section 7 elections - census.gov upon succession to the presidency, has held the office or acted as...
TRANSCRIPT

Elections 243U.S. Census Bureau, Statistical Abstract of the United States: 2011
This section relates primarily to presiden-tial, congressional, and gubernatorial elec-tions. Also presented are summary tables on congressional legislation; state legisla-tures; Black, Hispanic, and female office-holders; population of voting age; voter participation; and campaign finances.
Official statistics on federal elections, col-lected by the Clerk of the House, are pub-lished biennially in Statistics of the Presi-dential and Congressional Election and Statistics of the Congressional Election. Federal and state elections data appear also in America Votes, a biennial volume published by CQ Press (a division of Con-gressional Quarterly, Inc.), Washington, DC. Federal elections data also appear in the U.S. Congress, Congressional Direc-tory, and in official state documents. Data on reported registration and voting for social and economic groups are obtained by the U.S. Census Bureau as part of the Current Population Survey (CPS) and are published in Current Population Reports, Series P20 (see text, Section 1).
Almost all federal, state, and local govern-mental units in the United States conduct elections for political offices and other purposes. The conduct of elections is reg-ulated by state laws or, in some cities and counties, by local charter. An exception is that the U.S. Constitution prescribes the basis of representation in Congress and the manner of electing the president and grants to Congress the right to regulate the times, places, and manner of electing federal officers. Amendments to the Con-stitution have prescribed national criteria for voting eligibility. The 15th Amend-ment, adopted in 1870, gave all citizens the right to vote regardless of race, color, or previous condition of servitude. The 19th Amendment, adopted in 1919, further extended the right to vote to all citizens regardless of sex. The payment of poll taxes as a prerequisite to voting in federal elections was banned by the 24th Amendment in 1964. In 1971, as a result of the 26th Amendment, eligibility to vote
in national elections was extended to all citizens, 18 years old and over.
Presidential election— The Constitu-tion specifies how the president and vice president are selected. Each state elects, by popular vote, a group of electors equal in number to its total of members of Congress. The 23rd Amendment, adopted in 1961, grants the District of Columbia three presidential electors, a number equal to that of the least populous state. Subsequent to the election, the electors meet in their respective states to vote for president and vice president. Usually, each elector votes for the candidate receiving the most popular votes in his or her state. A majority vote of all electors is necessary to elect the president and vice president. If no candidate receives a majority, the House of Representatives, with each state having one vote, is empowered to elect the president and vice president, again, with a majority of votes required.
The 22nd Amendment to the Constitution, adopted in 1951, limits presidential ten-ure to two elective terms of 4 years each or to one elective term for any person who, upon succession to the presidency, has held the office or acted as President for more than 2 years.
Congressional election— The Consti-tution provides that representatives be apportioned among the states accord-ing to their population, that a census of population be taken every 10 years as a basis for apportionment, and that each state have at least one representa-tive. At the time of each apportionment, Congress decides what the total number of representatives will be. Since 1912, the total has been 435, except dur-ing 1960 to 1962 when it increased to 437, adding one representative each for Alaska and Hawaii. The total reverted to 435 after reapportionment following the 1960 census. Members are elected for 2-year terms, all terms covering the same period. The District of Columbia, Ameri-can Samoa, Guam, and the Virgin Islands
Section 7Elections
244 ElectionsU.S. Census Bureau, Statistical Abstract of the United States: 2011
each elect one nonvoting delegate, and Puerto Rico elects a nonvoting resident commissioner.
The Senate is composed of 100 members, two from each state, who are elected to serve for a term of 6 years. One-third of the Senate is elected every 2 years. Sena-tors were originally chosen by the state legislatures. The 17th Amendment to the Constitution, adopted in 1913, prescribed that senators be elected by popular vote.
Voter eligibility and participation— The Census Bureau publishes estimates of the population of voting age and the percent casting votes in each state for presidential and congressional election years. These voting-age estimates include
a number of persons who meet the age requirement but are not eligible to vote, (e.g. aliens and some institutionalized persons). In addition, since 1964, voter participation and voter characteristics data have been collected during Novem-ber of election years as part of the CPS. These survey data include noncitizens in the voting- age population estimates, but exclude members of the Armed Forces and the institutional population.
Statistical reliability— For a discussion of statistical collection and estimation, sampling procedures, and measures of statistical reliability applicable to Census Bureau data, see Appendix III.
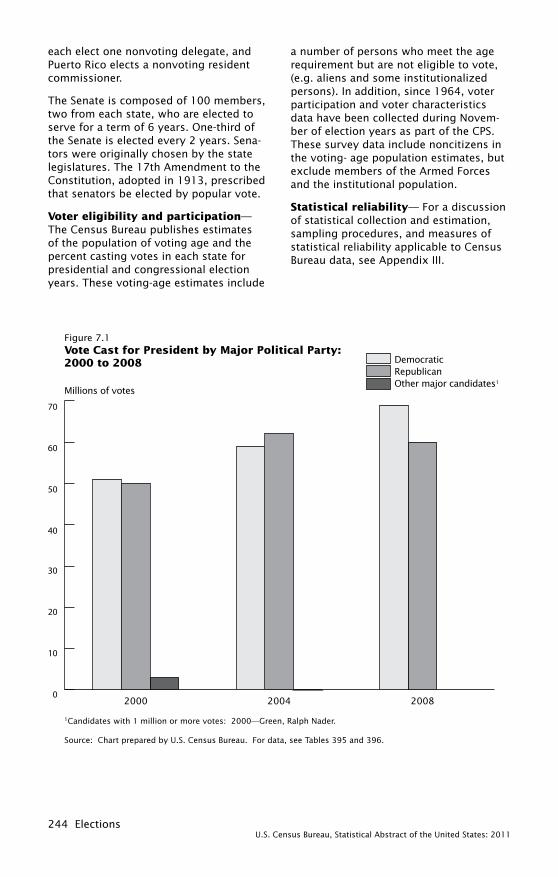
Millions of votes
1Candidates with 1 million or more votes: 2000—Green, Ralph Nader. Source: Chart prepared by U.S. Census Bureau. For data, see Tables 395 and 396.
Figure 7.1Vote Cast for President by Major Political Party: 2000 to 2008 Democratic
Republican Other major candidates1
0
10
20
30
40
50
60
70
200820042000
Elections 245U.S. Census Bureau, Statistical Abstract of the United States: 2011
Table 395. Vote Cast for President by Major Political Party: 1952 to 2008[In thousands (61,552 represents 61,552,000), except percent and electoral vote. Prior to 1960, excludes Alaska and Hawaii; prior to 1964, excludes DC. Vote cast for major party candidates includes the votes of minor parties cast for those candidates]
Year
Candidates for President Vote cast for President
Democratic Republican
Total popular
vote 1 (1,000)
Democratic Republican
Popular vote
Electoral vote
Popular vote
Electoral vote
Number (1,000) Percent
Number (1,000) Percent
1952. . . . Stevenson . . . . Eisenhower . . . 61,552 27,315 44.4 89 33,779 54.9 4421956. . . . Stevenson . . . . Eisenhower . . . 62,027 26,739 43.1 73 35,581 57.4 4571960. . . . Kennedy. . . . . . Nixon . . . . . . . . 68,836 34,227 49.7 303 34,108 49.5 2191964. . . . Johnson . . . . . . Goldwater . . . . 70,098 42,825 61.1 486 27,147 38.7 521968. . . . Humphrey . . . . Nixon . . . . . . . . 73,027 30,989 42.4 191 31,710 43.4 3011972. . . . McGovern . . . . Nixon . . . . . . . . 77,625 28,902 37.2 17 46,740 60.2 5201976. . . . Carter . . . . . . . Ford . . . . . . . . . 81,603 40,826 50.0 297 39,148 48.0 2401980. . . . Carter . . . . . . . Reagan . . . . . . 86,497 35,481 41.0 49 43,643 50.5 4891984. . . . Mondale . . . . . . Reagan . . . . . . 92,655 37,450 40.4 13 54,167 58.5 5251988. . . . Dukakis . . . . . . Bush . . . . . . . . 91,587 41,717 45.5 111 48,643 53.1 4261992. . . . Clinton . . . . . . . Bush . . . . . . . . 104,600 44,858 42.9 370 38,799 37.1 1681996. . . . Clinton . . . . . . . Dole . . . . . . . . . 96,390 47,402 49.2 379 39,198 40.7 1592000. . . . Gore . . . . . . . . . Bush . . . . . . . . 105,594 50,996 48.3 266 50,465 47.8 2712004. . . . Kerry . . . . . . . . Bush . . . . . . . . 122,349 58,895 48.1 251 61,873 50.6 2862008. . . . Obama . . . . . . . McCain . . . . . . 131,407 69,498 52.9 365 59,948 45.6 173
1 Include votes for minor party candidates, independents, unpledged electors, and scattered write-in votes.Source: U.S. House of Representatives, Office of the Clerk, Statistics of the Presidential and Congressional Election, 2009,
biennial. See also <http://clerk.house.gov/member_info/election.html>.
Table 396. Vote Cast for Leading Minority Party Candidates for President: 1952 to 2008[In thousands (135 represents 135,000). See headnote, Table 395. Data do not include write-ins, scatterings, or votes for candidates who ran on party tickets not shown]
Year Candidate PartyPopular
vote (1,000)
Candidate PartyPopular
vote (1,000)
1952. . . . . Vincent Hallinan . . . . . . Progressive . . . . . . . . . . . 135 Stuart Hamblen . . . . . . Prohibition . . . . . . . . 731956 1 . . . T. Coleman Andrews . . States' Rights . . . . . . . . . 91 Eric Hass . . . . . . . . . . . Socialist Labor . . . . . 411960. . . . . Eric Hass . . . . . . . . . . . Socialist Labor . . . . . . . . . 46 Rutherford Decker . . . . Prohibition . . . . . . . . 461964. . . . . Eric Hass . . . . . . . . . . . Socialist Labor . . . . . . . . . 43 Clifton DeBerry . . . . . . Socialist Workers . . . 221968. . . . . George Wallace . . . . . . American Independent . . 9,446 Henning Blomen . . . . . Socialist Labor . . . . . 521972 1 . . . John Schmitz . . . . . . . . American . . . . . . . . . . . . . 993 Benjamin Spock . . . . . . People's . . . . . . . . . . 91976. . . . . Eugene McCarthy . . . . Independent. . . . . . . . . . . 680 Roger McBride. . . . . . . Libertarian . . . . . . . . 1721980. . . . . John Anderson . . . . . . Independent. . . . . . . . . . . 5,251 Ed Clark . . . . . . . . . . . . Libertarian . . . . . . . . 9201984. . . . . David Bergland . . . . . . Libertarian . . . . . . . . . . . . 227 Lyndon H. LaRouche . . Independent. . . . . . . 791988. . . . . Ron Paul . . . . . . . . . . . Libertarian . . . . . . . . . . . . 410 Lenora B. Fulani . . . . . New Alliance . . . . . . 1291992. . . . . H. Ross Perot . . . . . . . . Independent. . . . . . . . . . . 19,722 Andre Marrou . . . . . . . . Libertarian . . . . . . . . 2811996. . . . . H. Ross Perot . . . . . . . . Reform . . . . . . . . . . . . . . . 7,137 Ralph Nader . . . . . . . . Green . . . . . . . . . . . . 5272000. . . . . Ralph Nader . . . . . . . . Green . . . . . . . . . . . . . . . . 2,530 Pat Buchanan . . . . . . . Reform . . . . . . . . . . . 3242004. . . . . Ralph Nader . . . . . . . . Independent. . . . . . . . . . . 156 Michael Badnarik . . . . . Libertarian . . . . . . . . 3692008. . . . . Ralph Nader . . . . . . . . Independent. . . . . . . . . . . 739 Bob Barr . . . . . . . . . . . Libertarian . . . . . . . . 515
1 Data include write-ins, scatterings, and/or votes for candidates who ran on party tickets not shown.Source: U.S. House of Representatives, Office of the Clerk, Statistics of the Presidential and Congressional Election, 2009,
biennial. See also <http://clerk.house.gov/member_info/election.html>.
Table 397. Democratic and Republican Percentages of Two-Party Presidential Vote by Selected Characteristics of Voters: 2004 and 2008[In percent. Covers citizens of voting age living in private housing units in the contiguous United States. Percentages for Democratic Presidential vote are computed by subtracting the percentage Republican vote from 100 percent; third-party or independent votes are not included as valid data. Data are from the National Election Studies and are based on a sample and subject to sampling variability; for details, see source]
Characteristic2004 2008
Characteristic2004 2008
Demo-cratic
Republi-can
Demo-cratic
Republi-can
Demo-cratic
Republi-can
Demo-cratic
Republi-can
Total 1 . . . . . . . . . . 50 50 55 45 Race: White . . . . . . . . . . . . . . . 42 58 44 56
Year of birth: Black . . . . . . . . . . . . . . . 90 10 99 1
1975 or later . . . . . . 66 34 65 35 Education: 1959 to 1974 . . . . . . 45 55 56 44 Less than high school . . . 69 31 72 28 1943 to 1958 . . . . . . 44 56 54 46 High school diploma/
equivalent . . . . . . . . . . 46 54 57 43 1927 to 1942 . . . . . . 51 49 41 59 1911 to 1926 . . . . . . 52 48 52 48 Some college,
no degree . . . . . . . . . . 47 53 53 47 1895 to 1910 . . . . . . – – – – College . . . . . . . . . . . . . . 50 50 51 49
Sex: Male . . . . . . . . . . . . . 46 54 52 48 Union household . . . . . . . 64 36 60 40 Female . . . . . . . . . . . 53 47 57 43 Nonunion household . . . . 46 54 54 46
– Represents zero. 1 Includes other characteristics, not shown separately.Source: American National Election Studies, <http://www.electionstudies.org/>.

246 ElectionsU.S. Census Bureau, Statistical Abstract of the United States: 2011
Table 398. Electoral Vote Cast for President by Major Political Party—States: 1968 to 2008[D = Democratic, R = Republican. For composition of regions, see map, inside front cover]
State 1968 1 1972 2 1976 3 1980 1984 1988 4 1992 1996 2000 5 2004 6 2008 7
Democratic . . . . . . 191 17 297 49 13 111 370 379 266 251 365 Republican . . . . . . 301 520 240 489 525 426 168 159 271 286 173
Northeast: Democratic . . . . . . . 102 14 86 4 – 53 106 106 102 101 101 Republican . . . . . . . . 24 108 36 118 113 60 – – 4 – –
Midwest: Democratic . . . . . . . 31 – 58 10 10 29 100 100 68 57 97 Republican . . . . . . . . 118 145 87 135 127 108 29 29 61 66 27
South: Democratic . . . . . . . 45 3 149 31 3 8 68 80 15 16 71 Republican . . . . . . . . 77 165 20 138 174 168 116 104 168 173 118
West: Democratic . . . . . . . 13 – 4 4 – 21 96 93 81 77 96 Republican . . . . . . . . 82 102 97 98 111 90 23 26 38 47 28
AL . . . . . . . . . . . . . . . (1) R-9 D-9 R-9 R-9 R-9 R-9 R-9 R-9 R-9 R-9AK . . . . . . . . . . . . . . . R-3 R-3 R-3 R-3 R-3 R-3 R-3 R-3 R-3 R-3 R-3AZ . . . . . . . . . . . . . . . R-5 R-6 R-6 R-6 R-7 R-7 R-8 D-8 R-8 R-10 R-10AR . . . . . . . . . . . . . . . (1) R-6 D-6 R-6 R-6 R-6 D-6 D-6 R-6 R-6 R-6CA . . . . . . . . . . . . . . . R-40 R-45 R-45 R-45 R-47 R-47 D-54 D-54 D-54 D-55 D-55CO . . . . . . . . . . . . . . . R-6 R-7 R-7 R-7 R-8 R-8 D-8 R-8 R-8 R-9 D-9CT . . . . . . . . . . . . . . . D-8 R-8 R-8 R-8 R-8 R-8 D-8 D-8 D-8 D-7 D-7DE . . . . . . . . . . . . . . . R-3 R-3 D-3 R-3 R-3 R-3 D-3 D-3 D-3 D-3 D-3DC . . . . . . . . . . . . . . . D-3 D-3 D-3 D-3 D-3 D-3 D-3 D-3 5 D-2 D-3 D-3FL . . . . . . . . . . . . . . . R-14 R-17 D-17 R-17 R-21 R-21 R-25 D-25 R-25 R-27 D-27
GA . . . . . . . . . . . . . . . (1) R-12 D-12 D-12 R-12 R-12 D-13 R-13 R-13 R-15 R-15HI . . . . . . . . . . . . . . . . D-4 R-4 D-4 D-4 R-4 D-4 D-4 D-4 D-4 D-4 D-4ID . . . . . . . . . . . . . . . . R-4 R-4 R-4 R-4 R-4 R-4 R-4 R-4 R-4 R-4 R-4IL . . . . . . . . . . . . . . . . R-26 R-26 R-26 R-26 R-24 R-24 D-22 D-22 D-22 D-21 D-21IN . . . . . . . . . . . . . . . . R-13 R-13 R-13 R-13 R-12 R-12 R-12 R-12 R-12 R-11 D-11IA . . . . . . . . . . . . . . . . R-9 R-8 R-8 R-8 R-8 D-8 D-7 D-7 D-7 R-7 D-7KS . . . . . . . . . . . . . . . R-7 R-7 R-7 R-7 R-7 R-7 R-6 R-6 R-6 R-6 R-6KY . . . . . . . . . . . . . . . R-9 R-9 D-9 R-9 R-9 R-9 D-8 D-8 R-8 R-8 R-8LA . . . . . . . . . . . . . . . (1) R-10 D-10 R-10 R-10 R-10 D-9 D-9 R-9 R-9 R-9ME . . . . . . . . . . . . . . . D-4 R-4 R-4 R-4 R-4 R-4 D-4 D-4 D-4 D-4 D-4
MD . . . . . . . . . . . . . . . D-10 R-10 D-10 D-10 R-10 R-10 D-10 D-10 D-10 D-10 D-10MA . . . . . . . . . . . . . . . D-14 D-14 D-14 R-14 R-13 D-13 D-12 D-12 D-12 D-12 D-12MI . . . . . . . . . . . . . . . . D-21 R-21 R-21 R-21 R-20 R-20 D-18 D-18 D-18 D-17 D-17MN . . . . . . . . . . . . . . . D-10 R-10 D-10 D-10 D-10 D-10 D-10 D-10 D-10 6 D-9 D-10MS . . . . . . . . . . . . . . . (1) R-7 D-7 R-7 R-7 R-7 R-7 R-7 R-7 R-6 R-6MO . . . . . . . . . . . . . . . R-12 R-12 D-12 R-12 R-11 R-11 D-11 D-11 R-11 R-11 R-11MT . . . . . . . . . . . . . . . R-4 R-4 R-4 R-4 R-4 R-4 D-3 R-3 R-3 R-3 R-3NE . . . . . . . . . . . . . . . R-5 R-5 R-5 R-5 R-5 R-5 R-5 R-5 R-5 R-5 7 R-4NV . . . . . . . . . . . . . . . R-3 R-3 R-3 R-3 R-4 R-4 D-4 D-4 R-4 R-5 D-5NH . . . . . . . . . . . . . . . R-4 R-4 R-4 R-4 R-4 R-4 D-4 D-4 R-4 D-4 D-4
NJ . . . . . . . . . . . . . . . R-17 R-17 R-17 R-17 R-16 R-16 D-15 D-15 D-15 D-15 D-15NM . . . . . . . . . . . . . . . R-4 R-4 R-4 R-4 R-5 R-5 D-5 D-5 D-5 R-5 D-5NY . . . . . . . . . . . . . . . D-43 R-41 D-41 R-41 R-36 D-36 D-33 D-33 D-33 D-31 D-31NC . . . . . . . . . . . . . . . 1 R-12 R-13 D-13 R-13 R-13 R-13 R-14 R-14 R-14 R-15 D-15ND . . . . . . . . . . . . . . . R-4 R-3 R-3 R-3 R-3 R-3 R-3 R-3 R-3 R-3 R-3OH . . . . . . . . . . . . . . . R-26 R-25 D-25 R-25 R-23 R-23 D-21 D-21 R-21 R-20 D-20OK . . . . . . . . . . . . . . . R-8 R-8 R-8 R-8 R-8 R-8 R-8 R-8 R-8 R-7 R-7OR . . . . . . . . . . . . . . . R-6 R-6 R-6 R-6 R-7 D-7 D-7 D-7 D-7 D-7 D-7PA . . . . . . . . . . . . . . . D-29 R-27 D-27 R-27 R-25 R-25 D-23 D-23 D-23 D-21 D-21RI . . . . . . . . . . . . . . . . D-4 R-4 D-4 D-4 R-4 D-4 D-4 D-4 D-4 D-4 D-4
SC . . . . . . . . . . . . . . . R-8 R-8 D-8 R-8 R-8 R-8 R-8 R-8 R-8 R-8 R-8SD . . . . . . . . . . . . . . . R-4 R-4 R-4 R-4 R-3 R-3 R-3 R-3 R-3 R-3 R-3TN . . . . . . . . . . . . . . . R-11 R-10 D-10 R-10 R-11 R-11 D-11 D-11 R-11 R-11 R-11TX . . . . . . . . . . . . . . . D-25 R-26 D-26 R-26 R-29 R-29 R-32 R-32 R-32 R-34 R-34UT . . . . . . . . . . . . . . . R-4 R-4 R-4 R-4 R-5 R-5 R-5 R-5 R-5 R-5 R-5VT . . . . . . . . . . . . . . . R-3 R-3 R-3 R-3 R-3 R-3 D-3 D-3 D-3 D-3 D-3VA . . . . . . . . . . . . . . . R-12 2 R-11 R-12 R-12 R-12 R-12 R-13 R-13 R-13 R-13 D-13WA . . . . . . . . . . . . . . . D-9 R-9 3 R-8 R-9 R-10 D-10 D-11 D-11 D-11 D-11 D-11WV . . . . . . . . . . . . . . . D-7 R-6 D-6 D-6 R-6 4 D-5 D-5 D-5 R-5 R-5 R-5WI . . . . . . . . . . . . . . . R-12 R-11 D-11 R-11 R-11 D-11 D-11 D-11 D-11 D-10 D-10WY . . . . . . . . . . . . . . . R-3 R-3 R-3 R-3 R-3 R-3 R-3 R-3 R-3 R-3 R-3
– Represents zero. 1 Excludes 46 electoral votes cast for American Independent George C. Wallace as follows: AL 10, AR 6, GA 12, LA 10, MS 7, and NC 1. 2 Excludes one electoral vote cast for Libertarian John Hospers in Virginia. 3 Excludes one electoral vote cast for Ronald Reagan in Washington. 4 Excludes one electoral vote cast for Lloyd Bentsen for President in West Virginia. 5 Excludes one electoral vote left blank by a Democratic elector in the District of Columbia. 6 Excludes one electoral vote cast for Democratic vice presidential nominee John Edwards in Minnesota. 7 Excludes one electoral vote for Barack Obama in Nebraska.
Source: U.S. House of Representatives, Office of the Clerk, Statistics of the Presidential and Congressional Election, 2009, biennial. See also <http://clerk.house.gov/member_info/election.html>.
Elections 247U.S. Census Bureau, Statistical Abstract of the United States: 2011
Table 399. Popular Vote Cast for President by Political Party—States: 2004 and 2008[In thousands (122,349 represents 122,349,000), except percent]
State
2004 2008
Total 1
Demo-cratic party
Republi-can
party
Percent of total vote
Total 1
Demo-cratic party
Republi-can
party
Percent of total vote
Demo-cratic party
Republi-can
party
Demo-cratic party
Republi-can
party
United States . . . . . 122,349 58,895 61,873 48 .1 50 .6 131,407 69,498 59,948 52 .9 45 .6
Alabama . . . . . . . . . . . 1,883 694 1,176 36.8 62.5 2,100 813 1,267 38.7 60.3Alaska . . . . . . . . . . . . . 313 111 191 35.5 61.1 326 124 194 37.9 59.4Arizona . . . . . . . . . . . . 2,013 894 1,104 44.4 54.9 2,293 1,035 1,230 45.1 53.6Arkansas . . . . . . . . . . . 1,055 470 573 44.5 54.3 1,087 422 638 38.9 58.7California . . . . . . . . . . . 12,421 6,745 5,510 54.3 44.4 13,562 8,274 5,012 61.0 37.0
Colorado . . . . . . . . . . . 2,130 1,002 1,101 47.0 51.7 2,401 1,289 1,074 53.7 44.7Connecticut . . . . . . . . . 1,579 857 694 54.3 43.9 1,647 998 629 60.6 38.2Delaware . . . . . . . . . . . 375 200 172 53.3 45.8 412 255 152 61.9 36.9District of Columbia . . . 228 203 21 89.2 9.3 266 246 17 92.5 6.5Florida . . . . . . . . . . . . . 7,610 3,584 3,965 47.1 52.1 8,391 4,282 4,046 51.0 48.2
Georgia . . . . . . . . . . . . 3,302 1,366 1,914 41.4 58.0 3,924 1,844 2,049 47.0 52.2Hawaii . . . . . . . . . . . . . 429 232 194 54.0 45.3 456 326 121 71.5 26.4Idaho . . . . . . . . . . . . . . 598 181 409 30.3 68.4 655 236 403 36.1 61.5Illinois . . . . . . . . . . . . . . 5,274 2,892 2,346 54.8 44.5 5,522 3,419 2,031 61.9 36.8Indiana . . . . . . . . . . . . . 2,468 969 1,479 39.3 59.9 2,751 1,374 1,346 49.9 48.9
Iowa . . . . . . . . . . . . . . . 1,507 742 752 49.2 49.9 1,537 829 682 53.9 44.4Kansas . . . . . . . . . . . . . 1,188 435 736 36.6 62.0 1,236 515 700 41.7 56.6Kentucky . . . . . . . . . . . 1,796 713 1,069 39.7 59.5 1,827 752 1,048 41.2 57.4Louisiana . . . . . . . . . . . 1,943 820 1,102 42.2 56.7 1,961 783 1,148 39.9 58.6Maine . . . . . . . . . . . . . . 741 397 330 53.6 44.6 731 422 295 57.7 40.4
Maryland . . . . . . . . . . . 2,384 1,334 1,025 56.0 43.0 2,632 1,629 960 61.9 36.5Massachusetts . . . . . . . 2,927 1,804 1,071 61.6 36.6 3,103 1,904 1,109 61.4 35.7Michigan . . . . . . . . . . . 4,839 2,479 2,314 51.2 47.8 5,002 2,873 2,049 57.4 41.0Minnesota . . . . . . . . . . 2,828 1,445 1,347 51.1 47.6 2,910 1,573 1,275 54.1 43.8Mississippi . . . . . . . . . . 1,140 458 673 40.2 59.0 1,290 555 725 43.0 56.2
Missouri . . . . . . . . . . . . 2,731 1,259 1,456 46.1 53.3 2,925 1,442 1,446 49.3 49.4Montana . . . . . . . . . . . . 450 174 266 38.6 59.1 490 232 243 47.3 49.5Nebraska . . . . . . . . . . . 778 254 513 32.7 65.9 801 333 453 41.6 56.5Nevada . . . . . . . . . . . . 830 397 419 47.9 50.5 968 534 413 55.1 42.7New Hampshire . . . . . . 678 341 331 50.2 48.8 711 385 317 54.1 44.5
New Jersey . . . . . . . . . 3,612 1,911 1,670 52.9 46.2 3,868 2,215 1,613 57.3 41.7New Mexico . . . . . . . . . 756 371 377 49.0 49.8 830 472 347 56.9 41.8New York . . . . . . . . . . . 7,448 4,181 2,807 56.1 37.7 7,722 4,805 2,753 62.2 35.6North Carolina . . . . . . . 3,501 1,526 1,961 43.6 56.0 4,298 2,143 2,128 49.8 49.5North Dakota . . . . . . . . 313 111 197 35.5 62.9 317 141 169 44.6 53.3
Ohio . . . . . . . . . . . . . . . 5,628 2,741 2,860 48.7 50.8 5,708 2,940 2,678 51.5 46.9Oklahoma . . . . . . . . . . 1,464 504 960 34.4 65.6 1,463 502 960 34.4 65.6Oregon . . . . . . . . . . . . . 1,837 943 867 51.3 47.2 1,828 1,037 738 56.7 40.4Pennsylvania . . . . . . . . 5,770 2,938 2,794 50.9 48.4 6,013 3,276 2,656 54.5 44.2Rhode Island . . . . . . . . 437 260 169 59.4 38.7 472 297 165 62.9 35.1
South Carolina . . . . . . . 1,618 662 938 40.9 58.0 1,921 862 1,035 44.9 53.9South Dakota . . . . . . . . 388 149 233 38.4 59.9 382 171 203 44.7 53.2Tennessee . . . . . . . . . . 2,437 1,036 1,384 42.5 56.8 2,600 1,087 1,479 41.8 56.9Texas . . . . . . . . . . . . . . 7,411 2,833 4,527 38.2 61.1 8,078 3,529 4,479 43.7 55.5Utah . . . . . . . . . . . . . . . 928 241 664 26.0 71.5 952 328 596 34.4 62.6
Vermont . . . . . . . . . . . . 312 184 121 58.9 38.8 325 219 99 67.5 30.4Virginia . . . . . . . . . . . . . 3,195 1,455 1,717 45.5 53.7 3,723 1,960 1,725 52.6 46.3Washington . . . . . . . . . 2,859 1,510 1,305 52.8 45.6 3,037 1,751 1,229 57.7 40.5West Virginia . . . . . . . . 756 327 424 43.2 56.1 713 304 397 42.6 55.7Wisconsin . . . . . . . . . . 2,997 1,490 1,478 49.7 49.3 2,983 1,677 1,262 56.2 42.3Wyoming . . . . . . . . . . . 244 71 168 29.0 68.7 255 83 165 32.5 64.7
1 Includes other parties.Source: U.S. House of Representatives, Office of the Clerk, Statistics of the Presidential and Congressional Election, 2009,
biennial. See also <http://clerk.house.gov/member_info/election.html>.

248 ElectionsU.S. Census Bureau, Statistical Abstract of the United States: 2011
Table 400. Vote Cast for U.S. Senators, 2006 and 2008, and Incumbent Senators, 2010—States[1,527 represents 1,527,000. D = Democrat, R = Republican, I = Independent]
State
2006 2008 Incumbent senators and year term expires 1
Total 2 (1,000)
Percent for
leading party
Total 2 (1,000)
Percent for
leading party Name, party, and year Name, party, and year
Alabama . . . . . . . . (X) (X) 2,060 R-63.4 Jeff Sessions (R) 2015 Richard Shelby (R) 2011Alaska . . . . . . . . . . (X) (X) 318 D-47.8 Lisa Murkowski (R) 2011 Mark Begich (D) 2015Arizona . . . . . . . . . 1,527 R-53.3 (X) (X) Jon Kyl (R) 2013 John McCain (R) 2011Arkansas . . . . . . . . (X) (X) 1,012 D-79.5 Blanche L. Lincoln (D) 2011 Mark L. Pryor (D) 2015California . . . . . . . . 8,541 D-59.4 (X) (X) Barbara Boxer (D) 2011 Dianne Feinstein (D) 2013
Colorado . . . . . . . . (X) (X) 2,332 D-52.8 Mark Udall (D) 2015 Michael F. Bennett 3 (D) 2011Connecticut . . . . . . 1,135 D-39.7 (X) (X) Christopher J. Dodd (D) 2011 Joseph I. Lieberman (I) 2013Delaware . . . . . . . . 243 D-70.2 398 D-64.7 Edward E. Kaufman 4 (D) 2015 Thomas R. Carper (D) 2013Florida . . . . . . . . . . 4,794 D-60.3 (X) (X) George S. LeMieux 5 (R) 2011 Bill Nelson (D) 2013Georgia . . . . . . . . . (X) (X) 2,266 R-54.2 Saxby Chambliss (R) 2015 Johnny Isakson (R) 2011
Hawaii . . . . . . . . . . 343 D-61.3 (X) (X) Daniel K. Akaka (D) 2013 Daniel K. Inouye (D) 2011Idaho . . . . . . . . . . . (X) (X) 645 R-57.7 James E. Risch (R) 2015 Mike Crapo (R) 2011Illinois . . . . . . . . . . . (X) (X) 5,330 D-67.8 Richard J. Durbin (D) 2015 Roland W. Burris 6 (D) 2011Indiana . . . . . . . . . . 1,341 R-87.4 (X) (X) Evan Bayh (D) 2011 Richard G. Lugar (R) 2013Iowa . . . . . . . . . . . . (X) (X) 1,503 D-62.7 Chuck Grassley (R) 2011 Tom Harkin (D) 2015
Kansas . . . . . . . . . . (X) (X) 1,211 R-60.1 Sam Brownback (R) 2011 Pat Roberts (R) 2015Kentucky . . . . . . . . (X) (X) 1,801 R-53.0 Jim Bunning (R) 2011 Mitch McConnell (R) 2015Louisiana 7 . . . . . . . (X) (X) 1,897 D-52.1 Mary L. Landrieu (D) 2015 David Vitter (R) 2011Maine . . . . . . . . . . . 545 R-74.4 724 R-61.3 Susan M. Collins (R) 2015 Olympia J. Snowe (R) 2013Maryland . . . . . . . . 1,781 D-54.2 (X) (X) Barbara A. Mikulski (D) 2011 Benjamin L. Cardin (D) 2013
Massachusetts . . . . 2,244 D-66.9 3,103 D-63.6 Scott P. Brown 8 (R) 2013 John F. Kerry (D) 2015Michigan . . . . . . . . 3,780 D-56.9 4,849 D-62.7 Carl Levin (D) 2015 Debbie Stabenow (D) 2013Minnesota . . . . . . . 2,203 D-58.1 2,888 D-42.0 Al Franken (D) 2015 Amy Klobuchar (D) 2013Mississippi . . . . . . . 611 R-63.6 1,247 R-61.4 Thad Cochran (R) 2015 Roger F. Wicker (R) 2013Missouri . . . . . . . . . 2,128 D-49.6 (X) (X) Christopher S. Bond (R) 2011 Claire McCaskill (D) 2013
Montana . . . . . . . . . 407 D-49.2 478 D-72.9 Max Baucus (D) 2015 John Tester (D) 2013Nebraska . . . . . . . . 592 D-63.9 793 R-57.5 Mike Johanns (R) 2015 Ben Nelson (D) 2013Nevada . . . . . . . . . 583 R-55.4 (X) (X) John Ensign (R) 2013 Harry Reid (D) 2011New Hampshire . . . (X) (X) 695 D-51.6 Judd Gregg (R) 2011 Jeanne Shaheen (D) 2015New Jersey . . . . . . 102 D-57.2 3,482 D-56.0 Robert Menendez (D) 2013 Frank R. Lautenberg (D) 2015
New Mexico . . . . . . 559 D-70.6 824 D-61.3 Jeff Bingaman (D) 2013 Tom Udall (D) 2015New York . . . . . . . . 4,701 D-57.4 (X) (X) Kirsten E. Gillibrand 9 (D) 2013 Charles E. Schumer (D) 2011North Carolina . . . . (X) (X) 4,272 D-52.7 Richard Burr (R) 2011 Kay R. Hagan (D) 2015North Dakota . . . . . 218 D-68.8 (X) (X) Kent Conrad (D) 2013 Byron L. Dorgan (D) 2011Ohio . . . . . . . . . . . . 4,019 D-56.2 (X) (X) Sherrod Brown (D) 2013 George V. Voinovich (R) 2011
Oklahoma . . . . . . . (X) (X) 1,347 R-56.7 Tom Coburn (R) 2011 James M. Inhofe (R) 2015Oregon . . . . . . . . . . (X) (X) 1,768 D-48.9 Jeff Merkley (D) 2015 Ron Wyden (D) 2011Pennsylvania . . . . . 4,081 D-58.6 (X) (X) Robert P. Casey Jr. (D) 2013 Arlen Specter (D) 2011Rhode Island . . . . . 385 D-53.5 439 D-73.1 Sheldon Whitehouse (D) 2013 Jack Reed (D) 2015South Carolina . . . . (X) (X) 1,871 R-57.5 Jim DeMint (R) 2011 Lindsey Graham (R) 2015
South Dakota . . . . . (X) (X) 381 D-62.5 Tim Johnson (D) 2015 John Thune (R) 2011Tennessee . . . . . . . 1,834 R-50.7 2,425 R-65.1 Lamar Alexander (R) 2015 Bob Corker (R) 2013Texas . . . . . . . . . . . 4,315 R-61.7 7,912 R-54.8 John Cornyn (R) 2015 Kay Hutchinson (R) 2013Utah . . . . . . . . . . . . 571 R-62.4 (X) (X) Robert F. Bennett (R) 2011 Orrin G. Hatch (R) 2013Vermont . . . . . . . . . 262 R-32.4 (X) (X) Bernard Sanders (I) 2013 Patrick J. Leahy (D) 2011
Virginia . . . . . . . . . . 2,370 D-49.6 3,643 D-65.0 Jim Webb (D) 2013 Mark R. Warner (D) 2015Washington . . . . . . 2,084 D-56.9 (X) (X) Maria Cantwell (D) 2013 Patty Murray (D) 2011West Virginia . . . . . 207 D-77.0 702 D-63.7 Carte P. Goodwin 10 (D) 2013 John D. Rockefeller IV (D) 2015Wisconsin . . . . . . . 2,138 D-67.3 (X) (X) Russell D. Feingold (D) 2011 Herb Kohl (D) 2013Wyoming . . . . . . . . 196 R-68.9 250 D-75.6 Michael B. Enzi (R) 2015 John Barrasso (R) 2013
X Not applicable. 1 As of 3 August 2010. 2 Includes vote cast for minor parties. 3 Appointed January 21, 2009, to fill vacancy due to resignation of Ken Salazar, January 20, 2009. 4 Appointed January 15, 2009, to fill vacancy due to resignation of Joseph R. Biden, Jr., January 15, 2009. 5 Appointed August 28, 2009, to fill vacancy due to resignation of Mel Martinez, September 9, 2009.6 Appointed December 31, 2008, to fill vacancy due to resignation of Barack Obama, November 16, 2009. 7 Louisiana holds an open-primary election with candidates from all parties running on the same ballot. Any candidate who receives a majority is elected. 8 Elected in the January 19, 2010 special election to fill seat previously held by appointed Senator Paul G. Kirk, Jr. 2006 datarepresents votes cast for Edward M. Kennedy. 9 Appointed January 23, 2009, to fill vacancy due to resignation of Hillary Rodham Clinton, January 21, 2009. 10 Appointed July 16, 2010, to fill vacancy due to death of Robert C. Byrd, June 28, 2010.
Source: U.S. House of Representatives, Office of the Clerk, Statistics of the Presidential and Congressional Election, 2009, biennial. See also <http://clerk.house.gov/member_info/election.html>.

Elections 249U.S. Census Bureau, Statistical Abstract of the United States: 2011
Table 401. Vote Cast for U.S. Representatives by Major Political Party— States: 2004 to 2008[In thousands (113,192 represents 113,192,000), except percent. R = Republican, D = Democrat, and I = Independent. In each state, totals represent the sum of votes cast in each Congressional District or votes cast for Representative-at-Large in states where only one member is elected. In all years there are numerous districts within the state where either the Republican or Democratic party had no candidate. In some states the Republican and Democratic vote includes votes cast for the party candidate by endorsing parties]
State
2004 2006 2008
Total 1
Demo-cratic
Republi-can
Percent for
leading party Total 1
Demo-cratic
Republi-can
Percent for
leading party Total 1
Demo-cratic
Republi-can
Percent for
leading party
U .S . . . . 113,192 52,745 55,713 R-49 .2 80,976 42,082 35,675 D-52 .0 122,586 64,888 51,953 D-52 .9
AL . . . . . . 1,793 708 1,080 R-60.2 1,140 502 628 R-55.0 1,855 718 1,121 R-60.4AK . . . . . . 300 67 213 R-71.1 235 94 133 R-56.6 317 143 159 R-50.1AZ . . . . . . 1,871 598 1,128 R-60.3 1,493 627 771 R-51.7 2,156 1,055 1,022 D-49.0AR 2 . . . . . 791 426 358 D-53.9 763 457 306 D-59.8 787 415 215 D-52.8CA . . . . . . 11,624 6,224 5,031 D-53.5 8,296 4,720 3,314 D-56.9 12,322 7,381 4,516 D-59.9
CO . . . . . . 2,039 995 992 D-48.8 1,539 833 624 D-54.1 2,284 1,260 991 D-55.2CT . . . . . . 1,429 786 630 D-55.0 1,075 649 420 D-60.4 1,527 909 505 D-59.5DE . . . . . . 356 106 246 R-69.1 252 98 144 R-57.2 385 146 235 R-61.1FL 2 . . . . . 5,627 2,212 3,319 R-59.0 3,852 1,600 2,183 R-56.7 7,421 3,435 3,792 R-51.1GA . . . . . . 2,961 1,141 1,820 R-61.5 2,070 932 1,138 R-55.0 3,655 1,858 1,797 D-50.8
HI . . . . . . . 417 262 148 D-62.9 338 220 118 D-65.0 456 320 83 D-70.2ID . . . . . . . 572 171 401 R-70.1 445 177 248 R-55.7 638 260 377 R-59.2IL . . . . . . . 4,989 2,675 2,272 D-53.6 3,453 1,986 1,423 D-57.5 5,248 3,176 1,961 D-60.5IN . . . . . . . 2,416 999 1,382 R-57.2 1,667 812 832 R-49.9 2,677 1,389 1,241 D-51.9IA . . . . . . . 1,458 625 823 R-56.4 1,033 493 522 R-50.6 1,482 759 698 D-51.3
KS . . . . . . 1,156 387 724 R-62.6 845 369 459 R-54.3 1,208 470 690 R-57.1KY . . . . . . 1,635 602 1,017 R-62.2 1,254 602 612 R-48.8 1,750 761 955 R-54.6LA 2 . . . . . 1,259 478 780 R-62.0 916 309 580 R-63.3 1,046 398 594 R-56.8ME . . . . . . 710 418 283 D-58.9 536 351 163 D-65.4 710 432 278 D-60.8MD . . . . . . 2,254 1,311 896 D-58.2 1,701 1,099 547 D-64.6 2,498 1,677 763 D-67.2
MA . . . . . . 2,927 2,060 435 D-70.4 2,244 1,632 199 D-72.7 3,103 2,246 318 D-72.4MI . . . . . . . 4,631 2,242 2,289 R-49.4 3,646 1,923 1,625 D-52.7 4,811 2,517 2,114 D-52.3MN . . . . . . 2,722 1,400 1,236 D-51.4 2,179 1,153 925 D-52.9 2,803 1,612 1,069 D-57.5MS . . . . . . 1,116 335 659 R-59.0 601 260 304 R-50.7 1,265 732 527 D-57.9MO . . . . . . 2,667 1,193 1,430 R-53.6 2,097 992 1,049 R-50.0 2,821 1,413 1,313 D-50.1
MT . . . . . . 444 146 286 R-64.4 406 159 239 R-58.9 481 156 308 R-64.1NE . . . . . . 765 231 515 R-67.3 596 262 334 R-56.1 775 265 511 R-65.8NV . . . . . . 791 334 421 R-53.2 575 288 260 D-50.1 908 457 384 D-50.4NH . . . . . . 652 244 396 R-60.8 403 209 190 D-52.0 675 365 295 D-54.1NJ . . . . . . 3,285 1,721 1,515 D-52.4 2,137 1,208 903 D-56.5 3,438 1,912 1,462 D-55.6
NM . . . . . . 743 385 358 D-51.8 561 313 248 D-55.8 815 457 321 D-56.1NY . . . . . . 7,448 3,457 2,209 D-46.4 4,687 2,538 1,160 D-54.1 7,722 4,006 1,800 D-51.9NC . . . . . . 3,413 1,670 1,743 R-51.1 1,941 1,027 914 D-52.9 4,215 2,294 1,902 D-54.4ND . . . . . . 311 185 126 D-59.6 218 143 75 D-65.7 314 195 119 D-62.0OH . . . . . . 5,184 2,515 2,650 R-51.1 3,961 2,082 1,870 D-52.6 5,374 2,752 2,491 D-51.2
OK . . . . . . 1,375 389 875 R-63.7 905 373 518 R-57.2 1,337 504 803 R-60.0OR . . . . . . 1,772 952 762 D-53.7 1,357 766 557 D-56.4 1,683 1,036 436 D-61.6PA . . . . . . 5,151 2,478 2,565 R-49.8 4,013 2,229 1,732 D-55.5 5,788 3,209 2,521 D-55.4RI . . . . . . . 402 279 113 D-69.5 373 265 42 D-71.0 438 304 119 D-69.3SC . . . . . . 1,439 486 913 R-63.5 1,086 473 600 R-55.2 1,874 920 940 R-50.1
SD . . . . . . 389 208 179 D-53.4 334 230 98 D-69.1 379 256 123 D-67.6TN . . . . . . 2,219 1,032 1,161 R-52.3 1,715 861 800 D-50.2 2,302 1,196 978 D-51.9TX . . . . . . 6,959 2,714 4,013 R-57.7 4,141 1,831 2,094 R-50.6 7,529 2,979 4,204 R-55.8UT . . . . . . 909 362 520 R-57.3 570 244 292 R-51.3 937 394 504 R-53.8VT . . . . . . 305 22 74 I-67.5 263 140 117 D-53.2 298 248 (X) D-83.2
VA . . . . . . 3,004 1,023 1,817 R-60.5 2,297 947 1,223 R-53.2 3,495 1,853 1,591 D-53.0WA . . . . . . 2,730 1,609 1,095 D-58.9 2,054 1,244 798 D-60.6 2,914 1,725 1,189 D-59.2WV . . . . . . 722 415 303 D-57.6 455 264 191 D-58.0 646 432 213 D-66.9WI . . . . . . 2,822 1,369 1,381 R-48.9 2,063 1,003 1,040 R-50.4 2,775 1,384 1,275 D-49.9WY . . . . . . 239 100 132 R-55.2 196 92 93 R-47.6 250 107 131 R-52.6
X Not applicable. 1 Includes votes cast for minor parties. 2 State law does not require tabulation of votes for unopposed candidates.
Source: U.S. House of Representatives, Office of the Clerk, Statistics of the Presidential and Congressional Election, 2009, biennial. See also <http://clerk.house.gov/member_info/election.html>.

250 ElectionsU.S. Census Bureau, Statistical Abstract of the United States: 2011
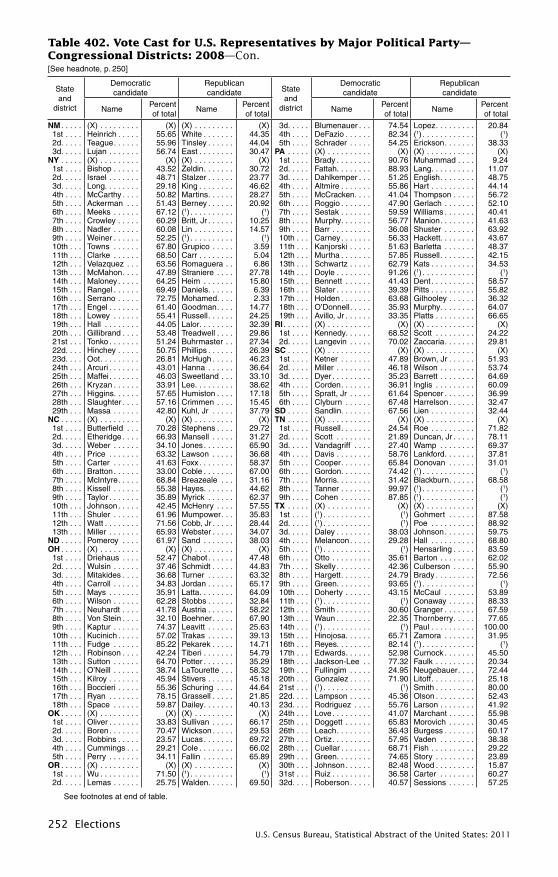
Table 402. Vote Cast for U.S. Representatives by Major Political Party—Congressional Districts: 2008[As of December 2008. Does not include special elections, see <http://clerk.house.gov/member_info/vacancies.html>. In some states the Democratic and Republican vote includes votes cast for the party candidate by endorsing parties]
State and
disrict
Democratic candidate
Republican candidate State
and disrict
Democratic candidate
Republican candidate
NamePercent of total
NamePercent of total
NamePercent of total
NamePercent of total
AL . . . . . (X) . . . . . . . . . . (X) (X) . . . . . . . . . . (X) 47th . . . Sanchez . . . . . . . 69.49 Avila . . . . . . . . . . 25.43 1st . . . . (1) . . . . . . . . . . . (1) Bonner . . . . . . . 98.27 48th . . . Young . . . . . . . . . 40.67 Campbell . . . . . . 55.61 2d. . . . . Bright . . . . . . . . 50.23 Love . . . . . . . . . 49.61 49th . . . Hamilton . . . . . . 37.45 Issa . . . . . . . . . . 58.30 3d. . . . . Segall . . . . . . . . 45.84 Rogers . . . . . . . 54.03 50th . . . Leibham . . . . . . . 45.18 Bilbray . . . . . . . . 50.24 4th . . . . Sparks . . . . . . . 25.11 Aderholt . . . . . . 74.76 51st . . . Filner . . . . . . . . . 72.75 Joy . . . . . . . . . . . 24.21 5th . . . . Griffith . . . . . . . 51.52 Parker . . . . . . . 47.94 52d. . . . Lumpkin . . . . . . . 38.95 Hunter . . . . . . . . 56.37 6th . . . . (1) . . . . . . . . . . . (1) Bachus . . . . . . . 97.79 53d. . . . Davis . . . . . . . . . 68.49 Crimmins . . . . . . 27.45 7th . . . . Davis . . . . . . . . 98.63 (1) . . . . . . . . . . . (1) CO . . . . . (X) . . . . . . . . . . . (X) (X) . . . . . . . . . . . (X)AK . . . . . Berkowitz . . . . . 44.97 Young . . . . . . . . 50.14 1st . . . . DeGette . . . . . . . 71.94 Lilly . . . . . . . . . . 23.78AZ . . . . . (X) . . . . . . . . . . (X) (X) . . . . . . . . . . (X) 2d. . . . . Polis . . . . . . . . . . 62.60 Starin . . . . . . . . . 33.86 1st . . . . Kirkpatrick . . . . 55.88 Hay . . . . . . . . . 39.43 3d. . . . . Salazar . . . . . . . 61.61 Wolf . . . . . . . . . . 38.39 2d. . . . . Thrasher . . . . . 37.16 Franks . . . . . . . 59.44 4th . . . . Markey . . . . . . . . 56.20 Musgrave . . . . . . 43.80 3d. . . . . Lord . . . . . . . . . 42.07 Shadegg . . . . . 54.08 5th . . . . Bidlack . . . . . . . . 37.04 Lamborn . . . . . . 60.03 4th . . . . Pastor . . . . . . . 72.11 Karg . . . . . . . . . 21.25 6th . . . . Eng . . . . . . . . . . 39.33 Coffman . . . . . . . 60.67 5th . . . . Mitchell . . . . . . 53.16 Schweikert . . . . 43.57 7th . . . . Perlmutter . . . . . 63.48 Lerew . . . . . . . . . 36.52 6th . . . . Schneider . . . . 34.55 Flake . . . . . . . . 62.42 CT . . . . . (X) . . . . . . . . . . . (X) (X) . . . . . . . . . . . (X) 7th . . . . Grijalva . . . . . . 63.26 Sweeney . . . . . 32.79 1st . . . . Larson . . . . . . . . 65.81 Visconti . . . . . . . 26.01 8th . . . . Giffords . . . . . . 54.72 Bee . . . . . . . . . 42.82 2d. . . . . Courtney . . . . . . 61.60 Sullivan . . . . . . . 32.37AR . . . . . (X) . . . . . . . . . . (X) (X) . . . . . . . . . . (X) 3d. . . . . DeLauro . . . . . . . 68.86 Itshaky . . . . . . . . 19.70 1st . . . . Berry . . . . . . . . (2) (1) . . . . . . . . . . . (1) 4th . . . . Himes . . . . . . . . 48.37 Shays . . . . . . . . . 47.56 2d. . . . . Snyder . . . . . . . 76.54 (1) . . . . . . . . . . . (1) 5th . . . . Murphy . . . . . . . . 53.25 Cappiello . . . . . . 38.96 3d. . . . . (1) . . . . . . . . . . . (1) Boozman . . . . . 78.53 Hartley- 4th . . . . Ross . . . . . . . . 86.17 (1) . . . . . . . . . . . (1) DE . . . . . Nagle . . . . . . . . 37.99 Castle . . . . . . . . 61.08CA . . . . . (X) . . . . . . . . . . (X) (X) . . . . . . . . . . (X) FL . . . . . (X) . . . . . . . . . . . (X) (X) . . . . . . . . . . . (X) 1st . . . . Thompson . . . . 68.10 Starkewolf . . . . 23.36 1st . . . . Bryan . . . . . . . . . 29.82 Miller . . . . . . . . . 70.18 2d. . . . . Morris. . . . . . . . 42.11 Herger . . . . . . . 57.89 2d. . . . . Boyd . . . . . . . . . 61.88 Mulligan . . . . . . . 38.08 3d. . . . . Durston . . . . . . 43.93 Lungren . . . . . . 49.49 3d. . . . . Brown . . . . . . . . (2) (1) . . . . . . . . . . . . (1) 4th . . . . Brown . . . . . . . 49.76 McClintock . . . . 50.24 4th . . . . McGovern . . . . . 34.75 Crenshaw . . . . . 65.25 5th . . . . Matsui . . . . . . . 74.27 Smith . . . . . . . . 20.80 5th . . . . Russell . . . . . . . . 38.85 Brown-Waite . . . 61.15 6th . . . . Woolsey . . . . . . 71.69 Halliwell . . . . . . 24.06 6th . . . . Cunha . . . . . . . . 39.11 Stearns . . . . . . . 60.89 7th . . . . Miller . . . . . . . . 72.82 Petersen . . . . . 21.79 7th . . . . Armitage . . . . . . 38.00 Mica . . . . . . . . . . 62.00 8th . . . . Pelosi . . . . . . . . 71.87 Walsh . . . . . . . . 9.68 8th . . . . Grayson . . . . . . . 52.01 Keller . . . . . . . . . 47.99 9th . . . . Lee. . . . . . . . . . 86.06 Hargrave . . . . . 9.70 9th . . . . Mitchell . . . . . . . 36.27 Bilirakis . . . . . . . 62.17 10th . . . Tauscher . . . . . 65.12 Gerber . . . . . . . 31.13 10th . . . Hackworth . . . . . 39.32 Young . . . . . . . . . 60.68 11th . . . McNerney . . . . 55.27 Andal . . . . . . . . 44.72 11th . . . Castor . . . . . . . . 71.66 Adams, Jr . . . . . 28.34 12th . . . Speier . . . . . . . 75.11 Conlon . . . . . . . 18.46 12th . . . Tudor . . . . . . . . . 42.54 Putnam . . . . . . . 57.46 13th . . . Stark . . . . . . . . 76.43 Chui . . . . . . . . . 23.57 13th . . . Jennings . . . . . . 37.49 Buchanan . . . . . 55.54 14th . . . Eshoo . . . . . . . 69.77 Santana . . . . . . 22.22 14th . . . Neeld . . . . . . . . . 24.77 Mack . . . . . . . . . 59.44 15th . . . Honda . . . . . . . 71.66 Cordi . . . . . . . . 23.26 15th . . . Blythe . . . . . . . . . 41.99 Posey . . . . . . . . . 53.10 16th . . . Lofgren . . . . . . 71.34 Winston . . . . . . 24.06 16th . . . Mahoney . . . . . . 39.91 Rooney . . . . . . . 60.09 17th . . . Farr . . . . . . . . . 73.88 Taylor . . . . . . . . 25.82 17th . . . Meek . . . . . . . . . (2) (1) . . . . . . . . . . . . (1) 18th . . . Cardoza . . . . . . 100.00 (1) . . . . . . . . . . . (1) 18th . . . Taddeo . . . . . . . . 42.13 Ros-Lehtinen . . . 57.87 19th . . . (1) . . . . . . . . . . . (1) Radanovich . . . 98.43 19th . . . Wexler . . . . . . . . 66.16 Lynch . . . . . . . . . 27.24 20th . . . Costa . . . . . . . . 74.33 Lopez . . . . . . . . 25.67 20th . . . Schultz . . . . . . . . 77.48 (1) . . . . . . . . . . . . (1) 21st . . . Johnson . . . . . . 31.61 Nunes . . . . . . . 68.39 21st . . . Martinez . . . . . . . 42.10 Diaz-Balart . . . . . 57.90 22d. . . . (1) . . . . . . . . . . . (1) McCarthy . . . . . 100.00 22d. . . . Klein . . . . . . . . . . 54.68 West . . . . . . . . . 45.32 23d. . . . Capps . . . . . . . 68.07 Kokkonen . . . . . 31.93 23d. . . . Hastings . . . . . . . 82.18 Thorpe, Jr. . . . . . 17.80 24th . . . Jorgensen . . . . 41.85 Gallegly . . . . . . 58.15 24th . . . Kosmas . . . . . . . 57.20 Feeney . . . . . . . . 41.11 25th . . . Conaway . . . . . 42.27 McKeon . . . . . . 57.73 25th . . . Garcia . . . . . . . . 46.95 Diaz-Balart . . . . . 53.05 26th . . . Warner . . . . . . . 40.44 Dreier . . . . . . . . 52.64 GA . . . . . (X) . . . . . . . . . . . (X) (X) . . . . . . . . . . . (X) 27th . . . Sherman . . . . . 68.51 Singh . . . . . . . . 24.83 1st . . . . Gillespie . . . . . . . 33.47 Kingston . . . . . . . 66.53 28th . . . Berman . . . . . . 99.89 (1) . . . . . . . . . . . (1) 2d. . . . . Bishop, Jr . . . . . . 68.95 Ferrell . . . . . . . . 31.05 29th . . . Schiff . . . . . . . . 68.91 Hahn . . . . . . . . 26.74 Westmore- 30th . . . Waxman. . . . . . 100.00 (1) . . . . . . . . . . . (1) 3d. . . . . Camp . . . . . . . . . 34.30 land . . . . . . . . . . 65.69 31st . . . Becerra . . . . . . 100.00 (1) . . . . . . . . . . . (1) 4th . . . . Johnson, Jr. . . . . 99.91 (1) . . . . . . . . . . . . (1) 32d. . . . Solis . . . . . . . . . 99.99 (1) . . . . . . . . . . . (1) 5th . . . . Lewis . . . . . . . . . 99.95 (1) . . . . . . . . . . . . (1) 33d. . . . Watson. . . . . . . 87.57 Crowley II . . . . . 12.43 6th . . . . Jones . . . . . . . . . 31.52 Price . . . . . . . . . 68.48 34th . . . Roybal-Allard . . 77.09 Balding . . . . . . . 22.91 7th . . . . Heckman . . . . . . 37.97 Linder . . . . . . . . . 62.03 35th . . . Waters . . . . . . . 82.58 Hayes. . . . . . . . 13.24 8th . . . . Marshall . . . . . . . 57.24 Goddard . . . . . . . 42.76 36th . . . Harman . . . . . . 68.64 Gibson . . . . . . . 31.36 9th . . . . Scott . . . . . . . . . 24.49 Deal . . . . . . . . . . 75.51 37th . . . Richardson . . . 74.94 (1) . . . . . . . . . . . (1) 10th . . . Saxon . . . . . . . . 39.27 Broun . . . . . . . . . 60.73 38th . . . Napolitano . . . . 81.73 (1) . . . . . . . . . . . (1) 11th . . . Gammon . . . . . . 31.81 Gingrey . . . . . . . 68.19 39th . . . Sanchez . . . . . . 69.67 Lenning . . . . . . 30.33 12th . . . Barrow . . . . . . . . 66.00 Stone . . . . . . . . . 34.00 40th . . . Avalos . . . . . . . 37.45 Royce . . . . . . . 62.55 13th . . . Scott . . . . . . . . . 69.04 Honeycutt . . . . . 30.96 41st . . . Prince . . . . . . . 38.35 Lewis . . . . . . . . 61.65 HI . . . . . . (X) . . . . . . . . . . . (X) (X) . . . . . . . . . . . (X) 42d. . . . Chau . . . . . . . . 39.84 Miller . . . . . . . . 60.16 1st . . . . Abercrombie . . . 70.60 Tataii . . . . . . . . . 17.45 43d. . . . Baca . . . . . . . . 69.14 Roberts . . . . . . 30.86 2d. . . . . Hirono . . . . . . . . 69.75 Evans . . . . . . . . . 18.70 44th . . . Hedrick . . . . . . 48.81 Calvert . . . . . . . 51.19 ID . . . . . . (X) . . . . . . . . . . . (X) (X) . . . . . . . . . . . (X) 45th . . . Bornstein . . . . . 41.71 Mack . . . . . . . . 58.29 1st . . . . Minnick . . . . . . . 50.61 Sali . . . . . . . . . . . 49.39 46th . . . Cook . . . . . . . . 43.08 Rohrabacher . . 52.52 2d. . . . . Holmes . . . . . . . 28.90 Simpson . . . . . . . 70.89
See footnotes at end of table.
Elections 251U.S. Census Bureau, Statistical Abstract of the United States: 2011
Table 402. Vote Cast for U.S. Representatives by Major Political Party—Congressional Districts: 2008—Con.[See headnote, p. 250]
State and
district
Democratic candidate
Republican candidate State
and district
Democratic candidate
Republican candidate
NamePercent of total
NamePercent of total
NamePercent of total
NamePercent of total
IL . . . . . . (X) . . . . . . . . . . . (X) (X) . . . . . . . . . . . (X) 5th . . . . Tsongas . . . . . 74.72 (1) . . . . . . . . . . . . (1) 1st . . . . Rush . . . . . . . . . 85.87 Members . . . . . . 14.13 6th . . . . Tierney. . . . . . 66.79 Baker . . . . . . . . . 28.00 2d. . . . . Jackson, Jr. . . . . 89.41 Williams . . . . . . . 10.59 Cunning- 3d. . . . . Lipinski . . . . . . . . 73.28 Hawkins . . . . . . . 21.37 7th . . . . Markey . . . . . . 70.48 ham . . . . . . . . . . 22.57 4th . . . . Gutierrez . . . . . . 80.60 Cunningham . . . 11.48 8th . . . . Capuano . . . . 76.03 (1) . . . . . . . . . . . . (1) 5th . . . . Emanuel . . . . . . 73.94 Hanson . . . . . . . 22.04 9th . . . . Lynch . . . . . . . 76.29 (1) . . . . . . . . . . . . (1) 6th . . . . Morgenthaler . . . 42.43 Roskam . . . . . . . 57.57 10th . . . Delahunt . . . . 75.02 (1) . . . . . . . . . . . . (1) 7th . . . . Davis . . . . . . . . . 85.02 Miller . . . . . . . . . 14.98 MI . . . . . . (X) . . . . . . . . . (X) (X) . . . . . . . . . . . (X) 8th . . . . Bean . . . . . . . . . 60.72 Greenberg . . . . . 39.28 1st . . . . Stupak . . . . . . 65.04 Casperson . . . . . 32.74 9th . . . . Schakowsky . . . . 74.66 Younan . . . . . . . . 21.99 2d. . . . . Johnson . . . . . 34.81 Hoekstra . . . . . . 62.36 10th . . . Seals . . . . . . . . . 47.44 Kirk . . . . . . . . . . 52.56 3d. . . . . Sanchez . . . . . 35.37 Ehlers . . . . . . . . 61.11 11th . . . Halvorson . . . . . 58.40 Ozinga . . . . . . . . 34.48 4th . . . . Concannon . . 35.68 Camp . . . . . . . . . 61.94 12th . . . Costello . . . . . . . 71.40 Richardson, Jr . . 24.95 5th . . . . Kildee . . . . . . . 70.36 Sawicki. . . . . . . . 26.96 13th . . . Harper . . . . . . . . 43.65 Biggert . . . . . . . . 53.55 6th . . . . Cooney . . . . . 38.56 Upton . . . . . . . . . 58.86 14th . . . Foster . . . . . . . . 57.75 Oberweis . . . . . . 42.25 7th . . . . Schauer . . . . . 48.78 Walberg . . . . . . . 46.47 15th . . . Cox . . . . . . . . . . 35.81 Johnson . . . . . . . 64.19 8th . . . . Alexander . . . 40.23 Rogers . . . . . . . . 56.53 16th . . . Abboud . . . . . . . 36.08 Manzullo . . . . . . 60.87 9th . . . . Peters . . . . . . 52.08 Knollenberg . . . . 42.63 17th . . . Hare . . . . . . . . . . 99.77 (1) . . . . . . . . . . . . (1) 10th . . . Denison . . . . . 31.17 Miller . . . . . . . . . 66.30 18th . . . Callahan . . . . . . 37.94 Schock . . . . . . . . 58.88 11th . . . Larkin . . . . . . . 45.37 McCotter . . . . . . 51.41 19th . . . Davis . . . . . . . . . 33.38 Shimkus . . . . . . . 64.46 12th . . . Levin . . . . . . . 72.07 Copple . . . . . . . . 23.87IN . . . . . . (X) . . . . . . . . . . . (X) (X) . . . . . . . . . . . (X) 13th . . . Kilpatrick . . . . 74.13 Gubics . . . . . . . . 19.08 1st . . . . Visclosky . . . . . . 70.90 Leyva . . . . . . . . . 27.18 14th . . . Conyers, Jr . . 92.40 (1) . . . . . . . . . . . . (1) 2d. . . . . Donnelly . . . . . . . 67.09 Puckett . . . . . . . . 30.23 15th . . . Dingell . . . . . . 70.70 Lynch . . . . . . . . . 24.95 3d. . . . . Montagano . . . . . 39.70 Souder . . . . . . . . 55.04 MN . . . . . (X) . . . . . . . . . (X) (X) . . . . . . . . . . . (X) 4th . . . . Ackerson . . . . . . 40.13 Buyer . . . . . . . . . 59.87 1st . . . . Walz . . . . . . . . 62.50 Davis . . . . . . . . . 32.93 5th . . . . Ruley . . . . . . . . . 34.45 Burton . . . . . . . . 65.55 2d. . . . . Sarvi . . . . . . . 42.55 Kline . . . . . . . . . . 57.29 6th . . . . Welsh . . . . . . . . . 33.38 Pence. . . . . . . . . 63.95 3d. . . . . Madia . . . . . . . 40.85 Paulsen . . . . . . . 48.48 7th . . . . Carson . . . . . . . . 65.08 Campo . . . . . . . . 34.92 4th . . . . McCollum . . . . 68.44 Matthews . . . . . . 31.31 8th . . . . Ellsworth . . . . . . 64.74 Goode . . . . . . . . 35.26 5th . . . . Ellison . . . . . . 70.88 White . . . . . . . . . 22.00 9th . . . . Hill . . . . . . . . . . . 57.77 Sodrel . . . . . . . . 38.41 6th . . . . Tinklenberg . . 43.43 Bachmann . . . . . 46.41IA . . . . . . (X) . . . . . . . . . . . (X) (X) . . . . . . . . . . . (X) 7th . . . . Peterson . . . . 72.20 Menze . . . . . . . . 27.67 1st . . . . Braley . . . . . . . . 64.61 Hartsuch . . . . . . 35.39 8th . . . . Oberstar . . . . . 67.69 Cummins . . . . . . 32.15 2d. . . . . Loebsack . . . . . . 57.24 Miller-Meeks . . . 38.80 MS . . . . . (X) . . . . . . . . . (X) (X) . . . . . . . . . . . (X) 3d. . . . . Boswell . . . . . . . 56.40 Schmett . . . . . . . 42.13 1st . . . . Childers . . . . . 54.47 Davis . . . . . . . . . 43.88 4th . . . . Greenwald . . . . . 39.43 Latham . . . . . . . . 60.57 2d. . . . . Thompson . . . 69.05 Cook . . . . . . . . . 30.95 5th . . . . Hubler . . . . . . . . 37.38 King . . . . . . . . . . 59.84 3d. . . . . Gill . . . . . . . . . 37.46 Harper . . . . . . . . 62.54KS . . . . . (X) . . . . . . . . . . . (X) (X) . . . . . . . . . . . (X) 4th . . . . Taylor . . . . . . . 74.54 McCay III . . . . . . 25.46 1st . . . . Bordonaro . . . . . 13.27 Moran . . . . . . . . 81.88 MO . . . . . (X) . . . . . . . . . (X) (X) . . . . . . . . . . . (X) 2d. . . . . Boyda . . . . . . . . 46.21 Jenkins . . . . . . . 50.61 1st . . . . Clay . . . . . . . . 86.86 (1) . . . . . . . . . . . . (1) 3d. . . . . Moore . . . . . . . . 56.44 Jordan . . . . . . . . 39.66 2d. . . . . Haas . . . . . . . 35.41 Akin . . . . . . . . . . 62.28 4th . . . . Betts, Jr . . . . . . . 32.38 Tiahrt . . . . . . . . . 63.41 3d. . . . . Carnahan . . . . 66.37 Sander . . . . . . . . 30.41KY . . . . . (X) . . . . . . . . . . . (X) (X) . . . . . . . . . . . (X) 4th . . . . Skelton . . . . . . 65.91 Parnell . . . . . . . . 34.09 1st . . . . Ryan . . . . . . . . . 35.65 Whitfield . . . . . . . 64.35 5th . . . . Cleaver . . . . . 64.37 Turk . . . . . . . . . . 35.63 2d. . . . . Boswell . . . . . . . 47.43 Guthrie . . . . . . . . 52.57 6th . . . . Barnes . . . . . . 36.86 Graves . . . . . . . . 59.43 3d. . . . . Yarmuth . . . . . . . 59.37 Northup . . . . . . . 40.63 7th . . . . Monroe . . . . . 28.16 Blunt . . . . . . . . . 67.76 4th . . . . Kelley . . . . . . . . . 36.97 Davis . . . . . . . . . 63.03 8th . . . . Allen . . . . . . . . 26.16 Emerson . . . . . . 71.44 5th . . . . (1) . . . . . . . . . . . . (1) Rogers . . . . . . . . 84.11 9th . . . . Baker . . . . . . . 47.49 Luetkemeyer . . . 49.99 6th . . . . Chandler . . . . . . 64.66 Larson . . . . . . . . 35.34 MT . . . . . Driscoll . . . . . . 32.42 Rehberg . . . . . . . 64.14LA 3 . . . . (X) . . . . . . . . . . . (X) (X) . . . . . . . . . . . (X) NE . . . . . (X) . . . . . . . . . (X) (X) . . . . . . . . . . . (X) 1st . . . . Harlan . . . . . . . . 34.32 Scalise . . . . . . . . 65.68 1st . . . . Yashirin . . . . . 29.64 Fortenberry . . . . 70.36 2d 4 . . . Jefferson . . . . . . 46.83 Cao . . . . . . . . . . 49.54 2d. . . . . Esch . . . . . . . . 48.07 Terry . . . . . . . . . 51.93 3d. . . . . Melancon . . . . . . (2) (1) . . . . . . . . . . . . (1) 3d. . . . . Stoddard . . . . 23.13 Smith . . . . . . . . . 76.87 4th 4 . . . Carmouche . . . . 47.69 Fleming . . . . . . . 48.07 NV . . . . . (X) . . . . . . . . . (X) (X) . . . . . . . . . . . (X) 5th . . . . (1) . . . . . . . . . . . . (1) Alexander . . . . . (2) 1st . . . . Berkley . . . . . . 67.65 Wegner . . . . . . . 28.32 6th . . . . Cazayoux, Jr . . . 40.29 Cassidy . . . . . . . 48.12 2d. . . . . Derby . . . . . . . 41.44 Heller . . . . . . . . . 51.82 7th . . . . Cravins, Jr . . . . . 34.33 Boustany, Jr . . . . 61.88 3d. . . . . Titus . . . . . . . . 47.43 Porter . . . . . . . . . 42.29ME . . . . . (X) . . . . . . . . . . . (X) (X) . . . . . . . . . . . (X) NH . . . . . (X) . . . . . . . . . (X) (X) . . . . . . . . . . . (X) 1st . . . . Pingree . . . . . . . 54.90 Summers . . . . . . 45.10 1st . . . . Shea-Porter . . 51.76 Bradley . . . . . . . 45.86 2d. . . . . Michaud . . . . . . . 67.44 Frary . . . . . . . . . 32.56 2d. . . . . Hodes . . . . . . 56.44 Horn . . . . . . . . . . 41.42MD . . . . . (X) . . . . . . . . . . . (X) (X) . . . . . . . . . . . (X) NJ . . . . . (X) . . . . . . . . . (X) (X) . . . . . . . . . . . (X) 1st . . . . Kratovil, Jr . . . . . 49.12 Harris . . . . . . . . . 48.33 1st . . . . Andrews . . . . . 72.40 Glading . . . . . . . 25.95 2d. . . . . Ruppersberger . . 71.86 Matthews . . . . . . 24.81 2d. . . . . Kurkowski . . . 39.09 LoBiondo . . . . . . 59.06 3d. . . . . Sarbanes . . . . . . 69.66 Harris . . . . . . . . . 30.08 3d. . . . . Adler . . . . . . . 52.08 Myers . . . . . . . . . 47.92 4th . . . . Edwards . . . . . . . 85.83 James . . . . . . . . 12.85 4th . . . . Zeitz . . . . . . . . 32.63 Smith . . . . . . . . . 66.21 5th . . . . Hoyer . . . . . . . . . 73.65 Bailey . . . . . . . . . 23.97 5th . . . . Shulman . . . . 42.40 Garrett . . . . . . . . 55.87 6th . . . . Dougherty . . . . . 38.79 Bartlett . . . . . . . . 57.76 6th . . . . Pallone, Jr . . . 66.95 McLeod . . . . . . . 31.61 7th . . . . Cummings . . . . . 79.50 Hargadon . . . . . . 18.58 7th . . . . Stender . . . . . 42.22 Lance . . . . . . . . . 50.22 8th . . . . Hollen . . . . . . . . 75.07 Hudson . . . . . . . 21.68 8th . . . . Pascrell, Jr . . . 71.11 Straten . . . . . . . . 28.17MA . . . . . (X) . . . . . . . . . . . (X) (X) . . . . . . . . . . . (X) 9th . . . . Rothman . . . . 67.53 Micco . . . . . . . . . 31.04 1st . . . . Olver . . . . . . . . . 69.67 Bech . . . . . . . . . 25.86 10th . . . Payne . . . . . . . 98.92 (1) . . . . . . . . . . . . (1) 2d. . . . . Neal . . . . . . . . . . 76.39 (1) . . . . . . . . . . . . (1) 11th . . . Wyka . . . . . . . 37.01 Frelinghuysen . . 61.84 3d. . . . . McGovern . . . . . 75.04 (1) . . . . . . . . . . . . (1) 12th . . . Holt . . . . . . . . 63.12 Bateman . . . . . . 35.32 4th . . . . Frank . . . . . . . . . 64.30 Sholley . . . . . . . . 23.94 13th . . . Sires . . . . . . . 75.36 Turula . . . . . . . . . 21.74
See footnotes at end of table.
252 ElectionsU.S. Census Bureau, Statistical Abstract of the United States: 2011
Table 402. Vote Cast for U.S. Representatives by Major Political Party—Congressional Districts: 2008—Con.[See headnote, p. 250]
State and
district
Democratic candidate
Republican candidate State
and district
Democratic candidate
Republican candidate
NamePercent of total
NamePercent of total
NamePercent of total
NamePercent of total
NM . . . . . (X) . . . . . . . . . (X) (X) . . . . . . . . . (X) 3d. . . . . Blumenauer . . . 74.54 Lopez . . . . . . . . . 20.84 1st . . . . Heinrich . . . . . 55.65 White . . . . . . . 44.35 4th . . . . DeFazio . . . . . . 82.34 (1) . . . . . . . . . . . . (1) 2d. . . . . Teague . . . . . . 55.96 Tinsley . . . . . . 44.04 5th . . . . Schrader . . . . . 54.25 Erickson . . . . . . . 38.33 3d. . . . . Lujan . . . . . . . 56.74 East . . . . . . . . 30.47 PA . . . . . (X) . . . . . . . . . . (X) (X) . . . . . . . . . . . (X)NY . . . . . (X) . . . . . . . . . (X) (X) . . . . . . . . . (X) 1st . . . . Brady . . . . . . . . 90.76 Muhammad . . . . 9.24 1st . . . . Bishop . . . . . . 43.52 Zeldin . . . . . . . 30.72 2d. . . . . Fattah. . . . . . . . 88.93 Lang. . . . . . . . . . 11.07 2d. . . . . Israel . . . . . . . 48.71 Stalzer . . . . . . 23.77 3d. . . . . Dahlkemper . . . 51.25 English . . . . . . . . 48.75 3d. . . . . Long. . . . . . . . 29.18 King . . . . . . . . 46.62 4th . . . . Altmire . . . . . . . 55.86 Hart . . . . . . . . . . 44.14 4th . . . . McCarthy . . . . 50.82 Martins . . . . . . 28.27 5th . . . . McCracken. . . . 41.04 Thompson . . . . . 56.72 5th . . . . Ackerman . . . 51.43 Berney . . . . . . 20.92 6th . . . . Roggio . . . . . . . 47.90 Gerlach . . . . . . . 52.10 6th . . . . Meeks . . . . . . 67.12 (1) . . . . . . . . . . (1) 7th . . . . Sestak . . . . . . . 59.59 Williams . . . . . . . 40.41 7th . . . . Crowley . . . . . 60.29 Britt, Jr . . . . . . 10.25 8th . . . . Murphy . . . . . . . 56.77 Manion . . . . . . . . 41.63 8th . . . . Nadler . . . . . . 60.08 Lin . . . . . . . . . 14.57 9th . . . . Barr . . . . . . . . . 36.08 Shuster . . . . . . . 63.92 9th . . . . Weiner . . . . . . 52.25 (1) . . . . . . . . . . (1) 10th . . . Carney . . . . . . . 56.33 Hackett. . . . . . . . 43.67 10th . . . Towns . . . . . . 67.80 Grupico . . . . . 3.59 11th . . . Kanjorski . . . . . 51.63 Barletta . . . . . . . 48.37 11th . . . Clarke . . . . . . 68.50 Carr . . . . . . . . 5.04 12th . . . Murtha . . . . . . . 57.85 Russell . . . . . . . . 42.15 12th . . . Velazquez . . . 63.56 Romaguera . . 6.86 13th . . . Schwartz . . . . . 62.79 Kats . . . . . . . . . . 34.53 13th . . . McMahon . . . . 47.89 Straniere . . . . 27.78 14th . . . Doyle . . . . . . . . 91.26 (1) . . . . . . . . . . . . (1) 14th . . . Maloney . . . . . 64.25 Heim . . . . . . . 15.80 15th . . . Bennett . . . . . . 41.43 Dent . . . . . . . . . . 58.57 15th . . . Rangel . . . . . . 69.49 Daniels . . . . . . 6.39 16th . . . Slater . . . . . . . . 39.39 Pitts . . . . . . . . . . 55.82 16th . . . Serrano . . . . . 72.75 Mohamed . . . . 2.33 17th . . . Holden . . . . . . . 63.68 Gilhooley . . . . . . 36.32 17th . . . Engel . . . . . . . 61.40 Goodman . . . . 14.77 18th . . . O’Donnell . . . . . 35.93 Murphy . . . . . . . . 64.07 18th . . . Lowey . . . . . . 55.41 Russell . . . . . . 24.25 19th . . . Avillo, Jr . . . . . . 33.35 Platts . . . . . . . . . 66.65 19th . . . Hall . . . . . . . . 44.05 Lalor . . . . . . . . 32.39 RI . . . . . . (X) . . . . . . . . . . (X) (X) . . . . . . . . . . . (X) 20th . . . Gillibrand . . . . 53.48 Treadwell . . . . 29.86 1st . . . . Kennedy. . . . . . 68.52 Scott . . . . . . . . . 24.22 21st . . . Tonko . . . . . . . 51.24 Buhrmaster . . 27.34 2d. . . . . Langevin . . . . . 70.02 Zaccaria . . . . . . . 29.81 22d. . . . Hinchey . . . . . 50.75 Phillips . . . . . . 26.39 SC . . . . . (X) . . . . . . . . . . (X) (X) . . . . . . . . . . . (X) 23d. . . . Oot . . . . . . . . . 26.81 McHugh . . . . . 46.23 1st . . . . Ketner . . . . . . . 47.89 Brown, Jr . . . . . . 51.93 24th . . . Arcuri . . . . . . . 43.01 Hanna . . . . . . 36.64 2d. . . . . Miller . . . . . . . . 46.18 Wilson . . . . . . . . 53.74 25th . . . Maffei . . . . . . . 46.03 Sweetland . . . 33.10 3d. . . . . Dyer . . . . . . . . . 35.23 Barrett . . . . . . . . 64.69 26th . . . Kryzan . . . . . . 33.91 Lee. . . . . . . . . 38.62 4th . . . . Corden . . . . . . . 36.91 Inglis . . . . . . . . . 60.09 27th . . . Higgins . . . . . . 57.65 Humiston . . . . 17.18 5th . . . . Spratt, Jr . . . . . 61.64 Spencer . . . . . . . 36.99 28th . . . Slaughter . . . . 57.16 Crimmen . . . . 15.45 6th . . . . Clyburn . . . . . . 67.48 Harrelson . . . . . . 32.47 29th . . . Massa . . . . . . 42.80 Kuhl, Jr . . . . . 37.79 SD . . . . . Sandlin . . . . . . . 67.56 Lien . . . . . . . . . . 32.44NC . . . . . (X) . . . . . . . . . (X) (X) . . . . . . . . . (X) TN . . . . . (X) . . . . . . . . . . (X) (X) . . . . . . . . . . . (X) 1st . . . . Butterfield . . . 70.28 Stephens . . . . 29.72 1st . . . . Russell . . . . . . . 24.54 Roe . . . . . . . . . . 71.82 2d. . . . . Etheridge . . . . 66.93 Mansell . . . . . 31.27 2d. . . . . Scott . . . . . . . . 21.89 Duncan, Jr . . . . . 78.11 3d. . . . . Weber . . . . . . 34.10 Jones . . . . . . . 65.90 3d. . . . . Vandagriff . . . . 27.40 Wamp . . . . . . . . 69.37 4th . . . . Price . . . . . . . 63.32 Lawson . . . . . 36.68 4th . . . . Davis . . . . . . . . 58.76 Lankford . . . . . . . 37.81 5th . . . . Carter . . . . . . 41.63 Foxx . . . . . . . . 58.37 5th . . . . Cooper . . . . . . . 65.84 Donovan . . . . . . 31.01 6th . . . . Bratton . . . . . . 33.00 Coble . . . . . . . 67.00 6th . . . . Gordon . . . . . . . 74.42 (1) . . . . . . . . . . . . (1) 7th . . . . McIntyre . . . . . 68.84 Breazeale . . . 31.16 7th . . . . Morris. . . . . . . . 31.42 Blackburn . . . . . . 68.58 8th . . . . Kissell . . . . . . 55.38 Hayes. . . . . . . 44.62 8th . . . . Tanner . . . . . . . 99.97 (1) . . . . . . . . . . . . (1) 9th . . . . Taylor . . . . . . . 35.89 Myrick . . . . . . 62.37 9th . . . . Cohen . . . . . . . 87.85 (1) . . . . . . . . . . . . (1) 10th . . . Johnson . . . . . 42.45 McHenry . . . . 57.55 TX . . . . . (X) . . . . . . . . . . (X) (X) . . . . . . . . . . . (X) 11th . . . Shuler . . . . . . 61.96 Mumpower . . . 35.83 1st . . . . (1) . . . . . . . . . . . (1) Gohmert . . . . . . 87.58 12th . . . Watt . . . . . . . . 71.56 Cobb, Jr . . . . . 28.44 2d. . . . . (1) . . . . . . . . . . . (1) Poe . . . . . . . . . . 88.92 13th . . . Miller . . . . . . . 65.93 Webster . . . . . 34.07 3d. . . . . Daley . . . . . . . . 38.03 Johnson . . . . . . . 59.75ND . . . . . Pomeroy . . . . 61.97 Sand . . . . . . . 38.03 4th . . . . Melancon . . . . . 29.28 Hall . . . . . . . . . . 68.80OH . . . . . (X) . . . . . . . . . (X) (X) . . . . . . . . . (X) 5th . . . . (1) . . . . . . . . . . . (1) Hensarling . . . . . 83.59 1st . . . . Driehaus . . . . 52.47 Chabot . . . . . . 47.48 6th . . . . Otto . . . . . . . . . 35.61 Barton . . . . . . . . 62.02 2d. . . . . Wulsin . . . . . . 37.46 Schmidt . . . . . 44.83 7th . . . . Skelly . . . . . . . . 42.36 Culberson . . . . . 55.90 3d. . . . . Mitakides . . . . 36.68 Turner . . . . . . 63.32 8th . . . . Hargett . . . . . . . 24.79 Brady . . . . . . . . . 72.56 4th . . . . Carroll . . . . . . 34.83 Jordan . . . . . . 65.17 9th . . . . Green . . . . . . . . 93.65 (1) . . . . . . . . . . . . (1) 5th . . . . Mays . . . . . . . 35.91 Latta. . . . . . . . 64.09 10th . . . Doherty . . . . . . 43.15 McCaul . . . . . . . 53.89 6th . . . . Wilson . . . . . . 62.28 Stobbs . . . . . . 32.84 11th . . . (1) . . . . . . . . . . . (1) Conaway . . . . . . 88.33 7th . . . . Neuhardt . . . . 41.78 Austria . . . . . . 58.22 12th . . . Smith . . . . . . . . 30.60 Granger . . . . . . . 67.59 8th . . . . Von Stein . . . . 32.10 Boehner . . . . . 67.90 13th . . . Waun . . . . . . . . 22.35 Thornberry . . . . . 77.65 9th . . . . Kaptur . . . . . . 74.37 Leavitt . . . . . . 25.63 14th . . . (1) . . . . . . . . . . . (1) Paul . . . . . . . . . . 100.00 10th . . . Kucinich . . . . . 57.02 Trakas . . . . . . 39.13 15th . . . Hinojosa . . . . . . 65.71 Zamora . . . . . . . 31.95 11th . . . Fudge . . . . . . 85.22 Pekarek . . . . . 14.71 16th . . . Reyes. . . . . . . . 82.14 (1) . . . . . . . . . . . . (1) 12th . . . Robinson . . . . 42.24 Tiberi . . . . . . . 54.79 17th . . . Edwards . . . . . . 52.98 Curnock . . . . . . . 45.50 13th . . . Sutton . . . . . . 64.70 Potter . . . . . . . 35.29 18th . . . Jackson-Lee . . 77.32 Faulk . . . . . . . . . 20.34 14th . . . O’Neill . . . . . . 38.74 LaTourette . . . 58.32 19th . . . Fullingim . . . . . 24.95 Neugebauer . . . . 72.44 15th . . . Kilroy . . . . . . . 45.94 Stivers . . . . . . 45.18 20th . . . Gonzalez . . . . . 71.90 Litoff . . . . . . . . . . 25.18 16th . . . Boccieri . . . . . 55.36 Schuring . . . . 44.64 21st . . . (1) . . . . . . . . . . . (1) Smith . . . . . . . . . 80.00 17th . . . Ryan . . . . . . . 78.15 Grassell . . . . . 21.85 22d. . . . Lampson . . . . . 45.36 Olson . . . . . . . . . 52.43 18th . . . Space . . . . . . 59.87 Dailey . . . . . . . 40.13 23d. . . . Rodriguez . . . . 55.76 Larson . . . . . . . . 41.92OK . . . . . (X) . . . . . . . . . (X) (X) . . . . . . . . . (X) 24th . . . Love . . . . . . . . . 41.07 Marchant . . . . . . 55.98 1st . . . . Oliver . . . . . . . 33.83 Sullivan . . . . . 66.17 25th . . . Doggett . . . . . . 65.83 Morovich . . . . . . 30.45 2d. . . . . Boren . . . . . . . 70.47 Wickson . . . . . 29.53 26th . . . Leach . . . . . . . . 36.43 Burgess . . . . . . . 60.17 3d. . . . . Robbins . . . . . 23.57 Lucas . . . . . . . 69.72 27th . . . Ortiz . . . . . . . . . 57.95 Vaden . . . . . . . . 38.38 4th . . . . Cummings . . . 29.21 Cole . . . . . . . . 66.02 28th . . . Cuellar . . . . . . . 68.71 Fish . . . . . . . . . . 29.22 5th . . . . Perry . . . . . . . 34.11 Fallin . . . . . . . 65.89 29th . . . Green . . . . . . . . 74.65 Story . . . . . . . . . 23.89OR . . . . . (X) . . . . . . . . . (X) (X) . . . . . . . . . (X) 30th . . . Johnson . . . . . . 82.48 Wood . . . . . . . . . 15.87 1st . . . . Wu . . . . . . . . . 71.50 (1) . . . . . . . . . . (1) 31st . . . Ruiz . . . . . . . . . 36.58 Carter . . . . . . . . 60.27 2d. . . . . Lemas . . . . . . 25.75 Walden. . . . . . 69.50 32d. . . . Roberson . . . . . 40.57 Sessions . . . . . . 57.25
See footnotes at end of table.

Elections 253U.S. Census Bureau, Statistical Abstract of the United States: 2011
Table 403. Composition of Congress by Political Party: 1975 to 2010[D = Democratic, R = Republican. As of beginning of first session of each Congress, except as noted. Data reflect immediate result of elections. Vacancies and third party candidates are noted]
YearParty and president
CongressHouse Senate
Majority party
Minority party Other
Majority party
Minority party Other
1975 1 . . . . . . . . . . . R (Ford) . . . . . . . . . 94th . . . . . . . . . . . . D-291 R-144 – D-61 R-37 21977 2 . . . . . . . . . . . D (Carter) . . . . . . . 95th . . . . . . . . . . . . D-292 R-143 – D-61 R-38 11979 2 . . . . . . . . . . . D (Carter) . . . . . . . 96th . . . . . . . . . . . . D-277 R-158 – D-58 R-41 11981 2 . . . . . . . . . . . R (Reagan) . . . . . . 97th . . . . . . . . . . . . D-242 R-192 1 R-53 D-46 11983. . . . . . . . . . . . . R (Reagan) . . . . . . 98th . . . . . . . . . . . . D-269 R-166 – R-54 D-46 –1985. . . . . . . . . . . . . R (Reagan) . . . . . . 99th . . . . . . . . . . . . D-253 R-182 – R-53 D-47 –1987. . . . . . . . . . . . . R (Reagan) . . . . . . 100th . . . . . . . . . . . D-258 R-177 – D-55 R-45 –1989. . . . . . . . . . . . . R (Bush) . . . . . . . . 101st . . . . . . . . . . . D-260 R-175 – D-55 R-45 –1991 3 . . . . . . . . . . . R (Bush) . . . . . . . . 102d. . . . . . . . . . . . D-267 R-167 1 D-56 R-44 –1993 3 . . . . . . . . . . . D (Clinton) . . . . . . . 103d. . . . . . . . . . . . D-258 R-176 1 D-57 R-43 –1995 3 . . . . . . . . . . . D (Clinton) . . . . . . . 104th . . . . . . . . . . . R-230 D-204 1 R-52 D-48 –1997 4 . . . . . . . . . . . D (Clinton) . . . . . . . 105th . . . . . . . . . . . R-226 D-207 2 R-55 D-45 –1999 3 . . . . . . . . . . . D (Clinton) . . . . . . . 106th . . . . . . . . . . . R-223 D-211 1 R-55 D-45 –2001 4 . . . . . . . . . . . R (Bush) . . . . . . . . 107th . . . . . . . . . . . R-221 D-212 2 D-50 R-50 –2003 5, 6 . . . . . . . . . . R (Bush) . . . . . . . . 108th . . . . . . . . . . . R-229 D-204 1 R-51 D-48 12005 5 . . . . . . . . . . . R (Bush) . . . . . . . . 109th . . . . . . . . . . . R-232 D-202 1 R-55 D-44 12007 7 . . . . . . . . . . . R (Bush) . . . . . . . . 110th . . . . . . . . . . . D-233 R-202 – D-49 R-49 22009 6, 7, 8 . . . . . . . . . D (Obama) . . . . . . . 111th . . . . . . . . . . . D-256 R-178 – D-55 R-41 22010 7, 9 . . . . . . . . . . D (Obama) . . . . . . . 111th . . . . . . . . . . . D-255 R-178 – D-57 R-41 2
– Represents zero. 1 Senate had one Independent and one Conservative-Republican. 2 Senate had one Independent. 3 House had one Independent-Socialist. 4 House had one Independent-Socialist and one Independent. 5 House and Senate each had one Independent. 6 House had one vacancy. 7 Senate had two Independents. 8 Senate had two vacancies. 9 As of beginning of second session, January 5, 2010.
Source: U.S. House of Representatives, Office of the Clerk, Official List of Members, 2010, annual. See also<http://clerk.house.gov/member_info/olm_111.pdf>
Table 402. Vote Cast for U.S. Representatives by Major Political Party—Congressional Districts: 2008—Con.[See headnote, p. 250]
State and
district
Democratic candidate
Republican candidate State
and district
Democratic candidate
Republican candidate
NamePercent of total
NamePercent of total
NamePercent of total
NamePercent of total
UT . . . . . (X) . . . . . . . . (X) (X) . . . . . . . . . (X) 4th . . . Fearing . . . . . 36.91 Hastings . . . . . . . . 63.09 1st . . . . Bowen . . . . . 30.47 Bishop . . . . . . 64.85 5th . . . Mays . . . . . . . 34.72 Rodgers . . . . . . . . 65.28 2d. . . . . Matheson . . . 63.35 Dew . . . . . . . . 34.47 6th . . . Dicks . . . . . . . 66.86 Cloud . . . . . . . . . . 33.14 3d. . . . . Spencer . . . . 28.28 Chaffetz . . . . . 65.61 7th . . . McDermott . . . 83.65 Beren . . . . . . . . . . 16.35VT . . . . . Welch . . . . . . 83.25 (1) . . . . . . . . . . (1) 8th . . . Burner . . . . . . 47.22 Reichert . . . . . . . . 52.78VA . . . . . (X) . . . . . . . . (X) (X) . . . . . . . . . (X) 9th . . . Smith . . . . . . . 65.45 Postma. . . . . . . . . 34.55 1st . . . . Day, Jr . . . . . 41.75 Wittman . . . . . 56.58 WV . . . . (X) . . . . . . . . . (X) (X) . . . . . . . . . . . . (X) 2d. . . . . Nye III . . . . . 52.40 Drake . . . . . . . 47.46 1st . . . Mollohan . . . . 99.93 (1) . . . . . . . . . . . . . (1) 3d. . . . . Scott . . . . . . 97.02 (1) . . . . . . . . . . (1) 2d. . . . Barth . . . . . . . 42.92 Capito . . . . . . . . . 57.07 4th . . . . Miller . . . . . . 40.37 Forbes . . . . . . 59.51 3d. . . . Rahall II . . . . . 66.92 Gearheart . . . . . . 33.08 5th . . . . Perriello . . . . 50.09 Goode, Jr . . . . 49.86 WI . . . . (X) . . . . . . . . . (X) (X) . . . . . . . . . . . . (X) 6th . . . . Rasoul . . . . . 36.61 Goodlatte . . . . 61.57 1st . . . Krupp . . . . . . . 34.69 Ryan . . . . . . . . . . 63.97 7th . . . . Hartke . . . . . 37.10 Cantor . . . . . . 62.72 2d. . . . Baldwin . . . . . 69.33 Theron . . . . . . . . . 30.56 8th . . . . Moran . . . . . 67.94 Ellmore . . . . . 29.68 3d. . . . Kind . . . . . . . . 63.19 Stark . . . . . . . . . . 34.44 9th . . . . Boucher . . . . 97.07 (1) . . . . . . . . . . (1) 4th . . . Moore . . . . . . 87.63 (1) . . . . . . . . . . . . . (1) 10th . . . Feder . . . . . . 38.83 Wolf . . . . . . . . 58.80 Sensenbrenner, 11th . . . Connolly . . . . 54.69 Fimian . . . . . . 43.05 5th . . . (1) . . . . . . . . . . (1) Jr . . . . . . . . . . . . . 79.58WA . . . . . (X) . . . . . . . . (X) (X) . . . . . . . . . (X) 6th . . . Kittelson . . . . . 36.21 Petri . . . . . . . . . . . 63.71 1st . . . . Inslee . . . . . . 67.76 Ishmael . . . . . 32.24 7th . . . Obey . . . . . . . 60.79 Mielke . . . . . . . . . 39.14 2d. . . . . Larsen . . . . . 62.39 Bart . . . . . . . . 37.61 8th . . . Kagen . . . . . . 54.00 Gard . . . . . . . . . . . 45.90 3d. . . . . Baird . . . . . . 64.01 Delavar . . . . . 35.99 WY . . . . Trauner . . . . . 42.78 Lummis . . . . . . . . 52.59
X Not applicable. 1 No candidate. 2 According to state law, it is not required to tabulate votes for unopposed candidates.3 Louisiana holds an open-primary election with candidates from all parties running on the same ballot. Any candidate who receives a majority is elected; if no candidate receives 50 percent, there is a run-off election in November between the top two finishers. 4 Reflects votes cast in the run-off election held on December 6, 2008.
Source: U.S. House of Representatives, Office of the Clerk, Statistics of the Presidential and Congressional Election, 2009, biennial. See also <http://clerk.house.gov/member_info/election.html>.

254 ElectionsU.S. Census Bureau, Statistical Abstract of the United States: 2011
Table 404. Composition of Congress by Political Party Affiliation—States: 2005 to 2010[Figures are for the beginning of the first session, except as noted. Dem. = Democratic; Rep. = Republican]
State
Representatives Senators
109th Cong.,1, 2, 3
2005
110th Cong., 2007
111th Cong.,4
2009
111th Cong.,5, 6
2010
109th Cong.,3, 7
2005
110th Cong.,8
2007
111th Cong., 8, 9
2009
111th Cong., 5, 8
2010
Dem. Rep. Dem. Rep. Dem. Rep. Dem. Rep. Dem. Rep. Dem. Rep. Dem. Rep. Dem. Rep.
U .S . . . . 202 231 233 202 256 178 255 178 44 55 49 49 55 41 57 41
AL . . . . . . 2 5 2 5 3 4 2 5 – 2 – 2 – 2 – 2AK . . . . . . – 1 – 1 – 1 – 1 – 2 – 2 1 1 1 1AZ . . . . . . 2 6 4 4 5 3 5 3 – 2 – 2 – 2 – 2AR . . . . . . 3 1 3 1 3 1 3 1 2 – 2 – 2 – 2 –CA . . . . . . 33 20 34 19 34 19 34 19 2 – 2 – 2 – 2 –
CO . . . . . . 3 4 4 3 5 2 5 2 1 1 1 1 2 – 2 –CT . . . . . . 2 3 4 1 5 – 5 – 2 – 1 – 1 – 1 –DE . . . . . . – 1 – 1 – 1 – 1 2 – 2 – 2 – 2 –FL . . . . . . 7 18 9 16 10 15 10 15 1 1 1 1 1 1 1 1GA . . . . . . 6 7 6 7 6 7 6 7 – 2 – 2 – 2 – 2
HI . . . . . . . 2 – 2 – 2 – 1 1 2 – 2 – 2 – 2 –ID . . . . . . . – 2 – 2 1 1 1 1 – 2 – 2 – 2 – 2IL . . . . . . . 10 9 10 9 11 7 12 7 2 – 2 – 1 – 2 –IN . . . . . . . 2 7 5 4 5 4 5 3 1 1 1 1 1 1 1 1IA . . . . . . . 1 4 3 2 3 2 3 2 1 1 1 1 1 1 1 1
KS . . . . . . 1 3 2 2 1 3 1 3 – 2 – 2 – 2 – 2KY . . . . . . 1 5 2 4 2 4 2 4 – 2 – 2 – 2 – 2LA . . . . . . 2 5 2 5 1 6 1 6 1 1 1 1 1 1 1 1ME . . . . . . 2 – 2 – 2 – 2 – – 2 – 2 – 2 – 2MD . . . . . . 6 2 6 2 7 1 7 1 2 – 2 – 2 – 2 –
MA . . . . . . 10 – 10 – 10 – 10 – 2 – 2 – 2 – 1 1MI . . . . . . . 6 9 6 9 8 7 8 7 2 – 2 – 2 – 2 –MN . . . . . . 4 4 5 3 5 3 5 3 1 1 1 1 1 – 2 –MS . . . . . . 2 2 2 2 3 1 3 1 – 2 – 2 – 2 – 2MO . . . . . . 4 5 4 5 4 5 4 5 – 2 1 1 1 1 1 1
MT . . . . . . – 1 – 1 – 1 – 1 1 1 2 – 2 – 2 –NE . . . . . . – 3 – 3 – 3 – 3 1 1 1 1 1 1 1 1NV . . . . . . 1 2 1 2 2 1 2 1 1 1 1 1 1 1 1 1NH . . . . . . – 2 2 – 2 – 2 – – 2 – 2 1 1 1 1NJ . . . . . . 7 6 7 6 8 5 8 5 2 – 2 – 2 – 2 –
NM . . . . . . 1 2 1 2 3 – 3 – 1 1 1 1 2 – 2 –NY . . . . . . 20 9 23 6 26 3 26 2 2 – 2 – 2 – 2 –NC . . . . . . 6 7 7 6 8 5 8 5 – 2 – 2 1 1 1 1ND . . . . . . 1 – 1 – 1 – 1 – 2 – 2 – 2 – 2 –OH . . . . . . 6 11 7 11 10 8 10 8 – 2 1 1 1 1 1 1
OK . . . . . . 1 4 1 4 1 4 1 4 – 2 – 2 – 2 – 2OR . . . . . . 4 1 4 1 4 1 4 1 1 1 1 1 2 – 2 –PA . . . . . . 7 12 11 8 12 7 12 7 – 2 1 1 1 1 2 –RI . . . . . . . 2 – 2 – 2 – 2 – 1 1 2 – 2 – 2 –SC . . . . . . 2 4 2 4 2 4 2 4 – 2 – 2 – 2 – 2
SD . . . . . . 1 – 1 – 1 – 1 – 1 1 1 1 1 1 1 1TN . . . . . . 5 4 5 4 5 4 5 4 – 2 – 2 – 2 – 2TX . . . . . . 11 21 13 19 12 20 12 20 – 2 – 2 – 2 – 2UT . . . . . . 1 2 1 2 1 2 1 2 – 2 – 2 – 2 – 2VT . . . . . . – – 1 – 1 – 1 – 1 – 1 – 1 – 1 –
VA . . . . . . 3 8 3 8 6 5 6 5 – 2 1 1 2 – 2 –WA . . . . . . 6 3 6 3 6 3 6 3 2 – 2 – 2 – 2 –WV . . . . . . 2 1 2 1 2 1 2 1 2 – 2 – 2 – 2 –WI . . . . . . 4 4 5 3 5 3 5 3 2 – 2 – 2 – 2 –WY . . . . . . – 1 – 1 – 1 – 1 – 2 – 2 – 2 – 2
– Represents zero. 1 Vermont had one Independent-Socialist representative. 2 Ohio had one vacancy due to the resignation of Rob Portman, April 29, 2005. 3 As of June 28, 2005. 4 One vacancy due to the resignation of Rahm Emanuel, January 6, 2009 5 As of second session, July 20, 2010. 6 Two vacancies—one in Indiana due to the resignation of Mark E. Souder, May 21, 2010, and one in New York due to the resignation of Eric J. J. Massa, March 8, 2010. 7 Vermont had one Independent senator. 8 Vermont and Connecticut both had one Independent senator. 9 Two vacancies—one in Illinois due to the resignation of Barack Obama, November 16, 2008, and one in Minnesota due to election dispute between Norm Coleman and Al Franken.
Source: U.S. House of Representatives, Office of the Clerk, Official List of Members, annual. See also <http://clerk.house.gov/member_info/olm_111.pdf>.

Elections 255U.S. Census Bureau, Statistical Abstract of the United States: 2011
Table 407. Congressional Bills Vetoed: 1961 to 2010
Period PresidentTotal
vetoesRegular
vetoesPocket vetoes
Vetoes sustained
Bills passed over veto
1961–63. . . . . . . . . . . . . . John F. Kennedy . . . . . . 21 12 9 21 –1963–69. . . . . . . . . . . . . . Lyndon B. Johnson . . . . 30 16 14 30 –1969–74. . . . . . . . . . . . . . Richard M. Nixon . . . . . . 43 26 17 36 71974–77. . . . . . . . . . . . . . Gerald R. Ford . . . . . . . . 66 48 18 54 121977–81. . . . . . . . . . . . . . Jimmy Carter . . . . . . . . . 31 13 18 29 21981–89. . . . . . . . . . . . . . Ronald W. Reagan . . . . . 78 39 39 69 91989–93. . . . . . . . . . . . . . George Bush . . . . . . . . . 44 29 15 43 11993–2001. . . . . . . . . . . . William J. Clinton . . . . . . 37 36 1 34 22001–2009. . . . . . . . . . . . George W. Bush . . . . . . . 10 10 – 7 32009–2010 1 . . . . . . . . . . Barack Obama . . . . . . . . 1 – 1 1 –
– Represents zero. 1 For the period January 20, 2009 through May 11, 2010. Source: U.S. Congress, Senate Library, Presidential Vetoes . . . 1789–1968; U.S. Congress, Calendars of the U.S. House of
Representatives and History of Legislation, annual. See also <http://clerk.house.gov/art_history/house_history/vetoes.html>.
Table 406. U.S. Congress—Measures Introduced and Enacted and Time in Session: 1993 to 2009[Excludes simple and concurrent resolutions]
Item103d
Cong., 1993–94
104th Cong.,
1995–96
105th Cong.,
1997–98
106th Cong.,
1999–00
107th Cong.,
2001–02
108th Cong.,
2003–04
109th Cong.,
2005–06
110th Cong.,
2007–08
111th Cong.,
2009
Measures introduced . . . . . . . . 8,544 6,808 7,732 9,158 9,130 8,625 10,703 11,228 7,415 Bills . . . . . . . . . . . . . . . . . . . . 7,883 6,545 7,532 8,968 8,953 8,468 10,560 11,081 7,324 Joint resolutions . . . . . . . . . . . 661 263 200 190 177 157 143 147 91
Measures enacted . . . . . . . . . . 473 337 404 604 337 504 590 460 125 Public 1 . . . . . . . . . . . . . . . . . . 465 333 394 580 331 498 589 460 125 Private 2 . . . . . . . . . . . . . . . . . 8 4 10 24 6 6 1 – –
HOUSE OF REPRESENTATIVES
Number of days . . . . . . . . . . . . 265 290 251 272 265 243 241 283 159Number of hours . . . . . . . . . . . 1,887 2,445 2,001 2,179 1,694 1,894 1,917 2,138 1,247Number of hours per day . . . . . 7.1 8.4 8.0 8.0 6.4 7.8 8.0 7.6 7.8
SENATENumber of days . . . . . . . . . . . . 291 343 296 303 322 300 297 374 191Number of hours . . . . . . . . . . . 2,514 2,876 2,188 2,200 2,279 2,486 2,250 2,364 1,421Number of hours per day . . . . . 8.6 8.4 7.4 7.3 7.1 8.3 7.6 6.3 7.4
– Represents zero. 1 Laws on public matters that apply to all persons. 2 Laws designed to provide legal relief to specified persons or entities adversely affected by laws of general applicability.
Source: U.S. Congress, Congressional Record and Daily Calendar, selected issues. See also <http://www.senate.gov/pagelayout/reference/two_column_table/Resumes.htm>.
Table 405. Members of Congress—Selected Characteristics: 1995 to 2009[As of beginning of first session of each Congress, except as noted. Figures for Representatives exclude vacancies]
Members of Congress and year
Male Female Black 1 API 2
His-panic 3
Age 4 (in years) Seniority 5, 6
Under 40
40 to 49
50 to 59
60 to
69
70 and over
Less than
2 yrs.
2 to 9
yrs.
10 to 19
yrs.
20 to 29
yrs.
30 yrs.
or more
REPRESENTATIVES104th Cong., 1995 . . . 388 47 7 40 7 17 53 155 135 79 13 92 188 110 36 9106th Cong., 1999 . . . 379 56 7 39 6 19 23 116 173 87 35 41 236 104 46 7107th Cong., 2001 . . . 376 59 7 39 7 19 14 97 167 117 35 44 155 158 63 14108th Cong., 2003 . . . 376 59 7 39 5 22 19 86 174 121 32 54 178 140 48 13109th Cong., 2005 . . . 369 65 7 42 4 23 22 96 175 113 28 37 173 158 48 18110th Cong., 2007 . . . 361 74 7 42 4 23 20 91 172 118 34 62 159 160 37 17111th Cong., 2009 . . . 366 72 7 41 8 (NA) 24 84 156 126 44 66 166 142 42 18
SENATORS104th Cong., 1995 . . . 92 8 1 2 – 1 14 41 27 17 12 38 30 15 5106th Cong., 1999 . . . 91 9 – 2 – – 14 38 35 13 8 39 33 14 6107th Cong., 2001 . . . 87 13 – 2 – – 8 39 33 18 11 34 30 14 9108th Cong., 2003 . . . 86 14 – 2 – 1 12 29 34 24 9 42 29 13 7109th Cong., 2005 . . . 86 14 1 2 2 – 17 29 33 21 9 41 29 14 7110th Cong., 2007 . . . 84 16 1 2 3 – 11 31 34 24 12 42 24 13 9111th Cong., 2009 8 . . 83 17 1 1 (NA) – 7 31 38 22 9 34 28 17 10
– Represents zero. NA Not available. 1 Source: Joint Center for Political and Economic Studies, Washington, DC, Black Elected Officials: Statistical Summary, annual (copyright). 2 Asian and Pacific Islanders. Source: Prior to 2005, Library of Congress, Congressional Research Service, “Asian Pacific Americans in the United States Congress,” Report 94-767 GOV; starting 2005, U.S. House of Representatives, “House Press Gallery,” <http://www.house.gov/daily/> (as of May 25, 2009) and U.S. Senate, “Minorities in the Senate,” <http://www.senate.gov/artandhistory/history/common/briefing/minority_senators.htm> (August 30, 2010). 3 Source: National Association of Latino Elected and Appointed Officials, Washington, DC, National Roster of Hispanic Elected Officials, annual. 4 Some members do not provide date of birth. 5 Represents consecutive years of service. 6 Some members do not provide years of service. 7 Includes District of Columbia and Virgin Islands delegate. 8 Excludes vacancies.
Source: Except as noted, compiled by U.S. Census Bureau from data published in Congressional Directory, biennial. See also <http://www.gpoaccess.gov/cdirectory/browse.html>.

256 ElectionsU.S. Census Bureau, Statistical Abstract of the United States: 2011
Table 408. Number of Governors by Political Party Affiliation: 1975 to 2010[Reflects figures after inaugurations for each year]
Year Demo-cratic
Republi-can
Inde-pendent/
otherYear Demo-
craticRepubli-
can
Inde-pendent/
otherYear Demo-
craticRepubli-
can
Inde-pendent/
other
1975. . . . 36 13 1 1999. . . . 17 31 1 2005. . . . 22 28 –1980. . . . 31 19 – 2000. . . . 18 30 2 2006. . . . 22 28 –1985. . . . 34 16 – 2001. . . . 19 29 2 2007. . . . 28 22 –1990. . . . 29 21 – 2002. . . . 22 27 1 2008. . . . 28 22 –1995. . . . 19 30 1 2003. . . . 23 27 – 2009. . . . 28 22 –1998. . . . 17 32 1 2004. . . . 22 28 – 2010. . . . 26 24 –
– Represents zero.Source: National Governors Association, Washington, DC, 1970–87 and 1991–2010, Directory of Governors of the American
States, Commonwealths & Territories, annual, and 1988–90, Directory of Governors, annual (copyright).
Table 409. Vote Cast for and Governor Elected by State: 2006 to 2009[In thousands (1,250 represents 1,250,000), except percent. D = Democratic, R = Republican]
State Current governor 1 Year of election Total vote 2 Republican Democratic
Percent leading party
Alabama . . . . . . . . . . . . Bob Riley 2006 1,250 718 520 R-57.4Alaska . . . . . . . . . . . . . . Sean Parnell 3 2006 238 115 97 R-48.1Arizona . . . . . . . . . . . . . Jan Brewer 4 2006 1,534 544 960 D-62.6Arkansas . . . . . . . . . . . . Mike Beebe 2006 774 315 430 D-55.5California . . . . . . . . . . . . Arnold Schwarzenegger 2006 8,679 4,850 3,377 R-55.9
Colorado . . . . . . . . . . . . Bill Ritter 2006 1,558 626 888 D-57.0Connecticut . . . . . . . . . . M. Jodi Rell 2006 1,123 710 398 R-63.2Delaware . . . . . . . . . . . . Jack Markell 2008 395 127 267 D-67.5Florida . . . . . . . . . . . . . . Charlie Crist 2006 4,829 2,520 2,178 R-52.2Georgia . . . . . . . . . . . . . Sonny Perdue 2006 2,122 1,230 811 R-57.9
Hawaii . . . . . . . . . . . . . . Linda Lingle 2006 349 215 122 R-61.7Idaho . . . . . . . . . . . . . . . C.L. “Butch” Otter 2006 489 276 199 R-52.7Illinois . . . . . . . . . . . . . . . Patrick Quinn 5 2006 3,586 1,369 1,736 D-48.4Indiana . . . . . . . . . . . . . . Mitch Daniels 2008 2,704 1,564 1,082 R-57.8Iowa . . . . . . . . . . . . . . . . Chet Culver 2006 1,059 467 569 D-53.7
Kansas . . . . . . . . . . . . . . Mark Parkinson 6 2006 850 344 492 D-57.9Kentucky . . . . . . . . . . . . Steven L. Beshear 2007 1,055 436 620 D-58.7Louisiana . . . . . . . . . . . . Bobby Jindal 2007 1,298 699 398 R-54.0Maine . . . . . . . . . . . . . . . John E. Baldacci 2006 551 166 210 D-38.1Maryland . . . . . . . . . . . . Martin O’Malley 2006 1,717 825 942 D-52.7
Massachusetts . . . . . . . . Deval L. Patrick 2006 2,244 784 1,235 D-55.0Michigan . . . . . . . . . . . . Jennifer Granholm 2006 3,801 1,608 2,143 D-56.3Minnesota . . . . . . . . . . . Tim Pawlenty 2006 2,218 1,029 1,007 R-46.4Mississippi . . . . . . . . . . . Haley Barbour 2007 744 431 313 R-57.9Missouri . . . . . . . . . . . . . Jay Nixon 2008 2,878 1,136 1,681 D-58.4
Montana . . . . . . . . . . . . . Brian Schweitzer 2008 487 158 319 D-65.5Nebraska . . . . . . . . . . . . Dave Heineman 2006 593 436 145 R-73.3Nevada . . . . . . . . . . . . . James A. Gibbons 2006 582 279 256 R-47.9New Hampshire . . . . . . . John Lynch 2008 683 189 479 D-70.2New Jersey . . . . . . . . . . Christopher J. Christie 2009 2,452 1,174 1,088 R-47.9
New Mexico . . . . . . . . . . Bill Richardson 2006 559 174 385 D-68.8New York . . . . . . . . . . . . David A. Paterson 7 2006 4,698 1,106 2,741 D-58.3North Carolina . . . . . . . . Beverly Perdue 2008 4,269 2,001 2,146 D-50.3North Dakota . . . . . . . . . John Hoeven 2008 316 235 74 R-74.4Ohio . . . . . . . . . . . . . . . . Ted Strickland 2006 4,184 1,471 2,428 D-58.0
Oklahoma . . . . . . . . . . . Brad Henry 2006 926 310 616 R-66.5Oregon . . . . . . . . . . . . . . Ted Kulongoski 2006 1,400 534 579 D-41.3Pennsylvania . . . . . . . . . Edward G. Rendell 2006 4,093 1,622 2,471 D-60.4Rhode Island . . . . . . . . . Don Carcieri 2006 388 197 190 R-51.0South Carolina . . . . . . . . Mark Sanford 2006 1,092 602 489 R-55.1
South Dakota . . . . . . . . . Mike Rounds 2006 336 207 121 R-61.7Tennessee . . . . . . . . . . . Phil Bredesen 2006 1,819 541 1,247 D-68.6Texas . . . . . . . . . . . . . . . Rick Perry 2006 4,399 1,717 1,310 R-39.0Utah . . . . . . . . . . . . . . . . Gary Herbert 8 2008 907 701 175 R-77.9Vermont . . . . . . . . . . . . . Jim Douglas 2008 319 170 70 R-53.4
Virginia . . . . . . . . . . . . . . Robert McDonnell 2009 1,982 1,164 819 R-59.0Washington . . . . . . . . . . Christine Gregoire 2008 3,003 1,404 1,599 D-53.2West Virginia . . . . . . . . . Joe Manchin III 2008 706 182 493 D-69.8Wisconsin . . . . . . . . . . . Jim Doyle 2006 2,162 979 1,139 D-52.7Wyoming . . . . . . . . . . . . Dave Freudenthal 2006 194 58 136 D-69.8
1 As of September 3, 2010. Source: National Governors Association, Washington, DC. See also <http://www.nga.org>.2 Includes minor party and scattered votes. 3 Data are for Sarah Palin, who resigned July 26, 2009. 4 Data are for Janet Napolitano, who was appointed U.S. Secretary of Homeland Security January 21, 2009. 5 Data are for Rod Blagojevich, who was removed from office January 29, 2009. 6 Data are for Kathleen Sebelius, who resigned April 28, 2009. 7 Data are for Eliot Spitzer, who resigned March 17, 2008. 8 Data are for Jon Huntsman, who resigned August 7, 2009.
Source: Except as noted, The Council of State Governments, Lexington, KY, The Book of States 2010, annual (copyright).

Elections 257U.S. Census Bureau, Statistical Abstract of the United States: 2011
Table 410. Political Party Control of State Legislatures by Party: 1985 to 2010[As of beginning of year. Nebraska has a nonpartisan legislature]
Year
Legislatures under—
Year
Legislatures under—
Year
Legislatures under—
Demo-cratic
control
Split control
or tie
Repub-lican
control
Demo-cratic
control
Split control
or tie
Repub-lican
control
Demo-cratic
control
Split control
or tie
Repub-lican
control
1985. . . . 27 11 11 1996. . . . 16 15 18 2004. . . . 17 11 211989 1 . . 28 13 8 1997. . . . 20 11 18 2005. . . . 19 10 201990. . . . 29 11 9 1999. . . . 20 12 17 2006. . . . 19 10 201992. . . . 29 14 6 2000. . . . 16 15 18 2007. . . . 22 12 151993. . . . 25 16 8 2001. . . . 16 15 18 2008. . . . 23 14 121994. . . . 24 17 8 2002. . . . 17 15 17 2009. . . . 27 8 141995. . . . 18 12 19 2003. . . . 16 12 21 2010. . . . 27 8 14
1 A party change during the year by a Democratic representative broke the tie in the Indiana House of Representatives, giving the Republicans control of both chambers.
Source: National Conference of State Legislatures, Denver, CO, State Legislatures, periodic.
Table 411. Composition of State Legislatures by Political Party Affiliation: 2009 and 2010[Data as of March and reflect February election results in year shown, except as noted. Figures reflect immediate results of elections, including holdover members in state houses which do not have all of their members running for reelection. Dem. = Democrat, Rep. = Republican, Vac. = Vacancies. In general, Lower House refers to body consisting of state representatives and Upper House, of state senators]
State
Lower House Lower House Upper House Upper House
2009 2010 2009 2010
Dem. Rep. Other Vac. Dem. Rep. Other Vac. Dem. Rep. Other Vac. Dem. Rep. Other Vac.
U .S . . . . . . . . 3,041 2,346 18 6 3,028 2,356 21 6 1,021 890 2 9 1,026 893 2 1AL 1 . . . . . . . . 62 43 – – 60 45 – – 19 13 – 3 21 14 – –AK 2 . . . . . . . . 18 22 – – 18 22 – – 10 10 – – 10 10 – –AZ 3 . . . . . . . . 24 36 – – 25 35 – – 12 18 – – 12 18 – –AR 2 . . . . . . . . 71 28 1 – 71 28 1 – 27 8 – – 27 8 – –CA 2 . . . . . . . . 51 29 – – 49 29 1 1 25 14 – 1 25 14 – 1CO 2 . . . . . . . . 38 27 – – 38 27 – – 21 14 – – 21 14 – –CT 3 . . . . . . . . 114 36 – 1 114 37 – – 24 12 – – 24 12 – –DE 2 . . . . . . . . 24 17 – – 24 17 – – 16 5 – – 15 6 – –FL 2 . . . . . . . . 44 76 – – 44 76 – – 14 26 – – 14 26 – –GA 3 . . . . . . . . 73 107 – – 74 105 1 – 22 34 – – 22 34 – –HI 2 . . . . . . . . . 45 6 – – 45 6 – – 23 2 – – 23 2 – –ID 3 . . . . . . . . . 18 52 – – 18 52 – – 7 28 – – 7 28 – –IL 4 . . . . . . . . . 70 48 – – 70 48 – – 37 22 – – 37 22 – –IN 2 . . . . . . . . . 52 48 – – 52 48 – – 17 33 – – 17 33 – –IA 2 . . . . . . . . . 56 44 – – 56 44 – – 32 18 – – 32 18 – –KS 2 . . . . . . . . 49 76 – – 49 76 – – 9 31 – – 9 31 – –KY 2 . . . . . . . . 65 35 – – 65 35 – – 15 21 1 1 17 20 1 –LA 1 . . . . . . . . 51 50 3 1 52 50 3 – 22 15 – 2 24 15 – –ME 3 . . . . . . . . 95 55 1 – 96 54 1 – 20 15 – – 20 15 – –MD 1 . . . . . . . . 104 36 1 – 104 36 1 – 33 14 – – 33 14 – –MA 3 . . . . . . . . 142 16 1 1 143 16 1 – 35 5 – – 35 5 – –MI 2 . . . . . . . . 67 43 – – 66 43 – 1 16 21 – 1 16 22 – –MN 2 . . . . . . . . 87 47 – – 87 47 – – 46 21 – – 46 21 – –MS 1 . . . . . . . . 74 48 – – 74 48 – – 27 25 – – 27 25 – –MO 2 . . . . . . . . 74 89 – – 74 88 – 1 11 23 – – 11 23 – –MT 2 . . . . . . . . 50 50 – – 50 50 – – 23 27 – – 23 27 – –NE 5 . . . . . . . . (5) (5) (5) (5) (5) (5) (5) (5) (5) (5) (5) (5) (5) (5) (5) (5)NV 2 . . . . . . . . 28 14 – – 28 14 – – 12 9 – – 12 9 – –NH 3 . . . . . . . . 224 175 – 1 225 175 – – 14 10 – – 14 10 – –NJ 2 . . . . . . . . 48 32 – – 47 33 – – 23 16 – 1 23 17 – –NM 2 . . . . . . . . 45 25 – – 45 25 – – 27 15 – – 27 15 – –NY 3 . . . . . . . . 108 41 1 – 105 43 2 – 32 30 – – 32 30 – –NC 3 . . . . . . . . 68 52 – – 68 52 – – 30 20 – – 30 20 – –ND 1 . . . . . . . . 36 58 – – 36 58 – – 21 26 – – 21 26 – –OH 2 . . . . . . . . 53 46 – – 53 46 – – 12 21 – – 12 21 – –OK 2 . . . . . . . . 40 61 – – 40 61 – – 22 26 – – 22 26 – –OR 2 . . . . . . . . 36 24 – – 36 24 – – 18 12 – – 18 12 – –PA 2 . . . . . . . . 104 99 – – 103 97 – 3 21 29 – – 20 30 – –RI 3 . . . . . . . . . 69 6 – – 69 6 – – 33 4 1 – 33 4 1 –SC 2 . . . . . . . . 52 71 – 1 51 73 – – 19 27 – – 19 27 – –SD 3 . . . . . . . . 24 46 – – 24 46 – – 14 21 – – 14 21 – –TN 2 . . . . . . . . 49 50 – – 48 51 – – 14 19 – – 14 19 – –TX 2 . . . . . . . . 74 76 – – 73 77 – – 12 19 – – 12 19 – –UT 2 . . . . . . . . 22 53 – – 22 53 – – 8 21 – – 8 21 – –VT 3 . . . . . . . . 95 48 7 – 95 48 7 – 23 7 – – 23 7 – –VA 2 . . . . . . . . 45 53 2 – 39 59 2 – 21 19 – – 22 18 – –WA 2 . . . . . . . . 61 36 – 1 61 37 – – 31 18 – – 31 18 – –WV 2 . . . . . . . . 71 29 – – 71 29 – – 26 8 – – 26 8 – –WI 2 . . . . . . . . 52 46 1 – 52 46 1 – 18 15 – – 18 15 – –WY 2 . . . . . . . . 19 41 – – 19 41 – – 7 23 – – 7 23 – –
– Represents zero. 1 Members of both houses serve 4-year terms. 2 Upper house members serve 4-year terms and lower house members serve 2-year terms. 3 Members of both houses serve 2-year terms. 4 Illinois—4- and 2-year term depending on district. 5 Nebraska—4-year term and only state to have a nonpartisan legislature.
Source: The Council of State Governments, Lexington, KY, The Book of States 2010, annual (copyright).

258 ElectionsU.S. Census Bureau, Statistical Abstract of the United States: 2011
Table 412. Women Holding State Public Offices by Office and State: 2009[As of January. For data on women in U.S. Congress, see Table 405. For women in parliament by country, see Table 1364]
State
Total
Statewide elective
executive office 1
State legislature
State
Total
Statewide elective
executive office 1
State legislature
Total Percent 2 Total Percent 2
U .S . . . . . . 1,868 71 1,797 25 MO . . . . . . 44 2 42 21MT . . . . . . 43 4 39 26
AL . . . . . . . 24 6 18 13 NE . . . . . . 11 1 10 (3)AK . . . . . . . 13 – 13 22 NV . . . . . . 23 3 20 32AZ . . . . . . . 31 3 28 31 NH . . . . . . 159 – 159 38AR . . . . . . . 32 1 31 23 NJ . . . . . . 36 – 36 30CA . . . . . . . 34 1 33 28 NM . . . . . . 37 3 34 30CO . . . . . . . 39 2 37 37 NY . . . . . . 52 – 52 25CT . . . . . . . 63 4 59 32 NC . . . . . . 50 6 44 26DE . . . . . . . 18 2 16 26 ND . . . . . . 24 1 23 16FL . . . . . . . 38 1 37 23 OH . . . . . . 30 2 28 21GA . . . . . . . 47 1 46 19 OK . . . . . . 21 4 17 11HI . . . . . . . . 26 1 25 33 OR . . . . . . 26 2 24 27ID . . . . . . . . 27 1 26 25 PA . . . . . . 37 – 37 15IL . . . . . . . . 50 1 49 28 RI . . . . . . . 26 1 25 22IN . . . . . . . . 33 1 32 21 SC . . . . . . 17 – 17 10IA . . . . . . . . 36 1 35 23 SD . . . . . . 21 – 21 20KS . . . . . . . 49 1 48 29 TN . . . . . . 24 – 24 18KY . . . . . . . 23 1 22 16 TX . . . . . . 45 2 43 24LA . . . . . . . 23 – 23 16 UT . . . . . . 23 – 23 22ME . . . . . . . 54 – 54 29 VT . . . . . . 68 1 67 37MD . . . . . . . 58 – 58 31 VA . . . . . . 24 – 24 17MA . . . . . . . 53 1 52 26 WA . . . . . . 49 1 48 33MI . . . . . . . . 39 2 37 25 WV . . . . . . 23 1 22 16MN . . . . . . . 73 3 70 35 WI . . . . . . 31 2 29 22MS . . . . . . . 25 – 25 14 WY . . . . . . 16 1 15 17
– Represents zero. 1 Excludes women elected to the judiciary, women appointed to state cabinet-level positions, women elected to executive posts by the legislature, and elected members of university Board of Trustees or Board of Education. 2 Calculated by U.S. Census Bureau based on total (male and female) state legislature (both upper and lower houses) data from Table 411. 3 Nebraska—4-year term and only state to have a nonpartisan legislature.
Source: Center for the American Woman and Politics, Eagleton Institute of Politics, Rutgers University, New Brunswick, NJ, information releases, (copyright).
Table 413. Black Elected Officials by Office, 1970 to 2002, and State, 2002[As of January 2002, no Black elected officials had been identified in Montana or South Dakota]
State
Total
U.S. and state
legisla-tures 1
City and county
offices 2
Law enforce-
ment 3
Educa-tion 4
State
Total
U.S. and state
legisla-tures 1
City and county
offices 2
Law enforce-
ment 3
Educa-tion 4
1970 (Feb.) . . . 1,469 179 715 213 362 MD . . . . . . . . 192 40 101 41 101980 (July) . . . . 4,890 326 2,832 526 1,206 MA . . . . . . . . 79 6 60 2 111990 (Jan.) . . . 7,335 436 4,485 769 1,645 MI . . . . . . . . . 353 24 153 62 1141995 (Jan.) . . . 8,385 604 4,954 987 1,840 MN . . . . . . . . 20 2 4 10 41999 (Jan.) . . . 8,896 618 5,354 997 1,927 MS . . . . . . . . 950 46 646 121 1372000 (Jan.) . . . 9,001 621 5,420 1,037 1,923 MO . . . . . . . . 206 19 145 17 252001 (Jan.) . . . 9,061 633 5,456 1,044 1,928 NE . . . . . . . . 9 1 5 – 3
2002 (Jan .) . . . 9,430 636 5,753 1,081 1,960NV . . . . . . . . 13 5 4 2 2NH . . . . . . . . 5 5 – – –
AL . . . . . . . . . . 757 36 569 56 96 NJ . . . . . . . . 269 18 162 – 89AK . . . . . . . . . . 2 1 1 – – NM . . . . . . . . 4 1 0 2 1AZ . . . . . . . . . . 13 1 1 6 5 NY . . . . . . . . 328 34 90 84 120AR . . . . . . . . . . 535 15 374 17 129 NC . . . . . . . . 523 28 369 31 95CA . . . . . . . . . . 234 10 78 76 70 ND . . . . . . . . 1 – 1 – –CO . . . . . . . . . . 17 4 5 8 – OH . . . . . . . . 305 21 197 35 52CT . . . . . . . . . . 69 14 46 3 6 OK . . . . . . . . 115 6 85 4 20DE . . . . . . . . . . 29 4 18 – 7 OR . . . . . . . . 5 3 1 1 –DC . . . . . . . . . . 174 5 2 169 – 3 PA . . . . . . . . 215 19 85 75 36FL . . . . . . . . . . 275 25 180 43 27 RI . . . . . . . . . 8 7 1 – –GA . . . . . . . . . . 640 53 413 48 126 SC . . . . . . . . 547 32 345 12 158HI . . . . . . . . . . . 1 1 – – – TN . . . . . . . . 195 18 118 28 31ID . . . . . . . . . . . 1 – 1 – – TX . . . . . . . . 466 19 306 47 94IL . . . . . . . . . . . 619 28 327 59 205 UT . . . . . . . . 5 1 3 1 –IN . . . . . . . . . . . 94 13 54 13 14 VT . . . . . . . . 1 1 – – –IA . . . . . . . . . . . 12 1 8 1 2 VA . . . . . . . . 248 16 132 16 84KS . . . . . . . . . . 16 7 4 3 2 WA . . . . . . . . 24 2 9 11 2KY . . . . . . . . . . 62 5 45 6 6 WV . . . . . . . . 19 2 13 3 1LA . . . . . . . . . . 739 32 408 132 167 WI . . . . . . . . 33 8 15 5 5ME . . . . . . . . . . 2 – 1 – 1 WY . . . . . . . . 1 – 1 – –
– Represents zero. 1 Includes elected state administrators. 2 County commissioners and councilmen, mayors, vice mayors, aldermen, regional officials, and other. 3 Judges, magistrates, constables, marshals, sheriffs, justices of the peace, and other.4 Members of state education agencies, college boards, school boards, and other. 5 Includes one shadow senator (an elected official who lobbied Congress on D.C. issues, but is not sworn in at the federal level and has no voting privileges).
Source: Joint Center for Political and Economic Studies, Washington, DC, Black Elected Officials: A Statistical Summary, annual (copyright), <http://www.jointcenter.org/publications_recent_publications/black_elected_officials>.

Elections 259U.S. Census Bureau, Statistical Abstract of the United States: 2011
Table 415. Reported Voting and Registration Among Native and Naturalized Citizens by Race and Hispanic Origin: 2008[In thousands, except percent. (206,072 represents 206,072,000). As of November]
Nativity status, race, and Hispanic origin
U.S. Citizen
Total citizen
popula- tion
Reported registered
Not registered
Reported voted
Did not vote
Number Percent Number Percent Number Percent Number Percent
Total: All races 1 . . . . . . . . . . . . . . . . . . . . . . 206,072 146,311 71.0 59,761 29.0 131,144 63.6 74,928 36.4 White alone 2 . . . . . . . . . . . . . . . . . . . 169,438 122,020 72.0 47,418 28.0 109,100 64.4 60,338 35.6 Black alone 2 . . . . . . . . . . . . . . . . . . . 24,930 17,375 69.7 7,555 30.3 16,133 64.7 8,797 35.3 Asian alone 2 . . . . . . . . . . . . . . . . . . . 7,059 3,901 55.3 3,159 44.7 3,357 47.6 3,702 52.4 Hispanic 3 . . . . . . . . . . . . . . . . . . . . . . 19,537 11,608 59.4 7,930 40.6 9,745 49.9 9,792 50.1Native citizen: All races 1 . . . . . . . . . . . . . . . . . . . . . . 190,683 137,001 71.8 53,682 28.2 122,839 64.4 67,844 35.6 White alone 2 . . . . . . . . . . . . . . . . . . . 160,266 116,375 72.6 43,891 27.4 104,005 64.9 56,262 35.1 White alone, non-Hispanic . . . . . . . . 146,906 108,438 73.8 38,467 26.2 97,538 66.4 49,367 33.6 Black alone 2 . . . . . . . . . . . . . . . . . . . 23,442 16,431 70.1 7,011 29.9 15,249 65.0 8,193 35.0 Asian alone 2 . . . . . . . . . . . . . . . . . . . 2,654 1,353 51.0 1,301 49.0 1,194 45.0 1,460 55.0 Hispanic 3 . . . . . . . . . . . . . . . . . . . . . . 14,461 8,574 59.3 5,886 40.7 6,995 48.4 7,466 51.6 White alone or in combination 4 . . . . . 162,511 117,910 72.6 44,601 27.4 105,341 64.8 57,170 35.2 Black alone or in combination 4 . . . . . 24,211 16,965 70.1 7,246 29.9 15,738 65.0 8,472 35.0 Asian alone or in combination 4 . . . . . 3,114 1,641 52.7 1,473 47.3 1,433 46.0 1,681 54.0Naturalized citizen: All races 1 . . . . . . . . . . . . . . . . . . . . . . 15,390 9,310 60.5 6,080 39.5 8,305 54.0 7,085 46.0 White alone 2 . . . . . . . . . . . . . . . . . . . 9,171 5,645 61.6 3,526 38.4 5,095 55.6 4,076 44.4 White alone, non-Hispanic . . . . . . . . 4,415 2,776 62.9 1,639 37.1 2,504 56.7 1,912 43.3 Black alone 2 . . . . . . . . . . . . . . . . . . . 1,488 943 63.4 544 36.6 884 59.4 604 40.6 Asian alone 2 . . . . . . . . . . . . . . . . . . . 4,405 2,548 57.8 1,857 42.2 2,163 49.1 2,242 50.9 Hispanic 3 . . . . . . . . . . . . . . . . . . . . . . 5,077 3,033 59.8 2,043 40.2 2,751 54.2 2,326 45.8 White alone or in combination 4 . . . . . 9,287 5,718 61.6 3,569 38.4 5,159 55.6 4,128 44.4 Black alone or in combination 4 . . . . . 1,557 995 63.9 562 36.1 936 60.1 621 39.9 Asian alone or in combination 4 . . . . . 4,448 2,584 58.1 1,864 41.9 2,194 49.3 2,254 50.7
1 Includes other races, not shown separately. 2 Beginning with the 2003 Current Population Survey (CPS), respondents could choose more than one race. Data shown represent persons who selected this race group only and exclude persons reporting more than one race. 3 Persons of Hispanic origin may be any race. 4 In combination with one or more races.
Source: U.S. Census Bureau, Voting and Registration in the Election of November 2008, Current Population Reports P20-562, 2010. See also <http://www.census.gov/hhes/www/socdemo/voting/index.html>.
Table 414. Hispanic Public Elected Officials by Office, 1985 to 2008, and State, 2008[As of January of year shown. For states not shown, no Hispanic public officials had been identified]
State
Total
State execu-
tives and legisla-
tors 1
County and
muni-cipal
officials
Judicial and law enforce-
ment
Educa-tion and
school boards
State
Total
State execu-
tives and legisla-
tors 1
County and
muni-cipal
officials
Judicial and law enforce-
ment
Educa-tion and
school boards
1985. . . . . 3,147 129 1,316 517 1,185 MD . . . . . . 11 4 6 – 11990. . . . . 4,004 144 1,819 583 1,458 MA . . . . . . 20 4 9 – 72000. . . . . 5,019 217 1,852 447 2,503 MI . . . . . . . 14 3 2 4 52001. . . . . 5,205 223 1,846 454 2,682 MN . . . . . . 5 3 1 1 –2002. . . . . 4,303 227 1,960 532 1,603 MO . . . . . . 2 1 1 – –2003. . . . . 4,432 231 1,958 549 1,694 MT . . . . . . 3 1 – 2 –2004. . . . . 4,651 253 2,059 638 1,723 NE . . . . . . 3 1 1 – 12005. . . . . 4,853 266 2,149 678 1,760 NV . . . . . . 12 6 2 3 12006. . . . . 4,932 244 2,151 693 1,835 NH . . . . . . 4 3 1 – –2007. . . . . 4,954 270 2,152 685 1,847 NJ . . . . . . 117 10 61 – 462008 . . . . . 5,240 283 2,266 738 1,952 NM . . . . . . 654 49 338 105 162AK . . . . . . 1 – 1 – – NY . . . . . . 61 19 27 13 2AZ . . . . . . 362 19 135 53 155 NC . . . . . . 4 2 2 – –CA . . . . . . 1,127 35 416 42 634 ND . . . . . . 1 – 1 – –CO . . . . . . 152 9 104 8 31 OH . . . . . . 6 – 5 1 –CT . . . . . . 28 6 18 – 4 OK . . . . . . 2 – – – 2DE . . . . . . 2 1 1 – – OR . . . . . . 12 2 5 5 –FL . . . . . . 150 21 87 35 7 PA . . . . . . 9 1 5 2 1GA . . . . . . 6 3 1 2 – RI . . . . . . . 7 3 4 – –HI . . . . . . . 2 1 1 – – SC . . . . . . 1 1 – – –ID . . . . . . . 2 2 – – – TN . . . . . . 3 1 2 – –IL . . . . . . . 111 13 60 8 30 TX . . . . . . 2,245 44 918 441 842IN . . . . . . . 17 1 11 3 2 UT . . . . . . 8 3 3 2 –IA . . . . . . . 1 – 1 – – VA . . . . . . 3 1 1 – 1KS . . . . . . 10 4 6 – – WA . . . . . . 35 3 19 – 13KY . . . . . . 2 – 1 – 1 WI . . . . . . 9 1 3 4 1LA . . . . . . 10 – 3 4 3 WY . . . . . . 5 2 3 – –
– Represents zero. 1 Includes U.S. Senators and Representatives, not shown separately.Source: National Association of Latino Elected and Appointed Officials (NALEO) Educational Fund, Washington, DC, National
Directory of Latino Elected Officials, annual.
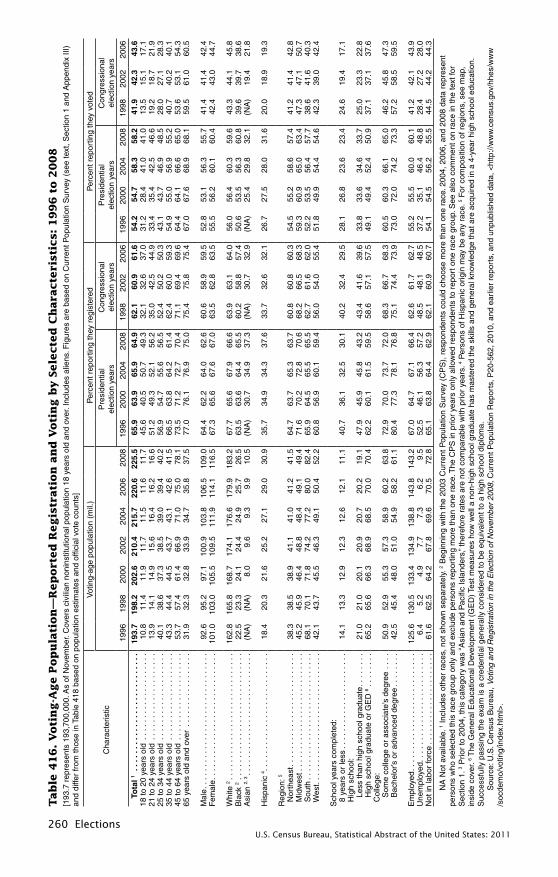
260 ElectionsU.S. Census Bureau, Statistical Abstract of the United States: 2011
Tab
le 4
16
. V
oti
ng-A
ge P
op
ula
tion
—R
ep
ort
ed
Regis
trati
on
an
d V
oti
ng b
y S
ele
cte
d C
hara
cte
risti
cs: 1
99
6 t
o 2
00
8[1
93.7
rep
rese
nts
193,
700,
000.
As
of N
ovem
ber.
Cov
ers
civi
lian
noni
nstit
utio
nal p
opul
atio
n 18
yea
rs o
ld a
nd o
ver.
Incl
udes
alie
ns. F
igur
es a
re b
ased
on
Cur
rent
Pop
ulat
ion
Sur
vey
(see
text
, Sec
tion
1 an
d A
ppen
dix
III)
and
diffe
r fr
om th
ose
in T
able
418
bas
ed o
n po
pula
tion
estim
ates
and
offi
cial
vot
e co
unts
]
Cha
ract
eris
tic
Vot
ing-
age
popu
latio
n (m
il.)
Per
cent
rep
ortin
g th
ey r
egis
tere
dP
erce
nt r
epor
ting
they
vot
ed
1996
1998
2000
2002
2004
2006
2008
Pre
side
ntia
l el
ectio
n ye
ars
Con
gres
sion
al
elec
tion
year
sP
resi
dent
ial
elec
tion
year
sC
ongr
essi
onal
el
ectio
n ye
ars
1996
2000
2004
2008
1998
2002
2006
1996
2000
2004
2008
1998
2002
2006
T
ota
l 1 .
. . . .
. . . .
. . . .
. . . .
. . . .
. . . .
. .19
3 .7
198 .
220
2 .6
210 .
421
5 .7
220 .
622
5 .5
65 .9
63 .9
65 .9
64 .9
62 .1
60 .9
61 .6
54 .2
54 .7
58 .3
58 .2
41 .9
42 .3
43 .6
18 to
20
year
s ol
d .
....
....
....
....
...
10.8
11.4
11.9
11.7
11.5
11.6
11.7
45.6
40.5
50.7
49.3
32.1
32.6
37.0
31.2
28.4
41.0
41.0
13.5
15.1
17.1
21 to
24
year
s ol
d .
....
....
....
....
...
13.9
14.1
14.9
15.6
16.4
16.2
16.6
51.2
49.3
52.1
56.2
35.0
42.5
44.9
33.4
35.4
42.5
46.6
19.2
18.7
21.9
25 to
34
year
s ol
d .
....
....
....
....
...
40.1
38.6
37.3
38.5
39.0
39.4
40.2
56.9
54.7
55.6
56.5
52.4
50.2
50.3
43.1
43.7
46.9
48.5
28.0
27.1
28.3
35 to
44
year
s ol
d .
....
....
....
....
...
43.3
44.4
44.5
43.7
43.1
42.6
41.5
66.5
63.8
64.2
61.4
62.4
60.0
59.3
54.9
55.0
56.9
55.2
40.7
40.2
40.1
45 to
64
year
s ol
d .
....
....
....
....
...
53.7
57.4
61.4
66.9
71.0
75.0
78.1
73.5
71.2
72.7
70.4
71.1
69.4
69.6
64.4
64.1
66.6
65.0
53.6
53.1
54.3
65 y
ears
old
and
ove
r ..
....
....
....
...
31.9
32.3
32.8
33.9
34.7
35.8
37.5
77.0
76.1
76.9
75.0
75.4
75.8
75.4
67.0
67.6
68.9
68.1
59.5
61.0
60.5
Mal
e ..
....
....
....
....
....
....
....
.92
.695
.297
.110
0.9
103.
810
6.5
109.
064
.462
.264
.062
.660
.658
.959
.552
.853
.156
.355
.741
.441
.442
.4F
emal
e ..
....
....
....
....
....
....
...
101.
010
3.0
105.
510
9.5
111.
911
4.1
116.
567
.365
.667
.667
.063
.562
.863
.555
.556
.260
.160
.442
.443
.044
.7
Whi
te 2 .
....
....
....
....
....
....
....
162.
816
5.8
168.
717
4.1
176.
617
9.9
183.
267
.765
.667
.966
.663
.963
.164
.056
.056
.460
.359
.643
.344
.145
.8B
lack
2 .
....
....
....
....
....
....
....
22.5
23.3
24.1
24.4
24.9
25.7
26.5
63.5
63.6
64.4
65.5
60.2
58.8
57.4
50.6
53.5
56.3
60.8
39.6
39.7
38.6
Asi
an 2,
3 .
....
....
....
....
....
....
...
(NA
)(N
A)
8.0
9.6
9.3
9.9
10.5
(NA
)30
.734
.937
.3(N
A)
30.7
32.9
(NA
)25
.429
.832
.1(N
A)
19.4
21.8
His
pani
c 4 .
....
....
....
....
....
....
..18
.420
.321
.625
.227
.129
.030
.935
.734
.934
.337
.633
.732
.632
.126
.727
.528
.031
.620
.018
.919
.3
Reg
ion:
5
Nor
thea
st .
....
....
....
....
....
....
.38
.338
.538
.941
.141
.041
.241
.564
.763
.765
.363
.760
.860
.860
.354
.555
.258
.657
.441
.241
.442
.8 M
idw
est .
....
....
....
....
....
....
..45
.245
.946
.448
.848
.449
.149
.471
.670
.272
.870
.668
.266
.568
.359
.360
.965
.063
.447
.347
.150
.7 S
outh
...
....
....
....
....
....
....
..68
.170
.171
.874
.277
.280
.082
.465
.964
.565
.565
.562
.761
.662
.052
.253
.556
.457
.738
.641
.640
.3 W
est .
....
....
....
....
....
....
....
.42
.143
.745
.546
.349
.150
.452
.260
.856
.960
.159
.456
.054
.055
.451
.849
.954
.454
.642
.339
.042
.4
Sch
ool y
ears
com
plet
ed:
8 y
ears
or
less
...
....
....
....
....
...
14.1
13.3
12.9
12.3
12.6
12.1
11.1
40.7
36.1
32.5
30.1
40.2
32.4
29.5
28.1
26.8
23.6
23.4
24.6
19.4
17.1
Hig
h sc
hool
:
Les
s th
an h
igh
scho
ol g
radu
ate
....
....
21.0
21.0
20.1
20.9
20.7
20.2
19.1
47.9
45.9
45.8
43.2
43.4
41.6
39.6
33.8
33.6
34.6
33.7
25.0
23.3
22.8
H
igh
scho
ol g
radu
ate
or G
ED
6 ..
....
..65
.265
.666
.368
.968
.570
.070
.462
.260
.161
.559
.558
.657
.157
.549
.149
.452
.450
.937
.137
.137
.6 C
olle
ge:
S
ome
colle
ge o
r as
soci
ate’
s de
gree
...
.50
.952
.955
.357
.358
.960
.263
.872
.970
.073
.772
.068
.366
.768
.360
.560
.366
.165
.046
.245
.847
.3
Bac
helo
r’s o
r ad
vanc
ed d
egre
e ..
....
..42
.545
.448
.051
.054
.958
.261
.180
.477
.378
.176
.875
.174
.473
.973
.072
.074
.273
.357
.258
.559
.5
Em
ploy
ed .
....
....
....
....
....
....
..12
5.6
130.
513
3.4
134.
913
8.8
143.
814
3.2
67.0
64.7
67.1
66.4
62.6
61.7
62.7
55.2
55.5
60.0
60.1
41.2
42.1
43.9
Une
mpl
oyed
. . .
. . .
. . .
. . .
. . .
. . .
. . .
. . .
.6.
45.
24.
97.
77.
36.
29.
552
.546
.156
.357
.248
.548
.148
.537
.235
.146
.448
.828
.427
.228
.0N
ot in
labo
r fo
rce
....
....
....
....
....
.61
.662
.564
.267
.869
.670
.572
.865
.163
.864
.462
.962
.160
.960
.754
.154
.556
.255
.544
.544
.244
.3
NA
Not
ava
ilabl
e. 1
Incl
udes
oth
er r
aces
, not
sho
wn
sepa
rate
ly. 2
Beg
inni
ng w
ith th
e 20
03 C
urre
nt P
opul
atio
n S
urve
y (C
PS
), r
espo
nden
ts c
ould
cho
ose
mor
e th
an o
ne r
ace.
200
4, 2
006,
and
200
8 da
ta r
epre
sent
pers
ons
who
sel
ecte
d th
is r
ace
grou
p on
ly a
nd e
xclu
de p
erso
ns r
epor
ting
mor
e th
an o
ne r
ace.
The
CP
S in
prio
r ye
ars
only
allo
wed
res
pond
ents
to r
epor
t one
rac
e gr
oup.
See
als
o co
mm
ent o
n ra
ce in
the
text
for
Sec
tion
1. 3
Prio
r to
200
4, th
is c
ateg
ory
was
“A
sian
and
Pac
ific
Isla
nder
s,” t
here
fore
rat
es a
re n
ot c
ompa
rabl
e w
ith p
rior
year
s. 4
Per
sons
of H
ispa
nic
orig
in m
ay b
e an
y ra
ce. 5
For
com
posi
tion
of r
egio
ns, s
ee m
ap,
insi
de c
over
. 6 The
Gen
eral
Edu
catio
nal D
evel
opm
ent (
GE
D) T
est m
easu
res
how
wel
l a n
on-h
igh
scho
ol g
radu
ate
has
mas
tere
d th
e sk
ills
and
gene
ral k
now
ledg
e th
at a
re a
cqui
red
in a
4-y
ear
high
sch
ool e
duca
tion.
S
ucce
ssfu
lly p
assi
ng th
e ex
am is
a c
rede
ntia
l gen
eral
ly c
onsi
dere
d to
be
equi
vale
nt to
a h
igh
scho
ol d
iplo
ma.
Sou
rce:
U.S
. Cen
sus
Bur
eau,
Vot
ing
and
Reg
istr
atio
n in
the
Ele
ctio
n of
Nov
embe
r 20
08, C
urre
nt P
opul
atio
n R
epor
ts, P
20-5
62, 2
010,
and
ear
lier
repo
rts,
and
unp
ublis
hed
data
, <ht
tp://
ww
w.c
ensu
s.go
v/hh
es/w
ww
/soc
dem
o/vo
ting/
inde
x.ht
ml>
.

Elections 261U.S. Census Bureau, Statistical Abstract of the United States: 2011
Table 418. Participation in Elections for President and U.S. Representatives: 1932 to 2008[75,768 represents 75,768,000. As of November, except as noted. Estimated resident population 21 years old and over, 1932–70, except as noted, and 18 years old and over thereafter; includes Armed Forces stationed in the U.S. Prior to 1958, excludes Alaska and prior to 1960, excludes Hawaii. District of Columbia is included in votes cast for President beginning 1964]
Year
Resident popula
tion (includes
aliens) of voting
age 1 (1,000)
Votes cast
Year
Resident popula-
tion (includes
aliens) of voting
age 1 (1,000)
Votes cast
For President
(1,000)
Percent of
voting- age
popu- lation
For U.S.
Repre-sentatives
(1,000)
Percent of
voting- age
popu- lation
For President
(1,000)
Percent of
voting-age
popu- lation
For U.S.
Repre-sentatives
(1,000)
Percent of
voting-age
popu- lation
1932. . . 75,768 39,817 52.6 (NA) (NA)1934. . . 77,997 (X) (X) 32,804 42.1 1972. . . 140,777 77,625 55.1 71,188 50.61936. . . 80,174 45,647 56.9 (NA) (NA) 1974. . . 146,338 (X) (X) 52,313 35.71938. . . 82,354 (X) (X) (NA) (NA) 1976. . . 152,308 81,603 53.6 74,259 48.81940. . . 84,728 49,815 58.8 (NA) (NA) 1978. . . 158,369 (X) (X) 54,584 34.51942. . . 86,465 (X) (X) 28,074 32.5 1980. . . 163,945 86,497 52.8 77,874 47.51944. . . 85,654 48,026 56.1 45,110 52.7 1982. . . 169,643 (X) (X) 63,881 37.71946. . . 92,659 (X) (X) 34,410 37.1 1984. . . 173,995 92,655 53.3 82,422 47.41948. . . 95,573 48,834 51.1 46,220 48.4 1986. . . 177,922 (X) (X) 59,758 33.61950. . . 98,134 (X) (X) 40,430 41.2 1988. . . 181,956 91,587 50.3 81,682 44.91952. . . 99,929 61,552 61.6 57,571 57.6 1990. . . 185,812 (X) (X) 62,355 33.61954. . . 102,075 (X) (X) 42,583 41.7 1992. . . 189,493 104,600 55.2 97,198 51.31956. . . 104,515 62,027 59.3 58,886 56.3 1994. . . 193,010 (X) (X) 70,494 36.51958. . . 106,447 (X) (X) 45,719 43.0 1996. . . 196,789 96,390 49.0 90,233 45.91960. . . 109,672 68,836 62.8 64,124 58.5 1998. . . 201,270 (X) (X) 66,605 33.11962. . . 112,952 (X) (X) 51,242 45.4 2000. . . 2 209,787 105,594 50.3 98,800 47.11964. . . 114,090 70,098 61.4 65,879 57.7 2002. . . 2 214,755 (X) (X) 74,707 34.81966. . . 116,638 (X) (X) 52,902 45.4 2004. . . 2 219,553 122,349 55.7 113,192 51.61968. . . 120,285 73,027 60.7 66,109 55.0 2006. . . 2 224,583 (X) (X) 80,976 36.11970. . . 124,498 (X) (X) 54,259 43.6 2008. . . 2 229,945 131,407 57.1 122,586 53.3
NA Not available. X Not applicable. 1 Population 18 and over in Georgia, 1944–70, and in Kentucky, 1956–70; 20 and over in Alaska and 20 and over in Hawaii, 1960–70. Source: Through 1990, U.S. Census Bureau, “Table 4. Participation in Elections for President and U.S. Representatives: 1930 to 1992,” May 1994, <http://www.census.gov/population/socdemo/voting/p25-1117 /tab03-04.pdf>. For 1992–1998, “Estimates and Projections of the Voting-Age Population, 1992 to 2000, and Percent Casting Votes for President, by State: November 1992 and 1996,” July 2000, <http://www.census.gov/population/socdemo/voting/proj00/tab03 .txt>. Starting 2000, “Annual Estimates of the Resident Population by Sex and Selected Age Groups for the United States: April 1, 2000 to July 1, 2009,” (NC-EST2009-02), June 2010, <http://www.census.gov/popest/national/asrh/NC-EST2009/NC-EST2009-02 .xls/>. 2 As of July 1.
Source: Except as noted, U.S. House of Representatives, Office of the Clerk, Statistics of the Presidential and Congressional Election, 2009, biennial. See also <http://clerk.house.gov/member_info/election.html>.
Table 417. Persons Reported Registered and Voted by State: 2008[225,499 represents 225,499,000. As of November. See headnote, Table 416]
StateVoting-age population
(1,000)
Percent of voting-age population State
Voting-age population
(1,000)
Percent of voting-age population
Registered Voted Registered Voted
U .S . . . . . . 225,499 64 .9 58 .2 MO . . . . . . . . 4,430 72.8 64.2AL . . . . . . . . 3,497 69.7 60.8 MT . . . . . . . . 731 70.6 64.7AK . . . . . . . . 488 70.8 62.4 NE . . . . . . . . 1,308 71.8 64.5AZ . . . . . . . . 4,688 61.3 53.3 NV . . . . . . . . 1,946 59.0 52.8AR . . . . . . . . 2,108 62.5 51.8 NH . . . . . . . . 1,015 74.5 69.8CA . . . . . . . . 26,993 55.1 51.2 NJ . . . . . . . . 6,489 62.0 56.0CO . . . . . . . . 3,694 66.0 62.5 NM . . . . . . . . 1,473 63.6 57.4CT . . . . . . . . 2,651 66.4 60.8 NY . . . . . . . . 14,665 57.7 51.5DE . . . . . . . . 648 69.1 63.0 NC . . . . . . . . 6,845 71.6 63.8DC . . . . . . . . 469 69.0 65.3 ND . . . . . . . . 484 82.3 66.3FL . . . . . . . . 14,069 62.4 56.5 OH . . . . . . . . 8,499 71.9 64.5GA . . . . . . . . 7,018 65.9 59.6 OK . . . . . . . . 2,667 67.4 56.5HI . . . . . . . . . 977 53.5 46.8 OR . . . . . . . . 2,904 67.5 62.6ID . . . . . . . . . 1,095 66.0 58.8 PA . . . . . . . . 9,449 68.3 60.8IL . . . . . . . . . 9,521 64.6 57.1 RI . . . . . . . . . 804 70.6 63.0IN . . . . . . . . . 4,686 66.3 58.8 SC . . . . . . . . 3,313 72.0 63.4IA . . . . . . . . . 2,244 72.6 66.9 SD . . . . . . . . 590 74.9 66.1KS . . . . . . . . 2,037 65.9 59.8 TN . . . . . . . . 4,692 62.3 53.6KY . . . . . . . . 3,179 71.1 61.4 TX . . . . . . . . 17,295 58.5 48.8LA . . . . . . . . 3,161 75.7 68.0 UT . . . . . . . . 1,859 56.8 50.5ME . . . . . . . . 1,020 78.5 70.2 VT . . . . . . . . 487 70.9 63.2MD . . . . . . . . 4,218 67.0 61.9 VA . . . . . . . . 5,720 69.1 63.8MA . . . . . . . . 4,962 66.4 61.3 WA . . . . . . . . 4,912 67.2 62.6MI . . . . . . . . . 7,487 73.9 65.0 WV . . . . . . . . 1,395 65.7 53.1MN . . . . . . . . 3,898 75.2 70.8 WI . . . . . . . . 4,212 73.5 68.5MS . . . . . . . . 2,109 75.3 68.2 WY . . . . . . . . 397 67.9 62.9
Source: U.S. Census Bureau, Voting and Registration in the Election of November 2008, Current Population Reports, P20-562, 2010, and earlier reports, and unpublished data, <http://www.census.gov/hhes/www/socdemo/voting/index.html>.

262 ElectionsU.S. Census Bureau, Statistical Abstract of the United States: 2011
Table 419. Resident Population of Voting Age and Percent Casting Votes—States: 2000 to 2008[209,787 represents 209,787,000. Estimated population, 18 years old and over. Includes Armed Forces stationed in each state, aliens, and institutional population]
State
Voting-age population (1,000) 1 Percent casting votes for—
2000 2004 2006 2008
Presidential electors U.S. Representatives
2000 2004 2008 2000 2006 2008
U .S . . . . . . . . 209,787 219,553 224,583 229,945 50 .3 55 .7 57 .1 47 .1 36 .1 53 .3AL . . . . . . . . . . 3,330 3,403 3,476 3,548 50.0 55.3 59.2 43.2 32.8 52.3AK . . . . . . . . . . 437 475 493 508 65.3 65.8 64.3 62.8 47.6 62.5AZ . . . . . . . . . . 3,791 4,232 4,550 4,782 40.4 47.6 48.0 38.7 32.8 45.1AR . . . . . . . . . . 1,998 2,063 2,117 2,161 46.1 51.1 50.3 31.7 36.0 36.4CA . . . . . . . . . . 24,723 26,078 26,534 27,156 44.4 47.6 49.9 42.2 31.3 45.4
CO . . . . . . . . . . 3,221 3,448 3,576 3,725 54.1 61.8 64.5 50.4 43.0 61.3CT . . . . . . . . . . 2,570 2,632 2,656 2,689 56.8 60.0 61.3 51.1 40.5 56.8DE . . . . . . . . . . 591 627 649 669 55.4 59.9 61.6 52.9 38.8 57.6DC . . . . . . . . . . 457 464 469 477 44.2 49.1 55.7 (X) (X) (X)FL . . . . . . . . . . 12,390 13,455 14,023 14,353 48.1 56.6 58.5 40.4 27.5 51.7
GA . . . . . . . . . . 6,052 6,550 6,852 7,132 42.7 50.4 55.0 39.9 30.2 51.2HI . . . . . . . . . . . 917 959 985 998 40.1 44.7 45.7 37.1 34.3 45.7ID . . . . . . . . . . . 929 1,010 1,064 1,112 54.0 59.3 58.9 53.0 41.8 57.4IL . . . . . . . . . . . 9,192 9,417 9,514 9,660 51.6 56.0 57.2 47.8 36.3 54.3IN . . . . . . . . . . . 4,517 4,639 4,715 4,796 48.7 53.2 57.4 47.8 35.4 55.8
IA . . . . . . . . . . . 2,195 2,229 2,253 2,281 61.6 67.6 67.4 58.1 45.9 64.9KS . . . . . . . . . . 1,979 2,031 2,060 2,097 54.2 58.5 58.9 52.3 41.0 57.6KY . . . . . . . . . . 3,054 3,153 3,213 3,272 50.6 57.0 55.8 47.0 39.0 53.5LA . . . . . . . . . . 3,252 3,319 3,175 3,331 54.3 58.6 58.9 37.0 28.9 31.4ME . . . . . . . . . . 976 1,017 1,031 1,044 66.8 72.8 70.0 65.4 52.0 68.0
MD . . . . . . . . . . 3,954 4,158 4,236 4,302 51.2 57.3 61.2 48.7 40.2 58.1MA . . . . . . . . . . 4,861 4,966 5,009 5,105 56.2 58.9 60.8 56.2 44.8 60.8MI . . . . . . . . . . . 7,359 7,548 7,598 7,610 57.5 64.1 65.7 55.3 48.0 63.2MN . . . . . . . . . . 3,645 3,808 3,883 3,968 66.9 74.3 73.3 64.9 56.1 70.6MS . . . . . . . . . . 2,074 2,122 2,137 2,173 47.9 53.7 59.4 47.6 28.1 58.2
MO . . . . . . . . . . 4,178 4,335 4,429 4,521 56.5 63.0 64.7 55.7 47.4 62.4MT . . . . . . . . . . 673 706 727 748 61.0 63.8 65.6 61.0 55.9 64.3NE . . . . . . . . . . 1,263 1,296 1,315 1,334 55.2 60.0 60.1 54.1 45.3 58.1NV . . . . . . . . . . 1,502 1,729 1,848 1,939 40.6 48.0 49.9 39.1 31.1 46.8NH . . . . . . . . . . 930 985 1,009 1,028 61.2 68.9 69.2 59.8 39.9 65.6
NJ . . . . . . . . . . 6,342 6,495 6,536 6,610 50.3 55.6 58.5 47.1 32.7 52.0NM . . . . . . . . . . 1,313 1,394 1,442 1,481 45.6 54.3 56.1 44.8 38.9 55.0NY . . . . . . . . . . 14,311 14,677 14,819 15,015 48.6 50.7 51.4 48.6 31.6 51.4NC . . . . . . . . . . 6,112 6,446 6,703 6,993 47.7 54.3 61.5 45.5 29.0 60.3ND . . . . . . . . . . 481 489 493 498 59.9 63.9 63.5 59.4 44.1 63.0
OH . . . . . . . . . . 8,478 8,642 8,710 8,789 55.5 65.1 64.9 54.1 45.5 61.1OK . . . . . . . . . . 2,562 2,633 2,682 2,737 48.2 55.6 53.4 42.4 33.8 48.9OR . . . . . . . . . . 2,583 2,725 2,817 2,912 59.4 67.4 62.8 55.7 48.2 57.8PA . . . . . . . . . . 9,367 9,530 9,641 9,771 52.4 60.5 61.5 48.6 41.6 59.2RI . . . . . . . . . . . 803 825 823 824 51.0 53.0 57.3 47.9 45.3 53.2
SC . . . . . . . . . . 3,013 3,172 3,289 3,428 45.9 51.0 56.0 43.9 33.0 54.7SD . . . . . . . . . . 553 578 591 606 57.2 67.2 63.0 56.9 56.4 62.5TN . . . . . . . . . . 4,304 4,486 4,622 4,749 48.2 54.3 54.7 43.1 37.1 48.5TX . . . . . . . . . . 15,038 16,159 16,851 17,538 42.6 45.9 46.1 39.8 24.6 42.9UT . . . . . . . . . . 1,523 1,679 1,781 1,877 50.6 55.2 50.7 49.8 32.0 49.9
VT . . . . . . . . . . 462 479 486 492 63.6 65.2 66.0 61.3 54.0 60.5VA . . . . . . . . . . 5,363 5,662 5,818 5,957 51.1 56.4 62.5 45.2 39.5 58.7WA . . . . . . . . . . 4,395 4,662 4,835 5,008 56.6 61.3 60.6 54.2 42.5 58.2WV . . . . . . . . . . 1,406 1,414 1,419 1,427 46.1 53.5 50.0 41.2 32.0 45.2WI . . . . . . . . . . 4,005 4,170 4,243 4,311 64.9 71.9 69.2 62.6 48.6 64.4WY . . . . . . . . . . 365 380 389 404 58.5 64.1 63.1 58.1 50.4 61.8
X Not applicable. 1 As of July 1. Source: U.S. Census Bureau, “Annual Estimates of the Resident Population by Sex and Age for States: April 1, 2000 to July 1, 2009,” (SC-EST2009-02), June 2010, <http://www.census.gov/popest/states/asrh /SC-EST2009-02.html>.
Source: Except as noted, U.S. House of Representatives, Office of the Clerk, Statistics of the Presidential and Congressional Election, 2009, biennial. See also <http://clerk.house.gov/member_info/electionInfo/index.html>.
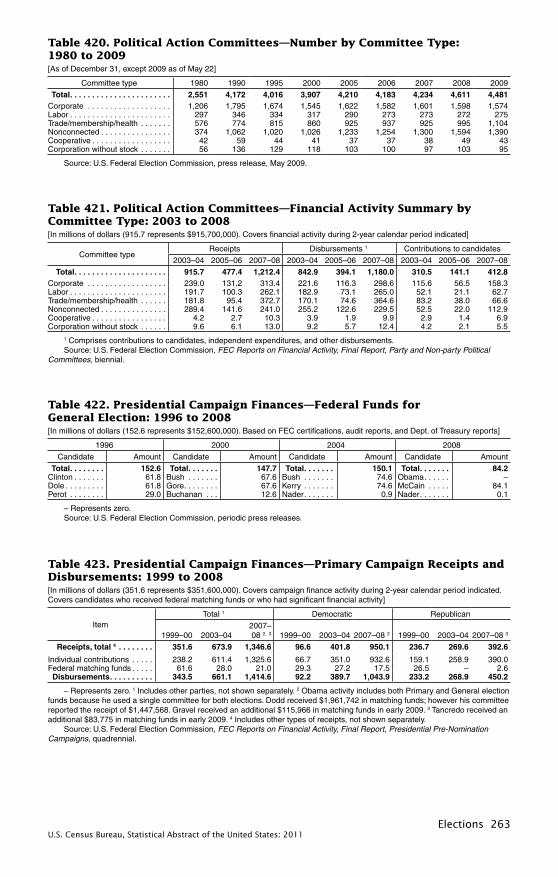
Elections 263U.S. Census Bureau, Statistical Abstract of the United States: 2011
Table 421. Political Action Committees—Financial Activity Summary by Committee Type: 2003 to 2008[In millions of dollars (915.7 represents $915,700,000). Covers financial activity during 2-year calendar period indicated]
Committee typeReceipts Disbursements 1 Contributions to candidates
2003–04 2005–06 2007–08 2003–04 2005–06 2007–08 2003–04 2005–06 2007–08
Total . . . . . . . . . . . . . . . . . . . . . 915 .7 477 .4 1,212 .4 842 .9 394 .1 1,180 .0 310 .5 141 .1 412 .8Corporate . . . . . . . . . . . . . . . . . . 239.0 131.2 313.4 221.6 116.3 298.6 115.6 56.5 158.3Labor . . . . . . . . . . . . . . . . . . . . . . 191.7 100.3 262.1 182.9 73.1 265.0 52.1 21.1 62.7Trade/membership/health . . . . . . 181.8 95.4 372.7 170.1 74.6 364.6 83.2 38.0 66.6Nonconnected . . . . . . . . . . . . . . . 289.4 141.6 241.0 255.2 122.6 229.5 52.5 22.0 112.9Cooperative . . . . . . . . . . . . . . . . . 4.2 2.7 10.3 3.9 1.9 9.9 2.9 1.4 6.9Corporation without stock . . . . . . 9.6 6.1 13.0 9.2 5.7 12.4 4.2 2.1 5.5
1 Comprises contributions to candidates, independent expenditures, and other disbursements.Source: U.S. Federal Election Commission, FEC Reports on Financial Activity, Final Report, Party and Non-party Political
Committees, biennial.
Table 422. Presidential Campaign Finances—Federal Funds for General Election: 1996 to 2008[In millions of dollars (152.6 represents $152,600,000). Based on FEC certifications, audit reports, and Dept. of Treasury reports]
1996 2000 2004 2008
Candidate Amount Candidate Amount Candidate Amount Candidate Amount
Total . . . . . . . . 152 .6 Total . . . . . . . 147 .7 Total . . . . . . . 150 .1 Total . . . . . . . 84 .2Clinton . . . . . . . 61.8 Bush . . . . . . . 67.6 Bush . . . . . . . 74.6 Obama . . . . . . –Dole . . . . . . . . . 61.8 Gore . . . . . . . . 67.6 Kerry . . . . . . . 74.6 McCain . . . . . 84.1Perot . . . . . . . . 29.0 Buchanan . . . 12.6 Nader . . . . . . . 0.9 Nader . . . . . . . 0.1
– Represents zero.Source: U.S. Federal Election Commission, periodic press releases.
Table 423. Presidential Campaign Finances—Primary Campaign Receipts and Disbursements: 1999 to 2008[In millions of dollars (351.6 represents $351,600,000). Covers campaign finance activity during 2-year calendar period indicated. Covers candidates who received federal matching funds or who had significant financial activity]
ItemTotal 1 Democratic Republican
1999–00 2003–042007– 08 2, 3 1999–00 2003–04 2007–08 2 1999–00 2003–04 2007–08 3
Receipts, total 4 . . . . . . . . 351 .6 673 .9 1,346 .6 96 .6 401 .8 950 .1 236 .7 269 .6 392 .6
Individual contributions . . . . . 238.2 611.4 1,325.6 66.7 351.0 932.6 159.1 258.9 390.0Federal matching funds . . . . . 61.6 28.0 21.0 29.3 27.2 17.5 26.5 – 2.6 Disbursements . . . . . . . . . . 343 .5 661 .1 1,414 .6 92 .2 389 .7 1,043 .9 233 .2 268 .9 450 .2
– Represents zero. 1 Includes other parties, not shown separately. 2 Obama activity includes both Primary and General election funds because he used a single committee for both elections. Dodd received $1,961,742 in matching funds; however his committee reported the receipt of $1,447,568. Gravel received an additional $115,966 in matching funds in early 2009. 3 Tancredo received an additional $83,775 in matching funds in early 2009. 4 Includes other types of receipts, not shown separately.
Source: U.S. Federal Election Commission, FEC Reports on Financial Activity, Final Report, Presidential Pre-Nomination Campaigns, quadrennial.
Table 420. Political Action Committees—Number by Committee Type: 1980 to 2009[As of December 31, except 2009 as of May 22]
Committee type 1980 1990 1995 2000 2005 2006 2007 2008 2009
Total . . . . . . . . . . . . . . . . . . . . . . . 2,551 4,172 4,016 3,907 4,210 4,183 4,234 4,611 4,481Corporate . . . . . . . . . . . . . . . . . . . 1,206 1,795 1,674 1,545 1,622 1,582 1,601 1,598 1,574Labor . . . . . . . . . . . . . . . . . . . . . . . 297 346 334 317 290 273 273 272 275Trade/membership/health . . . . . . . 576 774 815 860 925 937 925 995 1,104Nonconnected . . . . . . . . . . . . . . . . 374 1,062 1,020 1,026 1,233 1,254 1,300 1,594 1,390Cooperative . . . . . . . . . . . . . . . . . . 42 59 44 41 37 37 38 49 43Corporation without stock . . . . . . . 56 136 129 118 103 100 97 103 95
Source: U.S. Federal Election Commission, press release, May 2009.

264 ElectionsU.S. Census Bureau, Statistical Abstract of the United States: 2011
Table 424. Congressional Campaign Finances—Receipts and Disbursements: 2003 to 2008[708.5 represents $708,500,000. Covers all campaign finance activity during 2-year calendar period indicated for primary, general, run-off, and special elections. Data have been adjusted to eliminate transfers between all committees within a campaign. For further information on legal limits of contributions, see Federal Election Campaign Act of 1971, as amended]
Item
House of Representatives Senate
Amount (mil. dol.) Percent distribution Amount (mil. dol.) Percent distribution
2003–04
2005–06
2007–08
2003–04
2005–06
2007–08
2003–04
2005–06
2007–08
2003–04
2005–06
2007–08
Total receipts 1 . . . . . . . . . 708 .5 875 .4 1,005 .2 100 100 100 497 .6 564 .6 434 .1 100 100 100
Individual contributions . . . . . 396.7 478.9 538.8 56 55 54 324.1 383.2 267.0 65 68 62Other committees . . . . . . . . . 225.4 279.8 300.4 32 32 30 63.7 68.9 78.2 13 12 18Candidate loans . . . . . . . . . . . 47.4 56.1 77.6 7 6 8 39.8 47.0 24.2 8 8 6Candidate contributions . . . . . 7.8 14.7 32.4 1 2 3 38.2 37.5 5.7 8 7 1Democrats . . . . . . . . . . . . . . . 307.4 417.5 561.0 43 48 56 250.6 291.8 237.3 50 52 55Republicans . . . . . . . . . . . . . . 399.2 453.6 440.8 56 52 44 246.1 245.8 196.1 49 44 45Others . . . . . . . . . . . . . . . . . . 1.9 4.2 3.4 (Z) (Z) (Z) 0.9 26.9 0.7 (Z) 5 (Z)Incumbents . . . . . . . . . . . . . . 452.6 532.6 581.7 64 61 58 171.7 278.4 234.1 35 49 54Challengers . . . . . . . . . . . . . . 118.2 188.7 252.2 17 22 25 79.5 186.6 135.0 16 33 31Open seats 2 . . . . . . . . . . . . . 137.8 154.1 171.3 19 18 17 246.4 99.6 65.1 50 18 15
Total disbursements . . . . 660 .3 854 .8 929 .9 100 100 100 496 .4 562 .9 449 .4 100 100 100
Democrats . . . . . . . . . . . . . . . 288.5 395.5 491.0 44 46 53 254.6 288.6 229.6 51 51 51Republicans . . . . . . . . . . . . . . 370.0 455.2 435.6 56 53 47 241.0 249.3 202.0 49 44 45Others . . . . . . . . . . . . . . . . . . 1.8 4.1 3.3 (Z) (Z) (Z) 0.8 25.0 17.9 (Z) 4 4Incumbents . . . . . . . . . . . . . . 410.1 519.2 527.6 62 61 57 171.7 274.3 251.2 35 49 56Challengers . . . . . . . . . . . . . . 116.6 185.6 246.7 18 22 27 76.6 187.1 132.9 15 33 30Open seats 2 . . . . . . . . . . . . . 133.6 150.0 155.6 20 18 17 248.1 101.5 65.4 50 18 15
Z Less than $50,000 or 0.5 percent. 1 Includes other types of receipts, not shown separately. 2 Elections in which an incumbent did not seek reelection.
Source: U.S. Federal Election Commission, FEC Reports on Financial Activity, Final Report, U.S. Senate and House Campaigns, biennial.
Table 425. Contributions to Congressional Campaigns by Political Action Committees (PAC) by Type of Committee: 1997 to 2008[In millions of dollars (158.7 represents $158,700,000). Covers amounts given to candidates in primary, general, run-off, and special elections during the 2-year calendar period indicated. For number of political action committees, see Table 420]
Type of committee Total 1 Democrats Republicans Incumbents Challengers Open seats 2
HOUSE OF REPRESENTATIVES 1997–98. . . . . . . . . . . . . . . . . . . . . . . . 158.7 77.6 80.9 124.0 14.9 19.8 1999–00. . . . . . . . . . . . . . . . . . . . . . . . 193.4 98.2 94.7 150.5 19.9 23.0 2001–02. . . . . . . . . . . . . . . . . . . . . . . . 206.9 102.6 104.2 161.0 13.8 32.1 2003–04. . . . . . . . . . . . . . . . . . . . . . . . 225.4 98.6 126.6 187.3 15.6 22.5 2005–06. . . . . . . . . . . . . . . . . . . . . . . . 279.8 125.0 154.8 232.0 24.4 23.5
2007–08, total 3 . . . . . . . . . . . . . . . . . . 300 .4 184 .3 116 .1 245 .7 35 .8 18 .9Corporate . . . . . . . . . . . . . . . . . . . . . . . 108.0 56.7 51.3 99.4 5.0 3.6Trade association 4 . . . . . . . . . . . . . . . . 85.6 47.6 38.0 73.6 7.2 4.8Labor . . . . . . . . . . . . . . . . . . . . . . . . . . . 53.4 49.7 3.7 37.5 11.3 4.6Nonconnected 5 . . . . . . . . . . . . . . . . . . . 43.9 25.1 18.8 27.0 11.6 5.4
SENATE 1997–98. . . . . . . . . . . . . . . . . . . . . . . . 48.1 20.7 27.3 34.3 6.6 7.2 1999–00. . . . . . . . . . . . . . . . . . . . . . . . 51.9 18.7 33.2 33.5 7.1 11.3 2001–02. . . . . . . . . . . . . . . . . . . . . . . . 59.2 25.4 33.8 37.0 14.2 8.1 2003–04. . . . . . . . . . . . . . . . . . . . . . . . 63.7 28.4 35.3 39.3 5.6 18.8 2005–06. . . . . . . . . . . . . . . . . . . . . . . . 68.9 28.6 37.5 50.0 9.9 8.7
2007–08, total 3 . . . . . . . . . . . . . . . . . . 78 .2 33 .5 44 .3 56 .6 12 .8 9 .0Corporate . . . . . . . . . . . . . . . . . . . . . . . 32.4 11.2 21.2 26.8 2.5 3.1Trade association 4 . . . . . . . . . . . . . . . . 19.4 7.2 12.2 14.9 2.5 2.0Labor . . . . . . . . . . . . . . . . . . . . . . . . . . . 7.0 6.5 0.5 2.8 2.9 1.2Nonconnected 5 . . . . . . . . . . . . . . . . . . . 17.5 7.8 9.7 10.7 4.4 2.5
1 Includes other parties, not shown separately. 2 Elections in which an incumbent did not seek reelection. 3 Includes other types of political action committees, not shown separately. 4 Includes membership organizations and health organizations.5 Represents “ideological” groups as well as other issue groups not necessarily ideological in nature.
Source: U.S. Federal Election Commission, FEC Reports on Financial Activity, Party and Non-Party Political Committees, Final Report, biennial.