section 7. elections - census.gov · section 7 elections this section relates primarily to...
TRANSCRIPT
Section 7
Elections
This section relates primarily to presiden-tial, congressional, and gubernatorialelections. Also presented are summarytables on congressional legislation; statelegislatures; Black, Hispanic, and femaleofficeholders; population of voting age;voter participation; and campaignfinances.
Official statistics on federal elections, col-lected by the Clerk of the House, are pub-lished biennially in Statistics of the Presi-dential and Congressional Election andStatistics of the Congressional Election.Federal and state elections data appearalso in America Votes, a biennial volumepublished by Congressional Quarterly,Inc., Washington, DC. Federal electionsdata also appear in the U.S. Congress,Congressional Directory, and in officialstate documents. Data on reported regis-tration and voting for social and eco-nomic groups are obtained by the U.S.Census Bureau as part of the CurrentPopulation Survey (CPS) and are publishedin Current Population Reports, Series P20(see text, Section 1).
Almost all federal, state, and local govern-mental units in the United States conductelections for political offices and otherpurposes. The conduct of elections isregulated by state laws or, in some citiesand counties, by local charter. An excep-tion is that the U.S. Constitution pre-scribes the basis of representation in Con-gress and the manner of electing thePresident and grants to Congress theright to regulate the times, places, andmanner of electing federal officers.Amendments to the Constitution haveprescribed national criteria for voting eli-gibility. The 15th Amendment, adopted in1870, gave all citizens the right to voteregardless of race, color, or previous con-dition of servitude. The 19th Amendment,adopted in 1919, further extended theright to vote to all citizens regardless ofsex. The payment of poll taxes as a pre-requisite to voting in federal electionswas banned by the 24th Amendment in
1964. In 1971, as a result of the 26thAmendment, eligibility to vote in nationalelections was extended to all citizens,18 years old and over.
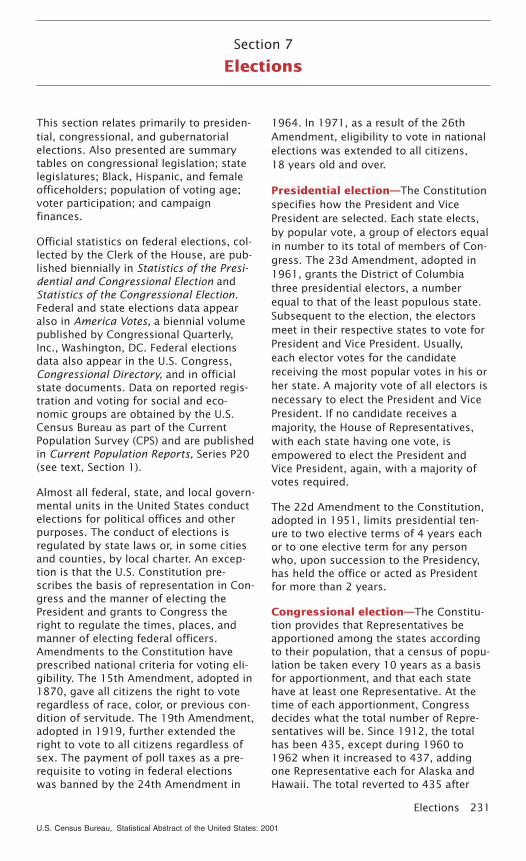
Presidential election—The Constitutionspecifies how the President and VicePresident are selected. Each state elects,by popular vote, a group of electors equalin number to its total of members of Con-gress. The 23d Amendment, adopted in1961, grants the District of Columbiathree presidential electors, a numberequal to that of the least populous state.Subsequent to the election, the electorsmeet in their respective states to vote forPresident and Vice President. Usually,each elector votes for the candidatereceiving the most popular votes in his orher state. A majority vote of all electors isnecessary to elect the President and VicePresident. If no candidate receives amajority, the House of Representatives,with each state having one vote, isempowered to elect the President andVice President, again, with a majority ofvotes required.
The 22d Amendment to the Constitution,adopted in 1951, limits presidential ten-ure to two elective terms of 4 years eachor to one elective term for any personwho, upon succession to the Presidency,has held the office or acted as Presidentfor more than 2 years.
Congressional election—The Constitu-tion provides that Representatives beapportioned among the states accordingto their population, that a census of popu-lation be taken every 10 years as a basisfor apportionment, and that each statehave at least one Representative. At thetime of each apportionment, Congressdecides what the total number of Repre-sentatives will be. Since 1912, the totalhas been 435, except during 1960 to1962 when it increased to 437, addingone Representative each for Alaska andHawaii. The total reverted to 435 after
Elections 231
U.S. Census Bureau, Statistical Abstract of the United States: 2001

reapportionment following the 1960 cen-sus. Members are elected for 2-yearterms, all terms covering the sameperiod. The District of Columbia, Ameri-can Samoa, Guam, and the Virgin Islandseach elect one nonvoting Delegate, andPuerto Rico elects a nonvoting ResidentCommissioner.
The Senate is composed of 100 members,2 from each state, who are elected toserve for a term of 6 years. One-third ofthe Senate is elected every 2 years. Sena-tors were originally chosen by the statelegislatures. The 17th Amendment to theConstitution, adopted in 1913, prescribedthat Senators be elected by popular vote.
Voter eligibility and participation—The Census Bureau publishes estimatesof the population of voting age and the
percent casting votes in each state forPresidential and congressional electionyears. These voting-age estimates includea number of persons who meet the agerequirement but are not eligible to vote,(e.g. aliens and some institutionalizedpersons). In addition, since 1964, voterparticipation and voter characteristicsdata have been collected during Novem-ber of election years as part of the CPS.These survey data include noncitizens inthe voting age population estimates butexclude members of the Armed Forcesand the institutional population.
Statistical reliability—For a discussionof statistical collection and estimation,sampling procedures, and measures ofstatistical reliability applicable to CensusBureau data, see Appendix III.
Figure 7.1Vote Cast for President by Major Political Party
1972
DemocraticRepublicanOther major candidates
0
10
20
30
40
50
60
1 1972—American, John Schmitz; 1980—Independent, John Anderson; 1992—Independent; Ross Perot,1996 Reform, Ross Perot. 2000—Green, Ralph Nader. Source: Chart prepared by U.S. Census Bureau. For data, see Tables 378 and 379.
1976 1980 1984 1988 1992 1996 2000
Millions of dollars
232 Elections
U.S. Census Bureau, Statistical Abstract of the United States: 2001

No. 378. Vote Cast for President by Major Political Party: 1940 to 2000
[Prior to 1960, excludes Alaska and Hawaii; prior to 1964, excludes DC. Vote cast for major party candidates include the votes ofminor parties cast for those candidates]
Year
Candidates for President Vote cast for President
Democratic RepublicanTotal
popularvote 1
(1,000)
Democratic Republican
Popular vote
Electoralvote
Popular vote
Electoralvote
Number(1,000) Percent
Number(1,000) Percent
1940 . . . . F. D. Roosevelt . . Willkie . . . . . . . . 49,900 27,313 54.7 449 22,348 44.8 821944 . . . . F. D. Roosevelt . . Dewey . . . . . . . . 47,977 25,613 53.4 432 22,018 45.9 991948 . . . . Truman . . . . . . . Dewey . . . . . . . . 48,794 24,179 49.6 303 21,991 45.1 1891952 . . . . Stevenson . . . . . Eisenhower. . . . . 61,551 27,315 44.4 89 33,936 55.1 4421956 . . . . Stevenson . . . . . Eisenhower. . . . . 62,027 26,023 42.0 73 35,590 57.4 4571960 . . . . Kennedy . . . . . . Nixon. . . . . . . . . 68,838 34,227 49.7 303 34,108 49.5 2191964 . . . . Johnson. . . . . . . Goldwater. . . . . . 70,645 43,130 61.1 486 27,178 38.5 521968 . . . . Humphrey . . . . . Nixon. . . . . . . . . 73,212 31,275 42.7 191 31,785 43.4 3011972 . . . . McGovern . . . . . Nixon. . . . . . . . . 77,719 29,170 37.5 17 47,170 60.7 5201976 . . . . Carter . . . . . . . . Ford . . . . . . . . . 81,556 40,831 50.1 297 39,148 48.0 2401980 . . . . Carter . . . . . . . . Reagan . . . . . . . 86,515 35,484 41.0 49 43,904 50.7 4891984 . . . . Mondale. . . . . . . Reagan . . . . . . . 92,653 37,577 40.6 13 54,455 58.8 5251988 . . . . Dukakis . . . . . . . Bush . . . . . . . . . 91,595 41,809 45.6 111 48,886 53.4 4261992 . . . . Clinton. . . . . . . . Bush . . . . . . . . . 104,425 44,909 43.0 370 39,104 37.4 1681996 . . . . Clinton. . . . . . . . Dole . . . . . . . . . 96,278 47,402 49.2 379 39,199 40.7 1592000 . . . . Gore . . . . . . . . . Bush . . . . . . . . . 105,397 50,992 48.4 266 50,455 47.9 271
1 Include votes for minor party candidates, independents, unpledged electors, and scattered write-in votes.
Source: Congressional Quarterly, Inc., Washington, DC, America at the Polls 2, 1965, and America Votes, biennial,(copyright).
No. 379. Vote Cast for Leading Minority Party Candidates for President:1940 to 2000
[See headnote, Table 378]
Year Candidate PartyPopular
vote(1,000)
Candidate PartyPopular
vote(1,000)
1940 . . Norman Thomas . . . Socialist . . . . . . . . . . 116 Roger Babson . . . . . Prohibition . . . . . . . . . 591944 . . Norman Thomas . . . Socialist . . . . . . . . . . 79 Claude Watson . . . . Prohibition . . . . . . . . . 751948 . . Strom Thurmond . . . States’ Rights. . . . . . . 1,176 Henry Wallace . . . . . Progressive . . . . . . . . 1,1571952 . . Vincent Hallinan . . . . Progressive . . . . . . . . 140 Stuart Hamblen . . . . Prohibition . . . . . . . . . 731956 . . T. Coleman Andrews . States’ Rights. . . . . . . 111 Eric Hass . . . . . . . . Socialist Labor . . . . . . 441960 . . Eric Hass . . . . . . . . Socialist Labor . . . . . . 48 Rutherford Decker . . Prohibition . . . . . . . . . 461964 . . Eric Hass . . . . . . . . Socialist Labor . . . . . . 45 Clifton DeBerry . . . . Socialist Workers . . . . 331968 . . George Wallace . . . . American Independent . 9,906 Henning Blomen . . . Socialist Labor . . . . . . 531972 . . John Schmitz. . . . . . American. . . . . . . . . . 1,099 Benjamin Spock. . . . People’s . . . . . . . . . . 791976 . . Eugene McCarthy . . Independent . . . . . . . 757 Roger McBride. . . . . Libertarian . . . . . . . . . 1731980 . . John Anderson . . . . Independent . . . . . . . 5,720 Ed Clark . . . . . . . . . Libertarian . . . . . . . . . 9211984 . . David Bergland . . . . Libertarian . . . . . . . . . 228 Lyndon H. LaRouche Independent . . . . . . . 791988 . . Ron Paul . . . . . . . . Libertarian . . . . . . . . . 432 Lenora B. Fulani . . . New Alliance . . . . . . . 2171992 . . H. Ross Perot . . . . . Independent . . . . . . . 19,742 Andre Marrou . . . . . Libertarian . . . . . . . . . 2921996 . . H. Ross Perot . . . . . Reform Party . . . . . . . 8,085 Ralph Nader . . . . . . Green. . . . . . . . . . . . 6852000 . . Ralph Nader . . . . . . Green. . . . . . . . . . . . 2,883 Pat Buchanan . . . . . Reform . . . . . . . . . . . 449
Source: Congressional Quarterly, Inc. Washington, DC, America at the Polls 1920-1996, 1997; and America Votes, biennial(copyright).
No. 380. Democratic and Republican Percentages of Two-Party PresidentialVote by Selected Characteristics of Voters: 1992 and 1996
[In percent. Covers citizens of voting age living in private housing units in the contiguous United States. Percentages forDemocratic Presidential vote are computed by subtracting the percentage Republican vote from 100 percent; third-party orindependent votes are not included as valid data. Data are from the National Election Studies and are based on a sample andsubject to sampling variability; for details, see source]
Characteristic1992 1996
Demo-cratic
Repub-lican
Demo-cratic
Repub-lican
Total 1 . . . . . . . . 58 42 58 42
Year of birth:1959 or later . . . . . . 58 42 58 421943 to 1958 . . . . . 58 42 58 421927 to 1942 . . . . . 56 44 56 441911 to 1926. . . . . . 62 38 64 361895 to 1910 . . . . . 58 42 57 43
Sex:Male . . . . . . . . . . . 55 45 51 50Female . . . . . . . . . 61 39 65 35
Characteristic1992 1996
Demo-cratic
Repub-lican
Demo-cratic
Repub-lican
Race:White. . . . . . . . . . . 53 47 54 46Black . . . . . . . . . . . 94 6 99 1
Education:Grade school . . . . . 68 32 82 18High school. . . . . . . 62 38 60 40College . . . . . . . . . 52 48 49 51
Union household . . . . . 68 32 75 25Nonunion household . . 57 43 54 46
1 Includes other characteristics, not shown separately.
Source: Center for Political Studies, University of Michigan, Ann Arbor, MI, unpublished data (copyright).
Elections 233
U.S. Census Bureau, Statistical Abstract of the United States: 2001
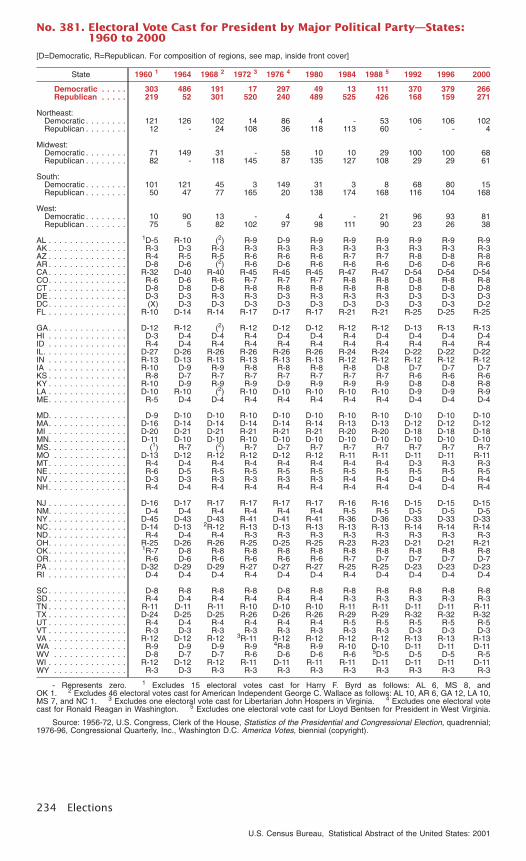
No. 381. Electoral Vote Cast for President by Major Political Party—States:1960 to 2000
[D=Democratic, R=Republican. For composition of regions, see map, inside front cover]
State 1960 1 1964 1968 2 1972 3 1976 4 1980 1984 1988 5 1992 1996 2000
Democratic . . . . . 303 486 191 17 297 49 13 111 370 379 266Republican . . . . . 219 52 301 520 240 489 525 426 168 159 271
Northeast:Democratic . . . . . . . . 121 126 102 14 86 4 - 53 106 106 102Republican . . . . . . . . 12 - 24 108 36 118 113 60 - - 4
Midwest:Democratic . . . . . . . . 71 149 31 - 58 10 10 29 100 100 68Republican . . . . . . . . 82 - 118 145 87 135 127 108 29 29 61
South:Democratic . . . . . . . . 101 121 45 3 149 31 3 8 68 80 15Republican . . . . . . . . 50 47 77 165 20 138 174 168 116 104 168
West:Democratic . . . . . . . . 10 90 13 - 4 4 - 21 96 93 81Republican . . . . . . . . 75 5 82 102 97 98 111 90 23 26 38
AL . . . . . . . . . . . . . . . 1D-5 R-10 (2) R-9 D-9 R-9 R-9 R-9 R-9 R-9 R-9AK . . . . . . . . . . . . . . . R-3 D-3 R-3 R-3 R-3 R-3 R-3 R-3 R-3 R-3 R-3AZ . . . . . . . . . . . . . . . R-4 R-5 R-5 R-6 R-6 R-6 R-7 R-7 R-8 D-8 R-8AR . . . . . . . . . . . . . . . D-8 D-6 (2) R-6 D-6 R-6 R-6 R-6 D-6 D-6 R-6CA . . . . . . . . . . . . . . . R-32 D-40 R-40 R-45 R-45 R-45 R-47 R-47 D-54 D-54 D-54CO. . . . . . . . . . . . . . . R-6 D-6 R-6 R-7 R-7 R-7 R-8 R-8 D-8 R-8 R-8CT . . . . . . . . . . . . . . . D-8 D-8 D-8 R-8 R-8 R-8 R-8 R-8 D-8 D-8 D-8DE . . . . . . . . . . . . . . . D-3 D-3 R-3 R-3 D-3 R-3 R-3 R-3 D-3 D-3 D-3DC. . . . . . . . . . . . . . . (X) D-3 D-3 D-3 D-3 D-3 D-3 D-3 D-3 D-3 D-2FL . . . . . . . . . . . . . . . R-10 D-14 R-14 R-17 D-17 R-17 R-21 R-21 R-25 D-25 R-25
GA. . . . . . . . . . . . . . . D-12 R-12 (2) R-12 D-12 D-12 R-12 R-12 D-13 R-13 R-13HI . . . . . . . . . . . . . . . D-3 D-4 D-4 R-4 D-4 D-4 R-4 D-4 D-4 D-4 D-4ID . . . . . . . . . . . . . . . R-4 D-4 R-4 R-4 R-4 R-4 R-4 R-4 R-4 R-4 R-4IL. . . . . . . . . . . . . . . . D-27 D-26 R-26 R-26 R-26 R-26 R-24 R-24 D-22 D-22 D-22IN . . . . . . . . . . . . . . . R-13 D-13 R-13 R-13 R-13 R-13 R-12 R-12 R-12 R-12 R-12IA . . . . . . . . . . . . . . . R-10 D-9 R-9 R-8 R-8 R-8 R-8 D-8 D-7 D-7 D-7KS . . . . . . . . . . . . . . . R-8 D-7 R-7 R-7 R-7 R-7 R-7 R-7 R-6 R-6 R-6KY . . . . . . . . . . . . . . . R-10 D-9 R-9 R-9 D-9 R-9 R-9 R-9 D-8 D-8 R-8LA . . . . . . . . . . . . . . . D-10 R-10 (2) R-10 D-10 R-10 R-10 R-10 D-9 D-9 R-9ME. . . . . . . . . . . . . . . R-5 D-4 D-4 R-4 R-4 R-4 R-4 R-4 D-4 D-4 D-4
MD. . . . . . . . . . . . . . . D-9 D-10 D-10 R-10 D-10 D-10 R-10 R-10 D-10 D-10 D-10MA. . . . . . . . . . . . . . . D-16 D-14 D-14 D-14 D-14 R-14 R-13 D-13 D-12 D-12 D-12MI . . . . . . . . . . . . . . . D-20 D-21 D-21 R-21 R-21 R-21 R-20 R-20 D-18 D-18 D-18MN. . . . . . . . . . . . . . . D-11 D-10 D-10 R-10 D-10 D-10 D-10 D-10 D-10 D-10 D-10MS. . . . . . . . . . . . . . . (1) R-7 (2) R-7 D-7 R-7 R-7 R-7 R-7 R-7 R-7MO . . . . . . . . . . . . . . D-13 D-12 R-12 R-12 D-12 R-12 R-11 R-11 D-11 D-11 R-11MT. . . . . . . . . . . . . . . R-4 D-4 R-4 R-4 R-4 R-4 R-4 R-4 D-3 R-3 R-3NE . . . . . . . . . . . . . . . R-6 D-5 R-5 R-5 R-5 R-5 R-5 R-5 R-5 R-5 R-5NV . . . . . . . . . . . . . . . D-3 D-3 R-3 R-3 R-3 R-3 R-4 R-4 D-4 D-4 R-4NH. . . . . . . . . . . . . . . R-4 D-4 R-4 R-4 R-4 R-4 R-4 R-4 D-4 D-4 R-4
NJ . . . . . . . . . . . . . . . D-16 D-17 R-17 R-17 R-17 R-17 R-16 R-16 D-15 D-15 D-15NM. . . . . . . . . . . . . . . D-4 D-4 R-4 R-4 R-4 R-4 R-5 R-5 D-5 D-5 D-5NY . . . . . . . . . . . . . . . D-45 D-43 D-43 R-41 D-41 R-41 R-36 D-36 D-33 D-33 D-33NC. . . . . . . . . . . . . . . D-14 D-13 2R-12 R-13 D-13 R-13 R-13 R-13 R-14 R-14 R-14ND. . . . . . . . . . . . . . . R-4 D-4 R-4 R-3 R-3 R-3 R-3 R-3 R-3 R-3 R-3OH. . . . . . . . . . . . . . . R-25 D-26 R-26 R-25 D-25 R-25 R-23 R-23 D-21 D-21 R-21OK. . . . . . . . . . . . . . . 1R-7 D-8 R-8 R-8 R-8 R-8 R-8 R-8 R-8 R-8 R-8OR. . . . . . . . . . . . . . . R-6 D-6 R-6 R-6 R-6 R-6 R-7 D-7 D-7 D-7 D-7PA . . . . . . . . . . . . . . . D-32 D-29 D-29 R-27 D-27 R-27 R-25 R-25 D-23 D-23 D-23RI . . . . . . . . . . . . . . . D-4 D-4 D-4 R-4 D-4 D-4 R-4 D-4 D-4 D-4 D-4
SC . . . . . . . . . . . . . . . D-8 R-8 R-8 R-8 D-8 R-8 R-8 R-8 R-8 R-8 R-8SD . . . . . . . . . . . . . . . R-4 D-4 R-4 R-4 R-4 R-4 R-3 R-3 R-3 R-3 R-3TN . . . . . . . . . . . . . . . R-11 D-11 R-11 R-10 D-10 R-10 R-11 R-11 D-11 D-11 R-11TX . . . . . . . . . . . . . . . D-24 D-25 D-25 R-26 D-26 R-26 R-29 R-29 R-32 R-32 R-32UT . . . . . . . . . . . . . . . R-4 D-4 R-4 R-4 R-4 R-4 R-5 R-5 R-5 R-5 R-5VT . . . . . . . . . . . . . . . R-3 D-3 R-3 R-3 R-3 R-3 R-3 R-3 D-3 D-3 D-3VA . . . . . . . . . . . . . . . R-12 D-12 R-12 3R-11 R-12 R-12 R-12 R-12 R-13 R-13 R-13WA . . . . . . . . . . . . . . R-9 D-9 D-9 R-9 4R-8 R-9 R-10 D-10 D-11 D-11 D-11WV . . . . . . . . . . . . . . D-8 D-7 D-7 R-6 D-6 D-6 R-6 5D-5 D-5 D-5 R-5WI . . . . . . . . . . . . . . . R-12 D-12 R-12 R-11 D-11 R-11 R-11 D-11 D-11 D-11 D-11WY . . . . . . . . . . . . . . R-3 D-3 R-3 R-3 R-3 R-3 R-3 R-3 R-3 R-3 R-3
- Represents zero. 1 Excludes 15 electoral votes cast for Harry F. Byrd as follows: AL 6, MS 8, andOK 1. 2 Excludes 46 electoral votes cast for American Independent George C. Wallace as follows: AL 10, AR 6, GA 12, LA 10,MS 7, and NC 1. 3 Excludes one electoral vote cast for Libertarian John Hospers in Virginia. 4 Excludes one electoral votecast for Ronald Reagan in Washington. 5 Excludes one electoral vote cast for Lloyd Bentsen for President in West Virginia.
Source: 1956-72, U.S. Congress, Clerk of the House, Statistics of the Presidential and Congressional Election, quadrennial;1976-96, Congressional Quarterly, Inc., Washington D.C. America Votes, biennial (copyright).
234 Elections
U.S. Census Bureau, Statistical Abstract of the United States: 2001
WA
OR
FL
ID
NV
AZ
CO
UT
TX
GA
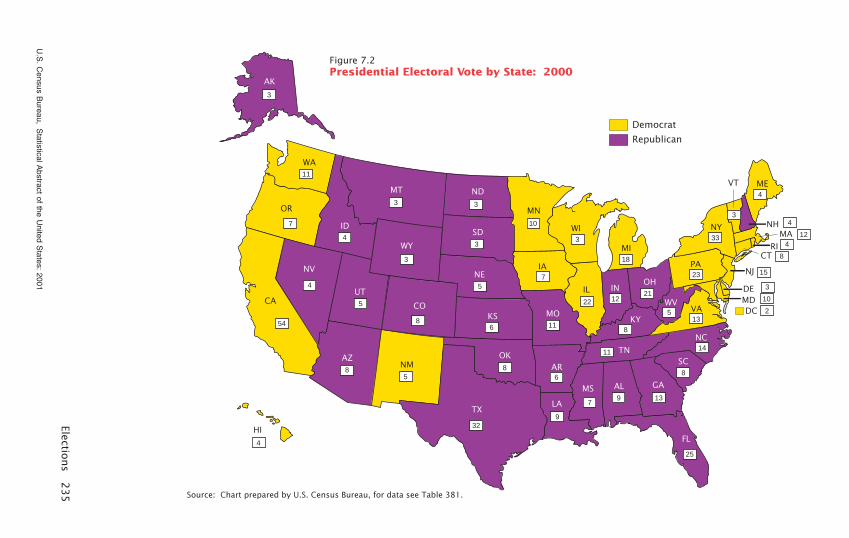
Figure 7.2Presidential Electoral Vote by State: 2000
Democrat
Republican
NM
NC
AK
MT
CA
WY
ND
SD
NE
KS
OK
HI
MN
IA
MO
AR
LA
WI
IL
MI
INOH
KY
TN
MS AL
ME
NY
PA
WVVA
NH
RI CT
NJ
DE
DC MD
VT
SC
Source: Chart prepared by U.S. Census Bureau, for data see Table 381.
3
11
7
3
54
4
3
8
5
3
3
5
6
8
32
10
7
11
6
22
3
9
12
18
11
9
8
7
21
13
23
14
8
13
33
4
5
25
2
10
3
15
8
4MA 12
43
4
4
8
5
Elections
23
5
U.S
.C
ensusB
ureau,S
tatisticalAbstract
ofthe
United
States:
2001
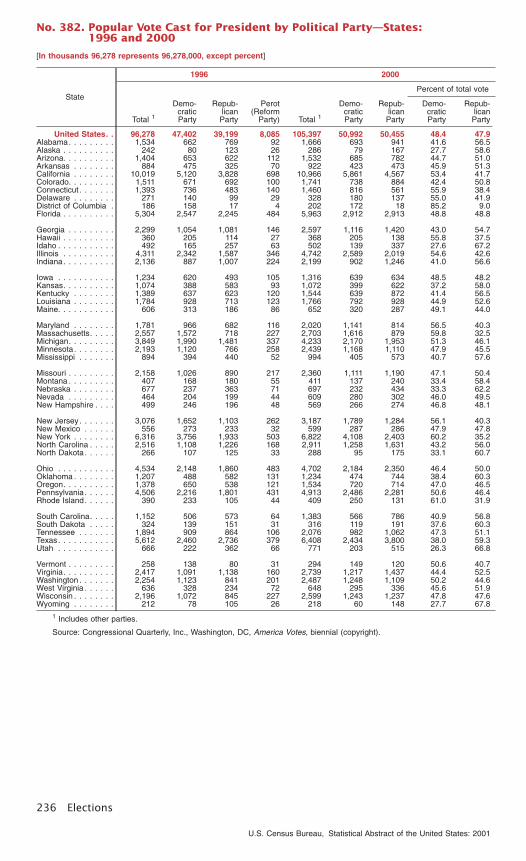
No. 382. Popular Vote Cast for President by Political Party—States:1996 and 2000
[In thousands 96,278 represents 96,278,000, except percent]
State
1996 2000
Total 1
Demo-craticParty
Repub-lican
Party
Perot(Reform
Party) Total 1
Demo-craticParty
Repub-lican
Party
Percent of total vote
Demo-craticParty
Repub-lican
Party
United States. . 96,278 47,402 39,199 8,085 105,397 50,992 50,455 48.4 47.9Alabama. . . . . . . . . 1,534 662 769 92 1,666 693 941 41.6 56.5Alaska . . . . . . . . . . 242 80 123 26 286 79 167 27.7 58.6Arizona. . . . . . . . . . 1,404 653 622 112 1,532 685 782 44.7 51.0Arkansas . . . . . . . . 884 475 325 70 922 423 473 45.9 51.3California . . . . . . . . 10,019 5,120 3,828 698 10,966 5,861 4,567 53.4 41.7Colorado. . . . . . . . . 1,511 671 692 100 1,741 738 884 42.4 50.8Connecticut . . . . . . . 1,393 736 483 140 1,460 816 561 55.9 38.4Delaware . . . . . . . . 271 140 99 29 328 180 137 55.0 41.9District of Columbia . 186 158 17 4 202 172 18 85.2 9.0Florida . . . . . . . . . . 5,304 2,547 2,245 484 5,963 2,912 2,913 48.8 48.8
Georgia . . . . . . . . . 2,299 1,054 1,081 146 2,597 1,116 1,420 43.0 54.7Hawaii . . . . . . . . . . 360 205 114 27 368 205 138 55.8 37.5Idaho . . . . . . . . . . . 492 165 257 63 502 139 337 27.6 67.2Illinois . . . . . . . . . . 4,311 2,342 1,587 346 4,742 2,589 2,019 54.6 42.6Indiana. . . . . . . . . . 2,136 887 1,007 224 2,199 902 1,246 41.0 56.6
Iowa . . . . . . . . . . . 1,234 620 493 105 1,316 639 634 48.5 48.2Kansas. . . . . . . . . . 1,074 388 583 93 1,072 399 622 37.2 58.0Kentucky . . . . . . . . 1,389 637 623 120 1,544 639 872 41.4 56.5Louisiana . . . . . . . . 1,784 928 713 123 1,766 792 928 44.9 52.6Maine. . . . . . . . . . . 606 313 186 86 652 320 287 49.1 44.0
Maryland . . . . . . . . 1,781 966 682 116 2,020 1,141 814 56.5 40.3Massachusetts. . . . . 2,557 1,572 718 227 2,703 1,616 879 59.8 32.5Michigan. . . . . . . . . 3,849 1,990 1,481 337 4,233 2,170 1,953 51.3 46.1Minnesota. . . . . . . . 2,193 1,120 766 258 2,439 1,168 1,110 47.9 45.5Mississippi . . . . . . . 894 394 440 52 994 405 573 40.7 57.6
Missouri . . . . . . . . . 2,158 1,026 890 217 2,360 1,111 1,190 47.1 50.4Montana . . . . . . . . . 407 168 180 55 411 137 240 33.4 58.4Nebraska . . . . . . . . 677 237 363 71 697 232 434 33.3 62.2Nevada . . . . . . . . . 464 204 199 44 609 280 302 46.0 49.5New Hampshire . . . . 499 246 196 48 569 266 274 46.8 48.1
New Jersey. . . . . . . 3,076 1,652 1,103 262 3,187 1,789 1,284 56.1 40.3New Mexico . . . . . . 556 273 233 32 599 287 286 47.9 47.8New York . . . . . . . . 6,316 3,756 1,933 503 6,822 4,108 2,403 60.2 35.2North Carolina . . . . . 2,516 1,108 1,226 168 2,911 1,258 1,631 43.2 56.0North Dakota. . . . . . 266 107 125 33 288 95 175 33.1 60.7
Ohio . . . . . . . . . . . 4,534 2,148 1,860 483 4,702 2,184 2,350 46.4 50.0Oklahoma . . . . . . . . 1,207 488 582 131 1,234 474 744 38.4 60.3Oregon. . . . . . . . . . 1,378 650 538 121 1,534 720 714 47.0 46.5Pennsylvania. . . . . . 4,506 2,216 1,801 431 4,913 2,486 2,281 50.6 46.4Rhode Island. . . . . . 390 233 105 44 409 250 131 61.0 31.9
South Carolina. . . . . 1,152 506 573 64 1,383 566 786 40.9 56.8South Dakota . . . . . 324 139 151 31 316 119 191 37.6 60.3Tennessee . . . . . . . 1,894 909 864 106 2,076 982 1,062 47.3 51.1Texas. . . . . . . . . . . 5,612 2,460 2,736 379 6,408 2,434 3,800 38.0 59.3Utah . . . . . . . . . . . 666 222 362 66 771 203 515 26.3 66.8
Vermont . . . . . . . . . 258 138 80 31 294 149 120 50.6 40.7Virginia. . . . . . . . . . 2,417 1,091 1,138 160 2,739 1,217 1,437 44.4 52.5Washington . . . . . . . 2,254 1,123 841 201 2,487 1,248 1,109 50.2 44.6West Virginia . . . . . . 636 328 234 72 648 295 336 45.6 51.9Wisconsin . . . . . . . . 2,196 1,072 845 227 2,599 1,243 1,237 47.8 47.6Wyoming . . . . . . . . 212 78 105 26 218 60 148 27.7 67.8
1 Includes other parties.
Source: Congressional Quarterly, Inc., Washington, DC, America Votes, biennial (copyright).
236 Elections
U.S. Census Bureau, Statistical Abstract of the United States: 2001

No. 383. Vote Cast for United States Senators, 1998 and 2000, and IncumbentSenators, 2000—States
[D=Democrat; R=Republican]
State
1998 2000 Incumbent senators and year term expires
Total(1,000) 1
Percentfor
leadingparty
Total(1,000) 1
Percentfor
leadingparty Name, party, and year Name, party, and year
Alabama. . . . . . 1,293 R-63.2 (X) (X) Jeff Sessions (R) 2003 Richard C. Shelby (R) 2005Alaska . . . . . . . 222 R-74.5 (X) (X) Frank H. Murkowski (R) 2005 Ted Stevens (R) 2003Arizona. . . . . . . 1,013 R-68.7 1,397 R-79.3 John McCain (R) 2005 Jon Kyl (R) 2007Arkansas . . . . . 701 D-55.1 (X) (X) Blanche Lincoln (D) 2005 Tim Hutchinson (R) 2003California . . . . . 8,315 D-53.1 10,624 D-55.8 Barbara Boxer (D) 2005 Dianne Feinstein (D) 2007Colorado. . . . . . 1,327 R-62.5 (X) (X) Ben N. Campbell (R) 2005 Wayne Allard (R) 2003Connecticut . . . . 964 D-65.1 1,311 D-63.2 Christopher J. Dodd (D) 2005 Joseph I. Lieberman (D) 2007Delaware . . . . . (X) (X) 327 D-55.5 Joseph R. Biden Jr. (D) 2003 Thomas R. Carper (D) 2007Florida . . . . . . . 3,900 D-62.5 5,857 D-51.0 Bob Graham (D) 2005 Bill Nelson (D) 2007Georgia . . . . . . 1,754 R-52.4 2,429 D-58.2 Paul Coverdell (R) 2005 Zell Miller (D) 2007Hawaii . . . . . . . 398 D-79.2 346 D-72.7 Daniel K. Akaka (D) 2007 Daniel K. Inouye (D) 2005Idaho . . . . . . . . 378 R-69.5 (X) (X) Larry E. Craig (R) 2003 Michael D. Crapo (R) 2005Illinois . . . . . . . 3,395 R-50.3 (X) (X) Peter Fitzgerald (R) 2005 Richard J. Durbin (D) 2003Indiana. . . . . . . 1,589 D-63.7 2,145 R-66.6 Evan Bayh (D) 2005 Richard G. Lugar (R) 2007Iowa . . . . . . . . 948 R-68.4 (X) (X) Tom Harkin (D) 2003 Charles E. Grassley (R) 2005Kansas. . . . . . . 727 R-65.3 (X) (X) Sam Brownback (R) 2005 Pat Roberts (R) 2003Kentucky . . . . . 1,145 R-49.7 (X) (X) Jim Bunning (R) 2005 Mitch McConnell (R) 2003Louisiana 2 . . . . 969 D-64.0 (X) (X) John B. Breaux (D) 2005 Mary Landrieu (D) 2003Maine. . . . . . . . (X) (X) 635 R-68.9 Susan Collins (R) 2003 Olympia J. Snowe (R) 2007Maryland . . . . . 1,507 D-70.5 1,947 D-63.2 Barbara A. Mikulski (D) 2005 Paul S. Sarbanes (D) 2007Massachusetts. . (X) (X) 2,599 D-72.7 Edward M. Kennedy (D) 2007 John F. Kerry (D) 2003Michigan. . . . . . (X) (X) 4,168 D-49.5 Carl Levin (D) 2003 Debbie Stabenow (D) 2007Minnesota. . . . . (X) (X) 2,420 D-48.8 Paul David Wellstone (D) 2003 Mark Dayton (D) 2007Mississippi . . . . (X) (X) 994 R-65.9 Thad Cochran (R) 2003 Trent Lott (R) 2007Missouri . . . . . . 1,577 R-52.7 2,362 D-50.5 Christopher S. Bond (R) 2005 Mel Carnahan (D) 2007Montana . . . . . . (X) (X) 412 R-50.6 Max Baucus (D) 2003 Conrad Burns (R) 2007Nebraska . . . . . (X) (X) 692 D-51.0 Chuck Hagel (R) 2003 Ben Nelson (D) 2007Nevada . . . . . . 436 D-47.9 600 R-55.1 Harry Reid (D) 2005 John Ensign (R) 2007New Hampshire . 315 R-67.8 (X) (X) Judd Gregg (R) 2005 Robert C. Smith (R) 2003New Jersey. . . . (X) (X) 3,016 D-50.1 Robert G. Torricelli (D) 2003 Jon Corzine (D) 2007New Mexico . . . (X) (X) 590 D-61.7 Jeff Bingaman (D) 2007 Pete V. Domenici (R) 2003New York . . . . . 4,671 D-54.6 6,780 D-55.3 Hillary Rodham Clinton (D) 2007 Charles E. Schumer (D) 2005North Carolina . . 2,012 D-51.2 (X) (X) John Edwards (D) 2005 Jesse Helms (R) 2003North Dakota. . . 213 D-63.2 288 D-61.4 Byron L. Dorgan (D) 2005 Kent Conrad (D) 2007Ohio . . . . . . . . 3,404 R-56.5 4,449 R-59.9 George V. Voinovich (R) 2005 Mike DeWine (R) 2007Oklahoma . . . . . 860 R-66.4 (X) (X) James Inhofe (R) 2003 Don Nickles (R) 2005Oregon. . . . . . . 1,118 D-61.1 (X) (X) Gordon Smith (R) 2003 Ron Wyden (D) 2005Pennsylvania. . . 2,958 R-61.3 4,736 R-52.4 Rick Santorum (R) 2007 Arlen Specter (R) 2005Rhode Island. . . (X) (X) 392 R-56.8 Jack Reed (D) 2003 Lincoln Chafee (R) 2007South Carolina. . 1,068 D-52.7 (X) (X) Ernest F. Hollings (D) 2005 Strom Thurmond (R) 2003South Dakota . . 262 D-62.1 (X) (X) Thomas A. Daschle (D) 2005 Tim Johnson (D) 2003Tennessee . . . . (X) (X) 1,929 R-65.1 Fred Thompson (R) 2003 Bill Frist (R) 2007Texas. . . . . . . . (X) (X) 6,277 R-65.0 Kay Bailey Hutchison (R) 2007 Phil Gramm (R) 2003Utah . . . . . . . . 495 R-64.0 770 R-65.6 Robert F. Bennett (R) 2005 Orrin G. Hatch (R) 2007Vermont . . . . . . 214 D-72.2 289 R-65.6 Patrick J. Leahy (D) 2005 James M. Jeffords (R) 2007Virginia. . . . . . . (X) (X) 2,718 R-52.3 George F. Allen (R) 2007 John W. Warner (R) 2003Washington . . . . 1,889 D-58.4 2,461 D-48.7 Patty Murray (D) 2005 Maria Cantwell (D) 2007West Virginia . . . (X) (X) 603 D-77.8 Robert C. Byrd (D) 2007 John D. Rockefeller IV (D) 2003Wisconsin . . . . . 1,761 D-50.5 2,540 D-61.5 Herb Kohl (D) 2007 Russell Feingold (D) 2005Wyoming . . . . . (X) (X) 214 R-73.8 Mike Enzi (R) 2003 Craig Thomas (R) 2007
X Not applicable. 1 Includes vote cast for minor parties. 2 Louisiana holds an open-primary election with candidates fromall parties running on the same ballot. Any candidate who receives a majority is elected.
Source: Congressional Quarterly, Inc., Washington, D.C. America Votes, biennial (copyright).
Elections 237
U.S. Census Bureau, Statistical Abstract of the United States: 2001

No. 384. Apportionment of Membership in House of Representatives by State:1790 to 2000
[Total membership includes Representatives assigned to newly admitted states after the apportionment acts. Population figures usedfor apportionment purposes are those determined for states by each decennial census. No reapportionment based on 1920 popu-lation census. For method of calculating apportionment and a short history of apportionment, see House Report 91-1314, 91st Con-gress, 2d session, The Decennial Population Census and Congressional Apportionment]
StateMembership based on census of—
1790 1800 1810 1820 1830 1840 1850 1860 1870 1880 1890 1900 1910 1930 1940 1950 1960 1970 1980 1990 2000
U.S. 106 142 186 213 242 232 237 243 293 332 357 391 435 435 435 437 435 435 435 435 435
AL . . . (X) (X) 11 3 5 7 7 6 8 8 9 9 10 9 9 9 8 7 7 7 7AK . . . (X) (X) (X) (X) (X) (X) (X) (X) (X) (X) (X) (X) (X) (X) (X) 11 1 1 1 1 1AZ . . . (X) (X) (X) (X) (X) (X) (X) (X) (X) (X) (X) (X) 21 1 2 2 3 4 5 6 8AR . . . (X) (X) (X) (X) 11 1 2 3 4 5 6 7 7 7 7 6 4 4 4 4 4CA . . . (X) (X) (X) (X) (X) 12 2 3 4 6 7 8 11 20 23 30 38 43 45 52 53CO. . . (X) (X) (X) (X) (X) (X) (X) (X) 11 1 2 3 4 4 4 4 4 5 6 6 7CT . . . 7 7 7 6 6 4 4 4 4 4 4 5 5 6 6 6 6 6 6 6 5DE . . . 1 1 2 1 1 1 1 1 1 1 1 1 1 1 1 1 1 1 1 1 1FL . . . (X) (X) (X) (X) (X) 11 1 1 2 2 2 3 4 5 6 8 12 15 19 23 25GA. . . 2 4 6 7 9 8 8 7 9 10 11 11 12 10 10 10 10 10 10 11 13
HI . . . (X) (X) (X) (X) (X) (X) (X) (X) (X) (X) (X) (X) (X) (X) (X) 11 2 2 2 2 2ID . . . (X) (X) (X) (X) (X) (X) (X) (X) (X) 11 1 1 2 2 2 2 2 2 2 2 2IL. . . . (X) (X) 11 1 3 7 9 14 19 20 22 25 27 27 26 25 24 24 22 20 19IN . . . (X) (X) 11 3 7 10 11 11 13 13 13 13 13 12 11 11 11 11 10 10 9IA . . . (X) (X) (X) (X) (X) 12 2 6 9 11 11 11 11 9 8 8 7 6 6 5 5KS . . . (X) (X) (X) (X) (X) (X) (X) 1 3 7 8 8 8 7 6 6 5 5 5 4 4KY . . . 2 6 10 12 13 10 10 9 10 11 11 11 11 9 9 8 7 7 7 6 6LA . . . (X) (X) 11 3 3 4 4 5 6 6 6 7 8 8 8 8 8 8 8 7 7ME. . . (X) (X) (X) 7 8 7 6 5 5 4 4 4 4 3 3 3 2 2 2 2 2MD. . . 8 9 9 9 8 6 6 5 6 6 6 6 6 6 6 7 8 8 8 8 8
MA. . . 14 17 20 13 12 10 11 10 11 12 13 14 16 15 14 14 12 12 11 10 10MI . . . (X) (X) (X) (X) 11 3 4 6 9 11 12 12 13 17 17 18 19 19 18 16 15MN. . . (X) (X) (X) (X) (X) (X) 12 2 3 5 7 9 10 9 9 9 8 8 8 8 8MS. . . (X) (X) 11 1 2 4 5 5 6 7 7 8 8 7 7 6 5 5 5 5 4MO . . (X) (X) (X) 1 2 5 7 9 13 14 15 16 16 13 13 11 10 10 9 9 9MT. . . (X) (X) (X) (X) (X) (X) (X) (X) (X) 11 1 1 2 2 2 2 2 2 2 1 1NE . . . (X) (X) (X) (X) (X) (X) (X) 11 1 3 6 6 6 5 4 4 3 3 3 3 3NV . . . (X) (X) (X) (X) (X) (X) (X) 11 1 1 1 1 1 1 1 1 1 1 2 2 3NH. . . 4 5 6 6 5 4 3 3 3 2 2 2 2 2 2 2 2 2 2 2 2NJ . . . 5 6 6 6 6 5 5 5 7 7 8 10 12 14 14 14 15 15 14 13 13
NM. . . (X) (X) (X) (X) (X) (X) (X) (X) (X) (X) (X) (X) 21 1 2 2 2 2 3 3 3NY . . . 10 17 27 34 40 34 33 31 33 34 34 37 43 45 45 43 41 39 34 31 29NC. . . 10 12 13 13 13 9 8 7 8 9 9 10 10 11 12 12 11 11 11 12 13ND. . . (X) (X) (X) (X) (X) (X) (X) (X) (X) 11 1 2 3 2 2 2 2 1 1 1 1OH. . . (X) 11 6 14 19 21 21 19 20 21 21 21 22 24 23 23 24 23 21 19 18OK. . . (X) (X) (X) (X) (X) (X) (X) (X) (X) (X) (X) 15 8 9 8 6 6 6 6 6 5OR. . . (X) (X) (X) (X) (X) (X) 11 1 1 1 2 2 3 3 4 4 4 4 5 5 5PA . . . 13 18 23 26 28 24 25 24 27 28 30 32 36 34 33 30 27 25 23 21 19RI . . . 2 2 2 2 2 2 2 2 2 2 2 2 3 2 2 2 2 2 2 2 2SC . . . 6 8 9 9 9 7 6 4 5 7 7 7 7 6 6 6 6 6 6 6 6
SD . . . (X) (X) (X) (X) (X) (X) (X) (X) (X) 12 2 2 3 2 2 2 2 2 1 1 1TN . . . 11 3 6 9 13 11 10 8 10 10 10 10 10 9 10 9 9 8 9 9 9TX . . . (X) (X) (X) (X) (X) 12 2 4 6 11 13 16 18 21 21 22 23 24 27 30 32UT . . . (X) (X) (X) (X) (X) (X) (X) (X) (X) (X) 11 1 2 2 2 2 2 2 3 3 3VT . . . 2 4 6 5 5 4 3 3 3 2 2 2 2 1 1 1 1 1 1 1 1VA . . . 19 22 23 22 21 15 13 11 9 10 10 10 10 9 9 10 10 10 10 11 11WA . . (X) (X) (X) (X) (X) (X) (X) (X) (X) 11 2 3 5 6 6 7 7 7 8 9 9WI . . . (X) (X) (X) (X) (X) 12 3 6 8 9 10 11 11 10 10 10 10 9 9 9 8WV . . (X) (X) (X) (X) (X) (X) (X) (X) 3 4 4 5 6 6 6 6 5 4 4 3 3WY . . (X) (X) (X) (X) (X) (X) (X) (X) (X) 11 1 1 1 1 1 1 1 1 1 1 1
X Not applicable. 1 Assigned after apportionment. 2 Included in apportionment in anticipation of statehood.
Source: U.S. Census Bureau, unpublished data. See also <http;//www.census.gov/population/www/censusdata/apportionment.html>.
238 Elections
U.S. Census Bureau, Statistical Abstract of the United States: 2001
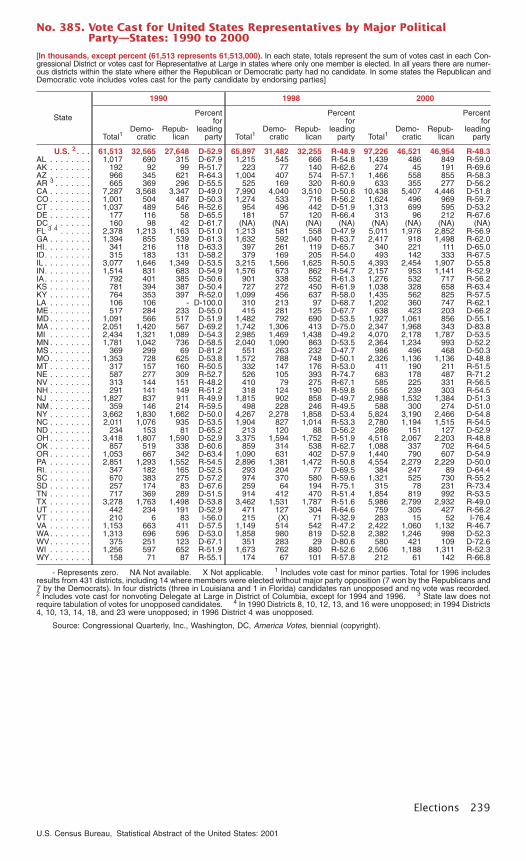
No. 385. Vote Cast for United States Representatives by Major PoliticalParty—States: 1990 to 2000
[In thousands, except percent (61,513 represents 61,513,000). In each state, totals represent the sum of votes cast in each Con-gressional District or votes cast for Representative at Large in states where only one member is elected. In all years there are numer-ous districts within the state where either the Republican or Democratic party had no candidate. In some states the Republican andDemocratic vote includes votes cast for the party candidate by endorsing parties]
State
1990 1998 2000
Total1Demo-
craticRepub-
lican
Percentfor
leadingparty Total1
Demo-cratic
Repub-lican
Percentfor
leadingparty Total1
Demo-cratic
Repub-lican
Percentfor
leadingparty
U.S. 2 . . . 61,513 32,565 27,648 D-52.9 65,897 31,482 32,255 R-48.9 97,226 46,521 46,954 R-48.3AL . . . . . . . . 1,017 690 315 D-67.9 1,215 545 666 R-54.8 1,439 486 849 R-59.0AK . . . . . . . . 192 92 99 R-51.7 223 77 140 R-62.6 274 45 191 R-69.6AZ . . . . . . . . 966 345 621 R-64.3 1,004 407 574 R-57.1 1,466 558 855 R-58.3AR 3 . . . . . . . 665 369 296 D-55.5 525 169 320 R-60.9 633 355 277 D-56.2CA . . . . . . . . 7,287 3,568 3,347 D-49.0 7,990 4,040 3,510 D-50.6 10,438 5,407 4,446 D-51.8CO . . . . . . . . 1,001 504 487 D-50.3 1,274 533 716 R-56.2 1,624 496 969 R-59.7CT . . . . . . . . 1,037 489 546 R-52.6 954 496 442 D-51.9 1,313 699 595 D-53.2DE . . . . . . . . 177 116 58 D-65.5 181 57 120 R-66.4 313 96 212 R-67.6DC . . . . . . . . 160 98 42 D-61.7 (NA) (NA) (NA) (NA) (NA) (NA) (NA) (NA)FL 3 4 . . . . . . 2,378 1,213 1,163 D-51.0 1,213 581 558 D-47.9 5,011 1,976 2,852 R-56.9GA . . . . . . . . 1,394 855 539 D-61.3 1,632 592 1,040 R-63.7 2,417 918 1,498 R-62.0HI. . . . . . . . . 341 216 118 D-63.3 397 261 119 D-65.7 340 221 111 D-65.0ID. . . . . . . . . 315 183 131 D-58.2 379 169 205 R-54.0 493 142 333 R-67.5IL . . . . . . . . . 3,077 1,646 1,349 D-53.5 3,215 1,566 1,625 R-50.5 4,393 2,454 1,907 D-55.8IN. . . . . . . . . 1,514 831 683 D-54.9 1,576 673 862 R-54.7 2,157 953 1,141 R-52.9IA. . . . . . . . . 792 401 385 D-50.6 901 338 552 R-61.3 1,276 532 717 R-56.2KS . . . . . . . . 781 394 387 D-50.4 727 272 450 R-61.9 1,038 328 658 R-63.4KY . . . . . . . . 764 353 397 R-52.0 1,099 456 637 R-58.0 1,435 562 825 R-57.5LA . . . . . . . . 106 106 - D-100.0 310 213 97 D-68.7 1,202 360 747 R-62.1ME . . . . . . . . 517 284 233 D-55.0 415 281 125 D-67.7 638 423 203 D-66.2MD . . . . . . . . 1,091 566 517 D-51.9 1,482 792 690 D-53.5 1,927 1,061 856 D-55.1MA . . . . . . . . 2,051 1,420 567 D-69.2 1,742 1,306 413 D-75.0 2,347 1,968 343 D-83.8MI . . . . . . . . 2,434 1,321 1,089 D-54.3 2,985 1,469 1,438 D-49.2 4,070 2,178 1,787 D-53.5MN . . . . . . . . 1,781 1,042 736 D-58.5 2,040 1,090 863 D-53.5 2,364 1,234 993 D-52.2MS . . . . . . . . 369 299 69 D-81.2 551 263 232 D-47.7 986 496 468 D-50.3MO. . . . . . . . 1,353 728 625 D-53.8 1,572 788 748 D-50.1 2,326 1,136 1,136 D-48.8MT . . . . . . . . 317 157 160 R-50.5 332 147 176 R-53.0 411 190 211 R-51.5NE . . . . . . . . 587 277 309 R-52.7 526 105 393 R-74.7 683 178 487 R-71.2NV . . . . . . . . 313 144 151 R-48.2 410 79 275 R-67.1 585 225 331 R-56.5NH . . . . . . . . 291 141 149 R-51.2 318 124 190 R-59.8 556 239 303 R-54.5NJ . . . . . . . . 1,827 837 911 R-49.9 1,815 902 858 D-49.7 2,988 1,532 1,384 D-51.3NM . . . . . . . . 359 146 214 R-59.5 498 228 246 R-49.5 588 300 274 D-51.0NY . . . . . . . . 3,662 1,830 1,662 D-50.0 4,267 2,278 1,858 D-53.4 5,824 3,190 2,466 D-54.8NC . . . . . . . . 2,011 1,076 935 D-53.5 1,904 827 1,014 R-53.3 2,780 1,194 1,515 R-54.5ND . . . . . . . . 234 153 81 D-65.2 213 120 88 D-56.2 286 151 127 D-52.9OH . . . . . . . . 3,418 1,807 1,590 D-52.9 3,375 1,594 1,752 R-51.9 4,518 2,067 2,203 R-48.8OK . . . . . . . . 857 519 338 D-60.6 859 314 538 R-62.7 1,088 337 702 R-64.5OR . . . . . . . . 1,053 667 342 D-63.4 1,090 631 402 D-57.9 1,440 790 607 D-54.9PA . . . . . . . . 2,851 1,293 1,552 R-54.5 2,896 1,381 1,472 R-50.8 4,554 2,279 2,229 D-50.0RI. . . . . . . . . 347 182 165 D-52.5 293 204 77 D-69.5 384 247 89 D-64.4SC . . . . . . . . 670 383 275 D-57.2 974 370 580 R-59.6 1,321 525 730 R-55.2SD . . . . . . . . 257 174 83 D-67.6 259 64 194 R-75.1 315 78 231 R-73.4TN . . . . . . . . 717 369 289 D-51.5 914 412 470 R-51.4 1,854 819 992 R-53.5TX . . . . . . . . 3,278 1,763 1,498 D-53.8 3,462 1,531 1,787 R-51.6 5,986 2,799 2,932 R-49.0UT . . . . . . . . 442 234 191 D-52.9 471 127 304 R-64.6 759 305 427 R-56.2VT . . . . . . . . 210 6 83 I-56.0 215 (X) 71 R-32.9 283 15 52 I-76.4VA . . . . . . . . 1,153 663 411 D-57.5 1,149 514 542 R-47.2 2,422 1,060 1,132 R-46.7WA . . . . . . . . 1,313 696 596 D-53.0 1,858 980 819 D-52.8 2,382 1,246 998 D-52.3WV. . . . . . . . 375 251 123 D-67.1 351 283 29 D-80.6 580 421 109 D-72.6WI . . . . . . . . 1,256 597 652 R-51.9 1,673 762 880 R-52.6 2,506 1,188 1,311 R-52.3WY. . . . . . . . 158 71 87 R-55.1 174 67 101 R-57.8 212 61 142 R-66.8
- Represents zero. NA Not available. X Not applicable. 1 Includes vote cast for minor parties. Total for 1996 includesresults from 431 districts, including 14 where members were elected without major party opposition (7 won by the Republicans and7 by the Democrats). In four districts (three in Louisiana and 1 in Florida) candidates ran unopposed and no vote was recorded.2 Includes vote cast for nonvoting Delegate at Large in District of Columbia, except for 1994 and 1996. 3 State law does notrequire tabulation of votes for unopposed candidates. 4 In 1990 Districts 8, 10, 12, 13, and 16 were unopposed; in 1994 Districts4, 10, 13, 14, 18, and 23 were unopposed; in 1996 District 4 was unopposed.
Source: Congressional Quarterly, Inc., Washington, DC, America Votes, biennial (copyright).
Elections 239
U.S. Census Bureau, Statistical Abstract of the United States: 2001

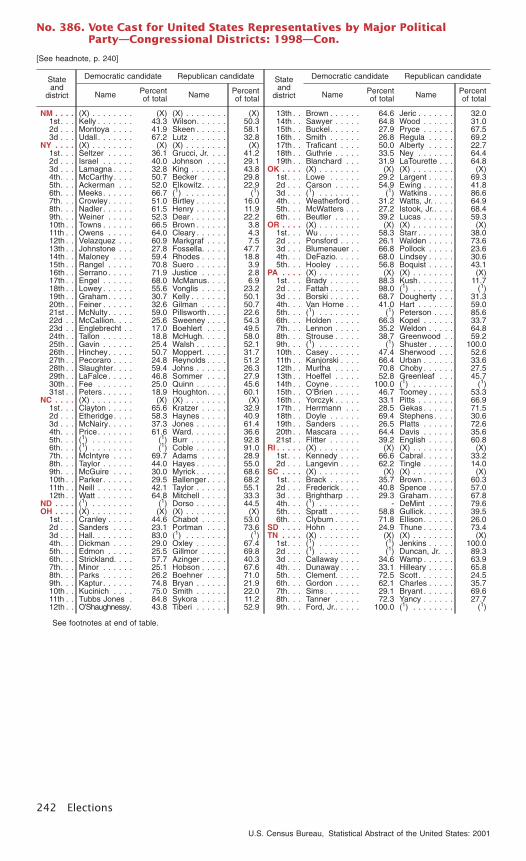
No. 386. Vote Cast for United States Representatives by Major PoliticalParty—Congressional Districts: 2000
[In some states the Democratic and Republican vote includes votes cast for the party candidate by endorsing parties]
Stateand
district
Democratic candidate Republican candidate
Name Percentof total Name Percent
of total
AL . . . . (X) . . . . . . . . (X) (X) . . . . . . . . (X)1st . . . (1) . . . . . . . . (1) Callahan . . . . 91.32d . . . Woods . . . . . 29.2 Everett . . . . . 68.23d . . . (1) . . . . . . . . (1) Riley . . . . . . . 86.94th. . . Folsom . . . . . 37.4 Aderholt . . . . 60.65th. . . Cramer, Jr. . . . 88.8 (1) . . . . . . . . (1)6th. . . (1) . . . . . . . . (1) Bachus . . . . . 87.97th. . . Hilliard. . . . . . 74.6 Martin . . . . . . 23.2
AK . . . . Greene . . . . . 16.5 Young . . . . . . 69.6AZ . . . . (X) . . . . . . . . (X) (X) . . . . . . . . (X)
1st . . . Mendoza . . . . 42.4 Flake . . . . . . 53.62d . . . Pastor . . . . . . 68.5 Barenholtz . . . 26.93d . . . Scharer . . . . . 31.4 Stump . . . . . . 65.74th. . . Jankowski . . . 32.7 Shadegg . . . . 64.05th. . . Cunningham. . 35.3 Kolbe . . . . . . 60.16th. . . Nelson . . . . . 35.6 Hayworth . . . . 61.4
AR . . . . (X) . . . . . . . . (X) (X) . . . . . . . . (X)1st . . . Berry. . . . . . . 60.1 Myshka . . . . . 39.72d . . . Snyder . . . . . 57.5 Thomas. . . . . 42.53d . . . (1) . . . . . . . . (1) Hutchinson. . . (2)4th. . . Ross. . . . . . . 51.0 Dickey. . . . . . 49.0
CA . . . . (X) . . . . . . . . (X) (X) . . . . . . . . (X)1st . . . Thompson . . . 65.0 Chase . . . . . . 28.02d . . . Morgan . . . . . 28.2 Herger. . . . . . 65.73d . . . Kent . . . . . . . 40.4 Ose . . . . . . . 56.24th. . . Norberg. . . . . 31.5 Doolittle . . . . . 63.45th. . . Matsui . . . . . . 68.7 Payne . . . . . . 26.16th. . . Woolsey . . . . 64.3 McAuliffe . . . . 28.37th. . . Miller. . . . . . . 76.5 Hoffman . . . . 21.18th. . . Pelosi . . . . . . 84.4 Sparks . . . . . 11.79th. . . Lee. . . . . . . . 85.0 Washington . . 9.810th . . Tauscher . . . . 52.6 Hutchinson. . . 44.211th . . Santos . . . . . 38.1 Pombo . . . . . 57.812th . . Lantos. . . . . . 74.5 Garza . . . . . . 20.813th . . Stark. . . . . . . 70.4 Goetz . . . . . . 24.314th . . Eshoo . . . . . . 70.2 Quraishi. . . . . 25.815th . . Honda. . . . . . 54.3 Cunneen . . . . 42.216th . . Lofgren . . . . . 72.1 Thayn . . . . . . 23.317th . . Farr . . . . . . . 68.6 Engler . . . . . . 24.718th . . Condit . . . . . . 67.1 Wilson. . . . . . 31.319th . . Rosenberg . . . 31.7 Radanovich . . 64.920th . . Dooley . . . . . 52.3 Rodriguez . . . 45.521st . . Martinez . . . . 24.8 Thomas. . . . . 71.622d . . Capps . . . . . . 53.1 Stoker . . . . . . 44.323d . . Case. . . . . . . 40.7 Gallegly . . . . . 54.124th . . Sherman . . . . 66.0 Doyle . . . . . . 29.825th . . Gold . . . . . . . 33.2 McKeon. . . . . 62.226th . . Berman . . . . . 84.1 (1) . . . . . . . . (1)27th . . Schiff . . . . . . 52.7 Rogan. . . . . . 43.828th . . Nelson . . . . . 39.9 Dreier . . . . . . 56.829th . . Waxman . . . . 75.7 Scileppi . . . . . 19.230th . . Becerra . . . . . 83.3 Goss. . . . . . . 11.831st . . Solis . . . . . . . 79.4 (1) . . . . . . . . (1)32d . . Dixon . . . . . . 83.5 Williamson . . . 12.133d . . Roybal-Allard . 84.5 Miller. . . . . . . 11.534th . . Napolitano . . . 71.3 Canales. . . . . 22.535th . . Waters . . . . . 86.5 McGill . . . . . . 10.836th . . Harman . . . . . 48.4 Kuykendall . . . 46.6
37th . .Millender-McDonald . . . 82.3 Van. . . . . . . . 11.3
38th . . Schipske . . . . 47.5 Horn . . . . . . . 48.439th . . Kanel . . . . . . 31.3 Royce . . . . . . 62.940th . . (1) . . . . . . . . (1) Lewis . . . . . . 79.941st . . Favila . . . . . . 37.4 Miller. . . . . . . 58.942d . . Baca. . . . . . . 59.8 Pirozzi. . . . . . 35.143d . . (1) . . . . . . . . (1) Calvert . . . . . 73.7
Stateand
district
Democratic candidate Republican candidate
Name Percentof total Name Percent
of total
44th . . Oden . . . . . . 37.9 Bono. . . . . . . 59.245th . . Crisell . . . . . . 32.4 Rohrabacher . 62.146th . . Sanchez . . . . 60.2 Tuchman . . . . 35.047th . . Graham. . . . . 30.1 Cox . . . . . . . 65.648th . . Kouvelis . . . . 28.3 Issa . . . . . . . 61.449th . . Davis . . . . . . 49.6 Bilbray. . . . . . 46.250th . . Filner . . . . . . 68.3 Divine . . . . . . 27.651st . . Barraza . . . . . 30.4 Cunningham. . 64.352d . . Barkacs. . . . . 31.3 Hunter. . . . . . 64.7
CO . . . . (X) . . . . . . . . (X) (X) . . . . . . . . (X)1st . . . DeGette . . . . 68.7 Thomas. . . . . 27.32d . . . Udall . . . . . . . 55.0 Cox . . . . . . . 38.63d . . . Imrie . . . . . . . 29.1 McInnis . . . . . 65.84th. . . (1) . . . . . . . . (1) Schaffer. . . . . 79.55th. . . (1) . . . . . . . . (1) Hefley . . . . . . 82.76th. . . Toltz . . . . . . . 42.1 Tancredo . . . . 53.9
CT . . . . (X) . . . . . . . . (X) (X) . . . . . . . . (X)1st . . . Larson . . . . . 71.9 Backlund . . . . 28.12d . . . Gejdenson . . . 49.4 Simmons . . . . 48.83d . . . DeLauro . . . . 71.9 Gold . . . . . . . 27.54th. . . Sanchez . . . . 40.9 Shays . . . . . . 57.65th. . . Maloney . . . . 53.6 Nielsen . . . . . 44.36th. . . Valenti. . . . . . 32.9 Johnson . . . . 62.6
DE . . . . Miller. . . . . . . 30.8 Castle . . . . . . 67.6FL. . . . . (X) . . . . . . . . (X) (X) . . . . . . . . (X)
1st . . . (1) . . . . . . . . - Scarborough . 99.52d . . . Boyd. . . . . . . 72.1 Dodd . . . . . . 27.93d . . . Brown . . . . . . 57.6 Carroll . . . . . . 42.44th. . . Sullivan . . . . . 31.2 Crenshaw . . . 67.05th. . . Thurman . . . . 64.3 Enwall . . . . . . 35.76th. . . (1) . . . . . . . . - Stearns . . . . . 100.07th. . . Vaughen . . . . 36.8 Mica . . . . . . . 63.28th. . . Chapin . . . . . 49.2 Keller . . . . . . 50.89th. . . (1) . . . . . . . . (1) Bilirakis . . . . . 81.910th . . (1) . . . . . . . . (1) Young . . . . . . 75.711th . . Davis . . . . . . 84.6 (1) . . . . . . . . (1)12th . . Stedem . . . . . 43.0 Putnam . . . . . 57.013th . . Dunn . . . . . . 36.1 Miller. . . . . . . 63.814th . . (1) . . . . . . . . (1) Goss. . . . . . . 85.215th . . Kurth . . . . . . 39.2 Weldon . . . . . 58.816th . . Brown . . . . . . 37.2 Foley . . . . . . 60.217th . . Meek . . . . . . 100.0 (1) . . . . . . . . (1)18th . . (1) . . . . . . . . (1) Ros Lehtinen . 100.019th . . Wexler . . . . . 71.6 Thompson . . . 28.420th . . Deutsch. . . . . 99.9 (1) . . . . . . . . (1)21st . . (1) . . . . . . . . (1) Diaz-Balart . . . 100.022d . . Bloom . . . . . . 49.9 Shaw . . . . . . 50.123d . . Hastings . . . . 76.3 Lambert. . . . . 23.7
GA . . . . (X) . . . . . . . . (X) (X) . . . . . . . . (X)1st . . . Griggs. . . . . . 30.9 Kingston . . . . 69.12d . . . Bishop, Jr. . . . 53.5 Glenn . . . . . . 46.53d . . . Notti . . . . . . . 36.5 Collins. . . . . . 63.54th. . . McKinney. . . . 60.7 Warren . . . . . 39.35th. . . Lewis . . . . . . 77.2 Schwab . . . . . 22.86th. . . DeHart . . . . . 25.2 Isakson . . . . . 74.87th. . . Kahn. . . . . . . 44.7 Barr . . . . . . . 55.38th. . . Marshall . . . . 41.1 Chambliss . . . 58.99th. . . Harrington . . . 24.8 Deal . . . . . . . 75.210th . . Freeman . . . . 36.8 Norwood . . . . 63.211th . . (1) . . . . . . . . - Linder . . . . . . 100.0
HI . . . . . (X) . . . . . . . . (X) (X) . . . . . . . . (X)1st . . . Abercrombie. . 69.0 Meyers . . . . . 28.62d . . . Mink . . . . . . . 61.6 Francis . . . . . 36.0
ID . . . . . (X) . . . . . . . . (X) (X) . . . . . . . . (X)1st . . . Pall. . . . . . . . 31.4 Otter . . . . . . . 64.82d . . . Williams. . . . . 25.9 Simpson . . . . 70.7
See footnotes at end of table.
240 Elections
U.S. Census Bureau, Statistical Abstract of the United States: 2001

No. 386. Vote Cast for United States Representatives by Major PoliticalParty—Congressional Districts: 2000—Con.
[See headnote, p. 240]
Stateand
district
Democratic candidate Republican candidate
Name Percentof total Name Percent
of total
IL . . . . . (X) . . . . . . . . (X) (X) . . . . . . . . (X)1st . . . Rush. . . . . . . 87.8 Wardingley. . . 12.22d . . . Jackson Jr. . . 89.8 Gordon III . . . 10.23d . . . Lipinski . . . . . 75.6 Groth . . . . . . 24.44th. . . Gutierrez . . . . 88.6 (1) . . . . . . . . (1)5th. . . Blagojevich . . 87.3 (1) . . . . . . . . (1)6th. . . Christensen . . 41.1 Hyde. . . . . . . 58.97th. . . Davis . . . . . . 85.9 Dallas . . . . . . 14.18th. . . Pressl . . . . . . 39.0 Crane . . . . . . 61.09th. . . Schakowsky . . 76.4 Driscoll . . . . . 23.610th . . Gash . . . . . . 48.8 Kirk. . . . . . . . 51.211th . . Stevenson . . . 43.6 Weller . . . . . . 56.412th . . Costello . . . . . 100.0 (1) . . . . . . . . (1)13th . . Mason. . . . . . 33.8 Biggert . . . . . 66.214th . . Deljonson . . . 26.0 Hastert . . . . . 74.015th . . Kelleher. . . . . 46.8 Johnson . . . . 53.216th . . Hendrickson . . 33.3 Manzullo . . . . 66.717th . . Evans . . . . . . 54.9 Baker . . . . . . 45.118th . . Harant. . . . . . 32.9 LaHood . . . . . 67.119th . . Phelps . . . . . 64.6 Eatherly. . . . . 35.420th . . Cooper . . . . . 36.9 Shimkus . . . . 63.1
IN . . . . . (X) . . . . . . . . (X) (X) . . . . . . . . (X)1st . . . Visclosky . . . . 71.6 Reynolds . . . . 27.02d . . . Rock. . . . . . . 38.8 Pence . . . . . . 50.93d . . . Roemer . . . . . 51.6 Chocola. . . . . 47.44th. . . Foster . . . . . . 35.4 Souder . . . . . 62.35th. . . Goodnight . . . 37.5 Buyer . . . . . . 60.96th. . . Griesey . . . . . 26.4 Burton. . . . . . 70.37th. . . Graf . . . . . . . 31.8 Kerns . . . . . . 64.88th. . . Perry. . . . . . . 45.3 Hostettler . . . . 52.79th. . . Hill . . . . . . . . 54.2 Bailey . . . . . . 43.810th . . Carson . . . . . 58.5 Scott . . . . . . . 39.7
IA . . . . . (X) . . . . . . . . (X) (X) . . . . . . . . (X)1st . . . Simpson . . . . 36.1 Leach . . . . . . 61.82d . . . Smith . . . . . . 43.7 Nussle. . . . . . 55.43d . . . Boswell . . . . . 62.8 Marcus . . . . . 33.74th. . . Huston . . . . . 36.7 Ganske . . . . . 61.45th. . . Palecek . . . . . 29.2 Latham . . . . . 68.8
KS . . . . (X) . . . . . . . . (X) (X) . . . . . . . . (X)1st . . . (1) . . . . . . . . (1) Moran . . . . . . 89.32d . . . Wiles . . . . . . 29.3 Ryun. . . . . . . 67.43d . . . Moore . . . . . . 50.0 Kline . . . . . . . 46.94th. . . Nolla . . . . . . . 42.0 Tiahrt . . . . . . 54.4
KY . . . . (X) . . . . . . . . (X) (X) . . . . . . . . (X)1st . . . Roy . . . . . . . 42.0 Whitfield . . . . 58.02d . . . Pedigo . . . . . 31.4 Lewis . . . . . . 67.73d . . . Jordan . . . . . 44.2 Northup . . . . . 52.94th. . . Lucas . . . . . . 54.3 Bell. . . . . . . . 43.55th. . . Bailey . . . . . . 26.4 Rogers . . . . . 73.66th. . . Baesler . . . . . 34.8 Fletcher . . . . . 52.8
LA 3 . . . (X) . . . . . . . . (X) (X) . . . . . . . . (X)1st . . . Armato . . . . . 12.6 Vitter. . . . . . . 80.52d . . . Jefferson . . . . (3) (1) . . . . . . . . (1)3d . . . (1) . . . . . . . . (1) Tauzin . . . . . . 78.04th. . . Green . . . . . . 25.1 McCrery . . . . 70.55th. . . Beall . . . . . . . 23.9 Cooksey . . . . 69.16th. . . Rogillio . . . . . 29.7 Baker . . . . . . 68.07th. . . John . . . . . . . 83.3 (1) . . . . . . . . (1)
ME . . . . (X) . . . . . . . . (X) (X) . . . . . . . . (X)1st . . . Allen . . . . . . . 59.8 Amero. . . . . . 36.52d . . . Baldacci . . . . 73.4 Campbell . . . . 26.6
MD . . . . (X) . . . . . . . . (X) (X) . . . . . . . . (X)1st . . . Bozman. . . . . 35.5 Gilchrest . . . . 64.42d . . . Bosley. . . . . . 31.3 Ehrlich. . . . . . 68.63d . . . Cardin . . . . . . 75.7 Harby . . . . . . 24.04th. . . Wynn . . . . . . 87.2 Kimble. . . . . . 12.65th. . . Hoyer . . . . . . 65.1 Hutchins . . . . 34.96th. . . DeArmon . . . . 39.3 Bartlett . . . . . 60.67th. . . Cummings . . . 87.1 Kondner . . . . 12.88th. . . Lierman. . . . . 45.5 Morella . . . . . 52.0
MA . . . . (X) . . . . . . . . (X) (X) . . . . . . . . (X)1st . . . Olver. . . . . . . 65.3 Abair. . . . . . . 28.42d . . . Neal . . . . . . . 77.5 (1) . . . . . . . . (1)3d . . . McGovern . . . 76.5 (1) . . . . . . . . (1)
Stateand
district
Democratic candidate Republican candidate
Name Percentof total Name Percent
of total
4th. . . Frank . . . . . . 70.8 Travis . . . . . . 20.05th. . . Meehan. . . . . 74.4 (1) . . . . . . . . (1)6th. . . Tierney . . . . . 67.6 McCarthy. . . . 27.57th. . . Markey . . . . . 75.6 (1) . . . . . . . . (1)8th. . . Capuano . . . . 71.0 (1) . . . . . . . . (1)9th. . . Moakley. . . . . 71.2 Jeghelian. . . . 18.010th . . Delahunt . . . . 70.5 Bleicken . . . . 24.4
MI. . . . . (X) . . . . . . . . (X) (X) . . . . . . . . (X)1st . . . Stupak . . . . . 58.4 Yob. . . . . . . . 40.42d . . . Shrauger . . . . 33.2 Hoekstra . . . . 64.43d . . . Steele . . . . . . 33.1 Ehlers . . . . . . 65.04th. . . Hollenbeck. . . 29.1 Camp . . . . . . 68.05th. . . Barcia . . . . . . 74.3 Actis . . . . . . . 23.96th. . . Bupp. . . . . . . 29.2 Upton . . . . . . 67.97th. . . Crittendon . . . 35.7 Smith . . . . . . 61.18th. . . Byrum . . . . . . 48.7 Rogers . . . . . 48.89th. . . Kildee . . . . . . 61.1 Garrett . . . . . 35.910th . . Bonior . . . . . . 64.4 Turner . . . . . . 33.211th . . Frumin . . . . . 40.5 Knollenberg . . 55.812th . . Levin . . . . . . 64.3 Baron . . . . . . 32.113th . . Rivers . . . . . . 64.7 Berry. . . . . . . 32.114th . . Conyers Jr. . . 89.1 Ashe. . . . . . . 9.315th . . Kilpatrick . . . . 88.6 Boyd-Fields . . 9.016th . . Dingell. . . . . . 71.0 Morse . . . . . . 26.5
MN . . . . (X) . . . . . . . . (X) (X) . . . . . . . . (X)1st . . . Rieder . . . . . . 41.6 Gutknecht . . . 56.42d . . . Minge . . . . . . 48.0 Kennedy . . . . 48.13d . . . Shuff. . . . . . . 29.8 Ramstad . . . . 67.64th. . . McCollum . . . 48.0 Runbeck . . . . 30.95th. . . Sabo. . . . . . . 69.2 Taylor . . . . . . 22.86th. . . Luther . . . . . . 49.6 Kline . . . . . . . 48.07th. . . Peterson . . . . 68.7 Menze. . . . . . 29.38th. . . Oberstar . . . . 67.8 Lemen . . . . . 25.8
MS . . . . (X) . . . . . . . . (X) (X) . . . . . . . . (X)1st . . . Grist . . . . . . . 28.6 Wicker. . . . . . 69.82d . . . Thompson . . . 65.1 Caraway . . . . 31.23d . . . Thrash . . . . . 25.7 Pickering . . . . 73.24th. . . Shows. . . . . . 58.1 Lampton . . . . 39.85th. . . Taylor . . . . . . 78.8 McDonnell . . . 18.2
MO . . . . (X) . . . . . . . . (X) (X) . . . . . . . . (X)1st . . . Clay . . . . . . . 75.2 Billingsly . . . . 21.52d . . . House . . . . . . 42.4 Akin . . . . . . . 55.33d . . . Gephardt . . . . 57.8 Federer . . . . . 39.74th. . . Skelton . . . . . 66.9 Noland . . . . . 31.35th. . . McCarthy. . . . 68.8 Gordon . . . . . 28.66th. . . Danner . . . . . 46.8 Graves, Jr. . . . 50.97th. . . Christrup . . . . 23.9 Blunt . . . . . . . 73.98th. . . Camp . . . . . . 28.9 Emerson . . . . 69.39th. . . Carroll . . . . . . 38.3 Hulshof . . . . . 59.3
MT . . . . Keenan . . . . . 46.3 Rehberg . . . . 51.5NE . . . . (X) . . . . . . . . (X) (X) . . . . . . . . (X)
1st . . . Jacobsen. . . . 31.0 Bereuter . . . . 66.22d . . . Kiel. . . . . . . . 31.1 Terry . . . . . . . 65.83d . . . Reynolds . . . . 15.7 Osborne . . . . 82.0
NV . . . . (X) . . . . . . . . (X) (X) . . . . . . . . (X)1st . . . Berkley . . . . . 51.7 Porter . . . . . . 44.22d . . . Cahill . . . . . . 29.8 Gibbons . . . . 64.2
NH . . . . (X) . . . . . . . . (X) (X) . . . . . . . . (X)1st . . . Clark. . . . . . . 45.1 Sununu . . . . . 52.92d . . . Brannen . . . . 40.7 Bass . . . . . . . 56.2
NJ . . . . (X) . . . . . . . . (X) (X) . . . . . . . . (X)1st . . . Andrews . . . . 76.2 Cathcart . . . . 21.22d . . . Janosik . . . . . 31.9 LoBiondo . . . . 66.43d . . . Levin . . . . . . 41.2 Saxton . . . . . 57.34th. . . Gusciora . . . . 35.1 Smith . . . . . . 63.25th. . . Mercurio . . . . 30.4 Roukema. . . . 65.46th. . . Pallone, Jr.. . . 67.5 Kennedy . . . . 29.87th. . . Connelly . . . . 45.6 Ferguson . . . . 51.68th. . . Pascrell Jr. . . . 67.0 Fusco . . . . . . 30.39th. . . Rothman . . . . 67.9 Tedeschi . . . . 30.010th . . Payne . . . . . . 87.5 Weber . . . . . . 12.111th . . Scollo . . . . . . 29.6 Frelinghuysen. 68.012th . . Holt . . . . . . . 48.7 Zimmer . . . . . 48.513th . . Menendez . . . 78.7 de Leon. . . . . 18.6
See footnotes at end of table.
Elections 241
U.S. Census Bureau, Statistical Abstract of the United States: 2001
No. 386. Vote Cast for United States Representatives by Major PoliticalParty—Congressional Districts: 1998—Con.
[See headnote, p. 240]
Stateand
district
Democratic candidate Republican candidate
Name Percentof total Name Percent
of total
NM . . . . (X) . . . . . . . . (X) (X) . . . . . . . . (X)1st . . . Kelly . . . . . . . 43.3 Wilson. . . . . . 50.32d . . . Montoya . . . . 41.9 Skeen . . . . . . 58.13d . . . Udall . . . . . . . 67.2 Lutz . . . . . . . 32.8
NY . . . . (X) . . . . . . . . (X) (X) . . . . . . . . (X)1st . . . Seltzer . . . . . 36.1 Grucci, Jr. . . . 41.22d . . . Israel . . . . . . 40.0 Johnson . . . . 29.13d . . . Lamagna . . . . 32.8 King . . . . . . . 43.84th. . . McCarthy. . . . 50.7 Becker . . . . . 29.85th. . . Ackerman . . . 52.0 Elkowitz. . . . . 22.96th. . . Meeks. . . . . . 66.7 (1) . . . . . . . . (1)7th. . . Crowley. . . . . 51.0 Birtley . . . . . . 16.08th. . . Nadler . . . . . . 61.5 Henry . . . . . . 11.99th. . . Weiner . . . . . 52.3 Dear . . . . . . . 22.210th . . Towns . . . . . . 66.5 Brown . . . . . . 3.811th . . Owens . . . . . 64.0 Cleary . . . . . . 4.312th . . Velazquez . . . 60.9 Markgraf . . . . 7.513th . . Johnstone . . . 27.8 Fossella. . . . . 47.714th . . Maloney . . . . 59.4 Rhodes . . . . . 18.815th . . Rangel . . . . . 70.8 Suero . . . . . . 3.916th . . Serrano . . . . . 71.9 Justice . . . . . 2.817th . . Engel . . . . . . 68.0 McManus. . . . 6.918th . . Lowey . . . . . . 55.6 Vonglis . . . . . 23.219th . . Graham. . . . . 30.7 Kelly . . . . . . . 50.120th . . Feiner . . . . . . 32.6 Gilman . . . . . 50.721st . . McNulty . . . . . 59.0 Pillsworth . . . . 22.622d . . McCallion. . . . 25.6 Sweeney . . . . 54.323d . . Englebrecht . . 17.0 Boehlert . . . . 49.524th . . Tallon . . . . . . 18.8 McHugh. . . . . 58.025th . . Gavin . . . . . . 25.4 Walsh . . . . . . 52.126th . . Hinchey. . . . . 50.7 Moppert. . . . . 31.727th . . Pecoraro . . . . 24.8 Reynolds . . . . 51.228th . . Slaughter . . . . 59.4 Johns . . . . . . 26.329th . . LaFalce . . . . . 46.8 Sommer . . . . 27.930th . . Fee . . . . . . . 25.0 Quinn . . . . . . 45.631st . . Peters . . . . . . 18.9 Houghton. . . . 60.1
NC . . . . (X) . . . . . . . . (X) (X) . . . . . . . . (X)1st . . . Clayton . . . . . 65.6 Kratzer . . . . . 32.92d . . . Etheridge. . . . 58.3 Haynes . . . . . 40.93d . . . McNairy. . . . . 37.3 Jones . . . . . . 61.44th. . . Price. . . . . . . 61.6 Ward. . . . . . . 36.65th. . . (1) . . . . . . . . (1) Burr . . . . . . . 92.86th. . . (1) . . . . . . . . (1) Coble . . . . . . 91.07th. . . McIntyre . . . . 69.7 Adams . . . . . 28.98th. . . Taylor . . . . . . 44.0 Hayes . . . . . . 55.09th. . . McGuire . . . . 30.0 Myrick . . . . . . 68.610th . . Parker . . . . . . 29.5 Ballenger . . . . 68.211th . . Neill . . . . . . . 42.1 Taylor . . . . . . 55.112th . . Watt . . . . . . . 64.8 Mitchell . . . . . 33.3
ND . . . . (1) . . . . . . . . (1) Dorso . . . . . . 44.5OH . . . . (X) . . . . . . . . (X) (X) . . . . . . . . (X)
1st . . . Cranley . . . . . 44.6 Chabot . . . . . 53.02d . . . Sanders . . . . 23.1 Portman . . . . 73.63d . . . Hall. . . . . . . . 83.0 (1) . . . . . . . . (1)4th. . . Dickman . . . . 29.0 Oxley . . . . . . 67.45th. . . Edmon . . . . . 25.5 Gillmor . . . . . 69.86th. . . Strickland. . . . 57.7 Azinger . . . . . 40.37th. . . Minor . . . . . . 25.1 Hobson . . . . . 67.68th. . . Parks . . . . . . 26.2 Boehner . . . . 71.09th. . . Kaptur . . . . . . 74.8 Bryan . . . . . . 21.910th . . Kucinich . . . . 75.0 Smith . . . . . . 22.011th . . Tubbs Jones . 84.8 Sykora . . . . . 11.212th . . O’Shaughnessy. 43.8 Tiberi . . . . . . 52.9
Stateand
district
Democratic candidate Republican candidate
Name Percentof total Name Percent
of total
13th . . Brown . . . . . . 64.6 Jeric . . . . . . . 32.014th . . Sawyer . . . . . 64.8 Wood . . . . . . 31.015th . . Buckel. . . . . . 27.9 Pryce . . . . . . 67.516th . . Smith . . . . . . 26.8 Regula . . . . . 69.217th . . Traficant . . . . 50.0 Alberty . . . . . 22.718th . . Guthrie . . . . . 33.5 Ney . . . . . . . 64.419th . . Blanchard . . . 31.9 LaTourette . . . 64.8
OK . . . . (X) . . . . . . . . (X) (X) . . . . . . . . (X)1st . . . Lowe . . . . . . 29.2 Largent . . . . . 69.32d . . . Carson . . . . . 54.9 Ewing . . . . . . 41.83d . . . (1) . . . . . . . . (1) Watkins . . . . . 86.64th. . . Weatherford . . 31.2 Watts, Jr. . . . . 64.95th. . . McWatters . . . 27.2 Istook, Jr.. . . . 68.46th. . . Beutler . . . . . 39.2 Lucas . . . . . . 59.3
OR . . . . (X) . . . . . . . . (X) (X) . . . . . . . . (X)1st . . . Wu . . . . . . . . 58.3 Starr . . . . . . . 38.02d . . . Ponsford . . . . 26.1 Walden . . . . . 73.63d . . . Blumenauer . . 66.8 Pollock . . . . . 23.64th. . . DeFazio. . . . . 68.0 Lindsey . . . . . 30.65th. . . Hooley . . . . . 56.8 Boquist . . . . . 43.1
PA . . . . (X) . . . . . . . . (X) (X) . . . . . . . . (X)1st . . . Brady . . . . . . 88.3 Kush. . . . . . . 11.72d . . . Fattah . . . . . . 98.0 (1) . . . . . . . . (1)3d . . . Borski . . . . . . 68.7 Dougherty . . . 31.34th. . . Van Horne . . . 41.0 Hart . . . . . . . 59.05th. . . (1) . . . . . . . . (1) Peterson . . . . 85.66th. . . Holden . . . . . 66.3 Kopel . . . . . . 33.77th. . . Lennon . . . . . 35.2 Weldon . . . . . 64.88th. . . Strouse . . . . . 38.7 Greenwood . . 59.29th. . . (1) . . . . . . . . (1) Shuster . . . . . 100.010th . . Casey . . . . . . 47.4 Sherwood . . . 52.611th . . Kanjorski . . . . 66.4 Urban . . . . . . 33.612th . . Murtha . . . . . 70.8 Choby . . . . . . 27.513th . . Hoeffel . . . . . 52.8 Greenleaf . . . 45.714th . . Coyne . . . . . . 100.0 (1) . . . . . . . . (1)15th . . O’Brien . . . . . 46.7 Toomey . . . . . 53.316th . . Yorczyk . . . . . 33.1 Pitts . . . . . . . 66.917th . . Herrmann . . . 28.5 Gekas . . . . . . 71.518th . . Doyle . . . . . . 69.4 Stephens . . . . 30.619th . . Sanders . . . . 26.5 Platts . . . . . . 72.620th . . Mascara . . . . 64.4 Davis . . . . . . 35.621st . . Flitter . . . . . . 39.2 English . . . . . 60.8
RI . . . . . (X) . . . . . . . . (X) (X) . . . . . . . . (X)1st . . . Kennedy . . . . 66.6 Cabral . . . . . . 33.22d . . . Langevin . . . . 62.2 Tingle . . . . . . 14.0
SC . . . . (X) . . . . . . . . (X) (X) . . . . . . . . (X)1st . . . Brack . . . . . . 35.7 Brown . . . . . . 60.32d . . . Frederick . . . . 40.8 Spence . . . . . 57.03d . . . Brightharp . . . 29.3 Graham. . . . . 67.84th. . . (1) . . . . . . . . - DeMint . . . . . 79.65th. . . Spratt . . . . . . 58.8 Gullick. . . . . . 39.56th. . . Clyburn . . . . . 71.8 Ellison. . . . . . 26.0
SD . . . . Hohn . . . . . . 24.9 Thune . . . . . . 73.4TN . . . . (X) . . . . . . . . (X) (X) . . . . . . . . (X)
1st . . . (1) . . . . . . . . (1) Jenkins . . . . . 100.02d . . . (1) . . . . . . . . (1) Duncan, Jr. . . 89.33d . . . Callaway . . . . 34.6 Wamp . . . . . . 63.94th. . . Dunaway . . . . 33.1 Hilleary . . . . . 65.85th. . . Clement. . . . . 72.5 Scott . . . . . . . 24.56th. . . Gordon . . . . . 62.1 Charles . . . . . 35.77th. . . Sims . . . . . . . 29.1 Bryant . . . . . . 69.68th. . . Tanner . . . . . 72.3 Yancy . . . . . . 27.79th. . . Ford, Jr.. . . . . 100.0 (1) . . . . . . . . (1)
See footnotes at end of table.
242 Elections
U.S. Census Bureau, Statistical Abstract of the United States: 2001

No. 386. Vote Cast for United States Representatives by Major PoliticalParty—Congressional Districts: 2000—Con.
[See headnote, p. 240]
Stateand
district
Democratic candidate Republican candidate
Name Percentof total Name Percent
of total
TX . . . . (X) . . . . . . . . (X) (X) . . . . . . . . (X)1st . . . Sandlin . . . . . 55.8 Willingham . . . 43.42d . . . Turner . . . . . . 91.1 (1) . . . . . . . . (1)3d . . . Zachary. . . . . 25.7 Johnson . . . . 71.64th. . . Hall. . . . . . . . 60.3 Newton . . . . . 37.95th. . . Coggins. . . . . 44.4 Sessions . . . . 54.06th. . . (1) . . . . . . . . (1) Barton. . . . . . 88.17th. . . Sell. . . . . . . . 24.4 Culberson . . . 73.98th. . . (1) . . . . . . . . (1) Brady . . . . . . 91.69th. . . Lampson . . . . 59.2 Williams. . . . . 39.710th . . Doggett . . . . . 84.6 (1) . . . . . . . . (1)11th . . Edwards . . . . 54.8 Farley . . . . . . 44.312th . . Greene . . . . . 36.0 Granger. . . . . 62.713th . . Clinesmith . . . 31.1 Thornberry . . . 67.614th . . Sneary . . . . . 40.3 Paul . . . . . . . 59.715th . . Hinojosa . . . . 88.5 (1) . . . . . . . . (1)16th . . Reyes . . . . . . 68.3 Power . . . . . . 30.217th . . Stenholm . . . . 59.0 Clements . . . . 35.518th . . Jackson-Lee. . 76.5 Levy . . . . . . . 22.219th . . (1) . . . . . . . . (1) Combest . . . . 91.620th . . Gonzalez . . . . 87.7 (1) . . . . . . . . (1)21st . . Green . . . . . . 22.2 Smith . . . . . . 75.922d . . Matranga . . . . 36.2 DeLay . . . . . . 60.423d . . Garza . . . . . . 38.8 Bonilla. . . . . . 59.324th . . Frost . . . . . . . 61.8 Wright . . . . . . 36.725th . . Bentsen. . . . . 60.1 Sudan . . . . . . 38.526th . . Love . . . . . . . 25.6 Armey . . . . . . 72.527th . . Ortiz . . . . . . . 63.4 Ahumada. . . . 33.928th . . Rodriguez . . . 89.0 (1) . . . . . . . . (1)29th . . Green . . . . . . 73.3 Vu . . . . . . . . 25.630th . . Johnson . . . . 91.8 (1) . . . . . . . . (1)
UT . . . . (X) . . . . . . . . (X) (X) . . . . . . . . (X)1st . . . Collinwood . . . 27.2 Hansen . . . . . 69.02d . . . Matheson . . . 55.9 Smith . . . . . . 41.33d . . . Dunn . . . . . . 37.3 Cannon . . . . . 58.5
VT10 . . .Diamond-stone . . . . . . 5.3 Kerin. . . . . . . 18.3
VA . . . . (X) . . . . . . . . (X) (X) . . . . . . . . (X)
Stateand
district
Democratic candidate Republican candidate
Name Percentof total Name Percent
of total
1st . . . Davies. . . . . . 37.0 Davis . . . . . . 57.52d . . . Wagner . . . . . 48.0 Schrock. . . . . 52.03d . . . Scott . . . . . . . 97.7 (1) . . . . . . . . (1)4th. . . Sisisky . . . . . 98.9 (1) . . . . . . . . (1)5th. . . Boyd, Jr. . . . . 30.7 (1) . . . . . . . . (1)6th. . . (1) . . . . . . . . (1) Goodlatte. . . . 99.37th. . . Stewart . . . . . 33.0 Cantor. . . . . . 66.98th. . . Moran . . . . . . 63.3 Miller. . . . . . . 34.19th. . . Boucher . . . . 69.8 Osborne . . . . 30.110th . . (1) . . . . . . . . (1) Wolf . . . . . . . 84.211th . . Corrigan . . . . 34.3 Davis . . . . . . 61.9
WA . . . . (X) . . . . . . . . (X) (X) . . . . . . . . (X)1st . . . Inslee . . . . . . 54.6 McDonald . . . 42.62d . . . Larsen . . . . . 50.0 Koster . . . . . . 45.93d . . . Baird. . . . . . . 56.4 Matson . . . . . 40.64th. . . Davis . . . . . . 37.3 Hastings . . . . 60.95th. . . Keefe . . . . . . 38.9 Nethercutt, Jr. . 57.36th. . . Dicks . . . . . . 64.7 Lawrence. . . . 31.17th. . . McDermott . . . 72.8 (1) . . . . . . . . (1)
8th. . .Behrens-Benedict . . . . 35.6 Dunn . . . . . . 62.2
9th. . . Smith . . . . . . 61.7 Vance . . . . . . 35.0WV . . . . (X) . . . . . . . . (X) (X) . . . . . . . . (X)
1st . . . Mollohan . . . . 87.8 (1) . . . . . . . . (1)2d . . . Humphreys . . 45.9 Capito . . . . . . 48.53d . . . Rahall II. . . . . 91.3 (1) . . . . . . . . (1)
WI. . . . . (X) . . . . . . . . (X) (X) . . . . . . . . (X)1st . . . Thomas. . . . . 33.3 Ryan. . . . . . . 66.62d . . . Baldwin . . . . . 51.4 (1) . . . . . . . . (1)3d . . . Kind . . . . . . . 63.7 Tully . . . . . . . 35.94th. . . Kleczka . . . . . 60.8 Riener . . . . . . 37.85th. . . Barrett. . . . . . 77.7 Smith . . . . . . 22.06th. . . Flaherty . . . . . 34.9 Petri . . . . . . . 65.07th. . . Obey . . . . . . 63.3 Cronin . . . . . . 36.78th. . . Reich . . . . . . 25.3 Green . . . . . . 74.6
9th. . . Clawson . . . . 25.9Sensenbren-ner, Jr. . . . . . 74.0
WY . . . . Green . . . . . . 28.6 Cubin . . . . . . 66.8
- Represents zero. X Not applicable. 1 No candidate. 2 According to state law, it is not required to tabulate votes forunopposed candidates. 3 Louisiana holds an open-primary election with candidates from all parties running on the same ballot.Any candidate who receives a majority is elected; if no candidate receives 50 percent, there is a run-off election in Novemberbetween the top two finishers.
Source: Congressional Quarterly Inc., Congressional Quarterly Weekly Report (copyright).
No. 387. Composition of Congress by Political Party: 1973 to 2001
[D=Democratic, R=Republican. Data for beginning of first session of each Congress (as of January 3), except as noted. Excludesvacancies at beginning of session]
Year Party and President CongressHouse Senate
Majorityparty
Minorityparty Other
Majorityparty
Minorityparty Other
1973 1 2 . . . . . . . . . R (Nixon) . . . . . . . . . . . 93d. . . . . . . . . . . . D-239 R-192 1 D-56 R-42 21975 3 . . . . . . . . . . R (Ford) . . . . . . . . . . . 94th . . . . . . . . . . . D-291 R-144 - D-60 R-37 21977 4 . . . . . . . . . . D (Carter) . . . . . . . . . . 95th . . . . . . . . . . . D-292 R-143 - D-61 R-38 11979 4 . . . . . . . . . . D (Carter) . . . . . . . . . . 96th . . . . . . . . . . . D-276 R-157 - D-58 R-41 11981 4 . . . . . . . . . . R (Reagan) . . . . . . . . . 97th . . . . . . . . . . . D-243 R-192 - R-53 D-46 11983 . . . . . . . . . . . R (Reagan) . . . . . . . . . 98th . . . . . . . . . . . D-269 R-165 - R-54 D-46 -1985 . . . . . . . . . . . R (Reagan) . . . . . . . . . 99th . . . . . . . . . . . D-252 R-182 - R-53 D-47 -1987 . . . . . . . . . . . R (Reagan) . . . . . . . . . 100th . . . . . . . . . . D-258 R-177 - D-55 R-45 -1989 . . . . . . . . . . . R (Bush) . . . . . . . . . . . 101st . . . . . . . . . . D-259 R-174 - D-55 R-45 -1991 5 . . . . . . . . . . R (Bush) . . . . . . . . . . . 102d . . . . . . . . . . . D-267 R-167 1 D-56 R-44 -1993 5 . . . . . . . . . . D (Clinton) . . . . . . . . . . 103d . . . . . . . . . . . D-258 R-176 1 D-57 R-43 -1995 5 . . . . . . . . . . D (Clinton) . . . . . . . . . . 104th . . . . . . . . . . R-230 D-204 1 R-52 D-48 -1996 5 . . . . . . . . . . D (Clinton) . . . . . . . . . . 104th . . . . . . . . . . R-236 D-197 1 R-53 D-46 -1997 5 6 . . . . . . . . . D (Clinton) . . . . . . . . . . 105th . . . . . . . . . . R-226 D-207 2 R-55 D-45 -1999 . . . . . . . . . . . D (Clinton) . . . . . . . . . . 106th . . . . . . . . . . R-222 D-212 - R-54 D-45 12001 . . . . . . . . . . . R (Bush) . . . . . . . . . . . 107th . . . . . . . . . . R-221 D-210 2 D-50 R-49 1
- Represents zero. 1 Senate had one Independent and one Conservative-Republican. 2 House had one Independent-Democrat. 3 Senate had one Independent, one Conservative-Republican, and one undecided (New Hampshire). 4 Senate hadone Independent. 5 House had one Independent-Socialist. 6 As of beginning of second session.
Source: U.S. Congress, Joint Committee on Printing, Congressional Directory, annual; beginning 1977, biennial.
Elections 243
U.S. Census Bureau, Statistical Abstract of the United States: 2001
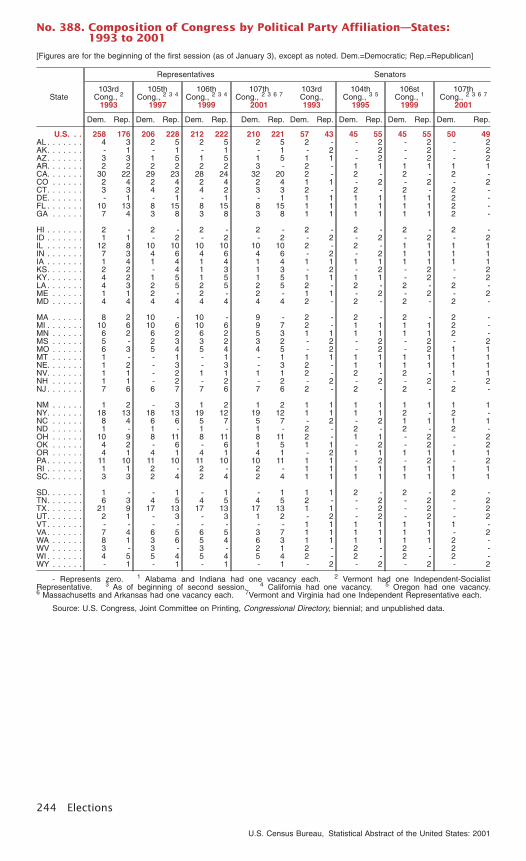
No. 388. Composition of Congress by Political Party Affiliation—States:1993 to 2001
[Figures are for the beginning of the first session (as of January 3), except as noted. Dem.=Democratic; Rep.=Republican]
State
Representatives Senators
103rdCong., 2
1993
105thCong., 2 3 4
1997
106thCong., 2 3 4
1999
107thCong., 2 3 6 7
2001
103rdCong.,1993
104thCong., 3 5
1995
106stCong., 1
1999
107thCong., 2 3 6 7
2001
Dem. Rep. Dem. Rep. Dem. Rep. Dem. Rep. Dem. Rep. Dem. Rep. Dem. Rep. Dem. Rep.
U.S. . . 258 176 206 228 212 222 210 221 57 43 45 55 45 55 50 49AL . . . . . . . 4 3 2 5 2 5 2 5 2 - - 2 - 2 - 2AK. . . . . . . - 1 - 1 - 1 - 1 - 2 - 2 - 2 - 2AZ. . . . . . . 3 3 1 5 1 5 1 5 1 1 - 2 - 2 - 2AR. . . . . . . 2 2 2 2 2 2 3 - 2 - 1 1 1 1 1 1CA. . . . . . . 30 22 29 23 28 24 32 20 2 - 2 - 2 - 2 -CO . . . . . . 2 4 2 4 2 4 2 4 1 1 - 2 - 2 - 2CT. . . . . . . 3 3 4 2 4 2 3 3 2 - 2 - 2 - 2 -DE. . . . . . . - 1 - 1 - 1 - 1 1 1 1 1 1 1 2 -FL . . . . . . . 10 13 8 15 8 15 8 15 1 1 1 1 1 1 2 -GA . . . . . . 7 4 3 8 3 8 3 8 1 1 1 1 1 1 2 -
HI . . . . . . . 2 - 2 - 2 - 2 - 2 - 2 - 2 - 2 -ID . . . . . . . 1 1 - 2 - 2 - 2 - 2 - 2 - 2 - 2IL . . . . . . . 12 8 10 10 10 10 10 10 2 - 2 - 1 1 1 1IN . . . . . . . 7 3 4 6 4 6 4 6 - 2 - 2 1 1 1 1IA . . . . . . . 1 4 1 4 1 4 1 4 1 1 1 1 1 1 1 1KS. . . . . . . 2 2 - 4 1 3 1 3 - 2 - 2 - 2 - 2KY. . . . . . . 4 2 1 5 1 5 1 5 1 1 1 1 - 2 - 2LA . . . . . . . 4 3 2 5 2 5 2 5 2 - 2 - 2 - 2 -ME . . . . . . 1 1 2 - 2 - 2 - 1 1 - 2 - 2 - 2MD . . . . . . 4 4 4 4 4 4 4 4 2 - 2 - 2 - 2 -
MA . . . . . . 8 2 10 - 10 - 9 - 2 - 2 - 2 - 2 -MI . . . . . . . 10 6 10 6 10 6 9 7 2 - 1 1 1 1 2 -MN . . . . . . 6 2 6 2 6 2 5 3 1 1 1 1 1 1 2 -MS . . . . . . 5 - 2 3 3 2 3 2 - 2 - 2 - 2 - 2MO . . . . . . 6 3 5 4 5 4 4 5 - 2 - 2 - 2 1 1MT . . . . . . 1 - - 1 - 1 - 1 1 1 1 1 1 1 1 1NE. . . . . . . 1 2 - 3 - 3 - 3 2 - 1 1 1 1 1 1NV. . . . . . . 1 1 - 2 1 1 1 1 2 - 2 - 2 - 1 1NH . . . . . . 1 1 - 2 - 2 - 2 - 2 - 2 - 2 - 2NJ . . . . . . . 7 6 6 7 7 6 7 6 2 - 2 - 2 - 2 -
NM . . . . . . 1 2 - 3 1 2 1 2 1 1 1 1 1 1 1 1NY. . . . . . . 18 13 18 13 19 12 19 12 1 1 1 1 2 - 2 -NC . . . . . . 8 4 6 6 5 7 5 7 - 2 - 2 1 1 1 1ND . . . . . . 1 - 1 - 1 - 1 - 2 - 2 - 2 - 2 -OH . . . . . . 10 9 8 11 8 11 8 11 2 - 1 1 - 2 - 2OK . . . . . . 4 2 - 6 - 6 1 5 1 1 - 2 - 2 - 2OR . . . . . . 4 1 4 1 4 1 4 1 - 2 1 1 1 1 1 1PA. . . . . . . 11 10 11 10 11 10 10 11 1 1 - 2 - 2 - 2RI . . . . . . . 1 1 2 - 2 - 2 - 1 1 1 1 1 1 1 1SC. . . . . . . 3 3 2 4 2 4 2 4 1 1 1 1 1 1 1 1
SD. . . . . . . 1 - - 1 - 1 - 1 1 1 2 - 2 - 2 -TN. . . . . . . 6 3 4 5 4 5 4 5 2 - - 2 - 2 - 2TX. . . . . . . 21 9 17 13 17 13 17 13 1 1 - 2 - 2 - 2UT. . . . . . . 2 1 - 3 - 3 1 2 - 2 - 2 - 2 - 2VT. . . . . . . - - - - - - - - 1 1 1 1 1 1 1 -VA. . . . . . . 7 4 6 5 6 5 3 7 1 1 1 1 1 1 - 2WA . . . . . . 8 1 3 6 5 4 6 3 1 1 1 1 1 1 2 -WV . . . . . . 3 - 3 - 3 - 2 1 2 - 2 - 2 - 2 -WI . . . . . . . 4 5 5 4 5 4 5 4 2 - 2 - 2 - 2 -WY . . . . . . - 1 - 1 - 1 - 1 - 2 - 2 - 2 - 2
- Represents zero. 1 Alabama and Indiana had one vacancy each. 2 Vermont had one Independent-SocialistRepresentative. 3 As of beginning of second session. 4 California had one vacancy. 5 Oregon had one vacancy.6 Massachusetts and Arkansas had one vacancy each. 7Vermont and Virginia had one Independent Representative each.
Source: U.S. Congress, Joint Committee on Printing, Congressional Directory, biennial; and unpublished data.
244 Elections
U.S. Census Bureau, Statistical Abstract of the United States: 2001
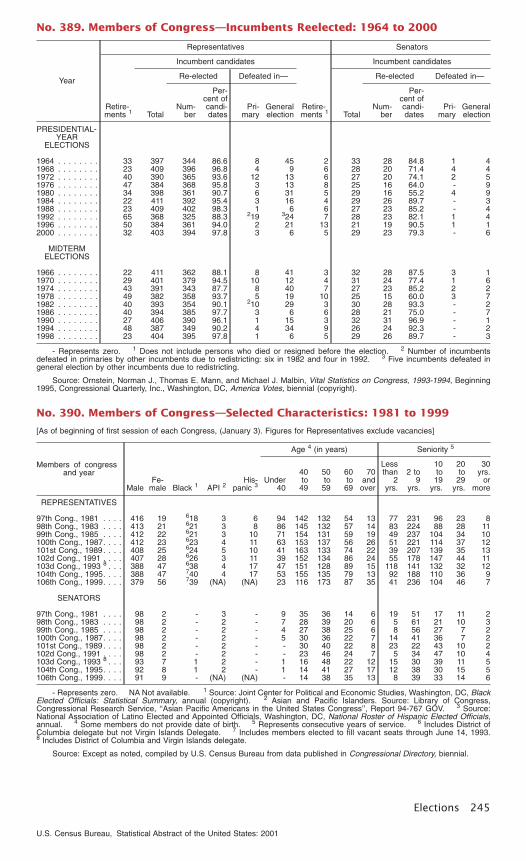
No. 389. Members of Congress—Incumbents Reelected: 1964 to 2000
Year
Representatives Senators
Retire-ments 1
Incumbent candidates
Retire-ments 1
Incumbent candidates
Total
Re-elected Defeated in—
Total
Re-elected Defeated in—
Num-ber
Per-cent ofcandi-dates
Pri-mary
Generalelection
Num-ber
Per-cent ofcandi-dates
Pri-mary
Generalelection
PRESIDENTIAL-YEAR
ELECTIONS
1964 . . . . . . . . 33 397 344 86.6 8 45 2 33 28 84.8 1 41968 . . . . . . . . 23 409 396 96.8 4 9 6 28 20 71.4 4 41972 . . . . . . . . 40 390 365 93.6 12 13 6 27 20 74.1 2 51976 . . . . . . . . 47 384 368 95.8 3 13 8 25 16 64.0 - 91980 . . . . . . . . 34 398 361 90.7 6 31 5 29 16 55.2 4 91984 . . . . . . . . 22 411 392 95.4 3 16 4 29 26 89.7 - 31988 . . . . . . . . 23 409 402 98.3 1 6 6 27 23 85.2 - 41992 . . . . . . . . 65 368 325 88.3 219 324 7 28 23 82.1 1 41996 . . . . . . . . 50 384 361 94.0 2 21 13 21 19 90.5 1 12000 . . . . . . . . 32 403 394 97.8 3 6 5 29 23 79.3 - 6
MIDTERMELECTIONS
1966 . . . . . . . . 22 411 362 88.1 8 41 3 32 28 87.5 3 11970 . . . . . . . . 29 401 379 94.5 10 12 4 31 24 77.4 1 61974 . . . . . . . . 43 391 343 87.7 8 40 7 27 23 85.2 2 21978 . . . . . . . . 49 382 358 93.7 5 19 10 25 15 60.0 3 71982 . . . . . . . . 40 393 354 90.1 210 29 3 30 28 93.3 - 21986 . . . . . . . . 40 394 385 97.7 3 6 6 28 21 75.0 - 71990 . . . . . . . . 27 406 390 96.1 1 15 3 32 31 96.9 - 11994 . . . . . . . . 48 387 349 90.2 4 34 9 26 24 92.3 - 21998 . . . . . . . . 23 404 395 97.8 1 6 5 29 26 89.7 - 3
- Represents zero. 1 Does not include persons who died or resigned before the election. 2 Number of incumbentsdefeated in primaries by other incumbents due to redistricting: six in 1982 and four in 1992. 3 Five incumbents defeated ingeneral election by other incumbents due to redistricting.
Source: Ornstein, Norman J., Thomas E. Mann, and Michael J. Malbin, Vital Statistics on Congress, 1993-1994, Beginning1995, Congressional Quarterly, Inc., Washington, DC, America Votes, biennial (copyright).
No. 390. Members of Congress—Selected Characteristics: 1981 to 1999
[As of beginning of first session of each Congress, (January 3). Figures for Representatives exclude vacancies]
Members of congressand year
MaleFe-
male Black 1 API 2His-
panic 3
Age 4 (in years) Seniority 5
Under40
40to49
50to59
60to69
70andover
Lessthan
2yrs.
2 to9
yrs.
10to19
yrs.
20to29
yrs.
30yrs.
ormore
REPRESENTATIVES
97th Cong., 1981 . . . . 416 19 618 3 6 94 142 132 54 13 77 231 96 23 898th Cong., 1983 . . . . 413 21 621 3 8 86 145 132 57 14 83 224 88 28 1199th Cong., 1985 . . . . 412 22 621 3 10 71 154 131 59 19 49 237 104 34 10100th Cong., 1987. . . . 412 23 623 4 11 63 153 137 56 26 51 221 114 37 12101st Cong., 1989. . . . 408 25 624 5 10 41 163 133 74 22 39 207 139 35 13102d Cong., 1991 . . . . 407 28 626 3 11 39 152 134 86 24 55 178 147 44 11103d Cong., 1993 8 . . . 388 47 638 4 17 47 151 128 89 15 118 141 132 32 12104th Cong., 1995. . . . 388 47 740 4 17 53 155 135 79 13 92 188 110 36 9106th Cong., 1999. . . . 379 56 739 (NA) (NA) 23 116 173 87 35 41 236 104 46 7
SENATORS
97th Cong., 1981 . . . . 98 2 - 3 - 9 35 36 14 6 19 51 17 11 298th Cong., 1983 . . . . 98 2 - 2 - 7 28 39 20 6 5 61 21 10 399th Cong., 1985 . . . . 98 2 - 2 - 4 27 38 25 6 8 56 27 7 2100th Cong., 1987. . . . 98 2 - 2 - 5 30 36 22 7 14 41 36 7 2101st Cong., 1989. . . . 98 2 - 2 - - 30 40 22 8 23 22 43 10 2102d Cong., 1991 . . . . 98 2 - 2 - - 23 46 24 7 5 34 47 10 4103d Cong., 1993 8 . . . 93 7 1 2 - 1 16 48 22 12 15 30 39 11 5104th Cong., 1995. . . . 92 8 1 2 - 1 14 41 27 17 12 38 30 15 5106th Cong., 1999. . . . 91 9 - (NA) (NA) - 14 38 35 13 8 39 33 14 6
- Represents zero. NA Not available. 1 Source: Joint Center for Political and Economic Studies, Washington, DC, BlackElected Officials: Statistical Summary, annual (copyright). 2 Asian and Pacific Islanders. Source: Library of Congress,Congressional Research Service, ‘‘Asian Pacific Americans in the United States Congress’’, Report 94-767 GOV. 3 Source:National Association of Latino Elected and Appointed Officials, Washington, DC, National Roster of Hispanic Elected Officials,annual. 4 Some members do not provide date of birth. 5 Represents consecutive years of service. 6 Includes District ofColumbia delegate but not Virgin Islands Delegate. 7 Includes members elected to fill vacant seats through June 14, 1993.8 Includes District of Columbia and Virgin Islands delegate.
Source: Except as noted, compiled by U.S. Census Bureau from data published in Congressional Directory, biennial.
Elections 245
U.S. Census Bureau, Statistical Abstract of the United States: 2001
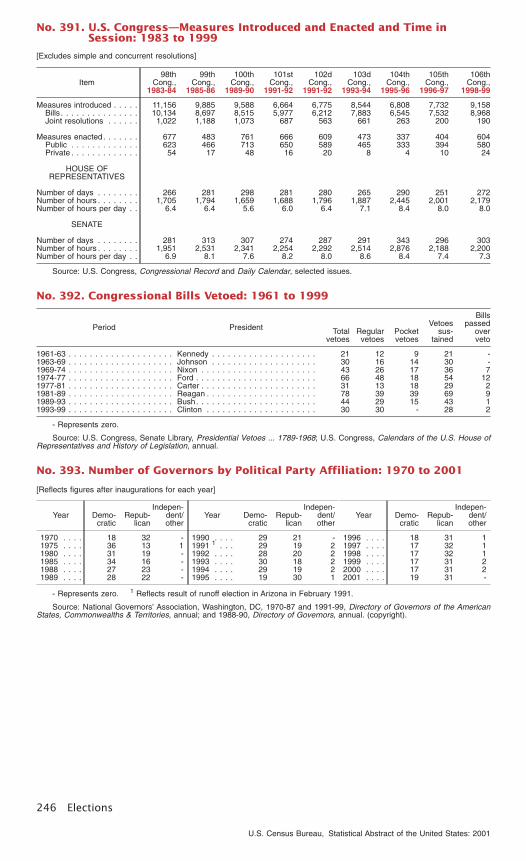
No. 391. U.S. Congress—Measures Introduced and Enacted and Time inSession: 1983 to 1999
[Excludes simple and concurrent resolutions]
Item98th
Cong.,1983-84
99thCong.,
1985-86
100thCong.,
1989-90
101stCong.,
1991-92
102dCong.,
1991-92
103dCong.,
1993-94
104thCong.,
1995-96
105thCong.,
1996-97
106thCong.,
1998-99
Measures introduced . . . . . 11,156 9,885 9,588 6,664 6,775 8,544 6,808 7,732 9,158Bills . . . . . . . . . . . . . . . 10,134 8,697 8,515 5,977 6,212 7,883 6,545 7,532 8,968Joint resolutions . . . . . . 1,022 1,188 1,073 687 563 661 263 200 190
Measures enacted. . . . . . . 677 483 761 666 609 473 337 404 604Public . . . . . . . . . . . . . 623 466 713 650 589 465 333 394 580Private . . . . . . . . . . . . . 54 17 48 16 20 8 4 10 24
HOUSE OFREPRESENTATIVES
Number of days . . . . . . . . 266 281 298 281 280 265 290 251 272Number of hours . . . . . . . . 1,705 1,794 1,659 1,688 1,796 1,887 2,445 2,001 2,179Number of hours per day . . 6.4 6.4 5.6 6.0 6.4 7.1 8.4 8.0 8.0
SENATE
Number of days . . . . . . . . 281 313 307 274 287 291 343 296 303Number of hours . . . . . . . . 1,951 2,531 2,341 2,254 2,292 2,514 2,876 2,188 2,200Number of hours per day . . 6.9 8.1 7.6 8.2 8.0 8.6 8.4 7.4 7.3
Source: U.S. Congress, Congressional Record and Daily Calendar, selected issues.
No. 392. Congressional Bills Vetoed: 1961 to 1999
Period President Totalvetoes
Regularvetoes
Pocketvetoes
Vetoessus-
tained
Billspassed
overveto
1961-63 . . . . . . . . . . . . . . . . . . . . Kennedy . . . . . . . . . . . . . . . . . . . . 21 12 9 21 -1963-69 . . . . . . . . . . . . . . . . . . . . Johnson . . . . . . . . . . . . . . . . . . . . 30 16 14 30 -1969-74 . . . . . . . . . . . . . . . . . . . . Nixon . . . . . . . . . . . . . . . . . . . . . . 43 26 17 36 71974-77 . . . . . . . . . . . . . . . . . . . . Ford . . . . . . . . . . . . . . . . . . . . . . . 66 48 18 54 121977-81 . . . . . . . . . . . . . . . . . . . . Carter . . . . . . . . . . . . . . . . . . . . . . 31 13 18 29 21981-89 . . . . . . . . . . . . . . . . . . . . Reagan . . . . . . . . . . . . . . . . . . . . . 78 39 39 69 91989-93 . . . . . . . . . . . . . . . . . . . . Bush. . . . . . . . . . . . . . . . . . . . . . . 44 29 15 43 11993-99 . . . . . . . . . . . . . . . . . . . . Clinton . . . . . . . . . . . . . . . . . . . . . 30 30 - 28 2
- Represents zero.
Source: U.S. Congress, Senate Library, Presidential Vetoes ... 1789-1968; U.S. Congress, Calendars of the U.S. House ofRepresentatives and History of Legislation, annual.
No. 393. Number of Governors by Political Party Affiliation: 1970 to 2001
[Reflects figures after inaugurations for each year]
Year Demo-cratic
Repub-lican
Indepen-dent/other
1970 . . . . 18 32 -1975 . . . . 36 13 11980 . . . . 31 19 -1985 . . . . 34 16 -1988 . . . . 27 23 -1989 . . . . 28 22 -
Year Demo-cratic
Repub-lican
Indepen-dent/other
1990 . . . . 29 21 -1991 1 . . . 29 19 21992 . . . . 28 20 21993 . . . . 30 18 21994 . . . . 29 19 21995 . . . . 19 30 1
Year Demo-cratic
Repub-lican
Indepen-dent/other
1996 . . . . 18 31 11997 . . . . 17 32 11998 . . . . 17 32 11999 . . . . 17 31 22000 . . . . 17 31 22001 . . . . 19 31 -
- Represents zero. 1 Reflects result of runoff election in Arizona in February 1991.
Source: National Governors’ Association, Washington, DC, 1970-87 and 1991-99, Directory of Governors of the AmericanStates, Commonwealths & Territories, annual; and 1988-90, Directory of Governors, annual. (copyright).
246 Elections
U.S. Census Bureau, Statistical Abstract of the United States: 2001
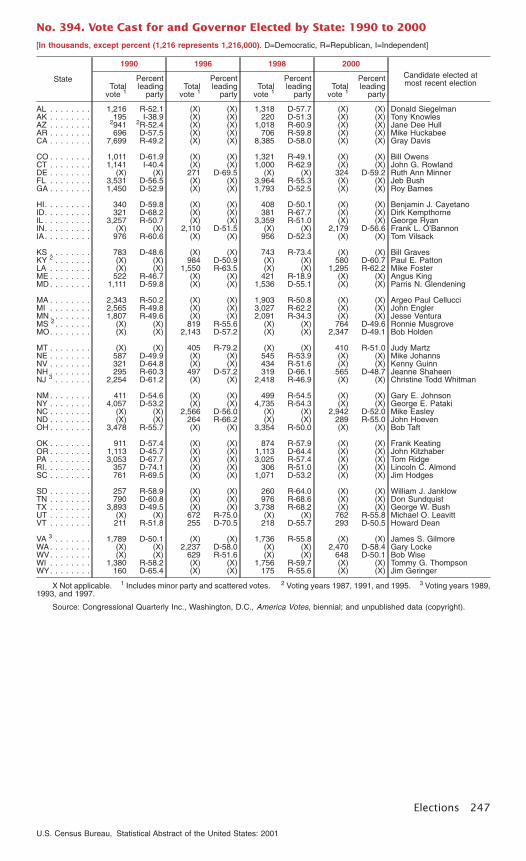
No. 394. Vote Cast for and Governor Elected by State: 1990 to 2000
[In thousands, except percent (1,216 represents 1,216,000). D=Democratic, R=Republican, I=Independent]
State
1990 1996 1998 2000Candidate elected atmost recent electionTotal
vote 1
Percentleading
partyTotal
vote 1
Percentleading
partyTotal
vote 1
Percentleading
partyTotal
vote 1
Percentleading
party
AL . . . . . . . . 1,216 R-52.1 (X) (X) 1,318 D-57.7 (X) (X) Donald SiegelmanAK . . . . . . . . 195 I-38.9 (X) (X) 220 D-51.3 (X) (X) Tony KnowlesAZ . . . . . . . . 2941 2R-52.4 (X) (X) 1,018 R-60.9 (X) (X) Jane Dee HullAR . . . . . . . . 696 D-57.5 (X) (X) 706 R-59.8 (X) (X) Mike HuckabeeCA . . . . . . . . 7,699 R-49.2 (X) (X) 8,385 D-58.0 (X) (X) Gray Davis
CO . . . . . . . . 1,011 D-61.9 (X) (X) 1,321 R-49.1 (X) (X) Bill OwensCT . . . . . . . . 1,141 I-40.4 (X) (X) 1,000 R-62.9 (X) (X) John G. RowlandDE . . . . . . . . (X) (X) 271 D-69.5 (X) (X) 324 D-59.2 Ruth Ann MinnerFL . . . . . . . . 3,531 D-56.5 (X) (X) 3,964 R-55.3 (X) (X) Jeb BushGA . . . . . . . . 1,450 D-52.9 (X) (X) 1,793 D-52.5 (X) (X) Roy Barnes
HI. . . . . . . . . 340 D-59.8 (X) (X) 408 D-50.1 (X) (X) Benjamin J. CayetanoID. . . . . . . . . 321 D-68.2 (X) (X) 381 R-67.7 (X) (X) Dirk KempthorneIL . . . . . . . . . 3,257 R-50.7 (X) (X) 3,359 R-51.0 (X) (X) George RyanIN. . . . . . . . . (X) (X) 2,110 D-51.5 (X) (X) 2,179 D-56.6 Frank L. O’BannonIA. . . . . . . . . 976 R-60.6 (X) (X) 956 D-52.3 (X) (X) Tom Vilsack
KS . . . . . . . . 783 D-48.6 (X) (X) 743 R-73.4 (X) (X) Bill GravesKY 2 . . . . . . . (X) (X) 984 D-50.9 (X) (X) 580 D-60.7 Paul E. PattonLA . . . . . . . . (X) (X) 1,550 R-63.5 (X) (X) 1,295 R-62.2 Mike FosterME . . . . . . . . 522 R-46.7 (X) (X) 421 R-18.9 (X) (X) Angus KingMD . . . . . . . . 1,111 D-59.8 (X) (X) 1,536 D-55.1 (X) (X) Parris N. Glendening
MA . . . . . . . . 2,343 R-50.2 (X) (X) 1,903 R-50.8 (X) (X) Argeo Paul CellucciMI . . . . . . . . 2,565 R-49.8 (X) (X) 3,027 R-62.2 (X) (X) John EnglerMN . . . . . . . . 1,807 R-49.6 (X) (X) 2,091 R-34.3 (X) (X) Jesse VenturaMS 2 . . . . . . . (X) (X) 819 R-55.6 (X) (X) 764 D-49.6 Ronnie MusgroveMO. . . . . . . . (X) (X) 2,143 D-57.2 (X) (X) 2,347 D-49.1 Bob Holden
MT . . . . . . . . (X) (X) 405 R-79.2 (X) (X) 410 R-51.0 Judy MartzNE . . . . . . . . 587 D-49.9 (X) (X) 545 R-53.9 (X) (X) Mike JohannsNV . . . . . . . . 321 D-64.8 (X) (X) 434 R-51.6 (X) (X) Kenny GuinnNH . . . . . . . . 295 R-60.3 497 D-57.2 319 D-66.1 565 D-48.7 Jeanne ShaheenNJ 3 . . . . . . . 2,254 D-61.2 (X) (X) 2,418 R-46.9 (X) (X) Christine Todd Whitman
NM . . . . . . . . 411 D-54.6 (X) (X) 499 R-54.5 (X) (X) Gary E. JohnsonNY . . . . . . . . 4,057 D-53.2 (X) (X) 4,735 R-54.3 (X) (X) George E. PatakiNC . . . . . . . . (X) (X) 2,566 D-56.0 (X) (X) 2,942 D-52.0 Mike EasleyND . . . . . . . . (X) (X) 264 R-66.2 (X) (X) 289 R-55.0 John HoevenOH . . . . . . . . 3,478 R-55.7 (X) (X) 3,354 R-50.0 (X) (X) Bob Taft
OK . . . . . . . . 911 D-57.4 (X) (X) 874 R-57.9 (X) (X) Frank KeatingOR . . . . . . . . 1,113 D-45.7 (X) (X) 1,113 D-64.4 (X) (X) John KitzhaberPA . . . . . . . . 3,053 D-67.7 (X) (X) 3,025 R-57.4 (X) (X) Tom RidgeRI. . . . . . . . . 357 D-74.1 (X) (X) 306 R-51.0 (X) (X) Lincoln C. AlmondSC . . . . . . . . 761 R-69.5 (X) (X) 1,071 D-53.2 (X) (X) Jim Hodges
SD . . . . . . . . 257 R-58.9 (X) (X) 260 R-64.0 (X) (X) William J. JanklowTN . . . . . . . . 790 D-60.8 (X) (X) 976 R-68.6 (X) (X) Don SundquistTX . . . . . . . . 3,893 D-49.5 (X) (X) 3,738 R-68.2 (X) (X) George W. BushUT . . . . . . . . (X) (X) 672 R-75.0 (X) (X) 762 R-55.8 Michael O. LeavittVT . . . . . . . . 211 R-51.8 255 D-70.5 218 D-55.7 293 D-50.5 Howard Dean
VA 3 . . . . . . . 1,789 D-50.1 (X) (X) 1,736 R-55.8 (X) (X) James S. GilmoreWA . . . . . . . . (X) (X) 2,237 D-58.0 (X) (X) 2,470 D-58.4 Gary LockeWV. . . . . . . . (X) (X) 629 R-51.6 (X) (X) 648 D-50.1 Bob WiseWI . . . . . . . . 1,380 R-58.2 (X) (X) 1,756 R-59.7 (X) (X) Tommy G. ThompsonWY. . . . . . . . 160 D-65.4 (X) (X) 175 R-55.6 (X) (X) Jim Geringer
X Not applicable. 1 Includes minor party and scattered votes. 2 Voting years 1987, 1991, and 1995. 3 Voting years 1989,1993, and 1997.
Source: Congressional Quarterly Inc., Washington, D.C., America Votes, biennial; and unpublished data (copyright).
Elections 247
U.S. Census Bureau, Statistical Abstract of the United States: 2001
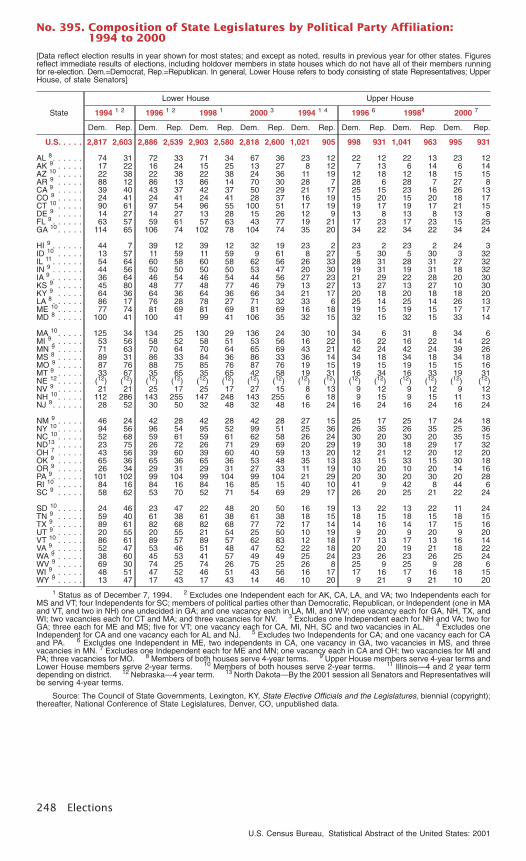
No. 395. Composition of State Legislatures by Political Party Affiliation:1994 to 2000
[Data reflect election results in year shown for most states; and except as noted, results in previous year for other states. Figuresreflect immediate results of elections, including holdover members in state houses which do not have all of their members runningfor re-election. Dem.=Democrat, Rep.=Republican. In general, Lower House refers to body consisting of state Representatives; UpperHouse, of state Senators]
State
Lower House Upper House
1994 1 2 1996 1 2 1998 1 2000 3 1994 1 4 1996 6 19984 2000 7
Dem. Rep. Dem. Rep. Dem. Rep. Dem. Rep. Dem. Rep. Dem. Rep. Dem. Rep. Dem. Rep.
U.S. . . . . 2,817 2,603 2,886 2,539 2,903 2,580 2,818 2,600 1,021 905 998 931 1,041 963 995 931
AL 8 . . . . . . 74 31 72 33 71 34 67 36 23 12 22 12 22 13 23 12AK 9 . . . . . 17 22 16 24 15 25 13 27 8 12 7 13 6 14 6 14AZ 10 . . . . . 22 38 22 38 22 38 24 36 11 19 12 18 12 18 15 15AR 9 . . . . . 88 12 86 13 86 14 70 30 28 7 28 6 28 7 27 8CA 9 . . . . . 39 40 43 37 42 37 50 29 21 17 25 15 23 16 26 13CO 9 . . . . . 24 41 24 41 24 41 28 37 16 19 15 20 15 20 18 17CT 10 . . . . . 90 61 97 54 96 55 100 51 17 19 19 17 19 17 21 15DE 9 . . . . . 14 27 14 27 13 28 15 26 12 9 13 8 13 8 13 8FL 9 . . . . . . 63 57 59 61 57 63 43 77 19 21 17 23 17 23 15 25GA 10 . . . . . 114 65 106 74 102 78 104 74 35 20 34 22 34 22 34 24
HI 9 . . . . . . 44 7 39 12 39 12 32 19 23 2 23 2 23 2 24 3ID 10 . . . . . 13 57 11 59 11 59 9 61 8 27 5 30 5 30 3 32IL 11 . . . . . . 54 64 60 58 60 58 62 56 26 33 28 31 28 31 27 32IN 9 . . . . . . 44 56 50 50 50 50 53 47 20 30 19 31 19 31 18 32IA 9 . . . . . . 36 64 46 54 46 54 44 56 27 23 21 29 22 28 20 30KS 9 . . . . . 45 80 48 77 48 77 46 79 13 27 13 27 13 27 10 30KY 9 . . . . . 64 36 64 36 64 36 66 34 21 17 20 18 20 18 18 20LA 8 . . . . . . 86 17 76 28 78 27 71 32 33 6 25 14 25 14 26 13ME 10. . . . . 77 74 81 69 81 69 81 69 16 18 19 15 19 15 17 17MD 8 . . . . . 100 41 100 41 99 41 106 35 32 15 32 15 32 15 33 14
MA 10. . . . . 125 34 134 25 130 29 136 24 30 10 34 6 31 8 34 6MI 9 . . . . . . 53 56 58 52 58 51 53 56 16 22 16 22 16 22 14 22MN 9 . . . . . 71 63 70 64 70 64 65 69 43 21 42 24 42 24 39 26MS 8 . . . . . 89 31 86 33 84 36 86 33 36 14 34 18 34 18 34 18MO 9 . . . . . 87 76 88 75 85 76 87 76 19 15 19 15 19 15 15 16MT 9 . . . . . 33 67 35 65 35 65 42 58 19 31 16 34 16 33 19 31NE 12 . . . . . (12) (12) (12) (12) (12) (12) (12) (12) (12) (12) (12) (12) (12) (12) (12) (12)NV 9 . . . . . 21 21 25 17 25 17 27 15 8 13 9 12 9 12 9 12NH 10. . . . . 112 286 143 255 147 248 143 255 6 18 9 15 9 15 11 13NJ 9. . . . . . 28 52 30 50 32 48 32 48 16 24 16 24 16 24 16 24
NM 9 . . . . . 46 24 42 28 42 28 42 28 27 15 25 17 25 17 24 18NY 10 . . . . . 94 56 96 54 95 52 99 51 25 36 26 35 26 35 25 36NC 10. . . . . 52 68 59 61 59 61 62 58 26 24 30 20 30 20 35 15ND13 . . . . . 23 75 26 72 26 71 29 69 20 29 19 30 18 29 17 32OH 7 . . . . . 43 56 39 60 39 60 40 59 13 20 12 21 12 20 12 20OK 9 . . . . . 65 36 65 36 65 36 53 48 35 13 33 15 33 15 30 18OR 9 . . . . . 26 34 29 31 29 31 27 33 11 19 10 20 10 20 14 16PA 9. . . . . . 101 102 99 104 99 104 99 104 21 29 20 30 20 30 20 28RI 10 . . . . . 84 16 84 16 84 16 85 15 40 10 41 9 42 8 44 6SC 9 . . . . . 58 62 53 70 52 71 54 69 29 17 26 20 25 21 22 24
SD 10 . . . . . 24 46 23 47 22 48 20 50 16 19 13 22 13 22 11 24TN 9 . . . . . 59 40 61 38 61 38 61 38 18 15 18 15 18 15 18 15TX 9. . . . . . 89 61 82 68 82 68 77 72 17 14 14 16 14 17 15 16UT 9 . . . . . 20 55 20 55 21 54 25 50 10 19 9 20 9 20 9 20VT 10 . . . . . 86 61 89 57 89 57 62 83 12 18 17 13 17 13 16 14VA 9. . . . . . 52 47 53 46 51 48 47 52 22 18 20 20 19 21 18 22WA 9 . . . . . 38 60 45 53 41 57 49 49 25 24 23 26 23 26 25 24WV 9 . . . . . 69 30 74 25 74 26 75 25 26 8 25 9 25 9 28 6WI 9. . . . . . 48 51 47 52 46 51 43 56 16 17 17 16 17 16 18 15WY 9 . . . . . 13 47 17 43 17 43 14 46 10 20 9 21 9 21 10 20
1 Status as of December 7, 1994. 2 Excludes one Independent each for AK, CA, LA, and VA; two Independents each forMS and VT; four Independents for SC; members of political parties other than Democratic, Republican, or Independent (one in MAand VT, and two in NH) one undecided in GA; and one vacancy each in LA, MI, and WV; one vacancy each for GA, NH, TX, andWI; two vacancies each for CT and MA; and three vacancies for NV. 3 Excludes one Independent each for NH and VA; two forGA; three each for ME and MS; five for VT; one vacancy each for CA, MI, NH, SC and two vacancies in AL. 4 Excludes oneIndependent for CA and one vacancy each for AL and NJ. 5 Excludes two Independents for CA; and one vacancy each for CAand PA. 6 Excludes one Independent in ME, two independents in CA, one vacancy in GA, two vacancies in MS, and threevacancies in MN. 7 Excludes one Independent each for ME and MN; one vacancy each in CA and OH; two vacancies for MI andPA; three vacancies for MO. 8 Members of both houses serve 4-year terms. 9 Upper House members serve 4-year terms andLower House members serve 2-year terms. 10 Members of both houses serve 2-year terms. 11 Illinois—4 and 2 year termdepending on district. 12 Nebraska—4 year term. 13 North Dakota—By the 2001 session all Senators and Representatives willbe serving 4-year terms.
Source: The Council of State Governments, Lexington, KY, State Elective Officials and the Legislatures, biennial (copyright);thereafter, National Conference of State Legislatures, Denver, CO, unpublished data.
248 Elections
U.S. Census Bureau, Statistical Abstract of the United States: 2001

No. 396. Political Party Control of State Legislatures by Party: 1975 to 2000[As of beginning of year. Until 1972 there were two nonpartisan legislatures in Minnesota and Nebraska. Since then onlyNebraska has had a nonpartisan legislature]
Year
Legislatures under—
Demo-cratic
control
Splitcontrol
or tie
Re-publican
control
1975. . . 37 7 51977. . . 36 8 51979. . . 30 7 121981. . . 28 6 151983 1 . 34 4 111985. . . 27 11 11
Year
Legislatures under—
Demo-cratic
control
Splitcontrol
or tie
Re-publican
control
1987. . . 28 12 91989 2 . 28 13 81990. . . 29 11 91992. . . 29 14 61993. . . 25 16 81994. . . 24 17 8
Year
Legislatures under—
Demo-cratic
control
Splitcontrol
or tie
Re-publican
control
1995. . . 18 12 191996. . . 16 15 181997. . . 20 11 181999. . . 20 12 172000. . . 16 15 18
1 Two 1984 midterm recall elections resulted in a change in control of the Michigan State Senate. At the time of the 1984election, therefore, Democrats controlled 33 legislatures. 2 A party change during the year by a Democratic representative brokethe tie in the Indiana House of Representatives, giving the Republicans control of both chambers.
Source: National Conference of State Legislatures, Denver, CO, State Legislatures, periodic.
No. 397. Women Holding State Public Offices by Office and State: 2000
[As of January. For data on women in U.S. Congress, see Table 390]
State
State-wideelective
executiveoffice 1
Statelegisla-
ture
United States . 92 1,672Alabama . . . . . . 3 11Alaska . . . . . . . . 1 11Arizona . . . . . . . 5 32Arkansas . . . . . . 2 21California . . . . . . 2 31Colorado . . . . . . 1 34Connecticut . . . . 4 56Delaware . . . . . . 3 15Florida . . . . . . . . 1 39Georgia . . . . . . . 2 46Hawaii . . . . . . . . 1 17Idaho. . . . . . . . . 1 27Illinois . . . . . . . . 2 44Indiana . . . . . . . 3 27Iowa . . . . . . . . . 2 31Kansas . . . . . . . 2 54
State
State-wideelective
executiveoffice 1
Statelegisla-
ture
Kentucky . . . . . . - 16Louisiana . . . . . . 1 23Maine . . . . . . . . - 52Maryland . . . . . . 1 55Massachusetts . . 2 52Michigan . . . . . . 2 36Minnesota . . . . . 4 57Mississippi . . . . . - 22Missouri . . . . . . . 2 44Montana . . . . . . 2 37Nebraska . . . . . . 2 12Nevada . . . . . . . 3 22New Hampshire. . 1 135New Jersey . . . . 1 19New Mexico . . . . 3 31New York . . . . . . 1 45North Carolina. . . 1 31
State
State-wideelective
executiveoffice 1
Statelegisla-
ture
North Dakota . . . 4 26Ohio . . . . . . . . . 2 27Oklahoma . . . . . 4 15Oregon . . . . . . . - 27Pennsylvania . . . 1 32Rhode Island . . . - 37South Carolina . . 1 18South Dakota . . . 4 15Tennessee . . . . . 1 23Texas . . . . . . . . 2 33Utah . . . . . . . . . 2 22Vermont . . . . . . . 1 57Virginia . . . . . . . - 23Washington . . . . 4 60West Virginia . . . - 24Wisconsin. . . . . . - 31Wyoming . . . . . . 2 17
- Represents zero. 1 Excludes women elected to the judiciary, women appointed to state cabinet-level positions, womenelected to executive posts by the legislature, and elected members of university Board of Trustees or board of education.
Source: Center for the American Woman and Politics, Eagleton Institute of Politics, Rutgers University, New Brunswick, NJ,information releases, copyright.
No. 398. Public Confidence Levels in Selected Public and Private Institutions:1999
[Based on a sample survey of 2,719 persons 18 years old and over conducted during the spring and subject to sampling variabil-ity; see source]
InstitutionLevel of confidence
A great deal Quite a lot Some Very littleCan’t say/no answer
Religious organizations . . . . . . . . . . . . . . . . . . . . . . 31.9 29.5 26.7 9.7 2.1Private higher education (colleges or univ.) . . . . . . . . . 22.9 35.6 26.6 8.1 6.9Private elementary or secondary education . . . . . . . . . 17.0 33.8 32.5 10.3 6.4Youth development and recreation organizations . . . . . 33.0 38.9 20.1 4.9 3.0Federated charitable appeals . . . . . . . . . . . . . . . . . . 16.1 28.8 33.2 16.4 5.6Health organizations . . . . . . . . . . . . . . . . . . . . . . . . 15.0 27.5 35.4 12.8 9.3Environmental organizations. . . . . . . . . . . . . . . . . . . 13.3 25.7 36.0 15.8 9.2Human service organizations . . . . . . . . . . . . . . . . . . 29.0 38.7 23.6 5.5 3.2Private and community foundations . . . . . . . . . . . . . . 8.7 26.5 36.2 12.5 16.2Public /society benefit organizations 1 . . . . . . . . . . . . 10.9 22.5 41.4 18.4 6.8International/foreign organizations 2 . . . . . . . . . . . . . . 7.7 19.9 38.5 20.9 13.0Small businesses . . . . . . . . . . . . . . . . . . . . . . . . . . 16.4 38.1 33.4 8.7 3.5Military . . . . . . . . . . . . . . . . . . . . . . . . . . . . . . . . . 22.2 35.0 29.4 10.8 2.6Public higher educ. (colleges or univ.) . . . . . . . . . . . . 19.1 42.4 28.7 7.4 2.4Public elementary or secondary education . . . . . . . . . 15.9 35.0 32.6 14.9 1.5Organized labor . . . . . . . . . . . . . . . . . . . . . . . . . . . 9.9 18.1 39.1 27.5 5.4Media (e.g. newspapers, TV, radio) . . . . . . . . . . . . . . 7.6 20.7 37.4 32.5 1.8Work-related organizations. . . . . . . . . . . . . . . . . . . . 6.6 23.5 47.1 14.7 8.2Major corporations . . . . . . . . . . . . . . . . . . . . . . . . . 7.4 21.5 43.5 23.0 4.6State government . . . . . . . . . . . . . . . . . . . . . . . . . . 7.9 23.1 45.0 21.6 2.4Political organizations, parties. . . . . . . . . . . . . . . . . . 4.3 14.5 37.3 40.5 3.4Local government. . . . . . . . . . . . . . . . . . . . . . . . . . 8.7 24.1 42.8 22.0 2.4Federal government . . . . . . . . . . . . . . . . . . . . . . . . 7.9 19.5 43.4 26.9 2.3Congress . . . . . . . . . . . . . . . . . . . . . . . . . . . . . . . 6.4 15.8 40.2 34.9 2.7
1 Civil rights, social justice, or community improvement organizations. 2 Culture exchange or relief organizations.Source: Saxon-Harold, Susan K.E., Murray Weitzman, and the Gallup Organization, Inc., Giving & Volunteering in the United
States: 1999 Edition. (Copyright and published by INDEPENDENT SECTOR, Washington, DC, 2000.)
Elections 249
U.S. Census Bureau, Statistical Abstract of the United States: 2001

No. 399. Black Elected Officials by Office, 1970 to 1999, and State, 1999
[As of January 1999, no Black elected officials had been identified in Hawaii, Idaho, Maine, Montana, North Dakota, South Dakota,or Wyoming]
State
Total
U.S.and
statelegisla-tures 1
City andcounty
offices 2
Lawenforce-
ment 3Educa-
tion 4
1970 (Feb.) . 1,469 179 715 213 3621980 (July) . . 4,890 326 2,832 526 1,2061990 (Jan.) . . 7,335 436 4,485 769 1,6451995 (Jan.) . . 8,385 604 4,954 987 1,8401996 (Jan.) . . 8,545 606 5,023 994 1,9221997 (Jan.) . . 8,617 613 5,056 996 1,9521998 (Jan.) . . 8,830 614 5,210 998 2,0081999 (Jan.) . 8,896 618 5,354 997 1,927
AL . . . . . . . 725 36 540 53 96AK . . . . . . . 3 - 2 - 1AZ . . . . . . . 13 2 1 4 6AR . . . . . . . 504 15 297 65 127CA . . . . . . . 237 10 66 77 84CO . . . . . . . 21 5 5 10 1CT . . . . . . . 68 15 43 3 7DE . . . . . . . 24 4 16 1 3DC . . . . . . . 199 52 192 - 5FL. . . . . . . . 216 23 146 33 14GA . . . . . . . 584 48 394 40 102IL . . . . . . . . 627 27 314 56 230IN . . . . . . . . 84 14 50 12 8IA . . . . . . . . 14 1 8 1 4KS . . . . . . . 19 7 5 4 3KY . . . . . . . 62 4 47 5 6LA . . . . . . . 714 32 398 123 161MD . . . . . . . 185 40 101 33 11
State
Total
U.S.and
statelegisla-tures 1
City andcounty
offices 2
Lawenforce-
ment 3Educa-
tion 4
MA . . . . . . . 31 6 20 2 3MI. . . . . . . . 338 22 144 54 118MN . . . . . . . 16 1 4 6 5MS . . . . . . . 850 46 575 97 132MO . . . . . . . 201 17 149 12 23NE . . . . . . . 4 1 1 - 2NV . . . . . . . 13 5 4 2 2NH . . . . . . . 3 3 - - -NJ. . . . . . . . 239 16 133 1 89NM . . . . . . . 4 1 - 2 1NY . . . . . . . 305 32 73 75 125NC . . . . . . . 506 27 359 28 92OH . . . . . . . 284 18 199 25 42OK . . . . . . . 105 6 80 3 16OR . . . . . . . 7 4 1 2 -PA . . . . . . . 164 19 57 60 28RI . . . . . . . . 10 9 1 - -SC . . . . . . . 542 34 333 8 167TN . . . . . . . 172 17 105 25 25TX . . . . . . . 479 18 319 42 100UT . . . . . . . 1 - - 1 -VT . . . . . . . 1 1 - - -VA . . . . . . . 251 16 137 16 82WA . . . . . . . 21 2 9 9 1WV . . . . . . . 19 4 12 3 -WI. . . . . . . . 31 8 14 4 5
- Represents zero. 1 Includes elected state administrators. 2 County commissioners and councilmen, mayors, vicemayors, aldermen, regional officials, and other. 3 Judges, magistrates, constables, marshals, sheriffs, justices of the peace, andother. 4 Members of state education agencies, college boards, school boards, and other. 5 Includes one shadowrepresentative.
Source: Joint Center for Political and Economic Studies, Washington, DC, Black Elected Officials: A Statistical Summary,annual (copyright) and <http://www.jointcenter.org/databank/graphs/98eo.pdf> and <http://www.jointcenter.org/databank/graphs/99beo.pdf> (accessed 17 April 2001).
No. 400. Hispanic Public Elected Officials by Office, 1985 to 2000,and State, 2000
[As of September. For states not shown, no Hispanic public officials had been identified]
State
Total
Stateexecu-
tivesand
legisla-tors 1
Countyand
munici-pal
officials
Judicialand lawenforce-
ment
Educa-tionand
schoolboards
1985 (Sept.) . 3,147 129 1,316 517 1,1851987 (Sept.) . 3,317 138 1,412 568 1,1991988 (Sept.) . 3,360 135 1,425 574 1,2261989 (Sept.) . 3,783 143 1,724 575 1,3411990 (Sept.) . 4,004 144 1,819 583 1,4581991 (Sept.) . 4,202 151 1,867 596 1,5881992 (Sept.) . 4,994 150 1,908 628 2,3081993 (Sept.) . 5,170 182 2,023 633 2,3321994 (Sept.) . 5,459 199 2,197 651 2,4122000 . . . . . . 5,205 223 1,846 454 2,682CA . . . . . . . 767 33 317 37 380CO . . . . . . . 154 11 92 9 42CT . . . . . . . 26 5 17 - 4DE . . . . . . . 3 1 2 - -DC . . . . . . . 1 - 1 - -FL. . . . . . . . 90 17 57 11 5GA . . . . . . . 3 - 3 - -HI . . . . . . . . 2 1 1 - -ID . . . . . . . . 2 - 2 - -IL . . . . . . . . 1,190 7 34 - 21,149IN . . . . . . . . 10 1 7 1 1IA . . . . . . . . 1 - 1 - -KS . . . . . . . 6 2 4 - -
State
Total
Stateexecu-
tivesand
legisla-tors 1
Countyand
munici-pal
officials
Judicialand lawenforce-
ment
Educa-tionand
schoolboards
LA . . . . . . . 3 - 1 2 -MA . . . . . . . 13 3 7 - 3MI. . . . . . . . 8 2 5 - 1MN . . . . . . . 3 1 1 1 -MO . . . . . . . 1 - 1 - -MT . . . . . . . 1 - - 1 -NE . . . . . . . 3 1 2 - -NV . . . . . . . 4 1 2 1 -NH . . . . . . . 1 1 - - -NJ. . . . . . . . 77 6 46 - 25NM . . . . . . . 618 48 316 74 180NY . . . . . . . 76 14 16 8 38NC . . . . . . . 1 1 - - -OH . . . . . . . 7 - 5 2 -OR . . . . . . . 6 - 5 - 1PA . . . . . . . 5 1 2 1 1RI . . . . . . . . 3 2 1 - -TX . . . . . . . 1,828 42 768 280 738UT . . . . . . . 3 1 2 - -VA . . . . . . . 1 - - - 1WA . . . . . . . 12 3 6 - 3WI. . . . . . . . 12 1 6 3 2WY . . . . . . . 4 1 3 - -
- Represents zero. 1 Includes U.S. Representatives, not shown separately. 2 Includes local school council members inthe Chicago area.
Source: National Association of Latino Elected and Appointed Officials, Washington, DC, National Roster of Hispanic ElectedOfficials, annual.
250 Elections
U.S. Census Bureau, Statistical Abstract of the United States: 2001

No. 401. Voting-Age Population, Percent Reporting Registered, and Voted: 1980 to 2000
[As of November. Covers civilian noninstitutional population 18 years old and over. Includes aliens. Figures are based on Current Population Survey (see text, Section 1, Population, and Appendix III) and differ fromthose in Table 403 based on population estimates and official vote counts]
Characteristic
Voting-age population (mil.) Percent reporting they registered Percent reporting they voted
1980 1988 1990 1994 1996 1998 2000
Presidential election years Congressional election years Presidential election years Congressional election years
1980 1992 1996 2000 1986 1990 1994 1998 1980 1992 1996 2000 1986 1990 1994 1998
Total 1 . . . . . . . . . . . . . 157.1 178.1 182.1 190.3 193.7 198.2 202.6 66.9 68.2 65.9 63.9 64.3 62.2 62.0 62.1 59.2 61.3 54.2 54.7 46.0 45.0 44.6 41.918 to 20 years old. . . . . . . . . 12.3 10.7 10.8 10.3 10.8 11.4 11.9 44.7 48.3 45.6 40.5 35.4 35.4 37.2 32.1 35.7 38.5 31.2 28.4 18.6 18.4 16.5 13.521 to 24 years old. . . . . . . . . 15.9 14.8 14.0 14.9 13.9 14.1 14.9 52.7 55.3 51.2 49.3 46.6 43.3 45.5 43.1 45.7 33.4 35.4 24.2 22.0 22.3 19.225 to 34 years old. . . . . . . . . 35.7 42.7 42.7 41.1 40.1 38.6 37.3 62.0 60.6 56.9 54.7 55.8 52.0 51.5 52.4 54.6 53.2 43.1 43.7 35.1 33.8 32.2 28.035 to 44 years old. . . . . . . . . 25.6 35.2 37.9 41.9 43.3 44.4 44.5 70.6 69.2 66.5 63.8 67.9 65.5 63.3 62.4 64.4 63.6 54.9 55.0 49.3 48.4 46.0 40.745 to 64 years old. . . . . . . . . 43.6 45.9 46.9 50.9 53.7 57.4 61.4 75.8 75.3 73.5 71.2 74.8 71.4 71.0 71.1 69.3 70.0 (NA) 64.1 58.7 55.8 56.0 53.665 years old and over . . . . . . 24.1 28.8 29.9 31.1 31.9 32.3 32.8 74.6 78.0 77.0 76.1 76.9 76.5 75.6 75.4 65.1 70.1 (NA) 67.6 60.9 60.3 60.7 59.5
Male. . . . . . . . . . . . . . . . . . 74.1 84.5 86.6 91.0 92.6 95.2 97.1 66.6 66.9 64.4 62.2 63.4 61.2 60.8 60.6 59.1 60.2 52.8 53.1 45.8 44.6 44.4 41.4Female . . . . . . . . . . . . . . . . 83.0 93.6 95.5 99.3 101.0 103.0 105.5 67.1 69.3 67.3 65.6 65.0 63.1 63.2 63.5 59.4 62.3 55.5 56.2 46.1 45.4 44.9 42.4
White . . . . . . . . . . . . . . . . . 137.7 152.9 155.6 160.3 162.8 165.8 168.7 68.4 70.1 67.7 65.6 65.3 63.8 64.2 63.9 60.9 63.6 56.0 56.4 47.0 46.7 46.9 43.3Black . . . . . . . . . . . . . . . . . 16.4 19.7 20.4 21.8 22.5 23.3 24.1 60.0 63.9 63.5 63.6 64.0 58.8 58.3 60.2 50.5 54.0 50.6 53.5 43.2 39.2 37.0 39.6
Hispanic 2 . . . . . . . . . . . . . . 8.2 12.9 13.8 17.5 18.4 20.3 21.6 36.3 35.0 35.7 34.9 35.9 32.3 30.0 33.7 29.9 28.9 26.7 27.5 24.2 21.0 19.1 20.0
Region: 3
Northeast . . . . . . . . . . . . . 35.5 37.9 38.1 38.4 38.3 38.5 38.9 64.8 67.0 64.7 63.7 62.0 61.0 60.9 60.8 58.5 61.2 54.5 55.2 44.4 45.2 45.2 41.2Midwest . . . . . . . . . . . . . . 41.5 43.3 43.9 44.5 45.2 45.9 46.4 73.8 74.6 71.6 70.2 70.7 68.2 68.7 68.2 65.8 67.2 59.3 60.9 49.5 48.6 48.8 47.3South . . . . . . . . . . . . . . . 50.6 60.7 62.4 66.4 68.1 70.1 71.8 64.8 67.2 65.9 64.5 63.0 61.3 60.7 62.7 55.6 59.0 52.2 53.5 43.0 42.4 40.5 38.6West . . . . . . . . . . . . . . . . 29.5 36.2 37.7 41.0 42.1 43.7 45.5 63.3 63.6 60.8 56.9 60.8 57.7 58.1 56.0 57.2 58.5 51.8 49.9 48.4 45.0 46.4 42.3
School years completed:8 years or less . . . . . . . . . 22.7 19.1 17.7 14.7 14.1 13.3 12.9 53.0 43.9 40.7 36.1 50.5 44.0 40.1 40.2 42.6 35.1 28.1 26.8 32.7 27.7 23.2 24.6High school:
1 to 3 years . . . . . . . . . 22.5 21.1 21.0 420.7 21.0 21.0 20.1 54.6 50.4 47.9 45.9 52.4 47.9 44.7 43.4 45.6 441.2 33.8 33.6 33.8 30.9 427.0 25.04 years. . . . . . . . . . . . . 61.2 70.0 71.5 564.9 65.2 65.6 66.3 66.4 64.9 62.2 60.1 62.9 60.0 58.9 58.6 58.9 557.5 49.1 49.4 44.1 42.2 540.5 37.1
College:1 to 3 years . . . . . . . . . 26.7 34.3 36.3 650.4 50.9 52.9 55.3 74.4 75.4 72.9 70.0 70.0 68.7 68.4 68.3 67.2 668.7 60.5 60.3 49.9 50.0 649.1 46.24 years or more . . . . . . . 24.0 33.6 35.6 739.4 42.5 45.4 48.0 84.3 84.8 80.4 77.3 77.8 77.3 76.3 75.1 79.9 781.0 73.0 72.0 62.5 62.5 763.1 57.2
Employed . . . . . . . . . . . . . . 95.0 113.8 115.5 122.6 125.6 135.7 133.4 68.7 69.9 67.0 64.7 64.4 62.6 62.9 62.6 61.8 63.8 55.2 55.5 45.7 45.1 45.2 41.2Unemployed . . . . . . . . . . . . 6.9 5.8 6.7 6.5 6.4 5.2 4.9 50.3 53.7 52.5 46.1 50.6 44.6 46.4 48.5 41.2 46.2 37.2 35.1 31.2 27.9 28.3 28.4Not in labor force . . . . . . . . . 55.2 58.5 59.9 61.2 61.6 62.5 64.2 65.8 66.8 65.1 63.8 65.4 63.4 61.9 62.1 57.0 58.7 54.1 54.5 48.2 46.7 45.3 44.5
NA Not available. 1 Includes other races not shown separately. 2 Hispanic persons may be of any race. 3 For composition of regions, see map, inside cover. 4 Represents those who completed 9th to 12thgrade, but have no high school diploma. 5 High school graduate. 6 Some college or associate degree. 7 Bachelor’s or advanced degree.
Source: U.S. Census Bureau, Current Population Reports, P20-453 and P20-466; and unpublished data.
Elections
25
1
U.S
.C
ensusB
ureau,S
tatisticalAbstract
ofthe
United
States:
2001

No. 402. Persons Reported Registered and Voted by State: 2000
[See headnote, Table 401]
StateVoting-agepopulation
(1,000)
Percent of voting-agepopulation
Registered Voted
U.S.. . . . . 202,609 63.9 54.7AL . . . . . . . . . 3,278 73.6 59.6AK . . . . . . . . . 412 72.5 65.5AZ . . . . . . . . . 3,524 53.3 46.7AR . . . . . . . . . 1,893 59.4 49.4CA . . . . . . . . . 24,749 52.8 46.4CO. . . . . . . . . 3,049 64.1 53.6CT . . . . . . . . . 2,415 62.5 55.2DE . . . . . . . . . 567 67.9 62.2DC. . . . . . . . . 407 72.4 65.6FL . . . . . . . . . 11,633 60.5 51.6GA. . . . . . . . . 5,775 61.1 49.0HI . . . . . . . . . 855 47.0 39.7ID . . . . . . . . . 927 61.4 53.9IL. . . . . . . . . . 8,859 66.7 56.8IN . . . . . . . . . 4,380 68.5 58.5IA . . . . . . . . . 2,110 72.2 64.1KS . . . . . . . . . 1,908 67.7 60.2KY . . . . . . . . . 2,996 69.7 54.9LA . . . . . . . . . 3,143 75.4 64.6ME. . . . . . . . . 979 80.3 69.2MD. . . . . . . . . 3,812 65.6 57.1MA. . . . . . . . . 4,614 70.3 60.1MI . . . . . . . . . 7,231 69.1 60.1MN. . . . . . . . . 3,506 76.7 67.8MS. . . . . . . . . 2,029 72.2 59.8
StateVoting-agepopulation
(1,000)
Percent of voting-agepopulation
Registered Voted
MO . . . . . . . . 4,066 74.3 65.4MT. . . . . . . . . 658 70.0 62.2NE . . . . . . . . . 1,205 71.8 58.9NV . . . . . . . . . 1,377 52.3 46.5NH. . . . . . . . . 902 69.6 63.3NJ . . . . . . . . . 6,109 63.2 55.2NM. . . . . . . . . 1,261 59.5 51.3NY . . . . . . . . . 13,725 58.6 51.0NC. . . . . . . . . 5,629 66.1 53.2ND. . . . . . . . . 449 91.1 69.8OH. . . . . . . . . 8,301 67.0 58.1OK. . . . . . . . . 2,457 68.3 58.3OR. . . . . . . . . 2,515 68.2 60.8PA . . . . . . . . . 8,950 65.3 55.7RI . . . . . . . . . 729 69.7 60.1SC . . . . . . . . . 2,929 68.0 58.9SD . . . . . . . . . 530 70.9 58.7TN . . . . . . . . . 4,173 62.1 52.3TX . . . . . . . . . 14,533 61.4 48.2UT . . . . . . . . . 1,472 64.7 56.3VT . . . . . . . . . 458 72.0 63.3VA . . . . . . . . . 5,177 64.1 57.2WA . . . . . . . . 4,314 66.1 58.6WV . . . . . . . . 1,405 63.1 52.1WI . . . . . . . . . 3,884 76.5 67.8
Source: U.S. Census Bureau, Current Population Reports, P20-466, and unpublished data.
No. 403. Participation in Elections for President and U.S. Representatives:1932 to 1998
[As of November. Estimated resident population 21 years old and over, 1932-70, except as noted, and 18 years old and overthereafter; includes Armed Forces. Prior to 1960, excludes Alaska and Hawaii. District of Columbia is included in votes cast forPresident beginning 1964 and in votes cast for Representative from 1972 to 1998]
Year
Residentpopula-
tion (incl.aliens) of
votingage 1
(1,000)
Votes cast
ForPresi-dent 2
(1,000)
Per-cent ofvoting-
agepopu-lation
For U.S.Repre-senta-
tives(1,000)
Per-cent ofvoting-
agepopu-lation
1932 . . . 75,768 39,758 52.5 37,657 49.71934 . . . 77,997 (X) (X) 32,256 41.41936 . . . 80,174 45,654 56.9 42,886 53.51938 . . . 82,354 (X) (X) 36,236 44.01940 . . . 84,728 49,900 58.9 46,951 55.41942 . . . 86,465 (X) (X) 28,074 32.51944 . . . 85,654 47,977 56.0 45,103 52.71946 . . . 92,659 (X) (X) 34,398 37.11948 . . . 95,573 48,794 51.1 45,933 48.11950 . . . 98,134 (X) (X) 40,342 41.11952 . . . 99,929 61,551 61.6 57,571 57.61954 . . . 102,075 (X) (X) 42,580 41.71956 . . . 104,515 62,027 59.3 58,426 55.91958 . . . 106,447 (X) (X) 45,818 43.01960 . . . 109,672 68,838 62.8 64,133 58.51962 . . . 112,952 (X) (X) 51,267 45.41964 . . . 114,090 70,645 61.9 65,895 57.8
Year
Residentpopula-
tion (incl.aliens) of
votingage 1
(1,000)
Votes cast
ForPresi-dent 2
(1,000)
Per-cent ofvoting-
agepopu-lation
For U.S.Repre-senta-
tives(1,000)
Per-cent ofvoting-
agepopu-lation
1966 . . . 116,638 (X) (X) 52,908 45.41968 . . . 120,285 73,212 60.9 66,288 55.11970 . . . 124,498 (X) (X) 54,173 43.51972 . . . 140,777 77,719 55.2 71,430 50.71974 . . . 146,338 (X) (X) 52,495 35.91976 . . . 152,308 81,556 53.5 74,422 48.91978 . . . 158,369 (X) (X) 55,332 34.91980 . . . 163,945 86,515 52.8 77,995 47.61982 . . . 169,643 (X) (X) 64,514 38.01984 . . . 173,995 92,653 53.3 83,231 47.81986 . . . 177,922 (X) (X) 59,619 33.51988 . . . 181,956 91,595 50.3 81,786 44.91990 . . . 185,812 (X) (X) 61,513 33.11992 . . . 189,524 104,425 55.1 96,239 50.81994 . . . 193,650 (X) (X) 70,781 36.61996 . . . 196,928 96,278 49.0 89,863 45.81998 . . . 198,228 (X) (X) 65,897 32.9
X Not applicable. 1 Population 18 and over in Georgia, 1944-70, and in Kentucky, 1956-70; 19 and over in Alaska and 20and over in Hawaii, 1960-70. 2 Source: 1932-58, U.S. Congress, Clerk of the House, Statistics of the Presidential andCongressional Election, biennial.
Source: Except as noted, U.S. Census Bureau, Current Population Reports, P25-1085; Congressional Quarterly Inc.,Washington, DC, America Votes, biennial (copyright).
252 Elections
U.S. Census Bureau, Statistical Abstract of the United States: 2001

No. 404. Resident Population of Voting Age and Percent Casting Votes—States: 1994 to 2000
[As of November. Estimated population, 18 years old and over. Includes Armed Forces stationed in each state, aliens, and insti-tutional population]
State
Voting-age population Percent casting votes for—
1994(1,000)
1996(1,000)
1998(1,000)
2000, (1,000) Presidentialelectors U.S. Representatives
Total Female BlackHis-
panic 1 1996 2000 1996 1998 2000
U.S. . . . . 193,650 196,928 198,228 202,609 105,523 24,132 21,598 49.0 52.0 45.6 33.2 48.0
AL . . . . . . . 3,138 3,221 3,252 3,278 1,771 859 27 47.7 50.8 46.6 37.4 43.9AK. . . . . . . 429 423 413 412 210 13 12 56.9 69.2 53.6 54.1 66.5AZ. . . . . . . 2,923 3,321 3,362 3,524 1,789 114 910 45.4 43.5 63.9 29.9 41.6AR. . . . . . . 1,817 1,854 1,855 1,893 996 331 51 47.5 48.7 57.1 28.3 33.4CA. . . . . . . 23,225 23,095 23,696 24,749 12,817 1,678 6,514 43.3 44.3 57.8 33.7 42.2
CO . . . . . . 2,713 2,841 2,954 3,049 1,535 116 478 53.1 57.1 52.1 43.1 53.2CT. . . . . . . 2,486 2,471 2,438 2,415 1,268 317 139 56.4 60.4 48.0 39.1 54.4DE. . . . . . . 534 551 555 567 299 111 20 49.6 57.7 52.4 32.5 55.2DC . . . . . . 452 428 392 407 216 258 26 42.7 49.4 44.1 (NA) (NA)FL . . . . . . . 10,856 11,055 11,275 11,633 6,100 1,467 2,162 48.0 51.3 40.9 10.8 43.1
GA . . . . . . 5,159 5,432 5,581 5,775 3,078 1,956 169 42.6 45.0 47.0 29.2 41.8HI . . . . . . . 900 875 855 855 442 16 29 40.8 42.9 46.9 46.5 39.8ID . . . . . . . 803 847 881 927 480 4 58 58.2 54.0 52.6 43.0 53.1IL . . . . . . . 8,712 8,703 8,659 8,859 4,652 1,342 771 49.2 53.5 50.8 37.1 49.6IN . . . . . . . 4,298 4,346 4,377 4,380 2,223 286 79 48.9 50.2 52.5 36.0 49.2
IA . . . . . . . 2,112 2,135 2,102 2,110 1,061 81 89 57.7 62.3 47.7 42.8 60.4KS. . . . . . . 1,889 1,896 1,868 1,908 981 103 50 56.6 56.2 47.1 38.9 54.4KY. . . . . . . 2,857 2,926 2,956 2,996 1,597 230 71 47.5 51.5 52.3 37.2 47.9LA . . . . . . . 3,100 3,117 3,114 3,143 1,709 892 61 56.9 56.2 56.2 10.0 38.2ME . . . . . . 931 943 938 979 514 6 4 64.5 66.5 56.9 44.2 65.2
MD . . . . . . 3,750 3,786 3,861 3,812 1,974 1,165 131 46.7 53.0 62.8 38.4 50.5MA . . . . . . 4,564 4,677 4,594 4,614 2,403 311 251 55.3 58.6 56.1 37.9 50.9MI . . . . . . . 6,983 7,177 7,227 7,231 3,713 891 156 54.5 58.5 53.2 41.3 56.3MN . . . . . . 3,362 3,417 3,443 3,506 1,785 95 50 64.3 69.5 55.6 59.2 67.4MS . . . . . . 1,905 1,966 1,975 2,029 1,086 611 25 45.6 49.0 60.9 27.9 48.6
MO . . . . . . 3,902 3,981 3,967 4,066 2,165 449 38 54.2 58.0 54.8 39.6 57.2MT . . . . . . 623 647 654 658 329 1 13 62.9 62.3 55.3 50.7 62.3NE. . . . . . . 1,192 1,211 1,193 1,205 626 46 56 56.1 57.8 40.7 44.1 56.7NV. . . . . . . 1,088 1,204 1,298 1,377 683 112 220 39.3 44.2 41.8 31.6 42.5NH . . . . . . 843 869 874 902 461 13 14 58.0 63.1 48.8 36.4 61.6
NJ . . . . . . . 5,974 6,023 6,059 6,109 3,190 787 583 51.2 52.2 43.0 30.0 48.9NM . . . . . . 1,167 1,216 1,253 1,261 670 36 484 46.0 47.4 (NA) 39.7 46.6NY. . . . . . . 13,646 13,610 13,440 13,725 7,112 2,181 1,706 46.5 49.7 43.2 31.8 42.4NC . . . . . . 5,364 5,512 5,536 5,629 3,003 1,315 255 45.8 51.7 36.9 34.4 49.4ND . . . . . . 467 475 460 449 228 2 3 56.3 64.1 45.7 46.3 63.5
OH . . . . . . 8,313 8,334 8,263 8,301 4,385 934 106 54.3 56.6 38.1 40.8 54.4OK . . . . . . 2,394 2,423 2,426 2,457 1,302 115 76 49.9 50.2 40.1 35.4 44.2OR . . . . . . 2,311 2,404 2,474 2,515 1,296 34 193 57.5 61.0 42.5 44.1 57.3PA. . . . . . . 9,212 9,150 8,942 8,950 4,663 764 248 49.0 54.9 44.5 32.4 50.9RI . . . . . . . 764 754 726 729 390 38 30 52.0 56.1 42.3 40.4 52.7
SC. . . . . . . 2,740 2,792 2,817 2,929 1,575 662 62 41.5 47.2 44.3 34.6 45.1SD. . . . . . . 522 533 529 530 266 5 4 61.1 59.6 45.6 48.9 59.2TN. . . . . . . 3,913 4,009 4,080 4,173 2,137 658 67 47.1 49.7 46.1 22.4 44.4TX. . . . . . . 13,166 13,748 14,080 14,533 7,454 1,397 4,414 41.2 44.1 36.8 24.6 41.2UT. . . . . . . 1,246 1,347 1,408 1,472 748 4 104 50.3 52.3 46.4 33.4 51.5
VT. . . . . . . 429 442 444 458 238 1 3 58.6 64.2 15.1 48.5 61.8VA. . . . . . . 4,967 5,058 4,969 5,177 2,745 1,010 234 47.5 52.9 48.8 23.1 46.8WA . . . . . . 4,000 4,112 4,179 4,314 2,261 123 167 54.7 57.6 38.3 44.5 55.2WV . . . . . . 1,389 1,401 1,401 1,405 750 45 7 45.0 46.1 45.1 25.1 41.2WI . . . . . . . 3,777 3,819 3,790 3,884 1,972 147 159 57.4 66.9 48.6 44.2 64.5WY . . . . . . 343 348 346 350 175 1 19 60.1 62.3 62.4 50.4 60.6
NA Not available. 1 Persons of Hispanic origin may be of any race.
Source: Compiled by U.S. Census Bureau. Population data from U.S. Census Bureau, Current Population Reports, P25-1117and Statistical Brief (SB/96-2); votes cast from Elections Research Center, Chevy Chase, MD, America Votes, biennial, (copyright);and Congressional Quarterly Inc., Washington, DC (copyright).
Elections 253
U.S. Census Bureau, Statistical Abstract of the United States: 2001

No. 405. Political Party Financial Activity by Major Political Party:1981 to 2000
[In millions of dollars (39.3 represents $39,300,000). Covers financial activity during 2-year calendar period indicated. Some politi-cal party financial activities, such as building funds and state and local election spending, are not reported to the source. Also excludescontributions earmarked to federal candidates through the party organizations, since some of those funds never passed throughthe committees’ accounts]
Year and type of committee
Democratic Republican
Receipts,net 1
Dis-burse-ments,
net 1
Contribu-tions tocandi-dates
Moniesspent onbehalf of
party’snomi-
nees 2Receipts,
net 1
Dis-burse-ments,
net 1
Contribu-tions tocandi-dates
Moniesspent onbehalf of
party’snomi-
nees 2
1981-82 . . . . . . . . . . . . . 39.3 40.1 1.7 3.3 215.0 214.0 5.6 14.31983-84 . . . . . . . . . . . . . 98.5 97.4 2.6 9.0 297.9 300.8 4.9 20.11985-86 . . . . . . . . . . . . . 64.8 65.9 1.7 9.0 255.2 258.9 3.4 14.31987-88 . . . . . . . . . . . . . 125.7 119.6 1.8 17.9 257.5 251.4 3.4 22.71989-90 . . . . . . . . . . . . . 85.8 90.9 1.5 8.7 206.3 213.5 2.9 10.71991-92 . . . . . . . . . . . . . 187.5 180.5 1.9 28.1 267.3 256.1 3.0 33.91993-94, total . . . . . . . . . . 151.1 149.9 2.2 21.2 254.4 243.7 3.0 20.61995-96, total . . . . . . . . . . 221.6 214.3 2.2 22.6 416.5 408.5 3.7 31.01997-98, total . . . . . . . . . . 160.0 155.3 1.2 18.6 285.0 275.9 2.6 15.71999-00, total 3 . . . . . . . . 275.2 265.8 1.4 21.0 465.8 427.0 2.3 29.6
National committee. . . . . . . . 124.0 122.0 - 13.5 212.8 187.4 0.4 23.7Senatorial committee . . . . . . 40.5 41.5 0.3 0.1 51.5 50.7 0.4 -Congressional committee. . . . 48.4 49.3 0.6 2.6 97.3 95.4 0.7 3.7State and local . . . . . . . . . . 149.3 140.0 0.5 4.7 176.6 165.9 0.8 2.2
- Represents zero. 1 Excludes monies transferred between affiliated committees. 2 Monies spent in the general election.Minus sign (-) indicates refunds for expenditures. 3 Excludes ‘‘Other national’’ activity.
Source: U.S. Federal Election Commission, FEC Reports on Financial Activity, Final Report, Party and Non-Party PoliticalCommittees, biennial.
No. 406. National Party Nonfederal Activity: 1996 to 2000
[During the 2000 election cycle, both major parties raised record amounts of nonfederal or ‘‘soft money.’’ Soft money is used to paya portion of the overhead expenses of party organizations, as well as other shared expenses that benefit both federal andnonfederal elections. In addition, it is used for issue advocacy, as well as generic party advertising. It may also be transferred fromnational committees to state and local party committees as well as being used to support construction and maintenance of partyheadquarters.]
Year and type of committeeDemocratic Republican
Receipts Disbursements Receipts Disbursements
1996
Total. . . . . . . . . . . . . . . . . . . . . . . . . . . . . . . 123,877,924 121,826,562 138,199,706 149,658,099National . . . . . . . . . . . . . . . . . . . . . . . . . . . . . . 101,905,186 100,483,977 113,127,010 114,401,973Senatorial . . . . . . . . . . . . . . . . . . . . . . . . . . . . . 14,176,392 14,061,273 29,395,329 29,362,653Congressional . . . . . . . . . . . . . . . . . . . . . . . . . . 12,340,824 11,822,790 18,530,773 28,746,879
1998
Total. . . . . . . . . . . . . . . . . . . . . . . . . . . . . . . 92,811,927 92,987,711 131,615,116 127,730,744National . . . . . . . . . . . . . . . . . . . . . . . . . . . . . . 56,966,353 57,411,879 74,805,286 74,325,722Senatorial . . . . . . . . . . . . . . . . . . . . . . . . . . . . . 25,880,538 25,858,673 37,866,845 37,283,103Congressional . . . . . . . . . . . . . . . . . . . . . . . . . . 16,865,410 16,617,533 26,914,059 24,092,993
2000
Total. . . . . . . . . . . . . . . . . . . . . . . . . . . . . . . 245,202,519 244,848,838 249,861,645 252,785,565National . . . . . . . . . . . . . . . . . . . . . . . . . . . . . . 136,563,419 135,332,105 166,207,843 163,521,510Senatorial . . . . . . . . . . . . . . . . . . . . . . . . . . . . . 63,717,982 63,300,415 44,652,709 44,633,117Congressional . . . . . . . . . . . . . . . . . . . . . . . . . . 56,702,023 57,997,220 47,295,736 52,925,581
Source: U.S. Federal Election Commission, FEC Index of Independent Expenditures, 1987-88, May 1989; press release ofMay 19, 1989; and unpublished data.
254 Elections
U.S. Census Bureau, Statistical Abstract of the United States: 2001

No. 407. Political Action Committees—Number by Committee Type:1980 to 2000
[As of December 31]
Committee type 1980 1985 1990 1995 1996 1997 1998 1999 2000
Total . . . . . . . . . . . . . . . . . . . . . 2,551 3,992 4,172 4,016 4,079 3,844 3,798 3,835 3,706Corporate . . . . . . . . . . . . . . . . . . . 1,206 1,710 1,795 1,674 1,642 1,597 1,567 1,548 1,523Labor . . . . . . . . . . . . . . . . . . . . . . 297 388 346 334 332 332 321 318 316Trade/membership/health . . . . . . . . . 576 695 774 815 838 825 821 844 812Nonconnected . . . . . . . . . . . . . . . . 374 1,003 1,062 1,020 1,103 931 935 972 902Cooperative . . . . . . . . . . . . . . . . . . 42 54 59 44 41 42 39 38 39Corporation without stock . . . . . . . . . 56 142 136 129 123 117 115 115 114
Source: U.S. Federal Election Commission, press release of January 2001.
No. 408. Political Action Committees—Financial Activity Summaryby Committee Type: 1995 to 2000
[In millions of dollars (437.5 represents $437,500,000). Covers financial activity during 2-year calendar period indicated. Datahave not been adjusted for transfers between affiliated committees]
Committee typeReceipts Disbursements 1 Contributions to candidates
1995-96
1997-98
1999-00
1995-96
1997-98
1999-00
1995-96
1997-98
1999-00
Total . . . . . . . . . . . . . . 437.5 502.6 604.9 430.0 470.8 579.4 217.9 219.9 259.8Corporate . . . . . . . . . . . . 133.8 144.1 164.5 130.6 137.6 158.3 78.2 78.0 91.5Labor . . . . . . . . . . . . . . . 104.1 111.3 136.0 99.8 98.2 128.7 48.0 44.6 51.6Trade/membership/health . . 106.0 119.6 142.9 105.4 114.4 137.2 60.2 62.3 71.8Nonconnected . . . . . . . . . 81.2 114.3 144.3 81.3 107.8 139.6 24.0 28.2 37.3Cooperative . . . . . . . . . . . 3.9 4.5 3.7 4.2 4.3 3.3 3.0 2.4 2.4Corporation without stock . . 8.5 8.8 13.6 8.7 8.5 12.2 4.5 4.4 5.3
1 Comprises contributions to candidates, independent expenditures, and other disbursements.
Source: U.S. Federal Election Commission, FEC Reports on Financial Activity, Final Report, Party and Non-Party PoliticalCommittees, biennial.
No. 409. Presidential Campaign Finances—Federal Funds for GeneralElection: 1980 to 1996
[In millions of dollars (62.7 represents $62,700,000). Based on FEC certifications, audit reports, and Dept. of Treasury reports]
1980 1988 1992 1996
Candidate Amount Candidate Amount Candidate Amount Candidate Amount
Total . . . . . . 62.7 Total. . . . . . . . 92.2 Total. . . . . . . . 110.4 Total. . . . . . . . 152.6Anderson 1 . . . . 4.2 Bush. . . . . . . . 46.1 Bush. . . . . . . . 55.2 Clinton . . . . . . 61.8Carter . . . . . . . 29.4 Dukakis . . . . . . 46.1 Clinton . . . . . . 55.2 Dole . . . . . . . . 61.8Reagan . . . . . . 29.2 Perot . . . . . . . - Perot . . . . . . . 29.0
- Represents zero. 1 John Anderson, as the candidate of a new party, was permitted to raise funds privately. Total receiptsfor the Anderson campaign, including federal funds, were $17.6 million, and total expenditures were $15.6 million.
Source: U.S. Federal Election Commission, periodic press releases.
No. 410. Presidential Campaign Finances—Primary Campaign Receipts andDisbursements: 1987 to 1996
[In millions of dollars (213.8 represents $213,800,000). Covers campaign finance activity during 2-year calendar periodindicated. Covers candidates who received federal matching funds or who had significant financial activity]
ItemTotal Democratic Republican
1987-88 1 1991-92 2 1995-96 1987-88 1991-92 1995-96 1987-88 1991-92 1995-96
Receipts, total 3 . . . 213.8 125.2 243.9 91.9 70.0 46.2 116.0 49.7 187.0Individual contributions . 141.1 82.4 126.4 59.4 44.7 31.3 76.8 34.4 93.1Federal matchingfunds. . . . . . . . . . . . 65.7 41.5 56.0 30.1 24.4 14.0 34.7 15.0 41.6Disbursements. . . . 210.7 118.7 (NA) 90.2 64.4 (NA) 114.6 48.8 (NA)
NA Not available. 1 Includes a minor party candidate who sought several party nominations and a Democratic candidatewho did not receive federal matching funds, but who had significant financial activity. 2 Includes other parties, not shownseparately. 3 Includes other types of receipts, not shown separately.
Source: U.S. Federal Election Commission, FEC Reports on Financial Activity, Final Report, Presidential Pre-NominationCampaigns, quadrennial.
Elections 255
U.S. Census Bureau, Statistical Abstract of the United States: 2001
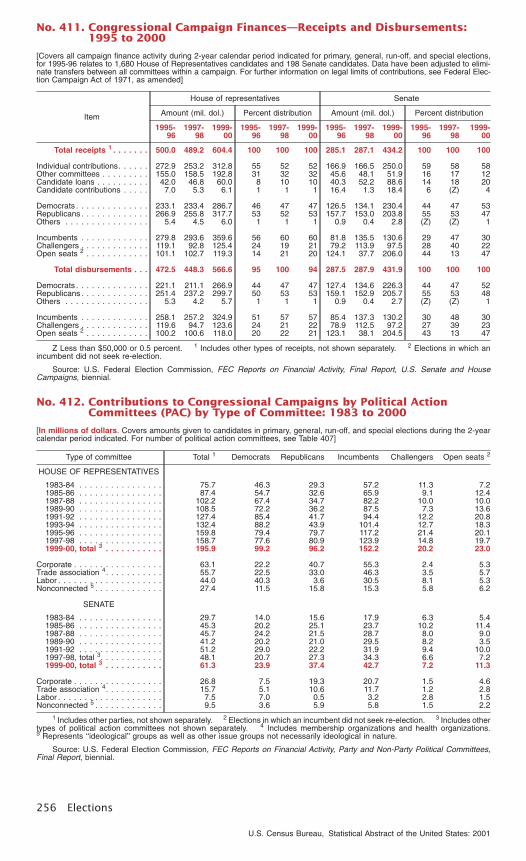
No. 411. Congressional Campaign Finances—Receipts and Disbursements:1995 to 2000
[Covers all campaign finance activity during 2-year calendar period indicated for primary, general, run-off, and special elections,for 1995-96 relates to 1,680 House of Representatives candidates and 198 Senate candidates. Data have been adjusted to elimi-nate transfers between all committees within a campaign. For further information on legal limits of contributions, see Federal Elec-tion Campaign Act of 1971, as amended]
Item
House of representatives Senate
Amount (mil. dol.) Percent distribution Amount (mil. dol.) Percent distribution
1995-96
1997-98
1999-00
1995-96
1997-98
1999-00
1995-96
1997-98
1999-00
1995-96
1997-98
1999-00
Total receipts 1 . . . . . . . 500.0 489.2 604.4 100 100 100 285.1 287.1 434.2 100 100 100
Individual contributions. . . . . . 272.9 253.2 312.8 55 52 52 166.9 166.5 250.0 59 58 58Other committees . . . . . . . . . 155.0 158.5 192.8 31 32 32 45.6 48.1 51.9 16 17 12Candidate loans . . . . . . . . . . 42.0 46.8 60.0 8 10 10 40.3 52.2 88.6 14 18 20Candidate contributions . . . . . 7.0 5.3 6.1 1 1 1 16.4 1.3 18.4 6 (Z) 4
Democrats . . . . . . . . . . . . . . 233.1 233.4 286.7 46 47 47 126.5 134.1 230.4 44 47 53Republicans . . . . . . . . . . . . . 266.9 255.8 317.7 53 52 53 157.7 153.0 203.8 55 53 47Others . . . . . . . . . . . . . . . . 5.4 4.5 6.0 1 1 1 0.9 0.4 2.8 (Z) (Z) 1
Incumbents . . . . . . . . . . . . . 279.8 293.6 359.6 56 60 60 81.8 135.5 130.6 29 47 30Challengers . . . . . . . . . . . . . 119.1 92.8 125.4 24 19 21 79.2 113.9 97.5 28 40 22Open seats 2 . . . . . . . . . . . . 101.1 102.7 119.3 14 21 20 124.1 37.7 206.0 44 13 47
Total disbursements . . . 472.5 448.3 566.6 95 100 94 287.5 287.9 431.9 100 100 100
Democrats . . . . . . . . . . . . . . 221.1 211.1 266.9 44 47 47 127.4 134.6 226.3 44 47 52Republicans . . . . . . . . . . . . . 251.4 237.2 299.7 50 53 53 159.1 152.9 205.7 55 53 48Others . . . . . . . . . . . . . . . . 5.3 4.2 5.7 1 1 1 0.9 0.4 2.7 (Z) (Z) 1
Incumbents . . . . . . . . . . . . . 258.1 257.2 324.9 51 57 57 85.4 137.3 130.2 30 48 30Challengers . . . . . . . . . . . . . 119.6 94.7 123.6 24 21 22 78.9 112.5 97.2 27 39 23Open seats 2 . . . . . . . . . . . . 100.2 100.6 118.0 20 22 21 123.1 38.1 204.5 43 13 47
Z Less than $50,000 or 0.5 percent. 1 Includes other types of receipts, not shown separately. 2 Elections in which anincumbent did not seek re-election.
Source: U.S. Federal Election Commission, FEC Reports on Financial Activity, Final Report, U.S. Senate and HouseCampaigns, biennial.
No. 412. Contributions to Congressional Campaigns by Political ActionCommittees (PAC) by Type of Committee: 1983 to 2000
[In millions of dollars. Covers amounts given to candidates in primary, general, run-off, and special elections during the 2-yearcalendar period indicated. For number of political action committees, see Table 407]
Type of committee Total 1 Democrats Republicans Incumbents Challengers Open seats 2
HOUSE OF REPRESENTATIVES
1983-84 . . . . . . . . . . . . . . . . 75.7 46.3 29.3 57.2 11.3 7.21985-86 . . . . . . . . . . . . . . . . 87.4 54.7 32.6 65.9 9.1 12.41987-88 . . . . . . . . . . . . . . . . 102.2 67.4 34.7 82.2 10.0 10.01989-90 . . . . . . . . . . . . . . . . 108.5 72.2 36.2 87.5 7.3 13.61991-92 . . . . . . . . . . . . . . . . 127.4 85.4 41.7 94.4 12.2 20.81993-94 . . . . . . . . . . . . . . . . 132.4 88.2 43.9 101.4 12.7 18.31995-96 . . . . . . . . . . . . . . . . 159.8 79.4 79.7 117.2 21.4 20.11997-98 . . . . . . . . . . . . . . . . 158.7 77.6 80.9 123.9 14.8 19.71999-00, total 3 . . . . . . . . . . . 195.9 99.2 96.2 152.2 20.2 23.0
Corporate . . . . . . . . . . . . . . . . . 63.1 22.2 40.7 55.3 2.4 5.3Trade association 4. . . . . . . . . . . 55.7 22.5 33.0 46.3 3.5 5.7Labor . . . . . . . . . . . . . . . . . . . . 44.0 40.3 3.6 30.5 8.1 5.3Nonconnected 5 . . . . . . . . . . . . . 27.4 11.5 15.8 15.3 5.8 6.2
SENATE
1983-84 . . . . . . . . . . . . . . . . 29.7 14.0 15.6 17.9 6.3 5.41985-86 . . . . . . . . . . . . . . . . 45.3 20.2 25.1 23.7 10.2 11.41987-88 . . . . . . . . . . . . . . . . 45.7 24.2 21.5 28.7 8.0 9.01989-90 . . . . . . . . . . . . . . . . 41.2 20.2 21.0 29.5 8.2 3.51991-92 . . . . . . . . . . . . . . . . 51.2 29.0 22.2 31.9 9.4 10.01997-98, total 3. . . . . . . . . . . . 48.1 20.7 27.3 34.3 6.6 7.21999-00, total 3 . . . . . . . . . . . 61.3 23.9 37.4 42.7 7.2 11.3
Corporate . . . . . . . . . . . . . . . . . 26.8 7.5 19.3 20.7 1.5 4.6Trade association 4. . . . . . . . . . . 15.7 5.1 10.6 11.7 1.2 2.8Labor . . . . . . . . . . . . . . . . . . . . 7.5 7.0 0.5 3.2 2.8 1.5Nonconnected 5 . . . . . . . . . . . . . 9.5 3.6 5.9 5.8 1.5 2.2
1 Includes other parties, not shown separately. 2 Elections in which an incumbent did not seek re-election. 3 Includes othertypes of political action committees not shown separately. 4 Includes membership organizations and health organizations.5 Represents ‘‘ideological’’ groups as well as other issue groups not necessarily ideological in nature.
Source: U.S. Federal Election Commission, FEC Reports on Financial Activity, Party and Non-Party Political Committees,Final Report, biennial.
256 Elections
U.S. Census Bureau, Statistical Abstract of the United States: 2001