section 4 county profile - westchester · section 4: county profile dma 2000 hazard mitigation plan...
TRANSCRIPT

Section 4: County Profile
DMA 2000 Hazard Mitigation Plan Update – Westchester County, New York 4-1October 2015
SECTION 4 COUNTY PROFILEThis profile describes the general information of the County (physical setting, population and demographics,
general building stock, and land use and population trends) and critical facilities located within Westchester
County. More specific information can be found in the most recent Flood Insurance Study for Westchester
County prepared by FEMA and from the County Databook at www.westchestergov.com/databook. In Section
5, specific profile information is presented and analyzed to develop an understanding of the county, including
the economic, structural, and population assets at risk and the particular concerns that may be present related to
hazards analyzed (for example, a high percentage of vulnerable persons in an area).
4.1 GENERAL INFORMATION
Westchester County covers an area of approximately 450 square miles and is home to nearly one million people
living in 45 municipalities (six cities, 23 villages, and 16 towns). Bounded by the Long Island Sound to the
southeast and the Hudson River to the west, the terrain throughout the county is largely rolling hills with many
rivers, streams and waterbodies of various sizes. Located just north of New York City, major transportation
networks are located throughout the county.
4.1.1 Physical Setting
This section presents location, topography and geology, hydrology and hydrography, climate, land use and land
over.
Location
Westchester County is located in the southeastern portion of New York State. It is 450 square miles in size and
is bordered to the north by Putnam County; to the east by Fairfield County, Connecticut; to the south by New
York City, and to the west by the Hudson River. The Long Island Sound makes up the southeastern border of
the County (FEMA 2007). See Figure 4-1, following page.
Hydrography and Hydrology
Numerous ponds, lakes, creeks, and rivers make up the waterscape of Westchester County. The major waterways
within the County include, but not limited to: West Branch Croton River, East Branch Croton River, Titicus
Reservoir, Amawalk Reservoir, Croton River, New Croton Reservoir, Cross River Reservoir, Saw Mill River,
Sprain Brook, Pocantico River, Caney Brook, Hutchinson River, Wickers Creek, Knollwood Brook,
Troublesome Brook Reach 1, Hartsdale Brook, Blind Brook, Beaver Swamp Brook, Brentwood Brook,
Mamaroneck River, East Branch Mamaroneck River, Barney Brook, Sunnyside Brook, Riverview Road Brook,
Sheldrake River, Nanny Hagen Brook, Fly Kill Brook, Clove Brook, Laurel Brook, Kisco River, Burling Brook,
Stephenson Brook, Bear Gutter Creek, Byran River, Wampus River, Kil Brook, Annsville Creek, Hudson River,
Kensico Reservoir, Bronx River and the Long Island Sound (FEMA FIS 2007).
The Long Island Sound shoreline in the county is generally rocky. Tidal mud flats and marshes, as well as
several natural and artificially-maintained sand beaches, are interspersed on the coast. Several islands can be
found offshore. The islands include: Glen Island which is a County park and used for passive and active
recreation; Huckleberry Island which is largely undeveloped and has one of the largest rookeries for some shore
bird species in western Long Island Sound; Hen Island which contains a residential community; and David’s
Island, the former location of the U.S. Army’s Fort Slocum, which is undergoing an environmental cleanup and
is slated to be used as passive parkland.

Section 4: County Profile
DMA 2000 Hazard Mitigation Plan Update – Westchester County, New York 4-2October 2015
Figure 4-1. Westchester County, New York Mitigation Plan Area
Source: Westchester County Department of Planning

Section 4: County Profile
DMA 2000 Hazard Mitigation Plan Update – Westchester County, New York 4-3October 2015
The widest section across the Hudson River is 3.6 miles and is found between the Westchester and Rockland
County shorelines immediately north of Croton Point in Croton-on-Hudson. The Hudson River is tidal and
brackish through the County and contains a small number of estuarine marshes. Two bridges span the River in
Westchester County; the Bear Mountain Bridge crosses at Cortlandt and the Tappan Zee Bridge at Tarrytown.
Municipal, County and state-owned parks provide access to waterfront landmarks and sites throughout
Westchester County.
Watersheds
A watershed is the area of land that drains into a body of water such as a river, lake, stream, or bay. It is separated
from other systems by high points in the area such as hills or slopes. It includes not only the waterway itself but
also the entire land area that drains to it. For example, the watershed of a lake would include not only the streams
entering the lake but also the land area that drains into those streams and eventually the lake. Drainage basins
generally refer to large watersheds that encompass the watersheds of many smaller rivers and streams. Figure
4-2 depicts the hydrologic system of a watershed.
Figure 4-2. Watershed
Source: U.S. Environmental Protection Agency (EPA) 2012
Watersheds come in all shapes and sizes and can cross municipal and county boundaries. New York State’s
waters (lakes, rivers, and streams) fall within one of 17 major watersheds (or drainage basins). Westchester
County is divided into six primary drainage basins (watersheds): Coastal Long Island Sound, Inland Long Island
Sound, Bronx River, Peekskill and Haverstraw Bays, Saw Mill and Pocantico Rivers, and Croton River. Within
these six primary drainage basins, there are approximately 60 smaller basins (subwatersheds). The principal
streams draining the southern part of the County include Beaver Swamp Brook, Blind Brook, Bronx River,
Hutchinson River, Mamaroneck River, Saw Mill River, Sheldrake River, Stephenson Brook, and Tibbetts Brook.
The primary streams draining the central portion of the County include: Byram River, Kisco River, Mianus
River, Mill River, Pocantico River, and Silvermine River. The northern part of the County is drained primarily
by the following: Dickey Brook, Furnance Brook, Hallocks Mill Brook, Hunter Brook, Muscoot River, Peekskill
Hollow Brook, and Titicus River. Figure 4-3 shows the watersheds in Westchester County.

Section 4: County Profile
DMA 2000 Hazard Mitigation Plan Update – Westchester County, New York 4-4October 2015
Figure 4-3. Watersheds of Westchester County
Source: Westchester County

Section 4: County Profile
DMA 2000 Hazard Mitigation Plan Update – Westchester County, New York 4-5October 2015
New York City Watershed
The Croton Watershed makes up a portion of the watershed for the New York City drinking water supply system.
The Kensico Reservoir, located in the central portion of Westchester, is a component of the Catskill/Delaware
System. The combined New York City Water Supply System – the Croton, Delaware and Catskill components
– provides drinking water to 85% of Westchester County residents. More detailed information on the New York
City water supply system can be obtained from the New York City Department of Environmental Protection at
http://www.nyc.gov/html/dep/html/watershed_protection/reservoirs.shtml and from the Comprehensive Croton
Watershed Water Quality Protection Plan at www.westchestergov.com/crotonplan. Figure 4-4 illustrates the
location of the Croton Watershed.
Figure 4-4. Croton Watershed
Source: New York City Environmental Protection 2007

Section 4: County Profile
DMA 2000 Hazard Mitigation Plan Update – Westchester County, New York 4-6October 2015
Topography and Geology
Westchester County is more hilly north of Interstate 287, which bisects the county. The highest point is Bailey
Mountain located in Mountain Lakes County Park in the Town of North Salem. It has an elevation of 976 feet
(Westchester County Databook, www.westchestergov.com/databook).
The portion of Westchester County south of I-287 is part of the Piedmont Province, which is a transition between
the Atlantic Coastal Plain to the southeast and the Hudson Highlands to the northwest. The ridges, valleys, and
streams trend north to northeast. The eastern side of the county rests on the upper edge of the unsubmerged
portion of the continental shelf of the U.S. Outcroppings of bedrock are frequent throughout each side of glacial
origin (FEMA 2007).
Climate
The climate of New York State is very similar to most of the Northeast U.S. and is classified as Humid
Continental. Differences in latitude, character of topography, and proximity to large bodies of water all have an
effect on the climate across New York State. Precipitation during the warm, growing season (April through
September) is characterized by convective storms that generally form in advance of an eastward moving cold
front or during periods of local atmospheric instability. Occasionally, tropical cyclones will move up from
southern coastal areas and produce large quantities of rain. Both types of storms typically are characterized by
relatively short periods of intense precipitation that produce large amounts of surface runoff and little recharge
(Cornell, Date Unknown).
The cool season (October through March) is characterized by large, low-pressure systems that move
northeastward along the Atlantic coast or the western side of the Appalachian Mountains. Storms that form in
these systems are characterized by long periods of steady precipitation in the form of rain, snow, or ice, and tend
to produce less surface runoff and more recharge than the summer storms because they have a longer duration
and occasionally result in snowmelt (Cornell, Date Unknown).
Westchester County generally experiences short winters and long summers. Temperature extremes between the
seasons are from -34°F to 106°F. The County’s received precipitation is consistent throughout the year with no
stark variations between months; however, the summer months can be slightly higher. The average amount of
precipitation yearly is approximately 45 inches (FEMA, 2007).
Land Use and Land Cover
Total land area in Westchester County is nearly 450 square miles, of which, 43% is occupied by residential land
use, with single-family residential properties making up 35% of the County. The densest residential areas
include cities and villages in the southern portion of the County, while the northern municipalities remain the
least dense. Dedicated open space and recreation lands occupy over 64,000 acres (22% of the County’s total
land area). The largest portions of protected open space are in the northern areas of Westchester County. Vacant
and undeveloped land consume over 22,000 acres (9% total land area) and transportation right-of-ways make up
8.5% of the County’s area.
The distribution of land use in Westchester County varies throughout. The County’s urban and village centers
in the south are dominated by medium- and high-density residential, commercial, and industrial uses, while open
space, low-density residential, and some institutional uses are more prominent in the northern section of the
County. During the 20th Century, the County experienced rapid growth and development, leaving less than one-
tenth of the County’s total land area vacant or undeveloped.

Section 4: County Profile
DMA 2000 Hazard Mitigation Plan Update – Westchester County, New York 4-7October 2015
The southern portion of Westchester County, along the Long Island Sound and the lower portion of the Hudson
River, is more densely developed and populated than the northern portion. Development in the northern part is
largely comprised of low- to medium-density residential development with small amounts of commercial
development located in 12 small hamlets. The southern portion of the county is home to five cities and densely
populated villages. The historical development of the county is based on three primary components: centers,
corridors, and open space.
County Centers
Westchester County’s centers are the focal points in the county’s pattern of development. Centers consist of
commercial or mixed use cores and surrounding residential and industrial areas. Centers are likely to have the
principal services on which most communities depend. They can be categorized into four types based on their
size and function. Hamlets are the smallest centers, mostly found at the crossroads of historic transportation
routes, and have basic retail, religious, and government facilities. Local centers are served by major road, train,
and transit corridors. Intermediate centers have well-developed infrastructure systems and have a distinct urban
character, with mid- and high-rise buildings, large-scale retail, and some industrial uses. Major centers are the
county’s largest places of economic activity, with high-density development and extensive infrastructure.
County Corridors
The corridors in Westchester County are the historic paths of movement and development, connecting the
County’s centers to each other and to places outside of the County. These corridors serve an important
transportation role but also have important functions beyond transportation. Housing, commercial, and industrial
development has occurred along corridors due to the access that they provide to places of employment and
markets for goods. Other corridors have developed based on their scenic qualities and the access they provide
to major open spaces and recreational opportunities. Table 4-1 provides information on the distribution of land
use in Westchester County. Figure 4-5 displays the land use and land cover of the County.
Table 4-1. Land Use in Westchester County
Land Use Type Acres Percent of Total Acreage
Residential – Single Family 112,802,75 39.24%
Residential – Two/Three Family 4,163.68 1.45%
Residential – Multi-Family 5,903.95 2.05%
Commercial and Retail 4,785.5 1.66%
Office and Research 4,148.36 1.44%
Manufacturing, Industrial, and Warehouses 2,296.55 0.8%
Institutional and Public Assembly 15,644.66 5.44%
Transportation, Communication and Utilities 5,569.09 1.94%
Mixed Use 837.60 0.29%
Agricultural 4,808.86 1.67%
Private Recreation 8,688,00 3.02%
Cemeteries 1,888.09 0.66%
Common Land Homeowners Association 2,658.36 0.92%
Nature Preserves 7,319.28 2.55%
Public Parks and Parkway Lands 33,099.26 11.51%
Water Supply Lands 11,406.68 3.97%
Vacant/Undeveloped 25,741.91 8.95%
Rights-of-Way 24,737.77 8.61%
Interior Waterbodies 10,960.33 3.81%
TOTAL 287,467.04 100%Source: Westchester County Department of Planning 2010

Section 4: County Profile
DMA 2000 Hazard Mitigation Plan Update – Westchester County, New York 4-8October 2015
Figure 4-5. Westchester County Land Use and Land Cover
Source: USGS National Land Cover Database, 2011

Section 4: County Profile
DMA 2000 Hazard Mitigation Plan Update – Westchester County, New York 4-9October 2015
The following provides information on the general land use types in Westchester County.
Residential
Residential land use continues to make up the largest share of land use in Westchester County, occupying 43%
of the County’s total land area. The Villages of Bronxville, Larchmont, and Scarsdale, and the Towns of Bedford
and New Castle have the largest percentage of land in residential use. The municipalities with the lowest
percentage of residential land use are the Villages of Buchanan, Elmsford, Mount Kisco, and Sleepy Hollow,
which all have significant amounts of commercial and industrial uses. The Town of Mount Pleasant also has a
small percentage of residential land due to the many institutional uses located throughout the Town.
Non-Residential
Commercial, non-residential land uses occupy less than 3% of Westchester County’s land area, with 4,360 acres
dedicated to commercial and retail uses and 4,120 acres devoted to office and research uses. Mixed-use land
use account for only 845 acres of land in the County (0.3% of the total land area). Industrial land use occupies
less than 2,400 acres (0.8% of the total land area). This is evidence that there is a decline in manufacturing in
the County’s economy. The City of Yonkers has the largest amount of industrial land (over 335 acres). Scarsdale
and Rye Brook are the only two municipalities in the County that do not have any industrial land. Agriculture
remains a small presence in Westchester County’s economy. It occupies 5,400 acres in the County (1.9% of
total land area). North Salem and Somers are the County’s municipalities with the largest amount of agricultural
land.
Transportation, Communication and Utilities
Transportation, communication and utilities occupy 30,000 acres (11% of total land) in Westchester County.
Transportation right-of-ways account for 24,531 acres (8.5%). This includes the Westchester County Airport
which has a total land area of 2,000 acres.
Open Space
Open space in Westchester County includes public parks, parkway lands, nature preserves, private recreation
lands, cemeteries, common land homeowners’ association lands, and water supply lands. Combined, open space
occupies nearly 64,000 acres (over 22%) of the County’s land area. The County has over 32,000 acres of city,
village, town, county, and state parks, preserves, and parkways, as well as 7,700 acres of privately-owned and
operated nature preserves.
The largest portion of open space in the County is located in the northern portion. Yorktown, Pound Ridge and
Somers have the largest amounts of open space. Pound Ridge also has the largest percentage of its land dedicated
as open space (36%). Bronxville, Buchanan, and Port Chester all have less than 5% of their total municipal area
dedicated to open space.
Westchester County is a major source for the region’s drinking water. A substantial amount of protected lands
surround the major reservoirs in the County. Water supply lands account for nearly 11,400 acres in the County
(4%); a majority of which are owned by the New York City Department of Environmental Protection
(NYCDEP). The NYCDEP maintains a program to purchase lands surrounding the water supply reservoirs for
permanent protection.
Vacant and Undeveloped Land
Approximately 9.4% of the County’s total land area (27,000 acres) is vacant and undeveloped. Almost 26,000
acres is undeveloped and 1,251 acres is vacant land with improvements. The County’s northern municipalities
have the largest amount of vacant land, including over 3,100 acres in North Salem and over 2,700 acres in

Section 4: County Profile
DMA 2000 Hazard Mitigation Plan Update – Westchester County, New York 4-10October 2015
Bedford and Cortlandt. North Salem has the largest percentage (21%) of its area remaining as vacant or
undeveloped. Bronxville and Pelham Manor have less than four acres of vacant or undeveloped land, with both
having less than 1% of their total land area remaining as vacant or undeveloped.
4.2 POPULATION AND DEMOGRAPHICS
According to the 2010 U.S. Census, Westchester County had a population of 949,113 people which represents
approximately a 3% increase from the 2000 U.S. Census population of 923,459 people. HAZUS-MH
demographic data will be used in the loss estimation analyses in Section 5 of this plan. All demographic data in
HAZUS corresponds to the 2000 U.S. Census data. Table 4-2 presents the population statistics for Westchester
County based on the 2000 and 2010 U.S. Census data. For the purposes of this plan, the 2010 Census was used
where the data was available and supplemented with HAZUS-MH data (representing 2000 data). Table 4-2
show the distribution of the general population density (persons per square mile) by 2010 Census block, and
persons over the age of 65 and low income by 2000 Census block.
DMA 2000 requires that HMPs consider socially vulnerable populations. These populations can be more
susceptible to hazard events, based on a number of factors including their physical and financial ability to react
or respond during a hazard and the location and construction quality of their housing. For the purposes of this
study, vulnerable populations shall include (1) the elderly (persons aged 65 and over) and (2) those living in
low-income households.
Table 4-2. Westchester County Population Statistics
Municipality
U.S. Census 2010 U.S. Census 2000*
Total
Pop.
65+
% Pop.
65+ Total
Pop.
65+
Percent
Pop. 65+
Low-
Income
Pop. **
% Low-
Income
Pop. of
Total
Ardsley (V) 4,452 806 18.1% 4,269 626 14.7% 40 0.9%
Bedford (T) 17,335 2,166 12.5% 18,133 1,861 10.3% 441 2.4%
Briarcliff Manor (V) 7,867 1,213 15.4% 7,696 1,094 14.2% 189 2.5%
Bronxville (V) 6,323 881 13.9% 6,543 799 12.2% 153 2.3%
Buchanan (V) 2,230 331 14.8% 2,189 280 12.8% 62 2.8%
Cortlandt (T) 31,292 4,836 15.5% 28,672 3,617 12.6% 977 3.4%
Croton-on-Hudson (V) 8,070 1,160 14.4% 7,606 1,029 13.5% 213 2.8%
Dobbs Ferry (V) 10,875 1,652 15.2% 10,622 1,582 14.9% 416 3.9%
Eastchester (T) 19,554 3,656 18.7% 18,564 3,650 19.7% 730 3.9%
Elmsford (V) 4,664 510 10.9% 4,676 572 12.2% 187 4.0%
Greenburgh (T) 42,863 7,466 17.4% 41,828 6,116 14.6% 1,294 3.1%
Harrison (T) 27,472 3,525 12.8% 24,154 3,460 14.3% 877 3.6%
Hastings-on-Hudson (V) 7,849 1,360 17.3% 7,648 1,183 15.5% 284 3.7%
Irvington (V) 6,420 968 15.1% 6,631 900 13.6% 187 2.8%
Larchmont (V) 5,864 740 12.6% 6,485 845 13.0% 194 3.0%
Lewisboro (T) 12,411 1,439 11.6% 12,324 871 7.1% 141 1.1%
Mamaroneck (T) 11,977 1,819 15.2% 11,429 1,539 13.5% 301 2.6%
Mamaroneck (V) 18,929 2,867 15.1% 18,464 3,052 16.5% 989 5.4%
Mount Kisco (T) 10,877 1,460 13.4% 9,983 1,205 12.1% 629 6.3%
Mount Pleasant (T) 26,176 3,412 13.0% 26,151 3,678 14.1% 458 1.8%
Mount Vernon (C) 67,292 9,318 13.8% 68,381 8,812 12.9% 6,236 9.1%
New Castle (T) 17,569 1,999 11.4% 17,491 1,610 9.2% 224 1.3%
New Rochelle (C) 77,062 11,711 15.2% 72,182 11, 303 15.7% 5,037 7.0%
North Castle (T) 11,841 1,565 13.2% 10,849 1,135 10.5% 1,83 1.7%
North Salem (T) 5,104 913 17.9% 5,173 728 14.1% 77 1.5%
Ossining (T) 5,406 1,270 23.5% 5,514 1,012 18.4% 83 1.5%
Ossining (V) 25,060 2,614 10.4% 24,010 2,663 11.1% 1,346 5.6%
Peekskill (C) 23,583 2,786 11.85% 22,441 2,566 11.4% 1,762 7.9%

Section 4: County Profile
DMA 2000 Hazard Mitigation Plan Update – Westchester County, New York 4-11October 2015
Table 4-2. Westchester County Population Statistics
Municipality
U.S. Census 2010 U.S. Census 2000*
Total
Pop.
65+
% Pop.
65+ Total
Pop.
65+
Percent
Pop. 65+
Low-
Income
Pop. **
% Low-
Income
Pop. of
Total
Pelham (V) 6,910 797 11.5% 6,400 737 11.5% 211 3.3%
Pelham Manor (V) 5,486 769 14.0% 5,466 746 13.6% 100 1.8%
Pleasantville (V) 7,019 930 13.2% 7,172 950 13.2% 222 3.1%
Port Chester (V) 28,967 3,082 10.6% 27,867 3,648 13.1% 2,038 7.3%
Pound Ridge (T) 5,104 772 15.1% 4,726 568 12.0% 38 0.8%
Rye (C) 15,720 2,358 15.0% 14,955 1,977 13.2% 366 2.4%
Rye Brook (V) 9,347 1,841 19.7% 8,602 1,525 17.7% 213 2.5%
Scarsdale (T) 17,166 2,390 13.9% 17,823 2,075 11.6% 191 1.1%
Sleepy Hollow (V) 9,870 1,263 12.8% 9,212 973 10.6% 516 5.6%
Somers (T) 20,434 4,581 22.4% 18,346 3,524 19.2% 426 2.3%
Tarrytown (V) 11,277 1,642 14.6% 11,090 1,631 14.7% 459 4.1%
Tuckahoe (V) 6,486 995 15.3% 6,211 785 12.6% 474 7.6%
White Plains (C) 56,853 8,672 15.3% 53,077 7,936 15.0% 3,689 7.0%
Yonkers (C) 195,976 28,776 14.7% 196,086 29,703 15.1% 18,045 9.2%
Yorktown (T) 36,081 5,831 16.2% 36,318 4,816 13.3% 1,176 3.2%
Westchester County (TOTAL) 949,113 139,122 14.7% 923,459 129,382 14.0% 51,874 5.6%
Source: Census 2010 (U.S. Census Bureau); HAZUS-MH (for 2000 U.S. Census data)
Note: Pop. = population
* Individuals below poverty level (Census poverty threshold for a 3-person family unit is approximately $18,500)
It is noted that the Census data for household income provided in HAZUS-MH includes two ranges ($0-10,000
and $10,000-$20,000/year) that were totaled to provide the “low-income” data used in this study. This does not
correspond exactly with the “poverty” thresholds established by the 2013 U.S. Census Bureau, which identifies
households with three adults and no children with an annual household income below $18,222 per year, or
households with one adult and two children with an annual household income below $18,769 per year as “low
income” for this region. This difference is not believed to be significant for the purposes of this planning effort.
Figure 4-7 shows the distribution of persons over age 65 in Westchester County, while Figure 4-8 shows the
distribution of low income persons.

Section 4: County Profile
DMA 2000 Hazard Mitigation Plan Update – Westchester County, New York 4-12October 2015
Figure 4-6. Distribution of General Population for Westchester County, New York
Source: U.S. Census 2010

Section 4: County Profile
DMA 2000 Hazard Mitigation Plan Update – Westchester County, New York 4-13October 2015
Figure 4-7. Distribution of Persons over the Age of 65 in Westchester County, New York
Source: HAZUS-MH

Section 4: County Profile
DMA 2000 Hazard Mitigation Plan Update – Westchester County, New York 4-14October 2015
Figure 4-8. Distribution of Low-Income Population in Westchester County, New York
Source: HAZUS-MH

Section 4: County Profile
DMA 2000 Hazard Mitigation Plan Update – Westchester County, New York 4-15October 2015
4.3 GENERAL BUILDING STOCK
The 2000 U.S. Census data identified 337,142 households (349,445 housing units) in Westchester County. The
2010 U.S. Census reported 347,232 households (370,821 housing units) in Westchester County. The County
experienced an increase in both households and housing units from 2000 to 2010. As for households, between
2000 and 2010, the County saw a 3.0% increase. As for housing units, the County experienced an increase of
6.1% between 2000 and 2010. The U.S. Census defines household as all the persons who occupy a housing unit,
and a housing unit as a house, an apartment, a mobile home, a group of rooms, or a single room that is occupied
(or if vacant, is intended for occupancy) as separate living quarters. Therefore, you may have more than one
household per housing unit. The median price of an owner-occupied housing unit in Westchester County was
estimated at $533,300 (U.S. Census, 2014).
For this update, the default general building stock in HAZUS-MH was updated and replaced with a custom
building inventory for Westchester County both at the aggregate and structure level. The building stock update
was performed using the most current parcel and the New York State Department of Taxation and Finance tax
assessment data provided by Westchester County. The replacement cost value was calculated using the square
footage value of each building and RS Means 2014 data.
For the purposes of this plan, there are approximately 274,395 structures identified by the tax data and spatial
data available. These structures account for a replacement cost value of approximately $363 billion. Estimated
content value was calculated by using 50-percent of the residential replacement cost value, and 100-percent of
the non-residential replacement values. Using this methodology, there is approximately $148 billion in contents
within these properties. Approximately 92% of the total buildings in the County are residential, which make up
approximately 55% of the total building stock structural. Table 4-3 presents building stock statistics by
occupancy class for Westchester County.
Table 4-3. Number of Buildings and Improvement Value by Municipality
Municipality
All Occupancies
Count
Estimated Structure
RCV
Estimated Contents
RCV
Total (Structure +
Contents)
Ardsley (V) 1,625 $1,004,645,830 $668,391,704 $1,673,037,534
Bedford (T) 8,715 $5,451,464,008 $3,553,892,595 $9,005,356,603
Briarcliff Manor (V) 2,757 $2,194,162,224 $1,423,209,912 $3,617,372,136
Bronxville (V) 1,601 $1,694,686,839 $1,133,798,515 $2,828,485,354
Buchanan (V) 1,157 $1,944,545,818 $1,814,903,534 $3,759,449,352
Cortlandt (T) 12,791 $6,989,473,890 $4,724,517,316 $11,713,991,206
Croton-on-Hudson (V) 3,480 $2,119,932,123 $1,551,074,857 $3,671,006,980
Dobbs Ferry (V) 3,063 $2,194,515,432 $1,465,771,766 $3,660,287,199
Eastchester (T) 6,051 $3,609,064,266 $2,233,574,900 $5,842,639,167
Elmsford (V) 1,530 $1,011,898,477 $741,527,281 $1,753,425,758
Greenburgh (T) 13,622 $12,729,170,899 $9,164,746,258 $21,893,917,157
Harrison (T) 8,101 $9,147,880,385 $6,828,853,273 $15,976,733,658
Hastings-on-Hudson (V) 2,792 $1,527,655,704 $977,873,668 $2,505,529,372
Irvington (V) 2,126 $1,660,776,222 $1,056,714,326 $2,717,490,548
Larchmont (V) 2,246 $1,352,506,748 $830,289,492 $2,182,796,240

Section 4: County Profile
DMA 2000 Hazard Mitigation Plan Update – Westchester County, New York 4-16October 2015
Municipality
All Occupancies
Count
Estimated Structure
RCV
Estimated Contents
RCV
Total (Structure +
Contents)
Lewisboro (T) 6,515 $3,243,450,518 $1,908,841,328 $5,152,291,846
Mamaroneck (T) 3,820 $2,505,216,282 $1,486,941,344 $3,992,157,626
Mamaroneck (V) 5,367 $3,761,418,986 $2,589,431,656 $6,350,850,642
Mount Kisco (T) 2,894 $3,021,776,949 $2,374,261,158 $5,396,038,106
Mount Pleasant (T) 10,270 $9,223,489,016 $7,121,723,902 $16,345,212,918
Mount Vernon (C) 14,088 $10,513,643,877 $7,282,453,802 $17,796,097,679
New Castle (T) 7,520 $5,730,848,942 $3,556,502,900 $9,287,351,842
New Rochelle (C) 18,114 $14,173,804,740 $9,783,771,825 $23,957,576,566
North Castle (T) 5,718 $5,688,857,022 $3,897,348,778 $9,586,205,800
North Salem (T) 3,191 $1,600,118,414 $1,026,595,491 $2,626,713,905
Ossining (T) 2,144 $1,395,190,504 $970,655,862 $2,365,846,366
Ossining (V) 5,978 $3,475,001,257 $2,365,979,890 $5,840,981,147
Peekskill (C) 6,123 $4,197,700,345 $3,044,049,544 $7,241,749,890
Pelham (V) 2,303 $1,128,604,342 $733,358,180 $1,861,962,522
Pelham Manor (V) 2,239 $1,313,019,752 $860,690,923 $2,173,710,675
Pleasantville (V) 2,671 $1,538,985,095 $980,341,739 $2,519,326,833
Port Chester (V) 6,328 $4,704,483,378 $3,486,852,167 $8,191,335,545
Pound Ridge (T) 3,106 $1,678,304,487 $903,313,441 $2,581,617,927
Rye (C) 5,722 $4,349,710,315 $2,829,062,861 $7,178,773,176
Rye Brook (V) 3,354 $2,903,600,321 $1,960,246,092 $4,863,846,413
Scarsdale (T) 6,882 $4,500,173,896 $2,660,443,937 $7,160,617,833
Sleepy Hollow (V) 2,060 $1,761,996,250 $1,319,319,544 $3,081,315,794
Somers (T) 9,478 $6,068,992,967 $3,975,643,967 $10,044,636,934
Tarrytown (V) 3,042 $2,783,030,922 $1,946,401,719 $4,729,432,641
Tuckahoe (V) 1,521 $1,006,691,887 $628,617,835 $1,635,309,722
White Plains (C) 12,298 $16,704,710,777 $12,847,488,721 $29,552,199,498
Yonkers (C) 36,288 $32,794,059,885 $22,442,413,107 $55,236,472,993
Yorktown (T) 13,704 $8,358,614,593 $5,481,319,019 $13,839,933,612
Westchester County (Total) 274,395 $214,757,874,586 $148,633,210,129 $363,391,084,715
Source: Westchester County, 2014
Notes: RCV = Replacement cost value.

Section 4: County Profile
DMA 2000 Hazard Mitigation Plan Update – Westchester County, New York 4-17October 2015
Table 4-4. Number of Buildings and Total Replacement Value by Occupancy Class
Municipality
Residential Commercial Industrial
Count
Total (Structure +
Contents) Count
Total (Structure
+ Contents) Count
Total (Structure
+ Contents)
Ardsley (V) 1,521 $1,008,762,377 79 $330,002,147 7 $10,850,107
Bedford (T) 7,848 $5,692,714,238 448 $1,488,384,398 41 $102,422,778
Briarcliff Manor (V) 2,563 $2,312,856,935 124 $754,066,887 14 $106,807,410
Bronxville (V) 1,462 $1,682,664,971 59 $493,189,685 1 $135,936
Buchanan (V) 965 $388,926,855 45 $760,221,462 126 $2,535,970,779
Cortlandt (T) 11,857 $6,794,869,721 544 $2,408,254,113 69 $124,006,009
Croton-on-Hudson (V) 3,079 $1,706,571,797 202 $516,803,993 132 $1,026,931,026
Dobbs Ferry (V) 2,776 $2,186,230,999 96 $432,808,062 8 $23,235,251
Eastchester (T) 5,675 $4,126,468,099 292 $1,140,432,078 15 $35,556,490
Elmsford (V) 1,328 $811,113,587 143 $639,720,517 41 $118,642,297
Greenburgh (T) 12,415 $10,693,273,925 763 $7,790,275,416 79 $475,630,776
Harrison (T) 7,406 $6,957,081,335 337 $4,870,383,245 58 $700,974,763
Hastings-on-Hudson (V) 2,614 $1,649,346,107 63 $164,131,405 7 $101,670,387
Irvington (V) 1,971 $1,812,185,690 44 $103,129,028 12 $174,072,910
Larchmont (V) 2,116 $1,566,651,766 101 $372,253,093 5 $5,985,734
Lewisboro (T) 6,098 $4,003,827,569 284 $493,530,982 20 $26,708,777
Mamaroneck (T) 3,657 $3,054,824,815 116 $482,195,600 15 $24,410,620
Mamaroneck (V) 4,901 $3,515,961,990 359 $1,548,819,193 46 $406,962,232
Mount Kisco (T) 2,409 $1,942,547,373 383 $2,741,410,389 30 $275,087,667
Mount Pleasant (T) 9,098 $6,305,295,343 451 $4,015,805,930 136 $1,049,643,103
Mount Vernon (C) 12,424 $9,693,570,228 694 $3,383,456,070 685 $2,685,759,867
New Castle (T) 6,968 $6,523,038,128 289 $1,056,744,509 54 $211,728,006
New Rochelle (C) 16,673 $13,170,098,745 967 $6,466,586,286 127 $1,009,407,239
North Castle (T) 5,095 $5,374,524,733 365 $2,303,865,798 101 $1,052,268,514
North Salem (T) 2,832 $1,720,568,769 232 $460,644,251 16 $34,900,139
Ossining (T) 1,960 $1,273,603,927 127 $598,582,607 8 $18,829,641
Ossining (V) 5,450 $3,327,064,099 291 $807,427,166 93 $430,967,277
Peekskill (C) 5,507 $3,460,952,403 391 $1,554,962,576 108 $1,101,701,518
Pelham (V) 2,185 $1,185,738,487 100 $323,520,838 3 $50,570,958
Pelham Manor (V) 2,096 $1,356,986,488 94 $654,364,358 17 $37,420,800
Pleasantville (V) 2,451 $1,675,930,067 120 $336,837,628 28 $137,594,502
Port Chester (V) 5,806 $3,652,893,634 405 $3,787,416,972 38 $158,696,544
Pound Ridge (T) 2,950 $2,324,973,139 107 $163,358,992 3 $1,972,951
Rye (C) 5,297 $4,561,942,361 326 $1,561,981,553 33 $111,000,269
Rye Brook (V) 3,190 $2,830,062,684 92 $1,054,199,430 18 $422,407,776
Scarsdale (T) 6,675 $5,519,189,875 93 $396,475,534 9 $53,031,282

Section 4: County Profile
DMA 2000 Hazard Mitigation Plan Update – Westchester County, New York 4-18October 2015
Municipality
Residential Commercial Industrial
Count
Total (Structure +
Contents) Count
Total (Structure
+ Contents) Count
Total (Structure
+ Contents)
Sleepy Hollow (V) 1,865 $1,328,030,120 99 $1,274,451,270 14 $22,216,630
Somers (T) 8,946 $6,280,047,000 306 $2,397,400,368 25 $47,404,100
Tarrytown (V) 2,742 $2,509,887,609 167 $1,343,854,112 11 $33,326,513
Tuckahoe (V) 1,399 $1,134,222,158 77 $315,649,082 14 $47,102,370
White Plains (C) 11,325 $11,571,666,166 693 $13,209,679,687 51 $518,200,931
Yonkers (C) 33,210 $31,054,940,335 1,661 $10,781,622,831 611 $6,181,766,732
Yorktown (T) 12,767 $8,631,886,721 560 $3,009,819,645 72 $226,329,738
Westchester County (Total) 251,572 $198,373,993,368 13,189 $88,788,719,187 3,001 $21,920,309,350
Source: Westchester County, 2014
Notes: Industrial includes buildings associated with public utilities parcels (categorized as IND5) - 50.1% of total
Commercial includes residential garages (categorized as COM10) – 0.005% of total value
The 2012 American Community Survey data identified that the majority of housing units (45.6% or 168,877
units) in Westchester County are single-family detached units. The 2012 U.S. Census Bureau’s County Business
Patterns data identified 31,469 business establishments employing 378,508 people in Westchester County. The
professional, scientific, and technical services industry has the most number of establishments in the County,
with 4,233 establishments. This is followed by the construction industry with 3,288 establishments and the other
services industry with 3,270 establishments (U.S. Census, 2012).
Figure 4-8 through Figure 4-10 show the distribution and exposure density of residential, commercial and
industrial buildings in Westchester County based on the New York State Department of Taxation and Finance
Property Class Code. Exposure density is the dollar value of structures per unit area, including building content
value. Generally, contents for residential structures are valued at about 50 percent of the building’s value. For
commercial facilities, the value of the content is generally about equal to the building’s structural value. Actual
content value various widely depending on the usage of the structure. The densities are shown in units of $1,000
($K) per square mile.
Viewing exposure distribution maps, such as Figure 4-9 through Figure 4-11 can assist communities in
visualizing areas of high exposure and in evaluating aspects of the study area in relation to the specific hazard
risks.

Section 4: County Profile
DMA 2000 Hazard Mitigation Plan Update – Westchester County, New York 4-19October 2015
Figure 4-9. Distribution of Residential Building Stock and Value Density in Westchester County
Source: HAZUS-MH 2.1

Section 4: County Profile
DMA 2000 Hazard Mitigation Plan Update – Westchester County, New York 4-20October 2015
Figure 4-10. Distribution of Commercial Building Stock and Exposure Density in Westchester County
Source: HAZUS-MH 2.1
Note: Residential parking garages listed as COM10 – 0.005% of total value

Section 4: County Profile
DMA 2000 Hazard Mitigation Plan Update – Westchester County, New York 4-21October 2015
Figure 4-11. Distribution of Industrial Building Stock and Value Density in Westchester County
Source: HAZUS-MH 2.1Note: Buildings associated with public utilities are listed as IND5 – 50.1% of total value

Section 4: County Profile
DMA 2000 Hazard Mitigation Plan Update – Westchester County, New York 4-22October 2015
4.4 LAND USE AND POPULATION TRENDS
In New York State, land use regulatory authority is vested in towns, villages, and cities. However, many
development and preservation issues transcend local political boundaries. DMA 2000 requires that communities
consider land use trends, which can impact the need for, and priority of, mitigation options over time. Land use
trends can also significantly impact exposure and vulnerability to various hazards. For example, significant
development in a hazard area increases the building stock and population exposed to that hazard.
This plan provides a general overview of population and land use and types of development occurring within the
county. An understanding of these development trends can assist in planning for future development and
ensuring that appropriate mitigation, planning, and preparedness measures are in place to protect human health
and community infrastructure.
4.4.1 Land Use Trends
A report prepared by the Westchester County Department of Planning titled Land Use in Westchester dated
2010, is a comprehensive resource for land use planners, policymakers, researchers, business communities, and
residents. The report presents data and information on the present state of land use in Westchester County.
Following is a summary of land use trends as presented in the report. For more information regarding land use
trends in the County, see Land Use in Westchester found here:
http://planning.westchestergov.com/images/stories/reports/LandUseReport1.pdf or visit the Westchester 2025
Web site at http://westchester2025.westchestergov.com/.
Over the past ten years, land use trends in Westchester County have had both positive and negative impacts on
the county. New development and redevelopment have strengthened the county’s municipal centers, as well as
waterfront areas. Open space protection has preserved important natural resources and scenic features in the
county as well. Major subdivisions, big box stores, and generic retail developments have been constructed on
previously vacant lands and have changed the character of some Westchester County communities.
Eight major land trends over the past 14 years have been identified in the county. Their effect on the county’s
communities has been apparent in recent years. Some of these trends have had positive effects on a community’s
function and character, while others have had a more negative impact. Communities lacking the necessary
zoning and land use regulations to avoid low-quality development were more negatively affected by these trends
than those that planned comprehensively and produced zoning frameworks protective of community character
and focused on efficient growth and development.
These eight trends are as follows:
Redevelopment in central cities
Development and redevelopment in small centers
Riverfront redevelopment
Preservation of open space
Build-out of large subdivisions
Growth of generic retail developments
Development of big box stores
Reuse of corporate campuses and office parks
The cities of White Plains, New Rochelle, and Yonkers are three of the largest cities in Westchester County.
The downtown areas of these cities benefited from the real estate and construction boom that occurred between
1995 and the early 2000s. The urban environments and transit accessibility of these three cities made them

Section 4: County Profile
DMA 2000 Hazard Mitigation Plan Update – Westchester County, New York 4-23October 2015
particularly attractive to commuters and residents desiring an urban lifestyle without the costs associated with
living in New York City.
Many of the county’s smaller municipalities are rediscovering historic strengths as convenient and walkable
community centers near transit. The central business districts of communities, such as Tuckahoe, Pelham, and
Scarsdale, have seen infill development on under-utilized or vacant properties and adaptive reuse of former
industrial and commercial buildings. These communities have increased their mix of uses, from residential
apartments to offices, stores, and restaurants.
The communities along the Hudson River have encouraged the construction of industrial and commercial
buildings along large portions of the waterfront during the 19th and early 20th centuries. As the region’s economy
shifted from manufacturing and transportation shifted to cars and trucks, the need for large industrial sites and
shipping of goods was reduced. This left many of the old waterfront industrial buildings empty, leaving many
communities large underutilized buildings and polluted sites along the waterfront. Many communities have
recognized the economic, environmental, and aesthetic value of their waterfront areas and been involved in
finding new uses for these properties.
Westchester County has a history of preserving open space for its environmental, scenic, and recreational quality.
Since the late 1990s, the County has worked to fund and acquire over 1,900 acres of open space. This includes
privately-held open spaces. Westchester County has over 51,000 acres of open space, occupying 18% of the
total land area. Some of the areas include: Taxter Ridge Park Preserve in the Town of Greenburgh (199 acre
site), Leon Levy Preserve in the Town of Lewisboro (383 acre site), and Angle Fly Preserve in the Town of
Somers (654 acre site).
The growth of the County’s suburbs occurred after World War II in single-family subdivisions. By the end of
the 20th century, the area of single-family subdivision development moved north of Westchester County as land
available for large subdivisions became scarcer. Developers in the County realized that they must turn to other
means to continue to build housing and to do business in the County. In the 1990s, the County started
experiencing a trend toward tearing down old homes and replacing with new, larger residences. Today, many
municipalities have passed ordinances banning the teardown practice, and others have used site layout and design
regulations to make certain that new homes positively impact neighborhood character.
Westchester County communities have experienced a large growth in the number of generic commercial
developments, especially banks, retail pharmacies, and convenience stores. The presence of these businesses
provides convenient access to import services; however, the rapid increase in the number of chain businesses
has garnered community opposition in many places since these businesses hurt small, local ones that provide the
same services.
Big box stores are large chain retail businesses that provide a variety of goods and services. With the
convenience of these stores, many smaller, independent businesses that have less diverse product offerings have
been replaced. The development of the big box stores requires large tracts of land, but the presence of available
land for commercial development in the County has been limited by commercial areas that are more restricted
and confined than in many other areas. In order to develop in Westchester County, many big box stores have
readapted previously developed commercial sites or have changed their standard architectural and site design
approaches.
Many corporate office parks and corporate campuses are found in Westchester County. Corporate campuses are
large tracts of land owned and occupied by single corporate tenants and which often include substantial
reservations of open space and park-like landscape design. Office parks typically include one or more buildings,
sometimes with multiple tenants, on large landscaped properties. Today, the region’s economy has shifted

Section 4: County Profile
DMA 2000 Hazard Mitigation Plan Update – Westchester County, New York 4-24October 2015
toward smaller firms, reducing the demand for these facilities; thus, creating redevelopment challenges to
corporate campuses and office parks. Many of these office areas were approved with the understanding that
large areas of their sites would be maintained or protected as permanent open space. Identifying the best
opportunities for reusing corporate campuses and office parks will ensure that communities have a vision in
place should these businesses relocate and require reuse of the properties.
4.4.2 Population Trends
This section discusses population trends to use as a basis for estimating future changes of the population and
significantly change the character of the area. Population trends can provide a basis for making decisions on the
type of mitigation approaches to consider and the locations in which these approaches should be applied. This
information can also be used to support planning decisions regarding future development in vulnerable areas.
According to the U.S. Census Bureau Westchester County’s 2010 population was 949,113 persons, which is
2.8% increase from the 2000 Census population of 923,459. From 1900 to 1970, the County experienced a
constant growth. The only decrease in population was seen between 1970 and 1980, when the County had a
3.1% decrease in population. The largest increase was seen between 1900 and 1910 when the population of the
County grew by 53.6% (98,798 persons). The smallest increase was seen between 1980 and 1990 when the
County only had a 1% increase in population (8,267 persons). Table 4-5 displays the population and change in
population from 1900 to 2013 in Westchester County.
Table 4-5. Westchester County Population Trends, 1900 to 2013
Year Population
Change in
Population
Percent (%)
Population
Change
1900 184,257 N/A N/A
1910 283,055 98,798 53.6
1920 344,436 61,381 21.7
1930 520,947 176,511 51.2
1940 573,558 52,611 10.1
1950 625,816 52,258 9.1
1960 808,891 183,075 29.3
1970 894,104 85,213 10.5
1980 866,599 -27,505 -3.1
1990 874,866 8,267 1.0
2000 923,459 48,593 5.6
2010 949,113 25,654 2.8
2013 968,802 19,689 2.1
Source: U.S. Census Bureau, 2014
Note: Change in population and percent in population change was calculated from available data
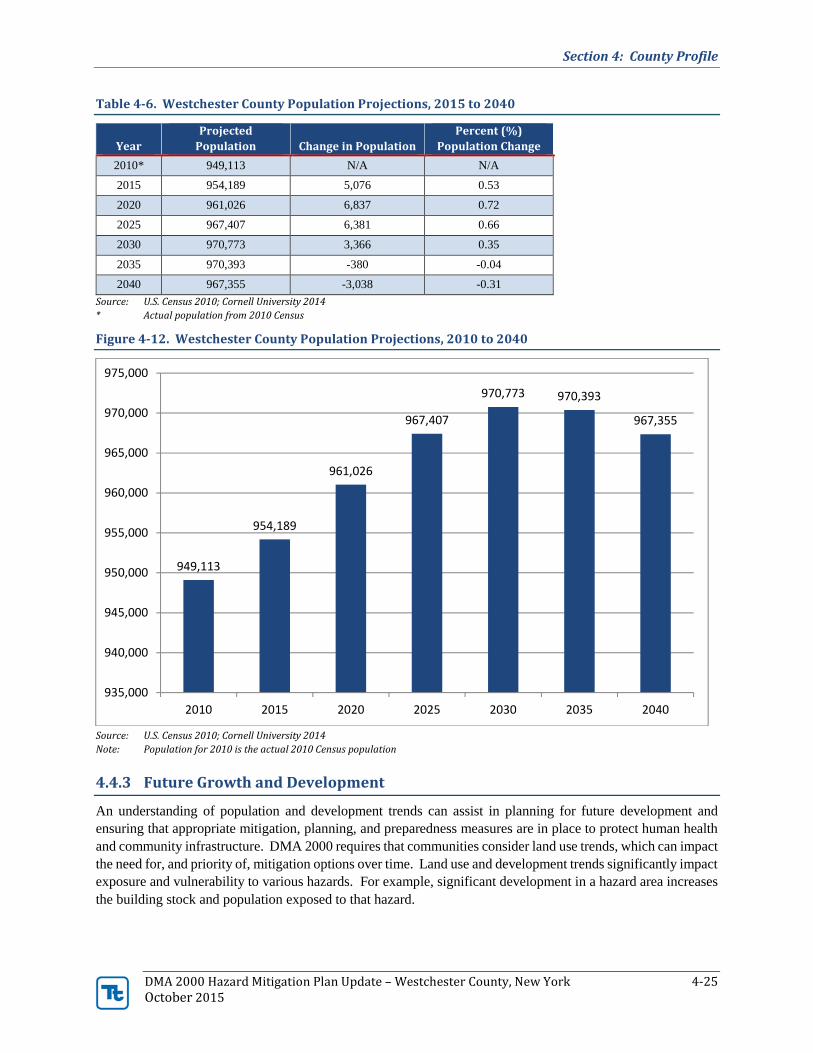
Over the next 25 years, from 2015 to 2040, Westchester County has a projected population growth of 1.4%
percent. Based on projections from the Cornell University Program on Applied Demographics, the County
population is expected to reach 954,189 by 2015 and 967,355 by 2040 (Table 4-6).
Section 4: County Profile
DMA 2000 Hazard Mitigation Plan Update – Westchester County, New York 4-25October 2015
Table 4-6. Westchester County Population Projections, 2015 to 2040
Year
Projected
Population Change in Population
Percent (%)
Population Change
2010* 949,113 N/A N/A
2015 954,189 5,076 0.53
2020 961,026 6,837 0.72
2025 967,407 6,381 0.66
2030 970,773 3,366 0.35
2035 970,393 -380 -0.04
2040 967,355 -3,038 -0.31
Source: U.S. Census 2010; Cornell University 2014
* Actual population from 2010 Census
Figure 4-12. Westchester County Population Projections, 2010 to 2040
Source: U.S. Census 2010; Cornell University 2014
Note: Population for 2010 is the actual 2010 Census population
4.4.3 Future Growth and Development
An understanding of population and development trends can assist in planning for future development and
ensuring that appropriate mitigation, planning, and preparedness measures are in place to protect human health
and community infrastructure. DMA 2000 requires that communities consider land use trends, which can impact
the need for, and priority of, mitigation options over time. Land use and development trends significantly impact
exposure and vulnerability to various hazards. For example, significant development in a hazard area increases
the building stock and population exposed to that hazard.
949,113
954,189
961,026
967,407
970,773 970,393
967,355
935,000
940,000
945,000
950,000
955,000
960,000
965,000
970,000
975,000
2010 2015 2020 2025 2030 2035 2040

Section 4: County Profile
DMA 2000 Hazard Mitigation Plan Update – Westchester County, New York 4-26October 2015
Local zoning and planning authority is provided for under the New York State General Municipal Law, which
gives municipalities zoning and planning authority. Refer to Sections 6 and 9 for further details on the planning
and regulatory capabilities for the County and each municipality.
New development that has occurred in the last five years within the County, and potential future development
in the next five years as identified by the county and each municipality, is included in the jurisdictional annexes
in Section 9, along with an indication of proximity to known hazard zones. Recent, ongoing, and
known/anticipated future development identified by the municipalities has been cross-checked and augmented
with a county-level development inventory (2014) provided by the Westchester County Department of Planning,
illustrated in Figure 4-13. The county-level inventory includes major development projects referred to the
County as part of the mandatory site plan review referral process, and does not include all development in the
County.

Section 4: County Profile
DMA 2000 Hazard Mitigation Plan Update – Westchester County, New York 4-27October 2015
Figure 4-13. New Development in Westchester County (2014 County Referral Locations)
Source: Westchester County Department of Planning, 2015

Section 4: County Profile
DMA 2000 Hazard Mitigation Plan Update – Westchester County, New York 4-28October 2015
4.5 CRITICAL FACILITIES
A comprehensive inventory of critical facilities in Westchester
County was developed from various sources including input from
the Planning Committees. The inventory of critical facilities
presented in this section represents the current state of this effort
at the time of publication of the HMP and was used for the risk
assessment in Section 5. For detailed lists of the critical facilities,
please refer to Appendix G.
Various municipal and County departments and agencies have
included mitigation actions to address vulnerable critical
facilities. These actions have been proposed in consideration of
protection against 500-year events, or worst-case scenarios.
These actions have been proposed in consideration of protection
against 500-year events, or worst-case scenarios. When
determined to be feasible and practical, mitigation planning for
critical facilities identified as previously sustaining flooding
and/or being located in a FEMA floodplain will be developed to
achieve protection to the 500-year flood event or the actual worst-
damage scenario, whichever is greater.
It is recognized, however, that in the case of projects being funded
through Federal mitigation programs, the level of protection may be influenced by cost-effectiveness as
determined through a formal benefit-cost analysis. In the case of “self-funded” projects, local government
authority must be recognized. Further, it must be recognized that the County and municipalities have limited
authority over privately-owned critical facility owners with regard to mitigation at any level of protection.
4.5.1 Essential Facilities
This section provides information on emergency facilities, hospital and medical facilities, schools, shelters and
senior care and living facilities. For the purposes of this Plan, emergency facilities include police, fire,
emergency medical services (EMS) and emergency operations centers (EOC). Figure 4-14 displays the location
of the essential facilities in Westchester County.
Emergency Facilities
The Westchester County Department of Emergency Services is composed of four separate divisions, the
Emergency Communications Division, the Fire Services Coordination-Training Division, the Emergency
Medical Services Coordination-Training Division and the Office of Emergency Management. The Department
is responsible for aiding communities in emergency planning and response, as well as providing the training and
equipment for the County’s first responders and volunteers. Additionally, the Department operates a 24-hour
Emergency Communications Center.
Almost all of the County’s municipalities are serviced by their own fire department, with the exception of Rye
Brook, which is primarily serviced by departments located in Port Chester. Police enforcement and public safety
is maintained by the New York State Police Department, Westchester County Police and local departments.
There are 138 fire facilities, 41 EMS facilities, 53 police facilities, and six EOCs located in Westchester County.
Critical facilities are those facilities considered
critical to the health and welfare of the
population and that are especially important
following a hazard. As defined for this HMP,
critical facilities include essential facilities,
transportation systems, lifeline utility systems,
high-potential loss facilities and hazardous
material facilities.
Essential facilities are a subset of critical
facilities that include those facilities that are
important to ensure a full recovery following
the occurrence of a hazard event. For the
County risk assessment, this category was
defined to include police, fire, EMS, EOCs,
schools, shelters, senior facilities and medical
facilities.
Emergency Facilities are for the purposes of
this Plan, emergency facilities include police,
fire, emergency medical services (EMS) and
emergency operations centers (EOC).

Section 4: County Profile
DMA 2000 Hazard Mitigation Plan Update – Westchester County, New York 4-29October 2015
Hospitals and Medical Facilities
The County also has multiple hospitals and health care facilities; these facilities range in size and primary
function that include smaller psychiatric and children’s hospitals and the larger, regional Westchester Medical
Center. There are 129 healthcare facilities in the County.
Schools
There are 386 primary educational facilities (elementary, middle and high schools) and 30 secondary educational
facilities (colleges and universities) located in Westchester County. In times of need, schools can function as
shelters and are an important resource to the community. For information regarding shelters, see the Shelters
subsection of this document.
Senior Care and Living Facilities
The County has an extensive system of programs and services for the senior population. This includes 39 nursing
homes 120 senior centers, and 18 senior housing facilities. These facilities are highly vulnerable to potential
impacts from disasters, and knowing the location and numbers of these types of facilities will be effective in
managing a response plan pre- and post-disaster.
Shelters
With support and cooperation of the American Red Cross and local jurisdictions, the County references an
inventory of suitable shelter locations and can assist with the coordination and communication of shelter
availability as necessitated by the execution of local municipal emergency operation plans. There are 35 shelter
facilities in the County. County-wide sheltering policies and procedures are documented in the following plans:
Westchester County Comprehensive Emergency Management Plan, Coastal Storm Emergency Response
Annex (Evacuation Centers/Shelters) – June, 2009
Westchester County Comprehensive Emergency Management Plan, Hazardous Materials EmergencyResponse Annex (In-Place Sheltering/Evacuation) – September, 2014
Westchester County Radiological Emergency Response Plan (Reception/Congregate Care Centers) –August, 2014
Specific shelter locations are identified on the Westchester County Website at:http://giswww.westchestergov.com/gismap/default.aspx?ovmap=hurricane
Evacuation Routes
The County has identified evacuation zones for hurricanes, maintains specific evacuation plans for radiological
emergencies associated with Indian Point Energy Center, and can assist with the coordination and
communication of evacuation routing as necessitated by the execution of local municipal emergency operation
plans.
Hurricane Emergency Evacuation Zones are identified at:
http://giswww.westchestergov.com/gismap/default.aspx?ovmap=hurricane
Specific evacuation routes are identified in the Westchester County Radiological Emergency Response
Plan – August, 2014
Westchester County Evacuation Bus Routes are also posted for residents who lack their own
transportation, and can be found at:
http://keepingsafe.westchestergov.com/images/stories/pdfs/IPEmergencyGuide2014-15.pdf

Section 4: County Profile
DMA 2000 Hazard Mitigation Plan Update – Westchester County, New York 4-30October 2015
The County has identified a number of mitigation actions within their County annex (Section 9.1) that willimprove county-wide emergency management capabilities, including evacuation and sheltering, as follows:
WCDES-1: County-Wide Evacuation Route and Sheltering Plan Initiative
WCDES-2: County-Wide Disaster Housing Location/Relocation Planning Initiative
WCDES-4: Develop Comprehensive County-Wide Critical Facility Database
WCDES-5: Create a Multi-Jurisdictional Access and Functional Needs Preparedness Committee

Section 4: County Profile
DMA 2000 Hazard Mitigation Plan Update – Westchester County, New York 4-31October 2015
Figure 4-14. Emergency Facilities in Westchester County
Source: Westchester County, HAZUS-MH

Section 4: County Profile
DMA 2000 Hazard Mitigation Plan Update – Westchester County, New York 4-32October 2015
4.5.2 Transportation Systems
Westchester County’s location and extensive transportation network offer residents and employees various
options for transportation throughout the County and the region. The County’s location within the New York
City metropolitan region is one of its most important assets. Westchester County’s transportation system
includes an extensive network of roads, access to national and commuter rail, countywide bus service, an airport
providing domestic services, regional ferry service, and a pedestrian and bicycle network. Figure 4-15 shows
the regional transportation systems found in Westchester County.
The County has over 3,200 miles of public roadways. County roads total 154 miles and State road make up
approximately 760 miles of Westchester County’s road network. Interstate (I)-95 is the east coast’s major
interstate highway. It is known as the New England Thruway in New York State and runs through southern
Westchester County parallel to the Long Island Sound and gives residents and commuters access to New York
City and New England. I-87 (New York State Thruway) runs north-south on the western side of the County and
links Westchester with New York City and upstate New York and Canada. The Cross Westchester Expressway,
I-287, runs east-west across the center of the County and connects I-87, the Tappan Zee Bridge, and I-95. It also
passes through the City of White Plains. I-684 runs north from White Plains into Putnam County through the
central and northern suburbs and provides a connection to I-84.
In addition to the major interstates found in Westchester County, there is a network of six scenic parkways that
facilitate travel within the County and beyond. These parkways include the following: Bronx River, Hutchinson
River, Cross County, Saw Mill River, Taconic State, and the Sprain Brook.
Residents of Westchester County have the highest rate of public transportation usage for commuting to work
among all suburban counties in the New York City metropolitan area. Over 20% of County resident workers
use railroad, subway or bus travel to work. Metro-North Railroad riders are a large portion of the public
transportation users, with over 55,000 County residents reporting travel via railroad as their primary mode of
transportation to work. The different modes of transportation provided in the County are discussed below.

Section 4: County Profile
DMA 2000 Hazard Mitigation Plan Update – Westchester County, New York 4-33October 2015
Figure 4-15. Transportation Facilities in Westchester County
Source: Westchester County, HAZUS-MH

Section 4: County Profile
DMA 2000 Hazard Mitigation Plan Update – Westchester County, New York 4-34October 2015
Bus and Other Transit Facilities
Numerous bus services are available in Westchester County. The Bee-Line System is run by the County’s
Department of Public Works and Transportation and provides an extensive network of local, express, and
railroad feeder bus services to customers throughout the county. It is one of the 40 largest bus systems in North
America. The Bee-Line operates between Westchester County and Manhattan, the Bronx and Putnam County
with 89 routes in the system. The Bee-Line also provides express routes for White Plains, an express service to
Manhattan and an Airlink service between White Plains and the Westchester County Airport. Many of the
System’s routes are designed to provide connecting service to Metro-North trains, New York City transit bus
and subway lines, and other transit systems. In addition to the Bee-Line system, other bus services are available
between Westchester and surrounding areas. There are 17 bus and other transit facilities located in Westchester
County, including: Transportation of Rockland, I-Bus Transit (CT), The Leprechaun Connection, Orange-
Westchester Line, Putnam Area Rapid Transit, and Greyhound and Trailways.
Railroad Facilities
There are two types of rail systems in Westchester County: interstate rail and commuter rail. Amtrak connects
three stations in Westchester County with points throughout the national rail system. The New Rochelle station
is located along Amtrak’s Northeast Corridor and provides regional service to Boston, Springfield, New York
City, and Washington D.C. The Croton-Harmon and Yonkers stations are served daily by five Amtrak lines: the
Lakeshore Limited, the Adirondack, the Ethan Allen Express, the Maple Leaf, and Empire Service. Connecting
rail service is available to many other points throughout the U.S. and Canada.
The Metropolitan Transportation Authority (MTA) Metro-North Railroad (Metro-North) provides commuter rail
service to 44 stations and to 75% of all communities in Westchester County. Three branches, the Hudson,
Harlem, and New Haven Lines, connect County communities to New York City’s Grand Central Terminal. The
Hudson Lines serves the portion of Westchester County along the Hudson River. The Harlem Line serves the
central part of the County and the New Haven Line serves areas along Long Island Sound. There are 45 rail
facilities located in Westchester County.
Airports
The Westchester County Airport is located five miles northeast of the City of White Plains’ downtown area.
This central location serves as the gateway to Westchester County and puts in close proximity to one of the
largest concentrations of company headquarters in the U.S. It has been cited that the Airport’s accessibility and
its ability to accommodate both corporate and commercial aircraft are benefits to many businesses in the County.
Additionally, New York-Kennedy, New York-LaGuardia, Newark-Liberty, Hartford-Bradley, and Newburgh-
Stewart Airports are within 100 miles of most points in Westchester County. The Westchester County Airport
handles all types of aircraft ranging from single engine aircraft to large corporate jets and commercial airliners.
Ferry Service and Ports
Passenger ferries connecting Westchester County locations with Rockland County and New York City are
available for commuters, residents, and visitors. The major ferry service providers include: NY Waterway and
New York Water Taxi with the ferry terminal located in the Village of Ossining. There are 32 port facilities, 64
marinas and one ferry facility in Westchester County.
4.5.3 Lifeline Utility Systems
This section presents potable water, wastewater, energy resource, and communication utility system data. Due
to heightened security concerns, local utility lifeline data sufficient to complete the analysis have only partially

Section 4: County Profile
DMA 2000 Hazard Mitigation Plan Update – Westchester County, New York 4-35October 2015
been obtained. Westchester County is served by a variety of communications systems, including traditional land
line, fiber optic, and cellular provided by multiple companies, such as Verizon, Direct TV, and Cablevision and
Optimum Online. There is one communication facility in Westchester County identified as a critical facility.
Each carrier has individual plans for emergency situations during hazard events and post disaster recovery
efforts. In addition to land line, fiber optic and cellular communications systems, Westchester County has an
extensive radio communications network that is utilized by emergency services agencies, hospitals, law
enforcement, public works, transportation and other supporting organizations.
Figure 4-16 shows the locations of the facilities for these various lifeline utility systems.
Potable Water
In Westchester County, water is provided from various facilities as a public service or through private supplies,
such as wells. Community water suppliers serve 95% of the county’s land area while the remaining area of the
county is served by on-site wells. Municipal suppliers are the local governments which have service areas
corresponding to the boundaries of the municipality.
The principal water source for both municipal and private suppliers is the New York City water supply system
which serves approximately 85% of the county’s total population. Details regarding the New York City reservoir
and aqueduct system are described earlier in this section.
There are two inter-municipal water suppliers, the Westchester Joint Water Works (WJWW) and the Northern
Westchester Joint Water Works (NWJWW), established under inter-municipal agreements. The WJWW serves
the Town of Mamaroneck, the villages of Mamaroneck and Larchmont, and portions of Harrison and the City
of Rye. The NWJWW serves the towns of Yorktown and Cortlandt and the Montrose Improvement District.
Private suppliers vary greatly in size, from homeowner associations serving a small area to the larger private
water companies serving several municipalities.
Four County water districts, each covering several municipalities or portions thereof, have been established to
distribute water and/or to provide benefits (treatment, maintenances, or administration of the water supply).
1. County Water District (CWD) 1 – serves the cities of White Plains, Yonkers, Mount Vernon, and the
Village of Scarsdale
2. CWD 2 – serves portions of the towns of Yorktown, Cortlandt, and Somers
3. CWD 3 – serves the Westchester Medical Center
4. CWD 4 – serves the City of Rye, and the villages of Rye Brook and Port Chester, which are currently
serviced by United Water of New Rochelle
There are 651 potable water facilities, 13 water towers, 388 potable wells, 66 potable pumps, and five potable
tanks in Westchester County.
Wastewater Facilities
Municipal wastewater collection systems connect with Westchester County trunk sewers which serve 13 separate
sewer districts. However, not all areas within districts are served by public sewers. The southern and central
portions of Westchester County are served by the County’s seven wastewater treatment plants: Blind Brook,
Mamaroneck, Port Chester, and New Rochelle plants on the Long Island Sound shore and Yonkers, Ossining,
and Peekskill plants on the Hudson River shore. These plants are located where 90% of the County’s population
resides. The plants are fed by 194 miles of trunk sewers and 40 pump stations.
Most areas in northern Westchester County are dependent on subsurface sewage disposal systems (septic
systems) located on each lot or are served by a few locally-based central sewage collection and treatment

Section 4: County Profile
DMA 2000 Hazard Mitigation Plan Update – Westchester County, New York 4-36October 2015
districts. By land area, approximately one-third of the county is dependent on septic systems. Most of this land
is located within the Croton watershed which encompasses five reservoirs that are part of the New York City
water supply systems (discussed earlier in this profile). There are also 28 privately and municipally-owned
wastewater collection, treatment and disposal systems located in the Croton watershed. These facilities
discharge four million gallons of treated effluent daily. . There are 64 wastewater pump facilities and 147
wastewater facilities located in the County.
Energy Resources
Power in Westchester County is transmitted and distributed by two companies: Consolidated Edison Company
of New York (Con Ed) and New York State Electric and Gas (NYSEG). Homes in the county are heated by
many different sources, with a majority using utility gas or fuel oil. There are 12 electric power facilities and 11
electric substations in Westchester County.
Communications
Westchester County is served by a variety of communications systems, including traditional land line, fiber optic,
and cellular provided by multiple companies, such as Verizon, Direct TV, and Cablevision and Optimum Online.
There is one communication facility in Westchester County identified as a critical facility. Each carrier has
individual plans for emergency situations during hazard events and post disaster recovery efforts. In addition to
land line, fiber optic and cellular communications systems, Westchester County has an extensive radio
communications network that is utilized by emergency services agencies, hospitals, law enforcement, public
works, transportation and other supporting organizations.

Section 4: County Profile
DMA 2000 Hazard Mitigation Plan Update – Westchester County, New York 4-37October 2015
Figure 4-16. Utility Lifelines in Westchester County
Source: Westchester County

Section 4: County Profile
DMA 2000 Hazard Mitigation Plan Update – Westchester County, New York 4-38October 2015
4.5.4 High-Potential Loss Facilities
High-potential loss facilities include dams, levees, hazardous materials facilities (HAZMAT), nuclear power
plants and military installations. There is one nuclear power plant, Indian Point located in the Village of
Buchanan, and one military installation, Camp Smith in the Town of Cortlandt. Dams are discussed below.
Figure 4-17 shows the locations of the High-Potential Loss Facilities in the county.
Dams and Levees
According to the NYSDEC Division of Water Bureau and Flood Protection and Dam Safety, there are three
hazard classifications of dams in New York State. The dams are classified in terms of potential for downstream
damage if the dam were to fail. The hazard classifications are as follows:
Low Hazard (Class A) is a dam located in an area where failure will damage nothing more than isolated
buildings, undeveloped lands, or township or county roads and/or will cause no significant economic
loss or serious environmental damage. Failure or mis-operation would result in no probable loss of
human life. Losses are principally limited to the owner's property
Intermediate Hazard (Class B) is a dam located in an area where failure may damage isolated homes,
main highways, minor railroads, interrupt the use of relatively important public utilities, and/or will
cause significant economic loss or serious environmental damage. Failure or mis-operation would result
in no probable loss of human life, but can cause economic loss, environment damage, disruption of
lifeline facilities, or impact other concerns. Significant hazard potential classification dams are often
located in predominantly rural or agricultural areas but could be located in areas with population and
significant infrastructure.
High Hazard (Class C) is a dam located in an area where failure may cause loss of human life, serious
damage to homes, industrial or commercial buildings, important public utilities, main highways or
railroads and/or will cause extensive economic loss. This is a downstream hazard classification for
dams in which excessive economic loss (urban area including extensive community, industry,
agriculture, or outstanding natural resources) would occur as a direct result of dam failure.
According to the U.S. Army Corps of Engineers National Inventory of Dams (NID), there are 87 dams located
within Westchester County. These numbers differ from the National Performance of Dam Program (NPDP)
which indicates that there are 86 dams in Westchester County (31 high hazard, 48 significant hazard and seven
low hazard). For the purpose of this plan, the NYSDEC data from the New York State GIS Clearinghouse will
be used. According to the GIS data, there are 199 dams located in Westchester County (105 Class A, 45 Class
B, 32 Class C, six Class D and 11 unclassified). Refer to Appendix G for the names and locations of the dams
found in the county.
4.5.5 Other Facilities
The Planning Committee identified 129 additional facilities (user-defined facilities) as critical including
municipal buildings and other government facilities. These facilities were included in the risk assessment
conducted for the county. Figure 4-18 shows the locations of these facilities in the county.

Section 4: County Profile
DMA 2000 Hazard Mitigation Plan Update – Westchester County, New York 4-39October 2015
Figure 4-17. High-Potential Loss Facilities in Westchester County
Source: Westchester County

Section 4: County Profile
DMA 2000 Hazard Mitigation Plan Update – Westchester County, New York 4-40October 2015
Figure 4-18. Other Facilities in Westchester County
Source: Westchester County