second quarterly report - british columbia
TRANSCRIPT


Second Quarterly Report
2014/15 Financial Update, Economic Outlook
&Six Month Financial Results
April – September 2014

British Columbia Cataloguing in Publication Data
British Columbia. Ministry of Finance.Quarterly report on the economy, fiscal situation and Crown
corporations. — ongoing–
Quarterly.Title on cover: Quarterly report.Continues: British Columbia. Ministry of Finance.
Quarterly financial report. ISSN 0833-1375.ISSN 1192-2176 — Quarterly Report on the economy, fiscal
situation and Crown corporations.
1. Finance, Public — British Columbia — Accounting — Periodicals. 2. British Columbia — Economic conditions — 1945– — Periodicals.*3. Corporations, Government — British Columbia — Accounting — Periodicals. I. Title.
HJ13.B77 354.711’007231’05
Second Quarterly Report 2014/15
TABLE OF CONTENTS2014/15 Second Quarterly Report November 26, 2014
Part One — Updated Financial Forecast
Introduction ............................................................................................................................................... 1Revenue ...................................................................................................................................................... 3
Expense ...................................................................................................................................................... 5Consolidated Revenue Fund spending .................................................................................................. 5Contingencies ...................................................................................................................................... 6Spending recovered from third parties .................................................................................................. 6Operating transfers to service delivery agencies ...................................................................................... 6Service delivery agency spending ........................................................................................................... 6
Government employment (FTEs) ............................................................................................................... 6
Provincial capital spending .......................................................................................................................... 7Projects over $50 million ...................................................................................................................... 7
Provincial debt ............................................................................................................................................ 8
Risks to the fiscal forecast ............................................................................................................................ 9
Supplementary schedules ............................................................................................................................ 10
Tables:1.1 2014/15 Forecast Update .......................................................................................................... 11.2 2014/15 Financial Forecast Changes ......................................................................................... 21.3 2014/15 Capital Spending Update ............................................................................................. 71.4 2014/15 Provincial Debt Update ............................................................................................... 8
Supplementary schedules1.5 Operating Statement ................................................................................................................. 101.6 Revenue by Source .................................................................................................................... 111.7 Expense by Ministry, Program and Agency ................................................................................ 121.8 Expense by Function ................................................................................................................. 131.9 Material Assumptions – Revenue .............................................................................................. 141.10 Material Assumptions – Expense ............................................................................................... 191.11 Full-Time Equivalents ............................................................................................................... 211.12 Capital Spending ....................................................................................................................... 211.13 Capital Expenditure Projects Greater Than $50 million ............................................................ 221.14 Provincial Debt ......................................................................................................................... 241.15 Statement of Financial Position ................................................................................................. 25
Part Two — Economic Review and Outlook
Summary .................................................................................................................................................... 27
British Columbia outlook – comparison to private sector forecasts .............................................................. 27

ii Table of Contents
Second Quarterly Report 2014/15
British Columbia economic activity ............................................................................................................. 28Labour market ..................................................................................................................................... 28Consumer spending and housing ......................................................................................................... 29External trade and commodity markets ................................................................................................ 30
Risks to the economic outlook .................................................................................................................... 32External environment ................................................................................................................................. 32
United States ........................................................................................................................................ 32Canada ................................................................................................................................................. 35Europe ................................................................................................................................................. 36China ................................................................................................................................................... 37Financial markets ................................................................................................................................. 38Exchange rate ....................................................................................................................................... 39
Tables:2.1 British Columbia Economic Indicators ..................................................................................... 282.2 Private Sector Canadian Interest Rate Forecasts .......................................................................... 392.3 Private Sector Exchange Rate Forecasts ...................................................................................... 39
Topic Box:Provincial Economic Accounts Update ................................................................................................. 40

Second Quarterly Report 2014/15
Introduction
The second quarter fiscal outlook for 2014/15 forecasts a surplus of $444 million – $178 million higher than the projection in the first Quarterly Report. The outlook reflects a $194 million increase in revenue due to higher taxation revenue as well as improvement in other revenue sources. The revenue improvements were partially offset by a $16 million net increase in expenses and prior year liability adjustments.
PART ONE — UPDATED FINANCIAL FORECAST2014/15 Second Quarterly Report November 26, 2014
Table 1.1 2014/15 Forecast UpdateFirst Second
($ millions)
Revenue ………………………………………………………… 44,800 45,315 45,509 Expense …………….....…....………………..………………… (44,416) (44,849) (44,865)
Surplus before forecast allowance ………………………… 384 466 644 Forecast allowance …………………………………………… (200) (200) (200)
Surplus …………………………………………………………… 184 266 444 Capital spending:
Taxpayer-supported capital spending ……………………… 4,030 4,198 4,012 Self-supported capital spending ……………………………… 2,590 2,651 2,651
6,620 6,849 6,663 Provincial Debt:
Taxpayer-supported debt ……………………………………… 43,075 42,290 41,990 Self-supported debt …………………………………………… 21,463 21,257 21,253 Total debt (including forecast allowance) ……………… 64,738 63,747 63,443
Taxpayer-supported debt-to-GDP ratio:As previously forecast .................................................. 18.4% 18.1% Impact of Statistics Canada update 1 ............................ -0.3% -0.3%Restated and second quarter projections .................. 18.1% 17.8% 17.7%
1 See Provincial Economic Accounts Update topic box on page 40.
QuarterlyReport
Budget 2014
QuarterlyReport
Chart 1.1 2014/15 surplus – major changes from first Quarterly Report
266
107
87 (31)
15 0 444
FirstQuarterly
Report
Highertaxationrevenue
Otherrevenue
improvements
Expensechanges
Prior yearliability
adjustment
Forecastallowanceunchanged
SecondQuarterly
Report
$ millionsSurplus increased by $178 million
Chart 1.1 Operating changes from the first Quarterly Report

2 Updated Financial Forecast
Second Quarterly Report 2014/15
Table 1.2 2014/15 Financial Forecast Changes($ millions)
2014/15 surplus – Budget 2014 (February 18, 2014) ……………………………………………………… 184 184 2014/15 surplus – first Quarterly Report (September 9, 2014) ………………………………………… 266
Q1 Update
Q2 Update
Total Changes
Revenue changes:Personal income tax – mainly higher 2013 tax assessments ........................................................... 337 - 337 Corporate income tax – increased federal government instalments and
prior-year adjustment, reflecting higher 2013 tax assessments ................................................... 119 18 137 Provincial sales tax – carryforward impact of lower 2013/14 sales revenue results ......................... (218) - (218) Property transfer tax – stronger year-to-date sales results .............................................................. 50 100 150 Other taxation sources …………………………………....................................................................... (13) (11) (24) Natural gas royalties – mainly higher prices and changes in volumes partially
offset by higher utilization of royalty programs ………………………………………………………… 202 12 214 Forests – mainly changes in stumpage rates and harvest volumes ................................................. 46 (31) 15 Coal, metals and minerals – lower coal prices and and higher mining costs ................................... (98) (8) (106) Other natural resources .................................................................................................................... 6 (11) (5) Fees, investment earnings and miscellaneous sources – mainly changes in revenue
from SUCH sector entities ……………………………………………………………………………. (51) 47 (4) Health and social transfers – lower entitlement for prior years and changes in 2014
population share …………………………………………………………………………………………. (30) 4 (26) Other federal government transfers – mainly higher revenue from SUCH sector entities …………… 44 5 49 Commercial Crown agencies operating results:
ICBC – mainly claims cost savings and higher investment income .............................................. 111 71 182 Other commercial Crown agencies changes ................................................................................ 10 (2) 8 Total revenue changes ………………………………………………………………………….......... 515 194 709
Less : expense increases (decreases):Consolidated Revenue Fund changes:
Statutory spending:Direct fire costs ....................................................................................................................... 287 (50) 237 Emergency program flood-related costs ................................................................................. 14 1 15 Teachers' Pension Plan liability adjustment ........................................................................... 66 - 66 BC Training and Education Savings Program – higher eligibilty volumes ............................. 8 - 8 Elections BC ........................................................................................................................... 3 - 3 BC Timber Sales …………………………………………………………………………………. - 3 3 Refundable tax credit transfers ............................................................................................... (6) 46 40
Prior year liability adjustments …………………………………………………………………………… - (15) (15) Management of public debt (net) – reflects lower interest rates and
revisions to scheduled borrowing ........................................................................................... (15) (14) (29) Spending funded by third party recoveries ....................................................................................... 8 13 21 (Increase) decrease in operating transfers to service delivery agencies .......................................... 34 91 125 Changes in spending profile of service delivery agencies:
School districts – lower operating expenses due to job action ..................................................... (163) (97) (260) Universities – higher amortization and grants to third parties ....................................................... 14 (1) 13 Colleges – primarily higher amortization costs ............................................................................. (10) 20 10 Health authorities and hospital societies – increasing demand for healthcare services ............... 110 26 136 Other service delivery agencies .................................................................................................... 7 (7) -
Removal of expenditure management targets from fiscal plan ........................................................ 76 - 76
Total expense increases …………………………………………………………………………...... 433 16 449 Total changes …….............................................................................……………………………………… 82 178 260 2014/15 surplus – first Quarterly Report …………………………………………………………………… 266 2014/15 surplus – second Quarterly Report ……………………………………………………………… 444 444

Second Quarterly Report 2014/15
Updated Financial Forecast 3
Projected taxpayer-supported capital spending has decreased by $186 million, reflecting lower spending on health facilities, post secondary infrastructure and transportation projects mainly due to updated project scheduling.
The taxpayer-supported debt forecast is $300 million lower compared to the projection in the first Quarterly Report mainly due to better than expected results in government’s cash management initiative and reductions in capital financing requirements. Self-supported debt is virtually unchanged, reflecting a $4 million reduction.
Taxpayer-supported debt to GDP is now projected to be 17.7 per cent. The debt to GDP ratio reflects a 0.1 percentage point reduction since the first Quarterly Report as a result of the lower debt forecast. A further 0.3 percentage point reduction in the ratio is due to the carry forward impact of Statistics Canada’s revision of historical nominal GDP numbers.
The forecast allowance has been left unchanged at $200 million, reflecting continuing volatility in some revenue sources (e.g. sales tax, natural gas royalties, and mineral levies).
Revenue
Revenue for 2014/15 is forecast to be $45.5 billion − $194 million higher than the projection in the first Quarterly Report. The improvement reflects additional revenue from taxation sources, federal transfers, commercial Crown corporations and other taxpayer-supported sources, partially offset by a reduction in natural resources revenue.
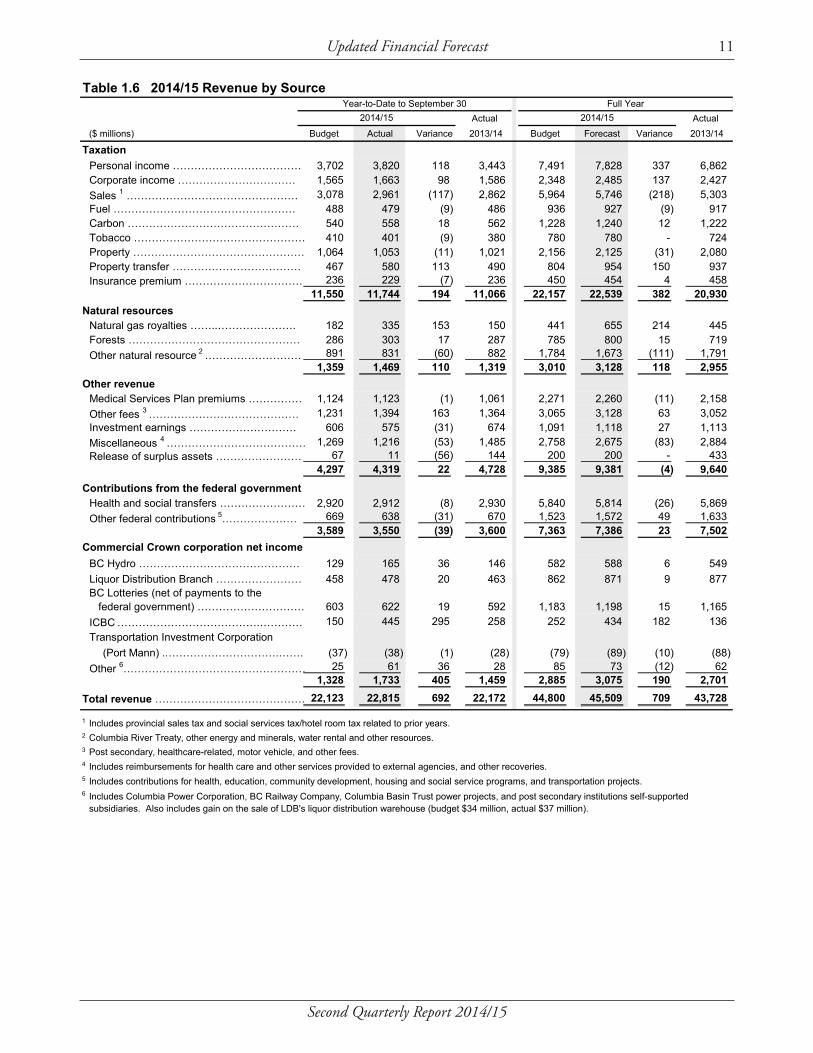
Detailed revenue projections are disclosed in Table 1.6, and key assumptions and sensitivities relating to revenue are provided in Table 1.9. Major changes from the first Quarterly Report include the following:
Chart 1.2 Revenue changes from first Quarterly Report
FirstQuarterly
Report
Incometaxes
Consumption& othertaxes
Naturalresources
Fees,miscellaneous
and other
Federaltransfers
CommercialCrowns
net income
SecondQuarterly
Report
18
89
(38) 47
9
69
45,509
$ millionsTotal revenue increased by $194 million
45,315
Chart 1.2 Revenue changes from the first Quarterly Report

4 Updated Financial Forecast
Second Quarterly Report 2014/15
Income tax revenue
Personal income tax revenue is unchanged from first Quarterly Report.
Corporate income tax revenue is up $18 million mainly due to higher federal government instalments, reflecting 2013 tax assessment results.
Consumption and other tax revenue
Property transfer tax revenue is up $100 million reflecting higher than expected results in the housing market. Other taxation revenues are down $11 million.
Natural resources revenue
Revenue from natural gas royalties is up $12 million mainly due to a 1.8 per cent increase in natural gas production volumes, partially offset by higher utilization of royalty programs and infrastructure credits.
Forests revenue is down $31 million due to lower stumpage revenue resulting from lower stumpage rates and a decline in harvest volumes.
Other natural resource revenues are projected to have a net decline of $19 million:• Revenue from sales of Crown land tenures is up $16 million mainly due to the effects
of stronger bid prices and auctioned land volumes.• Columbia River Treaty electricity sales revenue is down $12 million due to lower
electricity prices.• Revenue from coal, metals and minerals is down $8 million reflecting the effects of
higher mining cost and lower metal prices.• Other natural resource revenue is down $15 million mainly due to lower proceeds from
water rentals and licenses, and the effects of lower petroleum prices.
Other revenue
Revenue from fees, licenses, investment earnings and other miscellaneous sources is up $47 million mainly due to higher forecasts of own-source revenue provided by SUCH sector entities and improved investment earnings predominately reflecting increased recoveries through the Fiscal Agency Loan program.
Federal government transfers
Canada Health and Social Transfers are up $4 million mainly reflecting $9 million increase due to a higher BC population share of the national total partly offset by $5 million reduction related to prior years (2012/13 and 2013/14). Other federal government contributions are expected to be up $5 million mainly due to increased transfers to taxpayer-supported Crown agencies.
Second Quarterly Report 2014/15
Updated Financial Forecast 5
Commercial Crown corporations
The outlook for commercial Crown corporation net income is up $69 million mainly reflecting improvements in the forecasts from ICBC and the BC Lottery Corporation.• ICBC’s net income projections (adjusted to government’s fiscal year) are up $71 million
mainly due to higher investment income and premium revenues, and lower insurance operating costs.
• BCLC’s forecast is up $15 million, mainly due to higher net win (revenue less prizes and other direct costs), lower operating costs, and a reduction in capital amortization expense.
The above improvements were partially offset by a combined $17 million reduction in the net income projections of other commercial Crown corporations.
Expense
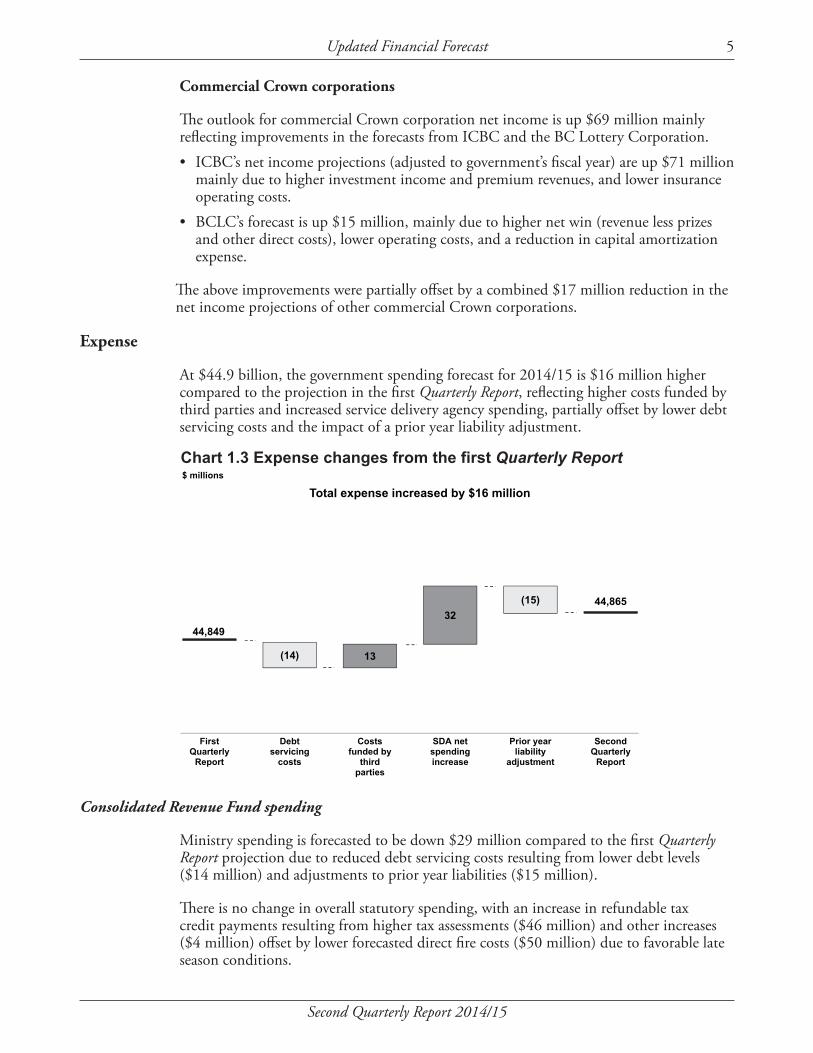
At $44.9 billion, the government spending forecast for 2014/15 is $16 million higher compared to the projection in the first Quarterly Report, reflecting higher costs funded by third parties and increased service delivery agency spending, partially offset by lower debt servicing costs and the impact of a prior year liability adjustment.
Consolidated Revenue Fund spending
Ministry spending is forecasted to be down $29 million compared to the first Quarterly Report projection due to reduced debt servicing costs resulting from lower debt levels ($14 million) and adjustments to prior year liabilities ($15 million).
There is no change in overall statutory spending, with an increase in refundable tax credit payments resulting from higher tax assessments ($46 million) and other increases ($4 million) offset by lower forecasted direct fire costs ($50 million) due to favorable late season conditions.
Chart 1.3 Expense changes from first Quarterly Report
44,849
(14) 13
32 (15) 44,865
FirstQuarterly
Report
Debtservicing
costs
Costsfunded by
thirdparties
SDA netspendingincrease
Prior yearliability
adjustment
SecondQuarterly
Report
$ millions
Total expense increased by $16 million
Chart 1.3 Expense changes from the first Quarterly Report

6 Updated Financial Forecast
Second Quarterly Report 2014/15
Contingencies
Budget 2014 included a Contingencies vote allocation of $300 million in 2014/15 to help manage unexpected costs and pressures as well as fund priority initiatives, including the 2014 public sector compensation mandate and LNG development. This allocation is unchanged in the second Quarterly Report forecast.
Spending recovered from third parties
Spending funded by third parties is forecasted to increase by $13 million primarily due to the impact of currency exchange rates on sinking funds for foreign currency denominated debt.
Operating transfers to service delivery agencies
Operating transfers to service delivery agencies are forecast to be $91 million lower mainly due to reduced grants to school districts as a result of the teachers’ job action, offset by adjustments to projected health organization allocations in response to spending forecast changes noted below.
Service delivery agency spending
Service delivery agency spending forecast is $59 million lower than the projection in the first Quarterly Report:• School district spending is forecast to be $97 million lower than the first Quarterly
Report due to further reduced teacher compensation costs as a result of continuing job action in the summer and fall, partially offset by estimated settlement costs.
• Post secondary sector spending is $19 million higher due to higher estimates for asset amortization and grants to third parties (e.g. student bursaries).
• Health authority and hospital society spending is forecast to be up $26 million mainly due to revised estimates for operating costs incurred in support of the increasing demand for healthcare services delivered by these organizations.
• Other service delivery agency spending is projected to decrease by $7 million mainly reflecting lower transportation costs partially offset by increased spending on housing initiatives.
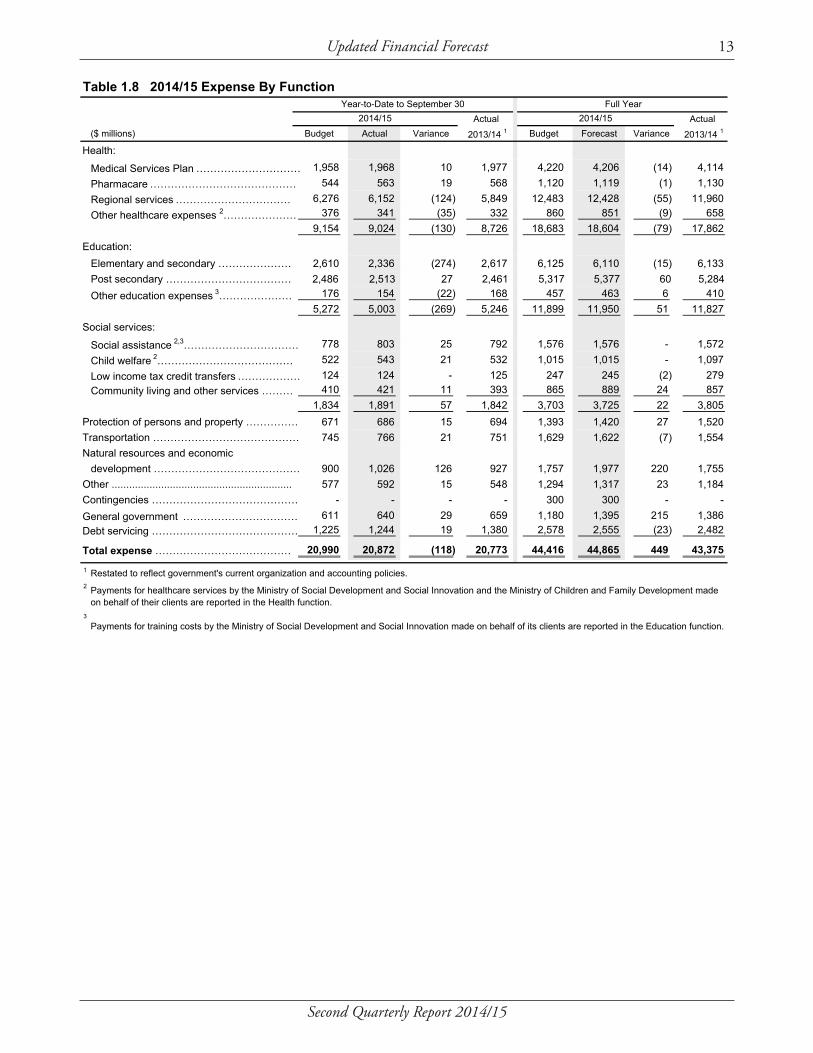
Detailed expense projections are disclosed in Table 1.7. Key spending assumptions and sensitivities are provided in Table 1.10.
Government employment (FTEs)
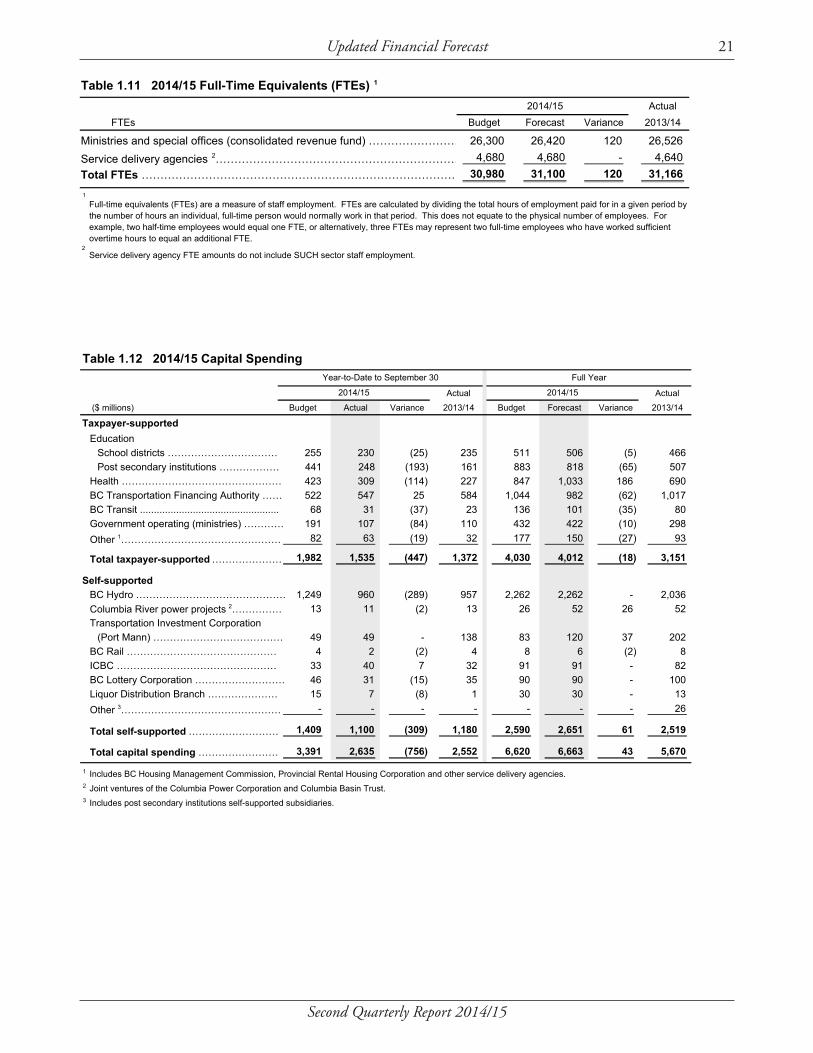
The projection of government employment for 2014/15 has been decreased by 130 full time equivalents since the first Quarterly Report due to lower than expected staffing requirements to fight forest fires. Further details on FTEs are provided in Table 1.11.

Second Quarterly Report 2014/15
Updated Financial Forecast 7
Provincial capital spending
Capital spending is projected to total $6.7 billion in 2014/15 – $186 million lower than the forecast in the first Quarterly Report (see Tables 1.3 and 1.12).
Taxpayer-supported capital spending is projected at $4.0 billion. The $186 million decrease since the first Quarterly Report mainly reflects lower forecast spending due to construction schedule adjustments (mainly in the areas of health facilities and transportation projects) and lower forecast spending on self-funded health and post secondary institution projects.
At $2.7 billion, projected self-supported capital spending is unchanged from the first Quarterly Report forecast.
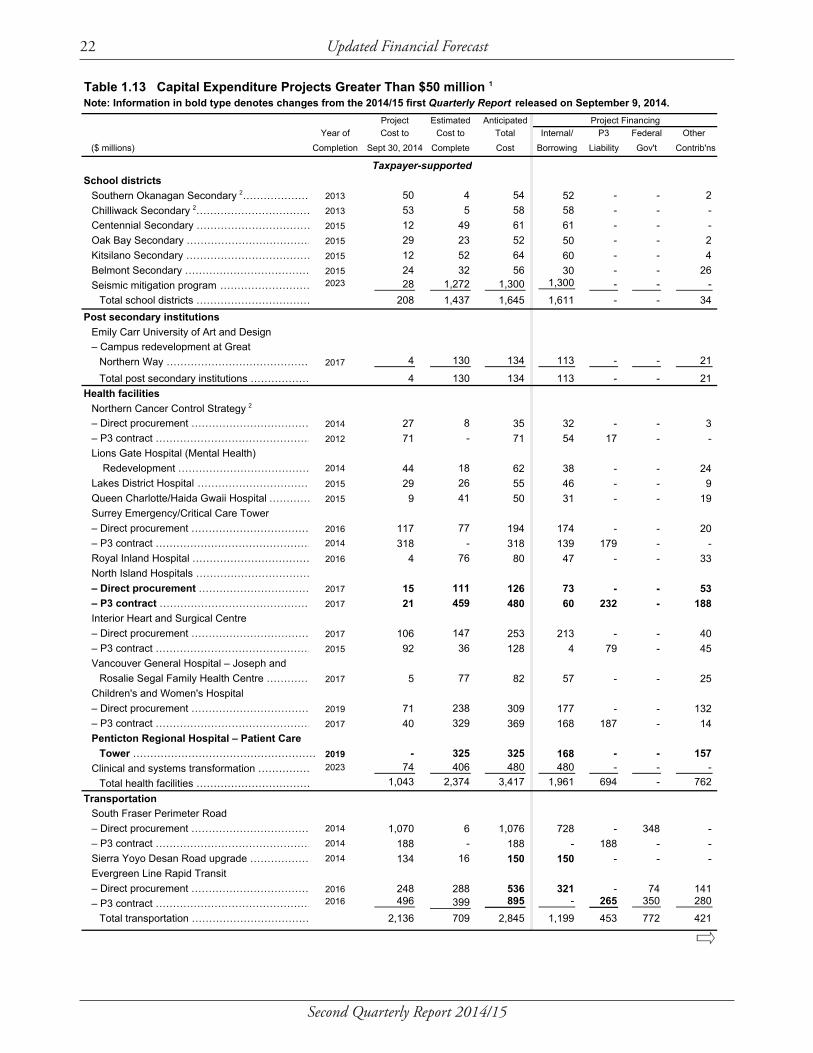
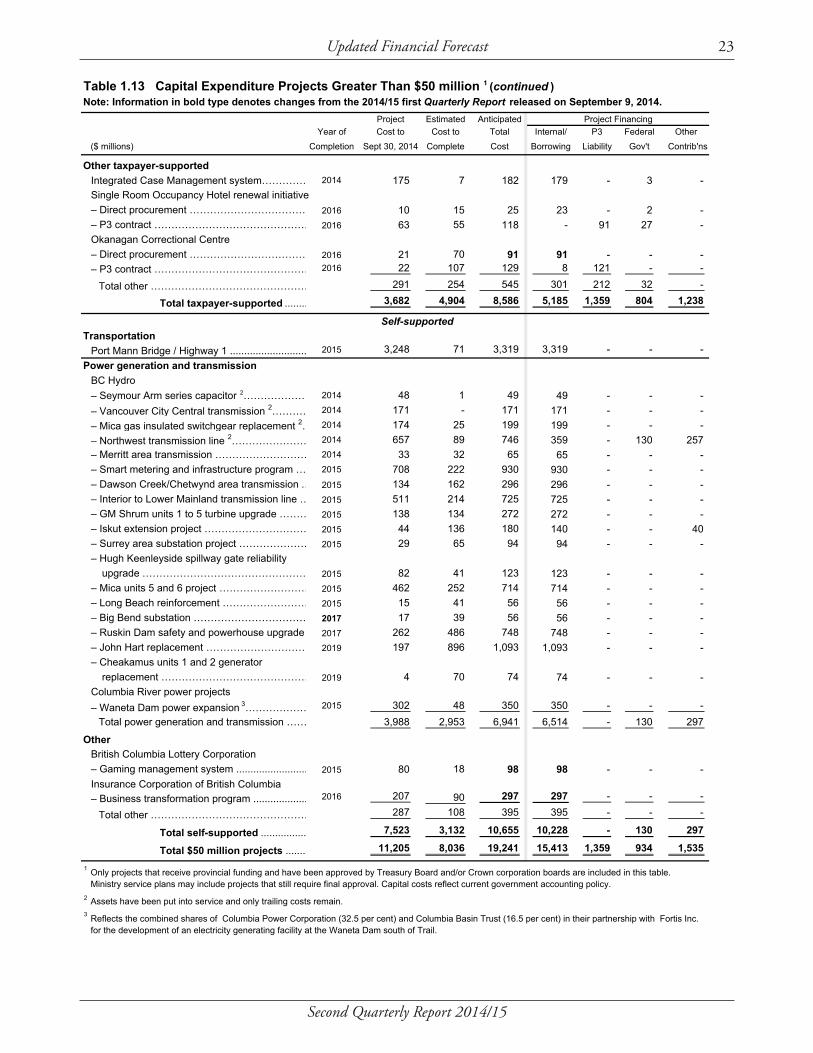
Projects over $50 million
Capital spending projects with provincial contributions greater than $50 million are presented in Table 1.13. Since the first Quarterly Report the following changes have occurred:• The $325 million Penticton Regional Hospital patient care tower project has been
added.• The overall cost for the North Island Hospitals project is unchanged; however, with
financial close completed, the allocation of capital cost between direct procurement and P3 contract components has been finalized.
• Anticipated costs for the Sierra Yoyo Desan road upgrade have increased $13 million.
Table 1.3 2014/15 Capital Spending Update($ millions)
2014/15 capital spending – Budget 2014 (February 18, 2014) …………………… 6,620 6,620
2014/15 capital spending – first Quarterly Report (September 9, 2014) ………… 6,849
Q1 Update
Q2 Update
Total Changes
Taxpayer-supported changes:Health project approvals since Budget 2014 ........................................................... 94 - 94 Changes in internally-financed spending:
– health authorities ……………………………………………………………………… 129 (27) 102 – post secondary institutions …………………………………………………………… (9) (57) (66)
Project scheduling changes:– health facilities ………………………………………………………………………… - (7) (7) – school projects ………………………………………………………………………… (5) - (5) – transportation projects ………………………………………………………………… (29) (68) (97) – other …………………………………………………………………………………… (12) (27) (39)
Total taxpayer-supported …………………………………………………………… 168 (186) (18)
Self-supported changes:Carry-over of prior year budgeted spending:
– Port Mann Bridge/Highway 1 ………………………………………………………… 37 - 37 – Columbia River power projects – Waneta Dam expansion ……………………… 26 - 26
Other ………………………………………………………………………………………… (2) - (2)
Total self-supported ………………………………..………………………………… 61 - 61
Total changes ……………………………………………………………………………… 229 (186) 43
2014/15 capital spending – first Quarterly Report …………………………………… 6,849 2014/15 capital spending – second Quarterly Report ……………………………… 6,663 6,663

8 Updated Financial Forecast
Second Quarterly Report 2014/15
• The overall cost for the Evergreen Line rapid transit project is unchanged; however, the allocation of capital cost between direct procurement and P3 contract components has been revised.
• The Okanagan Correctional Centre anticipated costs for direct procurement have been adjusted by $4 million, reflecting the acquisition of specialized equipment and vehicles for the facility.
• BC Hydro’s Big Bend substation project is now expected to be completed in 2017 rather than 2016.
• BC Lotteries’ gaming management system project forecast decreased by $1 million reflecting lower costs to date.
• Anticipated spending for the capital portion of ICBC’s business transformation program increased $33 million mainly due to additional complexities in systems integration and testing as determined by an external consultant review.
Provincial debt
The provincial debt, including the $200 million forecast allowance, is projected to total $63.4 billion by the end of the fiscal year – $304 million lower than the projection in the first Quarterly Report.
Table 1.4 2014/15 Provincial Debt Update($ millions)
2014/15 provincial debt – Budget 2014 (February 18, 2014) ………………… 64,738
Change in 2013/14 actual results from Budget 2014 forecast 1 ........................ (950)
Updated Budget 2014 projection 2 ................................................................... 63,788 63,788
2014/15 provincial debt – first Quarterly Report (September 9, 2014) ……… 63,747
Q1 Update
Q2 Update
Total Changes
Taxpayer-supported changes:Government operating:
– cash management strategy target adjustment ............................................ 307 (100) 207 – higher revenue cash receipts ...................................................................... (321) (102) (423) – other changes ............................................................................................. (87) 21 (66) Total operating debt changes ......................................................................... (101) (181) (282)
Capital debt: – change in capital spending ……………………………………………………… 168 (186) (18) – change in contributions from external parties ………………………………… (25) 11 (14) – change in internal financing …………………………………………………… (20) 56 36 Total capital debt changes .............................................................................. 123 (119) 4
Total taxpayer-supported …………………………………………….…………… 22 (300) (278) Self-supported changes:
– higher capital spending ………………………………………………………… 61 - 61 – increase in internal financing …………………………………………………… (124) (4) (128)
Total self-supported …………………………………...…………………………… (63) (4) (67) Total changes ………………………………………………………………………… (41) (304) (345) 2014/15 provincial debt – first Quarterly Report …………………………………63,747 2014/15 provincial debt – second Quarterly Report …………………………… 63,443 63,443 1
2
Excludes unused portion of the forecast allowance.
The Budget 2014 projection is based on an increase in debt for 2014/15 over a forecasted result for 2013/14. The revised projection reflects the same projected increase over the actual results for 2013/14.
Second Quarterly Report 2014/15
Updated Financial Forecast 9
Taxpayer-supported debt is projected to be $42.0 billion – $300 million lower than the projection in the first Quarterly Report. The reduction reflects lower direct operating debt (down $181 million), primarily due to anticipated improvement in both CRF revenue and government’s cash management strategy targets for the year.
The decrease in taxpayer-supported capital debt (down $119 million) is mainly due to reduced capital financing requirements – i.e. lower capital spending net of changes to contributions from external parties and internal financing of capital.
The lower taxpayer-supported debt projections resulted in a 0.1 percentage point reduction in the ratio taxpayer-supported debt to GDP ratio projected in first Quarterly Report. As well, Statistics Canada recently revised its historical nominal GDP data. The carry forward impact of the revision further reduced the debt to GDP ratio by 0.3 percentage points. As a result, the debt to GDP ratio for 2014/15 is now projected to be 17.7 per cent.
Self-supported debt is projected to be $21.3 billion – $4 million lower than the projection in the first Quarterly Report mainly due to further improvements in operating cash flows.
Details on provincial debt are shown in Table 1.14.
Risks to the fiscal forecast
There are a number of risks and pressures to the fiscal plan – in some instances reflecting risks to the BC economic outlook, which are largely due to the continued uncertainty surrounding global economic activity.
Revenues in British Columbia can be volatile, largely due to the influence of the cyclical nature of the natural resource sector in the economy. Changes in energy or commodity prices, such as natural gas and lumber, may have a significant effect on revenue and the fiscal forecast.
Personal and corporate income tax assessments for the 2013 tax year will not be finalized until March 2015 and could result in further revenue and tax credit transfer spending adjustments.
The spending forecast contained in the fiscal plan is based on ministry and service delivery agency plans and strategies. Changes to planning assumptions, such as utilization or demand rates for government services in the health care, education, or community social services sectors, and costs associated with natural disaster response represent the main spending risks.
The potential fiscal impact from these risks is covered by the $300 million Contingencies vote and the $200 million forecast allowance.

10 Updated Financial Forecast
Second Quarterly Report 2014/15
Supplementary schedules
The following tables provide the financial results for the six months ended September 30, 2014 and the 2014/15 full-year forecast.
Table 1.5 2014/15 Operating Statement
Actual Actual($ millions) Budget Actual Variance 2013/14 Budget Forecast Variance 2013/14
Revenue ……………………………………… 22,123 22,815 692 22,172 44,800 45,509 709 43,728 Expense …………….....…....……………….. (20,990) (20,872) 118 (20,773) (44,416) (44,865) (449) (43,375)
-Surplus before forecast allowance ………… 1,133 1,943 810 1,399 384 644 260 353
Forecast allowance …………………………… - - - - (200) (200) - - Surplus …………………………………………… 1,133 1,943 810 1,399 184 444 260 353
Accumulated surplus beginning of the year … 1,748 1,654 (94) 1,301 1,748 2,135 387 1,301 Accumulated surplus before comprehensive
income ……………………………………… 2,881 3,597 716 2,700 1,932 2,579 647 1,654 Accumulated other comprehensive income
from self-supported Crown agencies ……… (88) 289 377 81 (175) (272) (97) 481 Accumulated surplus end of period ………… 2,793 3,886 1,093 2,781 1,757 2,307 550 2,135
Year-to-Date to September 30 Full Year2014/15 2014/15
\quarterly\2005_06\q2\fiscal\tables\Table 1.5 Q2 2014-15 summary 11/17/2014 12:01 PM
Second Quarterly Report 2014/15
Updated Financial Forecast 11
Table 1.6 2014/15 Revenue by Source
Actual Actual ($ millions) Budget Actual Variance 2013/14 Budget Forecast Variance 2013/14
TaxationPersonal income ……………………………… 3,702 3,820 118 3,443 7,491 7,828 337 6,862 Corporate income …………………………… 1,565 1,663 98 1,586 2,348 2,485 137 2,427 Sales 1 ………………………………………… 3,078 2,961 (117) 2,862 5,964 5,746 (218) 5,303 Fuel …………………………………………… 488 479 (9) 486 936 927 (9) 917 Carbon ………………………………………… 540 558 18 562 1,228 1,240 12 1,222 Tobacco ………………………………………… 410 401 (9) 380 780 780 - 724 Property ………………………………………… 1,064 1,053 (11) 1,021 2,156 2,125 (31) 2,080 Property transfer ……………………………… 467 580 113 490 804 954 150 937 Insurance premium …………………………… 236 229 (7) 236 450 454 4 458
11,550 11,744 194 11,066 22,157 22,539 382 20,930 Natural resources
Natural gas royalties ……..…………………. 182 335 153 150 441 655 214 445 Forests ………………………………………… 286 303 17 287 785 800 15 719 Other natural resource 2 ……………………… 891 831 (60) 882 1,784 1,673 (111) 1,791
1,359 1,469 110 1,319 3,010 3,128 118 2,955 Other revenue
Medical Services Plan premiums …………… 1,124 1,123 (1) 1,061 2,271 2,260 (11) 2,158 Other fees 3 …………………………………… 1,231 1,394 163 1,364 3,065 3,128 63 3,052 Investment earnings ………………………… 606 575 (31) 674 1,091 1,118 27 1,113 Miscellaneous 4 ………………………………… 1,269 1,216 (53) 1,485 2,758 2,675 (83) 2,884 Release of surplus assets …………………… 67 11 (56) 144 200 200 - 433
4,297 4,319 22 4,728 9,385 9,381 (4) 9,640
Contributions from the federal government Health and social transfers …………………… 2,920 2,912 (8) 2,930 5,840 5,814 (26) 5,869 Other federal contributions 5………………… 669 638 (31) 670 1,523 1,572 49 1,633
3,589 3,550 (39) 3,600 7,363 7,386 23 7,502 Commercial Crown corporation net income
BC Hydro ……………………………………… 129 165 36 146 582 588 6 549 Liquor Distribution Branch …………………… 458 478 20 463 862 871 9 877 BC Lotteries (net of payments to the
federal government) ………………………… 603 622 19 592 1,183 1,198 15 1,165 ICBC ………………………………….………… 150 445 295 258 252 434 182 136 Transportation Investment Corporation
………………………….……. (37) (38) (1) (28) (79) (89) (10) (88) Other 6…………………………………………… 25 61 36 28 85 73 (12) 62
1,328 1,733 405 1,459 2,885 3,075 190 2,701
Total revenue …………………………………… 22,123 22,815 692 22,172 44,800 45,509 709 43,728
1
2
3
4
5
6
Year-to-Date to September 30 Full Year2014/15 2014/15
Includes provincial sales tax and social services tax/hotel room tax related to prior years.
Includes Columbia Power Corporation, BC Railway Company, Columbia Basin Trust power projects, and post secondary institutions self-supported subsidiaries. Also includes gain on the sale of LDB's liquor distribution warehouse (budget $34 million, actual $37 million).
Post secondary, healthcare-related, motor vehicle, and other fees. Includes reimbursements for health care and other services provided to external agencies, and other recoveries. Includes contributions for health, education, community development, housing and social service programs, and transportation projects.
Columbia River Treaty, other energy and minerals, water rental and other resources.
\quarterly\2005_06\q2\fiscal\tables\Table 1.6 Q2 2014-15 revenue by source 11/20/2014 9:40 AM
(Port Mann) ..

12 Updated Financial Forecast
Second Quarterly Report 2014/15
Table 1.7 2014/15 Expense by Ministry, Program and Agency 1
Actual Actual ($ millions) Budget Actual Variance 2013/14 2 Budget Forecast Variance 2013/14 2
Office of the Premier ……………………………… 5 5 - 4 9 9 - 9 Aboriginal Relations and Reconciliation ………… 40 44 4 38 82 82 - 105 Advanced Education ……………………………… 939 944 5 950 1,936 1,936 - 1,950 Agriculture ..........................……………………… 50 46 (4) 46 80 80 - 76 Children and Family Development ……………… 657 661 4 645 1,356 1,356 - 1,343 Community, Sport and Cultural Development … 173 166 (7) 96 221 221 - 181 Education …………………………………………… 2,735 2,556 (179) 2,703 5,387 5,395 8 5,412 Energy and Mines ...............................………… 10 13 3 14 21 21 - 39 Environment ……………………………………… 63 63 - 61 134 134 - 131 Finance …………………………………………… 106 100 (6) 94 202 268 66 242 Forests, Lands and Natural Resource
Operations ……………………………………… 296 442 146 330 593 833 240 621 Health ........................…………………………… 8,331 8,167 (164) 7,992 16,936 16,936 - 16,387 International Trade ............................................ 17 25 8 22 34 34 - 48 Jobs, Tourism and Skills Training ……………… 93 95 2 92 199 199 - 207 Justice ............................................................... 579 560 (19) 546 1,155 1,170 15 1,170 Natural Gas Development ................................. 200 197 (3) 185 401 401 - 371 Social Development and Social Innovation …… 1,260 1,266 6 1,222 2,530 2,530 - 2,509 Technology, Innovation and Citizens' Services … 258 250 (8) 244 527 527 - 525 Transportation and Infrastructure ……………… 401 402 1 404 812 812 - 806
Total ministries and Office of the Premier … 16,213 16,002 (211) 15,688 32,615 32,944 329 32,132 Management of public funds and debt ………… 661 604 (57) 637 1,286 1,257 (29) 1,237 Contingencies ……………………………………… - - - - 300 300 - 60 Funding for capital expenditures ………………… 322 278 (44) 216 1,048 1,006 (42) 740 Refundable tax credit transfers ………………… 387 388 1 414 778 818 40 730 Legislative and other appropriations …………… 64 57 (7) 87 130 133 3 153
Subtotal ………………..………………………… 17,647 17,329 (318) 17,042 36,157 36,458 301 35,052 Elimination of transactions between
appropriations 3 ………………………………… (8) (8) - - (17) (17) - (2) Prior year liability adjustments …………………… - (6) (6) (3) - (15) (15) (159)
Consolidated revenue fund expense …………… 17,639 17,315 (324) 17,039 36,140 36,426 286 34,891 Expenses recovered from external entities …… 1,085 1,211 126 1,484 2,599 2,620 21 2,760 Funding provided to service delivery agencies … (10,807) (10,428) 379 (10,555) (22,016) (21,849) 167 (21,503)
Total direct program spending ………………..… 7,917 8,098 181 7,968 16,723 17,197 474 16,148 Service delivery agency expense
School districts …………………………………… 2,491 2,074 (417) 2,488 5,667 5,407 (260) 5,661 Universities ………………………………………… 1,967 1,970 3 1,932 4,152 4,165 13 4,079 Colleges and institutes …………………………… 534 538 4 540 1,125 1,135 10 1,137 Health authorities and hospital societies ……… 6,448 6,450 2 6,297 13,108 13,244 136 12,802 Other service delivery agencies ………………… 1,633 1,742 109 1,548 3,743 3,743 - 3,548
Total service delivery agency expense ………… 13,073 12,774 (299) 12,805 27,795 27,694 (101) 27,227 Subtotal expense ………………..………………… 20,990 20,872 (118) 20,773 44,518 44,891 373 43,375
Expenditure management ………………………… - - - - (76) - 76 - Core Review ……………………………………… - - - - (26) (26) - -
Total expense ……………………………………… 20,990 20,872 (118) 20,773 44,416 44,865 449 43,375
1 Reflects government's organization that was in effect at September 30, 2014.2 Restated to reflect government's current accounting policies.3 Reflects payments made under an agreement where an expense from a voted appropriation is recorded as revenue by a special account.
ocg ocg budget mc wpcheck 20,872 20,773 44,416 44,865 43,375
- - - - -
Year-to-Date to September 30 Full Year2014/15 2014/15
\quarterly\2005_06\q2\fiscal\tables\Table 1.7 Q2 2014-15 expense by ministry 11/17/2014 10:44 AM
Second Quarterly Report 2014/15
Updated Financial Forecast 13
Table 1.8 2014/15 Expense By Function
Actual Actual ($ millions) Budget Actual Variance 2013/14 1 Budget Forecast Variance 2013/14 1
Health:
Medical Services Plan ………………………… 1,958 1,968 10 1,977 4,220 4,206 (14) 4,114 Pharmacare …………………………………… 544 563 19 568 1,120 1,119 (1) 1,130 Regional services …………………………… 6,276 6,152 (124) 5,849 12,483 12,428 (55) 11,960 Other healthcare expenses 2………………… 376 341 (35) 332 860 851 (9) 658
9,154 9,024 (130) 8,726 18,683 18,604 (79) 17,862
Education:Elementary and secondary ………………… 2,610 2,336 (274) 2,617 6,125 6,110 (15) 6,133 Post secondary ……………………………… 2,486 2,513 27 2,461 5,317 5,377 60 5,284 Other education expenses 3………………… 176 154 (22) 168 457 463 6 410
5,272 5,003 (269) 5,246 11,899 11,950 51 11,827
Social services:
Social assistance 2,3…………………………… 778 803 25 792 1,576 1,576 - 1,572 Child welfare 2………………………………… 522 543 21 532 1,015 1,015 - 1,097 Low income tax credit transfers ……………… 124 124 - 125 247 245 (2) 279 Community living and other services ……… 410 421 11 393 865 889 24 857
1,834 1,891 57 1,842 3,703 3,725 22 3,805 Protection of persons and property …………… 671 686 15 694 1,393 1,420 27 1,520 Transportation …………………………………… 745 766 21 751 1,629 1,622 (7) 1,554 Natural resources and economic
development …………………………………… 900 1,026 126 927 1,757 1,977 220 1,755 Other .............................................................. 577 592 15 548 1,294 1,317 23 1,184 Contingencies …………………………………… - - - - 300 300 - - General government …………………………… 611 640 29 659 1,180 1,395 215 1,386 Debt servicing …………………………………… 1,225 1,244 19 1,380 2,578 2,555 (23) 2,482
Total expense ………………………………… 20,990 20,872 (118) 20,773 44,416 44,865 449 43,375
1
2
3
Payments for healthcare services by the Ministry of Social Development and Social Innovation and the Ministry of Children and Family Development made on behalf of their clients are reported in the Health function.
Payments for training costs by the Ministry of Social Development and Social Innovation made on behalf of its clients are reported in the Education function.
Year-to-Date to September 30 Full Year2014/15 2014/15
Restated to reflect government's current organization and accounting policies.

14 Updated Financial Forecast
Second Quarterly Report 2014/15
Table 1.9 2014/15 Material Assumptions – Revenue
Revenue Source and Assumptions
($ millions unless otherwise specified) 2014/15 Sensitivities
Personal income tax $7,491 $7,828 $7,828Current calendar year assumptions
Household income growth ............................................ 3.3% 3.2% 3.2% +/- 1% change in 2014 BCCompensation of employees growth ............................ 3.5% 3.5% 3.5% household income growthTax base growth ........................................................... 2.6% 2.6% 2.6% equals +/- $70 to $100 millionAverage tax yield .......................................................... 5.09% 5.18% 5.18%Current-year tax ........................................................... $7,175 $7,341 $7,341Prior year's tax assessments ....................................... $305 $295 $295Unapplied taxes ............................................................ $90 $90 $90BC Tax Reduction ........................................................ -$110 -$132 -$132Non-Refundable BC tax credits .................................... -$56 -$56 -$56Policy neutral elasticity * ............................................... 1.2 1.2 1.2Fiscal year assumptionsPrior-year adjustment ................................................... $0 $201 $201
2013 Tax-year 2013 AssumptionsHousehold income growth ............................................ 3.0% 3.2% 4.6% +/- 1% change in 2013 BCTax base growth ........................................................... 5.4% 6.0% 6.0% household or taxable incomeAverage 2013 tax yield ................................................. 4.84% 4.95% 4.95% growth equals +/- $80 to $1002013 tax ....................................................................... $6,650 $6,850 $6,850 million one-time effect2012 & prior year's tax assessments ........................... $295 $285 $285 (prior-year adjustment)Unapplied taxes ............................................................ $90 $90 $90 and could result in an BC Tax Reduction ........................................................ -$108 -$130 -$130 additional +/-$65 to $75 millionNon-Refundable BC tax credits .................................... -$56 -$57 -$57 base change in 2014/15Policy neutral elasticity *................................................ 1.2 2.1 1.5* Ratio of annual per cent change in current-year revenue to annual per cent change in personal income (calendar year).
Corporate income tax $2,348 $2,467 $2,485Components of revenue (fiscal year)
Advance instalments .................................................... $2,384 $2,426 $2,442International Business Activity Act refunds .................. -$15 -$20 -$20Prior-year adjustment ................................................... -$21 $61 $63
Current calendar year assumptionsNational tax base ($ billions) ........................................ $269.2 $270.2 $269.6 +/- 1% change in the 2014BC instalment share of national tax base ..................... 11.4% 11.4% 11.4% national tax base equalsEffective tax rates (general/small business) ................. 11.0 / 2.5 11.0 / 2.5 11.0 / 2.5 +/- $15 to $25 million BC tax base growth (post federal measures)................. 1.9% 1.8% 1.8%BC net operating surplus growth .................................. 1.8% 1.4% 1.4%Non-Refundable BC tax credits .................................... -$106 -$106 -$104
2013 Tax-year 2013 Assumptions +/- 1% change in the 2013BC tax base growth (post federal measures)................. 1.7% 5.2% 5.2% BC tax base equals +/- $30BC net operating surplus growth .................................. -4.8% -4.9% -5.4% to $40 million in 2014/15Gross 2013 tax ............................................................. $2,351 $2,431 $2,431Prior-year adjustments ................................................. -$21 $61 $63Prior years losses/gains (included in above) ................. -$20 -$30 -$30 Non-Refundable BC tax credits .................................... -$98 -$86 -$83
Revenue is recorded on a cash basis. Due to lags in the federal collection and instalment systems, changes to the BC corporate profits and tax base forecasts affect revenue in the succeeding year. The 2014/15 instalments from the federal government reflects two-third of payments related to the 2014 tax year (paid during Apr-July 2014 and adjusted in Sept and Dec) and one-third of 2015 payments. Instalments for the 2014 (2015) tax year are based on BC's share of the national tax base for the 2012 (2013) tax year and a forecast of the 2014 (2015) national tax base. BC's share of the 2012 national tax base was 11.41%, based on tax assessments as of December 31, 2013. Cash adjustments for any under/over payments from the federal government in respect of 2013 will be received/paid on March 31, 2015.
Second Quarter
Forecast
First Quarter
Forecast
Budget 2014
Estimate

Second Quarterly Report 2014/15
Updated Financial Forecast 15
Table 1.9 2014/15 Material Assumptions – Revenue
Revenue Source and Assumptions
($ millions unless otherwise specified) 2014/15 Sensitivities
Second Quarter
Forecast
First Quarter
Forecast
Budget 2014
Estimate
Provincial sales tax $5,964 $5,746 $5,746Provincial sales tax base growth (fiscal year) …………… 3.9% 4.3% 4.3% +/- 1% change in the 2014 consumerCalendar Year expenditure growth equals up to
Nominal consumer expenditure .................................... 4.2% 4.0% 4.0% +/- $20 millionNominal business investment …………………………… 4.4% 4.7% 4.7%Other expenditures ………………………………………… 4.6% 6.0% 6.0%
Components of Provincial sales tax revenue +/- 1% change in the 2014 businessConsolidated Revenue Fund......................................... $5,950 $5,732 $5,732 investment growth equals up toBC Transportation Financing Authority ......................... $14 $14 $14 +/- $10 million
Fuel and carbon taxes $2,164 $2,176 $2,167Calendar Year
Real GDP ..................................................................... 2.0% 1.9% 1.9%Gasoline volumes ......................................................... 0.0% 0.0% 0.0%Diesel volumes ............................................................. 2.0% 2.0% 2.0%Natural gas volumes ..................................................... 2.0% 1.9% 1.9%
Carbon tax rates (July 1)Carbon dioxide equivalent emissions ($/tonne)................ $30 $30 $30Natural gas (cents/gigajoule) ……………………………… 148.98¢ 148.98¢ 148.98¢Gasoline (cents/litre) ………………………………………… 6.67¢ 6.67¢ 6.67¢Light fuel oil (cents/litre) …………………………………… 7.67¢ 7.67¢ 7.67¢
Carbon tax revenue ………………………………………… $1,228 $1,240 $1,240
Components of fuel tax revenueConsolidated Revenue Fund ..................................... $509 $509 $505BC Transit ................................................................ $12 $12 $12BC Transportation Financing Authority ..................... $415 $415 $410
$936 $936 $927
Property taxes $2,156 $2,126 $2,125Calendar Year
BC Consumer Price Index ............................................ 1.5% 1.3% 1.3% +/- 1% change in new construction Housing starts .............................................................. 24,949 25,900 25,900 & inflation equals up to +/- $25 million
Home owner grants (fiscal year) ..................................... $821 $820 $820 in residential property taxation Components of revenue revenue
Residential (net of home owner grants) ........................ $733 $726 $726Non-residential ............................................................. $1,124 $1,114 $1,114 +/- 1% change in 2014 newRural area .................................................................... $100 $89 $89 construction and inflationPolice ........................................................................... $32 $33 $33 equals up to +/- $20 millionBC Assessment Authority ............................................. $83 $84 $84 in non-residential propertyBC Transit .................................................................... $84 $80 $79 taxation revenue
Other taxes $2,034 $2,089 $2,188Calendar Year
Population .................................................................... 1.0% 1.0% 1.0%BC Consumer Price Index ............................................ 1.5% 1.3% 1.3%BC housing starts ......................................................... -7.8% -4.3% -4.3%Real GDP ..................................................................... 2.0% 1.9% 1.9%Nominal GDP ............................................................... 3.6% 3.5% 3.5%
Components of revenueProperty transfer .......................................................... $804 $854 $954Tobacco ....................................................................... $780 $780 $780Insurance premium and other....................................... $450 $455 $454
(continued )

16 Updated Financial Forecast
Second Quarterly Report 2014/15
Table 1.9 2014/15 Material Assumptions – Revenue
Revenue Source and Assumptions
($ millions unless otherwise specified) 2014/15 Sensitivities
Second Quarter
Forecast
First Quarter
Forecast
Budget 2014
Estimate
Energy, sales of Crown land tenures,metals, minerals and other $1,754 $1,865 $1,870
Natural gas price +/- $0.50 change in thePlant inlet, $Cdn/gigajoule ………………………………… $2.45 $3.03 $3.04 natural gas price equalsSumas, $US/ MMBtu …………………………………… $4.11 $4.50 $4.41 +/- $125 million, including impacts
Natural gas production volumes on production volumes and royaltyBillions of cubic metres ................................................ 42.8 41.7 42.5 program credits, but excluding anyPetajoules .................................................................... 1,696 1,655 1,685 changes from byproducts revenueAnnual per cent change …………………………………… 8.2% 5.5% 8.5% (e.g. butane, ethane, propane)
Sensitivities can also varyOil price ($US/bbl at Cushing, Ok) ………………………… $95.12 $98.86 $87.94 significantly at different price levels.
+/- 1% change in natural gasAuctioned land base (000 hectares) ……………………… 100 100 162 volumes equals +/- $2 millionAverage bid price/hectare ($) ……………………………… $750 $750 $1,360 on natural gas royaltiesCash sales of Crown land tenures ………………………… $75 $75 $220 +/- 1 cent change in the Metallurgical coal price ($US/tonne, fob west coast) ………… $176 $121 $121 exchange rate equals +/- $13 million Copper price ($US/lb) ..................................................... $3.16 $3.16 $3.14 on natural gas royalties
Annual electricity volumes set by treaty …………………… 4.1 4.1 4.1 +/- $10 change in the average (million mega-watt hours) Metallurgical coal price
Mid-Columbia electricity price ……………………………… $40 $42 $37 equals +/- $30 to $40 million on ($US/mega-watt hour) mineral tax revenue
Exchange rate (US¢/ Cdn$, calendar year) ……………… 93.2 91.3 91.1Components of revenue +/- 10% change in the average
Natural gas royalties ……………………………………… $441 $643 $655 Mid-Columbia electricity priceBonus bids, fees and rentals ……………………………… $806 $806 $822 equals +/- $14 million on Petroleum royalties ………………………………………… $97 $101 $98 electricity sales revenueColumbia River Treaty electricity sales ………………… $160 $163 $151Coal ………………………………………………………… $154 $63 $57 Based on a recommendationMinerals, metals and other ………………………………… $47 $40 $38 from the Auditor General to be Oil and Gas Commission fees and levies ……………… $49 $49 $49 consistent with generally
accepted accounting principles, Royalty programs and infrastructure credits bonus bid revenue recognition
Deep drilling ………………………………………………… -$323 -$493 -$523 reflects nine-year deferral of Road and pipeline infrastructure ………………………… -$60 -$53 -$65 cash receipts from the sale of Total ………………………………………………………… -$383 -$546 -$588 Crown land tenures
Implicit average natural gas royalty rate …………………… 10.6% 12.8% 12.7%
Royalty program (marginal, low productivity and ultra marginal drilling) adjustments reflect reduced royalty rates.Natural gas royalties incorporate royalty programs and Treasury Board approved infrastructure credits.
(continued )

Second Quarterly Report 2014/15
Updated Financial Forecast 17
Table 1.9 2014/15 Material Assumptions – Revenue
Revenue Source and Assumptions
($ millions unless otherwise specified) 2014/15 Sensitivities
Second Quarter
Forecast
First Quarter
Forecast
Budget 2014
Estimate
Forests $785 $831 $800Prices (calendar year average) +/- US$50 change in SPF
SPF 2x4 ($US/1000 bd ft) ………………………………… $345 $346 $355 price equals +/- $75 to Random Lengths Composite $100 million ($US/thousand board feet) ......................................... $370 $372 $382Pulp ($US/tonne) …………………………………………… $838 $904 $923 +/- US$50 change in pulp priceCoastal log ($Cdn/cubic metre) equals +/-$5 to $10 million(Vancouver Log Market)…………………………..…. $86 $93 $94 +/- Cdn$10 change in average
log price equals +/-$10 to Fiscal Year Trade Assumptions $20 million
Export tax rate (effective rate) ...................................... 0.8% 0.8% 0.4%Lumber shipments and consumption (billion board feet) +/- 1 cent change in U.S. lumber consumption …………………….............. 40.4 40.4 40.3 exchange rate equals BC surge trigger volumes ……………………..………… 8.6 8.6 8.5 +/- $15 to $20 million on BC lumber exports to US ……………………………… 6.9 6.9 6.9 stumpage revenue
+/- 10% change in InteriorCrown harvest volumes (million cubic metres) harvest volumes equals
Interior ……………………………………………………… 50.8 49.7 48.2 +/- $40 to $50 millionCoast ………………………………………………………… 14.2 14.3 14.3 +/- 10% change in CoastalTotal ………………………………………………………… 65.0 64.0 62.5 harvest volumes equalsBC Timber Sales (included in above) …………………… 11.7 11.7 11.5 +/- $5 to $7 million
Components of revenue The above sensitivities relateTenures ……………………………………………………… $513 $519 $484 to stumpage revenue only.BC Timber Sales …………………………………………… $209 $242 $254 Depending on marketFederal border tax (SLA 2006 ) …………………………… $7 $8 $0 conditions, changes inLogging tax ………………………………………………… $20 $25 $25 stumpage revenues may beOther CRF revenue ………………………………………… $21 $22 $22 offset by changes in softwoodRecoveries…………………………………………………… $15 $15 $15 lumber border tax revenues
Other natural resources $471 $470 $458Components of revenue
Water rental and licences* ………………………………… $401 $400 $388Recoveries ………………………………………………… $50 $50 $50Angling and hunting permits and licences ……………… $13 $13 $13Recoveries ………………………………………………… $7 $7 $7* Water rentals for power purposes are indexed to Consumer Price Index.
Other revenue $9,385 $9,334 $9,381Components of revenue
Fees and licencesConsolidated Revenue Fund ..................................... $3,025 $3,012 $3,014
Medical Services Plan premiums .......................... $2,176 $2,166 $2,165 +/- 1% change in BC'sMotor vehicle licences and permits ………………… $522 $520 $519 population growth equalsOther Consolidated Revenue Fund ....................... $327 $326 $330 +/- $10 to $20 million on MSP
Recoveries................................................................ $208 $208 $208 premium revenueMSP recoveries ..................................................... $95 $95 $95Other recoveries ................................................... $113 $113 $113
Crown corporations and agencies ............................. $111 $107 $106Other service delivery agencies ................................ $1,992 $2,053 $2,060
Post-secondary education fees ……………………… $1,489 $1,531 $1,534Other health-care related fees ……………………… $332 $342 $346School Districts ..................................................... $171 $180 $180
Investment earningsConsolidated Revenue Fund ..................................... $80 $74 $79Fiscal agency loans & sinking funds earnings............ $870 $869 $881Elimination of transactions between appropriations … -$17 -$17 -$17Crown corporations and agencies.............................. $18 $30 $30Other service delivery agencies ................................ $140 $140 $145
Sales of goods and services ……………………………… $905 $934 $929Miscellaneous .............................................................. $1,853 $1,724 $1,746Asset sales ................................................................... $200 $200 $200
(continued )

18 Updated Financial Forecast
Second Quarterly Report 2014/15
Table 1.9 2014/15 Material Assumptions – Revenue
Revenue Source and Assumptions
($ millions unless otherwise specified) 2014/15 Sensitivities
Second Quarter
Forecast
First Quarter
Forecast
Budget 2014
Estimate
Health and social transfers $5,840 $5,810 $5,814National Cash TransfersCanada Health Transfer (CHT) ..................................... $32,100 $32,100 $32,100 +/- 0.1% change in BC'sCanada Social Transfer (CST) ..................................... $12,582 $12,582 $12,582 population share equalsBC share of national population (June 1) ……………… 13.03% 13.01% 13.04% +/- $45 to $50 million on CHSTBC health and social transfers revenueCHT ............................................................................. $4,183 $4,178 $4,184CST .............................................................................. $1,640 $1,637 $1,640Prior-year adjustments ................................................. — -$22 -$27Health deferral
Diagnostic and Medical Equipment ........................... $10 $10 $10Medical Equipment Trust .......................................... $7 $7 $7
Other federal contributions $1,523 $1,567 $1,572Components of revenue
Disaster Financial Assistance ...................................... $44 $43 $43Other Consolidated Revenue Fund .............................. $148 $149 $149Labour Market Development Agreement ...................... $301 $301 $301Labour Market Agreement ............................................ $66 $66 $66Family Support and Children in Care ............................ $49 $49 $49Local Government Services and Transfers ................... $8 $8 $8Other recoveries............................................................ $116 $116 $116Crown corporations and agencies ................................ $243 $243 $247Post secondary institutions .......................................... $463 $504 $504Other SUCH sector agencies........................................ $85 $88 $89
Service delivery agency directrevenue $5,883 $5,892 $5,991
School districts ……………………………………………… $536 $527 $527Post secondary institutions ………………………………… $3,048 $3,036 $3,045Health authorities and hospital societies ………………… $799 $814 $903BC Transportation Financing Authority …………………… $511 $516 $511Other service delivery agencies ...................................... $989 $999 $1,005
Commercial Crown corporation net income $2,885 $3,006 $3,075
BC Hydro …………………………………………………… $582 $588 $588reservoir water inflows …………………………………… 100% 100% 94% +/-1% in hydro generation
= +/-$15 millionmean gas price ……………………………………………… 3.90 4.79 4.23 +/-10% = -/+$5 million (Sumas, $US/MMbtu – BC Hydro forecast based on NYMEX forward selling prices)electricity prices ........…………………………................ 31.85 38.37 34.00 +/-10% change in electricity trade (Mid-C, $US/MWh) margins = +/-$15 million
ICBC …………………………………………………...……… $252 $363 $434vehicle growth .............................................................. +1.7% +1.7% +1.8% +/-1% = +/-$41 millioncurrent claims cost percentage change ........................ +5.5% +6.3% +6.5% +/-1% = -/+$34 millionunpaid claims balance .................................................. $8.0 billion $8.2 billion $8.1 billion +/-1% = -/+$75 to $81 millioninvestment return …………………………………………… 4.5% 4.9% 5.2% +/-1% return = +/-$135 to $140 millionloss ratio ....................................................................... 89.8% 89.0% 89.0%
(continued )

Second Quarterly Report 2014/15
Updated Financial Forecast 19
Table 1.10 2014/15 Material Assumptions – Expense
Ministry Programs and Assumptions
($ millions unless otherwise specified) Sensitivities 2014/15Advanced Education ……………………………… 1,936 1,936 1,936
Student spaces in public institutions …………… 201,220 201,220 201,220
(# FTEs)Children and Family Development ……………… 1,356 1,356 1,356
Average children-in-care ………………………… 8,100 8,100 8,100caseload (#)
Average annual residential ……………………… 37,200 37,200 37,200cost per child in care ($)
Education …………………………………………… 5,387 5,395 5,395
Enrolment (# of FTEs) …………………..………… 544,095 534,213 534,213 School age (K–12) .......................................... 521,064 518,368 518,368 Distributed Learning (online) ........................... 11,842 11,824 11,824 Summer .......................................................... 6,658 6 6 Adults ............................................................. 4,531 4,015 4,015
Forests, Lands and Natural Resource Operations …………………...…....................... 593 880 833
BC Timber Sales …………………………….…… 156 156 159
Direct Fire Fighting ............................................ 63 350 300
Health ................................................................. 16,936 16,936 16,936Pharmacare ………………………………………… 1,079 1,079 1,079
Medical Services Plan (MSP) …………………… 4,062 4,062 4,062
Regional Services ………………………………… 11,524 11,524 11,524Justice ......................................................……… 1,155 1,169 1,170
New cases filed/processed ……………………… 270,000 270,000 270,000
(# for all courts)
Crown Proceedings Act (CPA) ………………… 25 25 25
Policing, Victim Services and Corrections ......... 609 609 609
Emergency Program Act (EPA) ………………… 15 29 30
The number and size of litigation brought against the province, as well as the effectiveness of mitigation strategies and legal defence.
Second Quarter
Forecast
The number of student spaces may vary depending on the financial and other policies of post secondary institutions.
First Quarter
Forecast
A 1% increase in the cost per case or a 1% increase in the average caseload will affect expenditures by approximately $2 million (excluding Delegated Aboriginal Agencies).
Enrolment figures are based on BC Stats and school district enrolment trends, to which the ministry has added forecasts for distributed and summer learning and adult education.The 2014/15 summer learning forecast decrease is due to the teachers' job action, which limited enrolment to students needing courses to graduate and enter post secondary education as per a BC Labour Relations Board essential service ruling.
Budget 2014
Estimate
Targets can be impacted by changes to actual inventory costs incurred. There is a lag of approximately 1.5 years between when inventory costs are incurred and when they are expensed. Volume harvested can also impact targets. For example, if volume harvested is less than projected in any year then capitalized expenses will also be reduced in that year.
A 1% change in utilization or drug prices affects costs by approximately $10 million.
A 1% increase in volume of services provided by fee-for-service physicians affects costs by approximately $25 million.
The volume and severity of criminal activity, the number of inmate beds occupied and the number of offenders under community supervision.
The number and severity of natural disasters.
Over the past several years, Direct fire fighting costs have ranged from a low of $19 million in 1997 to $382 million in 2009.
The number of criminal cases proceeded on by the provincial and federal Crown (including appeals to higher courts in BC), the number of civil and family litigation cases, the number of violation tickets disputed, and the number of municipal bylaw tickets disputed which would go to court for resolution.

20 Updated Financial Forecast
Second Quarterly Report 2014/15
Table 1.10 2014/15 Material Assumptions – Expense
Ministry Programs and Assumptions
($ millions unless otherwise specified) Sensitivities 2014/15
Second Quarter
Forecast
First Quarter
Forecast
Budget 2014
Estimate
Social Development and Social Innovation ………………………………………… 2,530 2,530 2,530
Temporary Assistance ………………………….… 44,800 44,800 44,800annual average caseload (#)
Disability Assistance ……………………………… 91,200 91,200 91,200annual average caseload (#)
Adult Community Living:
Developmental Disabilities ProgramsAverage caseload (#) …………………………… 16,260 16,360 16,360
Average cost per client ($) ……………………… 46,100 45,800 45,800Personal Supports Initiative
Average caseload (#) …………………………… 780 800 800
Average cost per client ($) ……………………… 23,950 23,260 23,260
Tax Transfers ……………………………………… 778 772 818
Individuals ......................................................... 307.0 317.0 308.0
Low Income Climate Action ............................ 194.0 194.0 194.0Early Childhood Tax Benefit ............................ Sales Tax ....................................................... 53.0 53.0 50.5Small Business Venture Capital ...................... 25.0 25.0 22.0BC Senior's Home Renovation ........................ 4.0 4.0 1.0Other tax transfers to individuals .................... 30.7 40.7 40.2Family Bonus Program.................................... 0.3 0.3 0.3
Corporations ...................................................... 471.0 455.0 510.0Film and Television ......................................... 80.0 80.0 80.0Production Services ........................................ 197.5 182.5 193.8Scientific Research & Experimental Development ................................................ 74.0 71.0 67.2Interactive Digital Media .................................. 50.0 45.0 40.0Mining Exploration .......................................... 55.0 65.0 120.0Other tax transfers to corporations .................. 14.5 11.5 9.0
2014/15 tax transfer forecasts incorporates adjustments relating to prior years.
Management of Public Funds and Debt ……… 1,286 1,271 1,257Interest rates for new provincial borrowing:
Short-term ………………………………………. 1.09% 1.07% 1.00%Long-term ……………………………………….. 3.93% 3.35% 3.07%
CDN/US exchange rate (cents) ………………… 107.6 109.8 110.2
Service delivery agency net spending ………… 5,792 5,797 5,870
School districts …………………………………… 279 256 256Post secondary institutions ……………………… 2,985 2,973 3,011Health authorities and hospital societies ……… 645 654 688BC Transportation Financing Authority ………… 1,038 1,035 1,023Other service delivery agencies ………………… 845 879 892
The adult community living caseload is sensitive to an aging population and to the level of service offered. For example, residential care is significantly more costly than day programs. A 1% change in the average annual caseload will affect expenditures by approximately $7 million annually.
These tax transfers are now expensed as required under generally accepted accounting principles. Previously the family bonus was split 50/50 between expense program and as reduction to revenue while all other refundable credits were recorded as reduction to revenue.
Full year impact on MoPD on interest costs of a 1% change in interest rates equals $40.9 million; $100 million increase in debt level equals $2.6 million.
The expected to work caseload is sensitive to fluctuations in economic and employment trends in the service sector. A 1% change in the Temporary Assistance annual average caseload or average cost per case will affect expenditures by approximately $4 million annually.
The caseload for persons with disabilities is sensitive to the aging of the population and longer life expectancy for individuals with disabilities and significant health issues. A 1% change in the Disability Assistance annual average caseload or average cost per case will affect expenditures by approximately $9 million annually.
(continued )
Second Quarterly Report 2014/15
Updated Financial Forecast 21
Table 1.12 2014/15 Capital Spending
Actual Actual
($ millions) Budget Actual Variance 2013/14 Budget Forecast Variance 2013/14
Taxpayer-supportedEducation
School districts …………………………… 255 230 (25) 235 511 506 (5) 466 Post secondary institutions ……………… 441 248 (193) 161 883 818 (65) 507
Health ………………………………………… 423 309 (114) 227 847 1,033 186 690 BC Transportation Financing Authority …… 522 547 25 584 1,044 982 (62) 1,017 BC Transit .................................................. 68 31 (37) 23 136 101 (35) 80 Government operating (ministries) ………… 191 107 (84) 110 432 422 (10) 298 Other 1………………………………………… 82 63 (19) 32 177 150 (27) 93
Total taxpayer-supported ………………… 1,982 1,535 (447) 1,372 4,030 4,012 (18) 3,151
Self-supportedBC Hydro ……………………………………… 1,249 960 (289) 957 2,262 2,262 - 2,036 Columbia River power projects 2…………… 13 11 (2) 13 26 52 26 52 Transportation Investment Corporation
(Port Mann) ………………………………… 49 49 - 138 83 120 37 202 BC Rail ……………………………………… 4 2 (2) 4 8 6 (2) 8 ICBC ………………………………………… 33 40 7 32 91 91 - 82 BC Lottery Corporation ……………………… 46 31 (15) 35 90 90 - 100 Liquor Distribution Branch ………………… 15 7 (8) 1 30 30 - 13 Other 3………………………………………… - - - - - - - 26
Total self-supported ……………………… 1,409 1,100 (309) 1,180 2,590 2,651 61 2,519
Total capital spending …………………… 3,391 2,635 (756) 2,552 6,620 6,663 43 5,670
1
2
3 Includes post secondary institutions self-supported subsidiaries.
Joint ventures of the Columbia Power Corporation and Columbia Basin Trust.
Includes BC Housing Management Commission, Provincial Rental Housing Corporation and other service delivery agencies.
Year-to-Date to September 30
2014/15
Full Year
2014/15
j:\FEP\ECB\quarterly\2005_06\q2\fiscal\tables\debt and capital\Table 1.12 Q2 2014-15 Capital – September 11/17/2014 10:30 AM
Table 1.11 2014/15 Full-Time Equivalents (FTEs) 1
2014/15 ActualFTEs Budget Forecast Variance 2013/14
Ministries and special offices (consolidated revenue fund) …………………… 26,300 26,420 120 26,526 Service delivery agencies 2………………………………………………………… 4,680 4,680 - 4,640 Total FTEs ………………………………………………………………………… 30,980 31,100 120 31,166 1
2
Full-time equivalents (FTEs) are a measure of staff employment. FTEs are calculated by dividing the total hours of employment paid for in a given period by the number of hours an individual, full-time person would normally work in that period. This does not equate to the physical number of employees. For example, two half-time employees would equal one FTE, or alternatively, three FTEs may represent two full-time employees who have worked sufficient overtime hours to equal an additional FTE.
Service delivery agency FTE amounts do not include SUCH sector staff employment.
j:\FEP\ECB\Quarterly\2006_07\q2\Fiscal\Fiscal Tables\Table 1.11 Q2 2014-15 ftes 11/17/2014 10:40 AM
22 Updated Financial Forecast
Second Quarterly Report 2014/15
Table 1.13 Capital Expenditure Projects Greater Than $50 million 1
Note: Information in bold type denotes changes from the 2014/15 first Quarterly Report released on September 9, 2014.Project Estimated Anticipated Project Financing
Year of Cost to Cost to Total Internal/ P3 Federal Other($ millions) Completion Sept 30, 2014 Complete Cost Borrowing Liability Gov't Contrib'ns
Taxpayer-supportedSchool districts
Southern Okanagan Secondary 2………………… 2013 50 4 54 52 - - 2 Chilliwack Secondary 2…………………………… 2013 53 5 58 58 - - - Centennial Secondary …………………………… 2015 12 49 61 61 - - - Oak Bay Secondary ……………………………… 2015 29 23 52 50 - - 2 Kitsilano Secondary ……………………………… 2015 12 52 64 60 - - 4 Belmont Secondary ……………………………… 2015 24 32 56 30 - - 26 Seismic mitigation program ……………………… 2023 28 1,272 1,300 1,300 - - -
Total school districts …………………………… 208 1,437 1,645 1,611 - - 34 Post secondary institutions
Emily Carr University of Art and Design– Campus redevelopment at Great
Northern Way …………………………………… 2017 4 130 134 113 - - 21
Total post secondary institutions ……………… 4 130 134 113 - - 21 Health facilities
Northern Cancer Control Strategy 2
– Direct procurement ……………………………… 2014 27 8 35 32 - - 3 – P3 contract ……………………………………… 2012 71 - 71 54 17 - - Lions Gate Hospital (Mental Health)
Redevelopment ………………………………… 2014 44 18 62 38 - - 24 Lakes District Hospital …………………………… 2015 29 26 55 46 - - 9 Queen Charlotte/Haida Gwaii Hospital ………… 2015 9 41 50 31 - - 19 Surrey Emergency/Critical Care Tower– Direct procurement ……………………………… 2016 117 77 194 174 - - 20 – P3 contract ……………………………………… 2014 318 - 318 139 179 - - Royal Inland Hospital ……………………………… 2016 4 76 80 47 - - 33 North Island Hospitals …………………………… – Direct procurement …………………………… 2017 15 111 126 73 - - 53 – P3 contract ……………………………………… 2017 21 459 480 60 232 - 188 Interior Heart and Surgical Centre– Direct procurement ……………………………… 2017 106 147 253 213 - - 40 – P3 contract ……………………………………… 2015 92 36 128 4 79 - 45 Vancouver General Hospital – Joseph and
Rosalie Segal Family Health Centre …………… 2017 5 77 82 57 - - 25 Children's and Women's Hospital – Direct procurement ……………………………… 2019 71 238 309 177 - - 132 – P3 contract ……………………………………… 2017 40 329 369 168 187 - 14 Penticton Regional Hospital – Patient Care
Tower ……………………………………………… 2019 - 325 325 168 - - 157 Clinical and systems transformation …………… 2023 74 406 480 480 - - -
Total health facilities …………………………… 1,043 2,374 3,417 1,961 694 - 762 Transportation
South Fraser Perimeter Road– Direct procurement ……………………………… 2014 1,070 6 1,076 728 - 348 - – P3 contract ……………………………………… 2014 188 - 188 - 188 - - Sierra Yoyo Desan Road upgrade ……………… 2014 134 16 150 150 - - - Evergreen Line Rapid Transit– Direct procurement ……………………………… 2016 248 288 536 321 - 74 141 – P3 contract ……………………………………… 2016 496 399 895 - 265 350 280
Total transportation ……………………………… 2,136 709 2,845 1,199 453 772 421
Second Quarterly Report 2014/15
Updated Financial Forecast 23
Table 1.13 Capital Expenditure Projects Greater Than $50 million 1 (continued )Note: Information in bold type denotes changes from the 2014/15 first Quarterly Report released on September 9, 2014.
Project Estimated Anticipated Project FinancingYear of Cost to Cost to Total Internal/ P3 Federal Other
($ millions) Completion Sept 30, 2014 Complete Cost Borrowing Liability Gov't Contrib'ns
Other taxpayer-supportedIntegrated Case Management system…………… 2014 175 7 182 179 - 3 - Single Room Occupancy Hotel renewal initiative– Direct procurement ……………………………… 2016 10 15 25 23 - 2 - – P3 contract ……………………………………… 2016 63 55 118 - 91 27 - Okanagan Correctional Centre– Direct procurement ……………………………… 2016 21 70 91 91 - - - – P3 contract ……………………………………… 2016 22 107 129 8 121 - -
Total other ………………………………………… 291 254 545 301 212 32 -
Total taxpayer-supported ........ 3,682 4,904 8,586 5,185 1,359 804 1,238
Self-supportedTransportation
Port Mann Bridge / Highway 1 ........................... 2015 3,248 71 3,319 3,319 - - - Power generation and transmission
BC Hydro– Seymour Arm series capacitor 2………………… 2014 48 1 49 49 - - - – Vancouver City Central transmission 2………… 2014 171 - 171 171 - - - – Mica gas insulated switchgear replacement 2… 2014 174 25 199 199 - - - – Northwest transmission line 2…………………… 2014 657 89 746 359 - 130 257 – Merritt area transmission ……………………… 2014 33 32 65 65 - - - – Smart metering and infrastructure program … 2015 708 222 930 930 - - - – Dawson Creek/Chetwynd area transmission … 2015 134 162 296 296 - - - – Interior to Lower Mainland transmission line … 2015 511 214 725 725 - - - – GM Shrum units 1 to 5 turbine upgrade ……… 2015 138 134 272 272 - - - – Iskut extension project ………………………… 2015 44 136 180 140 - - 40 – Surrey area substation project ………………… 2015 29 65 94 94 - - - – Hugh Keenleyside spillway gate reliability
upgrade ………………………………………… 2015 82 41 123 123 - - - – Mica units 5 and 6 project ……………………… 2015 462 252 714 714 - - - – Long Beach reinforcement ……………………… 2015 15 41 56 56 - - - – Big Bend substation …………………………… 2017 17 39 56 56 - - - – Ruskin Dam safety and powerhouse upgrade 2017 262 486 748 748 - - - – John Hart replacement ………………………… 2019 197 896 1,093 1,093 - - - – Cheakamus units 1 and 2 generator
replacement ……………………………………… 2019 4 70 74 74 - - - Columbia River power projects– Waneta Dam power expansion 3……………… 2015 302 48 350 350 - - -
Total power generation and transmission …… 3,988 2,953 6,941 6,514 - 130 297
OtherBritish Columbia Lottery Corporation– Gaming management system ......................... 2015 80 18 98 98 - - - Insurance Corporation of British Columbia– Business transformation program ................... 2016 207 90 297 297 - - -
Total other ………………………………………… 287 108 395 395 - - -
Total self-supported ................ 7,523 3,132 10,655 10,228 - 130 297
Total $50 million projects ....... 11,205 8,036 19,241 15,413 1,359 934 1,535
1
2
3 Reflects the combined shares of Columbia Power Corporation (32.5 per cent) and Columbia Basin Trust (16.5 per cent) in their partnership with Fortis Inc. for the development of an electricity generating facility at the Waneta Dam south of Trail.
Only projects that receive provincial funding and have been approved by Treasury Board and/or Crown corporation boards are included in this table. Ministry service plans may include projects that still require final approval. Capital costs reflect current government accounting policy.
Assets have been put into service and only trailing costs remain.
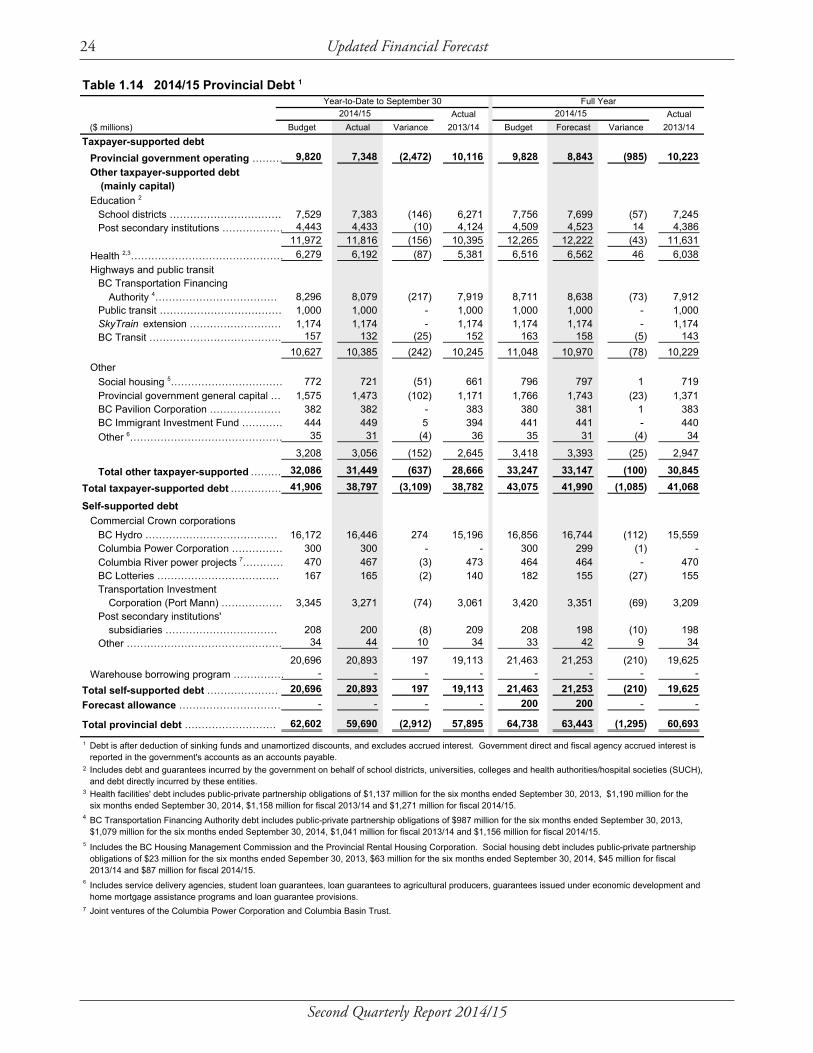
24 Updated Financial Forecast
Second Quarterly Report 2014/15
Table 1.14 2014/15 Provincial Debt 1
Actual Actual($ millions) Budget Actual Variance 2013/14 Budget Forecast Variance 2013/14
Taxpayer-supported debtProvincial government operating ……… 9,820 7,348 (2,472) 10,116 9,828 8,843 (985) 10,223 Other taxpayer-supported debt
(mainly capital)Education 2
School districts …………………………… 7,529 7,383 (146) 6,271 7,756 7,699 (57) 7,245 Post secondary institutions ……………… 4,443 4,433 (10) 4,124 4,509 4,523 14 4,386
11,972 11,816 (156) 10,395 12,265 12,222 (43) 11,631 Health 2,3……………………………………… 6,279 6,192 (87) 5,381 6,516 6,562 46 6,038 Highways and public transit
BC Transportation FinancingAuthority 4……………………………… 8,296 8,079 (217) 7,919 8,711 8,638 (73) 7,912
Public transit ……………………………… 1,000 1,000 - 1,000 1,000 1,000 - 1,000 SkyTrain extension ……………………… 1,174 1,174 - 1,174 1,174 1,174 - 1,174 BC Transit ………………………………… 157 132 (25) 152 163 158 (5) 143
10,627 10,385 (242) 10,245 11,048 10,970 (78) 10,229 Other
Social housing 5…………………………… 772 721 (51) 661 796 797 1 719 Provincial government general capital … 1,575 1,473 (102) 1,171 1,766 1,743 (23) 1,371 BC Pavilion Corporation ………………… 382 382 - 383 380 381 1 383 BC Immigrant Investment Fund ………… 444 449 5 394 441 441 - 440 Other 6……………………………………… 35 31 (4) 36 35 31 (4) 34
3,208 3,056 (152) 2,645 3,418 3,393 (25) 2,947
Total other taxpayer-supported ……… 32,086 31,449 (637) 28,666 33,247 33,147 (100) 30,845
Total taxpayer-supported debt …………… 41,906 38,797 (3,109) 38,782 43,075 41,990 (1,085) 41,068
Self-supported debtCommercial Crown corporations
BC Hydro ………………………………… 16,172 16,446 274 15,196 16,856 16,744 (112) 15,559 Columbia Power Corporation …………… 300 300 - - 300 299 (1) - Columbia River power projects 7………… 470 467 (3) 473 464 464 - 470 BC Lotteries ……………………………… 167 165 (2) 140 182 155 (27) 155 Transportation Investment
Corporation (Port Mann) ……………… 3,345 3,271 (74) 3,061 3,420 3,351 (69) 3,209 Post secondary institutions'
subsidiaries …………………………… 208 200 (8) 209 208 198 (10) 198 Other ……………………………….……… 34 44 10 34 33 42 9 34
20,696 20,893 197 19,113 21,463 21,253 (210) 19,625 Warehouse borrowing program …………… - - - - - - - -
Total self-supported debt ………………… 20,696 20,893 197 19,113 21,463 21,253 (210) 19,625 Forecast allowance ………………………… - - - - 200 200 - -
Total provincial debt ……………………… 62,602 59,690 (2,912) 57,895 64,738 63,443 (1,295) 60,693
1
2
3
4
5
6
7
Health facilities' debt includes public-private partnership obligations of $1,137 million for the six months ended September 30, 2013, $1,190 million for the six months ended September 30, 2014, $1,158 million for fiscal 2013/14 and $1,271 million for fiscal 2014/15.
Year-to-Date to September 30 Full Year
Joint ventures of the Columbia Power Corporation and Columbia Basin Trust.
2014/15 2014/15
Debt is after deduction of sinking funds and unamortized discounts, and excludes accrued interest. Government direct and fiscal agency accrued interest is reported in the government's accounts as an accounts payable.Includes debt and guarantees incurred by the government on behalf of school districts, universities, colleges and health authorities/hospital societies (SUCH), and debt directly incurred by these entities.
Includes the BC Housing Management Commission and the Provincial Rental Housing Corporation. Social housing debt includes public-private partnership obligations of $23 million for the six months ended Sepember 30, 2013, $63 million for the six months ended September 30, 2014, $45 million for fiscal 2013/14 and $87 million for fiscal 2014/15.
Includes service delivery agencies, student loan guarantees, loan guarantees to agricultural producers, guarantees issued under economic development and home mortgage assistance programs and loan guarantee provisions.
BC Transportation Financing Authority debt includes public-private partnership obligations of $987 million for the six months ended September 30, 2013, $1,079 million for the six months ended September 30, 2014, $1,041 million for fiscal 2013/14 and $1,156 million for fiscal 2014/15.

Second Quarterly Report 2014/15
Updated Financial Forecast 25
Table 1.15 2014/15 Statement of Financial PositionActual Year-to-Date Forecast
March 31, September 30, March 31,($ millions) 2014 2014 2015
Financial assetsCash and temporary investments …………………………………………………… 2,802 3,547 2,041 Other financial assets ………………………………………………………………… 9,336 8,244 9,256 Sinking funds ………………………………………………………………………… 835 803 902 Investments in commercial Crown corporations:
Retained earnings ………………………………………………………………… 7,839 8,237 8,163 Recoverable capital loans ………………………………………………………… 18,921 20,181 20,547
26,760 28,418 28,710 39,733 41,012 40,909
LiabilitiesAccounts payable and accrued liabilities ………………………………………… 8,024 7,709 8,182 Deferred revenue …………………………………………………………………… 9,684 10,652 9,531 Debt:
Taxpayer-supported debt ………………………………………………………… 41,068 38,797 41,990 Self-supported debt ………………………………………………………………… 19,625 20,893 21,253 Forecast allowance ………………………………………………………………… - - 200
Total provincial debt ………………………………………………………………… 60,693 59,690 63,443 Add: debt offset by sinking funds ……………………………………………… 835 803 902 Less : guarantees and non-guaranteed debt …………………………………… (726) (351) (725)
Financial statement debt …………………………………………………………… 60,802 60,142 63,620 78,510 78,503 81,333
Net liabilities …………………………………………………………………………… (38,777) (37,491) (40,424) Capital and other non-financial assets
Tangible capital assets ……………………………………………………………… 37,778 38,294 39,643 Other non-financial assets …………………………………………………………… 3,134 3,083 3,088
40,912 41,377 42,731 Accumulated surplus ……………………………..………………………………… 2,135 3,886 2,307
Changes in Financial PositionYear-to-Date Forecast
September 30, March 31,($ millions) 2014 2015
(Surplus) deficit for the period ………………………………………………………………………… (1,943) (444) Comprehensive income (increase) decrease ………………………………………………………… 192 272
(Increase) decrease in accumulated surplus ……………………………………………………………… (1,751) (172) Capital and other non-financial asset changes:
Increase in taxpayer-supported capital investments ………………………………………………… 1,535 4,012 Less: amortization and other accounting changes ……………………………………………… (1,019) (2,147) Change in net capital assets ………………………………………………………………………… 516 1,865
Increase (decrease) in other non-financial assets …………………………………………………… (51) (46) 465 1,819
Increase (decrease) in net liabilities ......................................................................................... (1,286) 1,647 Investment and working capital changes:
Increase (reduction) in cash and temporary investments …………………………………………… 745 (761) Increase in total investment in commercial Crown corporations:
Increase (decrease) in retained earnings ………………………………………………………… 398 324 Self-supported capital investments ………………………………………………………………… 1,100 2,651 Less: loan repayments and other accounting changes ………………………………………… 160 (1,025)
1,658 1,950 Other working capital changes ………………………………………………………………………… (1,777) (18)
626 1,171 Increase (decrease) in financial statement debt …………………………………………………… (660) 2,818
(Increase) decrease in sinking fund debt …………………………………………………………… 32 (67) Increase (decrease) in guarantees and non-guaranteed debt …………………………………… (375) (1)
Increase (decrease) in total provincial debt ……………………………………………………… (1,003) 2,750


Second Quarterly Report 2014/15
Summary• In the first Quarterly Report, the Ministry of Finance forecast BC’s real GDP to grow
by 1.9 per cent in 2014 and 2.3 per cent in 2015. The private sector outlook for 2014 has increased slightly since that time and the Ministry’s forecast for BC in both years remains prudent compared to the average private sector projection.
• BC’s economy has experienced steady growth so far in 2014 in some of its key sectors, including exports, retail sales and housing. However, employment gains and inflation in BC have been modest.
• Downside risks to BC’s economic outlook include the potential for slowing domestic activity, weakness in the US economic recovery and slowing Asian demand. Additional risks include the ongoing sovereign debt situation in Europe, a fluctuating Canadian dollar and weak inflation.
British Columbia outlook – comparison to private sector forecasts
Private sector projections for BC’s economic growth have changed slightly over the last several months. At the time of the first Quarterly Report, the private sector anticipated that BC’s real GDP would expand by 2.2 per cent in 2014 and 2.7 per cent in 2015. As of November 17, 2014, this average forecast increased 0.1 percentage points in 2014 and remained unchanged in 2015, ranking BC second among provinces for growth in both years (behind only Alberta). The Ministry of Finance forecast of 1.9 per cent in 2014 and 2.3 per cent in 2015 for BC economic growth remains prudent compared to the current average private sector outlook.
PART TWO — ECONOMIC REVIEW AND OUTLOOK 1
2014/15 Second Quarterly Report November 26, 2014
1 Reflects information available as of November 17, 2014, unless otherwise indicated.
2.2
2.7
2.3
2.7
1.9
2.3
0.0
1.0
2.0
3.0
4.0BC Real GDP (annual per cent change)
Sources: Ministry of Finance and Private Sector Average (subset of the Economic Forecast Council: BMO, CIBC, IHS Global Insight, RBC, Scotiabank and TD)
2014 2015
Private Sector Average
(Aug. 29, 2014)
Private Sector Average
(Aug. 29, 2014)
Private Sector Average
(Nov. 17, 2014)
Private Sector Average
(Nov. 17, 2014)
Ministry of Finance First Quarterly Report 2014
Ministry of Finance First Quarterly Report 2014
Chart 2.1 Ministry forecast for BC remains prudent
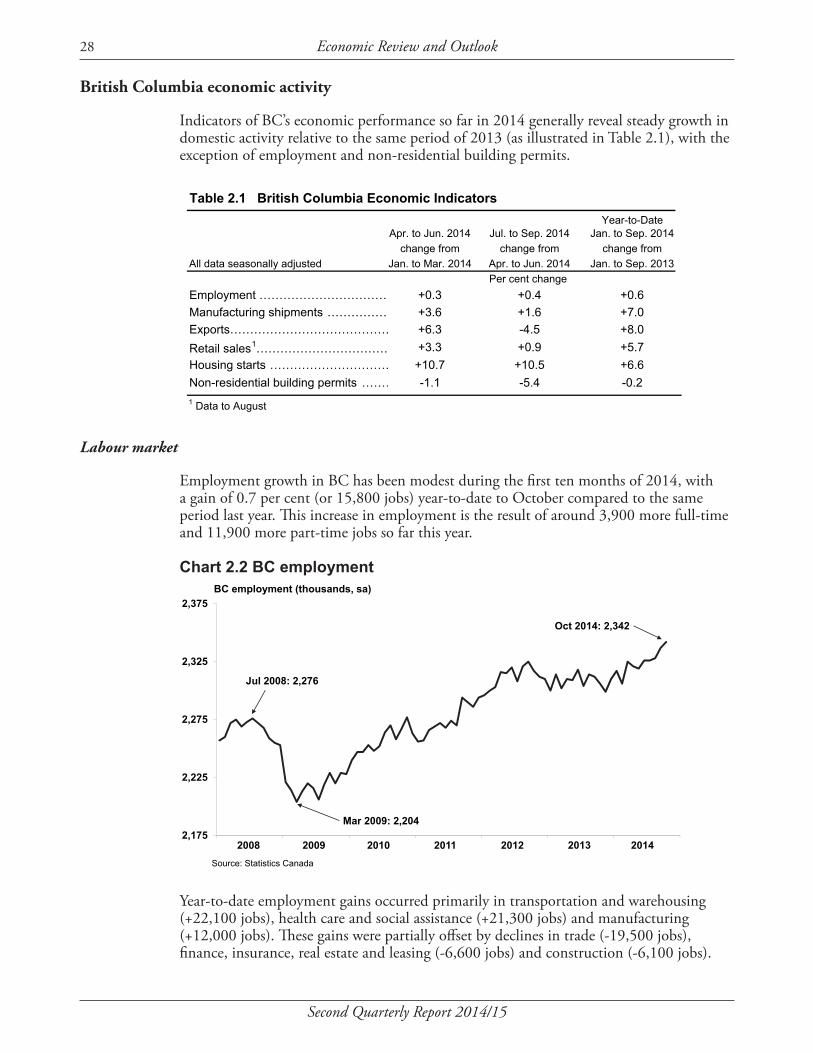
28 Economic Review and Outlook
Second Quarterly Report 2014/15
British Columbia economic activity
Indicators of BC’s economic performance so far in 2014 generally reveal steady growth in domestic activity relative to the same period of 2013 (as illustrated in Table 2.1), with the exception of employment and non-residential building permits.
Labour market
Employment growth in BC has been modest during the first ten months of 2014, with a gain of 0.7 per cent (or 15,800 jobs) year-to-date to October compared to the same period last year. This increase in employment is the result of around 3,900 more full-time and 11,900 more part-time jobs so far this year.
Year-to-date employment gains occurred primarily in transportation and warehousing (+22,100 jobs), health care and social assistance (+21,300 jobs) and manufacturing (+12,000 jobs). These gains were partially offset by declines in trade (-19,500 jobs), finance, insurance, real estate and leasing (-6,600 jobs) and construction (-6,100 jobs).
Table 2.1 British Columbia Economic IndicatorsYear-to-Date
Apr. to Jun. 2014 Jul. to Sep. 2014 Jan. to Sep. 2014change from change from change from
All data seasonally adjusted Jan. to Mar. 2014 Apr. to Jun. 2014 Jan. to Sep. 2013Per cent change
Employment …………………………… +0.3 +0.4 +0.6Manufacturing shipments …………… +3.6 +1.6 +7.0Exports…………………………………… +6.3 -4.5 +8.0Retail sales1…………………………… +3.3 +0.9 +5.7Housing starts ………………………… +10.7 +10.5 +6.6Non-residential building permits ……… -1.1 -5.4 -0.21 Data to August
Table 2.1 econ inds 2014-11-18 1:22 PM
2,175
2,225
2,275
2,325
2,375
Source: Statistics Canada
BC employment (thousands, sa)
Mar 2009: 2,204
2010 2011 201220092008 2014
Oct 2014: 2,342
Jul 2008: 2,276
2013
Chart 2.2 BC employment

Second Quarterly Report 2014/15
Economic Review and Outlook 29
BC’s monthly unemployment rate sat at 6.1 per cent in October 2014, unchanged from the previous month. The rate averaged 6.1 per cent year-to-date to October. Although this represents a 0.5 percentage point drop relative to the first ten months in 2013, this decline was partly due to slower-than-anticipated labour force growth (up only 0.2 per cent).
Consumer spending and housing
Despite modest job creation, retail sales have been a source of strength in BC’s economy so far this year. During the first eight months of 2014, sales increased by a robust 5.7 per cent compared to the same period last year. Gains over this period were broad based, with notable increases observed at motor vehicle and parts dealers, general merchandise stores, and food and beverage stores. Meanwhile, the only retail segment to lose sales year-to-date to August was building material and garden equipment and supply dealers. Though it may be too soon to fully understand the divergence between employment and retail sales growth in recent quarters, possible explanations may include increased tourist traffic to BC and the return to positive net interprovincial migration into the province year-to-date to June (after two years of annual net outflows to other provinces). However, the current pace of retail spending is not expected to continue given the modest employment situation, particularly for purchases of expensive discretionary products such as automobiles.
Annual inflation in BC registered above 1.0 per cent for the sixth consecutive month in September, after remaining below that rate for nineteen months in a row. The extended period of weak price growth prior to April 2014 was partially the result of the return to the PST sales tax system in April 2013. Overall, consumer prices in BC increased by 1.0 per cent through the first nine months of 2014 compared to January through September 2013. Over this period, inflation was relatively strong for energy products (such as gasoline) and food purchased from stores, while prices fell for food purchased from restaurants and home entertainment equipment, parts and services.
Chart 2.3 BC retail sales
4,250
4,575
4,900
5,225
5,550
5,875
Source: Statistics Canada
BC retail sales ($ millions, sa)
2010 2011 201320092008 2014
Aug 2014: 5,588
Dec 2008: 4,379
Jun 2008: 4,957
2012

30 Economic Review and Outlook
Second Quarterly Report 2014/15
BC housing starts averaged about 27,900 annualized units through the first ten months of 2014. The level is in line with the historical trend (with home construction averaging around 28,900 units from January 1990 to December 2013) and represents a 5.8 per cent gain compared to the same period in 2013. Meanwhile, residential building permits (a leading indicator of new housing activity) advanced by 4.9 per cent year-to-date to September 2014 compared to the same period last year, suggesting that strength may continue in BC homebuilding in the near future.
Home sales in BC advanced through the first ten months of 2014, climbing 15.1 per cent year-to-date to October compared to the same period of last year. At the same time, the average home price during this period was around $566,700, a gain of 6.8 per cent. Low mortgage rates and improving economic conditions are partly responsible for the strong housing market activity this year; however, momentum may wane as interest rates are expected to increase in the latter half of 2015.
The value of total non-residential building permits fell by 0.2 per cent year-to-date to September relative to the same period last year. Gains in commercial permits (+8.2 per cent) were outweighed by declines in industrial (-21.4 per cent) and institutional and government permits (-6.4 per cent) over the period.
External trade and commodity markets
BC businesses have enjoyed solid growth in export sales through the first nine months of 2014, with the value of BC international merchandise exports increasing by 8.0 per cent compared to the same period last year. In particular, substantial gains occurred in exports of metal ores and non-metallic minerals (+25.9 per cent), industrial machinery, equipment and parts (+17.8 per cent), and forestry products and building and packaging materials (+7.6 per cent). Exporters have benefited from increased economic activity in the US, with American exports up 15.4 per cent year-to-date to September. However, BC exports to China increased only 1.2 per cent over this period after eight consecutive years of double-digit growth, as slowing growth in the Chinese economy has restrained demand for BC products (in particular coal, which is down 22.3 per cent year-to-date to September).
Chart 2.4 BC housing starts
5,000
15,000
25,000
35,000
45,000
55,000
Source: Canada Mortgage and Housing Corporation
BC housing starts (units, saar)
Oct 2014: 25,004
Sep 2008: 40,026
Mar 2009: 11,452
2008 2009 2010 2012 2013 20142011

Second Quarterly Report 2014/15
Economic Review and Outlook 31
Like total goods exports, decent gains were also observed in shipments of manufactured goods in BC from January through September 2014, up 7.0 per cent compared to the first nine months of 2013. Notable growth was recorded in sectors such as shipments of paper products (+12.4 per cent), machinery (+12.1 per cent) and food (+5.7 per cent), which offset losses in electrical equipment, appliance and computer products (-7.4 per cent) and primary metal (-5.4 per cent).
Although prices for several forestry and energy products have increased in the first ten months of 2014 compared to last year, global commodity prices in general are expected to fluctuate in the near-term due to ongoing global economic uncertainty and slowing growth of the Chinese economy.
The price of spruce-pine-fir (SPF) lumber started 2014 at $375 US/000 board feet in January and dropped to a low of $325 US/000 board feet in June. Since then, the price climbed steadily to reach $363 US/000 board feet in September then slipped to $350 US/000 board feet in October. Altogether, the price has increased 0.3 per cent year-to-date to October.
The average price of pulp has increased every month for the past two years, with the exception of August 2013. It began 2014 at $910 US per tonne and resided at $932 per tonne as of October, registering a 9.0 per cent increase compared to the first ten months of 2013.
After reaching $105.79 US per barrel in June 2014, the daily West Texas Intermediate (WTI) oil price dropped dramatically in recent months, landing at $84.40 US per barrel in October. The decline was due to a number of factors, such as increased oil production in the US, slower growth in global demand and appreciation of the US dollar. Overall, the average price over the first ten months of 2014 ($98.27 US per barrel) was almost unchanged from the same period in 2013. Meanwhile, the price of natural gas shot up 78.0 per cent month-over-month to $5.19 C/GJ in February 2014 alongside surging
Chart 2.5 BC exports
1.5
1.9
2.3
2.7
3.1
3.5
Source: BC Stats
2012
BC total merchandise exports ($ billions, sa)
2013201020092008
Sept 2014: 3.0
2014
Oct 2008: 3.1
Sep 2009: 1.9
2011
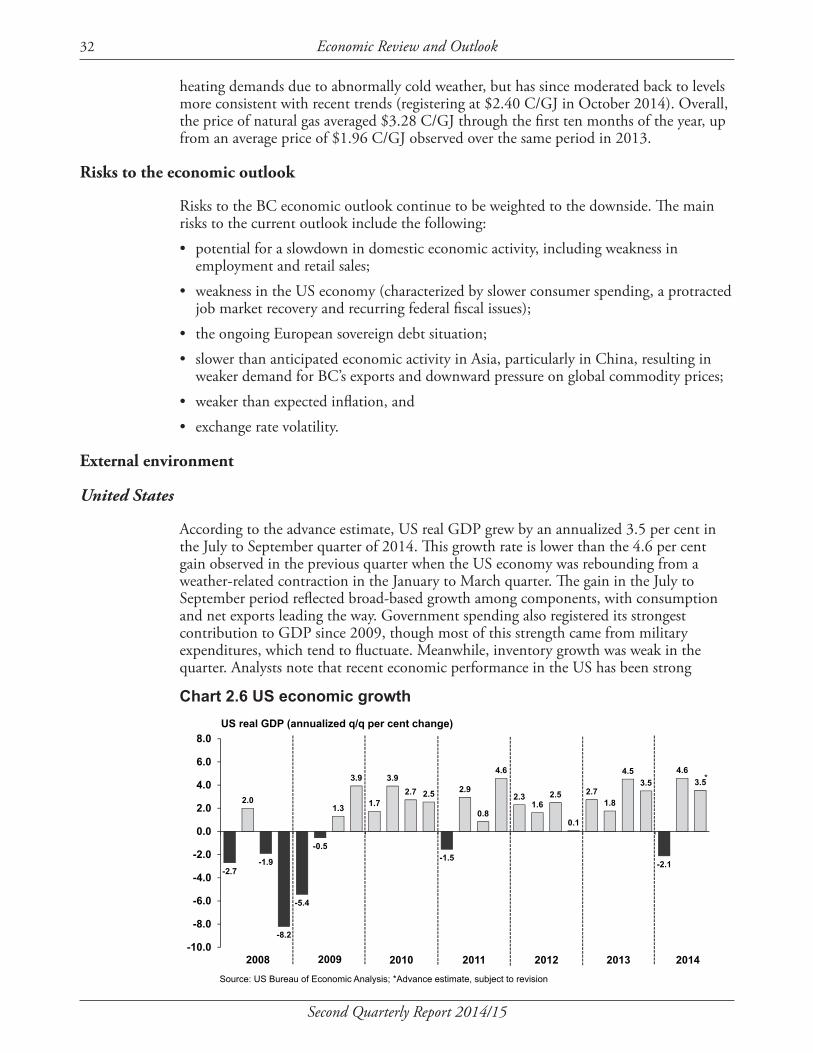
32 Economic Review and Outlook
Second Quarterly Report 2014/15
heating demands due to abnormally cold weather, but has since moderated back to levels more consistent with recent trends (registering at $2.40 C/GJ in October 2014). Overall, the price of natural gas averaged $3.28 C/GJ through the first ten months of the year, up from an average price of $1.96 C/GJ observed over the same period in 2013.
Risks to the economic outlook
Risks to the BC economic outlook continue to be weighted to the downside. The main risks to the current outlook include the following:• potential for a slowdown in domestic economic activity, including weakness in
employment and retail sales;• weakness in the US economy (characterized by slower consumer spending, a protracted
job market recovery and recurring federal fiscal issues);• the ongoing European sovereign debt situation;• slower than anticipated economic activity in Asia, particularly in China, resulting in
weaker demand for BC’s exports and downward pressure on global commodity prices;• weaker than expected inflation, and• exchange rate volatility.
External environment
United States
According to the advance estimate, US real GDP grew by an annualized 3.5 per cent in the July to September quarter of 2014. This growth rate is lower than the 4.6 per cent gain observed in the previous quarter when the US economy was rebounding from a weather-related contraction in the January to March quarter. The gain in the July to September period reflected broad-based growth among components, with consumption and net exports leading the way. Government spending also registered its strongest contribution to GDP since 2009, though most of this strength came from military expenditures, which tend to fluctuate. Meanwhile, inventory growth was weak in the quarter. Analysts note that recent economic performance in the US has been strong
Chart 2.6 US economic growth
-2.7
2.0
-1.9
-8.2
-5.4
-0.5
1.3
3.9
1.7
3.92.7 2.5
-1.5
2.9
0.8
4.6
2.31.6
2.5
0.1
2.71.8
4.53.5
-2.1
4.63.5
-10.0
-8.0
-6.0
-4.0
-2.0
0.0
2.0
4.0
6.0
8.0US real GDP (annualized q/q per cent change)
Source: US Bureau of Economic Analysis; *Advance estimate, subject to revision
2008 2009 2011 2012 2014
*
20132010
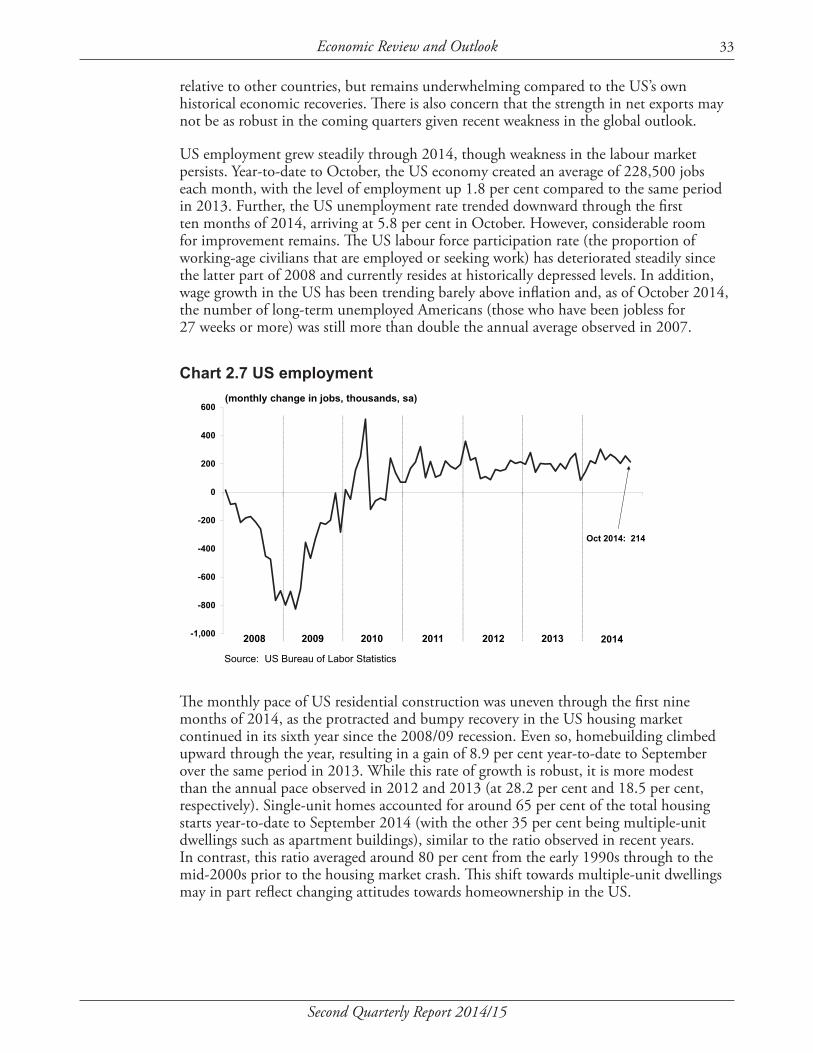
Second Quarterly Report 2014/15
Economic Review and Outlook 33
relative to other countries, but remains underwhelming compared to the US’s own historical economic recoveries. There is also concern that the strength in net exports may not be as robust in the coming quarters given recent weakness in the global outlook.
US employment grew steadily through 2014, though weakness in the labour market persists. Year-to-date to October, the US economy created an average of 228,500 jobs each month, with the level of employment up 1.8 per cent compared to the same period in 2013. Further, the US unemployment rate trended downward through the first ten months of 2014, arriving at 5.8 per cent in October. However, considerable room for improvement remains. The US labour force participation rate (the proportion of working-age civilians that are employed or seeking work) has deteriorated steadily since the latter part of 2008 and currently resides at historically depressed levels. In addition, wage growth in the US has been trending barely above inflation and, as of October 2014, the number of long-term unemployed Americans (those who have been jobless for 27 weeks or more) was still more than double the annual average observed in 2007.
The monthly pace of US residential construction was uneven through the first nine months of 2014, as the protracted and bumpy recovery in the US housing market continued in its sixth year since the 2008/09 recession. Even so, homebuilding climbed upward through the year, resulting in a gain of 8.9 per cent year-to-date to September over the same period in 2013. While this rate of growth is robust, it is more modest than the annual pace observed in 2012 and 2013 (at 28.2 per cent and 18.5 per cent, respectively). Single-unit homes accounted for around 65 per cent of the total housing starts year-to-date to September 2014 (with the other 35 per cent being multiple-unit dwellings such as apartment buildings), similar to the ratio observed in recent years. In contrast, this ratio averaged around 80 per cent from the early 1990s through to the mid-2000s prior to the housing market crash. This shift towards multiple-unit dwellings may in part reflect changing attitudes towards homeownership in the US.
Chart 2.7 US employment
-1,000
-800
-600
-400
-200
0
200
400
600
Source: US Bureau of Labor Statistics
2012
(monthly change in jobs, thousands, sa)
Oct 2014: 214
20132011201020092008 2014

34 Economic Review and Outlook
Second Quarterly Report 2014/15
Sales of new and existing homes in the US have been weak so far in 2014. Existing home sales averaged 4.9 million annualized units year-to-date to September, a decrease of 5.0 per cent relative to the same period of 2013. New home sales fared better over this time, averaging around 434,300 annualized units through the first nine months of 2014 and registering a slight year-to-date gain of 2.1 per cent compared to the previous year. Meanwhile, US home prices were still about 9 per cent below their pre-recession peak in August 2014, and around 11 per cent of homes with a mortgage were underwater (where the home value is lower than the mortgage amount owing) as of the second quarter of 2014. Though the continued recovery in the US labour market is expected to support housing sales and construction going forward, US realtors and homebuilders continue to face headwinds, such as shortages of skilled construction workers and ongoing weakness in household balance sheets.
US retail activity trended upward from January to October 2014, with gains in eight out of ten months. Overall, retail sales were up 3.9 per cent over this period compared to the first ten months of 2013. Retail spending has likely been supported by rising consumer confidence, which reached its highest level in seven years in October after increasing in five out of the six previous months. In particular, a notable increase in American consumers’ expectations in October is a good sign for US retail activity through the remainder of 2014.
Consensus Economics forecasters have increased their average US real GDP forecast for 2014 slightly since the first Quarterly Report. The November Consensus survey projects growth of 2.2 per cent for 2014, 0.1 percentage points higher than the August forecast. On the other hand, the outlook for US real GDP growth in 2015 was downgraded by 0.1 percentage point to 3.0 per cent from August to November.
Chart 2.8 US housing starts
200
600
1,000
1,400
1,800
2,200
2,600
Source: US Census Bureau
US housing starts (thousands, saar)
Jan 2006: 2,273
Sept 2014: 1,017
Apr 2009: 478
20102009 2012 2013 20142005 2006 2007 20082004 2011

Second Quarterly Report 2014/15
Economic Review and Outlook 35
Canada
Canadian real GDP advanced at an annualized rate of 2.3 per cent from January through June 2014 compared to the same period in 2013. In the January to March quarter, Canadian real GDP grew just 1.0 per cent quarter-on-quarter, with economic activity likely held back by adverse weather conditions. The national economy then rebounded somewhat with 3.6 per cent growth in the April to June quarter of 2014, led by double-digit gains in exports. However, recent indications of renewed weakness in the global economy (stemming largely from slower activity in Europe, China and Japan) suggest that growth in Canada’s exports and overall economy may moderate in the coming quarters.
Canada’s domestic economic activity has been moderate in 2014. Canada’s economy created an average of around 20,100 jobs per month year-to-date to October, increasing the level of employment by 0.7 per cent compared to the same period last year. The unemployment rate averaged 6.9 per cent so far this year, down 0.2 percentage points compared to the first ten months of 2013. Meanwhile, Canadian homebuilding has regained momentum after posting an annual decline in 2013, with housing starts increasing 1.4 per cent year-to-date to October 2014. National home sales and average home prices have increased year-to-date to October as well, with sales up 4.5 per cent (due in part to substantial gains observed in the April to June quarter of 2014) and prices increasing 7.0 per cent compared to the first ten months of 2013. Also domestically, retail sales saw a healthy gain of 4.7 per cent year-to-date to August compared to the first eight months of 2013. Going forward, some analysts anticipate that Canadian retail sales may be constrained by household debt loads and reduced equity returns.
Canadian merchandise exports grew by 11.1 per cent year-to-date to September relative to the same period of 2013. Notable gains during the first nine months of this year occurred in exports of energy products, consumer goods and motor vehicles and parts. These increases more than outweighed a minor year-to-date decline in exports of metal ores and non-metallic minerals. The value of manufacturing shipments in Canada also posted steady gains so far in 2014, up 5.6 per cent year-to-date to September compared to the same period of last year.
Chart 2.9 Consensus outlook for US up slightly since August
2.8 2.9 2.8 2.72.5
2.2
1.6
2.1 2.1 2.2 2.2
0.0
1.0
2.0
3.0
4.0
Jan Mar May July Sept Nov
Forecast annual per centchange in US real GDP, 2014
Source: Consensus EconomicsThe chart above represents forecasts for real GDP growth in 2014 as polled on specific dates. For example, forecasters surveyed on January 13, 2014 had an average 2014 US growth forecast of 2.8 per cent, while on November 10, 2014 they forecast 2014 US growth at 2.2 per cent.
2014

36 Economic Review and Outlook
Second Quarterly Report 2014/15
Since the first Quarterly Report, private sector economists have revised their average forecast up 0.1 percentage points for the Canadian economy in 2014, with the November Consensus expecting Canada’s real GDP to grow by 2.3 per cent. Meanwhile, Consensus forecasts for the Canadian economy in 2015 have been maintained since January at 2.5 per cent growth for next year.
Europe
After registering only 0.1 per cent growth in real GDP in the April to June quarter of 2014, early estimates out of the euro zone peg growth at just 0.2 per cent in the July to September quarter. Germany, Europe’s largest economy, continues to experience weak economic growth following a contraction in its real GDP in the April to June quarter. Furthermore, industrial production in the euro zone fell 0.4 per cent in the most recent quarter after posting zero growth the previous quarter, and the region’s unemployment rate remained at 11.5 per cent in September. Annual inflation in the euro area has been below one per cent for thirteen months through October (and registered just 0.4 per cent in October) and some analysts are concerned that there is a risk that the current very low inflation could turn into deflation. Also in October, a regulatory review of banks in the euro zone determined that 25 of the 130 largest banks in the region had insufficient capital, raising questions about the health of the European banking system.
According to Mario Draghi, President of the European Central Bank (ECB), risks facing the euro zone’s economic outlook remain tilted to the downside, given heightened geopolitical risks, recent weakening in the region’s growth momentum, and the potential for insufficient progress in structural reforms of some troubled member states. In light of this weakness, the ECB embarked on a new asset-backed securities and covered bond purchase program in October, with purchases expected to span at least two years. This new stimulus program is designed to return inflation toward the central bank’s target near 2.0 per cent, though some analysts believe that more action may be required.
Chart 2.10 Consensus maintains relatively steady forecasts for Canadian growth in 2014
2.2 2.2 2.2 2.2 2.3 2.2 2.2 2.2 2.3 2.3 2.3
0.0
1.0
2.0
3.0
4.0
Jan Mar May July Sept Nov
Forecast annual per centchange in Canadian real GDP, 2014
Source: Consensus EconomicsThe chart above represents forecasts for real GDP growth in 2014 as polled on specific dates. For example, forecasters surveyed on January 13, 2014 had an average 2014 Canadian real GDP growth forecast of 2.2 per cent, while on November 10, 2014 they forecast 2014 Canadian real GDP to grow by 2.3 per cent.
2014

Second Quarterly Report 2014/15
Economic Review and Outlook 37
Consensus forecasts for the euro zone economy have fallen in recent months, both for 2014 and for 2015. In its November publication, Consensus called for just 0.8 per cent growth in 2014 and 1.1 per cent the following year. Alongside these forecasts, Consensus analysts highlighted concerns about deflation and suggested that the ECB may embark on a full-scale quantitative easing program to combat the continuing economic stagnation in the euro zone.
China
Recent economic data out of China has been mixed. While exports beat expectations in October, annual inflation remained at its lowest rate since 2010 and year-over-year growth in retail sales slowed for a fifth consecutive month. In addition, China’s property market has cooled markedly this year which, along with the sign of slowing in the broader economy, has prompted officials to implement a series of small targeted stimulus measures throughout the year. Such measures include investments in infrastructure, expanded credit to private businesses and the injection of billions of dollars into the banking system to enhance liquidity.
Altogether, China’s economy grew 7.3 per cent in the July to September quarter of 2014 compared to the same period in 2013. This marks the slowest year-over-year growth of the Chinese economy since the beginning of 2009, during the height of the global financial crisis. Though economic growth is running below the Chinese government’s official target of 7.5 per cent, China’s Prime Minister Li Keqiang announced in September that the government would be comfortable with slower growth as long as job creation remains steady.
From August to November, the Consensus forecast for China’s real GDP growth held steady at 7.4 per cent for 2014, but decreased by 0.1 percentage points to 7.1 per cent for 2015. In the November publication, Consensus analysts stated that industrial overcapacity and moderation in the real estate sector are putting downward pressure on prices, and that China’s economic activity is showing softness at the beginning of the October to December quarter of 2014.
1.0 1.01.1
1.21.1 1.1 1.1
1.00.9
0.8 0.8
0.0
0.5
1.0
1.5
Jan Mar May July Sept Nov
Forecast annual per cent changein euro zone real GDP, 2014
Source: Consensus EconomicsThe chart above represents forecasts for real GDP growth in 2014 as polled on specific dates. For example, forecasters surveyed on January 13, 2014 had an average 2014 euro zone growth forecast of 1.0 per cent, while on November 10, 2014 they forecast euro zone growth of 0.8 per cent in 2014.
2014
Chart 2.11 Consensus forecast for euro zone downgraded in recent months

38 Economic Review and Outlook
Second Quarterly Report 2014/15
Financial markets
Interest rates
During its meeting in October, the Bank of Canada announced that it will continue to hold its target for the overnight rate at 1.00 per cent (where the rate has remained since September 2010). In its accompanying Monetary Policy Report, the Bank increased its forecast slightly for the Canadian economy in 2014, but downgraded its global outlook for 2015 and 2016. In a separate speech, Bank of Canada governor Stephen Poloz stated that the single largest headwind facing the global economic recovery is lingering uncertainty about the future due to geopolitical tensions, market volatility and legacy effects from the recent recession. To help counteract these headwinds, Mr. Poloz indicated that interest rates will remain low. Most private sector forecasters expect the Bank to postpone increasing interest rates until the second half of 2015.
As widely expected, the US Federal Reserve held its intended federal funds rate in the 0.00 to 0.25 per cent range at its most recent meeting in October, and announced the end of its asset purchase program. Despite the completion of the program, the Fed noted that it will maintain a large balance sheet by continuing to reinvest maturing securities. Furthermore, Federal Reserve policymakers stated that the federal funds rate will likely remain at its current highly accommodative level for a considerable amount of time. As with Canadian rates, most private sector analysts do not expect the Fed to raise rates until mid-2015 or later.
The average of private sector forecasters’ views on Canadian short-term interest rates (three-month Treasury bills) as of October 17, 2014 indicates that three-month rates will average 0.9 per cent in 2014 and 1.1 per cent in 2015. The same forecasters project ten-year Government of Canada bonds to average 2.3 per cent in 2014 and 2.9 per cent the following year.
Chart 2.12 Interest rates expected to remain low in the near-term
0
1
2
3
4
5 Per cent
Sources: Bank of Canada, US Federal Reserve and Private Sector Average as of October 17, 2014 (BMO, CIBC, IHS Global Insight, RBC, Scotiabank, and TD).
Bank of CanadaOvernight Target Rate
US Intended Federal Funds Rate
Forecast
1.35%
0.13%
1.00%
2008 2009 2010 2011 2012 2013 2014
0.85%
2015

Second Quarterly Report 2014/15
Economic Review and Outlook 39
Exchange rate
After beginning the year at 94.0 US cents, the Canadian dollar dropped to as low as 88.9 US cents in March, then rebounded back to 94.0 US cents in July. The loonie has softened again, registering at 88.4 US cents as of November 17, 2014. The depreciation of the Canadian dollar over the past few months continued a trend underway since 2012 when the dollar was near parity with its US counterpart. The gradual recovery of the US economy (and, more recently, falling prices for oil) has contributed to the depreciation of the Canadian dollar.
As of October 17, 2014, an average of six private sector forecasts calls for the Canadian dollar to average 91.1 US cents in 2014 and 88.4 per cent in 2015.
Table 2.3 Private Sector Exchange Rate ForecastsAverage annual exchange rate (US cents/Can $) 2014 2015
IHS Global Insight …………………………………………… 91.3 91.3CIBC ……………………..……………………………………… 91.6 87.1Bank of Montreal …………………………………………….… 91.0 88.0Scotiabank …………………………………………….……… 91.1 89.8TD Economics ………………………………………………… 91.0 88.6RBC Capital Markets ………………………………………… 90.6 85.8
Average (as of October 17, 2014) …………………… 91.1 88.4
Table 2.3 exchange rate 2014-11-14 4:43 PM
70
80
90
100
110
2008 2009 2010 2011
US cents/Canadian $ (noon rate)
Sources: Bank of Canada and BC Ministry of Finance forecasts.* Based on the average of Private Sector forecasts as of October 17, 2014 (BMO, CIBC, IHS Global Insight, RBC,
Scotiabank, and TD).
88.2¢
First Quarterly Report
2012 2013 2014
Private Sector Average*
(dotted line)
Forecast
89.1¢
2015
Chart 2.13 Private sector expects Canadian dollar below parity
Table 2.2 Private Sector Canadian Interest Rate Forecasts
Average annual interest rate (per cent) 2014 2015 2014 2015
IHS Global Insight …………………………… 0.9 1.1 2.4 3.2CIBC …………………………………………… 0.9 1.1 2.3 2.8Bank of Montreal ……………………………… 0.9 1.0 2.2 2.4Scotiabank …………………………………… 0.9 1.1 2.3 3.0TD Economics ………………………………… 0.9 1.1 2.3 2.8RBC Capital Markets ………………………… 0.9 1.4 2.3 3.0
Average (as of October 17, 2014) …… 0.9 1.1 2.3 2.9
3-month Treasury Bill 10-year Government Bond
Table 2.2 interest rates (3mo,10yr) 11/17/2014 9:57 AM

40 Economic Review and Outlook
Second Quarterly Report 2014/15
Real GDP
Annual growth in BC’s real GDP from 2010 to 2013 is illustrated in Chart 2. The latest data incorporate historical revisions to real GDP back to 2011, which result in a significant increase in the estimated growth of BC’s economy in 2012, from 1.5 per cent to 2.4 per cent. The data now reveal that growth in BC’s economy has slowed each year since 2010.
Nominal GDP
Chart 3 depicts BC’s nominal GDP in recent years (in levels). Nominal GDP increased by $7.1 billion (or 3.2 per cent) in 2013, after growing by $5.1 billion (or 2.3 per cent) the previous year. Statistics Canada’s latest release also incorporated historical revisions to nominal GDP, with a notable upward revision in 2011 nominal GDP from $215.1 billion (an increase of 4.4 per cent over the 2010 level) to $217.5 billion (an annual increase of 5.6 per cent).
Provincial Economic Accounts Update
Statistics Canada released its estimates of provincial GDP for 2013 on November 5, 2014.
British Columbia’s real GDP increased by 1.9 per cent in 2013, following a gain of 2.4 per cent the previous year. BC registered the sixth strongest growth rate among provinces last year, behind Newfoundland and Labrador (7.2 per cent), Saskatchewan (5.0 per cent), Alberta (3.8 per cent), Manitoba (2.2 per cent) and Prince Edward Island (2.0 per cent). Overall, the Canadian economy grew by 2.0 per cent in 2013.
BC’s main real GDP expenditure categories all experienced positive growth in 2013, with the exception of gross fixed capital formation, which fell by 1.2 per cent on the year following an increase of 8.1 per cent the year before. Household final consumption expenditures advanced by 2.5 per cent in 2013 after increasing 2.1 per cent in 2012, while government spending (federal, provincial, local and Aboriginal) registered a 0.6 per cent gain on the year following growth of 1.8 per cent in 2012. The pace of growth also slowed for imports of goods and services, which increased by just 0.8 per cent in 2013 following a gain of 3.9 per cent the previous year. Meanwhile, exports of goods and services advanced 2.5 per cent last year after increasing 1.0 per cent in 2012.
-0.5
0.31.0
1.31.9 2.0 2.2
3.8
5.0
7.2
-1.0
0.0
1.0
2.0
3.0
4.0
5.0
6.0
7.0
8.0
NB NS QC ON BC PE MB AB SK NL
Annual per cent change in 2013 real GDP
Source: Statistics Canada
Canada 2.0
Chart 1 – Real GDP in Canadian provinces
206.0
217.5222.6
229.7
140
160
180
200
220
240
2010 2011 2012 2013
BC nominal GDP, $ billions
Source: Statistics Canada
Chart 3 – BC nominal GDP
3.32.8
2.41.9
-4
-3
-2
-1
0
1
2
3
4
2010 2011 2012 2013
BC annual per cent change in real GDP
Source: Statistics Canada
Chart 2 – BC real GDP

