sec 17-a december 31, 2013
DESCRIPTION
FSTRANSCRIPT

0 0 0 0 0 1 6 3 4 2
SEC Registration Number
S M I N V E S T M E N T S C O R P O R A T I O N A N D S U
D B S I D I A R I E S
(Company’s Full Name)
1 0 t h F l o o r , O n e E - C o m C e n t e r , H a r b
o r D r i v e , M a l l o f A s i a C o m p l e x , C
B P - I A , P a s a y C i t y 1 3 0 0
(Business Address: No. Street City/Town/Province)
Jose T. Sio 857-0105 (Contact Person) (Company Telephone Number)
1 2 3 1 1 7 - A 0 4 3 0
Month Day (Form Type) Month Day (Fiscal Year) (Annual Meeting)
(Secondary License Type, If Applicable)
Dept. Requiring this Doc. Amended Articles Number/Section
Total Amount of Borrowings
Total No. of Stockholders Domestic Foreign
To be accomplished by SEC Personnel concerned
File Number LCU
Document ID Cashier
S T A M P S
Remarks: Please use BLACK ink for scanning purposes.
SEC Number 016342
SM INVESTMENTS CORPORATION (Company’s Full Name)
10th Floor, OneE-Com Center, Harbor Drive,
Mall of Asia Complex, CBP-1A Pasay City, 1300
(Company’s Address)
857-0100
(Telephone Number)
December 31
(Year Ending)
(month & day)
SEC Form 17-A
Annual Report
Form Type
Amendment Designation (If applicable)
December 31, 2013
Period Ended Date
(Secondary License Type and File Number)

SECURITIES AND EXCHANGE COMMISSION
SEC FORM 17-A, AS AMENDED
ANNUAL REPORT PURSUANT TO SECTION 17 OF THE SECURITIES REGULATION CODE AND SECTION 141
OF THE CORPORATION CODE OF THE PHILIPPINES 1. For the fiscal year ended December 31, 2013 2. SEC Identification Number 0000016342 3. BIR Tax Identification No. 169-020-000 4. Exact name of registrant as specified in its charter SM INVESTMENTS CORPORATION 5. PHILIPPINES 6. (SEC Use Only) Province, Country or other jurisdiction of
incorporation or organization Industry Classification Code:
7. 10
th Floor, OneE-Com Center, Harbor Drive, Mall of Asia
Complex, CBP-1A, Pasay City 1300 Address of principal office Postal Code 8. (632) 857-0100 / fax (632) 857-0132 Registrant's telephone number, including area code 9. ________________________________________________________________ Former name, former address, and former fiscal year, if changed since last report. 10. Securities registered pursuant to Sections 4 and 8 of the RSA
Title of Each Class
Number of Shares of Common Stock Outstanding and Amount of Debt Outstanding
COMMON SHARES, P 10 PAR VALUE
796,272,268
11. Are any or all of these securities listed on a Stock Exchange. Yes [X] No [ ] If yes, state the name of such stock exchange and the classes of securities listed therein: Philippine Stock Exchange, 796,272,268, P10 par value, common shares 12. Check whether the registrant: (a) has filed all reports required to be filed by Section 17 of the SRC and SRC Rule 17.1
thereunder or Section 11 of the RSA and RSA Rule 11(a)-1 thereunder and Sections 26 and 141 of The Corporation Code of the Philippines during the preceding 12 months (or for such shorter period that the registrant was required to file such reports);
Yes [X] No [ ] (b) has been subject to such filing requirements for the past 90 days. Yes [ ] No [X] 13. Aggregate market value of the voting stock held by non-affiliates: P248,112,994,464 as of December 31, 2013.

TABLE OF CONTENTS
Page No.
PART I - BUSINESS AND GENERAL INFORMATION Item 1. Business 1 Item 2. Properties 10 Item 3. Legal Proceedings 10 Item 4. Submission of Matters to a Vote of Security Holders 10 PART II - OPERATIONAL AND FINANCIAL INFORMATION Item 5. Market for Registrant’s Common Equity and Related Stockholder Matters 11 Item 6. Management’s Discussion and Analysis or Plan of Operation 14 Item 7. Financial Statements 38 Item 8. Changes in and Disagreements With Accountants and Financial Disclosure 38 PART III - CONTROL AND COMPENSATION INFORMATION Item 9. Directors and Executive Officers of the Registrant 39 Item 10. Executive Compensation 46 Item 11. Security Ownership of Certain Beneficial Owners and Management 47 Item 12. Certain Relationships and Related Transactions 48 PART IV – CORPORATE GOVERNANCE Item 13. Corporate Governance 48 PART V - EXHIBITS AND SCHEDULES Item 14. a. Exhibits 50 b. Reports on SEC Form 17-C (Current Report) 50 INDEX TO EXHIBITS 51 INDEX TO FINANCIAL STATEMENTS AND SUPPLEMENTARY SCHEDULES 53 SIGNATURES 143

PART I - BUSINESS AND GENERAL INFORMATION ITEM 1. Business Business Development SM Investments Corporation (SMIC), is the holding company of the SM Group of Companies.
For management purposes, the Group is organized into business units based on their products and
services. As a result of the Property Group corporate restructuring in 2013, the Group changed the
presentation of its segment information and has identified three reportable operating segments as
follows: property, retail, and financial services and others.
The property segment is involved in mall, residential, commercial, hotels and convention centers and
leisure and resorts operations. The mall segment develops, conducts, operates and maintains the
business of modern commercial shopping centers and all businesses related thereto such as the
conduct, operation and maintenance of shopping center spaces for rent, amusement centers, or
cinema theaters within the compound of the shopping centers. Residential and commercial segments
are involved in the development and transformation of major residential, commercial, entertainment
and tourism districts through sustained capital investments in buildings and infrastructure. The
hotels and convention centers and leisure and resorts segments engage in and carry on the business of
hotel and resort and operates and maintains any and all services and facilities incident thereto.
SMIC was incorporated in the Philippines on 15 January 1960 with its registered office at 10th Floor,
OneE-com Center, Harbor Drive, Mall of Asia Complex, Pasay City, Philippines.
The contribution of each of the business segments to the December 31, 2013 consolidated revenues and net income of SMIC are as follows:
Revenue
Net Income Revenue

- 2 -
Business of Issuer
Retail
Formerly called SM Department Stores, “The SM Store”, signifies the business’ commitment to
being the fashion store for all amid rapidly changing fashion trends, highly competitive local and
global labels and increased purchasing power. In line with its rebranding, the business continues to
roll out new store designs and lay-outs to accommodate more brands and deliver an enhanced
shopping experience. An institution that has become part of the lives of many Filipinos, it serves
millions of customers through its 48 stores across the country.
These forty-eight stores are strategically located in Metro Manila and key provincial cities, making it
possible for the SM brand to be available to a wide customer base. Five stores, Makati, Cubao,
Quiapo, Harrison, and Delgado, are standalone stores while the forty-three stores are based inside the
SM Supermalls.
In 2013, two new stores were opened in Aura, Taguig and BF, Parañaque. These new stores
contributed an additional 12,540 sqm, bringing the total store area of the forty-eight stores to 437,804
sqm.
In spite of the expansion of established Department Store chains as well as the entry of foreign
brands, the SM Store has maintained its market leadership in the Department store format. This can
be attributed to product innovations, new brand entries, and the growth of in-house brands that make
the offerings of the store unique to competition. Moreover, innovative store designs and improved
customer service and amenities ensure that “The SM Store” is a cut above the rest of the retailers in
the country. These improvements in the brand mix of The SM Store have garnered recognition from
local and international associations. Testament to this is the Best of the Best Award from Retail Asia
for the past five consecutive years, and the elevation of The SM Store as a Hall of Fame Awardee.
SM Supermarkets, SaveMore and SM Hypermarkets currently has thirty nine (39) supermarkets,
ninety three (93) savemore stores and thirty nine (39) hypermarkets.
In 2013, two (2) supermarkets were opened in Aura, Taguig and BF Parañaque.
In 2013, fifteen (15) savemore branches were opened in Zabarte Town Center, Caloocan City; Bajada
Plaza, Davao City; ARDI Cainta Rizal; TM Centerpoint, San Jose Bulacan; Acacia Estate, Taguig
City; Project 8, Quezon City; Sta. Marai, Ilocos Sur; ARCC Bacoor City; Pili CamSur; San
Ildefonso, Bulacan; Marulas, Valenzuela City; Free Choice, Pasig City; Star J, Malabon City;
Lumina Plus, Imus; and Meridian, Tagaytay.
In 2013, two (2) hypermarkets were opened. These were in Jazz Residences and FTI, Taguig.
The total stores area of the 171 stores is 923,539 sqm.
For 2014, the retail food group plans to open another 19 stores. Expansion plans for 2014 include the
opening of one supermarket, fifteen savemore branches and three hypermarkets.
- 3 -
Waltermart Supermarket, Inc. (WSI), a corporation mainly engaged in the business of
supermarket retailing, was registered with the SEC in January 1994.
It opened two stores in 2012 and another two stores in 2013 bringing the total number of stores to
twenty-two as of the end of the year. It plans to grow its store network by at least one to two stores
annually.
In January 2013, WSI entered into a joint venture with SM Retail Inc., a company incorporated and
domiciled in the Philippines. SM Retail owns 51% in WSI’s issued share capital.
WSI’s revenues in 2013 for the twenty two stores amounted to P10.7 billion.
For the year ended December 31, 2013, WSI’s issued share capital amounted to P380 million, with
380,000,000 authorized, subscribed and paid up shares at a par value of P1.00 per share.
Property
SM Prime Holdings, Inc. (“SM Prime”), is the country’s leading shopping mall developer and
operator. In 2013, the Sy family initiated a corporate restructuring exercise to consolidate all of the
SM Group’s real estate subsidiaries and real estate assets under SM Prime. The reorganization was
approved by the Board of Directors of SM Prime on May 31, 2013. The reorganization was achieved
through (1) SM Land’s tender offers for SMDC and HPI, (2) Merger of SM Prime and SM Land,
and (3) Acquisition of Unlisted Real Estate Companies and Assets from SMIC and the Sy Family.
SM Prime’s mall business unit has forty eight shopping malls in the Philippines with 6.2 million
square meters of gross floor area and five shopping malls in China with 0.8 million square meters of
gross floor area. For the rest of 2014, the mall business unit will open three new malls, located in
Cauayan and Angono in the Philippines and Zibo in China, as well as expansion of four existing
malls. By end 2014, the mall business unit will have an estimated 7.5 million square meters of gross
floor area.
SM Development Corporation (“SM Development or SMDC”), was incorporated in the Philippines
in 1974 under the name Ayala Fund, Inc, a publicly-listed closed-end investment company. After the
SM Group obtained majority shareholdings in March 1986, it was renamed SM Fund, Inc. and
continued to provide an avenue for investment in diverse businesses in the Philippines with the aim
of maximizing dividend income and capital appreciation.
In May 1996, SM Fund, Inc. was renamed SM Development Corporation to reflect its new business
thrust of property development, whose primary objective is to pursue opportunities in the real estate
industry. In line with this, its business proposition was directed toward tapping the residential
property market near/beside SM shopping malls. Meanwhile, the business of securities investment is
retained to provide a regular flow of earnings in the form of interest and dividend income.
SMDC has a current portfolio of 21 residential projects, 20 of which are in Metro Manila and one in
Tagaytay City in the Province of Cavite. In 2011, SMDC launched Mezza II Residences in Quezon
City, Green Residences in Manila, Shell Residences in Pasay City and Shine Residences in Pasig
City. In 2012, SMDC introduced in the real estate market Breeze Residences in Pasay City and
Grace Residences in Taguig City. In 2013, SMDC offered two (2) new projects such as Shore
Residences in Mall of Asia Complex, Pasay City and Trees Residences, near SM Fairview in Quezon
City. During the year, SMDC also made expansions of its existing four (4) projects namely: Grass
Residences Phase 2 Building 4, Wind Residences Tower 5, Grace Residences Tower 3 and Field

- 4 -
Residences Building 4. For 2014, SMDC plans to launch about 10,600 units spread over five new
and expansion projects.
Highlands Prime, Inc (“HPI”) used to be a publicly listed high-end property development company
majority owned by the SM Group. With the Property Group Restructuring in 2013, HPI has been
delisted from the Philippine Stock Exchange. HPI develops and sells residential properties located at
a private and exclusive mountainside resort called Tagaytay Highlands. Tagaytay Highlands is in
Tagaytay City, an hour and a half drive from the Makati Central Business District. It is a popular
weekend destination for upscale Manila residents due to its proximity, cool climate and incomparable
views of Taal Lake, Laguna de Bay and the mountains of Batangas and Laguna.
HPI’s assets are comprised primarily of undeveloped land in the Tagaytay Highlands and Tagaytay
Midlands resort complex. HPI has completed six projects, to date - The Woodridge at Tagaytay
Highlands, Horizon, Phase I of the Woodridge Place, The Hillside, Pueblo Real and Sierra Lago.
The Woodridge and The Woodridge Place Phase I are fully sold.
The Company has three projects under construction namely: The Woodridge Place II, Woodlands
Point and Aspenhills. Woodridge Place II is a condominium project in Tagaytay Highlands, which
boasts of magnificent views of Laguna de Bay, Fairways and Mt. Makiling and was formally
introduced to the market in May 2010. This project consists of two mid-rise buildings with 177
condominium residential units. The first building, Mahogany, is slated for completion this December
2014. Woodlands Point, located at the Highlands, is a highly exclusive enclave designed to house 60
Log Cabins, 24 of which are already completed. Aspenhills is a 29.7-hectare lot development located
at the Highlands enclave of the Tagaytay Highlands. Construction of the Aspenhills project is on-
going and will be completed and ready for turnover by 4Q-2014.
Costa del Hamilo, Inc. (“CDHI”) was incorporated in the Philippines and registered with the SEC
on September 26, 2006 with the primary purpose of acquiring, developing and selling real estate and
investment in various securities. CDHI is the developer of Pico de Loro Cove, the first residential
community within Hamilo Coast, a master planned Coastal Resort Township development in
Nasugbu Batangas encompassing 13 coves and 31 kilometres of coastline.
Pico de Loro Cove is located in a lush 40-hectare valley, bound by rolling mountains and a protected
cove that contains a 1.5 kilometres white sand swimming beach. Currently, Pico de Loro Cove offers
residential condominium units, membership in an exclusive Beach & Country Club as well as a hotel.
The Beach Club was completed and opened in 2009, while the Country Club was completed in June
2010, providing members with the complete club experience together with attendant facilities and
amenities. Most recreational activities are outdoor and nature-based owing to the rich natural
environment, such as kayaking, snorkeling, mountain biking, hiking, and others.
The residential clusters of Jacana, Myna, Miranda and Carola were completed from January 2010 to
August 2012. The ferry terminal at Hamilo Coast’s Papaya Cove was completed by May 2011. The
150 room Pico Sands Hotel was operational in the 2nd
quarter of 2011.
Prime Metroestate Inc. (formerly Pilipinas Makro, Inc.) was incorporated on June 1, 1995. On
December 14, 2012, the company changed its corporate name to Prime Metroestate Inc. as the
Trademark License Agreement for the use of “Makro” was terminated on January 1, 2013.

- 5 -
The company likewise changed the concentration of its business operations from wholesale/ retail of
food and non-food articles to leasing. The company is now engaged in the acquiring of properties to
the extent permitted by law including but not limited to real estate, to exercise all rights, powers and
privileges of ownership including the right to receive, collect, dispose, and hold the properties for
lease.
Other real estate projects include the development of the Mall of Asia Complex in Pasay City. It
houses the SM Mall of Asia, which is the country’s biggest and most ambitious mall project opened
to the public; the SMX Convention Center, which serves as a venue for major conferences, trade
exhibitions and shows in Metro Manila; the One and Two E-Com Centres, which are specifically
designed for the use of contact center, customer relationship management, business process
outsourcing (BPO), and other specialized companies; the SM Corporate Offices; the OneEsplanade;
the San Miguel by the Bay and the SM Arena, which is a five-storey, first-class multipurpose venue
for sporting events, concerts, entertainment shows, and other similar events with a seating capacity of
approximately 16,000. The other on-going development is the Three E-com Center, a 15-storey
building with gross floor area of approximately 145,000 square meters, with projected completion
date by year-end of 2014.
SM Hotels and Conventions Corp., formerly SM Hotels Corp., was incorporated in April 2008
with the primary purpose of developing and managing the various hotel and convention properties of
the SM group. The SMHCC portfolio is composed of four hotels and over 32,000 sqm of leasable
convention space. SMHCC is guided by its mission to be the leading hotels and conventions
company and its vision to build and operate hotels and convention center that take pride in Filipino
warmth and hospitality. SMHCC endeavors to meet global standards of consistent, excellent service
that create memorable experiences.
In 2009, Taal Vista Hotel’s newly constructed east wing with 133 guest rooms (making it a total of
261 rooms) and a 1,000-seater ballroom became fully operational. SMX, located at Mall of Asia
Complex with its state of the art convention and exhibition facilities, continues to host major internal
and local conventions and exhibitions. It is a three-storey structure with a gross floor area of 46,647
square metres made up of two large exhibit floors which can be divided into multiple exhibition and
function halls.
In the last quarter of 2010, SM Hotels launched the 400-room Radisson Blu Hotel in Cebu, the first
hotel managed by Carlson International in Asia-Pacific region to be classified under its “Blu”
upscale hotel brand category. The property has been classified as a deluxe hotel category by the
Department of Tourism and its facilities include an in-house spa, fitness center, business center, 800-
square meter swimming pool, club lounge, two ballrooms and a number of smaller meeting rooms. It
is strategically located beside SM City Cebu and is adjacent to the International Port Area.
In August of 2011, Pico Sands Hotel opened a 154 room resort-type hotel in Hamilo Coast in
Nasugbu, Batangas. The spacious rooms are equipped with modern facilities and captivating views
of lush mountains and tranquil lagoon. Pico Sands Hotel is located within Pico de Loro Cove, the
maiden community of Hamilo Coast, the premier seaside leisure development of Costa del Hamilo.
SM Hotels has developed and opened the Park Inn by Radisson Davao which is the very first “Park
Inn by Radisson” in Asia Pacific region. The Park Inn brand for hotels under Carlson Rezidor and is
the largest mid-market brand for hotels under development in Europe. Park Inn by Radisson Davao
hotel project has 204 rooms located in Lanang, Davao City. The hotel started its commercial
operations in March 2013.
- 6 -
SM Hotels also signed with Carlson Rezidor for the second Park Inn by Radisson which is located
adjacent to the SM Mall in Clark. This hotel should break ground in May 2014 and is scheduled to
open in the last quarter of 2014 with 150 rooms.
In 2012, SMX Manila, entered into an agreement with SM Prime to manage its SMX Convention
Center in Lanang Davao which opened in 2012. This is in addition to the properties managed by
SMX Manila namely, Mega Trade Hall and Cebu Trade Hall. Also SMX Manila manages the
newly opened SMX Aura Premier (SM Aura) in Taguig.
In March 2013, SMHCC together with Hilton Worldwide signed an agreement to manage the first
Conrad Hotel in the Philippines. The 347-room Conrad Hotel Manila will be located within the
Mall of Asia complex with stunning views of the famed Manila Bay. The eight-storey hotel will
incorporate two levels of retail and entertainment facilities on the ground floor. It will also have
other hotel facilities as well as a 1,446 sqm ballroom and other function and meeting spaces. Conrad
Hotel Manila is scheduled for completion in the last quarter of 2015.
Financial Services
BDO Unibank, Inc. (“BDO”), is a full-service universal bank in the Philippines. It is the product of
a merger heralded as unprecedented in size and scale in the Philippine banking industry. BDO today
represents a firm consolidation of distinct strengths and advantages built over the years by the
entities behind its history. BDO is an institution that honors its past, continues to improve on its
present, and moves towards the future with confidence and strength.
BDO has the ability to provide a complete array of industry-leading products and services including
Lending (corporate, middle market, SME, and consumer), Deposit-taking, Foreign Exchange,
Brokering, Trust and Investments, Credit Cards, Corporate Cash Management and Remittances in the
Philippines. Through its local subsidiaries, the Bank offers Leasing and Financing, Investment
Banking, Private Banking, Bancassurance, Insurance Brokerage and Stock Brokerage services.
BDO’s institutional strengths and value-added products and services hold the key to its successful
business relationships with customers. On the front line, its branches remain at the forefront of
setting high standards as a sales and service-oriented, customer-focused force. BDO has one of the
largest distribution networks, with more than 800 operating branches and over 2,200 ATMs
nationwide.
Through selective acquisitions and organic growth, BDO has positioned itself for increased balance
sheet strength and continuing expansion into new markets. As of 30 December 2013, BDO is the
country’s largest bank in terms of total resources, capital, customer loans, total deposits, and assets
under management.
The China Banking Corporation (China Bank), was incorporated on July 20, 1920 and commenced
business on August 16 of the same year as the first privately owned local commercial bank in the
Philippines. It resumed operations after World War II on July 23, 1945 and played a key role in the
post-war reconstruction and economic recovery by providing financial support to businesses and
entrepreneurs. China Bank CHIB was listed by 1947 on the local stock exchange and acquired its
universal banking license in 1991. The Bank started by catering mainly to the Chinese-Filipino
commercial sector, but has since expanded its market scope to include the retail and consumer
segments. Its core banking franchise stems mainly from its 93-year history in the Philippines, a factor
that has enabled it to become deeply entrenched within the socioeconomic fabric of the Chinese-
Filipino community. The Bank's market comprises the corporate, commercial and consumer markets.

- 7 -
It provides a wide range of domestic and international banking services, and is one of the largest
commercial banks in the country in terms of assets and capital.
China Bank offers a wide range of financial products and services through its network of 367
branches (including 72 branches of China Bank Savings) as of Dec 2013. Complementing this branch
network are convenient and secure electronic banking channels for day & night banking service –
China Bank TellerCard ATM, China Bank Online (mobile and internet banking), and China Bank
TellerPhone (phone banking).
China Banking Corporation (China Bank) won the Bell Awards for Corporate Governance for the
second consecutive year. The Bell Awards was established by the Philippine Stock Exchange (PSE)
to recognize publicly listed companies and trading participants for adhering to high standards of
corporate governance. For the second year in a row, China Bank is the only bank among the top five
awardees in the publicly-listed company category.
The Monetary Board of the Bangko Sentral ng Pilipinas (BSP) approved on November 21, 2013 the
merger between China Bank Savings, Inc. (CBS) and Pampanga-based rural lender Unity Bank, with
CBS as the surviving bank. Exactly a year ago, BSP approved China Bank’s acquisition of 99.95% of
Unity Bank’s outstanding subscribed capital stock.
2013 also paved way for the signing of Memorandum of Agreement (MOA) for Planters
Development Bank (Plantersbank) and China Bank which calls for the purchase by China Bank of
more than two-thirds of Plantersbank’s shares, subject to approval of the bank’s shareholders and
regulatory bodies. The Plantersbank deal bolsters China Bank’s current strategy in two areas –
growing its middle market/SME portfolio and its network expansion program. China Bank is in the
midst of the most rapid expansion in its history
In addition, Fitch Ratings affirmed its national rating of AA- which is one notch below the top bank
rating in the country. Capital Intelligence rating agency also affirmed its credit rating on China Bank
(Financial Strength BBB-) and recently upgraded its Foreign Currency Long-Term rating to BBB-
from BB+ following the upgrade in the Philippines’ sovereign rating.
For 2014, the Bank will continue to build up its core businesses: corporate, consumer, middle market
and, SMEs. The Bank aims to tap the synergy with the Bank’s holding company (the SM Group),
affiliates such as Manulife as well their suppliers & retailers as means of expanding its share of the
consumer & commercial sectors. The Bank will build a competitive Treasury organization by
diversifying its investment portfolio to include triple A corporate issues and increase the velocity of
securities trading. The growth in existing fee-based revenues would be augmented by diversifying the
sources of its revenue streams and client base. CBC’s credit card business will be launched during
third quarter of 2014 and would not only broaden revenue sources for the Bank but serve as a
strategic tool for better customer engagement. Credit cards are expected to build greater loyalty
among customers and accelerate the customer acquisition effort through the Bank’s subsidiaries
(CBC, Manulife, among others) and the SM Group.
The merger between Unity Bank and CBSI and the recent acquisition of Planters Development Bank
(PDB), a SME bank with 78 branches, enabled the Bank to meet its target of 400 branches, earlier
than 2014. The China Bank Group (China Bank, CBS, Unity Bank and PDB) ended 2013 with 447
branches (295 branches for the main bank, 72 for CBS and 80 for PDB). This rapid branch
expansion will be the impetus to acquire new customers, increase client relationships and strengthen
the distribution capacity of the branches – to cross sell various products within a total relationship
framework. The branch network will be the main platform for delivering financial products and
services to the commercial and consumer segments. Electronic channels such as ATMs, kiosk, online
and mobile banking will be upgraded for more efficient distribution of banking services to our retail
and consumer clients.

- 8 -
Building a stronger and more responsive organization is a prerequisite for achieving the Bank’s
corporate goals. To strengthen the bank’s organizational capability, it will implement tighter
accountability and performance monitoring, centralization of support and achieve industry best
Turnaround Time (TAT) in key customer processes. The upgrading of the core banking system is the
centerpiece of CBC’s 3-year technology plans. The Bank will focus on the integration of various
products and channel systems to provide customers with an enhanced service level on 24x7 basis,
multi-channel banking and straight-through processing via technology-driven channels. It will also
continue to upgrade its technology platforms – Core Banking system, ATM Switch, Credit Card /
Debit Card system, Treasury, ALM systems, Data Warehouse, CRM systems – to be able to serve its
customers with satisfaction while delivering superior returns to its stakeholders.
Others
Belle Corporation ("Belle") was incorporated in 1973 as Belle Mining and Oil Exploration,
Incorporated (“Belle Resources”) and, in 1976, was listed on the Philippine Stock Exchange. In
1989, Belle Resources developed a golf club named Tagaytay Highlands International Golf Club,
Incorporated (“Tagaytay Highlands”), which became its initial foray into the property development
sector. In 1994, Belle Resources changed its name to Belle Corporation to underscore the shift in its
principal activity of real estate development. Belle mainly develops property within the Tagaytay
Highlands, Midlands and Greenlands complex (“Complex”), a 1,280-hectare property that provides
excellent views of Taal lake, Laguna de Bay and the towering mountains of Batangas and Laguna.
The Complex is located less than 90 minutes south of Makati City in Tagaytay City and adjoining
areas in Batangas province.
Since 1989, Belle has launched a total of 19 real estate projects, two golf clubs and one country club,
with total gross land area of approximately 600 hectares in Tagaytay City and Batangas.
In 2009, the Belle entered into a Memorandum of Agreement with SM Commerical Properties and its
related companies, for Belle’s acquisition of all the outstanding capital stock of Premium Leisure &
Amusement, Inc. (“PLAI”). PLAI and its consortium members were granted a license by the
Philippine Amusement and Gaming Corporation, to develop and operate an integrated resort
complex. This marked the Company’s strategic entry into the integrated resort industry. The
construction of the Belle Grande Manila Bay integrated resort (“Belle Grande”) began in January
2010 and is currently in full swing. Belle Grande is being constructed on 6.2-hectares of prime land
at the corner of Roxas Boulevard and Aseana Avenue in Parañaque City. In 2012, Belle and PLAI
entered into a Cooperation Agreement with Melco Crown Entertainment Limited (”MCE”) of Hong
Kong for a collaborative partnership in the development and operation of Belle Grande. MCE is a
developer and operator of resorts focused on the Macau market, with its flagship property therein
being the successful “City of Dreams” integrated resort complex. The Cooperation Agreement
places Belle as the licensee and owner of the site’s land and buildings, with MCE being the
developer and operator of all facilities within Belle Grande. Upon completion, envisioned in 2014,
the integrated resort is planned to have approximately 30 hectares of gross land area, and will house
approximately 2 hectares of gaming areas, more than 2 hectares of retail and restaurant facilities,
more than 900 hotel rooms of 5-star and 6-star quality and entertainment facilities. Belle Grande is
only about 1 kilometer away from the Mall of Asia complex.
- 9 -
Atlas Consolidated Mining & Development Corporation (“Atlas”) is a company primarily
engaged in metallic mineral exploration and mining. It operates the Toledo copper mine in the
province of Cebu (the “Toledo Copper Mine”) through its wholly-owned subsidiary Carmen Copper
Corporation (“Carmen Copper”).
The Toledo Copper Mine is one of the Philippines’ largest copper mines, thus making Carmen
Copper a principal producer and exporter of copper concentrate in the country. To optimize its
operations, and in line with the expansion of its beneficiation plant, Carmen Copper is pursuing the
development and commercial distribution of marketable by-products from its copper concentrate
processing such as molybdenum, magnetite, and pyrite.
Atlas Mining also has a stake in the nickel laterite mining project of Berong Nickel Corporation
(“Berong Nickel”) in Palawan. Berong Nickel has been engaged in the direct shipping of nickel
laterite ore since 2007.
The Net Group includes ten legal entities namely, 19-1 Property Holdings Inc., Crescent Park 19-1
Property Holdings Inc., 18-2 Property Holdings Inc., Crescent Park 18-2 Property Holdings Inc., 6-3
Property Holdings Inc., Crescent Park 6-3 Property Holdings Inc., 6-24 Property Holdings, Inc.,
Crescent Park 6-24 Property Holdings Inc., 14-678 Property Holdings Inc., and Crescent Park 14-678
Property Holdings, Inc. The portfolio assets are strategically located within the E-square Zone, the
largest and only PEZA certified IT park in Bonifacio Global City.
The Portfolio consists of prime Grade A Philippine Economic Zone Authority (PEZA) registered
office buildings and land. The gross lot areas is 13,300 square meters while the gross leasable area is
147,000 square meters more or less. The occupancy rate as of December 31, 2013 is at 100%. Its
tenants base includes top tier local and multinational companies. Competition The Company’s subsidiaries compete with other local companies in the industry segments in which
they operate. The Company believes that each of its subsidiaries has strong competitive advantages
over the other industry players. In addition, the strong synergy created by the complementing
businesses of the individual subsidiaries has further reinforced each subsidiary’s preparedness to face
stiff competition in the coming years. Suppliers
The Company and its subsidiaries have a broad range of suppliers, both local and foreign. Customers / Clients
The Company and its subsidiaries are not dependent on a single or a few customer / client base. The
group has a broad base of local and foreign, and corporate and individual customers / clients.
Transactions With and/or Dependence on Related Parties All transactions with related companies are done on market terms and arm’s length basis. See Note
22 (Related Party Transactions) of the Notes to the Consolidated Financial Statements.
- 10 -
Governmental regulations and environmental laws The Company and its subsidiaries meet all governmental, environment, health and safety requirements. The Company has not experienced significant governmental, environment, health or safety problems. Employees As of December 31, 2013, the Group had about 86,457 direct employees. The Parent Company had 270 regular employees as of the same period. The Parent Company employees are not subject to any Collective Bargaining Agreements (CBA). Risks SMIC and its subsidiaries are exposed to financial, operating, and administrative risks which are
normal in the course of the business, depending on the business industry segments where each of the
subsidiaries operate.
The Board of Directors of the Parent Company and its subsidiaries are assisted by their respective Audit and Risk Management Committees in overseeing the effectiveness of the Enterprise Risk Management System to mitigate, if not to eliminate these risks. The Audit and Risk Management Committee is likewise supported by the Parent Company’s external and internal auditors in its oversight role in managing these risks.
ITEM 2. Properties
The Company and its subsidiaries own and lease several tracts of land for shopping malls,
commercial, residential and other development.
Leased properties intended for future development have lease terms ranging from 15 to 50 years.
Some contracts provide for renewal options subject to mutual agreement of the parties. Rental rates
are based on prevailing market rental rates for the said properties. Please refer to Note 28 of the
accompanying Notes to the Consolidated Financial Statements for further details on Lease
agreements. Other real properties that the Company intends to acquire are still under review
depending on factors such as demographics and accessibility to public transport.
ITEM 3. Legal Proceedings
The Company and its subsidiaries are not involved in any discussion of legal proceedings.
ITEM 4. Submission of Matters to a Vote of Security Holders
There were no matters submitted to a vote of security holders during the fourth quarter of the
calendar year covered by this report.

- 11 -
PART II - OPERATIONAL AND FINANCIAL INFORMATION
ITEM 5. Market for Registrant’s Common Equity and Related Stockholder Matters
Market Information The Company’s shares of stock are traded in the Philippine Stock Exchange.
2013 2012
Stock Prices High Low High Low
1st Quarter P 892.0 P 720.0 P 692.0 P 559.0
2nd
Quarter 962.4 728.0 730.0 640.0
3rd Quarter 961.5 634.0 758.0 705.0
4th Quarter 863.0 695.0 900.5 728.0
As of February 28, 2014, the closing price of the Company’s shares of stock is P694/share.
Shareholder and Dividend Information
The number of shareholders of record of February 28, 2014 was 1,255. Capital stock issued and
outstanding as of February 28, 2014 was 796,272,268. As of December 31, 2013, there are no
restrictions that would limit the ability of the Company to pay dividends to the common stockholders,
except with respect to P108.3 billion, representing accumulated equity in net earnings of subsidiaries.
These earnings are not available for dividend distribution until such time that the Parent Company
receives the dividends from the subsidiaries.
On April 25, 2013, the BOD approved the declaration of cash dividends of 118.0% of the par value
or 11.80 per share for a total amount of P7,423.0 million in favor of stockholders on record as at May
24, 2013. This was paid on June 20, 2013.
On the same date, the BOD approved the declaration of 25% stock dividends in favor of stockholders
on record to be fixed by the Philippine SEC.
On June 24, 2013 and July 12, 2013, SEC approved the issuance of 157,000,000 and 629,986 shares
as stock dividends to stockholders on record as of July 8, 2013. The stock dividends were issued on
August 1, 2013.
On April 26, 2012, the Board of Directors approved the declaration of cash dividends of P10.4 per
share in favor of stockholders on record as of May 26, 2012 and paid on June 21, 2012.
The top 20 stockholders as of February 28, 2014 are as follows:
Name
No. of Shares Held
% to Total
1 PCD Nominee Corp. (Non-Filipino) 279,374,017 35.08%
2 Hans T. Sy 65,969,521 8.28%
3 Herbert T. Sy 65,960,450 8.28%
4 Harley T. Sy 58,528,292 7.35%
5 Henry T. Sy, Jr. 58,460,450 7.34%
6 Teresita T. Sy 57,085,450 7.17%
7 Elizabeth T. Sy 46,722,988 5.87%
8 PCD Nominee Corp. (Filipino) 46,022,368 5.78%
- 12 -
Name
No. of Shares Held
% to Total
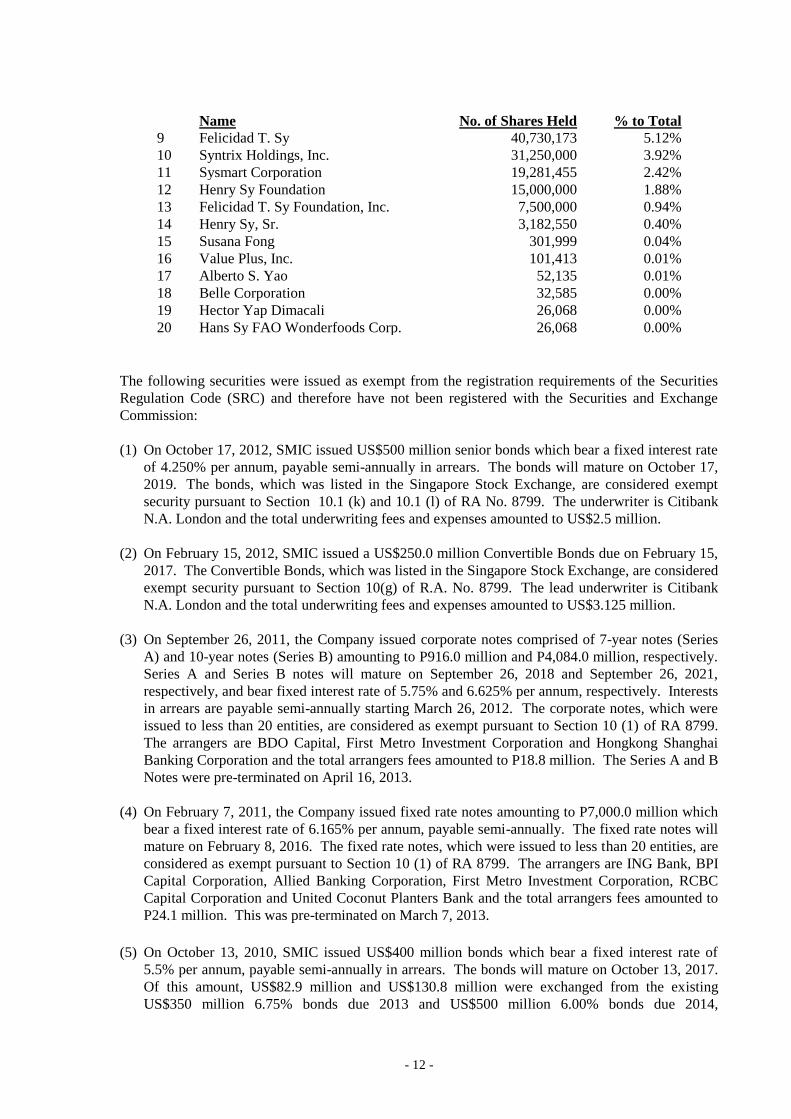
9 Felicidad T. Sy 40,730,173 5.12%
10 Syntrix Holdings, Inc. 31,250,000 3.92%
11 Sysmart Corporation 19,281,455 2.42%
12 Henry Sy Foundation 15,000,000 1.88%
13 Felicidad T. Sy Foundation, Inc. 7,500,000 0.94%
14 Henry Sy, Sr. 3,182,550 0.40%
15 Susana Fong 301,999 0.04%
16 Value Plus, Inc. 101,413 0.01%
17 Alberto S. Yao 52,135 0.01%
18 Belle Corporation 32,585 0.00%
19 Hector Yap Dimacali 26,068 0.00%
20 Hans Sy FAO Wonderfoods Corp. 26,068 0.00%
The following securities were issued as exempt from the registration requirements of the Securities
Regulation Code (SRC) and therefore have not been registered with the Securities and Exchange
Commission:
(1) On October 17, 2012, SMIC issued US$500 million senior bonds which bear a fixed interest rate
of 4.250% per annum, payable semi-annually in arrears. The bonds will mature on October 17,
2019. The bonds, which was listed in the Singapore Stock Exchange, are considered exempt
security pursuant to Section 10.1 (k) and 10.1 (l) of RA No. 8799. The underwriter is Citibank
N.A. London and the total underwriting fees and expenses amounted to US$2.5 million.
(2) On February 15, 2012, SMIC issued a US$250.0 million Convertible Bonds due on February 15,
2017. The Convertible Bonds, which was listed in the Singapore Stock Exchange, are considered
exempt security pursuant to Section 10(g) of R.A. No. 8799. The lead underwriter is Citibank
N.A. London and the total underwriting fees and expenses amounted to US$3.125 million.
(3) On September 26, 2011, the Company issued corporate notes comprised of 7-year notes (Series
A) and 10-year notes (Series B) amounting to P916.0 million and P4,084.0 million, respectively.
Series A and Series B notes will mature on September 26, 2018 and September 26, 2021,
respectively, and bear fixed interest rate of 5.75% and 6.625% per annum, respectively. Interests
in arrears are payable semi-annually starting March 26, 2012. The corporate notes, which were
issued to less than 20 entities, are considered as exempt pursuant to Section 10 (1) of RA 8799.
The arrangers are BDO Capital, First Metro Investment Corporation and Hongkong Shanghai
Banking Corporation and the total arrangers fees amounted to P18.8 million. The Series A and B
Notes were pre-terminated on April 16, 2013.
(4) On February 7, 2011, the Company issued fixed rate notes amounting to P7,000.0 million which
bear a fixed interest rate of 6.165% per annum, payable semi-annually. The fixed rate notes will
mature on February 8, 2016. The fixed rate notes, which were issued to less than 20 entities, are
considered as exempt pursuant to Section 10 (1) of RA 8799. The arrangers are ING Bank, BPI
Capital Corporation, Allied Banking Corporation, First Metro Investment Corporation, RCBC
Capital Corporation and United Coconut Planters Bank and the total arrangers fees amounted to
P24.1 million. This was pre-terminated on March 7, 2013.
(5) On October 13, 2010, SMIC issued US$400 million bonds which bear a fixed interest rate of
5.5% per annum, payable semi-annually in arrears. The bonds will mature on October 13, 2017.
Of this amount, US$82.9 million and US$130.8 million were exchanged from the existing
US$350 million 6.75% bonds due 2013 and US$500 million 6.00% bonds due 2014,
- 13 -
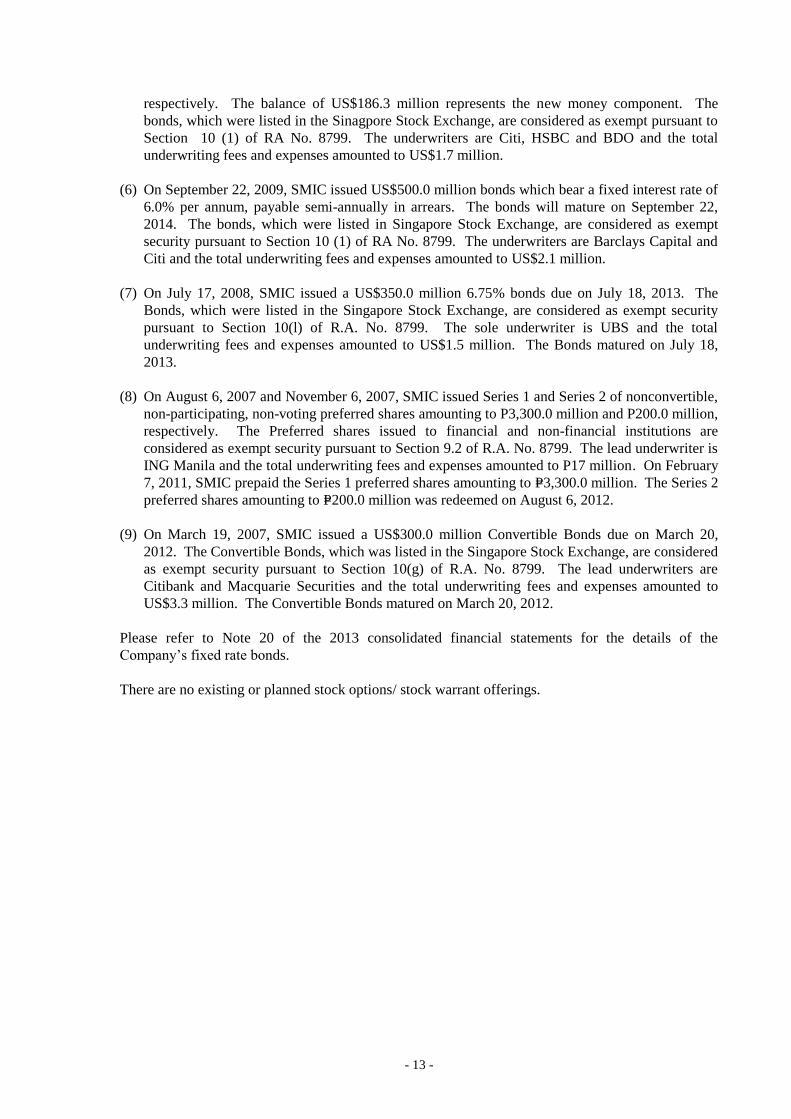
respectively. The balance of US$186.3 million represents the new money component. The
bonds, which were listed in the Sinagpore Stock Exchange, are considered as exempt pursuant to
Section 10 (1) of RA No. 8799. The underwriters are Citi, HSBC and BDO and the total
underwriting fees and expenses amounted to US$1.7 million.
(6) On September 22, 2009, SMIC issued US$500.0 million bonds which bear a fixed interest rate of
6.0% per annum, payable semi-annually in arrears. The bonds will mature on September 22,
2014. The bonds, which were listed in Singapore Stock Exchange, are considered as exempt
security pursuant to Section 10 (1) of RA No. 8799. The underwriters are Barclays Capital and
Citi and the total underwriting fees and expenses amounted to US$2.1 million.
(7) On July 17, 2008, SMIC issued a US$350.0 million 6.75% bonds due on July 18, 2013. The
Bonds, which were listed in the Singapore Stock Exchange, are considered as exempt security
pursuant to Section 10(l) of R.A. No. 8799. The sole underwriter is UBS and the total
underwriting fees and expenses amounted to US$1.5 million. The Bonds matured on July 18,
2013.
(8) On August 6, 2007 and November 6, 2007, SMIC issued Series 1 and Series 2 of nonconvertible,
non-participating, non-voting preferred shares amounting to P3,300.0 million and P200.0 million,
respectively. The Preferred shares issued to financial and non-financial institutions are
considered as exempt security pursuant to Section 9.2 of R.A. No. 8799. The lead underwriter is
ING Manila and the total underwriting fees and expenses amounted to P17 million. On February
7, 2011, SMIC prepaid the Series 1 preferred shares amounting to P=3,300.0 million. The Series 2
preferred shares amounting to P=200.0 million was redeemed on August 6, 2012.
(9) On March 19, 2007, SMIC issued a US$300.0 million Convertible Bonds due on March 20,
2012. The Convertible Bonds, which was listed in the Singapore Stock Exchange, are considered
as exempt security pursuant to Section 10(g) of R.A. No. 8799. The lead underwriters are
Citibank and Macquarie Securities and the total underwriting fees and expenses amounted to
US$3.3 million. The Convertible Bonds matured on March 20, 2012.
Please refer to Note 20 of the 2013 consolidated financial statements for the details of the
Company’s fixed rate bonds.
There are no existing or planned stock options/ stock warrant offerings.
- 14 -
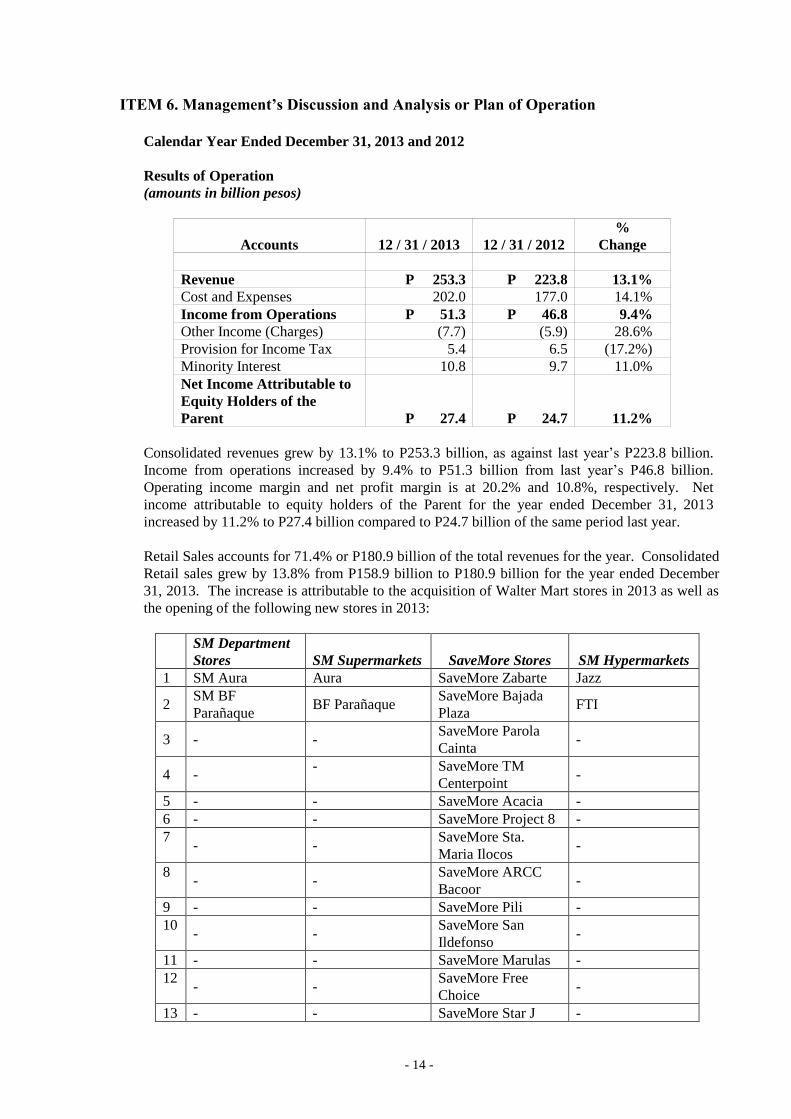
ITEM 6. Management’s Discussion and Analysis or Plan of Operation
Calendar Year Ended December 31, 2013 and 2012
Results of Operation
(amounts in billion pesos)
Accounts
12 / 31 / 2013
12 / 31 / 2012
%
Change
Revenue P 253.3 P 223.8 13.1%
Cost and Expenses 202.0 177.0 14.1%
Income from Operations P 51.3 P 46.8 9.4%
Other Income (Charges) (7.7) (5.9) 28.6%
Provision for Income Tax 5.4 6.5 (17.2%)
Minority Interest 10.8 9.7 11.0%
Net Income Attributable to
Equity Holders of the
Parent
P 27.4
P 24.7
11.2%
Consolidated revenues grew by 13.1% to P253.3 billion, as against last year’s P223.8 billion.
Income from operations increased by 9.4% to P51.3 billion from last year’s P46.8 billion.
Operating income margin and net profit margin is at 20.2% and 10.8%, respectively. Net
income attributable to equity holders of the Parent for the year ended December 31, 2013
increased by 11.2% to P27.4 billion compared to P24.7 billion of the same period last year.
Retail Sales accounts for 71.4% or P180.9 billion of the total revenues for the year. Consolidated
Retail sales grew by 13.8% from P158.9 billion to P180.9 billion for the year ended December
31, 2013. The increase is attributable to the acquisition of Walter Mart stores in 2013 as well as
the opening of the following new stores in 2013:
SM Department
Stores
SM Supermarkets
SaveMore Stores
SM Hypermarkets
1 SM Aura Aura SaveMore Zabarte Jazz
2 SM BF
Parañaque BF Parañaque
SaveMore Bajada
Plaza FTI
3 - - SaveMore Parola
Cainta -
4 - - SaveMore TM
Centerpoint -
5 - - SaveMore Acacia -
6 - - SaveMore Project 8 -
7 - -
SaveMore Sta.
Maria Ilocos -
8 - -
SaveMore ARCC
Bacoor -
9 - - SaveMore Pili -
10 - -
SaveMore San
Ildefonso -
11 - - SaveMore Marulas -
12 - -
SaveMore Free
Choice -
13 - - SaveMore Star J -

- 15 -
SM Department
Stores
SM Supermarkets
SaveMore Stores
SM Hypermarkets
14 - - SaveMore Lumina -
15 - - SaveMore Meridien -
Of the P180.9 billion and P158.9 billion retail sales in 2013 and 2012, respectively, the non-food
group and food group contributed 40.6% and 59.4%, respectively in 2013 and 43.8% and 56.2%,
respectively in 2012.
As of December 31, 2013, SM Investments’ retail subsidiaries have 241 stores. These consist of
48 department stores, 39 supermarkets, 93 SaveMore stores, 39 hypermarkets and 22 Walter Mart
supermarkets.
Real estate sales for the year ended December 31, 2013, derived mainly from SM Development
Corporation, amounted to P21.2 billion or a decrease of 5.6% compared to last year of P22.5
billion. The decrease in real estate sales is primarily due to lower sales take up of projects in
2013 compared to last year. This is attributable to project launches in 2010 and 2011 which were
more “blockbusters” namely, Shell, Green and Jazz compared to launches in 2012 of Breeze and
Grace. Projects launched in the last quarter of 2013, namely: Grass Phase 2, Shore and Trees are
expected to contribute significantly to revenues starting in 2014.
Rent revenue for the year ended December 31, 2013, derived mainly from mall operations of SM
Prime Holdings, Inc. (SM Prime), increased by 13.1% to P27.9 billion in 2013 from P24.7 billion
in 2012. SM Prime is the country’s leading shopping mall developer and operator which owns 48
malls in the Philippines with a total gross floor area of 6.2 million square meters and five malls in
China with a total gross floor area of 0.8 million square meters as of December 31, 2013. The
increase in rental revenues is primarily due to the full-year effect of new malls opened in 2012
namely SM City Olongapo, SM City Consolacion, SM City San Fernando, SM City General
Santos, SM Lanang Premier, and the opening in 2013 of SM Aura Premier. Excluding the new
malls and expansions, rental revenues grew 7.0%. The full year recognition of revenues from
TwoE-Com, which began operations in mid-2012 and is now 98% occupied, also helped push up
rental revenues from commercial operations.
For the year 2013, cinema ticket sales and amusement revenues increased by 2.5% to P4.9 billion
in 2013 from P4.8 billion in 2012 largely due to the opening of additional digital cinemas at the
new malls, opening of new amusement rides in SM by the Bay and the Sky Ranch in Tagaytay.
Amusement revenues is mainly composed of amusement income from rides, bowling and ice
skating operations including the SM Science Discovery Center and the SM Storyland.
Equity in net earnings of associates increased by 50.4% to P13.6 billion in 2013 from P9.0 billion
in 2012, primarily due to the 56% increase in net income of BDO to P22.6 billion, in an
environment marked by high system liquidity and volatility in the capital markets. BDO’s
primary commercial banking businesses continued its robust growth with net interest income
leading the way with a 20% rise, customer loans expanding 19% and an upsurge of 44% on total
deposits led by steady growth in low-cost deposits as well as the inflow of maturing Special
Deposit Accounts (SDA) funds from the Bangko Sentral ng Pilipinas (BSP). Further, non-
interest income increased by 30% on the double digit expansion in both fee based income and
trading and foreign exchange gains. BDO’s continued branch expansion enabled it to keep cost
of funds tempered with low cost deposits growing over 20%. With the Philippine economy
expected to sustain its growth momentum in 2014, BDO is fully equipped to realize the
promising growth opportunities in its customer segments by capitalizing on its established
business franchise and wide distribution network.

- 16 -
Gain on sale of available-for-sale investments and fair value changes on investments held for
trading increased to P0.1 billion in 2013 from P0.002 billion in 2012 primarily due to the gain on
sale of available-for-sale investments of the Group in 2013.
Dividend income increased by P0.3 billion or 40.6% in 2013 to P0.9 billion from P0.6 billion in
2012 due to increase in dividends received from investees. Management and service fees, which
is computed based on percentage of sales, increased by P0.3 billion or 29.2% from P1.1 billion in
2012 to P1.4 billion in 2013 mainly due to increase in sales of retail affiliates.
Other revenues, which comprise mainly of income for the promotional activities highlighting
products, commission from bills payment, prepaid cards and show tickets, advertising income
and sponsorship revenues remained at P2.2 billion in 2013 and 2012.
Total cost and expenses went up by 14.1% to P202.0 billion for the year ended December 31,
2013 compared to 2012. Retail cost of sales increased by 17.7% from P117.9 billion to P138.7
billion mainly due to the increase in retail sales. Real estate cost of sales decreased by 13.3%
from P14.1 billion to P12.2 billion due primarily to lower recognized real estate costs in line with
lower recognized real estate sales in 2013 and tighter cost controls during project engineering and
stricter monitoring of project costs which resulted to improved gross margins. Selling, general
and administrative expenses increased by 13.5% from P45.0 billion in 2012 to P51.0 billion in
2013. The increase is primarily associated with mall expansions, new malls, department stores,
supermarkets, hypermarkets, SaveMore and Walter Mart stores, as well as store renovations and
current real estate projects.
Other charges of P7.7 billion in 2013 increased by 28.6% or P1.8 billion from last year’s P5.9
billion. Gain on disposal of investments and properties decreased by 58.0% to P0.5 billion in
2013 from P1.3 billion in 2012 due mainly to the deferred gain on Belle-PLAI share swap that
was realized in 2012. Gain (loss) on fair value changes on derivatives decreased by 28.9% to
P1.0 billion in 2013 from P1.4 billion in 2012 resulting mainly from the fair value changes of the
embedded derivatives related to the US$250.0 million convertible bonds of SMIC in 2013 (refer
to Note 20 of the consolidated financial statements). Interest expense increased by 1.2% or P0.1
billion to P10.9 billion in 2013 from P10.8 billion in 2012. Interest income decreased by 16.0%
to P3.7 billion in 2013 from P4.4 billion in 2012 due mainly from the decrease in interest rates
and lower average balance of temporary investments in 2013 compared to 2012. Foreign
exchange gains decreased by 89.5% from P0.6 billion in 2012 to P0.1 billion in 2013 due mainly
to the increase in foreign exchange rate to P44.395:US$1.00 in 2013 from P41.05:US$1.00 in
2012.
Provision for income tax decreased by 17.2% to P5.4 billion for the year 2013 from P6.5 billion
in 2012 resulting mainly from the SM Property group restructuring transaction.
Non-controlling interests increased by 11.0% to P10.8 billion in 2013 from P9.7 billion in 2012
due to the increase in net income of certain subsidiaries.

- 17 -
Financial Position
(amounts in billion pesos)
Accounts 12 / 31 / 2013 12 / 31 / 2012 % Change
Current assets P 162.9 P 145.9 11.7%
Noncurrent assets 470.1 415.9 13.0%
Total assets P 633.0 P 561.8 12.7%
Current liabilities P 132.1 P 105.1 25.7%
Noncurrent Liabilities 200.7 195.1 2.9%
Total Liabilities 332.8 300.2 10.9%
Total Equity 300.2 261.6 14.8%
Total Liabilities and
Equity
P 633.0
P 561.8
12.7%
On the Balance Sheet side, consolidated total assets as of December 31, 2013 amounted to P633.0
billion, higher by 12.7% from P561.8 billion in the previous year. On the other hand, consolidated
total liabilities grew by 10.9% to P332.8 billion in 2013 from P300.2 billion in the previous year.
Total current assets increased by 11.7% to P162.9 billion as of December 31, 2013 from P145.9
billion as of last year. Cash and cash equivalents decreased by 17.3% to P50.2 billion in 2013
from P60.7 billion in 2012 while Time deposits and Short term investments decreased by 0.6% to
P28.9 billion in 2013 from P29.1 billion in 2012 due mainly to payment of bank loans, capital
expenditures and new investments. Investments held for trading and sale decreased by 60.8% to
P1.1 billion in 2013 from P2.9 billion in 2012 due to maturity of certain investments in bonds.
Receivables increased by 62.8% to P26.6 billion from P16.4 billion due primarily to increase in
Receivable from tenants and real estate buyers. Other current assets increased by 82.6% to P42.8
billion in 2013 from P23.4 billion in 2012 resulting mainly from the reclassification to current
from noncurrent of ongoing land and development projects of the property group and increase in
condominium units for sale, input tax and other prepayments.
Total consolidated noncurrent assets amounted to P470.1 billion as of December 31, 2013, an
increase of 13.0% from last year’s P415.9 billion. Investments in shares of stock of associates and
joint venture increased by 8.2% or P10.6 billion to P139.0 billion from P128.4 billion due mainly
to additional investments in associates and joint venture and equity share in bank’s net income.
The increase in Investment properties and Property and equipment by 28.4% or P42.6 billion and
6.6% or P1.1 billion, respectively, arose from new mall constructions and new store openings.
Deferred tax assets increased by 238.4% to P2.2 billion in 2013 from P0.6 billion in 2012
resulting mainly from the SM Property Group restructuring transaction. Other noncurrent assets
increased by 2.5% to P28.4 billion from P27.8 billion while Intangibles increased by 31.9% to
P20.2 billion from P15.4 billion resulting mainly from goodwill recognized from business
combinations. These were partially offset by the decrease in Available-for-sale investments by
2.4% and by the decrease in Land and development by P4.5 billion or 15% to P25.7 billion in
2013 from P30.2 billion in 2012 due mainly from the reclassification of ongoing projects to
current portion. The 8.0% or P2.4 billion decrease in Time deposits represents reclassification to
current portion of maturing time deposits.
- 18 -
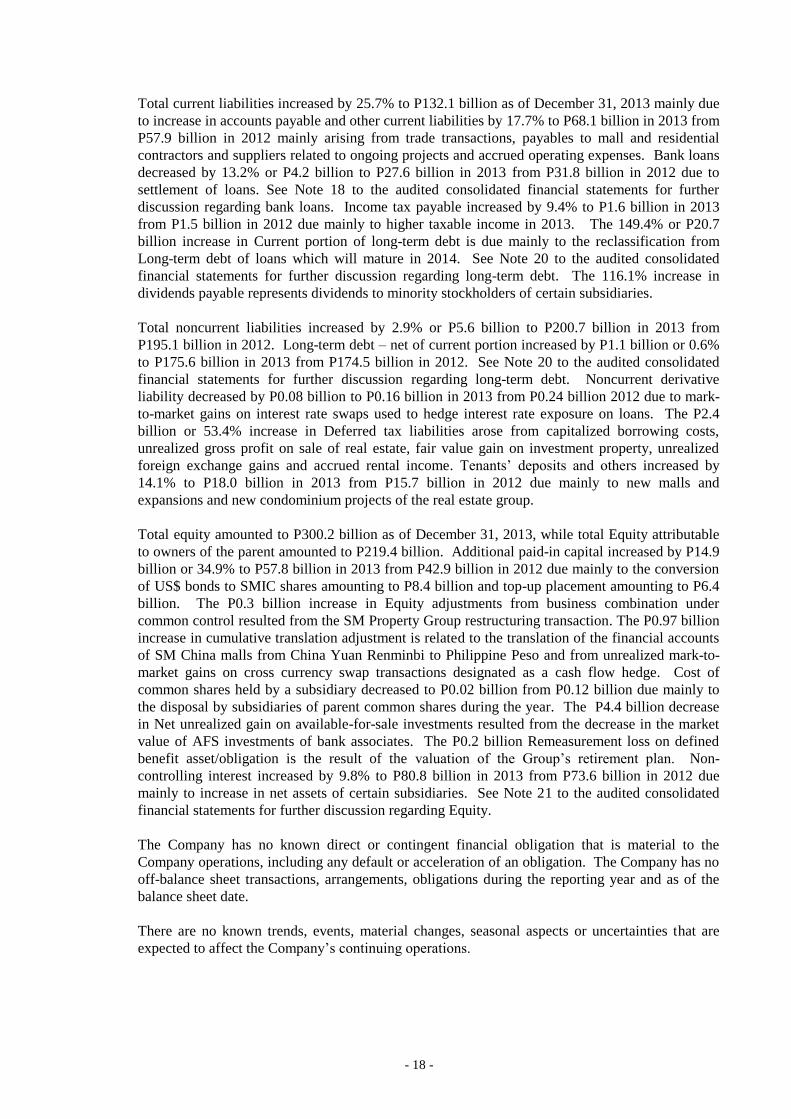
Total current liabilities increased by 25.7% to P132.1 billion as of December 31, 2013 mainly due
to increase in accounts payable and other current liabilities by 17.7% to P68.1 billion in 2013 from
P57.9 billion in 2012 mainly arising from trade transactions, payables to mall and residential
contractors and suppliers related to ongoing projects and accrued operating expenses. Bank loans
decreased by 13.2% or P4.2 billion to P27.6 billion in 2013 from P31.8 billion in 2012 due to
settlement of loans. See Note 18 to the audited consolidated financial statements for further
discussion regarding bank loans. Income tax payable increased by 9.4% to P1.6 billion in 2013
from P1.5 billion in 2012 due mainly to higher taxable income in 2013. The 149.4% or P20.7
billion increase in Current portion of long-term debt is due mainly to the reclassification from
Long-term debt of loans which will mature in 2014. See Note 20 to the audited consolidated
financial statements for further discussion regarding long-term debt. The 116.1% increase in
dividends payable represents dividends to minority stockholders of certain subsidiaries.
Total noncurrent liabilities increased by 2.9% or P5.6 billion to P200.7 billion in 2013 from
P195.1 billion in 2012. Long-term debt – net of current portion increased by P1.1 billion or 0.6%
to P175.6 billion in 2013 from P174.5 billion in 2012. See Note 20 to the audited consolidated
financial statements for further discussion regarding long-term debt. Noncurrent derivative
liability decreased by P0.08 billion to P0.16 billion in 2013 from P0.24 billion 2012 due to mark-
to-market gains on interest rate swaps used to hedge interest rate exposure on loans. The P2.4
billion or 53.4% increase in Deferred tax liabilities arose from capitalized borrowing costs,
unrealized gross profit on sale of real estate, fair value gain on investment property, unrealized
foreign exchange gains and accrued rental income. Tenants’ deposits and others increased by
14.1% to P18.0 billion in 2013 from P15.7 billion in 2012 due mainly to new malls and
expansions and new condominium projects of the real estate group.
Total equity amounted to P300.2 billion as of December 31, 2013, while total Equity attributable
to owners of the parent amounted to P219.4 billion. Additional paid-in capital increased by P14.9
billion or 34.9% to P57.8 billion in 2013 from P42.9 billion in 2012 due mainly to the conversion
of US$ bonds to SMIC shares amounting to P8.4 billion and top-up placement amounting to P6.4
billion. The P0.3 billion increase in Equity adjustments from business combination under
common control resulted from the SM Property Group restructuring transaction. The P0.97 billion
increase in cumulative translation adjustment is related to the translation of the financial accounts
of SM China malls from China Yuan Renminbi to Philippine Peso and from unrealized mark-to-
market gains on cross currency swap transactions designated as a cash flow hedge. Cost of
common shares held by a subsidiary decreased to P0.02 billion from P0.12 billion due mainly to
the disposal by subsidiaries of parent common shares during the year. The P4.4 billion decrease
in Net unrealized gain on available-for-sale investments resulted from the decrease in the market
value of AFS investments of bank associates. The P0.2 billion Remeasurement loss on defined
benefit asset/obligation is the result of the valuation of the Group’s retirement plan. Non-
controlling interest increased by 9.8% to P80.8 billion in 2013 from P73.6 billion in 2012 due
mainly to increase in net assets of certain subsidiaries. See Note 21 to the audited consolidated
financial statements for further discussion regarding Equity.
The Company has no known direct or contingent financial obligation that is material to the
Company operations, including any default or acceleration of an obligation. The Company has no
off-balance sheet transactions, arrangements, obligations during the reporting year and as of the
balance sheet date.
There are no known trends, events, material changes, seasonal aspects or uncertainties that are
expected to affect the Company’s continuing operations.
- 19 -
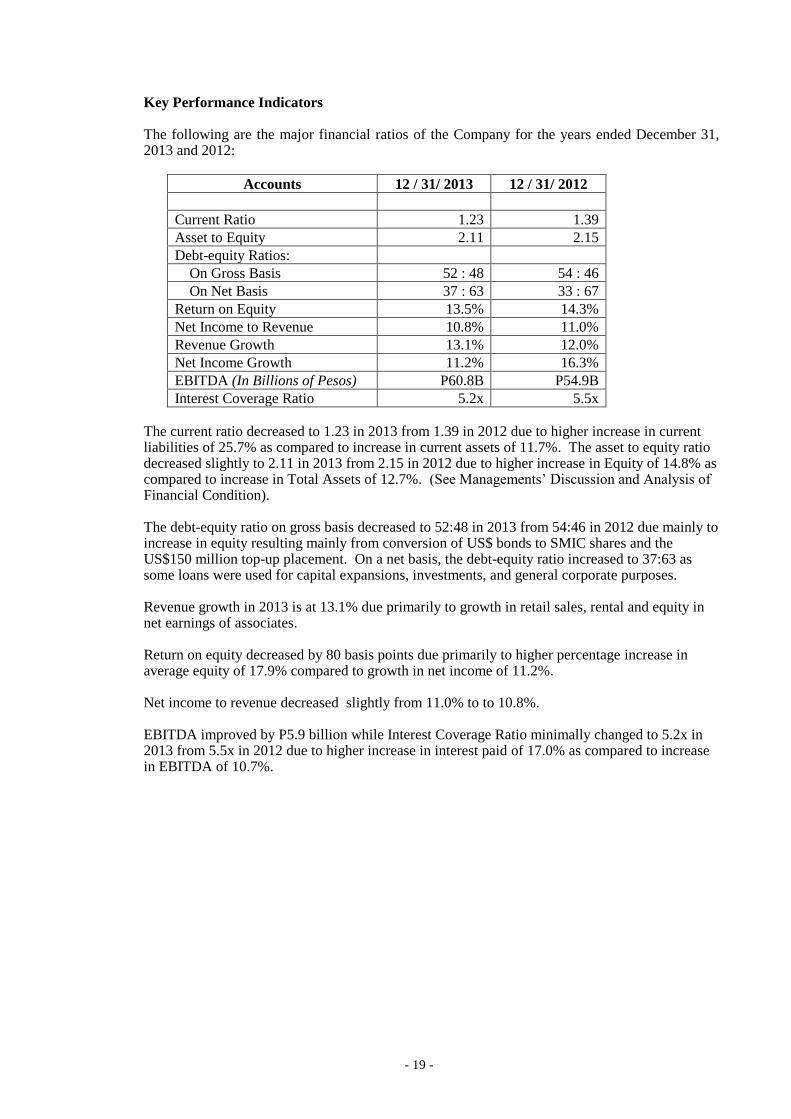
Key Performance Indicators The following are the major financial ratios of the Company for the years ended December 31, 2013 and 2012:
Accounts 12 / 31/ 2013 12 / 31/ 2012
Current Ratio 1.23 1.39
Asset to Equity 2.11 2.15
Debt-equity Ratios:
On Gross Basis 52 : 48 54 : 46
On Net Basis 37 : 63 33 : 67
Return on Equity 13.5% 14.3%
Net Income to Revenue 10.8% 11.0%
Revenue Growth 13.1% 12.0%
Net Income Growth 11.2% 16.3%
EBITDA (In Billions of Pesos) P60.8B P54.9B
Interest Coverage Ratio 5.2x 5.5x
The current ratio decreased to 1.23 in 2013 from 1.39 in 2012 due to higher increase in current liabilities of 25.7% as compared to increase in current assets of 11.7%. The asset to equity ratio decreased slightly to 2.11 in 2013 from 2.15 in 2012 due to higher increase in Equity of 14.8% as compared to increase in Total Assets of 12.7%. (See Managements’ Discussion and Analysis of Financial Condition). The debt-equity ratio on gross basis decreased to 52:48 in 2013 from 54:46 in 2012 due mainly to increase in equity resulting mainly from conversion of US$ bonds to SMIC shares and the US$150 million top-up placement. On a net basis, the debt-equity ratio increased to 37:63 as some loans were used for capital expansions, investments, and general corporate purposes. Revenue growth in 2013 is at 13.1% due primarily to growth in retail sales, rental and equity in net earnings of associates. Return on equity decreased by 80 basis points due primarily to higher percentage increase in average equity of 17.9% compared to growth in net income of 11.2%. Net income to revenue decreased slightly from 11.0% to to 10.8%. EBITDA improved by P5.9 billion while Interest Coverage Ratio minimally changed to 5.2x in 2013 from 5.5x in 2012 due to higher increase in interest paid of 17.0% as compared to increase in EBITDA of 10.7%.
- 20 -
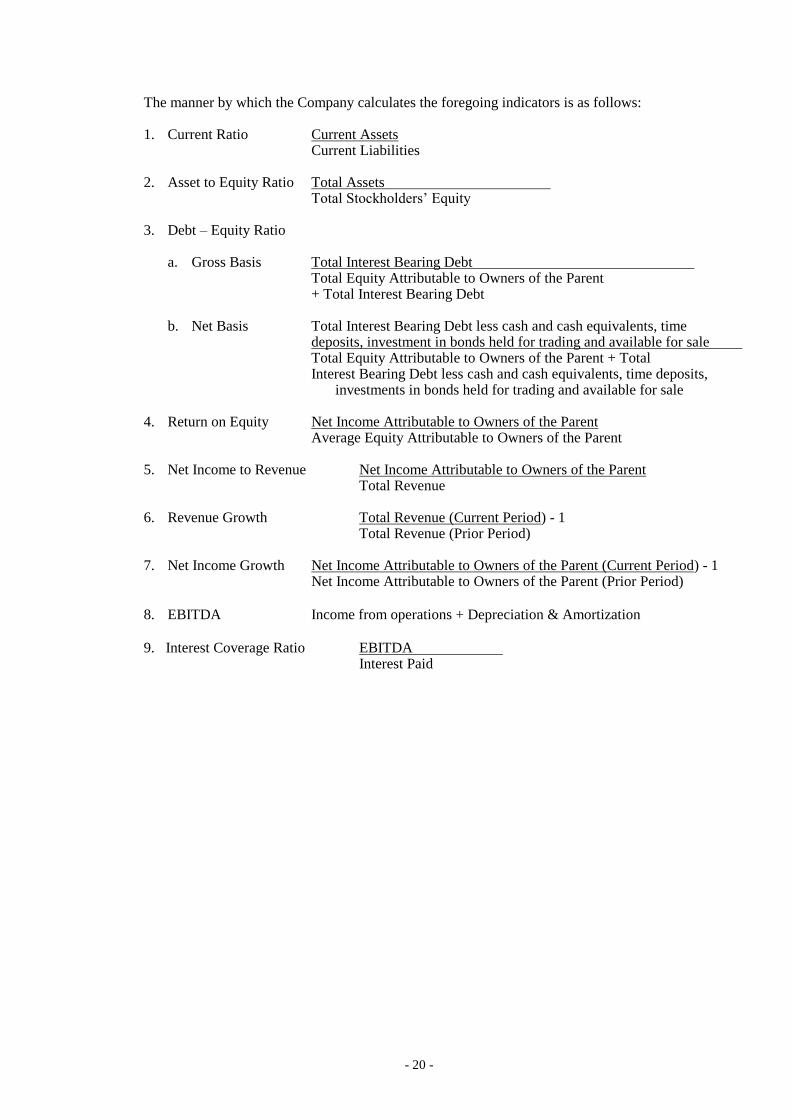
The manner by which the Company calculates the foregoing indicators is as follows: 1. Current Ratio Current Assets Current Liabilities 2. Asset to Equity Ratio Total Assets
Total Stockholders’ Equity 3. Debt – Equity Ratio
a. Gross Basis Total Interest Bearing Debt
Total Equity Attributable to Owners of the Parent + Total Interest Bearing Debt
b. Net Basis Total Interest Bearing Debt less cash and cash equivalents, time
deposits, investment in bonds held for trading and available for sale Total Equity Attributable to Owners of the Parent + Total Interest Bearing Debt less cash and cash equivalents, time deposits, investments in bonds held for trading and available for sale
4. Return on Equity Net Income Attributable to Owners of the Parent Average Equity Attributable to Owners of the Parent 5. Net Income to Revenue Net Income Attributable to Owners of the Parent Total Revenue 6. Revenue Growth Total Revenue (Current Period) - 1 Total Revenue (Prior Period)
7. Net Income Growth Net Income Attributable to Owners of the Parent (Current Period) - 1 Net Income Attributable to Owners of the Parent (Prior Period)
8. EBITDA Income from operations + Depreciation & Amortization
9. Interest Coverage Ratio EBITDA Interest Paid

- 21 -
Expansion Plans / Prospects for the Future
For 2014, SM Prime will open three new malls, located in Cauayan and Angono in the
Philippines and Zibo in China, as well as expansion of four existing malls. By year end, SM
Prime will have an estimated 7.5 million square meters of gross floor area.
In 2014, SMDC plans to launch over five new and expansion projects that will yield around
10,600 condominium units.
In the last quarter of 2015, SM Hotels will be opening Park Inn by Radisson in Pampanga. This
is the second Park Inn Hotel to be managed by Carlson Rezidor. This 150-room hotel is located
within the Clarkfield Air Base in Pampanga. In addition, construction of the 347-room Conrad
Hotel in the Mall of Asia Complex will be continuing in 2014. This is the first Conrad Hotel in
the Philippines and it will be managed by Hilton Worldwide. Conrad Hotel Manila is scheduled
to start operations in the last quarter of 2015.
The Property Group’s land banking initiatives will continue in 2014.
The Retail Group will be opening one department store, one supermarket, fifteen SaveMore
branches and three hypermarkets.
The above expenditures will be funded through internally generated sources and other capital
raising initiatives such as bond issuances and loan availments.

- 22 -
Calendar Year Ended December 31, 2012 and 2011
Results of Operation
(amounts in billion pesos)
Accounts
12 / 31 / 2012
12 / 31 / 2011
%
Change
Revenue P 223.8 P 199.9 12.0%
Cost and Expenses 177.0 162.9 8.7%
Income from Operations P 46.8 P 37.0 26.6%
Other Income (Charges) (5.9) (1.3) 346.5%
Provision for Income Tax 6.5 5.5 19.1%
Minority Interest 9.7 9.0 8.4%
Net Income Attributable to
Equity Holders of the
Parent
P 24.7
P 21.2
16.3%
Consolidated revenues grew by 12.0% to P223.8 billion, as against last year’s P199.9 billion.
Income from operations increased by 26.6% to P46.8 billion from last year’s P37.0 billion.
Operating income margin and Net profit margin is at 20.9% and 11.0%, respectively. Net
income attributable to equity holders of the Parent for the year ended December 31, 2012
increased by 16.3% to P24.7 billion compared to P21.2 billion of the same period last year.
Retail Sales accounts for 71.0% or P158.9 billion of the total revenues for the year. Consolidated
Retail sales grew by 7.2% from P148.2 billion to P158.9 billion for the year ended December 31,
2012 due mainly to the opening of the following new stores in 2012:
SM Department Stores SM Supermarkets /
SaveMore Stores
SM Hypermarkets
1 Olongapo Consolacion Cebu Alabang, Zapote Road Las
Piñas *
2 Consolacion Cebu San Fernando
Pampanga
East Service Road
Muntinlupa *
3 San Fernando Pampanga General Santos Monumento Caloocan City
4 General Santos Lanang Davao Cainta Rizal *
5 Lanang Davao SaveMore LGZ Silver
Screen
Heroes’ Hall Laoag Ilocos
Norte
6 - SaveMore Basak Antipolo, City
7 - SaveMore Nova Plaza Cadiz Negros Occidental
8 - SaveMore Bangkal -
9 - SaveMore Sorsogon -
10 - SaveMore Baclaran -
11 - SaveMore Malinta -
12 - SaveMore San Jose -
13 - SaveMore Parian -
14 - SaveMore Camarin -
15 - SaveMore Avenida -
16 - SaveMore LB Centro -
17 - SaveMore Sta. Rosa -
18 - SaveMore Maribago -

- 23 -
SM Department Stores
SM Supermarkets /
SaveMore Stores
SM Hypermarkets
19 - SaveMore MD Fuente -
20 - SaveMore Talisay -
21 - SaveMore Kawit -
22 - SaveMore Santiago -
* These were formerly Makro stores which were converted into Hypermarket stores
Excluding the full year sales of Makro in 2011, the retail sales growth would be 9.3% from
P145.4 billion in 2011 to P158.9 billion in 2012. Of the 2012 total retail sales, the non-food
group, which is composed of SM Department stores, contributed 43.8% or P69.6 billion, while
the food group, composed of SM Supermarkets, SM SaveMore stores and SM Hypermarkets
contributed 56.2% or P89.3 billion.
As of December 31, 2012, SM Investments’ retail subsidiaries have 202 stores. These consist of
46 department stores, 37 supermarkets, 82 SaveMore stores and 37 hypermarkets.
Real estate sales for the year ended December 31, 2012, derived mainly from condominium
projects of SMDC, grew by 30.7% to P22.5 billion. The market continues to show strong
acceptance of SM Residences and M Place products, backed by a deeper confidence on SMDC’s
proven ability to complete its projects, thereby fueling to a large extent SMDC’s notable 2012
results. The consistent offerings of high-quality and well-designed residential units built by an
experienced team composed of the country’s top contractors, engineers, architects, and interior
designers also allowed SMDC to gain further traction and brand recognition. SMDC has a total
of 19 residential projects as of December 31, 2012. In 2012, SMDC introduced in the real estate
market Breeze Residences in Pasay City and Grace Residences in Taguig City. For the whole of
2012, SMDC pre-sold 12,614 residential condominium units worth approximately P31.7 billion.
Compared to the same period in 2011, the number of units pre-sold increased by 8%.
The other ongoing projects of SMDC are the following: Grass Residences beside SM City North
Edsa; Field Residences in Sucat, Paranaque; Princeton Residences along Aurora Boulevard in
Quezon City; Jazz Residences near Jupiter Road in Makati City; Sun Residences right beside the
Mabuhay (formerly Welcome) Rotunda near Quezon Avenue; Light Residences near Pioneer
Street in Mandaluyong; Wind Residences along the Emilio Aguinaldo Highway in Tagaytay
City; Blue Residences, which is located at Loyola Heights in Quezon City; M Place South
Triangle in Panay Avenue, Quezon City; Mezza II Residences in Sta. Mesa Quezon City; Rose
Residences in Pasig City; Green Residences along Taft Avenue, Manila; Shell Residences near
Mall of Asia Complex in Pasay City; Breeze Residences in Roxas Boulevard, Pasay City; and
Grace Residences in Taguig City. Currently, SMDC has five fully completed projects namely
Mezza Residences, a 38-storey four-tower high rise condominium across SM City Sta. Mesa,
Quezon City; Chateau Elysee, a mid-rise condominium project in Parañaque City; Berkeley
Residences in Katipunan Road, Quezon City; Sea Residences near the Mall of Asia Complex in
Pasay City and Lindenwood Residences, a residential subdivision in Muntinlupa City. Further
contributions to the growth in real estate sales were provided by the sale of condominium units of
Costa del Hamilo and club shares in Pico de Loro.
Rent revenue for the year ended December 31, 2012, derived mainly from mall operations of SM
Prime Holdings, Inc. (SM Prime), increased by 18.5% to P24.7 billion in 2012 from P20.8 billion
in 2011. SM Prime is the country’s leading shopping mall developer and operator which owns 46
malls in the Philippines and five malls in China as of December 31, 2012. The increase in rental
revenues is largely due to rentals from new SM Supermalls which opened in 2011 and 2012,
namely SM City Masinag, SM City Olongapo, SM City Consolacion, SM City San Fernando, SM
- 24 -
City General Santos and SM Lanang Premier, with a total gross floor area of 527,000 square
meters. Excluding the new malls and expansions, same store rental growth is at 8.0%.
The four malls in China contributed P2.5 billion in 2012 and P2.0 billion in 2011, or 10.4% and
9.9%, respectively, of SMIC’s consolidated rental revenue. The rental revenue of these four
malls in China increased by 24.4% in 2012 compared to the same period in 2011 largely due to
improvements in the average occupancy rate, lease renewals and the opening of the SM Xiamen
Lifestyle and SM Suzhou which added 182,000 sqm of gross floor area. SM Chongqing, the fifth
mall in China, opened in December 2012 with a gross floor area of 149,000 square meters.
Average occupancy rate for the four malls is now at 92%.
For the year 2012, cinema ticket sales and amusement revenues increased by 16.6% to P4.8
billion in 2012 from P4.1 billion in 2011 largely due to more blockbuster movies both local and
international, conversion of all screens to digital and roll-out of cinema turnstile system which
made the cinema viewing experience more convenient for customers that altogether led to an
increase in foot traffic. Amusement revenues is mainly composed of amusement income from
rides, bowling and ice skating operations including the SM Science Discovery Center and the SM
Storyland.
Equity in net earnings of associates increased by 40.9% to P9.0 billion in 2012 from P6.4 billion
in 2011, primarily due to the increase in the net income of BDO which is attributed to the bank’s
robust expansion in its lending, deposit-taking, and fee-based businesses. Net interest income
was up 7.1% even as volume growth was offset by the impact of regulatory changes and excess
system liquidity. Total non-interest income rose 18% contributed substantially by trading gains
from treasury activities. BDO was able to capitalize on market opportunities and realize
exceptional gains from its investment portfolio. With the Philippine economy expected to sustain
its growth momentum, BDO looks forward to tapping the promising growth opportunities in
customer segments, capitalizing on its established business franchise and wide distribution
network.
Gain on sale of available-for-sale investments and fair value changes on investments held for
trading decreased by 95.4% to P0.002 billion in 2012 from P0.04 billion in 2011 primarily due to
the gain on sale of available-for-sale investments of certain subsidiaries in 2011.
Dividend income increased by P0.2 billion or 70.3% in 2012 to P0.6 billion from P0.4 billion in
2011 due to increase in dividends received from investees. Management and service fees, which
is computed based on percentage of sales, increased by P0.2B or 26.3% from P0.9 billion in 2011
to P1.1 billion in 2012 mainly due to increase in sales of retail affiliates.
Other revenues, which comprise mainly of income for the promotional activities highlighting
products, commission from bills payment, prepaid cards and show tickets, increased by P0.3
billion or 18.8% from P1.8 billion in 2011 to P2.2 billion in 2012.
Total cost and expenses went up by 8.7% to P177.0 billion for the year ended December 31, 2012
compared to 2011. Retail cost of sales increased by 5.1% from P112.2 billion to P117.9 billion
while real estate cost of sales and others increased by 37.3% from P10.3 billion to P14.1 billion
mainly due to the increase in sales. Selling, general and administrative expenses increased by
11.3% from P40.4 billion in 2011 to P45.0 billion in 2012. Major contributors to the increase in
selling, general and administrative expenses are personnel cost, depreciation and amortization,
utilities, rent, taxes and licenses, outside services, advertising and promotion and repairs and
maintenance totaling to P39.5 billion in 2012 which accounts for 88% of total selling, general
and administrative expenses for the year ended December 31, 2012. The increase is primarily

- 25 -
associated with new malls, department stores, supermarkets, savemore, hypermarkets and
residential projects.
Other charges of P5.9 billion in 2012 increased by 346.5% or P4.6 billion from last year’s other
charges of P1.3 billion. Gain on disposal of investments and properties decreased by 50.4% to
P1.3 billion in 2012 from P2.6 billion in 2011 due mainly to the gain on Belle-PLAI share swap
in 2011 of P1.5 billion (net of minority interest). Gain (loss) on fair value changes on derivatives
decreased by 483.3% to loss of P1.4 billion in 2012 from gain of P0.4 billion in 2011 resulting
mainly from the fair value changes of the embedded derivatives related to the US$250.0 million
convertible bonds of SMIC in 2012 (refer to Note 19 of the consolidated financial statements).
Interest expense increased by 22.4% or P2.0 billion to P10.8 billion in 2012 from P8.8 billion in
2011 due mainly to new loans availed of in 2012 (refer to Note 19 of the consolidated financial
statements). These were offset by the increase in interest income by 3.3% to P4.4 billion in 2012
from P4.3 billion in 2011 and increase in foreign exchange gains by 132.7% from P0.2 billion in
2011 to P0.6 billion in 2012 due mainly to the decrease in foreign exchange rate from
P43.93:US$1.00 in 2011 to P41.05:US$1.00 in 2012.
Provision for income tax increased by 19.1% to P6.5 billion for the year 2012 from P5.5 billion
in 2011 due mainly to the increase in taxable income.
Minority interest increased by 8.4% to P9.7 billion in 2012 from P9.0 billion in 2011 due to the
increase in net income of certain subsidiaries.
Financial Position
(amounts in billion pesos)
Accounts 12 / 31 / 2012 12 / 31 / 2011 % Change
Current assets P 145.9 P 101.3 44.1%
Noncurrent assets 415.9 347.8 19.6%
Total assets P 561.8 P 449.1 25.1%
Current liabilities P 105.1 P 79.8 31.7%
Noncurrent Liabilities 195.1 147.0 32.7%
Total Liabilities 300.2 226.8 32.4%
Total Equity 261.6 222.3 17.7%
Total Liabilities and
Equity
P 561.8
P 449.1
25.1%
On the Balance Sheet side, consolidated total assets as of December 31, 2012 amounted to P561.8
billion, higher by 25.1% from P449.1 billion in previous year. On the other hand, consolidated
total liabilities grew by 32.4% to P300.2 billion in 2012 from P226.8 billion in previous year.
Total current assets increased by 44.1% to P145.9 billion as of December 31, 2012 from P101.3
billion as of last year. Cash and cash equivalents increased by 8.3% to P60.7 billion in 2012 from
P56.1 billion in 2011 while Time deposits and short term investments increased by 3207.9% to
P29.1 billion in 2012 from P0.9 billion in 2011 due mainly to proceeds from loan availments
during the year and reclassification from noncurrent to current of time deposits which will mature
in 2013. Receivables increased by 39.1% to P16.4 billion from P11.8 billion due primarily to
increase in receivable from tenants and real estate buyers. Other current assets increased by
36.5% to P23.4 billion from P17.2 billion resulting mainly from condominium units for sale of the
real estate group, prepaid taxes and other prepayments and nontrade receivables.

- 26 -
Total consolidated noncurrent assets amounted to P415.9 billion as of December 31, 2012, a
growth of 19.6% from P347.8 billion as of December 31, 2011. Investments available for sale
increased by 35.8% to P16.9 billion in 2012 from P12.4 billion in 2011 mainly due to additional
investments in bonds during the year. Investments in shares of stock increased by 45.3% to
P128.4 billion in 2012 from P88.4 billion in 2011 mainly due to additional investment in shares of
stock of associates, increase in equity in banks and additional share in the unrealized gain on AFS
investments of associates in 2012. The increase in investment properties, property and equipment
and land and development by 14.2% or P18.7 billion, 13.9% or P2.1 billion and 31.2% or P7.2
billion, respectively, arose from new mall constructions, real estate developments and purchase of
commercial lots in 2012. Other noncurrent assets increased by 15.3% to P27.8 billion from P24.1
billion mainly due to the non-current receivable from real estate buyers, deposits and advance
rentals and non-current portion of advances for project development. These were partially offset
by the decrease in deferred tax assets to P0.64 billion in 2012 from P0.69 billion in 2011 and
decrease in time deposits by 21.3% to P29.4 billion in 2012 from P37.4 billion in 2011 due mainly
from reclassification to current portion of maturing time deposits.
Total consolidated current liabilities increased by 31.7% to P105.1 billion as of December 31,
2012 mainly due to availment of bank loans which increased by 23.5% to P31.8 billion in 2012
from P25.7 billion in 2011 and increase in accounts payable and other current liabilities by
29.3%% to P57.9 billion in 2012 from P44.7 billion in 2011 mainly arising from trade
transactions, payable arising from acquisition of land, and current derivative liability. See note 17
to the audited consolidated financial statements for further discussion regarding bank loans.
Income tax payable increased by 10.7% to P1.5 billion in 2012 from P1.3 billion in 2011 due
mainly to higher taxable income in 2012. The 75.0% or P5.9 billion increase in current portion of
long-term debt is due mainly to the reclassification from Long-term debt of loans which will
mature in 2013. See note 19 to the audited consolidated financial statements for further discussion
regarding long-term debt. The 278.6% increase in dividends payable represents dividends to
minority stockholders of certain subsidiaries.
Total Noncurrent Liabilities increased by P48.1 billion to P195.1 billion in 2012 from P147.0
billion in 2011. Long-term debt – net of current portion increased by P46.1 billion or 35.9% to
P174.5 billion in 2012 from P128.5 billion in 2011 due mainly from bond issuances of SMIC and
corporate notes issued by SMDC and SMPHI. See note 19 to the audited consolidated financial
statements for further discussion regarding long-term debt. Noncurrent derivative liability
remained at P0.2 billion in 2012 and 2011. Defined benefit liability decreased by P0.05 billion or
63.0% to P0.03 billion from P0.08 billion in 2011. Tenants’ deposits and others increased by
14.6% to P15.7 billion in 2012 from P13.7 billion in 2011 due mainly to new malls and
expansions and new condominium projects of the real estate group.
Total equity amounted to P261.6 billion as of December 31, 2012, while total Equity attributable
to equity holders of the parent amounted to P188.1 billion. The 37.6% or P0.1 billion decrease in
cumulative translation adjustment is related to the translation of the financial accounts of SM
China malls from China Yuan Renminbi to Philippine peso. Cost of common shares held by a
subsidiary decreased by 52.2% to P0.1 billion from P0.3 billion due mainly to the disposal by
subsidiaries of parent common shares during the year. Minority interest increased by 13.8% to
P73.6 billion in 2012 from P64.6 billion in 2011 due mainly to increase in net assets of certain
subsidiaries. See Note 20 to the audited consolidated financial statements for further discussion
regarding Equity.
The Company has no known direct or contingent financial obligation that is material to the
Company operations, including any default or acceleration of an obligation. The Company has no
off-balance sheet transactions, arrangements, obligations during the reporting year and as of the
balance sheet date.

- 27 -
There are no known trends, events, material changes, seasonal aspects or uncertainties that are
expected to affect the company’s continuing operations. Key Performance Indicators The following are the major financial ratios of the Company for the years ended December 31, 2012 and 2011:
Accounts 12 / 31/ 2012 12 / 31/ 2011
Current Ratio 1.39 : 1.00 1.27 : 1.00
Debt-equity Ratios:
On Gross Basis 54% : 46% 51% : 49%
On Net Basis 33% : 67% 28% : 72%
Return on Equity 14.3% 14.2%
Net Income to Revenue 11.0% 10.6%
Revenue Growth 12.0% 13.0%
Net Income Growth 16.3% 15.1%
EBITDA (In Billions of Pesos) P54.9B P44.2B
The current ratio increased to 1.39 : 1.00 in 2012 from 1.27 : 1.00 in 2011 due to higher increase of currents assets of 44.1% as compared to current liabilities of 31.7% (See Managements’ Discussion and Analysis of Financial Condition). The debt-equity ratio on gross basis increased to 54%:46% in 2012 from 51%:49% in 2011 due mainly to the additional loans in 2012. On a net basis, the debt-equity ratio increased to 33%:67% as some loans were used for capital expansions, investments, and general corporate purposes. In terms of profitability, the return on equity and net income to revenue slightly improved to 14.3% and 11.0%, respectively in 2012 as compared to 14.2% and 10.6%, respectively in 2011. Revenue growth decreased to 12.0% in 2012 from 13.0% in 2011 mainly attributed to higher % growth of retail and real estate sales in 2011 as compared to 2012. Net income growth increased to 16.3% in 2012 from 15.1% in 2011 and EBITDA improved to P54.9 billion in 2012 from P44.2 billion in 2011 due mainly from the increase in revenues by 12.0% and lower growth of costs and expenses by 8.7% as compared to last year’s 12.4%.
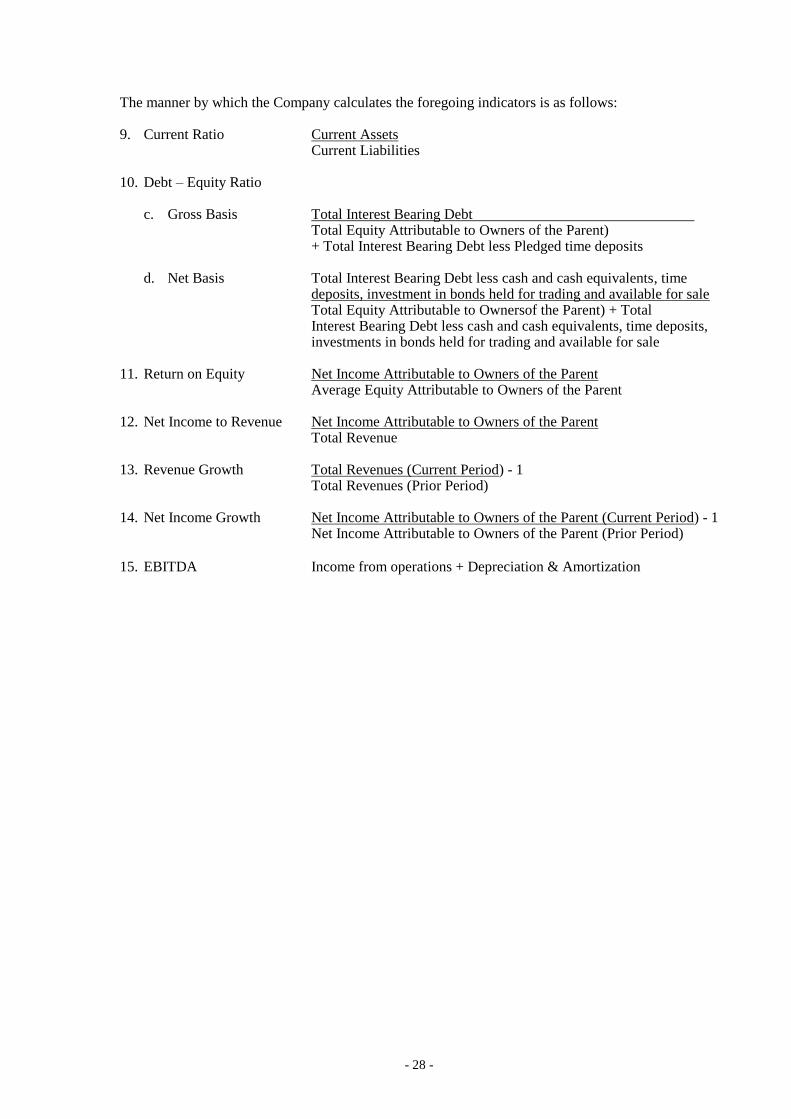
- 28 -
The manner by which the Company calculates the foregoing indicators is as follows: 9. Current Ratio Current Assets
Current Liabilities
10. Debt – Equity Ratio c. Gross Basis Total Interest Bearing Debt
Total Equity Attributable to Owners of the Parent) + Total Interest Bearing Debt less Pledged time deposits
d. Net Basis Total Interest Bearing Debt less cash and cash equivalents, time deposits, investment in bonds held for trading and available for sale
Total Equity Attributable to Ownersof the Parent) + Total Interest Bearing Debt less cash and cash equivalents, time deposits, investments in bonds held for trading and available for sale
11. Return on Equity Net Income Attributable to Owners of the Parent
Average Equity Attributable to Owners of the Parent
12. Net Income to Revenue Net Income Attributable to Owners of the Parent Total Revenue
13. Revenue Growth Total Revenues (Current Period) - 1 Total Revenues (Prior Period)
14. Net Income Growth Net Income Attributable to Owners of the Parent (Current Period) - 1 Net Income Attributable to Owners of the Parent (Prior Period)
15. EBITDA Income from operations + Depreciation & Amortization

- 29 -
Expansion Plans / Prospects for the Future
For 2013, SM Prime is scheduled to launch SM Aura Premier in Taguig and SM City Cauayan in
Isabela. SM Megamall, on the other hand, will be expanded with an additional 100,000 square
meters.
By year-end, SM Prime will have 48 malls in the Philippines and five in China with an estimated
combined gross floor area of 6.7 million square meters.
Retail expansion plans for 2013 include the opening of two department stores, two supermarkets, 19
SaveMore branches and seven hypermarkets.
SMDC currently has 18 residential projects under its SM Residences brand and one project under the
M Place brand. In order to sustain the growth momentum and to further expand the SMDC’s
presence in the industry, SMDC will continue to vigorously pursue its vision of uplifting the Filipino
lifestyles by launching products that will meet the demand for affordable and high quality residential
units in prime locations and will also pursue projects that will cater to the preferences and financial
capacity of its target market. Innovation shall remain to be its strength while continuously focusing
attention to changing market needs. The broadening and strengthening of its revenue base shall also
be pursued as it moves forward.
For the year 2013, SMDC is targeting to launch at least three new projects in various cities within
Metro Manila. In addition, it shall continue to search for viable locations in key cities in Metro
Manila in response to the increasing demands for residences. SMDC shall be open to tapping
various sources of financing to support its operational needs in real estate development.
The expansion plans of Costa del Hamilo include developing the Marina Village. It is envisioned to
be a vibrant mixed-use community of prime residential lots, waterfront homes, retail and water sports
facilities connected by a boardwalk that surrounds the Marina which will enhance Coastal Living in
Hamilo Coast.
SM Hotels is currently developing Park Inn by Radisson Davao, which will be the very first “Park
Inn by Radisson” in the Asia Pacific region. The Park Inn brand is one of the hotel brands under
Carlson and is the largest mid-market brand for hotels under development in Europe. Park Inn by
Radisson Davao hotel project is approximately a 204-room hotel located in Lanang, Davao City. The
hotel is scheduled to open in the first quarter of 2013.
SM Hotel’s subsidiary SMX Manila is to manage SM Prime’s SMX Convention Center in Taguig,
which is scheduled to open in April 2013.
The above expenditures will be funded through internally generated sources and other capital raising
initiatives such as bond issuances and loan availments.
The Company has no known direct or contingent financial obligation that is material to the Company,
including any default or acceleration of an obligation. There were no contingent liabilities or assets
in the Company’s balance sheet. The Company has no off-balance sheet transactions, arrangements,
obligations during the reporting year as of balance sheet date.
There are no known trends, events, material changes, seasonal aspects or uncertainties that are
expected to affect the Company’s continuing operations.

- 30 -
Calendar Year Ended December 31, 2011 and 2010
Results of Operation
(amounts in billion pesos)
Accounts
12 / 31 / 2011
12 / 31 / 2010
%
Change
Revenue P 199.9 P 176.9 13.0%
Cost and Expenses 162.9 145.0 12.3%
Income from Operations P 37.0 P 31.9 15.9%
Other Income (Charges) (1.3) (1.7) -19.9%
Provision for Income Tax 5.5 5.4 1.7%
Minority Interest 9.0 6.4 39.4%
Net Income Attributable to
Equity Holders of the
Parent
P 21.2
P 18.4
15.1%
Consolidated revenues grew by 13.0% to P199.9 billion, as against last year’s P176.9 billion.
Income from operations increased by 15.9% to P37.0 billion from last year’s P31.9 billion.
Operating income margin and Net profit margin is at 18.5% and 10.6%, respectively. Net
income attributable to equity holders of the Parent for the year ended December 31, 2011
increased by 15.1% to P21.2 billion compared to P18.4 billion of the same period last year.
Retail Sales accounts for 74.1% or P148.2 billion of the total revenues for the year. Consolidated
Retail sales grew by 9.3% from P135.6 billion to P148.2 billion for the year ended December 31,
2011 due mainly to the opening of the following new stores in 2011:
SM Department Stores SM Supermarkets /
SaveMore Stores
SM Hypermarkets
1 SM City Masinag SM City Masinag Mandaue, Cebu*
2 - Megamall A JMall, Mandaue, Cebu
3 - Olongapo Imus*
4 - SaveMore Muntinlupa Sucat -Lopez
5 - SaveMore Jackman Marketmall
6 - SaveMore Capistrano -
7 - SaveMore Bayambang -
8 - SaveMore Malhacan -
9 - SaveMore Kauswagan* -
10 - SaveMore Araneta -
11 - SaveMore Sta. Ana -
12 - SaveMore Apalit -
13 - SaveMore Sta. Maria -
14 - SaveMore Binan -
15 - SaveMore Tuguegarao -
16 - SaveMore Halang -
17 - SaveMore Shoe Ave. -
18 - SaveMore Balibago -
19 - SaveMore Canduman -
20 - SaveMore Maguikay -
21 - SaveMore Pedro Gil -
* These were formerly Makro stores which were converted into Hypermarket stores

- 31 -
SM Department Stores SM Supermarkets /
SaveMore Stores
SM Hypermarkets
22 -
SaveMore Iba
Zambales
-
23 - SaveMore Kanlaon -
24 - SaveMore Ilagan -
25 - SaveMore A. Avenue -
26 - SaveMore Laoag -
27 - SaveMore Salitran -
28 - SaveMore Blumentritt -
* These were formerly Makro stores which were converted into Hypermarket stores
Excluding the full year sales of Makro, the retail sales growth would be 12.4% from P129.4
billion in 2010 to P145.4 billion in 2011. Of the total retail sales, the non-food group, which is
composed of SM Department stores, contributed 42.9% or P63.6 billion, while the food group,
composed of SM Supermarkets, SM SaveMore stores, SM Hypermarkets, and Makro outlets,
contributed 57.1% or P84.6 billion.
As of December 31, 2011, SM Investments’ retail subsidiaries have 169 stores. These consist of
41 department stores, 33 supermarkets, 65 SaveMore stores and 30 hypermarkets.
Real estate sales for the year ended December 31, 2011, derived mainly from condominium
projects of SMDC, surged by 63.1% to P17.2 billion. The market continues to show strong
acceptance of SM Residences and M Place products, backed by a deeper confidence on SMDC’s
proven ability to complete its projects, thereby fueling to a large extent SMDC’s notable 2011
results. The consistent offerings of high-quality and well-designed residential units built by an
experienced team composed of the country’s top contractors, engineers, architects, and interior
designers also allowed SMDC to gain further traction and brand recognition. SMDC has a total
of 17 residential projects as of December 31, 2011. In 2011, SMDC launched Mezza II
Residences in Quezon City, Green Residences in Manila, Shell Residences in Pasay City and M
Place Ortigas in Pasig City. For the whole of 2011, SMDC pre-sold 11,726 residential
condominium units worth approximately P26.3 billion. Compared to the same period in 2010,
the number of units pre-sold increased by 14% and exceeded SMDC’s sales target of P23.6
billion by 11%.
The other ongoing projects of SMDC are the following: Grass Residences beside SM City North
Edsa; Sea Residences near the Mall of Asia Complex in Pasay City; Field Residences in Sucat,
Paranaque; Princeton Residences along Aurora Boulevard in Quezon City; Jazz Residences near
Jupiter Road in Makati City; Sun Residences right beside the Mabuhay (formerly Welcome)
Rotunda near Quezon Avenue; Light Residences near Pioneer Street in Mandaluyong; Wind
Residences along the Emilio Aguinaldo Highway in Tagaytay City; Blue Residences, which is
located at Loyola Heights in Quezon City and M Place South Triangle in Panay Avenue, Quezon
City. Currently, SMDC has four fully completed projects namely Mezza Residences, a 38-storey
four-tower high rise condominium across SM City Sta. Mesa, Quezon City; Chateau Elysee, a
mid-rise condominium project in Parañaque City; Berkeley Residences in Katipunan Road,
Quezon City; and Lindenwood Residences, a residential subdivision in Muntinlupa City.
Further contributions to the growth in real estate sales were provided by the sale of condominium
units of Costa del Hamilo and club shares in Pico de Loro.
Rent revenue for the year ended December 31, 2011, derived mainly from mall operations of SM
Prime Holdings, Inc. (SM Prime), increased by 15.3% to P20.8 billion in 2011 from P18.1 billion
in 2010. SM Prime is the country’s leading shopping mall developer and operator which owns 41
malls in the Philippines and four malls in China as of December 31, 2011. The increase in rental

- 32 -
revenues is largely due to rentals from new SM Supermalls. In 2010, SM City Tarlac, SM City
San Pablo, SM City Calamba and SM City Novaliches were opened. In 2011, SM Masinag was
also opened. The new malls added 380,000 square meters (sqm) to total gross floor area.
Excluding the new malls and expansions, same store rental growth is at 7.0%.
The four malls in China contributed P2.0 billion in 2011 and P1.4 billion in 2010, or 9.9% and
7.7%, respectively, of SMIC’s consolidated rental revenue. The rental revenue of these four
malls in China increased by 46.4% in 2011 compared to the same period in 2010 largely due to
improvements in the average occupancy rate, lease renewals and the opening of the SM Xiamen
Lifestyle and SM Suzhou which added 182,000 sqm of gross floor area. Average occupancy rate
for the four malls is now at 95%.
For the year 2011, cinema ticket sales and amusement revenues increased by 11.2% to P4.1
billion in 2011 from P3.7 billion in 2010 largely due to the success of local blockbuster movies
shown in 2011 compared to 2010 and higher sponsorship revenues in 2011. Amusement
revenues is mainly composed of amusement income from bowling and ice skating operations
including the SM Science Discovery Center and the SM Storyland.
Equity in net earnings of associates increased by 17.9% to P6.4 billion in 2011 from P5.4 billion
in 2010, primarily due to the increase in the net income of BDO which is attributed to the bank’s
recurring fee-based income from its service businesses which rose 18%. Amid a volatile external
environment, BDO generated a 10% increase in trading and foreign exchange gains. Along with
other miscellaneous income, BDO recorded a 17% growth in non-interest income. BDO
continues to derive bulk of its operating income from core lending and deposit-taking business
and fee-based service activities. Having completed its investment in capacity, BDO is now
starting to benefit from scale with operating expenses increasing only moderately by 4% with
ongoing initiatives to enhance operational efficiency.
Gain on sale of available-for-sale investments and fair value changes on investments held for
trading decreased by 93.5% to P0.04 billion in 2011 from P0.7 billion in 2010 primarily due to
the gain on sale of various available-for-sale investments of certain subsidiaries in 2010.
Dividend income increased by P0.1 billion or 21.6% in 2011 to P0.4 billion from P0.3 billion in
2010 due to increase in dividends received from investees. Management and service fees, which
is computed based on percentage of sales, increased by P0.1B or 9.1% from P0.8 billion in 2010
to P0.9 billion in 2011 mainly due to increase in sales of retail affiliates.
Other revenues, which comprise mainly of income for the promotional activities highlighting
products, commission from bills payment, prepaid cards and show tickets, slightly decreased by
P0.1 billion or 3.4%.
Total cost and expenses went up by 12.3% to P162.9 billion for the year ended December 31,
2011 compared to 2010. Retail cost of sales increased by 8.4% from P103.5 billion to P112.2
billion while real estate cost of sales and others increased by 71.6% from P6.0 billion to P10.3
billion mainly due to the increase in sales. Selling, general and administrative expenses
increased by 13.8% from P35.5 billion in 2010 to P40.4 billion in 2011. Major contributors to
the increase in selling, general and administrative expenses are personnel cost, depreciation and
amortization, utilities, rent, taxes and licenses, outside services, advertising and promotion and
repairs and maintenance totaling to P34.2 billion in 2011 or a growth of 14.8% from P29.8 billion
in 2010. The increase is primarily associated with new malls, department stores, supermarkets,
savemore and hypermarkets and residential projects.
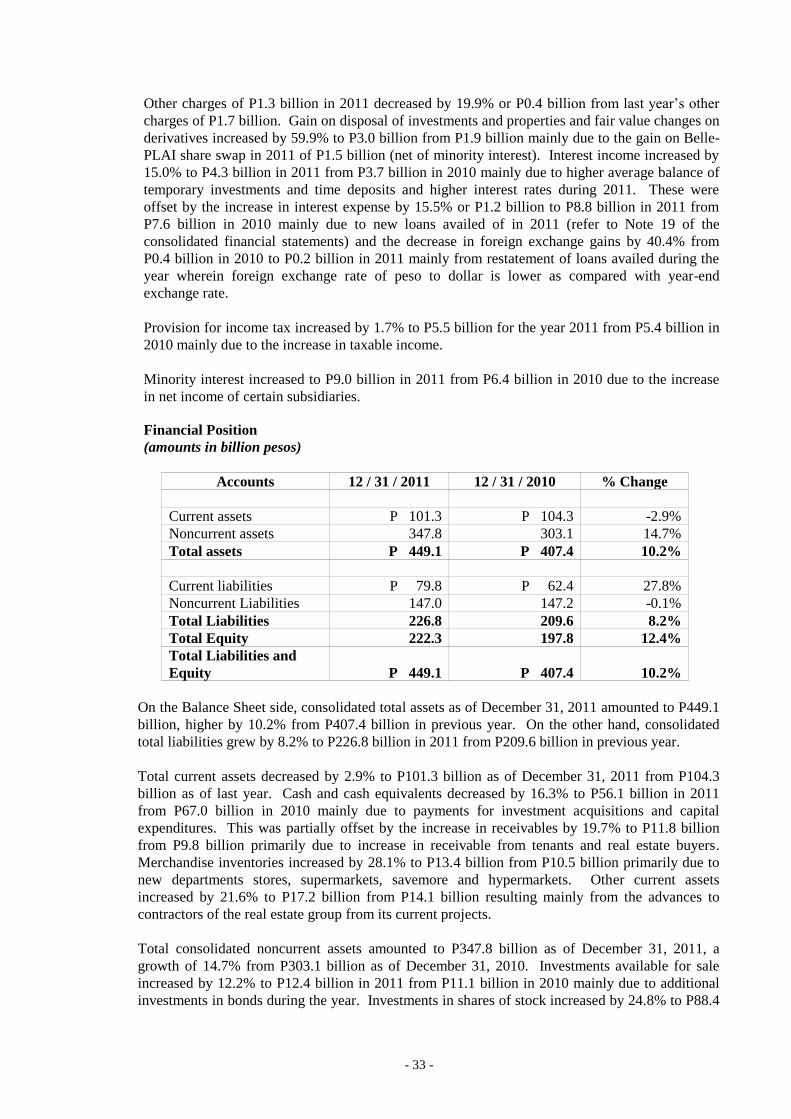
- 33 -
Other charges of P1.3 billion in 2011 decreased by 19.9% or P0.4 billion from last year’s other
charges of P1.7 billion. Gain on disposal of investments and properties and fair value changes on
derivatives increased by 59.9% to P3.0 billion from P1.9 billion mainly due to the gain on Belle-
PLAI share swap in 2011 of P1.5 billion (net of minority interest). Interest income increased by
15.0% to P4.3 billion in 2011 from P3.7 billion in 2010 mainly due to higher average balance of
temporary investments and time deposits and higher interest rates during 2011. These were
offset by the increase in interest expense by 15.5% or P1.2 billion to P8.8 billion in 2011 from
P7.6 billion in 2010 mainly due to new loans availed of in 2011 (refer to Note 19 of the
consolidated financial statements) and the decrease in foreign exchange gains by 40.4% from
P0.4 billion in 2010 to P0.2 billion in 2011 mainly from restatement of loans availed during the
year wherein foreign exchange rate of peso to dollar is lower as compared with year-end
exchange rate.
Provision for income tax increased by 1.7% to P5.5 billion for the year 2011 from P5.4 billion in
2010 mainly due to the increase in taxable income.
Minority interest increased to P9.0 billion in 2011 from P6.4 billion in 2010 due to the increase
in net income of certain subsidiaries.
Financial Position
(amounts in billion pesos)
Accounts 12 / 31 / 2011 12 / 31 / 2010 % Change
Current assets P 101.3 P 104.3 -2.9%
Noncurrent assets 347.8 303.1 14.7%
Total assets P 449.1 P 407.4 10.2%
Current liabilities P 79.8 P 62.4 27.8%
Noncurrent Liabilities 147.0 147.2 -0.1%
Total Liabilities 226.8 209.6 8.2%
Total Equity 222.3 197.8 12.4%
Total Liabilities and
Equity
P 449.1
P 407.4
10.2%
On the Balance Sheet side, consolidated total assets as of December 31, 2011 amounted to P449.1
billion, higher by 10.2% from P407.4 billion in previous year. On the other hand, consolidated
total liabilities grew by 8.2% to P226.8 billion in 2011 from P209.6 billion in previous year.
Total current assets decreased by 2.9% to P101.3 billion as of December 31, 2011 from P104.3
billion as of last year. Cash and cash equivalents decreased by 16.3% to P56.1 billion in 2011
from P67.0 billion in 2010 mainly due to payments for investment acquisitions and capital
expenditures. This was partially offset by the increase in receivables by 19.7% to P11.8 billion
from P9.8 billion primarily due to increase in receivable from tenants and real estate buyers.
Merchandise inventories increased by 28.1% to P13.4 billion from P10.5 billion primarily due to
new departments stores, supermarkets, savemore and hypermarkets. Other current assets
increased by 21.6% to P17.2 billion from P14.1 billion resulting mainly from the advances to
contractors of the real estate group from its current projects.
Total consolidated noncurrent assets amounted to P347.8 billion as of December 31, 2011, a
growth of 14.7% from P303.1 billion as of December 31, 2010. Investments available for sale
increased by 12.2% to P12.4 billion in 2011 from P11.1 billion in 2010 mainly due to additional
investments in bonds during the year. Investments in shares of stock increased by 24.8% to P88.4

- 34 -
billion in 2011 from P70.9 billion in 2010 mainly due to additional investment in and purchase of
shares of stock of associates, increase in equity in banks and additional share in the unrealized
gain on AFS investments of associates in 2011. The increase in investment properties, property
and equipment and land and development by 15.5% or P17.6 billion, 12.9% or P1.7 billion and
16.8% or P3.3 billion, respectively, arose from new mall constructions, real estate developments
and purchase of commercial lots in 2011. Deferred tax assets increased by 20.5% to P0.7 billion
in 2011 from P0.6 billion in 2010 mainly due to tax effect of unrealized foreign exchange loss,
unamortized past service cost and defined benefit liability and accrued leases. Other noncurrent
assets increased by 14.4% to P24.1 billion from P21.0 billion mainly due to the non-current
receivable from real estate buyers.
Total consolidated current liabilities increased by 27.8 % to P79.8 billion as of December 31,
2011 mainly due to availment of bank loans which increased by 26.2% to P25.7 billion in 2011
from P20.4 billion in 2010 and increase in accounts payable and other current liabilities by 14.6%
to P44.7 billion in 2011 from P39.0 billion in 2010 mainly arising from trade transactions,
subscriptions payable and accrued expenses. See note 17 to the audited consolidated financial
statements for further discussion regarding bank loans. Income tax payable increased by 12.3% to
P1.3 billion in 2011 from P1.2 billion in 2010 mainly due to higher taxable income in 2011. The
348.3% or P6.2 billion increase in current portion of long-term debt is mainly due to the
reclassification from Long-term debt of loans which will mature in 2011. See note 19 to the
audited consolidated financial statements for further discussion regarding long-term debt. The
5.8% increase in dividends payable represents dividends to minority stockholders of certain
subsidiaries.
Total Noncurrent Liabilities slightly decreased by P0.1 billion to P147.0 billion in 2011 from
P147.2 billion in 2010. Defined benefit liability decreased by P0.1 billion or 57.1% to P0.1
billion from P0.2 billion in 2010. Deferred tax liabilities decreased by 2.8% to P4.5 billion in
2011 from P4.6 billion in 2010. Noncurrent derivative liability decreased by 82.4% to P0.2 billion
from P1.4 billion mainly due to non-deliverable forwards entered into in 2010 which matured in
2011 and unwinding of interest rate swaps as a result of the prepayment of the underlying loans.
See note 29 to the audited consolidated financial statements for further discussion regarding
derivative transactions. Long-term debt – net of current portion decreased by P0.1 billion or 0.1%
to P128.5 billion in 2011 from P128.6 billion in 2010. See note 19 to the audited consolidated
financial statements for further discussion regarding long-term debt. These were partially offset
by the increase in Tenants’ deposits and others by 10.8% to P13.7 billion in 2011 from P12.4
billion in 2010 mainly due to new malls and expansions and from new condominium projects of
the real estate group.
Total equity amounted to P222.3 billion as of December 31, 2011, while total Equity attributable
to equity holders of the parent amounted to P157.7 billion. The 48.0% or P0.1 billion increase in
cumulative translation adjustment is related to the translation of the financial accounts of SM
China malls from China Yuan Renminbi to Philippine peso. Minority interest increased by 14.8%
to P64.6 billion in 2011 from P56.3 billion in 2010 mainly due to increase in net assets of certain
subsidiaries. See Note 20 to the audited consolidated financial statements for further discussion
regarding Equity.
The Company has no known direct or contingent financial obligation that is material to the
Company operations, including any default or acceleration of an obligation. The Company has no
off-balance sheet transactions, arrangements, obligations during the reporting year and as of the
balance sheet date.
There are no known trends, events, material changes, seasonal aspects or uncertainties that are
expected to affect the company’s continuing operations.
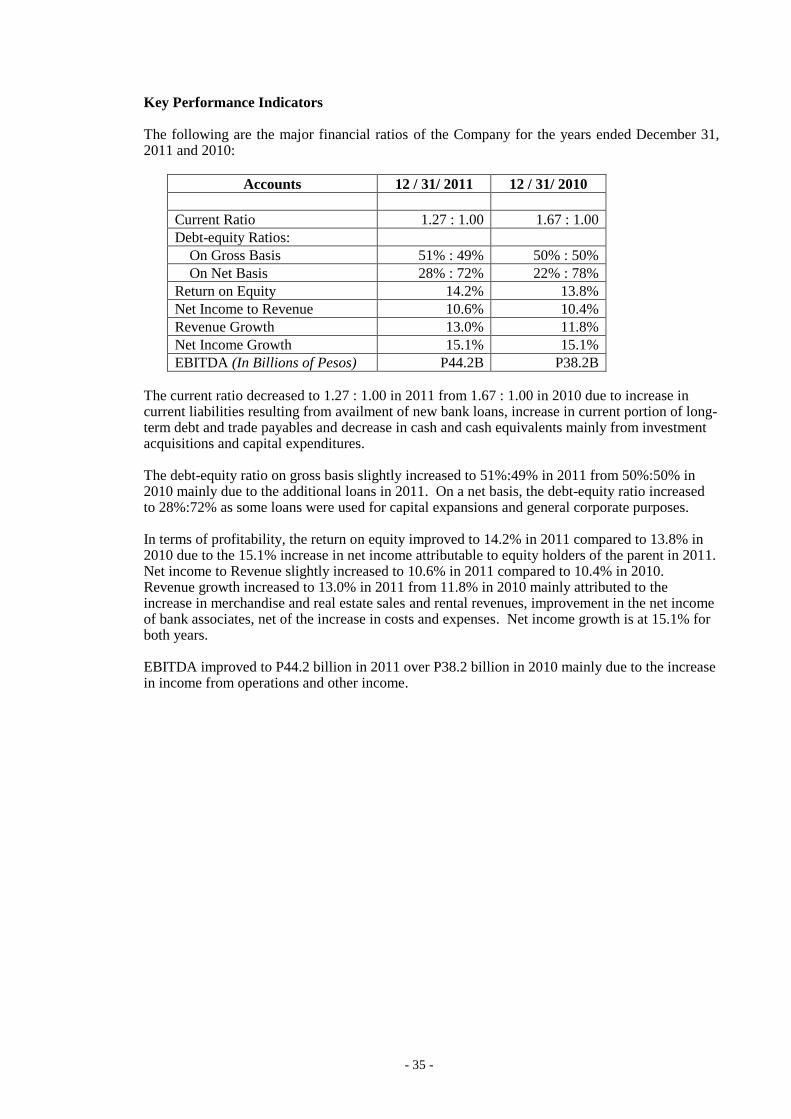
- 35 -
Key Performance Indicators The following are the major financial ratios of the Company for the years ended December 31, 2011 and 2010:
Accounts 12 / 31/ 2011 12 / 31/ 2010
Current Ratio 1.27 : 1.00 1.67 : 1.00
Debt-equity Ratios:
On Gross Basis 51% : 49% 50% : 50%
On Net Basis 28% : 72% 22% : 78%
Return on Equity 14.2% 13.8%
Net Income to Revenue 10.6% 10.4%
Revenue Growth 13.0% 11.8%
Net Income Growth 15.1% 15.1%
EBITDA (In Billions of Pesos) P44.2B P38.2B
The current ratio decreased to 1.27 : 1.00 in 2011 from 1.67 : 1.00 in 2010 due to increase in current liabilities resulting from availment of new bank loans, increase in current portion of long-term debt and trade payables and decrease in cash and cash equivalents mainly from investment acquisitions and capital expenditures. The debt-equity ratio on gross basis slightly increased to 51%:49% in 2011 from 50%:50% in 2010 mainly due to the additional loans in 2011. On a net basis, the debt-equity ratio increased to 28%:72% as some loans were used for capital expansions and general corporate purposes. In terms of profitability, the return on equity improved to 14.2% in 2011 compared to 13.8% in 2010 due to the 15.1% increase in net income attributable to equity holders of the parent in 2011. Net income to Revenue slightly increased to 10.6% in 2011 compared to 10.4% in 2010. Revenue growth increased to 13.0% in 2011 from 11.8% in 2010 mainly attributed to the increase in merchandise and real estate sales and rental revenues, improvement in the net income of bank associates, net of the increase in costs and expenses. Net income growth is at 15.1% for both years. EBITDA improved to P44.2 billion in 2011 over P38.2 billion in 2010 mainly due to the increase in income from operations and other income.
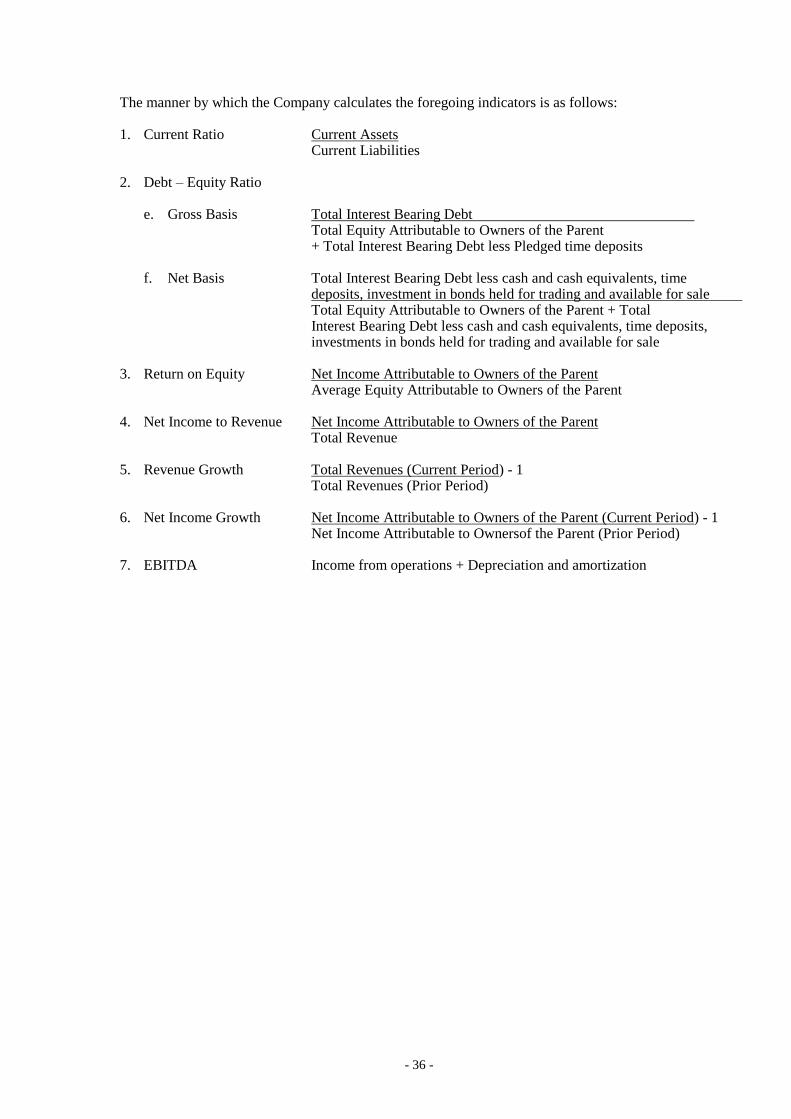
- 36 -
The manner by which the Company calculates the foregoing indicators is as follows: 1. Current Ratio Current Assets Current Liabilities 2. Debt – Equity Ratio
e. Gross Basis Total Interest Bearing Debt Total Equity Attributable to Owners of the Parent + Total Interest Bearing Debt less Pledged time deposits
f. Net Basis Total Interest Bearing Debt less cash and cash equivalents, time deposits, investment in bonds held for trading and available for sale Total Equity Attributable to Owners of the Parent + Total Interest Bearing Debt less cash and cash equivalents, time deposits, investments in bonds held for trading and available for sale 3. Return on Equity Net Income Attributable to Owners of the Parent Average Equity Attributable to Owners of the Parent 4. Net Income to Revenue Net Income Attributable to Owners of the Parent Total Revenue 5. Revenue Growth Total Revenues (Current Period) - 1 Total Revenues (Prior Period) 6. Net Income Growth Net Income Attributable to Owners of the Parent (Current Period) - 1 Net Income Attributable to Ownersof the Parent (Prior Period)
7. EBITDA Income from operations + Depreciation and amortization
- 37 -
Expansion Plans / Prospects for the Future
For 2012, SM Prime plans to open SM City Lanang in Davao City, SM City General Santos in South
Cotabato, SM City Consolacion in Cebu, SM City Olongapo in Zambales, SM City San Fernando in
Pampanga and SM Chongqing in China.
By the end of 2012, SM Prime will have 46 malls in the Philippines and five in China with an
estimated combined GFA of 6.4 million sqm.
Retail expansion plans for 2012 include the opening of five department stores, six supermarkets, 21
SaveMore branches and five hypermarkets.
SMDC currently has 15 residential projects under its SM Residences brand and two projects under
the M Place brand. In order to sustain the growth momentum and to further expand the SMDC’s
presence in the industry, SMDC will continue to vigorously pursue its vision of uplifting the Filipino
lifestyles by launching products that will meet the demand for affordable and high quality residential
units in prime locations and will also pursue projects that will cater to the preferences and financial
capacity of its target market. Innovation shall remain to be its strength while continuously focusing
attention to changing market needs. The broadening and strengthening of its revenue base shall also
be pursued as it moves forward.
For the year 2012, SMDC is targeting to launch five new projects in various cities within Metro
Manila. In addition, it shall continue to search for viable locations in key cities in Metro Manila in
response to the increasing demands for residences. SMDC shall be open to tapping various sources
of financing to support its operational needs in real estate development.
The Miranda and Carola clusters of Costa Del Hamilo are targeted to be completed 1st quarter of
2012.
SM Hotels is currently developing Park Inn by Radisson Davao, which will be the very first “Park
Inn by Radisson” in the Asia Pacific region. The Park Inn brand is one of the hotel brands under
Carlson and is the largest mid-market brand for hotels under development in Europe. Park Inn by
Radisson Davao hotel project is approximately a 204-room hotel located in Lanang, Davao City. The
hotel is scheduled to open in the first quarter of 2013.
The above expenditures will be funded through internally generated sources and other capital raising
initiatives such as bond issuances and loan availments.
The Company has no known direct or contingent financial obligation that is material to the Company,
including any default or acceleration of an obligation. There were no contingent liabilities or assets
in the Company’s balance sheet. The Company has no off-balance sheet transactions, arrangements,
obligations during the reporting year as of balance sheet date.
There are no known trends, events, material changes, seasonal aspects or uncertainties that are
expected to affect the Company’s continuing operations.

- 38 -
ITEM 7. Financial Statements
Please see the attached consolidated financial statements and schedules listed in the
accompanying Index to Financial Statements and Supplementary Schedules (page 1 – 142).
ITEM 8. Changes in and Disagreements With Accountants on Accounting and
Financial Disclosure
There were no changes in and disagreements with accountants on accounting and financial disclosure.
Independent Public Accountants, External Audit Fees and Services Sycip, Gorres, Velayo & Company is the external auditor for the current year. The same external auditor will be recommended for re-appointment at the scheduled stockholders’ meeting. Representatives of the said firm are expected to be present at the stockholders’ meeting and they will have the opportunity to make a statement if they desire to do so and are expected to be available to respond to appropriate questions. Pursuant to SRC Rule 68, Paragraph 3 (b) (iv) and (ix) (Rotation of External Auditors) which states that the signing partner shall be rotated after every five (5) years of engagement with a two-year cooling off period for the re-engagement of the same signing partner, the Company engaged Ms. Belinda Beng Hui of SGV & Co. for the examination of the Company’s financial statements from 2008 to 2012. Previously, the Company engaged Mr. Ramon D. Dizon, Ms. Melinda G. Manto and Mr. Joel M. Sebastian of SGV & Co. for the examination of the Company’s financial statements from 2008 to 2012, 2006 to 2007 and 2001 to 2005, respectively.
The aggregate fees billed for each of the last two fiscal years for professional services rendered by
the external auditor were P2,100,000 and P1,800,000 for 2013 and 2012, respectively. The audit
fees for 2014 is estimated to be at P2,200,000. Services rendered include the audit of the financial
statements and supplementary schedules for submission to SEC, and assistance in the preparation of
annual income tax returns. Also, in 2012, SGV rendered other professional services relating to the
bond issuances of SMIC and none in 2013. The professional fees amounted to P20.2 million in 2012
and nil in 2013. There were no other professional services rendered by SGV & Co. during the
period. Tax consultancy services are secured from other entities other than the external auditor.
The Audit Committee recommends to the Board of Directors the appointment of the external auditor
and the fixing of the audit fees. The Board of Directors and stockholders approve the Audit
Committee’s recommendation.

- 39 -
PART III- CONTROL AND COMPENSATION INFORMATION
ITEM 9. Directors and Executive Officers of the Registrant
The incumbent Directors and Executive Officers of the Company are as follows:
Office Name Age Citizenship
Chairman Henry Sy, Sr. 89 Filipino
Vice Chairman Teresita T. Sy 63 Filipino
Vice Chairman Henry T. Sy, Jr. 60 Filipino
Director and President Harley T. Sy 54 Filipino
Director and Executive
Vice President and CFO Jose T. Sio 74 Filipino
Independent Director Vicente S. Perez, Jr. 55 Filipino
Independent Director Ah Doo Lim 64 Singaporean
Independent Director Joseph R. Higdon 72 American
Treasurer Grace F. Roque 63 Filipino
Senior Vice President,
Corporate Legal Affairs,
Compliance Officer and
Asst. Corp. Sec.
Corazon I. Morando 72 Filipino
Senior Vice President -
Finance
Franklin C. Gomez 44 Filipino
Senior Vice President -
Corporate Services
Elizabeth Anne C. Uychaco 58 Filipino
Senior Vice President - Taxes Cecilia Reyes-Patricio 56 Filipino
Senior Vice President - Legal Marianne Malate-Guerrero 49 Filipino
Senior Vice President -
Investor Relations
Corazon P. Guidote 53 Filipino
Senior Vice President -
Investments Portfolio
Frederic C. DyBuncio 54 Filipino
Corporate Secretary Emmanuel C. Paras 64 Filipino
MANAGEMENT
Board of Directors
The Directors of the Company are elected at the annual stockholders’ meeting to hold office until the
next succeeding annual meeting and until their respective successors have been appointed or elected
and qualified.
The following are the business experience/s of the Company’s Directors during the last five years:
Henry Sy, Sr., is the Chairman of the Board of Directors of SMIC. He is the founder of the SM
Group and is currently Chairman of SM Prime, SM Development, and Highlands Prime Inc., among
others. Mr. Sy opened the first ShoeMart store in 1958 and has since evolved into a dynamic group
of companies with five lines of businesses - shopping malls, retail, financial services, real estate
development and tourism, hotels and conventions. He is likewise Chairman Emeritus of BDO
Universal Bank, Inc. and Honorary Chairman of China Banking Corporation.

- 40 -
Teresita T. Sy, is the Vice Chairperson of SMIC. She has varied experiences in retail merchandising,
mall development and banking businesses. A graduate of Assumption College, she was actively
involved in Shoemart’s development. At present, she is the Chairman of the Board of Directors of
BDO Unibank, Inc. She also holds board positions in several companies within the SM Group.
Henry T. Sy, Jr., is the Vice Chairman of SMIC. He is also the Vice Chairman – President of
Highlands Prime, Inc., Vice Chairman of SM Development Corporation, Director of SM Prime
Holdings, Inc. and BDO Unibank, Inc. He is likewise the President of National Grid Corporation of
the Philippines. He is responsible for the real estate acquisitions and development activities of the
SM Group which include the identification, evaluation and negotiation for potential sites as well as
the input of design ideas. He graduated with a Management degree from De La Salle University.
Harley T. Sy, is the President of SMIC. He is a Director of China Banking Corporation and other
companies within the SM Group and Adviser to the Board of Directors of BDO Private Bank. He is
the Executive Vice-president for Merchandising of SM Retail, Inc. He holds a degree in Bachelor of
Science, Major in Finance from De La Salle University.
Jose T. Sio, is the Executive Vice President and Chief Finance Officer of SMIC. He is also a
Director of China Banking Corporation, Belle Corporation, SM Keppel Land, Inc., Manila North
Tollways Corporation, and Atlas Consolidated Mining and Development Corporation as well as other
companies within the SM Group. Mr. Sio is also Adviser to the Board of Directors of BDO Unibank,
Inc. and SM Development Corporation. Mr. Sio holds a master’s degree in Business Administration
from New York University, is a certified public accountant and was formerly a senior partner at
Sycip Gorres Velayo & Co.
Vicente S. Perez, Jr. *, is an Independent Director of SMIC. His career has ranged from
international banker, debt trader, investment bank partner, private equity investor to cabinet
secretary. He is the Chief Executive Officer of Alternergy Partners, a renewable power company for
emerging Asian countries, Chairman of Merritt Partners, an energy advisory firm, and Vice-
Chairman of Ten Knots Philippines, the resort operating company of El Nido Resorts. He was the
youngest and longest serving Secretary of the Department of Energy. He had also briefly served as
Undersecretary for Industry and Investments at the Department of Trade and Industry and Managing
Head of the Board of Investments. He is Chairman of WWF Philippines and member of the WWF-
International Board. Mr. Perez is a member of the advisory boards of Coca-Cola FEMSA Phils.,
Pictet Clean Energy Fund, Roxas Holdings, and Yale Center for Business and Environment. He
obtained his master’s degree in Business Administration from the Wharton School of the University
of Pennsylvania, and his bachelor’s degree in Business Economics from the University of the
Philippines. He was a 2005 World Fellow at Yale University where he lectured an MBA Class on
renewable power in emerging countries.
Ah Doo Lim *, a Singaporean, is an Independent Director of SMIC. He is currently a Director and
Chairman of the Audit Committee of Sembcorp Marine Ltd., a world leading rig builder in the
offshore marine and engineering sector, and of ARA-CWT Trust Management (Cache) Ltd., GP
Industries Ltd., Linc Energy Limited, and U Mobile Sdn Bhd. He is also a Director of Sateri
Holdings Limited, a world leader in the specialty cellulose industry. He obtained a degree in
Engineering from Queen Mary College, University of London in 1971, and a Master’s Degree in
Business Administration from Cranfield School of Management, England in 1976.
Joseph R. Higdon*, an American, is an Independent Director of SMIC. Until his retirement, he was
a Senior Vice-President of Capital Research and Management Company, a United States investment
company. He joined Capital Research in 1974 and worked there until 2006. He analyzed Philippine
Stocks from 1989 until 2006. He was a US Peace Corps volunteer in the Philippines from 1962 to
1964. He is also an Independent Director of International Container Terminal Services, Inc. and
- 41 -
Security Bank Corporation. Until last year, he served as a member of the Advisory Board for the
Coca-Cola Bottling Company, Philippines.
* Independent director – the Company has complied with the Guidelines set forth by SRC (Securities
Regulation Code) Rule 38 regarding the Nomination and Election of Independent Director.. The Company’s
By-Laws incorporate the procedures for the nomination and election of independent director/s in accordance
with the requirements of the said Rule
Period of Directorship
Name Period Served
Henry Sy, Sr. 1960 to present
Teresita T. Sy 1979 to present
Henry T. Sy, Jr. 1979 to present
Harley T. Sy 1993 to present
Jose T. Sio 2005 to present
Vicente S. Perez, Jr. 2005 to present
Ah Doo Lim 2008 to present
Joseph R. Higdon 2010 to present
Executive Officers
Grace F. Roque is the Treasurer of SMIC. She is also the President and Chairman of Metro Manila
Shopping Mecca and President and Director of HFS Corporation and Mercantile Stores Group, Inc.
She holds a Bachelor Degree in Economics from Maryknoll College and a Masters in Business
Administration Degree from the University of the Philippines.
Corazon I. Morando, is Senior Vice President, Corporate Legal Affairs, Compliance Officer and
Assistant Corporate Secretary of SMIC. She is also the Vice President and Corporate Secretary of
China Banking Corporation and Corporate Secretary and Compliance Officer of Highlands Prime,
Inc.; Senior Vice President - Corporate Legal Affairs, Assistant Corporate Secretary and Compliance
Officer of SM Prime; and the Corporate Secretary of Pico de Loro Beach and Country Club, Inc. She
holds a Bachelor of Laws degree from the University of the Philippines and took up graduate studies
under the MBA-Senior Executive Program in the Ateneo de Manila University. She was formerly
Director of the Corporate and Legal Department of the Securities and Exchange Commission in the
Philippines.
Franklin C. Gomez is Senior Vice President for Finance of SMIC. Prior to joining SM Investments, Mr. Franklin Gomez spent over 20 years at Unilever where he held several senior
positions, his last being Finance Director and Chief Financial Officer of Unilever Indonesia since
May 2009. His previous senior posts in the same company include National Finance Director at
Unilever Philippines; Innovation and Learning Director at the Finance Excellence Centre in London;
and Finance Director of Selecta Wall’s Ice Cream, Philippines. Mr. Gomez holds a Bachelor of Arts
in Economics and BSC in Accounting from De La Salle University, Manila.
Elizabeth Anne C. Uychaco, is Senior Vice President, Corporate Services of SMIC. She is also a
Board Director of Belle Corporation, Megawide Construction Corporation, Republic Glass Holdings
Corp., Asia Pacific College, Generali Pilipinas Holding Company, Inc., and Premium Leisure &
Amusement, Inc. She was formerly Senior Vice President and Chief Marketing Officer of Philippine
American Life Insurance Company and Board Director of Philam Call Center. Prior to that, she was
Vice President of Globe Telecom, Inc., Kuok Philippine Properties, Inc. and Transnational
Diversified Corp. Ms. Uychaco graduated from St. Scholastica’s College in 1978 with a Bachelor of
Arts Degree. She obtained a Master’s Degree in Business Economics from the University of Asia
- 42 -
and Pacific in 1988 and a Master’s Degree in Business Administration from the Ateneo Business
School in 1992.
Cecilia Reyes-Patricio is the Senior Vice President, Corporate Tax Department of SMIC. Prior to
joining SMIC in 1988, she was a financial and tax auditor at SyCip, Gorres Velayo & Co. She holds
a Master of Science degree (with highest honors) in Commerce, Major in Taxation, from the Manuel
Luis Quezon University. A Certified Public Accountant, she graduated magna cum laude with a
Bachelor of Science degree in Business Administration from the University of the East.
Marianne Malate-Guerrero, is Senior Vice President, Legal Department Head of SMIC. She
formerly worked as Senior Vice President and Legal Department Head of United Overseas Bank
Philippines. Previous to that, she was Vice President and Legal Officer of Solidbank Corporation.
She began her practice with the law firm of Castillo Laman Tan & Pantaleon Law office. She
graduated from the Ateneo School of Law in 1988.
Corazon P. Guidote is Senior Vice President for Investor Relations of SMIC. She was formerly a
Presidential Consultant for Investor Relations and Executive Director of the Investor Relations
Office of the Republic of the Philippines. Prior to government service, she was a Director and Chief
Operating Officer of ABN AMRO Asia Securities Philippines, Group Vice President for Corporate
Communications and Investor Relations at Metro Pacific Corporation, and Managing Director of
Citibank Securities, Philippines, Inc and UBS Securities Phils., Inc. Ms. Guidote also served as
Equities Research Head in Peregrine Securities, Inc., Barclays de Zoete Wedd (BZW), and Vickers
da Costa. A Certified Public Accountant, Ms. Guidote is a Bachelor of Science graduate of the
University of Santo Tomas. She holds a Master in Applied Business Economics degree from the
University of Asia and the Pacific and is a Chevening Fellow of the United Kingdom Foreign and
Commonwealth Office. She is also a fellow at the Institute of Corporate Directors.
Frederic C. DyBuncio is Senior Vice President, Investments Portfolio of SMIC. Prior to joining
SMIC, he was a career banker who spent over 20 years with JPMorgan Chase and its predecessor
institutions. During his stint in the banking industry, he was assigned to various
managerial/executive positions where he gained substantial professional experience in the areas of
credit, relationship management and origination, investment banking, capital markets, and general
management. He has worked and lived in several major cities including New York, Seoul, Bangkok,
Hong Kong and Manila. He obtained his undergraduate degree in Business Management from the
Ateneo de Manila University, and his master’s degree in Business Administration from the Asian
Institute of Management.
Emmanuel C. Paras, is the Corporate Secretary of SMIC and other companies within the SM
Group. He holds a Bachelor of Law degree from Ateneo de Manila University and is a senior partner
and Head of the Corporate Services Department of the Sycip, Salazar, Hernandez and Gatmaitan Law
Offices.
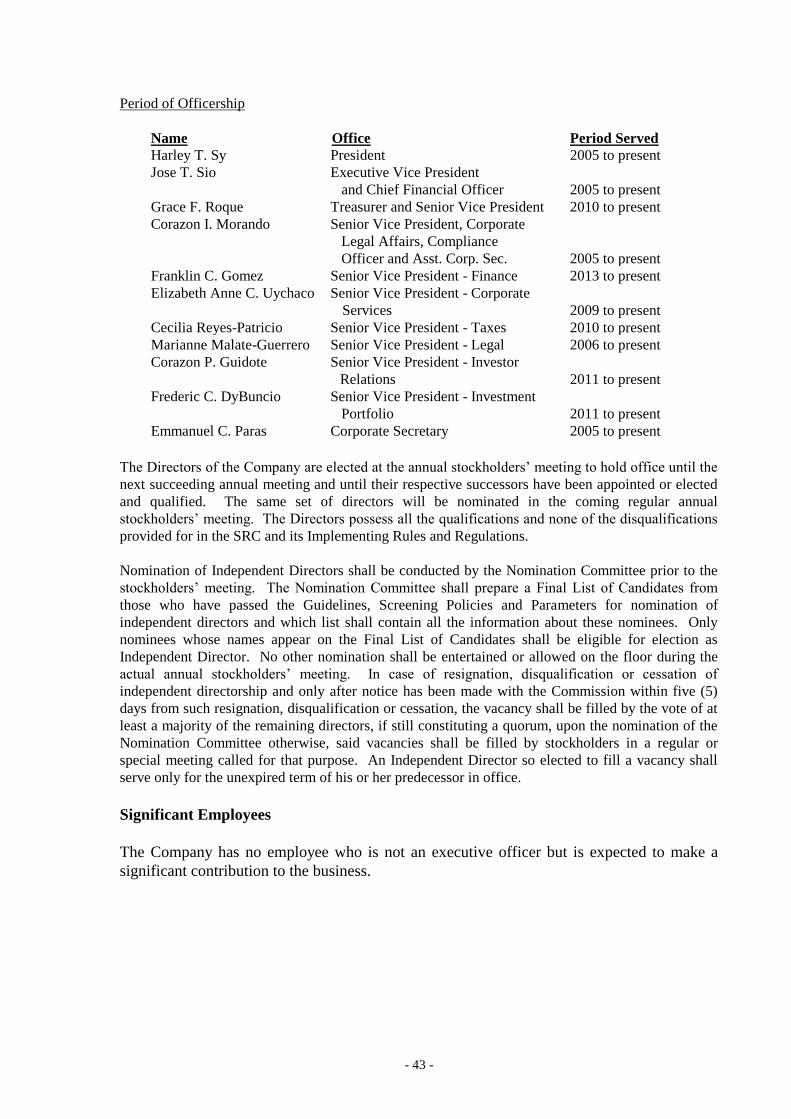
- 43 -
Period of Officership
Name Office Period Served
Harley T. Sy President 2005 to present
Jose T. Sio Executive Vice President
and Chief Financial Officer 2005 to present
Grace F. Roque Treasurer and Senior Vice President 2010 to present
Corazon I. Morando Senior Vice President, Corporate
Legal Affairs, Compliance
Officer and Asst. Corp. Sec.
2005 to present
Franklin C. Gomez Senior Vice President - Finance 2013 to present
Elizabeth Anne C. Uychaco Senior Vice President - Corporate
Services
2009 to present
Cecilia Reyes-Patricio Senior Vice President - Taxes 2010 to present
Marianne Malate-Guerrero Senior Vice President - Legal 2006 to present
Corazon P. Guidote Senior Vice President - Investor
Relations
2011 to present
Frederic C. DyBuncio Senior Vice President - Investment
Portfolio
2011 to present
Emmanuel C. Paras Corporate Secretary 2005 to present
The Directors of the Company are elected at the annual stockholders’ meeting to hold office until the
next succeeding annual meeting and until their respective successors have been appointed or elected
and qualified. The same set of directors will be nominated in the coming regular annual
stockholders’ meeting. The Directors possess all the qualifications and none of the disqualifications
provided for in the SRC and its Implementing Rules and Regulations.
Nomination of Independent Directors shall be conducted by the Nomination Committee prior to the
stockholders’ meeting. The Nomination Committee shall prepare a Final List of Candidates from
those who have passed the Guidelines, Screening Policies and Parameters for nomination of
independent directors and which list shall contain all the information about these nominees. Only
nominees whose names appear on the Final List of Candidates shall be eligible for election as
Independent Director. No other nomination shall be entertained or allowed on the floor during the
actual annual stockholders’ meeting. In case of resignation, disqualification or cessation of
independent directorship and only after notice has been made with the Commission within five (5)
days from such resignation, disqualification or cessation, the vacancy shall be filled by the vote of at
least a majority of the remaining directors, if still constituting a quorum, upon the nomination of the
Nomination Committee otherwise, said vacancies shall be filled by stockholders in a regular or
special meeting called for that purpose. An Independent Director so elected to fill a vacancy shall
serve only for the unexpired term of his or her predecessor in office.
Significant Employees
The Company has no employee who is not an executive officer but is expected to make a
significant contribution to the business.
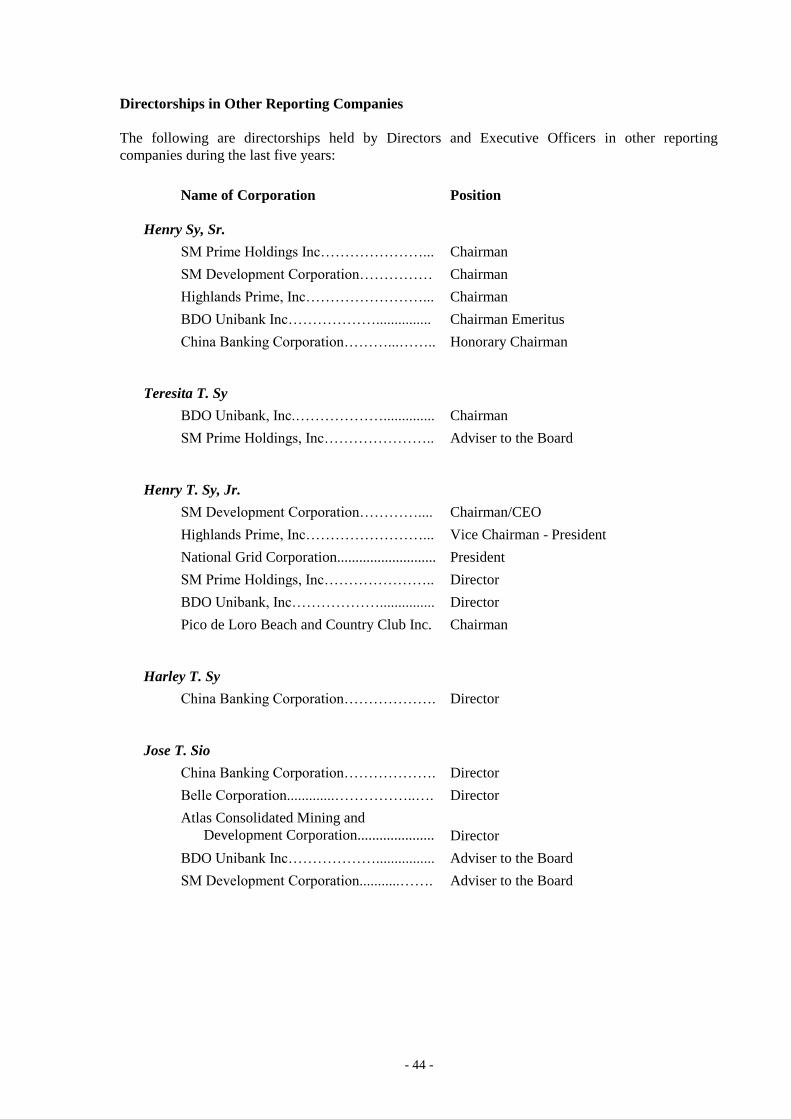
- 44 -
Directorships in Other Reporting Companies
The following are directorships held by Directors and Executive Officers in other reporting
companies during the last five years:
Henry Sy, Sr.
SM Prime Holdings Inc…………………... Chairman
SM Development Corporation…………… Chairman
Highlands Prime, Inc……………………... Chairman
BDO Unibank Inc………………............... Chairman Emeritus
China Banking Corporation………...…….. Honorary Chairman
Teresita T. Sy
BDO Unibank, Inc.……………….............. Chairman
SM Prime Holdings, Inc………………….. Adviser to the Board
Henry T. Sy, Jr.
SM Development Corporation………….... Chairman/CEO
Highlands Prime, Inc……………………... Vice Chairman - President
National Grid Corporation........................... President
SM Prime Holdings, Inc………………….. Director
BDO Unibank, Inc………………............... Director
Pico de Loro Beach and Country Club Inc. Chairman
Harley T. Sy
China Banking Corporation………………. Director
Jose T. Sio
China Banking Corporation………………. Director
Belle Corporation.............……………..…. Director
Atlas Consolidated Mining and
Development Corporation.....................
Director
BDO Unibank Inc………………................ Adviser to the Board
SM Development Corporation...........……. Adviser to the Board
Name of Corporation Position
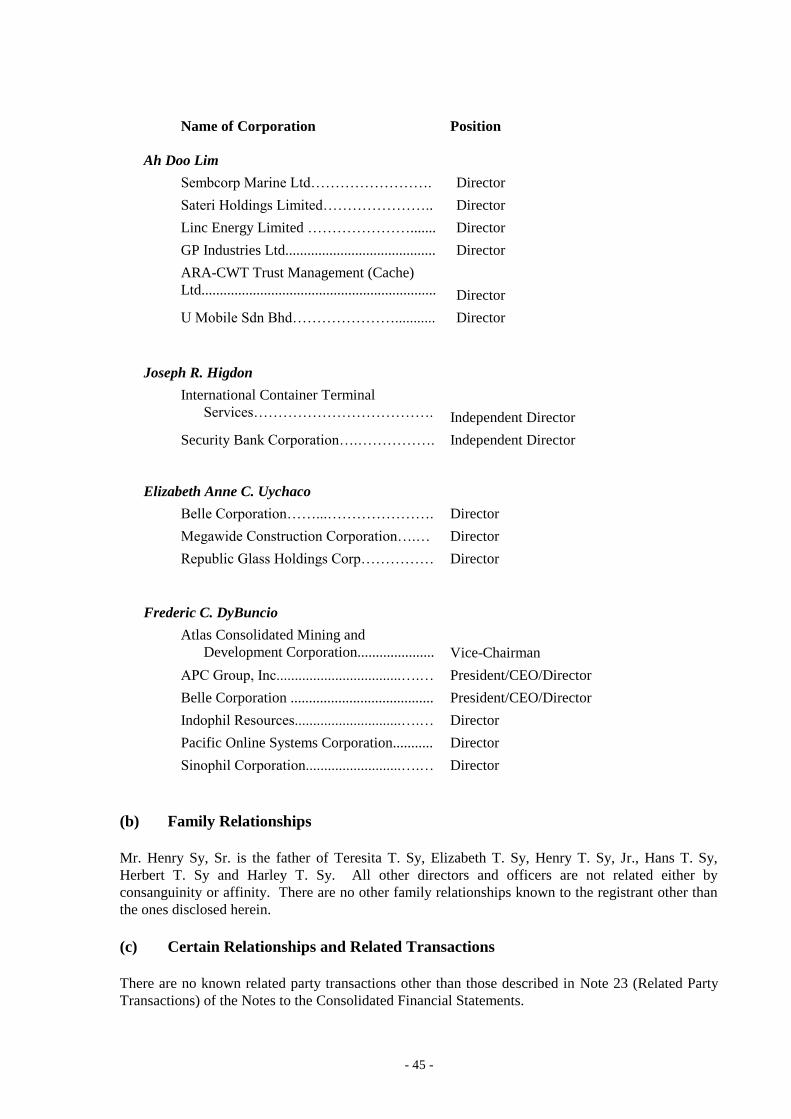
- 45 -
Name of Corporation Position
Ah Doo Lim
Sembcorp Marine Ltd……………………. Director
Sateri Holdings Limited………………….. Director
Linc Energy Limited …………………....... Director
GP Industries Ltd......................................... Director
ARA-CWT Trust Management (Cache)
Ltd................................................................
Director
U Mobile Sdn Bhd…………………........... Director
Joseph R. Higdon
International Container Terminal
Services……………………………….
Independent Director
Security Bank Corporation….……………. Independent Director
Elizabeth Anne C. Uychaco
Belle Corporation……...…………………. Director
Megawide Construction Corporation….… Director
Republic Glass Holdings Corp…………… Director
Frederic C. DyBuncio
Atlas Consolidated Mining and
Development Corporation.....................
Vice-Chairman
APC Group, Inc..................................….… President/CEO/Director
Belle Corporation ....................................... President/CEO/Director
Indophil Resources.............................….… Director
Pacific Online Systems Corporation........... Director
Sinophil Corporation..........................….… Director
(b) Family Relationships
Mr. Henry Sy, Sr. is the father of Teresita T. Sy, Elizabeth T. Sy, Henry T. Sy, Jr., Hans T. Sy,
Herbert T. Sy and Harley T. Sy. All other directors and officers are not related either by
consanguinity or affinity. There are no other family relationships known to the registrant other than
the ones disclosed herein.
(c) Certain Relationships and Related Transactions
There are no known related party transactions other than those described in Note 23 (Related Party
Transactions) of the Notes to the Consolidated Financial Statements.

- 46 -
(d) Involvement in Legal Proceedings
The Company is not aware of any of the following events having occurred during the past five years
up to the date of this report that are material to an evaluation of the ability or integrity of any
director, nominee for election as Director, executive officer, underwriter or controlling person of the
Company:
(1) any bankruptcy petition filed by or against any business of which such person was a general
partner or executive officer either at the time of the bankruptcy or within two years prior to
that time;
(2) any conviction by final judgment, including the nature of the offense, in a criminal
proceeding, domestic or foreign, or being subject to a pending criminal proceeding, domestic
or foreign, excluding traffic violations and other minor offenses;
(3) being subject to any order, judgment or decree, not subsequently reversed, suspended or
vacated, of any court of competent jurisdiction, domestic or foreign, permanently or
temporarily enjoining, barring suspending or otherwise limiting his involvement in any type
of business, securities, commodities or banking activities; and
(4) being found by a domestic or foreign court of competent jurisdiction (in a civil action), the
SEC or comparable foreign body, or a domestic or foreign exchange or other organized
trading market or self-regulatory organization, to have violated a securities or commodities
law or regulation, and the judgment has not been reversed, suspended or vacated.
(5) a securities or commodities law or regulation, and the judgment has not been reversed,
suspended or vacated.
ITEM 10. Compensation of Directors and Executive Officers
The aggregate compensation paid or incurred during the last two fiscal years and estimated to be paid
in the ensuing fiscal year to the Chief Executive Officer and executive officers of the Company are as
follows:
Name and Position
1. Harley T. Sy
President*
2. Jose T. Sio
Executive Vice President & CFO*
3. Elizabeth Anne C. Uychaco
Senior Vice President – Corporate Services*
4. Franklin C. Gomez
Senior Vice President – Finance*
5. Frederic C. Dybuncio
Senior Vice President - Investment Portfolio*
Summary Compensation Table
Year
Salary
Bonus
Other Annual
Compensation
*CEO and four Most 2014 (estimate) 59,000,000 10,000,000 2,000,000
Highly Compensated 2013 51,000,000 8,000,000 2,000,000
Executive Officers 2012 41,000,000 7,000,000 2,000,000
All other Officers and 2014 (estimate) 163,000,000 27,000,000 7,000,000
Directors as a group 2013 142,000,000 23,000,000 6,000,000
unnamed 2012 110,000,000 18,000,000 4,000,000
Aside from the aforementioned compensation, these officers do not receive any other form of remuneration.

- 47 -
There are no outstanding warrants or options held by directors and officers. There are no actions to be taken
with regard to election, any bonus or profit-sharing, change in pension/retirement plan, granting of or
extension of any options, warrants or rights to purchase any securities.
ITEM 11. Security Ownership of Certain Record and Beneficial Owners
as of February 28, 2014
As of February 28, 2014, the following are the owners of the Company’s common stock in excess of 5% of total outstanding shares:
Title of
Class
Name and Address of
Record Owner and
Relationship with Issuer
Name of
Beneficial Owner
and Relationship
with Record
Owner
Citizenship
No. of Shares
Held
Percent
( % )
Common
Felicidad T. Sy
(Shareholder of Issuer)
No. 63 Cambridge Circle,
Forbes Park, Makati City
Same as the
Record Owner
Filipino 40,730,173 5.12%
-do-
Teresita T. Sy
(Director and Vice
Chairperson)
No. 63 Cambridge Circle,
Forbes Park, Makati City
Same as the
Record Owner
Filipino 57,085,450 7.17%
-do-
Harley T. Sy
(Director and President)
No. 63 Cambridge Circle,
Forbes Park, Makati City
Same as the
Record Owner
Filipino 58,528,292 7.35%
-do-
Hans T. Sy
(Shareholder of Issuer)
No. 11 Harvard Road,
Forbes Park, Makati City
Same as the
Record Owner
Filipino 65,969,521 8.28%
-do-
Henry T. Sy, Jr.
(Director and Vice
Chairperson)
No. 63 Cambridge Circle,
Forbes Park, Makati City
Same as the
Record Owner
Filipino 58,460,450 7.34%
-do-
Herbert T. Sy
(Shareholder of Issuer)
No. 63 Cambridge Circle,
Forbes Park, Makati City
Same as the
Record Owner
Filipino 65,960,450 8.28%
-do-
Elizabeth T. Sy
(Shareholder of Issuer)
No. 63 Cambridge Circle,
Forbes Park, Makati City
Same as the
Record Owner
Filipino 46,722,988 5.87%
-do-
PCD Nominee Corp.
(Filipino)
Various clients 1 Filipino 46,022,368 5.78%
-do-
PCD Nominee Corp.
(Non-Filipino)
Various clients 1 Foreign 279,374,017 35.09%
(1) The Company has no information as to the beneficial owners of the shares of stocks held by PCD Nominee Corp. The
clients of PCD Nominee Corp. have the power to decide how their shares are to be voted.
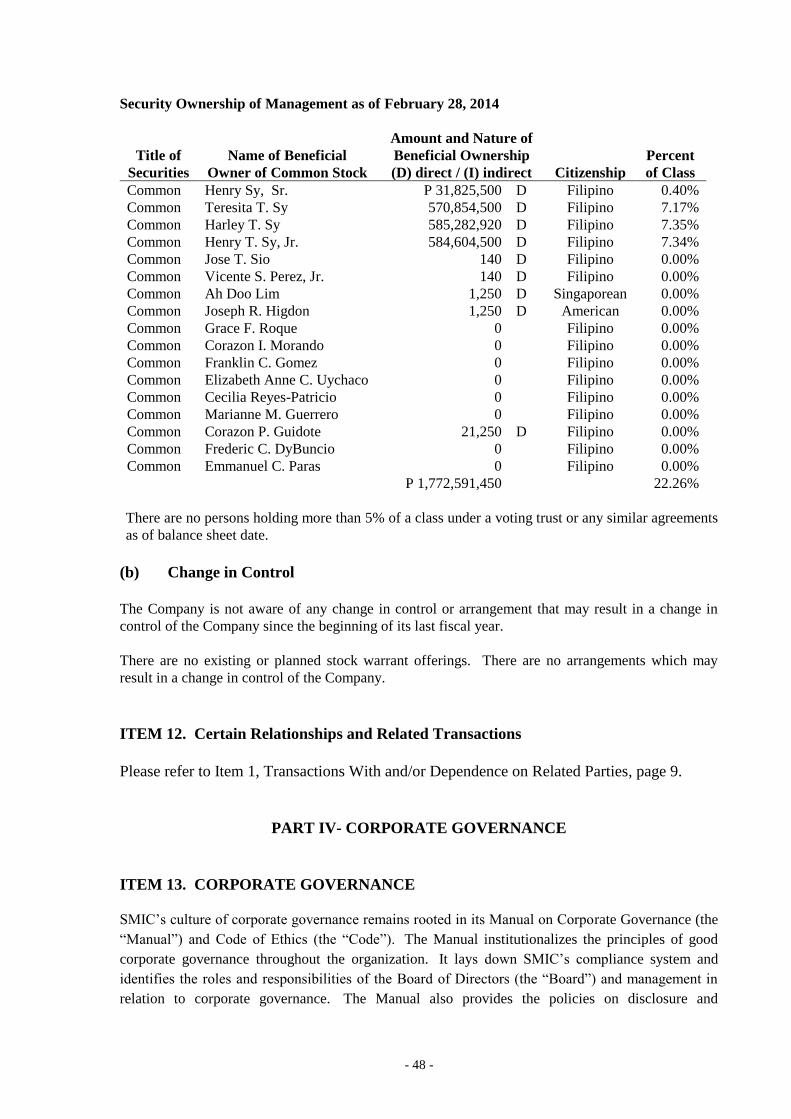
- 48 -
Security Ownership of Management as of February 28, 2014
Title of
Securities
Name of Beneficial
Owner of Common Stock
Amount and Nature of
Beneficial Ownership
(D) direct / (I) indirect Citizenship
Percent
of Class
Common Henry Sy, Sr. P 31,825,500 D Filipino 0.40%
Common Teresita T. Sy 570,854,500 D Filipino 7.17%
Common Harley T. Sy 585,282,920 D Filipino 7.35%
Common Henry T. Sy, Jr. 584,604,500 D Filipino 7.34%
Common Jose T. Sio 140 D Filipino 0.00%
Common Vicente S. Perez, Jr. 140 D Filipino 0.00%
Common Ah Doo Lim 1,250 D Singaporean 0.00%
Common Joseph R. Higdon 1,250 D American 0.00%
Common Grace F. Roque 0 Filipino 0.00%
Common Corazon I. Morando 0 Filipino 0.00%
Common Franklin C. Gomez 0 Filipino 0.00%
Common Elizabeth Anne C. Uychaco 0 Filipino 0.00%
Common Cecilia Reyes-Patricio 0 Filipino 0.00%
Common Marianne M. Guerrero 0 Filipino 0.00%
Common Corazon P. Guidote 21,250 D Filipino 0.00%
Common Frederic C. DyBuncio 0 Filipino 0.00%
Common Emmanuel C. Paras 0 Filipino 0.00%
P 1,772,591,450 22.26%
There are no persons holding more than 5% of a class under a voting trust or any similar agreements
as of balance sheet date.
(b) Change in Control
The Company is not aware of any change in control or arrangement that may result in a change in
control of the Company since the beginning of its last fiscal year.
There are no existing or planned stock warrant offerings. There are no arrangements which may
result in a change in control of the Company.
ITEM 12. Certain Relationships and Related Transactions
Please refer to Item 1, Transactions With and/or Dependence on Related Parties, page 9.
PART IV- CORPORATE GOVERNANCE
ITEM 13. CORPORATE GOVERNANCE
SMIC’s culture of corporate governance remains rooted in its Manual on Corporate Governance (the
“Manual”) and Code of Ethics (the “Code”). The Manual institutionalizes the principles of good
corporate governance throughout the organization. It lays down SMIC’s compliance system and
identifies the roles and responsibilities of the Board of Directors (the “Board”) and management in
relation to corporate governance. The Manual also provides the policies on disclosure and

- 49 -
transparency, the conduct of communication and training programs on corporate governance, the
rights and equitable treatment of shareholders and the protection of SMIC’s stakeholders. There
have been no deviations from the Manual since its adoption.
The Code reflects SMIC’s mission, vision and values and serves as a guiding principle for SMIC’s
directors, officers and employees in the performance of their duties and responsibilities. Primarily,
the Code regulates the relationships and treatment that directors, officers and employees should
employ when dealing with customers, investors, creditors, contractors, supplies, regulators, the
public and the other various stakeholders of the company. To align with the Code, SMIC has
adopted several supplemental policies, such as the Guidelines on Acceptance of Gifts, the Insider
Trading Policy and the Policy on Accountability, Integrity and Vigilance (PAIV), to name a few.
SMIC continues to keep pace with best practice in corporate governance through the continuous
review and development of its policies and programs.
SMIC’s Board of Directors remains the driving force behind the company’s corporate governance
development. All directors and members of senior management have undergone training on
corporate governance. The Board is composed of eight (8) directors, three (3) of which are Non-
Executive Independent Directors, namely, Mr. Vicente S. Perez, Jr., Mr. Ah Doo Lim and Mr. Joseph
R. Higdon. An SMIC independent directors must be independent of Management, substantial
shareholdings and material relations, whether it be business or otherwise, which could reasonably be
perceived to impede the performance of independent judgment. Furthermore, none of SMIC’s
independent directors have served the Company as a regular director, officer or employee. SMIC’s
independent directors provide balance at the board-level by ensuring impartial discussions during
meetings, monitoring and challenging the performance of Management, and by safeguarding the
interests of the Company’s stakeholders.
Since the establishment of its corporate governance culture, SMIC has been recipient to numerous
awards and citations for its good governance programs and policies. Corporate Governance Asia
(CG Asia) a regional publication out of Hong Kong, has annually recognized SMIC as one of the best
in corporate governance in the Philippines. The Asset, a multi-media entity that serves the Asian
financial markets, has also awarded SMIC with its prestigious Platinum Award for all-around
excellence in management, financial performance, corporate governance, social and environmental
responsibility and investor relations for five (5) consecutive years.
SMIC continues to move forward with the development of its corporate governance culture and is
steadfast in keeping pace with global best practice.

- 50 -
PART V- EXHIBITS AND SCHEDULES
ITEM 14. Exhibits and Reports on SEC Form 17-C
(a) Exhibits - See accompanying Index to Exhibits (page 51).
The following exhibit is filed as a separate section of this report:
(18) Subsidiaries of the Registrant
The other exhibits, as indicated in the Index to Exhibits are either not applicable to
the Company or require no answer.
(b) Reports on SEC Form 17-C
Reports on SEC Form 17-C (Current Report) have been filed during the last six
months period covered by this report.

- 51 -
INDEX TO EXHIBITS
Form 17-A
No. Page No.
(3) Plan of Acquisition, Reorganization, Arrangement,
Liquidation, or Succession *
(5) Instruments Defining the Rights of Security Holders,
Including Indentures *
(8) Voting Trust Agreement *
(9) Material Contracts *
(10) Annual Report to Security Holders, Form 11-Q or
Quarterly Report to Security Holders *
(13) Letter re Change in Certifying Accountant *
(16) Report Furnished to Security Holders *
(18) Subsidiaries of the Registrant 52
(19) Published Report Regarding Matters Submitted to Vote
of Security Holders *
(20) Consent of Experts and Independent Counsel *
(21) Power of Attorney *
(29) Additional Exhibits *
_______
* These Exhibits are either not applicable to the Company or require no answer.

- 52 -
EXHIBIT 18 SUBSIDIARIES OF THE REGISTRANT
Please refer to Note 2 of the accompanying Notes to the Consolidated Financial Statements
for details.

- 53 -
SM INVESTMENTS CORPORATION AND SUBSIDIARIES
INDEX TO THE FINANCIAL STATEMENTS
AND SUPPLEMENTARY SCHEDULES
FORM 17-A, ITEM 7
Consolidated Financial Statements Page No.
Statement of Management’s Responsibility for Financial Statements
Independent Auditors’ Report
Consolidated Balance Sheets as at December 31, 2013 and 2012
Consolidated Statements of Income
For the years ended December 31, 2013, 2012 and 2011
Consolidated Statements of Comprehensive Income
For the years ended December 31, 2013, 2012 and 2011
Consolidated Statements of Changes in Stockholders’ Equity
For the years ended December 31, 2013, 2012 and 2011
Consolidated Statements of Cash Flows
For the years ended December 31, 2013, 2012 and 2011
Notes to Consolidated Financial Statements
Supplementary Schedules
Independent Auditors’ Report on Supplementary Schedules 114
SRC Annex 68-E Schedules
A. Financial Assets 115
B. Amounts Receivable from Directors, Officers, Employees, Related
Parties and Principal Stockholders (Other than Related parties) *
C. Amounts Receivable from Related Parties which are eliminated during
the Consolidation of Financial Statements 118
D. Intangible Assets - Other Assets 124
E. Long-term Debt 125
F. Indebtedness to Related Parties *
G. Guarantees of Securities of Other Issuers *
H. Capital Stock 127
Computation of Public Ownership 128
Financial Ratios - Key Performance Indicators 131
Reconciliation of Retained Earnings for Dividend Declaration 132
Conglomerate Map 133
Tabular Schedule of Effective Standards and Interpretations under the PFRS 137
*These schedules, which are required by SRC Rule 68.1, As Amended (2011), have been omitted because
they are either not applicable or the information required to be presented is included in the Company's
consolidated financial statements or the notes to consolidated financial statements.
*

1 6 3 4 2
SEC Registration Number
S M I N V E S T M E N T S C O R P O R A T I O N A N D S U
B S I D I A R I E S
(Company’s Full Name)
1 0 t h F l o o r , O n e E - C o m C e n t e r , H a r
b o r D r i v e , M a l l o f A s i a C o m p l e x ,
C B P - 1 A , P a s a y C i t y 1 3 0 0
(Business Address: No. Street
City/Town/Province)
Jose T. Sio 857-0105 (Contact Person) (Company Telephone Number)
1 2 3 1 A A C F S 0 4 3 0
Month Day (Form Type) Month Day (Fiscal Year) (Annual Meeting)
(Secondary License Type, If Applicable)
Dept. Requiring this Doc. Amended Articles Number/Section
Total Amount of Borrowings
Total No. of Stockholders Domestic Foreign
To be accomplished by SEC Personnel concerned
File Number LCU
Document ID Cashier
S T A M P S
Remarks: Please use BLACK ink for scanning purposes.
COVER SHEET
STATEMENT OF MANAGEMENT‘S RESPONSIBILITY
FOR FINANCIAL STATEMENTS
The management of SM Investments Corporation and Subsidiaries (the Group) is responsible for the
preparation and fair presentation of the consolidated financial statements as at December 31, 2013 and
2012 and for each of the three years in the period ended December 31, 2013, including the additional
components attached therein, in accordance with the Philippine Financial Reporting Standards. This
responsibility includes designing and implementing internal controls relevant to the preparation and fair
presentation of the consolidated financial statements that are free from material misstatement, whether
due to fraud or error, selecting and applying appropriate accounting policies, and making accounting
estimates that are reasonable in the circumstances.
The Board of Directors reviews and approves the consolidated financial statements and submits the
same to the stockholders.
SyCip Gorres Velayo & Co., the independent auditors, appointed by the stockholders has examined the
consolidated financial statements of SM Investments Corporation and Subsidiaries in accordance with
the Philippine Standards on Auditing, and in its report to the stockholders, has expressed its opinion on
the fairness of presentation upon completion of such examination.
TERESITA T. SY HARLEY T. SY JOSE T. SIO
Vice Chairperson of the Board President Chief Financial Officer
Signed this 3rd day of March 2014.

- 2 -
REPUBLIC OF THE PHILIPPINES ) MAKATI CITY ) SUBSCRIBED AND SWORN to before this _______at Makati City, affiants exhibiting to me their Community Tax Certificates, as follows: NAMES C.T. CERT. NO./ DATE OF ISSUE PLACE OF ISSUE PASSPORT NO. TERESITA T. SY 10712237 February 14, 2014 Manila HARLEY T. SY 10712243 February 14, 2014 Manila JOSE T. SIO EB5104390 April 11, 2012 Manila

*SGVFS004197*
INDEPENDENT AUDITORS’ REPORT
The Stockholders and the Board of DirectorsSM Investments Corporation10th Floor, One E-Com CenterHarbor Drive, Mall of Asia ComplexCBP-1A, Pasay City 1300
We have audited the accompanying consolidated financial statements of SM Investments Corporationand Subsidiaries, which comprise the consolidated balance sheets as at December 31, 2013 and 2012,and the consolidated statements of income, statements of comprehensive income, statements ofchanges in equity and statements of cash flows for each of the three years in the period endedDecember 31, 2013, and a summary of significant accounting policies and other explanatoryinformation.
Management’s Responsibility for the Consolidated Financial Statements
Management is responsible for the preparation and fair presentation of these consolidated financialstatements in accordance with Philippine Financial Reporting Standards, and for such internal controlas management determines is necessary to enable the preparation of the consolidated financialstatements that are free from material misstatement, whether due to fraud or error.
Auditors’ Responsibility
Our responsibility is to express an opinion on these consolidated financial statements based on ouraudits. We conducted our audits in accordance with Philippine Standards on Auditing. Thosestandards require that we comply with ethical requirements and plan and perform the audit to obtainreasonable assurance about whether the consolidated financial statements are free from materialmisstatement.
An audit involves performing procedures to obtain audit evidence about the amounts and disclosuresin the consolidated financial statements. The procedures selected depend on the auditors’ judgment,including the assessment of the risks of material misstatement of the consolidated financial statements,whether due to fraud or error. In making those risk assessments, the auditor considers internal controlrelevant to the entity’s preparation and fair presentation of the consolidated financial statements inorder to design audit procedures that are appropriate in the circumstances, but not for the purpose ofexpressing an opinion on the effectiveness of the entity’s internal control. An audit also includesevaluating the appropriateness of accounting policies used and the reasonableness of accountingestimates made by management, as well as evaluating the overall presentation of the consolidatedfinancial statements.
We believe that the audit evidence we have obtained are sufficient and appropriate to provide a basisfor our audit opinion.
SyCip Gorres Velayo & Co.6760 Ayala Avenue1226 Makati CityPhilippines
Tel: (632) 891 0307Fax: (632) 819 0872ey.com/ph
BOA/PRC Reg. No. 0001, December 28, 2012, valid until December 31, 2015SEC Accreditation No. 0012-FR-3 (Group A), November 15, 2012, valid until November 16, 2015
A member firm of Ernst & Young Global Limited

*SGVFS004197*
- 2 -
Opinion
In our opinion, the consolidated financial statements present fairly, in all material respects, thefinancial position of SM Investments Corporation and Subsidiaries as at December 31, 2013 and 2012,and their financial performance and their cash flows for each of the three years in the period endedDecember 31, 2013 in accordance with Philippine Financial Reporting Standards.
SYCIP GORRES VELAYO & CO.
Belinda T. Beng HuiPartnerCPA Certificate No. 88823SEC Accreditation No. 0923-AR-1 (Group A), March 25, 2013, valid until March 24, 2016Tax Identification No. 153-978-243BIR Accreditation No. 08-001998-78-2012, June 19, 2012, valid until June 18, 2015PTR No. 4225152, January 2, 2014, Makati City
March 3, 2014
A member firm of Ernst & Young Global Limited

*SGVFS004197*
SM INVESTMENTS CORPORATION AND SUBSIDIARIESCONSOLIDATED BALANCE SHEETS(Amounts in Thousands)
December 312013 2012
ASSETSCurrent AssetsCash and cash equivalents (Notes 7, 29 and 30) P=50,209,657 P=60,714,720Time deposits and short-term investments (Notes 8, 29 and 30) 28,912,650 29,090,335Investments held for trading and sale (Notes 9, 29 and 30) 1,118,980 2,854,541Receivables (Notes 10, 29 and 30) 26,637,734 16,365,552Merchandise inventories - at cost (Note 23) 13,232,308 13,402,762Other current assets (Notes 11, 29 and 30) 42,827,624 23,458,208 Total Current Assets 162,938,953 145,886,118Noncurrent AssetsAvailable-for-sale investments (Notes 12, 29 and 30) 16,499,092 16,912,646Investments in shares of stock of associates and joint ventures (Note 13) 138,994,366 128,453,744Time deposits (Notes 8, 29 and 30) 27,080,950 29,432,850Property and equipment (Note 14) 18,323,380 17,186,517Investment properties (Notes 15 and 20) 192,609,189 149,970,690Land and development (Note 16) 25,666,930 30,197,862Intangibles (Note 17) 20,255,055 15,354,200Deferred tax assets - net (Note 27) 2,172,799 642,105Other noncurrent assets (Notes 17, 29 and 30) 28,453,455 27,767,236 Total Noncurrent Assets 470,055,216 415,917,850
P=632,994,169 P=561,803,968
LIABILITIES AND EQUITYCurrent LiabilitiesBank loans (Notes 18, 22, 29 and 30) P=27,588,259 P=31,793,975Accounts payable and other current liabilities (Notes 19, 29 and 30) 68,088,327 57,865,876Income tax payable 1,612,784 1,474,045Current portion of long-term debt (Notes 20, 29 and 30) 34,566,619 13,859,558Dividends payable (Notes 29 and 30) 210,189 97,282 Total Current Liabilities 132,066,178 105,090,736Noncurrent LiabilitiesLong-term debt - net of current portion (Notes 15, 20, 22, 29 and 30) 175,589,418 174,532,871Derivative liabilities (Notes 29 and 30) 159,974 244,330Deferred tax liabilities - net (Note 27) 6,970,527 4,542,918Tenants’ deposits and others (Notes 15, 26, 29 and 30) 17,967,224 15,748,135 Total Noncurrent Liabilities 200,687,143 195,068,254 Total Liabilities 332,753,321 300,158,990Equity Attributable to Owners of the ParentCapital stock (Note 21) 7,962,723 6,229,746Additional paid-in capital (Note 21) 57,799,360 42,858,920Equity adjustments from common control transactions (Note 21) (2,584,210) (2,332,796)Cost of Parent common shares held by subsidiaries (Note 21) (25,386) (125,906)Cumulative translation adjustment of a subsidiary 1,233,177 266,915Remeasurement loss on defined benefit asset/obligation (Note 26) (195,074) –Net unrealized gain on available-for-sale investments (Notes 12 and 13) 7,338,500 11,718,559Retained earnings (Note 21): Appropriated 27,000,000 35,000,000 Unappropriated 120,904,727 94,458,694 Total Equity Attributable to Owners of the Parent 219,433,817 188,074,132Non-controlling Interests 80,807,031 73,570,846 Total Equity 300,240,848 261,644,978
P=632,994,169 P=561,803,968
See accompanying Notes to Consolidated Financial Statements.
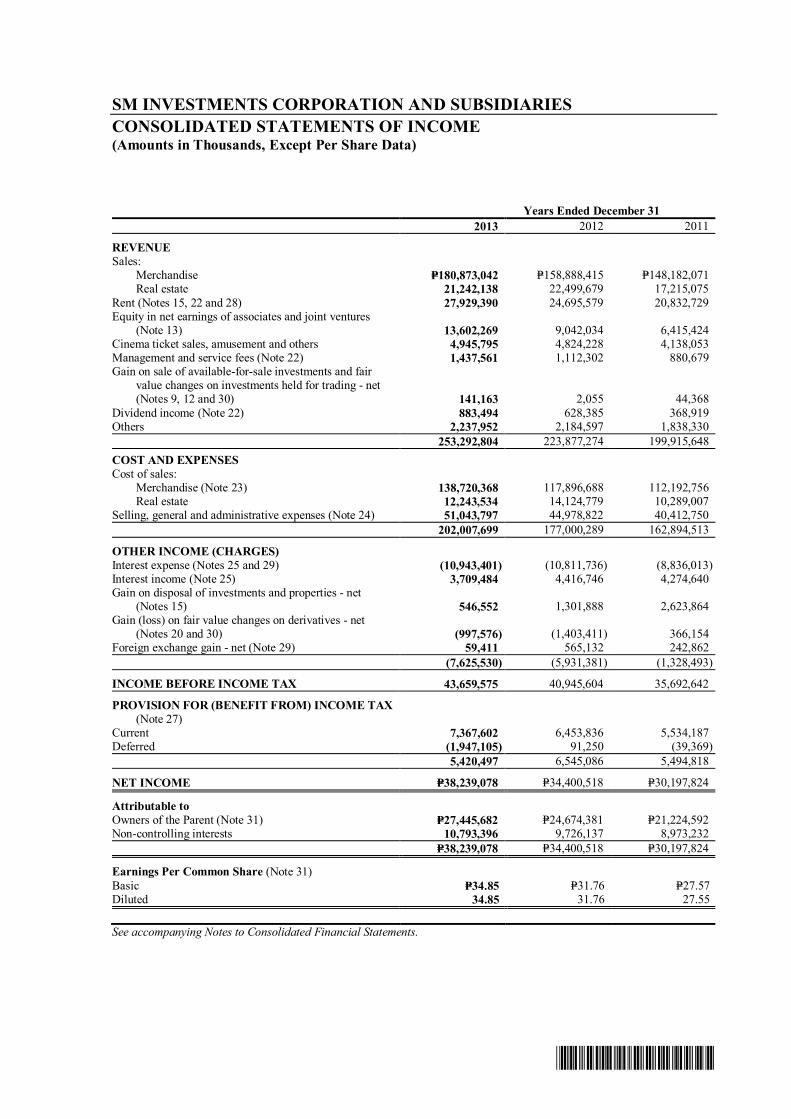
*SGVFS004197*
SM INVESTMENTS CORPORATION AND SUBSIDIARIESCONSOLIDATED STATEMENTS OF INCOME(Amounts in Thousands, Except Per Share Data)
Years Ended December 312013 2012 2011
REVENUESales: Merchandise P=180,873,042 P=158,888,415 P=148,182,071 Real estate 21,242,138 22,499,679 17,215,075Rent (Notes 15, 22 and 28) 27,929,390 24,695,579 20,832,729Equity in net earnings of associates and joint ventures
(Note 13) 13,602,269 9,042,034 6,415,424Cinema ticket sales, amusement and others 4,945,795 4,824,228 4,138,053Management and service fees (Note 22) 1,437,561 1,112,302 880,679Gain on sale of available-for-sale investments and fair
value changes on investments held for trading - net(Notes 9, 12 and 30) 141,163 2,055 44,368
Dividend income (Note 22) 883,494 628,385 368,919Others 2,237,952 2,184,597 1,838,330
253,292,804 223,877,274 199,915,648COST AND EXPENSESCost of sales: Merchandise (Note 23) 138,720,368 117,896,688 112,192,756 Real estate 12,243,534 14,124,779 10,289,007Selling, general and administrative expenses (Note 24) 51,043,797 44,978,822 40,412,750
202,007,699 177,000,289 162,894,513
OTHER INCOME (CHARGES)Interest expense (Notes 25 and 29) (10,943,401) (10,811,736) (8,836,013)Interest income (Note 25) 3,709,484 4,416,746 4,274,640Gain on disposal of investments and properties - net
(Notes 15) 546,552 1,301,888 2,623,864Gain (loss) on fair value changes on derivatives - net
(Notes 20 and 30) (997,576) (1,403,411) 366,154Foreign exchange gain - net (Note 29) 59,411 565,132 242,862
(7,625,530) (5,931,381) (1,328,493)
INCOME BEFORE INCOME TAX 43,659,575 40,945,604 35,692,642
PROVISION FOR (BENEFIT FROM) INCOME TAX(Note 27)
Current 7,367,602 6,453,836 5,534,187Deferred (1,947,105) 91,250 (39,369)
5,420,497 6,545,086 5,494,818
NET INCOME P=38,239,078 P=34,400,518 P=30,197,824
Attributable toOwners of the Parent (Note 31) P=27,445,682 P=24,674,381 P=21,224,592Non-controlling interests 10,793,396 9,726,137 8,973,232
P=38,239,078 P=34,400,518 P=30,197,824
Earnings Per Common Share (Note 31)Basic P=34.85 P=31.76 P=27.57Diluted 34.85 31.76 27.55
See accompanying Notes to Consolidated Financial Statements.
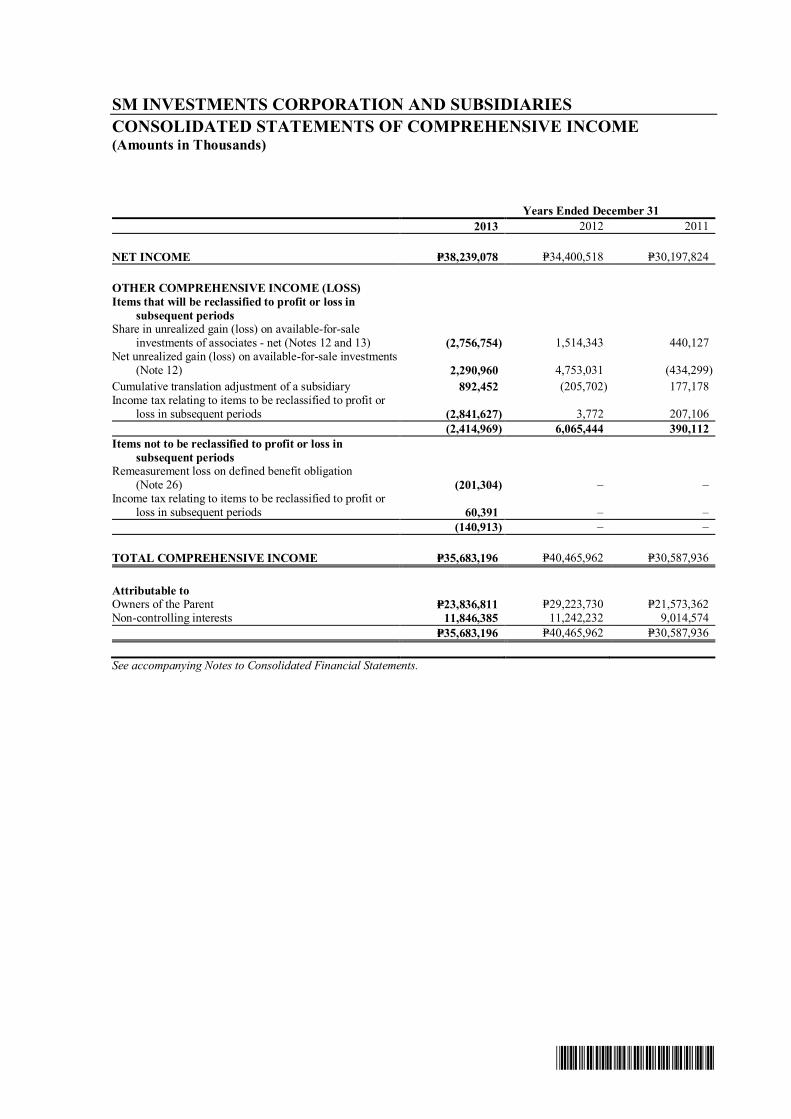
*SGVFS004197*
SM INVESTMENTS CORPORATION AND SUBSIDIARIESCONSOLIDATED STATEMENTS OF COMPREHENSIVE INCOME(Amounts in Thousands)
Years Ended December 312013 2012 2011
NET INCOME P=38,239,078 P=34,400,518 P=30,197,824
OTHER COMPREHENSIVE INCOME (LOSS)Items that will be reclassified to profit or loss in
subsequent periodsShare in unrealized gain (loss) on available-for-sale
investments of associates - net (Notes 12 and 13) (2,756,754) 1,514,343 440,127Net unrealized gain (loss) on available-for-sale investments
(Note 12) 2,290,960 4,753,031 (434,299)Cumulative translation adjustment of a subsidiary 892,452 (205,702) 177,178Income tax relating to items to be reclassified to profit or
loss in subsequent periods (2,841,627) 3,772 207,106(2,414,969) 6,065,444 390,112
Items not to be reclassified to profit or loss insubsequent periods
Remeasurement loss on defined benefit obligation(Note 26) (201,304) – –
Income tax relating to items to be reclassified to profit orloss in subsequent periods 60,391 – –
(140,913) – –
TOTAL COMPREHENSIVE INCOME P=35,683,196 P=40,465,962 P=30,587,936
Attributable toOwners of the Parent P=23,836,811 P=29,223,730 P=21,573,362Non-controlling interests 11,846,385 11,242,232 9,014,574
P=35,683,196 P=40,465,962 P=30,587,936
See accompanying Notes to Consolidated Financial Statements.

*SGVFS004197*
SM INVESTMENTS CORPORATION AND SUBSIDIARIESCONSOLIDATED STATEMENTS OF CHANGES IN EQUITY(Amounts in Thousands, Except Per Share Data)
Equity Attributable to Owners of the Parent
Capital StockAdditional
Paid-in Capital
EquityAdjustments
from CommonControl
Transactions
Cost of ParentCommon
Shares Heldby Subsidiaries
CumulativeTranslationAdjustment
of a Subsidiary
Net UnrealizedGain on
Available-for-SaleInvestments
Remeasurementloss on defined
benefit asset /obligation
AppropriatedRetainedEarnings
UnappropriatedRetainedEarnings Total
Non-controllingInterests
TotalEquity
Balance at December 31, 2012 P=6,229,746 P=42,858,920 (P=2,332,796) (P=125,906) P=266,915 P=11,718,559 P=– P=35,000,000 P=94,458,694 P=188,074,132 P=73,570,846 P=261,644,978Net income for the year – – – – – – – – 27,445,682 27,445,682 10,793,396 38,239,078Other comprehensive income – – – – 966,262 (4,380,059) (195,074) – – (3,608,871) 1,052,989 (2,555,882)Total comprehensive income for the year – – – – 966,262 (4,380,059) (195,074) – 27,445,682 23,836,811 11,846,385 35,683,196Issuance of Parent common shares (Note 21) 156,404 14,802,328 – – – – – – – 14,958,732 – 14,958,732Disposal of Parent common shares held by subsidiaries (Note 21) – 138,112 – 100,520 – – – – – 238,632 – 238,632Cash dividends - P=11.80 a share (Note 21) – – – – – – – – (7,423,076) (7,423,076) – (7,423,076)Stock dividends (Note 21) 1,576,573 – – – – – – – (1,576,573) – – –Reversal of appropriation during the year (Note 21) – – – – – – – (8,000,000) 8,000,000 – – –Increase in non-controlling interests – – – – – – – – – – 1,830,497 1,830,497Common control transactions (Notes 5 and 21) – – (251,414) – – – – – – (251,414) (2,083,843) (2,335,257)Cash dividends received by non-controlling interests – – – – – – – – – – (4,356,854) (4,356,854)Balance at December 31, 2013 P=7,962,723 P=57,799,360 (P=2,584,210) (P=25,386) P=1,233,177 P=7,338,500 (P=195,074) P=27,000,000 P=120,904,727 P=219,433,817 P=80,807,031 P=300,240,848
Balance at December 31, 2011 P=6,121,640 P=35,536,615 (P=2,332,796) (P=263,195) P=428,058 P=7,008,067 P=– P=5,000,000 P=106,167,942 P=157,666,331 P=64,620,530 P=222,286,861Net income for the year – – – – – – – – 24,674,381 24,674,381 9,726,137 34,400,518Other comprehensive income – – – – (161,143) 4,710,492 – – – 4,549,349 1,516,095 6,065,444Total comprehensive income for the year – – – – (161,143) 4,710,492 – – 24,674,381 29,223,730 11,242,232 40,465,962Issuance of Parent common shares (Note 21) 108,106 7,216,451 – – – – – – – 7,324,557 – 7,324,557Disposal of Parent common shares held by subsidiaries (Note 21) – 105,854 – 137,289 – – – – – 243,143 52,402 295,545Cash dividends - P=10.40 a share (Note 21) – – – – – – – – (6,383,629) (6,383,629) – (6,383,629)Appropriation during the year (Note 21) – – – – – – – 30,000,000 (30,000,000) – – –Decrease in non-controlling interests – – – – – – – – – – (235,336) (235,336)Cash dividends received by non-controlling interests – – – – – – – – – – (2,108,982) (2,108,982)Balance at December 31, 2012 P=6,229,746 P=42,858,920 (P=2,332,796) (P=125,906) P=266,915 P=11,718,559 P=– P=35,000,000 P=94,458,694 P=188,074,132 P=73,570,846 P=261,644,978
Balance at December 31, 2010 P=6,119,826 P=35,456,200 (P=2,332,796) (P=263,195) P=289,260 P=6,798,095 P=– P=5,000,000 P=90,475,674 P=141,543,064 P=56,274,415 P=197,817,479Net income for the year – – – – – – – – 21,224,592 21,224,592 8,973,232 30,197,824Other comprehensive income – – – – 138,798 209,972 – – – 348,770 41,342 390,112Total comprehensive income for the year – – – – 138,798 209,972 – – 21,224,592 21,573,362 9,014,574 30,587,936Issuance of Parent common shares 1,814 80,415 – – – – – – – 82,229 – 82,229Cash dividends - P=9.04 a share – – – – – – – – (5,532,324) (5,532,324) – (5,532,324)Increase in non-controlling interests – – – – – – – – – – 1,562,422 1,562,422Cash dividends received by non-controlling interests – – – – – – – – – – (2,230,881) (2,230,881)Balance at December 31, 2011 P=6,121,640 P=35,536,615 (P=2,332,796) (P=263,195) P=428,058 P=7,008,067 P=– P=5,000,000 P=106,167,942 P=157,666,331 P=64,620,530 P=222,286,861
See accompanying Notes to Consolidated Financial Statements.
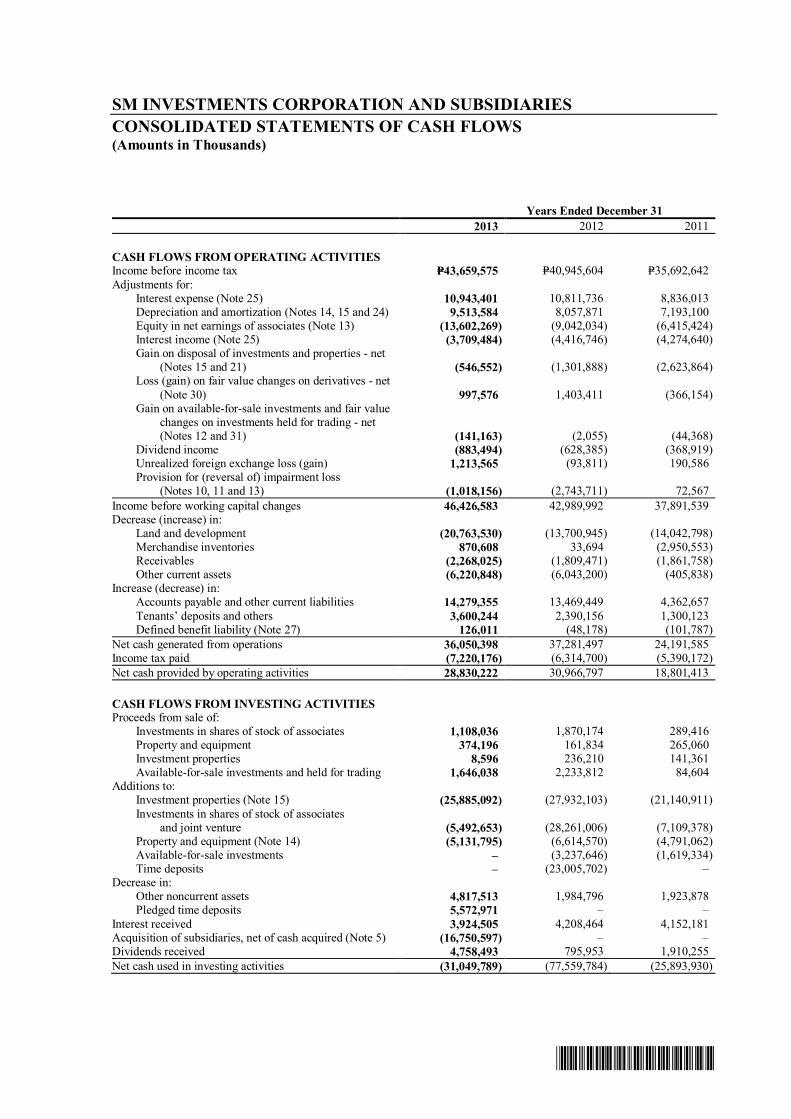
*SGVFS004197*
SM INVESTMENTS CORPORATION AND SUBSIDIARIESCONSOLIDATED STATEMENTS OF CASH FLOWS(Amounts in Thousands)
Years Ended December 312013 2012 2011
CASH FLOWS FROM OPERATING ACTIVITIESIncome before income tax P=43,659,575 P=40,945,604 P=35,692,642Adjustments for: Interest expense (Note 25) 10,943,401 10,811,736 8,836,013 Depreciation and amortization (Notes 14, 15 and 24) 9,513,584 8,057,871 7,193,100 Equity in net earnings of associates (Note 13) (13,602,269) (9,042,034) (6,415,424) Interest income (Note 25) (3,709,484) (4,416,746) (4,274,640) Gain on disposal of investments and properties - net
(Notes 15 and 21) (546,552) (1,301,888) (2,623,864) Loss (gain) on fair value changes on derivatives - net
(Note 30) 997,576 1,403,411 (366,154) Gain on available-for-sale investments and fair value
changes on investments held for trading - net(Notes 12 and 31) (141,163) (2,055) (44,368)
Dividend income (883,494) (628,385) (368,919) Unrealized foreign exchange loss (gain) 1,213,565 (93,811) 190,586 Provision for (reversal of) impairment loss
(Notes 10, 11 and 13) (1,018,156) (2,743,711) 72,567Income before working capital changes 46,426,583 42,989,992 37,891,539Decrease (increase) in: Land and development (20,763,530) (13,700,945) (14,042,798) Merchandise inventories 870,608 33,694 (2,950,553) Receivables (2,268,025) (1,809,471) (1,861,758) Other current assets (6,220,848) (6,043,200) (405,838)Increase (decrease) in: Accounts payable and other current liabilities 14,279,355 13,469,449 4,362,657 Tenants’ deposits and others 3,600,244 2,390,156 1,300,123 Defined benefit liability (Note 27) 126,011 (48,178) (101,787)Net cash generated from operations 36,050,398 37,281,497 24,191,585Income tax paid (7,220,176) (6,314,700) (5,390,172)Net cash provided by operating activities 28,830,222 30,966,797 18,801,413
CASH FLOWS FROM INVESTING ACTIVITIESProceeds from sale of: Investments in shares of stock of associates 1,108,036 1,870,174 289,416 Property and equipment 374,196 161,834 265,060 Investment properties 8,596 236,210 141,361 Available-for-sale investments and held for trading 1,646,038 2,233,812 84,604Additions to: Investment properties (Note 15) (25,885,092) (27,932,103) (21,140,911) Investments in shares of stock of associates
and joint venture (5,492,653) (28,261,006) (7,109,378) Property and equipment (Note 14) (5,131,795) (6,614,570) (4,791,062) Available-for-sale investments – (3,237,646) (1,619,334) Time deposits – (23,005,702) –Decrease in: Other noncurrent assets 4,817,513 1,984,796 1,923,878 Pledged time deposits 5,572,971 – –Interest received 3,924,505 4,208,464 4,152,181Acquisition of subsidiaries, net of cash acquired (Note 5) (16,750,597) – –Dividends received 4,758,493 795,953 1,910,255Net cash used in investing activities (31,049,789) (77,559,784) (25,893,930)

*SGVFS004197*
- 2 -
Years Ended December 312013 2012 2011
CASH FLOWS FROM FINANCING ACTIVITIESAvailments of: Long-term debt P=66,196,550 P=71,638,384 P=27,594,082 Bank loans 60,249,390 62,039,335 23,428,370Payments of: Long-term debt (47,783,598) (14,495,495) (21,874,200) Bank loans (70,185,745) (55,910,180) (18,228,800) Interest (11,608,952) (9,918,610) (8,747,952) Dividends (13,243,597) (8,421,026) (7,761,796)Proceeds from issuance of new common shares (Note 21) 6,424,666 6,329,678 –Disposal of Parent common shares held by subsidiaries
(Note 21) 100,520 295,546 –Increase (decrease) in non-controlling interests 1,830,497 (235,336) 1,562,422Net cash provided by (used in) financing activities (8,020,269) 51,322,296 (4,027,874)
NET INCREASE (DECREASE) IN CASHAND CASH EQUIVALENTS (10,239,836) 4,729,309 (11,120,391)
EFFECT OF EXCHANGE RATE CHANGESON CASH AND CASH EQUIVALENTS (265,227) (64,911) 209,703
CASH AND CASH EQUIVALENTSAT BEGINNING OF YEAR 60,714,720 56,050,322 66,961,010
CASH AND CASH EQUIVALENTSAT END OF YEAR P=50,209,657 P=60,714,720 P=56,050,322
See accompanying Notes to Consolidated Financial Statements.
*SGVFS004197*
SM INVESTMENTS CORPORATION AND SUBSIDIARIESNOTES TO CONSOLIDATED FINANCIAL STATEMENTS
1. Corporate Information
SM Investments Corporation (SMIC or Parent Company) was incorporated in the Philippines onJanuary 15, 1960. On June 3, 2009, the Philippine Securities and Exchange Commission (SEC)approved the amendment of SMIC’s articles of incorporation for the extension of the Company’scorporate life for another 50 years from January 15, 2010. Its registered office address is 10thFloor, One E-Com Center, Harbor Drive, Mall of Asia Complex, CBP-1A, Pasay City 1300.
The Parent Company and its subsidiaries (collectively referred to as the Group), and its associatesare involved primarily in the property, retail and financial services and other businesses.
The Parent Company’s shares of stock are publicly traded in the Philippine Stock Exchange(PSE).
The accompanying consolidated financial statements were authorized for issue by the Board ofDirectors (BOD) as approved and recommended for approval by the Audit Committee onMarch 3, 2014.
2. Basis of Preparation and Statement of Compliance
Basis of PreparationThe consolidated financial statements of the Group have been prepared on a historical cost basis,except for derivative financial instruments, investments held for trading and available-for-sale(AFS) investments which have been measured at fair value. The consolidated financial statementsare presented in Philippine peso, which is the Parent Company’s functional and presentationcurrency under Philippine Financial Reporting Standards (PFRS). All values are rounded to thenearest thousand, except when otherwise indicated.
Statement of ComplianceThe consolidated financial statements have been prepared in compliance with PFRS. PFRSincludes statements named PFRS and Philippine Accounting Standards (PAS), including theinterpretations issued by the Philippine Financial Reporting Standards Council (PFRSC).
Basis of ConsolidationThe consolidated financial statements comprise the financial statements of the Parent Companyand all of its subsidiaries as at December 31, 2013. Control is achieved when the Group isexposed, or has rights, to variable returns from its involvement with the investee and has theability to affect to those returns through its power over the investee. Specifically, the Groupcontrols an investee, if and only if, the Group has:
§ Power over the investee (i.e. existing rights that give it the current ability to direct the relevantactivities of the investee)
§ Exposure, or rights, to variable returns from its involvement with the investee, and§ The ability to use its power over the investee to affect its returns.
- 2 -
*SGVFS004197*
When the Group has less than a majority of the voting or similar rights of an investee, the Groupconsiders all relevant facts and circumstances in assessing whether it has power over an investee,including:
§ The contractual arrangement with the other vote holders of the investee§ Rights arising from other contractual arrangements, and§ The Group’s voting rights and potential voting rights.
The Group re-assesses whether or not it controls an investee if facts and circumstances indicatethat there are changes to one or more of the three elements of control. Consolidation of asubsidiary begins when the Group obtains control over the subsidiary and ceases when the Grouploses control of the subsidiary. Assets, liabilities, income and expenses of a subsidiary acquired ordisposed of during the year are included in the statement of comprehensive income from the datethe Group gains control until the date the Group ceases to control the subsidiary.
Profit or loss and each component of other comprehensive income (OCI) are attributed to theequity holders of the parent of the Group and to the non-controlling interests, even if this results inthe non-controlling interests having a deficit balance. When necessary, adjustments are made tothe financial statements of subsidiaries to bring their accounting policies into line with the Group’saccounting policies. All intra-group assets and liabilities, equity, income, expenses and cash flowsrelating to transactions between members of the Group are eliminated in full on consolidation.
A change in the ownership interest of a subsidiary, without loss of control, is accounted for as anequity transaction. If the Group loses control over a subsidiary, it:
§ Derecognizes the assets (including goodwill) and liabilities of the subsidiary;§ Derecognizes the carrying amount of any non-controlling interest;§ Derecognizes the cumulative translation differences recorded in equity;§ Recognizes the fair value of the consideration received;§ Recognizes the fair value of any investment retained;§ Recognizes any surplus or deficit in profit or loss;§ Reclassifies the Parent Company’s share of components previously recognized in other
comprehensive income to profit or loss or retained earnings, as appropriate.
The consolidated financial statements include the accounts of the Parent Company and thefollowing subsidiaries. The subsidiaries listed below were all incorporated in the Philippines.
Percentage of Ownership2013 2012
Company Principal Activities Direct Indirect Direct IndirectPropertySM Prime Holdings, Inc. (SM Prime) and
Subsidiaries Real estate development 51 – 22 41 SM Land, Inc. (SM Land) and Subsidiaries*: Real estate development – – 67 – SM Development Corporation (SMDC)
and Subsidiaries Real estate development – 100 – 65 Magenta Legacy, Inc. (Magenta) Real estate development – 100 – 99 Associated Development Corporation Real estate development – 100 – 100 Highlands Prime, Inc. (HPI) Real estate development – 100 – – Summerhills Home Development Corp.
(SHDC) Real estate development – 100 – – CHAS Realty and Development Corporation
and Subsidiaries Real estate development – 100 – – Costa del Hamilo, Inc. Real estate development – 100 – 100 Prime Metro Estate, Inc. (PMI) Real estate development – 100 10 90

- 3 -
*SGVFS004197*
Percentage of Ownership2013 2012
Company Principal Activities Direct Indirect Direct Indirect Rappel Holdings, Inc. (Rappel) and
Subsidiaries Real estate development – 100 100 – SM Arena Complex Corporation Conventions – 100 100 – SM Hotels and Conventions Corp.
(SM Hotels) and Subsidiaries Hotel and tourism – 100 100 – Tagaytay Resort Development Corporation Real estate development – 100 33 25Mountain Bliss Resort and Development
Corporation (Mt. Bliss) and Subsidiaries Real estate development 100 – 100 –Belleshares Holdings, Inc. (formerly
SM Commercial Properties, Inc.)and Subsidiaries Real estate development 59 40 59 –
Intercontinental Development Corporation(ICDC) Real estate development 97 3 72 28
Prime Central, Inc. (Prime Central)and Subsidiaries Real estate development 100 – 100 –
Bellevue Properties, Inc. Real estate development 62 – 62 –Net Group (see Note 5) Real estate development 90 – – –Sto. Roberto Marketing Corp. Real estate development 100 – – –Nagtahan Property Holdings, Inc.
(formerly AD Farming) Real estate development 100 – 100 –
RetailSM Retail, Inc. (SM Retail) and Subsidiaries Retail 100 – 100 –
OthersPrimebridge Holdings, Inc. (Primebridge) Investment 80 20 80 20Asia Pacific Computer Technology Center, Inc. Education 52 – 52 –Multi-Realty Development Corporation (MRDC) Investment 91 – 91 –Henfels Investments Corp. Investment 99 – 99 –
*On October 10, 2013, SM Land was merged with SM Prime via a share-for-share swap
Material Partly-owned SubsidiaryThe non-controlling interests of SM Prime is material to the Group. Non-controlling interest holds49% and 51% as at December 31, 2013 and 2012, respectively.
The summarized financial information of SM Prime are provided below. This information isbased on amounts before inter-company eliminations.
Summarized Consolidated Statements of Financial Position
December 312013 2012
(In Thousands)
Total current assets P=85,685,323 P=68,262,333Total noncurrent assets 249,898,359 216,389,783Total current liabilities 56,882,069 47,892,141Total noncurrent liabilities 112,506,024 86,297,990Total equity P=166,195,589 P=150,461,985
Attributable to:Owners of the Parent P=84,759,750 P=94,791,051Non-controlling interests 81,435,839 55,670,934
P=166,195,589 P=150,461,985
- 4 -
*SGVFS004197*
Summarized Consolidated Statements of Income
Years Ended December 312013 2012 2011
(In Thousands)
Revenue P=59,794,410 P=57,215,094 P=50,069,243Costs and expenses 35,658,865 35,145,277 30,771,982Other income (charges) (3,425,454) (1,635,923) (2,254,419)Income before income tax 20,710,091 20,433,894 17,042,842Provision for income tax 3,984,163 3,790,461 3,040,709Net income P=16,725,928 P=16,643,433 P=14,002,133
Attributable to:Owners of the Parent P=8,530,223 P=10,485,363 P=8,821,344
Non-controlling interests 8,195,705 6,158,070 5,180,789P=16,725,928 P=16,643,433 P=14,002,133
Summarized Consolidated Statements of Cash Flows
Years Ended December 312013 2012 2011
(In Thousands)
Operating P=22,184,513 P=6,587,695 P=11,623,633Investing (30,238,315) (20,527,706) (15,513,817)Financing 13,865,755 17,907,072 (3,158,723)Effect of exchange rate changes
on cash and cash equivalents 30,187 (13,005) 60,652Net increase (decrease)
in cash and cash equivalents P=5,842,140 P=3,954,056 (P=6,988,255)
3. Summary of Significant Accounting Policies, Changes and Improvements
The principal accounting adopted in the preparation of the consolidated financial statements are asfollows:
Cash and Cash EquivalentsCash includes cash on hand and in banks. Cash equivalents are short-term, highly liquidinvestments that are readily convertible to known amounts of cash with original maturities of threemonths or less from acquisition date and are subject to an insignificant risk of change in value.
Time Deposits and Short-term InvestmentsTime deposits and short-term investments are cash placements, shown under current assets, withoriginal maturities of more than three months but less than one year. Time deposits which willmature twelve months after the reporting period are presented under noncurrent assets.

- 5 -
*SGVFS004197*
Determination of Fair ValueFair value is the price that would be received to sell an asset or paid to transfer a liability in anorderly transaction between market participants at the measurement date. The fair valuemeasurement is based on the presumption that the transaction to sell the asset or transfer theliability takes place either:
§ in the principal market for the asset or liability, or§ in the absence of a principal market, in the most advantageous market for the asset or liability.
The principal or the most advantageous market must be accessible to the Group.
The fair value of an asset or a liability is measured using the assumptions that market participantswould use when pricing the asset or liability, assuming that market participants act in theireconomic best interest.
A fair value measurement of a nonfinancial asset takes into account a market participant’s abilityto generate economic benefits by using the asset in its highest and best use or by selling it toanother market participant that would use the asset in its highest and best use.
The Group uses valuation techniques that are appropriate in the circumstances and for whichsufficient data are available to measure fair value, maximizing the use of relevant observableinputs and minimizing the use of unobservable inputs.
Assets and liabilities for which fair value is measured or disclosed in the consolidated financialstatements are categorized within the fair value hierarchy, described as follows, based on thelowest level input that is significant to the fair value measurement as a whole:
§ Level 1 - Quoted (unadjusted) market prices in active markets for identical assets or liabilities;§ Level 2 - Valuation techniques for which the lowest level input that is significant to the fair
value measurement is directly or indirectly observable; and§ Level 3 - Valuation techniques for which the lowest level input that is significant to the fair
value measurement is unobservable.
For assets and liabilities that are recognized in the consolidated financial statements on a recurringbasis, the Group determines whether transfers have occurred between Levels in the hierarchy byre-assessing categorization (based on the lowest level input that is significant to the fair valuemeasurement as a whole) at the end of each reporting period.
The Group determines the policies and procedures for both recurring and non-recurring fair valuemeasurements. For the purpose of fair value disclosures, the Group has determined classes ofassets and liabilities on the basis of the nature, characteristics and risks of the asset or liability andthe level of the fair value hierarchy.
The Group recognizes transfers into and transfers out of fair value hierarchy levels by re-assessingcategorization (based on the lowest level input that is significant to the fair value measurement asa whole) as at the date of the event or change in circumstances that caused the transfer.
“Day 1” Difference. Where the transaction price in a non-active market is different from the fairvalue of other observable current market transactions in the same instrument or based on avaluation technique whose variables include only data from observable market, the Grouprecognizes the difference between the transaction price and fair value (a “Day 1” difference) in theconsolidated statement of income unless it qualifies for recognition as some other type of asset orliability. In cases where use is made of data which is not observable, the difference between the

- 6 -
*SGVFS004197*
transaction price and model value is only recognized in the consolidated statement of incomewhen the inputs become observable or when the instrument is derecognized. For each transaction,the Group determines the appropriate method of recognizing the “Day 1” difference amount.
Financial Instruments - Initial Recognition and Subsequent Measurement
Date of Recognition. The Group recognizes a financial asset or a financial liability in theconsolidated balance sheets when it becomes a party to the contractual provisions of theinstrument. In the case of a regular way purchase or sale of financial assets, recognition andderecognition, as applicable, are done using settlement date accounting. Regular way purchases orsales are purchases or sales of financial assets that require delivery of assets within the periodgenerally established by regulation or convention in the market place. Derivatives are recognizedon a trade date basis.
Initial Recognition of Financial Instruments. Financial instruments are recognized initially at fairvalue, which is the fair value of the consideration given (in case of an asset) or received (in case ofa liability). The initial measurement of financial instruments, except for those classified as fairvalue through profit or loss (FVPL), includes transaction cost.
Subsequent to initial recognition, the Group classifies its financial instruments in the followingcategories: financial assets and financial liabilities at FVPL, loans and receivables, HTMinvestments, AFS investments and other financial liabilities. The classification depends on thepurpose for which the instruments are acquired and whether they are quoted in an active market.Management determines the classification at initial recognition and, where allowed andappropriate, re-evaluates this classification at every reporting date.
Financial Assets and Liabilities at FVPL. Financial assets and liabilities at FVPL includefinancial assets and liabilities held for trading and financial assets and liabilities designated uponinitial recognition as at FVPL.
Financial assets and liabilities are classified as held for trading if they are acquired for the purposeof selling or repurchasing in the near term. Gains or losses on investments held for trading arerecognized in the consolidated statement of income under “Gain on sale of available-for-saleinvestments and fair value changes on investments held for trading - net” account. Interest incomeearned on investment held for trading are recognized in “Interest income” account in theconsolidated statement of income.
Financial assets and liabilities may be designated by management at initial recognition as FVPLwhen any of the following criteria is met:
§ the designation eliminates or significantly reduces the inconsistent treatment that wouldotherwise arise from measuring the assets and liabilities or recognizing gains or losses on adifferent basis; or
§ the assets and liabilities are part of a group of financial assets, financial liabilities or bothwhich are managed and their performance are evaluated on a fair value basis, in accordancewith a documented risk management or investment strategy; or
§ the financial instrument contains an embedded derivative, unless the embedded derivativedoes not significantly modify the cash flows or it is clear, with little or no analysis, that itwould not be separately recorded.

- 7 -
*SGVFS004197*
The Group’s investments held for trading and derivative assets are classified as financial assets atFVPL, while the Group’s derivative liabilities arising from issuance of convertible bonds andderivative financial instruments with negative fair values are also included as financial liabilities atFVPL.
Loans and Receivables. Loans and receivables are nonderivative financial assets with fixed ordeterminable payments that are not quoted in an active market. They are not entered into with theintention of immediate or short-term resale and are not designated as AFS investments or financialassets at FVPL.
After initial measurement, loans and receivables are subsequently measured at amortized costusing the effective interest method, less allowance for impairment. Amortized cost is calculatedby taking into account any discount or premium on acquisition and fees that are an integral part ofthe effective interest rate. Gains and losses are recognized in the consolidated statement ofincome when the loans and receivables are derecognized and impaired, as well as through theamortization process. Loans and receivables are included under current assets if realizability orcollectibility is within twelve months after the reporting period. Otherwise, these are classified asnoncurrent assets.
The Group’s cash and cash equivalents, time deposits and short-term investments (includingnoncurrent portion) and receivables (including noncurrent portion of receivables from real estatebuyers), advances and other receivables (included under “Other current assets” account),receivable from a related party and long-term notes (included under “Other noncurrrent assets”account) are classified under this category.
HTM Investments. HTM investments are quoted nonderivative financial assets with fixed ordeterminable payments and fixed maturities for which the Group’s management has the positiveintention and ability to hold to maturity. Where the Group sells other than an insignificant amountof HTM investments, the entire category would be tainted and reclassified as AFS investments.After initial measurement, these investments are measured at amortized cost using the effectiveinterest method, less impairment in value. Amortized cost is calculated by taking into account anydiscount or premium on acquisition and fees that are an integral part of the effective interest rate.Gains and losses are recognized in the consolidated statement of income when the HTMinvestments are derecognized or impaired, as well as through the amortization process. Assetsunder this category are classified as current assets if maturity is within twelve months fromreporting period. Otherwise, these are classified as noncurrent assets.
The Group’s investment in quoted Philippine government treasury bonds are classified under thiscategory.
AFS Investments. AFS investments are nonderivative financial assets that are designated underthis category or are not classified in any of the other categories. These are purchased and heldindefinitely, and may be sold in response to liquidity requirements or changes in marketconditions. Subsequent to initial recognition, AFS investments are carried at fair value in theconsolidated balance sheets. Changes in the fair value of such assets are reported as net unrealizedgain or loss on AFS investments in the consolidated statement of comprehensive income under“Net unrealized gain (loss) on available-for-sale investments” account until the investment isderecognized or the investment is determined to be impaired. On derecognition or impairment,the cumulative gain or loss previously reported in consolidated statement of comprehensiveincome is transferred to the consolidated statement of income. Interest earned on holding AFSinvestments are recognized in the consolidated statement of income using the effective interestmethod. Assets under this category are classified as current assets if expected to be disposed of

- 8 -
*SGVFS004197*
within 12 months after the reporting period and as noncurrent assets if expected date of disposal ismore than 12 months after the reporting period.
The Group’s investments in shares of stock, bonds and corporate notes, redeemable preferredshares and club shares are classified under this category. The current portion is included under“Investments held for trading and sale” account in the consolidated balance sheets.
Other Financial Liabilities. This category pertains to financial liabilities that are not held fortrading or not designated as at FVPL upon the inception of the liability. These include liabilitiesarising from operations or borrowings.
Other financial liabilities are recognized initially at fair value and are subsequently carried atamortized cost, taking into account the impact of applying the effective interest method ofamortization (or accretion) for any related premium, discount and any directly attributabletransaction costs. Gains and losses on other financial liabilities are recognized in the consolidatedstatement of income when the liabilities are derecognized, as well as through the amortizationprocess.
The Group’s bank loans, accounts payable and other current liabilities, dividends payable,long-term debt and tenants’ deposits and others are classified under this category.
Classification of Financial Instruments Between Liability and EquityA financial instrument is classified as liability if it provides for a contractual obligation to:
§ deliver cash or another financial asset to another entity; or
§ exchange financial assets or financial liabilities with another entity under conditions that arepotentially unfavorable to the Group; or
§ satisfy the obligation other than by the exchange of a fixed amount of cash or another financialasset for a fixed number of own equity shares.
If the Group does not have an unconditional right to avoid delivering cash or another financialasset to settle its contractual obligation, the obligation meets the definition of a financial liability.
The components of issued financial instruments that contain both liability and equity elements areaccounted for separately, with the equity component being assigned the residual amount afterdeducting from the instrument as a whole the amount separately determined as the fair value of theliability component on the date of issue.
Redeemable Preferred SharesIn determining whether a preferred share is a financial liability or an equity instrument, the Groupassesses the particular rights attaching to the share to determine whether it exhibits thefundamental characteristic of a financial liability. A preferred share that provides for mandatoryredemption by the Group for a fixed or determinable amount at a fixed or determinable futuredate, or gives the holder the right to require the Group to redeem the instrument at or after aparticular date for a fixed or determinable amount, is a financial liability.
The redeemable preferred shares of the Group exhibit the characteristics of a financial liability andare thus recognized as a liability under “Long-term debt” account in the consolidated balancesheets, net of transaction costs. The corresponding dividends on the shares are charged as interestexpense in the consolidated statement of income.

- 9 -
*SGVFS004197*
Transaction costs are amortized over the maturity period of the preferred shares using the effectiveinterest method.
Debt Issue CostsDebt issue costs are presented as reduction in long-term debt and are amortized over the terms ofthe related borrowings using the effective interest method.
Derivative Financial InstrumentsThe Group uses derivative financial instruments such as long-term currency swaps, foreigncurrency call options, interest rate swaps, foreign currency range options and non-deliverableforwards to hedge the risks associated with foreign currency and interest rate fluctuations.Derivative financial instruments, including bifurcated embedded derivatives, are initiallyrecognized at fair value on the date on which the derivative contract is entered into and aresubsequently re-measured at fair value. Derivatives are carried as assets when the fair value ispositive and as liabilities when the fair value is negative.
The Group’s derivative instruments provide economic hedges under the Group’s policies but arenot designated as accounting hedges. Consequently, any gains or losses arising from changes infair value are taken directly to profit or loss for the year.
Cash Flow Hedges. Cash flow hedges are hedges of the exposure to variability in cash flows thatis attributable to a particular risk associated with a recognized asset, liability or a highly probableforecast transaction and could affect the consolidated statements of income. Changes in the fairvalue of a hedging instrument that qualifies as a highly effective cash flow hedge are recognizedas “Cumulative translation adjustment of a subsidiary” in the consolicated statements ofcomprehensive income, whereas any hedge ineffectiveness is immediately recognized in theconsolidated statements of income under “Gain (loss) on fair value changes on derivatives”account (see Note 30).
Amounts taken to equity are transferred to the consolidated statements of income when the hedgedtransaction affects profit or loss, such as when the hedged financial income or financial expense isrecognized. However, if an entity expects that all or a portion of a loss recognized in othercomprehensive income will not be recovered in one or more future periods, it shall reclassify fromequity to profit or loss as a reclassification adjustment the amount that is not expected to berecovered.
Hedge accounting is discontinued prospectively when the hedge ceases to be highly effective.When hedge accounting is discontinued, the cumulative gains or losses on the hedging instrumentthat has been reported as “Cumulative translation adjustment of a subsidiary” is retained in theother comprehensive income until the hedged transaction impacts the consolidated statements ofincome. When the forecasted transaction is no longer expected to occur, any net cumulative gainsor losses previously reported in the consolidated statements of comprehensive income isrecognized immediately in the consolidated statements of income.
Other Derivative Instruments Not Accounted for as Hedges. Certain freestanding derivativeinstruments that provide economic hedges under the Company’s policies either do not qualify forhedge accounting or are not designated as accounting hedges. Changes in the fair values ofderivative instruments not designated as hedges are recognized immediately under “Gain (loss) onfair value changes on derivatives - net” account in the consolidated statements of income(see Note 30). Derivatives are carried as assets when the fair value is positive and as liabilitieswhen the fair value is negative.

- 10 -
*SGVFS004197*
Embedded Derivative. An embedded derivative is a component of a hybrid (combined)instrument that also includes a nonderivative host contract with the effect that some of the cashflows of the combined instrument vary, in a way similar to a stand-alone derivative. The Groupassesses whether embedded derivatives are required to be separated from host contracts when theGroup first becomes a party to the contract. An embedded derivative is separated from the hostcontract and accounted for as a derivative if all of the following conditions are met: a) theeconomic characteristics and risks of the embedded derivative are not closely related to theeconomic characteristics and risks of the host contract; b) a separate instrument with the sameterms as the embedded derivative would meet the definition of a derivative; and c) the hybrid orcombined instrument is not recognized as at FVPL.
Subsequent reassessment is prohibited unless there is a change in the terms of the contract thatsignificantly modifies the cash flows that otherwise would be required under the contract, in whichcase reassessment is required. The Group determines whether a modification to cash flows issignificant by considering the extent to which the expected future cash flows associated withembedded derivative, the host contract or both have changed and whether the change is significantrelative to the previously expected cash flows on the contract.
Options arising from the Group’s investment in bonds and convertible bonds payable are theGroup’s bifurcated embedded derivatives.
Derecognition of Financial Assets and Liabilities
Financial Assets. A financial asset (or, where applicable a part of a financial asset or part of agroup of similar financial assets) is derecognized when:
§ the rights to receive cash flows from the asset have expired;
§ the Group retains the right to receive cash flows from the asset, but has assumed anobligation to pay them in full without material delay to a third party under a “pass-through”arrangement; or
§ the Group has transferred its rights to receive cash flows from the asset and either (a) hastransferred substantially all the risks and rewards of the asset, or (b) has neither transferred norretained substantially all the risks and rewards of the asset, but has transferred control of theasset.
When the Group has transferred its rights to receive cash flows from an asset and has neithertransferred nor retained substantially all the risks and rewards of the asset, the asset is recognizedto the extent of the Group’s continuing involvement in the asset. Continuing involvement thattakes the form of a guarantee over the transferred asset is measured at the lower of originalcarrying amount of the asset and the maximum amount of consideration that the Group could berequired to repay.
Financial Liabilities. A financial liability is derecognized when the obligation under the liabilityis discharged or cancelled or has expired.
When an existing financial liability is replaced by another from the same lender on substantiallydifferent terms, or the terms of an existing liability are substantially modified, such modification istreated as a derecognition of the original liability and the recognition of a new liability, and thedifference in the respective carrying amounts is recognized in profit or loss.

- 11 -
*SGVFS004197*
Impairment of Financial AssetsThe Group assesses at each reporting period whether a financial asset or a group of financial assetsis impaired. A financial asset or a group of financial assets is deemed to be impaired, if and onlyif, there is objective evidence of impairment as a result of one or more events that occurred afterthe initial recognition of the asset (an incurred loss event) and that loss event has an impact on theestimated future cash flows of the financial asset or a group of financial assets that can be reliablyestimated. Objective evidence of impairment may include indications that the borrower or a groupof borrowers is experiencing significant financial difficulty, default or delinquency in interest orprincipal payments, the probability that they will enter bankruptcy or other financialreorganization and where observable data indicate that there is measurable decrease in theestimated future cash flows, such as changes in arrears or economic conditions that correlate withdefaults.
Financial Assets Carried at Amortized Cost. The Group first assesses whether objective evidenceof impairment exists for financial assets that are individually significant, and individually orcollectively for financial assets that are not individually significant. If it is determined that noobjective evidence of impairment exists for an individually assessed financial asset, whethersignificant or not, the asset is included in a group of financial assets with similar credit riskcharacteristics and that group of financial assets is collectively assessed for impairment. Assetsthat are individually assessed for impairment and for which an impairment loss is or continues tobe recognized are not included in the collective impairment assessment.
If there is objective evidence that an impairment loss on loans and receivables carried at amortizedcost has been incurred, the amount of the loss is measured as the difference between the asset’scarrying amount and the present value of estimated future cash flows (excluding future creditlosses that have not been incurred) discounted at the financial asset’s original effective interestrate (i.e., the effective interest rate computed at initial recognition).
The carrying amount of the impaired asset shall be reduced through the use of an allowanceaccount. The amount of the loss shall be recognized in the consolidated statement of income.Interest income continues to be accrued on the reduced carrying amount based on the originaleffective interest rate of the asset. Loans and receivables together with the associated allowanceare written off when there is no realistic prospect of future recovery and all collateral, if any, hasbeen realized or has been transferred to the Group. If, in a subsequent period, the amount of theimpairment loss increases or decreases because of an event occurring after the impairment wasrecognized, the previously recognized impairment loss is increased or decreased by adjusting theallowance account. If a future write-off is later recovered, the recovery is recognized in theconsolidated statement of income to the extent of the carrying amount that would have beendetermined had no impairment loss been recognized.
Financial Assets Carried at Cost. If there is objective evidence that an impairment loss has beenincurred in an unquoted equity instrument that is not carried at fair value because its fair valuecannot be reliably measured, or on a derivative asset that is linked to and must be settled bydelivery of such an unquoted equity instrument, the amount of the loss is measured as thedifference between the asset’s carrying amount and the present value of estimated future cashflows discounted at the current market rate of return for a similar financial asset.
AFS Investments. The Group assesses at each reporting period whether there is objective evidencethat an investment or a group of investments is impaired. In the case of equity investmentsclassified as AFS investments, an objective evidence of impairment would include a significant orprolonged decline in the fair value of the investments below its cost. Significant decline in fairvalue is evaluated against the original cost of the investment, while prolonged decline is assessed
- 12 -
*SGVFS004197*
against the periods in which the fair value has been below its original cost. Where there isevidence of impairment, the cumulative loss, measured as the difference between the acquisitioncost and the current fair value, less any impairment loss on that financial asset previouslyrecognized in the consolidated statement of income, is removed from the consolidated statementof comprehensive income and recognized in the consolidated statement of income. Impairmentlosses on equity investments are not reversed through the consolidated statement of income;increases in fair value after impairment are recognized directly in the consolidated statement ofcomprehensive income.
In the case of debt instruments classified as AFS investments, impairment is assessed based on thesame criteria as financial assets carried at amortized cost. Future interest income is based on thereduced carrying amount of the asset and is accrued based on the rate of interest used to discountfuture cash flows for the purpose of measuring impairment loss. Such accrual is recorded as partof “Interest income” account in the consolidated statement of income. If, in subsequent year, thefair value of a debt instrument increased and the increase can be objectively related to an eventoccurring after the impairment loss was recognized in the consolidated statement of income, theimpairment loss is reversed through the consolidated statement of income.
Offsetting Financial InstrumentsFinancial assets and financial liabilities are offset and the net amount is reported in theconsolidated balance sheets if, and only if, there is a currently enforceable legal right to offset therecognized amounts and there is an intention to settle on a net basis, or to realize the asset andsettle the liability simultaneously. This is not generally the case with master netting agreements,and the related assets and liabilities are presented at gross in the consolidated balance sheets.
Merchandise InventoriesMerchandise inventories are valued at the lower of cost and net realizable value. Cost, whichincludes all costs directly attributable to acquisition, such as purchase price and transport costs, isprimarily determined using the weighted average method. Net realizable value is the estimatedselling price in the ordinary course of business, less estimated costs necessary to make the sale.
Land and Development and Condominium Units for SaleLand and development and condominium units for sale (included under “Other current assets”account in the consolidated balance sheets) are stated at the lower of cost and net realizable value.Net realizable value is the selling price in the ordinary course of business, less costs to completeand the estimated cost to make the sale. Cost includes those costs incurred for development andimprovement of the properties.
Land and development includes properties held for future development and properties beingconstructed for sale in the ordinary course of business, rather than to be held for rental or capitalappreciation. Cost incurred for the development and improvement of the properties includes thefollowing:
§ Land cost
§ Amounts paid to contractors for construction and development
§ Borrowing costs, planning and design costs, costs of site preparation, professional fees,property transfer taxes, construction overheads and other related costs.

- 13 -
*SGVFS004197*
Investments in Shares of Stock of Associates and Joint VenturesAn associate is an entity over which the Group has significant influence. Significant influence isthe power to participate in the financial and operating policy decisions of the investee, but is notcontrol or joint control over those policies.
A joint venture is a joint arrangement whereby the parties that have joint control of thearrangement have rights to the net assets of the arrangement. Joint control is the contractuallyagreed sharing of control of an arrangement, which exists only when decisions about the relevantactivities require unanimous consent of the parties sharing control.
The considerations made in determining significant influence or joint control are similar to thosenecessary to determine control over subsidiaries.
The Group’s investments in shares of stock of associates and joint ventures are accounted forunder the equity method of accounting.
Under the equity method, investment in an associate or a joint venture is carried in theconsolidated balance sheets at cost plus post-acquisition changes in the Group’s share in net assetsof the associate or joint venture.
On acquisition of the investment, any difference between the cost of the investment and theinvestor’s share in the net fair value of the associate’s or joint venture’s identifiable assets,liabilities and contingent liabilities is accounted for as follows:
a. goodwill relating to an associate or joint venture is included in the carrying amount of theinvestment. However, amortization of that goodwill is not permitted and is therefore notincluded in the determination of the Group’s share in the associate’s or joint venture’s profitsor losses.
b. any excess of the Group’s share in the net fair value of the associate’s and joint venture’sidentifiable assets, liabilities and contingent liabilities over the cost of the investment isincluded as income in the determination of the investor's share of the associate's or jointventure’s profit or loss in the period in which the investment is acquired.
The consolidated statement of income reflect the share in the results of operations of the associateor joint venture. Where there has been a change recognized directly in the equity of the associateor joint venture, the Group recognizes its share in any changes and discloses this in theconsolidated statement of comprehensive income. Profits and losses resulting from transactionsbetween the Group and the associate or joint venture are eliminated to the extent of the Group’sinterest in the associate or joint venture.
Also, appropriate adjustments to the investor’s share of the associate’s or joint venture’s profit orloss after acquisition are made to account for the depreciation of the depreciable assets based ontheir fair values at the acquisition date and for impairment losses recognized by the associate orjoint venture, such as for goodwill or property, plant and equipment.
After application of the equity method, the Group determines whether it is necessary to recognizeany impairment loss with respect to the Group’s net investment in the associate or joint venture.
The Group discontinues the use of equity method from the date when it ceases to have significantinfluence over an associate or joint control over a joint venture and accounts for the retainedinvestment in accordance with PAS 39, from that date, provided the associate or joint venture doesnot become a subsidiary. Upon loss of significant influence over the associate or joint control

- 14 -
*SGVFS004197*
over the joint venture, the Group measures and recognizes any retained investment at its fair value.Any difference in the carrying amount of the associate or joint venture upon loss of significantinfluence or joint control and the fair value of the retained investment and proceeds from disposalis recognized in the consolidated statement of income. When the Group’s interest in aninvestment in associate or joint venture is reduced to zero, additional losses are provided only tothe extent that the Group has incurred obligations or made payments on behalf of the associate orjoint venture to satisfy obligations of the investee that the Group has guaranteed or otherwisecommitted. If the associate or joint venture subsequently reports profits, the Group resumesrecognizing its share of the profits only after its share of the profits equals the share of net lossesnot recognized.
The financial statements of the associates and joint ventures are prepared for the same reportingperiod as the Parent Company. The accounting policies of the associates and joint venturesconform to those used by the Group for like transactions and events in similar circumstances.
Property and EquipmentProperty and equipment, except land, is stated at cost less accumulated depreciation andamortization and any accumulated impairment in value. Such cost includes the cost of replacingpart of the property and equipment at the time that cost is incurred, if the recognition criteria aremet, and excludes the costs of day-to-day servicing. Land is stated at cost less any impairment invalue.
The initial cost of property and equipment consists of its purchase price, including import duties,taxes and any directly attributable costs necessary in bringing the asset to its working conditionand location for its intended use. Cost also includes any related asset retirement obligation andinterest incurred during the construction period on funds borrowed to finance the construction ofthe projects. When each major inspection is performed, its cost is recognized in the carryingamount of the property and equipment as a replacement if the recognition criteria are satisfied.Expenditures incurred after the item has been put into operation, such as repairs, maintenance andoverhaul costs, are normally recognized as expense in the period such costs are incurred. Insituations where it can be clearly demonstrated that the expenditures have improved the conditionof the asset beyond the originally assessed standard of performance, the expenditures arecapitalized as additional cost of property and equipment.
Depreciation and amortization are calculated on a straight-line basis over the following estimateduseful lives of the assets:
Buildings, condominium units and improvements 5–25 yearsStore equipment and improvements 5–10 yearsData processing equipment 5 yearsFurniture, fixtures and office equipment 3–10 yearsMachinery and equipment 5–10 yearsLeasehold improvements 5–10 years or term of the lease,
whichever is shorterTransportation equipment 5–10 years
The residual values, useful lives and method of depreciation and amortization of the assets arereviewed and adjusted, if appropriate, at the end of each reporting period.
The carrying values of property and equipment are reviewed for impairment when events orchanges in circumstances indicate that the carrying values may not be recoverable.

- 15 -
*SGVFS004197*
Fully depreciated assets are retained in the accounts until they are no longer in use and no furtherdepreciation and amortization is credited or charged to current operations.
An item of property and equipment is derecognized when either it has been disposed or when it ispermanently withdrawn from use and no future economic benefits are expected from its use ordisposal. Any gains or losses arising on the retirement and disposal of an item of property andequipment are recognized in the consolidated statement of income in the period of retirement ordisposal.
Investment PropertiesInvestment properties are measured initially at cost. The cost of a purchased investment propertycomprises of its purchase price and any directly attributable costs. Subsequently, investmentproperties, except land, are measured at cost, less accumulated depreciation and amortization andaccumulated impairment in value. The carrying amount includes the cost of replacing part of anexisting investment property at the time that cost is incurred if the recognition criteria are met, andexcludes the costs of day-to-day servicing of an investment property. Land is stated at cost lessany impairment in value.
Property under construction or development for future use as an investment property is classifiedas investment property.
Depreciation and amortization are calculated on a straight-line basis over the following estimateduseful lives of the assets:
Land improvements 3–5 yearsLand use rights 40–60 yearsBuildings and improvements 10–35 yearsBuilding equipment, furniture and others 3–15 years
The residual values, useful lives and method of depreciation and amortization of the assets arereviewed and adjusted, if appropriate, at the end of each reporting period.
Investment property is derecognized when either it has been disposed or when it is permanentlywithdrawn from use and no future economic benefit is expected from its disposal. Any gains orlosses on the retirement or disposal of an investment property are recognized in the consolidatedstatement of income in the period of retirement or disposal.
Transfers are made to investment property when, and only when, there is a change in use,evidenced by ending of owner-occupation or commencement of an operating lease to anotherparty. Transfers are made from investment property when, and only when, there is a change inuse, evidenced by commencement of owner-occupation or commencement of development with aview to sell.
For a transfer from investment property to owner-occupied property or inventories, the cost ofproperty for subsequent accounting is its carrying value at the date of change in use. If theproperty occupied by the Group as an owner-occupied property becomes an investment property,the Group accounts for such property in accordance with the policy stated under property andequipment up to the date of change in use.
Construction in ProgressConstruction in progress represents structures under construction and is stated at cost. Thisincludes cost of construction, property and equipment, and other direct costs. Cost also includesinterest on borrowed funds incurred during the construction period. Construction in progress isnot depreciated until such time that the relevant assets are completed and are ready for use.

- 16 -
*SGVFS004197*
Tenants’ DepositsTenants’ deposits are measured at amortized cost. Tenants’ deposits refers to security depositsreceived from various tenants upon inception of the respective lease contracts on the Group’sinvestment properties. At the termination of the lease contracts, the deposits received by theGroup are returned to tenants, reduced by unpaid rental fees, penalties and/or deductions fromrepairs of damaged leased properties, if any. The related lease contracts usually have a term ofmore than twelve months.
Property Acquisitions, Business Combinations and Acquisitions of Non-controlling Interests
Property Acquisitions and Business Combinations. When property is acquired, through corporateacquisitions or otherwise, management considers the substance of the assets and activities of theacquired entity in determining whether the acquisition represents an acquisition of a business.
When such an acquisition is not judged to be an acquisition of a business, it is not treated as abusiness combination. Rather, the cost to acquire the entity is allocated between the identifiableassets and liabilities of the entity based on their relative fair values at the acquisition date.Accordingly, no goodwill or additional deferred tax arises. Otherwise, the acquisition isaccounted for as a business combination.
Business combinations are accounted for using the acquisition method except for businesscombinations under common control in which an accounting similar to pooling of interest methodis used. Business combinations under common control are those in which all of the combiningentities or businesses are controlled by the same party or parties both before and after the businesscombination, and that control is not transitory. Under the acquisition method, the cost of anacquisition is measured as the aggregate of the consideration transferred, measured at acquisitiondate fair value and the amount of any non-controlling interest in the acquiree. For each businesscombination, the acquirer measures the non-controlling interest in the acquiree either at fair valueor at the proportionate share of the acquiree’s identifiable net assets. Transaction costs incurredare expensed and included in “Selling, general and administrative expenses” account in theconsolidated statement of income.
For accounting similar to pooling of interest method, the assets, liabilities and equity of theacquired companies for the reporting period in which the common control business combinationsoccur, and for any comparative periods presented, are included in the consolidated financialstatements of the Group at their carrying amounts as if the combinations had occurred from thedate when the acquired companies first became under the control of the Group. The excess of thecost of business combinations over the net carrying amounts of the assets and liabilities of theacquired companies is recognized under “Equity adjustments from business combination undercommon control” account in the equity section of the consolidated balance sheet.
When the Group acquires a business, it assesses the financial assets and liabilities assumed forappropriate classification and designation in accordance with the contractual terms, economiccircumstances and pertinent conditions as at the acquisition date. This includes the separation ofembedded derivatives in host contracts by the acquiree.
If the business combination is achieved in stages, the acquisition date fair value of the acquirer’spreviously held equity interest in the acquiree is remeasured at its acquisition date fair value andany resulting gain or loss is recognized in profit or loss. It is then considered in the determinationof goodwill.
- 17 -
*SGVFS004197*
Any contingent consideration to be transferred by the acquirer will be recognized at fair value atthe acquisition date. Subsequent changes to the fair value of the contingent consideration which isdeemed to be an asset or liability, will be recognized in accordance with PAS 39 either in profit orloss or as a change to other comprehensive income. If the contingent consideration is classified asequity, it should not be remeasured and subsequent settlement is accounted for within equity.
Acquisitions of Non-controlling Interests. Changes in the Parent Company’s ownership interest ina subsidiary that do not result in a loss of control are accounted for as equity transactions(i.e., transactions with owners in their capacity as owners). In such circumstances, the carryingamounts of the controlling and non-controlling interests shall be adjusted to reflect the changes intheir relative interests in the subsidiary. Any difference between the amount by which thenon-controlling interests are adjusted and the fair value of the consideration paid shall berecognized directly in equity.
Goodwill
Initial Measurement of Goodwill or Gain on a Bargain Purchase. Goodwill is initially measuredby the Group at cost being the excess of the aggregate of the consideration transferred and theamount recognized for non-controlling interest over the net identifiable assets acquired andliabilities assumed. If this consideration is lower than the fair value of the net assets of thesubsidiary acquired, the difference is recognized in profit or loss as gain on a bargain purchase.Before recognizing a gain on a bargain purchase, the Group determines whether it has correctlyidentified all of the assets acquired and all of the liabilities assumed and recognize any additionalassets or liabilities that are identified.
Subsequent Measurement of Goodwill. Following initial recognition, goodwill is measured at costless any accumulated impairment losses.
Impairment Testing of Goodwill. For the purpose of impairment testing, goodwill acquired in abusiness combination is, from the acquisition-date, allocated to each of the Group’scash-generating units (CGU), or groups of CGUs, that are expected to benefit from the synergiesof the combination, irrespective of whether other assets or liabilities of the acquiree are assignedto those units or groups of units. Each unit or group of units to which the goodwill is allocated:
§ represents the lowest level within the Group at which the goodwill is monitored for internalmanagement purposes; and
§ is not larger than an operating segment as defined in PFRS 8, Operating Segments, beforeaggregation.
Frequency of Impairment Testing. Irrespective of whether there is any indication of impairment,the Company tests goodwill acquired in a business combination for impairment at least annually.
Allocation of Impairment Loss. An impairment loss is recognized for a CGU if the recoverableamount of the unit or group of units is less than the carrying amount of the unit or group of units.The impairment loss is allocated to reduce the carrying amount of the assets of the unit or group ofunits first to reduce the carrying amount of goodwill allocated to the CGU or group of units andthen to the other assets of the unit or group of units pro rata on the basis of the carrying amount ofeach asset in the unit or group of units.

- 18 -
*SGVFS004197*
Measurement Period. If the initial accounting for a business combination is incomplete by the endof the reporting period in which the combination occurs, the Group reports in its consolidatedfinancial statements provisional amounts for the items for which the accounting is incomplete. Themeasurement period ends as soon as the Group receives the information it was seeking about factsand circumstances that existed as of the acquisition date or learns that more information is notobtainable. The measurement period shall not exceed one year from the acquisition date.
Intangible AssetsThe cost of trademarks and brand names acquired in a business combination is the fair value as atthe date of acquisition. The Group assessed the useful life of the trademarks and brand names tobe indefinite because based on an analysis of all of the relevant factors, there is no foreseeablelimit to the period over which the asset is expected to generate cash inflows for the Group.
Trademarks and brand names with indefinite useful lives are not amortized but are tested forimpairment annually either individually or at the cash generating unit level. The useful life of anintangible asset is reviewed annually to determine whether the indefinite life assessment continuesto be supportable. If not, the change in the useful life assessment from indefinite to finite is madeon a prospective basis.
Gains or losses arising from derecognition of an intangible asset are measured as the differencebetween the net disposal proceeds and the carrying amount of the asset at the date of disposal andare recognized in the consolidated statement of income when the asset is derecognized.
Impairment of Nonfinancial AssetsThe carrying values (property and equipment, investment properties and investments in shares ofstock of associates and joint ventures, intagibles and other noncurrent assets) are reviewed forimpairment when events or changes in circumstances indicate that the carrying value may not berecoverable. If any such indication exists, and if the carrying value exceeds the estimatedrecoverable amount, the assets or CGUs are written down to their recoverable amounts. Therecoverable amount of the asset is the greater of fair value less costs to sell or value in use. Thefair value less costs to sell is the amount obtainable from the sale of an asset in an arm’s-lengthtransaction between knowledgeable, willing parties, less costs of disposal. In assessing value inuse, the estimated future cash flows are discounted to their present value using a pre-tax discountrate that reflects current market assessments of the time value of money and the risks specific tothe asset. For an asset that does not generate largely independent cash inflows, the recoverableamount is determined for the CGU to which the asset belongs. Impairment losses are recognizedin the consolidated statement of income in those expense categories consistent with the function ofthe impaired asset.
An assessment is made at each reporting date as to whether there is any indication that previouslyrecognized impairment loss may no longer exist or may have decreased. If such indication exists,the recoverable amount is estimated. A previously recognized impairment loss is reversed only ifthere has been a change in the estimates used to determine the asset’s recoverable amount sincethe last impairment loss was recognized. If that is the case, the carrying amount of the asset isincreased to its recoverable amount. That increased amount cannot exceed the carrying amountthat would have been determined, net of depreciation and amortization, had no impairment lossbeen recognized for the asset in prior years. Such reversal is recognized in consolidated statementof income. After such a reversal, the depreciation or amortization charge is adjusted in futureperiods to allocate the asset’s revised carrying amount, less any residual value, on a systematicbasis over its remaining useful life.
- 19 -
*SGVFS004197*
Capital StockCapital stock is measured at par value for all shares issued. Incremental costs incurred directlyattributable to the issuance of new shares are shown in equity as deduction from proceeds, net oftax. Proceeds and/or fair value of considerations received in excess of par value, if any, arerecognized as additional paid-in capital.
RevenueRevenue is recognized when it is probable that the economic benefits associated with thetransaction will flow to the Group and the amount of the revenue can be reliably measured.Revenue is measured at the fair value of the consideration received or receivable, excludingdiscounts, rebates and sales taxes or duties. The Group assesses its revenue arrangements againstspecific criteria in order to determine if it is acting as a principal or as an agent. The Group hasconcluded that it is acting as principal in majority of its revenue arrangements. The followingspecific recognition criteria must also be met before revenue is recognized:
Sale of Merchandise Inventories. Revenue is recognized when the significant risks and rewards ofownership of the goods have passed to the buyer, which is normally upon delivery. Sales returnsand sales discounts are deducted from sales to arrive at sales shown in the consolidated statementof income.
Sale of goods under consignment arrangements with suppliers is recognized as revenue uponbilling, delivery and transfer of goods to customers.
Sale of Real Estate. The Group assesses whether it is probable that the economic benefits willflow to the Group when the sales prices are collectible. Collectibility of the contract price isdemonstrated by the buyer’s commitment to pay, which is supported by the buyer’s initial andcontinuous investments that motivates the buyer to honor its obligation. Collectibility is alsoassessed by considering factors such as collections, credit standing of the buyer and location of theproperty.
Revenue from sales of completed real estate projects is accounted for using the full accrualmethod. In accordance with Philippine Interpretations Committee Q&A No. 2006-01, thepercentage-of-completion method is used to recognize income from sales of projects where theGroup has material obligations under the sales contract to complete the project after the property issold, the equitable interest has been transferred to the buyer, construction is beyond preliminarystage (i.e., engineering, design work, construction contracts execution, site clearance andpreparation, excavation and the building foundation are finished), and the costs incurred or to beincurred can be measured reliably. Under this method, revenue is recognized as the relatedobligations are fulfilled, measured principally on the basis of the estimated completion of aphysical proportion of the contract work.
Any excess of collections over the recognized receivables are included in the “Tenants’ depositsand others” account in the consolidated balance sheets. If any of the criteria under the full accrualor percentage-of-completion method is not met, the deposit method is applied until all theconditions for recording a sale are met. Pending recognition of sale, cash received from buyersare presented under the “Tenants’ deposits and others” account in the consolidated balance sheets.
Revenue from construction contracts included in the “Revenue from real estate and others”account in the consolidated statement of income is recognized using the percentage-of-completionmethod, measured principally on the basis of the estimated physical completion of the contractwork.
- 20 -
*SGVFS004197*
Rent. Revenue is recognized on a straight-line basis over the lease term or based on the terms ofthe lease as applicable.
Sale of Cinema and Amusement Tickets. Revenue is recognized upon receipt of cash from thecustomer which coincides with the rendering of services.
Gain on Sale of Investments in Shares of Stock and Available-for-Sale Investments. Revenue isrecognized upon delivery of the securities to and confirmation of the sale by the broker.
Dividend. Revenue is recognized when the Group’s right as a shareholder to receive the paymentis established.
Management and Service Fees. Revenue is recognized when earned in accordance with the termsof the agreements.
Marketing Support. Revenue is recognized when the performance and provision of contractuallyagreed marketing tasks have been rendered and store facilities have been used. Marketing supportis shown under “Others” account in the consolidated statement of income.
Interest. Revenue is recognized as the interest accrues, taking into account the effective yield onthe asset.
Management FeesManagement fees are recognized as expense in accordance with the terms of the agreements.
Cost and Expenses
Cost of Real Estate Sales. Cost of real estate sales is recognized consistent with the revenuerecognition method applied. Cost of condominium units sold before the completion of thedevelopment is determined on the basis of the acquisition cost of the land plus its full developmentcosts, which include estimated costs for future development works.
The cost of inventory recognized in the consolidated statement of income upon sale is determinedwith reference to the specific costs incurred on the property, allocated to saleable area based onrelative size and takes into account the percentage of completion used for revenue recognitionpurposes.
Expected losses on contracts are recognized immediately when it is probable that the total contractcosts will exceed total contract revenue. Changes in the estimated cost to complete thecondominium project which affects cost of real estate sold and gross profit are recognized in theyear in which changes are determined.
Selling, General, Administrative and Other Expenses. Costs and expenses are recognized asincurred.
Pension BenefitsThe net defined benefit liability or asset is the aggregate of the present value of the defined benefitobligation at the end of the reporting period reduced by the fair value of plan assets (if any),adjusted for any effect of limiting a net defined benefit asset to the asset ceiling. The asset ceilingis the present value of any economic benefits available in the form of refunds from the plan orreductions in future contributions to the plan.

- 21 -
*SGVFS004197*
The cost of providing benefits under the defined benefit plans is actuarially determined using theprojected unit credit method.
Defined benefit costs comprise the following:§ Service cost§ Net interest on the net defined benefit liability or asset§ Remeasurements of net defined benefit liability or asset
Service costs which include current service costs, past service costs and gains or losses onnon-routine settlements are recognized as expense in profit or loss. Past service costs arerecognized in profit or loss on the earlier of the date of the plan amendment or curtailment, and thedate the Group recognizes restructuring-related costs. These amounts are calculated periodicallyby independent qualified actuaries.
Net interest on the net defined benefit liability or asset is the change during the period in the netdefined benefit liability or asset that arises from the passage of time which is determined byapplying the discount rate based on government bonds to the net defined benefit liability or asset.Net interest on the net defined benefit liability or asset is recognized as expense or income inprofit or loss.
Remeasurements comprising actuarial gains and losses, return on plan assets and any change inthe effect of the asset ceiling (excluding net interest on defined benefit liability) are recognizedimmediately in other comprehensive income in the period in which they arise. Remeasurementsare not reclassified to profit or loss in subsequent periods.
Plan assets are assets that are held by a long-term employee benefit fund or qualifying insurancepolicies. Plan assets are not available to the creditors of the Group, nor can they be paid directly tothe Group. Fair value of plan assets is based on market price information. When no market priceis available, the fair value of plan assets is estimated by discounting expected future cash flowsusing a discount rate that reflects both the risk associated with the plan assets and the maturity orexpected disposal date of those assets (or, if they have no maturity, the expected period until thesettlement of the related obligations). If the fair value of the plan assets is higher than the presentvalue of the defined benefit obligation, the measurement of the resulting defined benefit asset islimited to the present value of economic benefits available in the form of refunds from the plan orreductions in future contributions to the plan.
The Group’s right to be reimbursed of some or all of the expenditure required to settle a definedbenefit obligation is recognized as a separate asset at fair value when and only whenreimbursement is virtually certain.
Foreign Currency-denominated TransactionsThe consolidated financial statements are presented in Philippine peso, which is the ParentCompany’s functional and presentation currency. Transactions in foreign currencies are initiallyrecorded in the functional currency rate at the date of the transaction. Monetary assets andliabilities denominated in foreign currencies are restated at the functional currency rate ofexchange as at reporting date. Nonmonetary items denominated in foreign currency are translatedusing the exchange rates as at the date of initial recognition. All differences are taken to theconsolidated statement of income.

- 22 -
*SGVFS004197*
Foreign Currency TranslationThe assets and liabilities of foreign operations are translated into Philippine peso at the rate ofexchange ruling as at reporting date and their respective statements of income are translated at theweighted average rates for the year. The exchange differences arising on the translation areincluded in the consolidated statement of comprehensive income and are presented within the“Cumulative translation adjustment of a subsidiary” account in the consolidated statement ofchanges in equity. On disposal of a foreign entity, the deferred cumulative amount of exchangedifferences recognized in equity relating to that particular foreign operation is recognized in theprofit or loss.
LeasesThe determination of whether an arrangement is, or contains a lease is based on the substance ofthe arrangement and requires an assessment of whether the fulfillment of the arrangement isdependent on the use of a specific asset or assets and the arrangement conveys a right to use theasset.
Group as Lessee. Finance leases, which transfer to the Group substantially all the risks andbenefits incidental to ownership of the leased item, are capitalized at the inception of the lease atthe fair value of the leased property or, if lower, at the present value of the minimum leasepayments. Lease payments are apportioned between the finance charges and reduction of the leaseliability so as to achieve a constant rate of interest on the remaining balance of the liability.Finance charges are reflected in the consolidated statement of income.
Capitalized leased assets are depreciated over the shorter of the estimated useful life of the assetand the lease term, if there is no reasonable certainty that the Group will obtain ownership by theend of the lease term.
Leases which do not transfer to the Group substantially all the risks and benefits of ownership ofthe asset are classified as operating leases. Operating lease payments are recognized as expense inthe consolidated statement of income on a straight-line basis over the lease term. Associatedcosts, such as maintenance and insurance, are expensed as incurred.
Group as Lessor. Leases where the Group does not transfer substantially all the risks and benefitsof ownership of the asset are classified as operating leases. Lease income from operating leasesare recognized as income on a straight-line basis over the lease term. Initial direct costs incurredin negotiating an operating lease are added to the carrying amount of the leased asset andrecognized over the lease term on the same basis as rental income. Contingent rents arerecognized as revenue in the period in which they are earned.
ProvisionsProvisions are recognized when the Group has a present obligation (legal or constructive) as aresult of a past event, it is probable that an outflow of resources embodying economic benefits willbe required to settle the obligation, and a reliable estimate can be made of the amount of theobligation. If the effect of the time value of money is material, provisions are determined bydiscounting the expected future cash flows at a pre-tax rate that reflects current marketassessments of the time value of money and, where appropriate, the risks specific to the liability.Where discounting is used, the increase in the provision due to the passage of time is recognizedas interest expense. Where the Group expects a provision to be reimbursed, the reimbursement isrecognized as a separate asset but only when the receipt of the reimbursement is virtually certain.

- 23 -
*SGVFS004197*
Borrowing CostsBorrowing costs are capitalized as part of the cost of the asset if they are directly attributable tothe acquisition or construction of a qualifying asset. Capitalization of borrowing costs commenceswhen the activities to prepare the asset are in progress and expenditures and borrowing costs arebeing incurred. Borrowing costs are capitalized until the assets are substantially ready for theirintended use. Borrowing costs are capitalized when it is probable that they will result in futureeconomic benefits to the Group. All other borrowing costs are expensed as incurred. Forborrowing associated with a specific asset, the actual rate on that borrowing is used. Otherwise, aweighted average cost of borrowings is used.Taxes
Current Tax. Current tax assets and liabilities for the current and prior periods are measured at theamount expected to be recovered from or paid to the taxation authorities. The tax rates and taxlaws used to compute the amount are those that are enacted or substantively enacted as at the endof the reporting period.
Deferred Tax. Deferred tax is provided, using the balance sheet liability method, on temporarydifferences at the end of the reporting period between the tax bases of assets and liabilities andtheir carrying amounts for financial reporting purposes. Deferred tax liabilities are recognized forall taxable temporary differences, except:
§ where the deferred tax liability arises from the initial recognition of goodwill or of an asset orliability in a transaction that is not a business combination and, at the time of the transaction,affects neither the accounting profit nor taxable profit or loss; and
§ with respect to taxable temporary differences associated with investments in subsidiaries,associates and interests in joint ventures, where the timing of the reversal of the temporarydifferences can be controlled and it is probable that the temporary differences will not reversein the foreseeable future.
Deferred tax assets are recognized for all deductible temporary differences and carryforwardbenefits of excess MCIT and NOLCO, to the extent that it is probable that taxable profit will beavailable against which the deductible temporary differences and the carryforward benefits ofexcess MCIT and NOLCO can be utilized, except:
§ where the deferred tax asset relating to the deductible temporary difference arises from theinitial recognition of an asset or liability in a transaction that is not a business combinationand, at the time of the transaction, affects neither the accounting profit nor taxable profit orloss; and
§ with respect to deductible temporary differences associated with investments in subsidiaries,associates and interests in joint ventures, deferred tax assets are recognized only to the extentthat it is probable that the temporary differences will reverse in the foreseeable future andtaxable profit will be available against which the temporary differences can be utilized.
The carrying amount of deferred tax assets is reviewed at the end of each reporting period andreduced to the extent that it is no longer probable that sufficient taxable profit will be available toallow all or part of the deferred income tax assets to be utilized. Unrecognized deferred tax assetsare reassessed at the end of each reporting period and are recognized to the extent that it hasbecome probable that future taxable profit will allow the deferred tax assets to be recovered.

- 24 -
*SGVFS004197*
Deferred tax assets and liabilities are measured at the tax rates that are expected to apply to theperiod the asset is realized or the liability is settled, based on tax rates and tax laws that have beenenacted or substantively enacted as at reporting date.
Income tax relating to items recognized directly in the consolidated statement of comprehensiveincome is recognized in the consolidated statement of comprehensive income and not in theconsolidated statement of income.
Deferred tax assets and deferred tax liabilities are offset, if a legally enforceable right exists tooffset current tax assets against current tax liabilities and the deferred taxes relate to the sametaxable entity and the same taxation authority.
Value-added Tax (VAT). Revenue, expenses and assets are recognized net of the amount of VAT,except:
§ where the tax incurred on a purchase of assets or services is not recoverable from the taxationauthority, in which case the tax is recognized as part of the cost of acquisition of the asset oras part of the expense item as applicable; and
§ for receivables and payables that are stated with the amount of tax included.
The net amount of VAT recoverable from, or payable to, the taxation authority is included as partof “Other current assets” or “Accounts payable and other current liabilities” accounts in theconsolidated balance sheets.
Business SegmentsThe Group is organized and managed separately according to the nature of business. The threemajor operating businesses of the Group are property, retail and financial services and others.These operating businesses are the basis upon which the Group reports its segment informationpresented in Note 6 to the consolidated financial statements.
Basic/Diluted Earnings Per Common Share (EPS)Basic EPS is computed by dividing the net income for the period attributable to owners of theParent by the weighted-average number of issued and outstanding common shares during theperiod, with retroactive adjustment for any stock dividends declared.
For the purpose of computing diluted EPS, the net income for the period attributable to owners ofthe Parent and the weighted-average number of issued and outstanding common shares areadjusted for the effects of all dilutive potential ordinary shares.
ContingenciesContingent liabilities are not recognized in the consolidated financial statements. They aredisclosed unless the possibility of an outflow of resources embodying economic benefits isremote. Contingent assets are not recognized in the consolidated financial statements but aredisclosed when an inflow of economic benefits is probable.
Events after the Reporting PeriodPost year-end events that provide additional information about the Group’s position at the end ofthe reporting period (adjusting events) are reflected in the consolidated financial statements. Postyear-end events that are not adjusting events are disclosed in the notes to the consolidatedfinancial statements when material.
- 25 -
*SGVFS004197*
Cha nges in Accounting Policies and DisclosuresThe accounting policies adopted are consistent with those of the previous financial year, except forthe adoption of the following amended PFRS, which were adopted starting January 1, 2013. Theadoption of the following amended standards and interpretations did not have any impact on theGroup’s consolidated financial statements, except when otherwise indicated:
§ PFRS 7, Financial Instruments: Disclosures – Offsetting Financial Statements and FinancialLiabilities (Amendments)
§ PFRS 10, Consolidated Financial Statements
§ PFRS 11, Joint Arrangements
§ PFRS 12, Disclosure of Interests in Other Entities
§ PFRS 13, Fair Value Measurement
§ PAS 1, Presentation of Financial Statements - Presentation of Items of Other ComprehensiveIncome or OCI (Amendments)
§ PAS 19, Employee Benefits (Revised)
§ PAS 27, Separate Financial Statements (as revised in 2011)
§ PAS 28, Investments in Associates and Joint Ventures (as revised in 2011)
§ Philippine Interpretation IFRIC 20, Stripping Costs in the Production Phase of a Surface Mine
§ Philippine Interpretations Committee Q&A No. 2013-03, Accounting for Employee Benefitsunder a Defined Contribution Plan Subject to Requirements of Republic Act 7641, ThePhilippine Retirement Law
§ 2012 improvements to PFRSs, effective 2013.
Adoption of Revised PAS 19For defined benefit plans, the Revised PAS 19 requires all remeasurements actuarial gains andlosses to be recognized in other comprehensive income and unvested past service costs previouslyrecognized over the average vesting period to be recognized immediately in profit or loss whenincurred.
Prior to adoption of the Revised PAS 19, the Group recognized actuarial gains and losses asincome or expense when the net cumulative unrecognized gains and losses for each individualplan at the end of the previous period exceeded 10% of the higher of the defined benefit obligationand the fair value of the plan assets and recognized unvested past service costs as an expense on astraight-line basis over the average vesting period until the benefits become vested.
Upon adoption of the Revised PAS 19, the Group changed its accounting policy to recognize allremeasurements in other comprehensive income, which will not be reclassified to profit or loss insubsequent periods, and all past service costs in profit or loss in the period they occur. Movingforward, the Group will retain the remeasurements in other comprehensive income and will nottransfer this to other items of equity.

- 26 -
*SGVFS004197*
The revised PAS 19 replaced the interest cost and expected return on plan assets with the conceptof net interest on defined benefit liability or asset which is calculated by multiplying the netbalance sheet defined benefit liability or asset by the discount rate used to measure the employeebenefit obligation, each as at the beginning of the annual period.
The revised PAS 19 also amended the definition of short-term employee benefits and requiresemployee benefits to be classified as short-term based on expected timing of settlement rather thanthe employee’s entitlement to the benefits. In addition, the Revised PAS 19 modifies the timing ofrecognition for termination benefits. The modification requires the termination benefits to berecognized at the earlier of when the offer cannot be withdrawn or when the related restructuringcosts are recognized.
The changes to the definition of short-term employee benefits and the timing of recognition fortermination benefits do not have any impact to the Group’s financial position and financialperformance.
The Group reviewed its existing employee benefits and determined that the amended standard hasan impact on its accounting for pension benefits. The effect of the adoption of theRevised PAS 19 as at January 1, 2013 amounted to P=283.7 million. This was recorded in thecurrent year profit or loss as reduction pension benefit expense, instead of a retrospectiveadjustment as required by the Revised PAS 19, as the impact is not material (see Note 26). Onthis basis, the Group’s consolidated statement of financial position at the beginning of the earliestcomparative period was also not presented.
The adoption increased earnings per share by P=0.36 in 2013 (see Note 31). It did not have impacton the consolidated statement of cash flows for the year ended December 31, 2013.
Future Changes in Accounting PoliciesThe following are the new standards, interpretations, amendments and improvements to PFRS andPhilippine Interpretations that were issued but are not yet effective as at December 31, 2013. TheGroup intends to adopt the applicable standards, interpretations, amendments and improvementswhen these become effective.
New Standards and Interpretations
§ PAS 36, Impairment of Assets - Recoverable Amount Disclosures for Non-Financial Assets(Amendments). These amendments remove the unintended consequences of PFRS 13 on thedisclosures required under PAS 36. In addition, these amendments require disclosure of therecoverable amounts for the assets or cash-generating units (CGUs) for which impairment losshas been recognized or reversed during the period. These amendments are effectiveretrospectively for annual periods beginning on or after January 1, 2014 with earlierapplication permitted, provided PFRS 13 is also applied. The amendments affect disclosuresonly and have no impact on the Group’s financial position or performance.
§ Investment Entities (Amendments to PFRS 10, PFRS 12 and PAS 27). These amendments areeffective for annual periods beginning on or after January 1, 2014. They provide an exceptionto the consolidation requirement for entities that meet the definition of an investment entityunder PFRS 10. The exception to consolidation requires investment entities to account forsubsidiaries at fair value through profit or loss. It is not expected that this amendment wouldbe relevant to the Group since none of the entities in the Group would qualify to be aninvestment entity under PFRS 10.
- 27 -
*SGVFS004197*
§ Philippine Interpretation IFRIC 21, Levies (IFRIC 21). IFRIC 21 clarifies that an entityrecognizes a liability for a levy when the activity that triggers payment, as identified by therelevant legislation, occurs. For a levy that is triggered upon reaching a minimum threshold,the interpretation clarifies that no liability should be anticipated before the specified minimumthreshold is reached. IFRIC 21 is effective for annual periods beginning on or after January 1,2014. The Group does not expect that IFRIC 21 will have material financial impact in futurefinancial statements.
§ PAS 39, Financial Instruments: Recognition and Measurement - Novation of Derivatives andContinuation of Hedge Accounting (Amendments). These amendments provide relief fromdiscontinuing hedge accounting when novation of a derivative designated as a hedginginstrument meets certain criteria. These amendments are effective for annual periodsbeginning on or after January 1, 2014. The Group has not novated its derivatives during thecurrent period. However, these amendments would be considered for future novations.
§ PAS 32, Financial Instruments: Presentation - Offsetting Financial Assets and FinancialLiabilities (Amendments). The amendments clarify the meaning of “currently has a legallyenforceable right to set-off” and also clarify the application of the PAS 32 offsetting criteria tosettlement systems (such as central clearing house systems) which apply gross settlementmechanisms that are not simultaneous. The amendments affect presentation only and have noimpact on the Group’s financial position or performance. The amendments to PAS 32 are tobe retrospectively applied for annual periods beginning on or after January 1, 2014.
§ PAS 19, Employee Benefits – Defined Benefit Plans: Employee Contributions (Amendments),apply to contributions from employees or third parties to defined benefit plans. Contributionsthat are set out in the formal terms of the plan shall be accounted for as reductions to currentservice costs if they are linked to service or as part of the remeasurements of the net definedbenefit asset or liability if they are not linked to service. Contributions that are discretionaryshall be accounted for as reductions of current service cost upon payment of thesecontributions to the plans. The amendments to PAS 19 are to be retrospectively applied forannual periods beginning on or after July 1, 2014. The amendments have no impact in theGroup’s financial position and performance.
§ Annual Improvements to PFRSs (2010–2012 cycle)
The Annual Improvements to PFRSs (2010–2012 cycle) contain non-urgent but necessaryamendments to the following standards:
· PFRS 2, Share-based Payment – Definition of Vesting Condition. The amendmentrevised the definitions of vesting condition and market condition and added thedefinitions of performance condition and service condition to clarify various issues.This amendment shall be prospectively applied to share-based payment transactions forwhich the grant date is on or after July 1, 2014. This amendment does not apply to theGroup as it has no share-based payments.
· PFRS 3, Business Combinations – Accounting for Contingent Consideration in aBusiness Combination. The amendment clarifies that a contingent consideration thatmeets the definition of a financial instrument should be classified as a financial liabilityor as equity in accordance with PAS 32. Contingent consideration that is not classifiedas equity is subsequently measured at fair value through profit or loss whether or not itfalls within the scope of PFRS 9 (or PAS 39, if PFRS 9 is not yet adopted). Theamendment shall be prospectively applied to business combinations for which theacquisition date is on or after July 1, 2014. The Group shall consider this amendment infuture business combinations.
- 28 -
*SGVFS004197*
· PFRS 8, Operating Segments – Aggregation of Operating Segments and Reconciliationof the Total of the Reportable Segments’ Assets to the Entity’s Assets. The amendmentsrequire entities to disclose the judgment made by management in aggregating two ormore operating segments. This disclosure should include a brief description of theoperating segments that have been aggregated in this way and the economic indicatorsthat have been assessed in determining that the aggregated operating segments sharesimilar economic characteristics. The amendments also clarify that an entity shallprovide reconciliations of the total of the reportable segments’ assets to the entity’sassets if such amounts are regularly provided to the chief operating decision maker.These amendments are effective for annual periods beginning on or after July 1, 2014and are applied retrospectively. The amendments affect disclosures only and have noimpact on the Group’s financial position or performance.
· PFRS 13, Fair Value Measurement – Short-term Receivables and Payables. Theamendment clarifies that short-term receivables and payables with no stated interestrates can be held at invoice amounts when the effect of discounting is immaterial.
· PAS 16, Property, Plant and Equipment – Revaluation Method – ProportionateRestatement of Accumulated Depreciation. The amendment clarifies that, uponrevaluation of an item of property, plant and equipment, the carrying amount of the assetshall be adjusted to the revalued amount, and the asset shall be treated in one of thefollowing ways:
a. The gross carrying amount is adjusted in a manner that is consistent with therevaluation of the carrying amount of the asset. The accumulated depreciation atthe date of revaluation is adjusted to equal the difference between the gross carryingamount and the carrying amount of the asset after taking into account anyaccumulated impairment losses.
b. The accumulated depreciation is eliminated against the gross carrying amount of theasset.
The amendment is effective for annual periods beginning on or after July 1, 2014. Theamendment shall apply to all revaluations recognized in annual periods beginning on orafter the date of initial application of this amendment and in the immediately precedingannual period. The amendment has no impact on the Group’s financial position orperformance as it does not have property, plant and equipment carried at revaluedamounts.
· PAS 24, Related Party Disclosures – Key Management Personnel. The amendmentsclarify that an entity is a related party of the reporting entity if the said entity, or anymember of a group for which it is a part of, provides key management personnelservices to the reporting entity or to the parent company of the reporting entity. Theamendments also clarify that a reporting entity that obtains management personnelservices from another entity (also referred to as management entity) is not required todisclose the compensation paid or payable by the management entity to its employees ordirectors. The reporting entity is required to disclose the amounts incurred for the keymanagement personnel services provided by a separate management entity. Theamendments are effective for annual periods beginning on or after July 1, 2014 and areapplied retrospectively. The amendments affect disclosures only and have no impact onthe Group’s financial position or performance.

- 29 -
*SGVFS004197*
· PAS 38, Intangible Assets – Revaluation Method – Proportionate Restatement ofAccumulated Amortization. The amendments clarify that, upon revaluation of anintangible asset, the carrying amount of the asset shall be adjusted to the revaluedamount, and the asset shall be treated in one of the following ways:
a. The gross carrying amount is adjusted in a manner that is consistent with therevaluation of the carrying amount of the asset. The accumulated amortization atthe date of revaluation is adjusted to equal the difference between the gross carryingamount and the carrying amount of the asset after taking into account anyaccumulated impairment losses.
b. The accumulated amortization is eliminated against the gross carrying amount of theasset.
The amendments also clarify that the amount of the adjustment of the accumulatedamortization should form part of the increase or decrease in the carrying amountaccounted for in accordance with the standard.
The amendments are effective for annual periods beginning on or after July 1, 2014.The amendments shall apply to all revaluations recognized in annual periods beginningon or after the date of initial application of this amendment and in the immediatelypreceding annual period. The amendments have no impact on the Group’s financialposition or performance as it does not have intangible assets carried at revaluedamounts.
§ Annual Improvements to PFRSs (2011–2013 cycle)
The Annual Improvements to PFRSs (2011–2013 cycle) contain non-urgent but necessaryamendments to the following standards:
· PFRS 1, First-time Adoption of Philippine Financial Reporting Standards – Meaning of‘Effective PFRSs’. The amendment clarifies that an entity may choose to apply either acurrent standard or a new standard that is not yet mandatory, but that permits earlyapplication, provided either standard is applied consistently throughout the periodspresented in the entity’s first PFRS financial statements. This amendment is notapplicable to the Group as it is not a first-time adopter of PFRS.
· PFRS 3, Business Combinations – Scope Exceptions for Joint Arrangements. Theamendment clarifies that PFRS 3 does not apply to the accounting for the formation of ajoint arrangement in the financial statements of the joint arrangement itself. Theamendment is effective for annual periods beginning on or after July 1 2014 and isapplied prospectively.
· PFRS 13, Fair Value Measurement – Portfolio Exception. The amendment clarifies thatthe portfolio exception in PFRS 13 can be applied to financial assets, financial liabilitiesand other contracts. The amendment is effective for annual periods beginning on orafter July 1 2014 and is applied prospectively. The amendment has no significantimpact on the Group’s financial position or performance.
· PAS 40, Investment Property. The amendment clarifies the interrelationship betweenPFRS 3 and PAS 40 when classifying property as investment property or owner-occupied property. The amendment stated that judgment is needed when determiningwhether the acquisition of investment property is the acquisition of an asset or a group
- 30 -
*SGVFS004197*
of assets or a business combination within the scope of PFRS 3. This judgment is basedon the guidance of PFRS 3. This amendment is effective for annual periods beginningon or after July 1, 2014 and is applied prospectively. The Group shall consider thisamendment in future acquisitions of investment properties.
§ PFRS 9, Financial Instruments. PFRS 9, as issued, reflects the first and third phases of theproject to replace PAS 39 and applies to the classification and measurement of financial assetsand liabilities and hedge accounting, respectively. Work on the second phase, which relate toimpairment of financial instruments, and the limited amendments to the classification andmeasurement model is still ongoing, with a view to replace PAS 39 in its entirety. PFRS 9requires all financial assets to be measured at fair value at initial recognition. A debt financialasset may, if the fair value option (FVO) is not invoked, be subsequently measured atamortized cost if it is held within a business model that has the objective to hold the assets tocollect the contractual cash flows and its contractual terms give rise, on specified dates, tocash flows that are solely payments of principal and interest on the principal outstanding. Allother debt instruments are subsequently measured at fair value through profit or loss. Allequity financial assets are measured at fair value either through other comprehensive income(OCI) or profit or loss. Equity financial assets held for trading must be measured at fair valuethrough profit or loss. For liabilities designated as at FVPL using the fair value option, theamount of change in the fair value of a liability that is attributable to changes in credit riskmust be presented in OCI. The remainder of the change in fair value is presented in profit orloss, unless presentation of the fair value change relating to the entity’s own credit risk in OCIwould create or enlarge an accounting mismatch in profit or loss. All other PAS 39classification and measurement requirements for financial liabilities have been carried forwardto PFRS 9, including the embedded derivative bifurcation rules and the criteria for using theFVO. The adoption of the first phase of PFRS 9 will have an effect on the classification andmeasurement of the Group’s financial assets, but will potentially have no impact on theclassification and measurement of financial liabilities.
On hedge accounting, PFRS 9 replaces the rules-based hedge accounting model ofPAS 39 with a more principles-based approach. Changes include replacing the rules-basedhedge effectiveness test with an objectives-based test that focuses on the economicrelationship between the hedged item and the hedging instrument, and the effect of credit riskon that economic relationship; allowing risk components to be designated as the hedged item,not only for financial items, but also for non-financial items, provided that the risk componentis separately identifiable and reliably measurable; and allowing the time value of an option,the forward element of a forward contract and any foreign currency basis spread to beexcluded from the designation of a financial instrument as the hedging instrument andaccounted for as costs of hedging. PFRS 9 also requires more extensive disclosures for hedgeaccounting.
PFRS 9 currently has no mandatory effective date. PFRS 9 may be applied before thecompletion of the limited amendments to the classification and measurement model andimpairment methodology. The Group will not adopt the standard before the completion of thelimited amendments and the second phase of the project.
§ Philippine Interpretation IFRIC 15, Agreements for the Construction of Real Estate, coversaccounting for revenue and associated expenses by entities that undertake the construction ofreal estate directly or through subcontractors. The interpretation requires that revenue onconstruction of real estate be recognized only upon completion, except when such contractqualifies as construction contract to be accounted for under PAS 11, Construction Contracts,or involves rendering of services in which case revenue is recognized based on stage of
- 31 -
*SGVFS004197*
completion. Contracts involving provision of services with the construction materials andwhere the risks and reward of ownership are transferred to the buyer on a continuous basiswill also be accounted for based on stage of completion. The SEC and the FinancialReporting Standards Council have deferred the effectivity of this interpretation until the finalRevenue standard is issued by the International Accounting Standards Board and anevaluation of the requirements of the final Revenue standard against the practices of thePhilippine real estate industry is completed. The adoption of this interpretation will result to achange in the revenue and cost recognition from percentage of completion method tocompleted contract method. The Group has made an assessment and is continuouslymonitoring the impact of this new interpretation to its consolidated financial statements.
4. Significant Accounting Judgments, Estimates and Assumptions
The preparation of the consolidated financial statements requires management to make judgments,estimates and assumptions that affect the reported amounts of revenue, expenses, assets andliabilities, and the disclosure of contingent liabilities, at the reporting date. However, uncertaintyabout these estimates and assumptions could result in outcomes that could require a materialadjustment to the carrying amount of the affected asset or liability in the future.
JudgmentsIn the process of applying the Group’s accounting policies, management has made the followingjudgments, apart from those involving estimations, which have the most significant effect on theamounts recognized in the consolidated financial statements:
Functional Currency. The Parent Company has determined that its functional currency is thePhilippine peso. It is the currency of primary economic environment in which the ParentCompany operates.
Revenue Recognition on Real Estate. The Group’s process of selecting an appropriate revenuerecognition method for a particular real estate sales transaction requires certain judgments basedon the buyer’s commitment on the sale which may be ascertained through the significance of thebuyer’s initial investment and completion of development. The buyer’s commitment is evaluatedbased on collections, credit standing of the buyer and location of the property. The completion ofdevelopment is determined based on engineer’s judgments and estimates on the physical portionof contract work done and the completion of development beyond the preliminary stage.
Revenue from real estate sales amounted to P=21,242.1 million, P=22,499.7 million andP=17,215.1 million for the years ended December 31, 2013, 2012 and 2011, respectively.
Property Acquisitions and Business Combinations. The Group acquires subsidiaries which ownreal estate. At the time of acquisition, the Group considers whether the acquisition represents anacquisition of a business or a group of assets and liabilities. The Group accounts for anacquisition as a business combination if it acquires an integrated set of business processes inaddition to the real estate property. The consideration is made to the extent that the significantbusiness processes are acquired and the additional services to be provided by the subsidiary.
When the acquisition of subsidiary does not constitute a business, it is accounted for as anacquisition of a group of assets and liabilities. The purchase price of the acquisition is allocated tothe assets and liabilities acquired based upon their relative fair values at the date of acquisition, nogoodwill or deferred tax is recognized.
- 32 -
*SGVFS004197*
Classification of Property. The Group determines whether a property is classified as investmentproperty, land and development or property and equipment as follows:
§ Investment property comprises building spaces and improvements which are not occupied foruse by, or in the operations of, the Group, nor for sale in the ordinary course of business, butare held primarily to earn rental income and capital appreciation.
§ Land and development comprises property that is held for sale in the ordinary course ofbusiness in which the Group develops and intends to sell on or before completion ofconstruction.
§ Property and equipment is held for use in the supply of goods or services or for administrativepurposes.
The Group considers each property separately in making its judgment.
The aggregate carrying values of land and development, investment properties and property andequipment amounted to P=236,599.5 million and P=197,355.1 million as at December 31, 2013 and2012, respectively (see Notes 11, 14, 15 and 16).
Consignment Arrangements on Retail Segment. The retail segment of the Group has entered intovarious consignment arrangements with suppliers. Under these arrangement, the Group bears thesignificant risks and rewards associated with the sale of goods. The Group concluded that it isacting as principal in the sales transaction with customers. Accordingly, sales revenue isrecognized at gross amount upon actual sales to customers. The related inventory stocks suppliedunder these arrangement are only payable to suppliers when actually sold.
Operating Lease Commitments - Group as Lessor. The Group has entered into commercialproperty leases in its investment property portfolio. The Group has determined, based on anevaluation of the terms and conditions of the arrangements, that it retains all the significant risksand rewards of ownership of the properties and thus accounts for the contracts as operating leases.
Rent income amounted to P=27,929.4 million, P=24,695.6 million and P=20,832.7 million for theyears ended December 31, 2013, 2012 and 2011, respectively.
Operating Lease Commitments - Group as Lessee. The Group has entered into various leaseagreements as a lessee. Management has determined that all the significant risks and benefits ofownership of these properties, which the Group leases under operating lease arrangements, remainwith the lessor. Accordingly, the leases were accounted for as operating leases.
Rent expense amounted to P=7,295.1 million, P=4,876.3 million and P=3,463.7 million for the yearsended December 31, 2013, 2012 and 2011, respectively (see Note 24).
Assessing Significant Influence over Associates. Significant influence is presumed when there is aholding of 20% or more of the voting power of the investee (held directly or indirectly, throughsubsidiaries). Management assessed that the Group has significant influence over all its associatesby virtue of the Group’s holding more than 20% voting power in the investee, representation onthe board of directors, and participation in policy-making processes of the associates.
The carrying value of the investments in associates as at December 31, 2013 and 2012 amountedto P=133,814.2 million and P=128,453.7 million, respectively (see Note 13).

- 33 -
*SGVFS004197*
Assessing Joint Control of an Arrangement and the Type of Arrangement. Joint control is thecontractually agreed sharing of control of an arrangement, which exists only when decisions aboutthe relevant activities require the unanimous consent of the parties sharing control. Managementassessed that the Group has joint control of Waltermart Mall by virtue of a contractual agreementwith other shareholders. Waltermart Mall is a joint venture arrangement as it is a separate legalentity and its stockholders have rights to its net assets.
The carrying value of the investment in Waltermart Mall amounted to P=5,180.2 million as atDecember 31, 2013 (see Note 13).
Impairment of AFS Investments - Significant or Prolonged Decline in Fair Value. The Groupdetermines that an AFS investment is impaired when there has been a significant or prolongeddecline in the fair value below its cost. The Group determines that a decline in fair value ofgreater than 20% of cost is considered to be a significant decline and a decline for a period oflonger than 12 months is considered to be a prolonged decline. The determination of what issignificant or prolonged requires judgment. In making this judgment, the Group evaluates, amongother factors, the normal volatility in price. In addition, impairment may be appropriate whenthere is evidence of deterioration in the financial health of the investee, industry and sectorperformance.
There was no impairment loss recognized on AFS investments for the years ended December 31,2013, 2012 and 2011. The carrying values of AFS investments amounted to P=17,158.3 millionand P=19,307.8 million as at December 31, 2013 and 2012, respectively (see Notes 9 and 12).
Assessing of Control of Investees. The Group controls an investee when it is exposed, or hasrights, to variable returns from its involvement with the investee and when it has the ability toaffect those returns through its power over the investee.
Net Group. On December 2, 2013, SMIC entered into Shareholders Agreement and SharePurchase Agreement for the acquisition of ownership interest in the Net Group. The acquisitionincluded a purchase of five (5) land-holding companies where SMIC obtained 90% economicinterest and 40% voting interest. Management assessed that SMIC has control of theseland-holding companies as the contracting party intend to align the voting interest in the land-holding companies to reflect the economic interest in these subsidiaries. SMIC has secured itsinterest in the land by virtue of its long-term leases on both the buildings and land (see Note 5).
BDO. The Group has 48% ownership interest in BDO which is accounted for as an associate.Management assessed that the Group does not have control of BDO as the Group’s voting rightsare not sufficient to give it power to direct the relevant activities of BDO (see Note 13).
Estimates and AssumptionsThe key assumptions concerning the future and other key sources of estimation uncertainty at theend of the reporting period that have a significant risk of causing material adjustments to thecarrying amounts of assets and liabilities within the next financial year are discussed below:
Revenue and Cost Recognition. The Group’s revenue recognition policies require management tomake use of estimates and assumptions that may affect the reported amounts of revenues andcosts. The Group’s revenue from real estate and construction contracts recognized based on thepercentage of completion are measured principally on the basis of the estimated completion of aphysical proportion of the contract work.

- 34 -
*SGVFS004197*
Revenue from sale of real estate amounted to P=21,242.1 million, P=22,499.7 million andP=17,215.1 million for the years ended December 31, 2013, 2012, and 2011, respectively, whilecost of real estate sold amounted to P=12,243.5 million, P=14,124.8 million and P=10,289.0 millionfor the years ended December 31, 2013, 2012 and 2011, respectively.
Impairment of Receivables. The Group maintains an allowance for impairment loss at a levelconsidered adequate to provide for potential uncollectible receivables. The level of allowance isevaluated by the Group on the basis of factors that affect the collectibility of the accounts. Thesefactors include, but are not limited to, the length of the Group’s relationship with the customersand counterparties, average age of accounts and collection experience. The Group performs aregular review of the age and status of these accounts, designed to identify accounts with objectiveevidence of impairment and to provide the appropriate allowance for doubtful accounts. Thereview is accomplished using a combination of specific and collective assessment. The amountand timing of recorded expenses for any period would differ if the Group made differentjudgments or utilized different methodologies. An increase in allowance for impairment losswould increase the recorded selling, general and administrative expenses and decrease current andnoncurrent assets.
Allowance for impairment loss amounted to P=340.6 million and P=161.0 million as atDecember 31, 2013 and 2012, respectively (see Notes 10 and 11) . Receivables, including non-trade receivables, advances and deposits, accrued interest receivable and receivable from banksand credit cards included under “Other current assets” account and advances for projectdevelopment, noncurrent portion of receivables from real estate buyers and long-term notesincluded under “Other noncurrent assets” account, amounted to P=54,749.1 million andP=45,312.6 million as at December 31, 2013 and 2012, respectively (see Notes 10, 11 and 17).
Impairment of AFS Investments - Calculation of Impairment Losses. The computation for theimpairment of AFS debt instruments requires an estimation of the present value of the expectedfuture cash flows and the selection of an appropriate discount rate. In the case of AFS equityinstruments, the Group expands its analysis to consider changes in the investee’s industry andsector performance, legal and regulatory framework, changes in technology and other factors thataffect the recoverability of the Group’s investments.
Allowance for impairment loss amounted to P=31.2 million and P=45.1 million as at December 31,2013 and 2012. The carrying values of AFS investments amounted to P=17,158.3 million andP=19,307.8 million as at December 31, 2013 and 2012, respectively (see Notes 9 and 12).
Net Realizable Value of Merchandise Inventories, Condominium Units for Sale, and Land andDevelopment. The Group writes down merchandise inventories, condominium units for sale, andland and development to net realizable value, through the use of an allowance account, wheneverthe net realizable value of the assets become lower than cost due to damage, physicaldeterioration, obsolescence, changes in price levels or other causes.
Estimates of net realizable value are based on the most reliable evidence available at the time theestimates are made of the amount the assets are expected to be realized. These estimates take intoconsideration fluctuations of price or cost directly relating to events occurring after reportingperiod to the extent that such events confirm conditions existing at the end of the reporting period.
The allowance account is reviewed on a regular basis to reflect the accurate valuation in thefinancial records.

- 35 -
*SGVFS004197*
In 2013 and 2012, the Group assessed that the net realizable values of merchandise inventories,condominium units for sale and land and development are higher than cost, hence, the Group didnot recognize any losses on write down of the assets. The carrying values of merchandiseinventories amounted to P=13,232.3 million and P=13,402.8 million as at December 31, 2013 and2012, respectively (see Note 23). The carrying values of condominium units for sale includedunder “Other current assets” account amounted to P=6,213.5 million and P=2,670.9 million as atDecember 31, 2013 and 2012, respectively (see Note 11). The carrying values of land anddevelopment amounted to P=38,209.7 million and P=30,197.9 million as at December 31, 2013 and2012, respectively (see Notes 11 and 16).
Estimated Useful Lives of Property and Equipment and Investment Properties. The useful life ofeach of the Group’s property and equipment and investment properties is estimated based on theperiod over which the asset is expected to be available for use. Such estimation is based on acollective assessment of industry practice, internal technical evaluation and experience withsimilar assets. The estimated useful life of each asset is reviewed periodically and updated ifexpectations differ from previous estimates due to physical wear and tear, technical or commercialobsolescence and legal or other limitations on the use of the asset. It is possible, however, thatfuture financial performance could be materially affected by changes in the amounts and timing ofrecorded expenses brought about by changes in the factors mentioned above. A reduction in theestimated useful life of any property and equipment and investment properties would increase therecorded selling, general and administrative expenses and decrease noncurrent assets.
The total carrying values of property and equipment and investment properties amounted toP=210,932.6 million and P=167,157.2 million as at December 31, 2013 and 2012, respectively(see Notes 14 and 15).
Impairment of Investments in Shares of Stock of Associates. Impairment review of investments inshares of stock of associates is performed when events or changes in circumstances indicate thatthe carrying value may not be recoverable. This requires management to make an estimate of theexpected future cash flows from the investments and to choose a suitable discount rate in order tocalculate the present value of those cash flows.
The Group reversed impairment loss amounting to P=775.0 million and P=3,542.7 million in 2013and 2012, respectively, and no allowance was recognized for impairment loss in 2013 and 2012.Allowance for impairment loss amounted to nil and P=775.0 million as at December 31, 2013 and2012, respectively. The carrying values of investments in shares of stock of associates amountedto P=133,814.2 million and P=128,453.7 million as at December 31, 2013 and 2012, respectively(see Note 13).
Impairment of Goodwill and Trademarks and Brand Names with Indefinite Useful Lives.Impairment exists when the carrying value of an asset or cash generating unit exceeds itsrecoverable amount, which is the higher of its fair value less costs of disposal and its value in use.Fair value less costs of disposal calculation is based on available data from binding salestransactions, conducted at arm’s length, for similar assets or observable market prices lessincremental costs for disposing of the asset. The value in use calculations is based on a discountedcash flow model. The cash flows are derived from the budget for the next three years and do notinclude restructuring activities that the Group is not yet committed to or significant futureinvestments that will enhance the assets. The recoverable amount is most sensitive to the pre-taxdiscount rates used for the discounted cash flow model as well as the expected future cash inflowsand the growth rate used for extrapolation purposes. The key assumptions used to determine therecoverable amount for the different cash generating units are further discussed in Note 17.
- 36 -
*SGVFS004197*
The total carrying values of goodwill and trademarks and brand names with indefinite usefullives arising from business combinations amounted P=20,255.1 million and P=15,354.2 million as atDecember 31, 2013 and 2012, respectively (see Note 17).
Impairment of Other Nonfinancial Assets. The Group assesses at each reporting date whetherthere is an indication that an item of property and equipment and investment properties may beimpaired. Determining the value of the assets, which requires the determination of future cashflows expected to be generated from the continued use and ultimate disposition of such assets,requires the Group to make estimates and assumptions that can materially affect the consolidatedfinancial statements. Future events could cause the Group to conclude that these assets areimpaired. Any resulting impairment loss could have a material impact on the financial positionand performance of the Group.
The preparation of the estimated future cash flows involves judgments and estimations. While theGroup believes that its assumptions are appropriate and reasonable, significant changes in theseassumptions may materially affect the Group’s assessment of recoverable values and may lead tofuture additional impairment charges.
Allowance for impairment loss on investment properties amounted to P=923.2 million as atDecember 31, 2013 and 2012 (see Note 15). The total carrying values of property and equipmentand investment properties amounted to P=210,932.6 million and P=167,157.2 million as atDecember 31, 2013 and 2012, respectively (see Notes 14 and 15).
Purchase Price Allocation in Business Combinations. The acquisition method requires extensiveuse of accounting estimates and judgments to allocate the purchase price to the fair market valuesof the acquiree’s identifiable assets and liabilities at acquisition date. It also requires the acquirerto recognize goodwill. The Group’s acquisitions have resulted in goodwill and separaterecognition of trademarks and brand names with indefinite lives.
In 2013, the Group acquired 90% ownership interest in Net Group and 51% ownership interest inWaltermart Supermarket, Inc. (WSI). The acquisition was accounted on provisional basis pendingdetermination of the fair value of Net Group’s and WSI’s net assets as at December 31, 2013(see Note 5).
In 2011, the Group acquired 17.9% equity interest in Atlas Consolidated Mining and DevelopmentCorporation (Atlas). The acquisition was accounted on provisional basis pending the fair value ofAtlas’ net assets as at December 31, 2011. In 2012, the fair values of the net assets acquired werefinalized where the resulting goodwill from the acquisition formed part of the cost of investmentin shares of stock of Atlas (see Note 13).
In 2012, SMIC increased its ownership in Atlas from 17.9% to 28.4%. The goodwill resultingfrom the acquisition formed part of the cost of investment in shares of stock of Atlas(see Note 13).
The total carrying values of goodwill and trademarks and brand names with indefinite useful livesarising from business combinations amounted P=20,255.1 million and P=15,354.2 million as atDecember 31, 2013 and 2012, respectively (see Note 17).

- 37 -
*SGVFS004197*
Realizability of Deferred Tax Assets. The carrying amount of deferred tax assets is reviewed at theend of each reporting period and reduced to the extent that it is no longer probable that sufficienttaxable profit will be available to allow all or part of the deferred tax assets to be utilized. TheGroup’s assessment on the recognition of deferred tax assets on deductible temporary differencesand carryforward benefits of excess minimum corporate income tax (MCIT) and net operating losscarryover (NOLCO) is based on the projected taxable income in future periods. Based on theprojection, not all deductible temporary differences and carryforward benefits of excess MCIT andNOLCO will be realized. Consequently, only a portion of the Group’s deferred tax assets wasrecognized.
Deferred tax assets recognized in the consolidated balance sheets as at December 31, 2013 and2012 amounted to P=2,172.8 million and P=642.1 million, respectively, while the unrecognizeddeferred tax assets amounted to P=304.6 million and P=1,902.3 million as at December 31, 2013 and2012, respectively (see Note 27).
Present Value of Defined Benefit Obligation. The present value of the pension obligationsdepends on a number of factors that are determined on an actuarial basis using a number ofassumptions. The assumptions used in determining the net cost for pensions include, amongothers, discount rate, and rate of salary increase. Actual results that differ from the Group’sassumptions are accumulated and amortized over future periods and therefore, generally affect therecognized expense and recorded obligation in such future periods.
The Group determines the appropriate discount rate at the end of each reporting period. It is theinterest rate that should be used to determine the present value of estimated future cash outflowsexpected to be required to settle the pension obligations. In determining the appropriate discountrate the Group considers the interest rates on government bonds that are denominated in thecurrency in which the benefits will be paid, and that have terms to maturity approximating theterms of the related pension liability.
Other key assumptions for pension obligations are based on current market conditions.
While it is believed that the Group’s assumptions are reasonable and appropriate, significantdifferences in actual experience or significant changes in assumptions may materially affect theGroup’s pension and other pension obligations.
The Group’s defined benefit asset amounted to P=616.0 million and P=452.9 million as atDecember 31, 2013 and 2012, respectively (see Notes 17 and 26). While the Group’s definedbenefit liability amounted to P=154.3 million and P=28.3 million as at December 31, 2013 and 2012,respectively (see Note 26).
Fair Value of Financial Assets and Liabilities. The Group carries certain financial assets andliabilities at fair value, which requires extensive use of accounting judgments and estimates. Thesignificant components of fair value measurement were determined using verifiable objectiveevidence (i.e., foreign exchange rates, interest rates and volatility rates). The amount of changesin fair value would differ if the Group utilized different valuation methodologies and assumptions.Any changes in the fair value of these financial assets and liabilities would directly affect profit orloss and other comprehensive income.
The fair value of financial assets and liabilities are discussed in Note 30.

- 38 -
*SGVFS004197*
Contingencies. The Group is currently involved in legal and administrative proceedings. TheGroup’s estimate of the probable costs for the resolution of these proceedings has been developedin consultation with outside legal counsel handling defense in these matters and is based upon ananalysis of potential results. The Group currently does not believe that these proceedings willhave a material adverse effect on its financial position and performance. It is possible, however,that future financial performance could be materially affected by changes in the estimates or in theeffectiveness of strategies relating to these proceedings. No accruals were made in relation tothese proceedings.
5. Corporate Restructuring and Significant Acquisitions
Corporate RestructuringIn 2013, SM Prime initiated a corporate restructuring exercise to consolidate all of the SMGroup’s real estate subsidiaries and real estate assets under one single listed entity which is SMPrime (collectively, the “SM Property Group”). The overall objective is to bring to the equitiesmarket the most comprehensive and integrated Philippine property company that will engage theinvestor community in the long-term growth potential not just of the Philippine property sector,but also of the consumer and tourism sectors. This will leverage on SM’s strong brand franchise,group synergies, dominant position in mall and residential development, extensive marketing andsupplier network, huge landbank and other resources to strongly enhance the overall value of thecompany and all its future projects, which also include township and mixed-use development,commercial and resorts development, and hotels and convention centers.
Following are the significant corporate restructuring transactions of the SM Property Group:
a. SM Land’s Tender Offers for SMDC and HPI
Both SMDC and HPI are companies primarily engaged in real estate development listed in thePSE and registered with the Philippine SEC. On June 4, 2013, SM Land launched a tenderoffer to the existing shareholders of SMDC and HPI in exchange for SM Prime shares held bySM Land. The terms of the tender offer were executed at an exchange ratio of 0.472 SMPrime share for 1 SMDC share and 0.135 SM Prime share for 1 HPI share. The exchangeratios were arrived at based on SM Prime’s one month volume-weighted average price(VWAP) of P=18.66 per share and a six percent premium to SMDC’s one month VWAP ofP=8.303 per share. For HPI, the exchange ratios were arrived at based on SM Prime’s onemonth VWAP of P=18.66 per share and a fifteen percent premium to HPI’s one month VWAPof P=2.195 per share. The tender offers were completed on August 12, 2013. Total number ofSM Prime common shares held by SM Land exchanged to complete the tender offer toshareholders of SMDC and HPI is 1,778,427,940. After the completion of the Tender Offer,SMDC and HPI became 98.9% and 99.9% subsidiaries of SM Land.
Subsequently, on November 5, 2013, SMDC and HPI were delisted from the PSE.
b. Merger of SM Prime and SM Land
Following the completion of the tender offer, on October 10, 2013, the SEC approved themerger of SM Prime and SM Land via a share-for-share swap where the stockholders ofSM Land received new SM Prime shares in exchange for their shareholdings in SM Land.SM Prime is the surviving entity while SM Land is the absorbed entity. As a result of themerger, SMDC and HPI became subsidiaries of SM Prime effective October 10, 2013. Inaddition to the shareholdings in SMDC and HPI, SM Prime now holds SM Land’s real estate
- 39 -
*SGVFS004197*
assets which includes among others, Mall of Asia Complex (MOAC), office buildings such asTwo E-Com in MOAC, Cyber 1 and Cyber 2 in Makati, and certain real properties leased toSM SaveMore and SM Department Store. The merger ratio of 738 SM Prime shares for 1 SMLand share were arrived based on the net appraised values of SM Prime and SM Land as atFebruary 28, 2013 as conducted by CB Richard Ellis. The total number of new SM Primecommon shares issued to SM Land shareholders is 14,390,923,857.
c. Acquisition of unlisted real estate companies and real estate assets from SMIC and the SyFamily
On October 10, 2013, the SEC approved SM Prime’s acquisition of SMIC’s unlisted realestate companies including SM Hotels and Conventions Corp. (SMHCC), SM Arena ComplexCorporation (SMACC), Costa del Hamilo, Inc. (Costa), Prime Metro Estate, Inc. (PMI) andTagaytay Resort and Development Corporation (TRDC) (collectively, the “Unlisted RealEstate Companies”). The SEC likewise approved SM Prime’s acquisition of real propertyassets of SMIC which includes among others, SMX Convention Center in MOAC and realproperties located in Tagaytay, by issuing new SM Prime shares to SMIC. The unlisted realestate companies and real estate assets of SMIC were acquired based on the appraised valuesas at February 28, 2013 as conducted by CB Richard Ellis. The total acquisition price of theunlisted real estate companies and real property assets amounted to P=25.8 billion equivalent to1,382,841,458 SM Prime common shares issued based on SM Prime 30-day VWAP ofP=18.66.
The Group viewed the series of the corporate restructuring transactions described above as a“single” or “linked” arrangements effected by the Sy Family (the Controlling Shareholder) to re-organize its real estate businesses and assets. The companies and real estate assets (accounted foras business units) involved in the restructuring are all under the common control by the Sy Family.
The impact to SMIC of the SM Property Group corporate restructuring are as follows:
SMDC, SM Land, SM Prime and Unlisted Real Estate Companies. The corporate restructuringresulted in changes in SMIC’s ownership interest in these subsidiaries only without loss of control.The related transaction costs of P=1,862.1 million was recorded under the “Equity adjustment fromcommon control transactions” account.
HPI. The increase in ownership interest of HPI from 27% to 51% resulted in acquisition ofcontrol. HPI is ultimately controlled by the Sy Family, hence, the transaction was accounted foras a step acquisition of an associate under common control. HPI was consolidated beginning2013. The related transaction costs of P=38.1 million was recognized as an expense under“Selling, general and administrative expenses” account of the 2013 consolidated statement ofincome.
The difference of P=1,610.7 million between the carrying value of the net assets disposed tonon-controlling interests and the carrying value of the net assets acquired from non-controllinginterests was recorded as part of the “Equity adjustment from common control transactions”account in the equity section of the December 2013 consolidated balance sheet.

- 40 -
*SGVFS004197*
Acquisitions
Net Group. On December 2, 2013, SMIC entered into a Shareholders Agreement and SharePurchase Agreement for the acquisition of ownership interests in the following companies(collectively, the “Net Group”):
Company Voting Interest Economic Interest6-24 Property Holdings, Inc. 90% 90%14-678 Property Holdings, Inc. 90% 90%19-1 Property Holdings, Inc. 90% 90%18-2 Property Holdings, Inc. 90% 90%6-3 Property Holdings, Inc. 90% 90%Crescent Park 6-24 Property Holdings, Inc. 40% 90%Crescent Park 14-678 Property Holdings, Inc. 40% 90%Crescent Park 19-1 Property Holdings, Inc. 40% 90%Crescent Park 18-2 Property Holdings, Inc. 40% 90%Crescent Park 6-3 Property Holdings, Inc. 40% 90%
As a result of the acquisition, the Net Group became a partially-owned subsidiary of the Group.The primary reason for acquiring the Net Group was to expand the Group’s commercialdevelopment’s operation across major commercial business districts.
The acquisition was accounted for based on provisional fair values of the identifiable assets andliabilities as at the date of the acquisition as follows:
ProvisionalFair Values
(In Thousands)
Cash and cash equivalents P=926,304Receivables 894,298Other current assets 360,997Property and equipment (see Note 14) 3,125Investment properties (see Note 15) 18,800,000Other noncurrent assets 684,141
Total identifiable assets 21,668,865Less:
Trade payables and other current liabilities 307,758Bank loan 5,630,288Deferred tax liabilities 2,431,755Other noncurrent liabilities 1,281,597
Total identifiable liabilities 9,651,398Total identifiable net assets at fair value P=12,017,467
The amount of purchase consideration is subject to finalization after due diligence.
The Net Group’s receivables comprise mainly of lease receivables from tenants amounting toP=894.3 million which was the carrying value as at acquisition date. None of the receivables havebeen impaired and it is expected that the full contractual amounts can be collected.
- 41 -
*SGVFS004197*
The Group’s consolidated revenue and net income would have increased by P=1,647.2 million andP=646.8 million, respectively, for the year ended December 31, 2013 had the acquisition of NetGroup taken place on January 1, 2013. Total revenue and net income of Net Group included inthe consolidated financial statements for 2013 are immaterial.
WSI. In January and May 2013, SM Retail acquired a total of 193,800,000 shares of WSIequivalent to 51% ownership interest for P=3,200.0 million. WSI is mainly engaged in the businessof trading goods and merchandise. As a result of the acquisition, WSI became a partially-ownedsubsidiary of the Group. The primary reason for acquiring WSI was to expand the Group’s marketshare through the pre-existing stores of WSI.
The acquisition was accounted for based on provisional fair values of the identifiable assets andliabilities as at the date of the acquisition as follows:
ProvisionalFair Values
(In Thousands)
Cash and cash equivalents P=552,991Receivables 187,710Inventories 700,154Other current assets 154,512Property and equipment (see Note 14) 425,511Investment properties (see Note 15) 589,126Other noncurrent assets 26,535
Total identifiable assets 2,636,539Less:
Trade payables and other current liabilities 1,349,769Other liabilities 3,606
Total identifiable liabilities 1,353,375Total identifiable net assets at fair value 1,283,164Non-controlling interest measured at proportionate
share of the provisional fair value (628,750)Goodwill arising from acquisition 2,545,625Purchase consideration transferred P=3,200,039
The goodwill of P=2,545.6 million represents the value of expected synergies arising from thebusiness combination.
WSI’s receivables comprise mainly of trade receivables amounting to P=187.7 million which wasthe carrying value as at acquisition date. None of the receivables have been impaired and it isexpected that the full contractual amounts can be collected.
The Group’s consolidated revenue and net income would have increased by P=3,595.5 million andP=102.8 million, respectively, for the year ended December 31, 2013 had the acquisition of WSItaken place on January 1, 2013. Total revenue and net income of WSI included in theconsolidated financial statements for 2013 are immaterial.

- 42 -
*SGVFS004197*
The net cash outflow on the acquisition is as follows
Amount(In Thousands)
Purchase consideration, net of cash acquired(presented as investing activities) P=2,647,048
Transaction costs (presented as operating activities) 369,931P=3,016,979
CHAS Realty and Development Corporation and subsidiaries (CHAS). In January 2013, SMPrime entered into a Binding Share Purchase Agreement for the acquisition of 100% interest inCHAS. CHAS is engaged in the business of shopping mall operations which owns CabanatuanMegacenter in Nueva Ecija. The primary reason for acquiring CHAS is to expand the Group’small operations.
In December 2013, SM Prime completed its acquisition of 100% interest in CHAS.The acquisition was accounted based on provisional fair values of the identifiable assets andliabilities as at the date of the acquisition as follows:
ProvisionalFair Values
(In Thousands)
Investment properties P=1,384,990Cash and other assets 192,261 Total identifiable assets 1,577,251Less: Accounts payable and other current assets 72,259 Deferred tax liabilities 199,098
Total identifiable liabilities 271,357Total identifiable net assets at fair value 1,305,894Goowill arising from acquisition 378,721Purchase consideration transferred P=1,684,615
The goodwill of P=378.7 million represents the value of expected synergies arising from thebusiness combination.
The fair value of acquired receivables amounting to P=73 million approximates their carryingvalue. No impairment loss was provided on these receivables.
SM Prime’s consolidated revenue and net income would have increased by P=80 million anddecreased by P=105 million, respectively, for the year ended December 31, 2013 had theacquisition of CHAS taken place on January 1, 2013. Total revenue and net income of CHASincluded in the consolidated financial statements for 2013 are immaterial.
The net cash outflow from the acquisition of CHAS amounted to P=1,572.2 million.
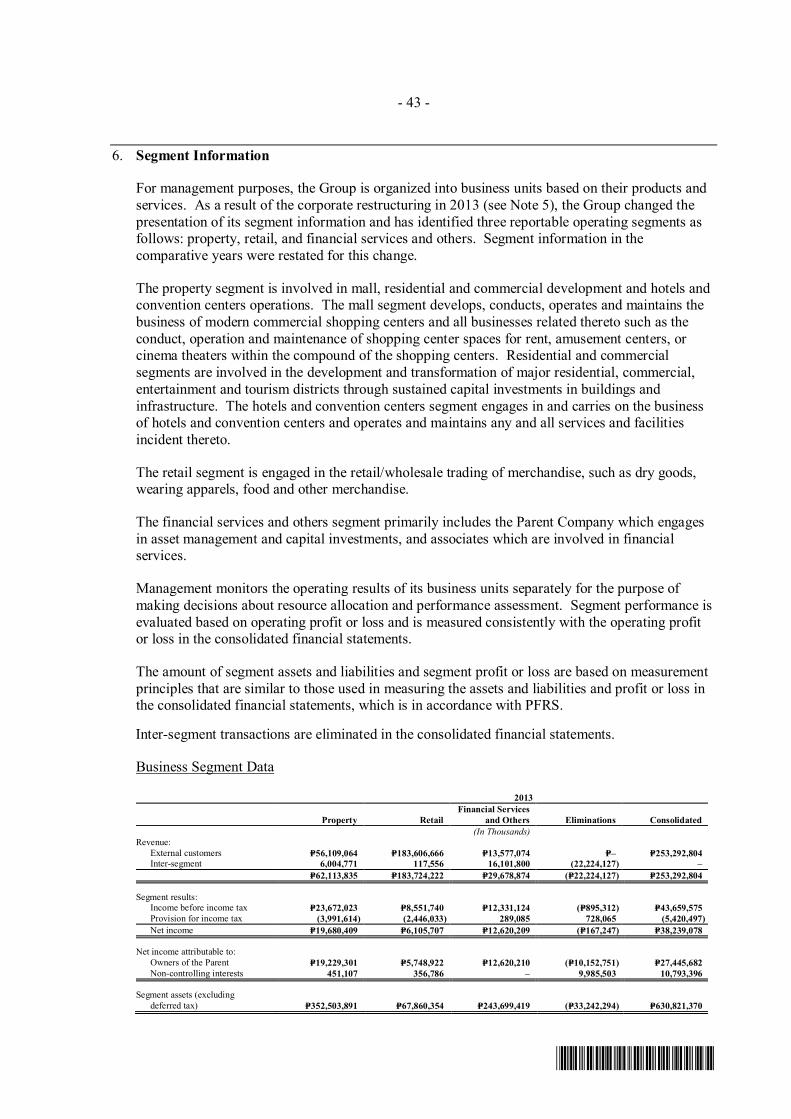
- 43 -
*SGVFS004197*
6. Segment Information
For management purposes, the Group is organized into business units based on their products andservices. As a result of the corporate restructuring in 2013 (see Note 5), the Group changed thepresentation of its segment information and has identified three reportable operating segments asfollows: property, retail, and financial services and others. Segment information in thecomparative years were restated for this change.
The property segment is involved in mall, residential and commercial development and hotels andconvention centers operations. The mall segment develops, conducts, operates and maintains thebusiness of modern commercial shopping centers and all businesses related thereto such as theconduct, operation and maintenance of shopping center spaces for rent, amusement centers, orcinema theaters within the compound of the shopping centers. Residential and commercialsegments are involved in the development and transformation of major residential, commercial,entertainment and tourism districts through sustained capital investments in buildings andinfrastructure. The hotels and convention centers segment engages in and carries on the businessof hotels and convention centers and operates and maintains any and all services and facilitiesincident thereto.
The retail segment is engaged in the retail/wholesale trading of merchandise, such as dry goods,wearing apparels, food and other merchandise.
The financial services and others segment primarily includes the Parent Company which engagesin asset management and capital investments, and associates which are involved in financialservices.
Management monitors the operating results of its business units separately for the purpose ofmaking decisions about resource allocation and performance assessment. Segment performance isevaluated based on operating profit or loss and is measured consistently with the operating profitor loss in the consolidated financial statements.
The amount of segment assets and liabilities and segment profit or loss are based on measurementprinciples that are similar to those used in measuring the assets and liabilities and profit or loss inthe consolidated financial statements, which is in accordance with PFRS.
Inter-segment transactions are eliminated in the consolidated financial statements.
Business Segment Data
2013
Property RetailFinancial Services
and Others Eliminations Consolidated(In Thousands)
Revenue: External customers P=56,109,064 P=183,606,666 P=13,577,074 P=– P=253,292,804 Inter-segment 6,004,771 117,556 16,101,800 (22,224,127) –
P=62,113,835 P=183,724,222 P=29,678,874 (P=22,224,127) P=253,292,804
Segment results: Income before income tax P=23,672,023 P=8,551,740 P=12,331,124 (P=895,312) P=43,659,575 Provision for income tax (3,991,614) (2,446,033) 289,085 728,065 (5,420,497) Net income P=19,680,409 P=6,105,707 P=12,620,209 (P=167,247) P=38,239,078
Net income attributable to: Owners of the Parent P=19,229,301 P=5,748,922 P=12,620,210 (P=10,152,751) P=27,445,682 Non-controlling interests 451,107 356,786 – 9,985,503 10,793,396
Segment assets (excludingdeferred tax) P=352,503,891 P=67,860,354 P=243,699,419 (P=33,242,294) P=630,821,370
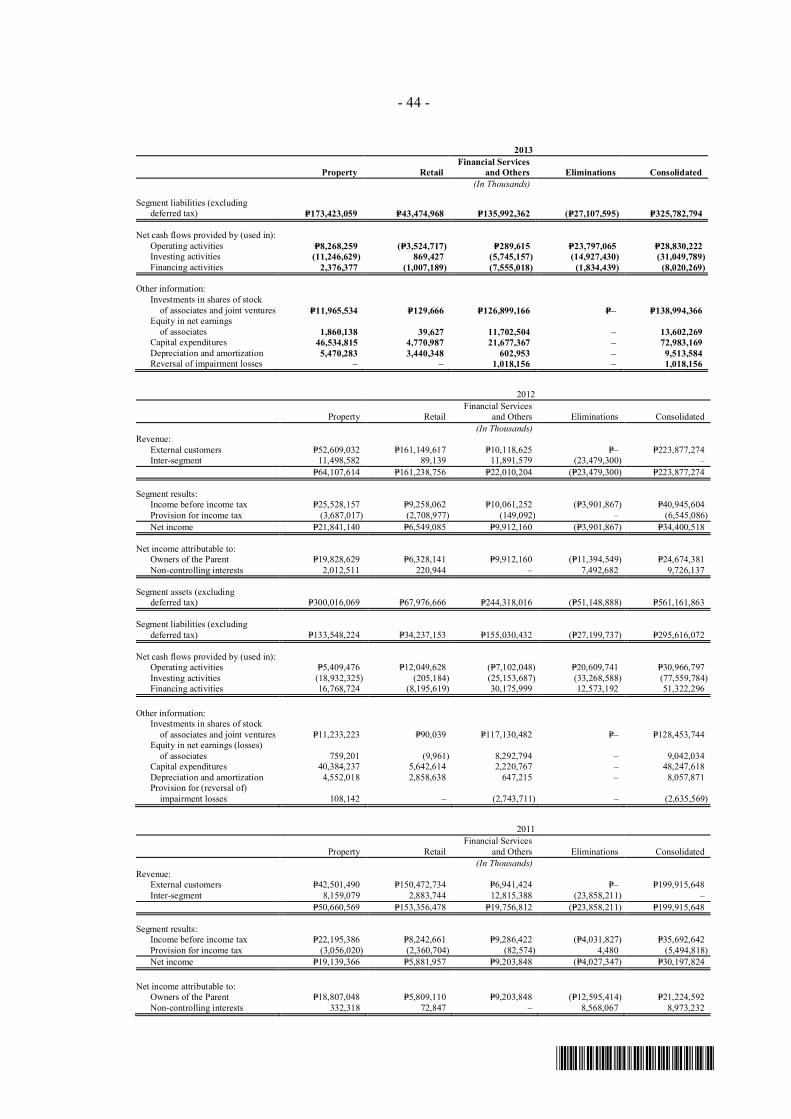
- 44 -
*SGVFS004197*
2013
Property RetailFinancial Services
and Others Eliminations Consolidated(In Thousands)
Segment liabilities (excludingdeferred tax) P=173,423,059 P=43,474,968 P=135,992,362 (P=27,107,595) P=325,782,794
Net cash flows provided by (used in): Operating activities P=8,268,259 (P=3,524,717) P=289,615 P=23,797,065 P=28,830,222 Investing activities (11,246,629) 869,427 (5,745,157) (14,927,430) (31,049,789) Financing activities 2,376,377 (1,007,189) (7,555,018) (1,834,439) (8,020,269)
Other information: Investments in shares of stock
of associates and joint ventures P=11,965,534 P=129,666 P=126,899,166 P=– P=138,994,366 Equity in net earnings
of associates 1,860,138 39,627 11,702,504 – 13,602,269 Capital expenditures 46,534,815 4,770,987 21,677,367 – 72,983,169 Depreciation and amortization 5,470,283 3,440,348 602,953 – 9,513,584 Reversal of impairment losses – – 1,018,156 – 1,018,156
2012
Property RetailFinancial Services
and Others Eliminations Consolidated(In Thousands)
Revenue: External customers P=52,609,032 P=161,149,617 P=10,118,625 P=– P=223,877,274 Inter-segment 11,498,582 89,139 11,891,579 (23,479,300) –
P=64,107,614 P=161,238,756 P=22,010,204 (P=23,479,300) P=223,877,274
Segment results: Income before income tax P=25,528,157 P=9,258,062 P=10,061,252 (P=3,901,867) P=40,945,604 Provision for income tax (3,687,017) (2,708,977) (149,092) – (6,545,086) Net income P=21,841,140 P=6,549,085 P=9,912,160 (P=3,901,867) P=34,400,518
Net income attributable to: Owners of the Parent P=19,828,629 P=6,328,141 P=9,912,160 (P=11,394,549) P=24,674,381 Non-controlling interests 2,012,511 220,944 – 7,492,682 9,726,137
Segment assets (excludingdeferred tax) P=300,016,069 P=67,976,666 P=244,318,016 (P=51,148,888) P=561,161,863
Segment liabilities (excludingdeferred tax) P=133,548,224 P=34,237,153 P=155,030,432 (P=27,199,737) P=295,616,072
Net cash flows provided by (used in): Operating activities P=5,409,476 P=12,049,628 (P=7,102,048) P=20,609,741 P=30,966,797 Investing activities (18,932,325) (205,184) (25,153,687) (33,268,588) (77,559,784) Financing activities 16,768,724 (8,195,619) 30,175,999 12,573,192 51,322,296
Other information: Investments in shares of stock
of associates and joint ventures P=11,233,223 P=90,039 P=117,130,482 P=– P=128,453,744 Equity in net earnings (losses)
of associates 759,201 (9,961) 8,292,794 – 9,042,034 Capital expenditures 40,384,237 5,642,614 2,220,767 – 48,247,618 Depreciation and amortization 4,552,018 2,858,638 647,215 – 8,057,871 Provision for (reversal of)
impairment losses 108,142 – (2,743,711) – (2,635,569)
2011
Property RetailFinancial Services
and Others Eliminations Consolidated(In Thousands)
Revenue: External customers P=42,501,490 P=150,472,734 P=6,941,424 P=– P=199,915,648 Inter-segment 8,159,079 2,883,744 12,815,388 (23,858,211) –
P=50,660,569 P=153,356,478 P=19,756,812 (P=23,858,211) P=199,915,648
Segment results: Income before income tax P=22,195,386 P=8,242,661 P=9,286,422 (P=4,031,827) P=35,692,642 Provision for income tax (3,056,020) (2,360,704) (82,574) 4,480 (5,494,818) Net income P=19,139,366 P=5,881,957 P=9,203,848 (P=4,027,347) P=30,197,824
Net income attributable to: Owners of the Parent P=18,807,048 P=5,809,110 P=9,203,848 (P=12,595,414) P=21,224,592 Non-controlling interests 332,318 72,847 – 8,568,067 8,973,232

- 45 -
*SGVFS004197*
2011
Property RetailFinancial Services
and Others Eliminations Consolidated(In Thousands)
Net cash flows provided by (used in): Operating activities P=9,923,580 P=7,656,609 P=4,643,410 (P=3,422,186) P=18,801,413 Investing activities (20,372,344) 1,158,138 (271,559) (6,408,165) (25,893,930) Financing activities 1,840,433 (8,154,976) (7,183,829) 9,470,498 (4,027,874)
Other information: Equity in net earnings (losses)
of associates and joint ventures 522,904 – 5,892,520 – 6,415,424 Capital expenditures 32,623,063 4,219,155 3,132,553 – 39,974,771 Depreciation and amortization 4,301,033 2,409,174 482,893 – 7,193,100 Provision for (reversal of)
impairment losses 479,775 – 73,611 – 553,386
7. Cash and Cash Equivalents
This account consists of:
2013 2012(In Thousands)
Cash on hand and in banks (see Note 22) P=10,202,986 P=6,098,368Temporary investments (see Notes 18 and 22) 40,006,671 54,616,352
P=50,209,657 P=60,714,720
Cash in banks earn interest at the respective bank deposit rates. Temporary investments are madefor varying periods of up to three months depending on the immediate cash requirements of theGroup, and earn interest at the respective temporary investment rates.
Interest income earned on cash and cash equivalents is disclosed in Note 25.
8. Time Deposits and Short-Term Investments
This account consists of:
2013 2012(In Thousands)
Time deposits:Pledged (see Notes 20 and 22) P=21,087,625 P=19,498,750Not pledged (see Note 22) 34,018,075 38,203,435
55,105,700 57,702,185Short-term investments (see Note 22) 887,900 821,000
55,993,600 58,523,185Less current portion 28,912,650 29,090,335Noncurrent portion P=27,080,950 P=29,432,850
A portion of the time deposits amounting to US$475.0 million, with peso equivalents ofP=21,087.6 million and P=19,498.8 million as at December 31, 2013 and 2012, respectively and bearinterest ranging from 4.1% to 5.4%, are used as collateral for loans obtained by the Group(see Note 20).

- 46 -
*SGVFS004197*
Short-term investments amounting to US$20.0 million, with peso equivalents of P=887.9 millionand P=821.0 million as at December 31, 2013 and 2012, respectively, bear a fixed interest rate of3.24%.
Interest income earned on time deposits and short-term investments is disclosed in Note 25.
9. Investments Held for Trading and Sale
This account consists of:
2013 2012(In Thousands)
Investments held for trading -Bonds (see Note 22) P=459,754 P=459,343
AFS investments (see Note 12):Bonds and corporate notes (see Note 22) – 1,733,752Shares of stock 659,226 661,446
659,226 2,395,198P=1,118,980 P=2,854,541
The Group recognized a loss of P=18.2 million for the year ended December 31, 2013 and a gain ofP=16.3 million and P=13.4 million from fair value adjustments of investments held for trading forthe years ended December 31, 2012 and 2011, respectively. The amounts are included under“Gain on sale of available-for-sale investments and fair value changes on investments held fortrading - net” account in the consolidated statements of income.
Interest income earned on investments held for trading and sale is disclosed in Note 25.
10. Receivables
This account consists of:
2013 2012(In Thousands)
Trade:Real estate buyers P=29,150,833 P=23,373,079Third-party tenants 3,329,038 3,123,358Related-party tenants (see Note 22) 2,594,444 1,512,842
Due from related parties (see Note 22) 1,334,076 2,465,971Management fees (see Note 22) 433,921 154,172Dividends 766,816 292,917Total 37,609,128 30,922,339Less allowance for impairment loss 334,891 155,274
37,274,237 30,767,065Less noncurrent portion of receivables from
real estate buyers (see Note 17) 10,636,503 14,401,513Current portion P=26,637,734 P=16,365,552

- 47 -
*SGVFS004197*
The terms and conditions of the above receivables are as follows:
§ Trade receivables from tenants and management fee receivables are noninterest-bearing andare normally collectible on a 30 to 90 days’ term.
§ Receivables from real estate buyers mainly consist of receivables subject to financing frombanks and other financial institutions with interest at market rates ranging from 13% to 18%per annum and normally collectible on a 3 to 5 years term.
§ The terms and conditions of related party receivables are further discussed in Note 22.
§ Dividends receivables are noninterest-bearing and are normally collectible within the nextfinancial year.
The movements in allowance for impairment loss are as follows:
2013 2012(In Thousands)
Balance at beginning of year P=155,274 P=47,132Provision for the year (see Note 24) 179,640 108,142Reversal of provision (23) –Balance at end of year P=334,891 P=155,274
The allowance for impairment loss pertains to receivables from real estate buyers and tenantswhich were identified through specific assessment.
The aging analysis of receivables as at December 31, 2013 and 2012 are as follows:
December 31, 2013Neither Past Due
nor ImpairedPast Due but not Impaired Individually
31–90 Days 91–120 Days Over 120 Days Impaired Total(In Thousands)
Trade:Real estate buyers:
Current P=17,142,278 P=231,862 P=145,587 P=671,699 P=322,904 P=18,514,330Noncurrent 10,636,503 – – – – 10,636,503
Related-party tenants 2,594,444 – – – – 2,594,444Third-party tenants 3,208,416 69,975 38,660 – 11,987 3,329,038
Due from related parties 1,334,076 – – – – 1,334,076Management fees -
Related parties 433,921 – – – – 433,921Dividends 766,816 – – – – 766,816Net receivables before allowance
for doubtful accounts P=36,116,454 P=301,837 P=184,247 P=671,699 P=334,891 P=37,609,128
December 31, 2012Neither Past Due
nor ImpairedPast Due but not Impaired Individually
31–90 Days 91–120 Days Over 120 Days Impaired Total(In Thousands)
Trade:Real estate buyers:
Current P=8,569,352 P=83,106 P=28,886 P=147,315 P=142,907 P=8,971,566Noncurrent 14,401,513 – – – 14,401,513
Related-party tenants 1,512,842 – – – – 1,512,842Third-party tenants 3,110,175 390 426 – 12,367 3,123,358
Due from related parties 2,465,971 – – – – 2,465,971Management fees -
Related parties 154,172 – – – – 154,172Dividends 292,917 – – – – 292,917Net receivables before allowance
for doubtful accounts P=30,506,942 P=83,496 P=29,312 P=147,315 P=155,274 P=30,922,339

- 48 -
*SGVFS004197*
Receivables, other than those identified as impaired, are assessed by the Group’s management asgood and collectible.
11. Other Current Assets
This account consists of:
2013 2012(In Thousands)
Land and development (see Note 16) P=12,542,783 P=–Prepaid taxes and other prepayments 5,652,642 5,295,701Condominium units for sale (see Note 16) 6,213,523 2,670,943Non-trade receivables, net of allowance for
impairment loss of P=5,705 5,086,936 4,247,081Advances and deposits 5,091,059 3,374,278Input tax 2,987,264 1,704,159Receivable from banks and credit cards 2,423,215 2,352,836Accrued interest receivable 959,763 1,174,785Advances for project development (see Note 22) 88,615 1,121,565Others 1,781,824 1,516,860
P=42,827,624 P=23,458,208
§ Non-trade receivables include interest-bearing advances to third parties which are normallycollectible within the next financial year.
§ Receivable from banks and credit cards are noninterest-bearing and are normally collectibleon a 30 to 90 days term.
§ Accrued interest receivable relates mostly to time deposits which will be collected atrespective maturity dates.
§ Advances for project development mostly pertain to advances made to related parties for theacquisition of land for future development.
12. Available-for-Sale Investments
This account consists of investments in:
2013 2012(In Thousands)
Shares of stock:Listed (see Note 20) P=11,539,018 P=11,516,716Unlisted 99,468 102,120
Bonds and corporate notes (see Note 20) 5,539,822 7,728,240Club shares 11,260 5,900
17,189,568 19,352,976Less allowance for impairment loss 31,250 45,132
17,158,318 19,307,844Less current portion (see Note 9) 659,226 2,395,198Long-term portion P=16,499,092 P=16,912,646
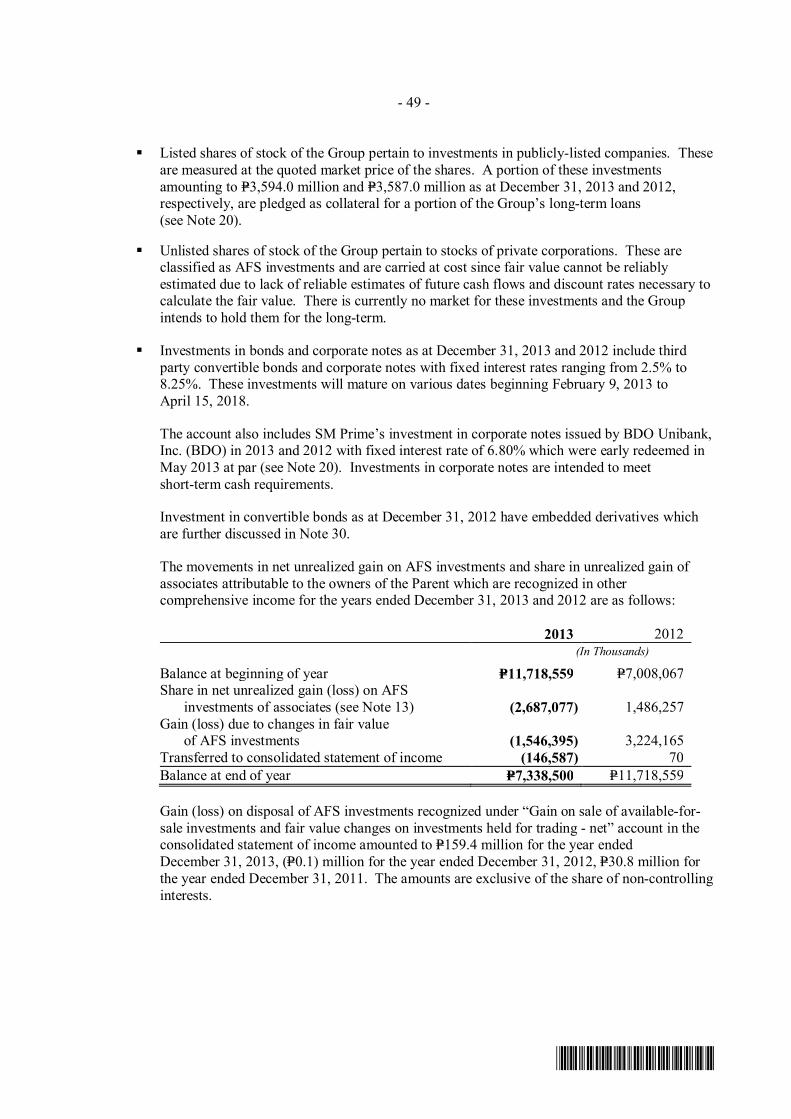
- 49 -
*SGVFS004197*
§ Listed shares of stock of the Group pertain to investments in publicly-listed companies. Theseare measured at the quoted market price of the shares. A portion of these investmentsamounting to P=3,594.0 million and P=3,587.0 million as at December 31, 2013 and 2012,respectively, are pledged as collateral for a portion of the Group’s long-term loans(see Note 20).
§ Unlisted shares of stock of the Group pertain to stocks of private corporations. These areclassified as AFS investments and are carried at cost since fair value cannot be reliablyestimated due to lack of reliable estimates of future cash flows and discount rates necessary tocalculate the fair value. There is currently no market for these investments and the Groupintends to hold them for the long-term.
§ Investments in bonds and corporate notes as at December 31, 2013 and 2012 include thirdparty convertible bonds and corporate notes with fixed interest rates ranging from 2.5% to8.25%. These investments will mature on various dates beginning February 9, 2013 toApril 15, 2018.
The account also includes SM Prime’s investment in corporate notes issued by BDO Unibank,Inc. (BDO) in 2013 and 2012 with fixed interest rate of 6.80% which were early redeemed inMay 2013 at par (see Note 20). Investments in corporate notes are intended to meetshort-term cash requirements.
Investment in convertible bonds as at December 31, 2012 have embedded derivatives whichare further discussed in Note 30.
The movements in net unrealized gain on AFS investments and share in unrealized gain ofassociates attributable to the owners of the Parent which are recognized in othercomprehensive income for the years ended December 31, 2013 and 2012 are as follows:
2013 2012(In Thousands)
Balance at beginning of year P=11,718,559 P=7,008,067Share in net unrealized gain (loss) on AFS
investments of associates (see Note 13) (2,687,077) 1,486,257Gain (loss) due to changes in fair value
of AFS investments (1,546,395) 3,224,165Transferred to consolidated statement of income (146,587) 70Balance at end of year P=7,338,500 P=11,718,559
Gain (loss) on disposal of AFS investments recognized under “Gain on sale of available-for-sale investments and fair value changes on investments held for trading - net” account in theconsolidated statement of income amounted to P=159.4 million for the year endedDecember 31, 2013, (P=0.1) million for the year ended December 31, 2012, P=30.8 million forthe year ended December 31, 2011. The amounts are exclusive of the share of non-controllinginterests.
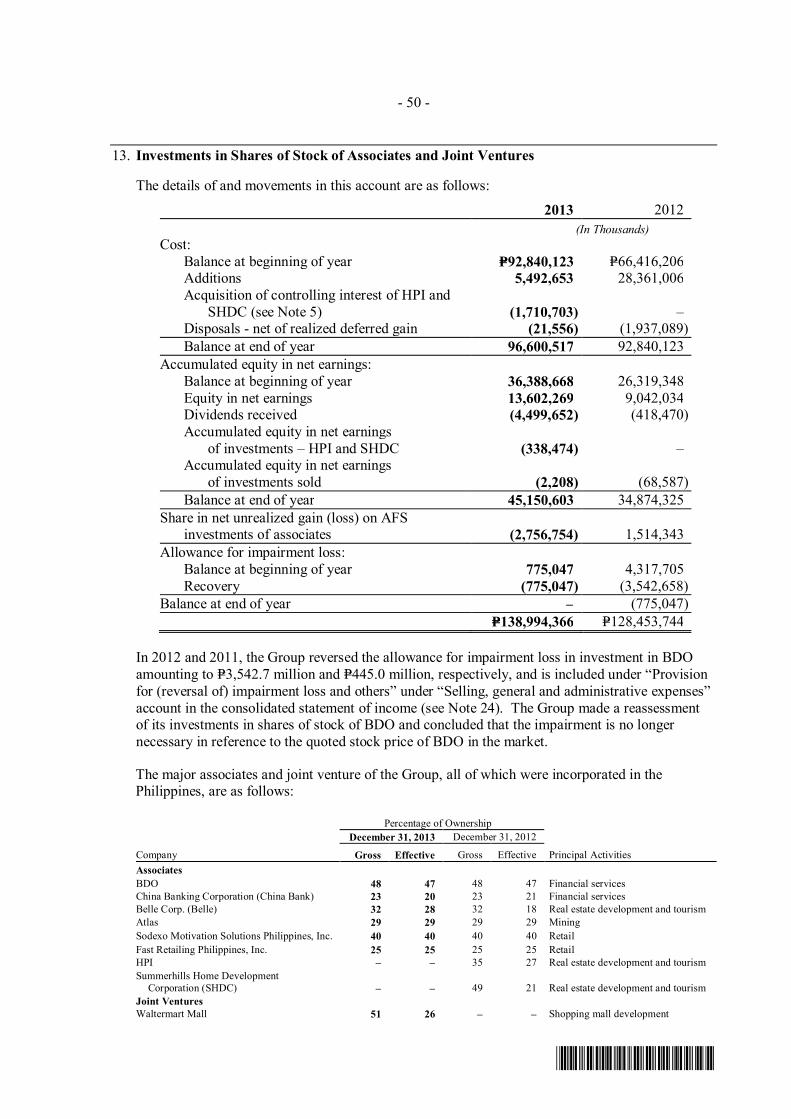
- 50 -
*SGVFS004197*
13. Investments in Shares of Stock of Associates and Joint Ventures
The details of and movements in this account are as follows:
2013 2012(In Thousands)
Cost:Balance at beginning of year P=92,840,123 P=66,416,206Additions 5,492,653 28,361,006Acquisition of controlling interest of HPI and
SHDC (see Note 5) (1,710,703) –Disposals - net of realized deferred gain (21,556) (1,937,089)Balance at end of year 96,600,517 92,840,123
Accumulated equity in net earnings:Balance at beginning of year 36,388,668 26,319,348Equity in net earnings 13,602,269 9,042,034Dividends received (4,499,652) (418,470)Accumulated equity in net earnings
of investments – HPI and SHDC (338,474) –Accumulated equity in net earnings
of investments sold (2,208) (68,587)Balance at end of year 45,150,603 34,874,325
Share in net unrealized gain (loss) on AFSinvestments of associates (2,756,754) 1,514,343
Allowance for impairment loss:Balance at beginning of year 775,047 4,317,705Recovery (775,047) (3,542,658)
Balance at end of year – (775,047)P=138,994,366 P=128,453,744
In 2012 and 2011, the Group reversed the allowance for impairment loss in investment in BDOamounting to P=3,542.7 million and P=445.0 million, respectively, and is included under “Provisionfor (reversal of) impairment loss and others” under “Selling, general and administrative expenses”account in the consolidated statement of income (see Note 24). The Group made a reassessmentof its investments in shares of stock of BDO and concluded that the impairment is no longernecessary in reference to the quoted stock price of BDO in the market.
The major associates and joint venture of the Group, all of which were incorporated in thePhilippines, are as follows:
Percentage of OwnershipDecember 31, 2013 December 31, 2012
Company Gross Effective Gross Effective Principal ActivitiesAssociatesBDO 48 47 48 47 Financial servicesChina Banking Corporation (China Bank) 23 20 23 21 Financial servicesBelle Corp. (Belle) 32 28 32 18 Real estate development and tourismAtlas 29 29 29 29 MiningSodexo Motivation Solutions Philippines, Inc. 40 40 40 40 RetailFast Retailing Philippines, Inc. 25 25 25 25 RetailHPI – – 35 27 Real estate development and tourismSummerhills Home Development
Corporation (SHDC) – – 49 21 Real estate development and tourismJoint VenturesWaltermart Mall 51 26 – – Shopping mall development

- 51 -
*SGVFS004197*
BDOIn March 2012, BDO declared a stock dividend equivalent to 3% of the outstanding capital stockof BDO which increased the number of common and preferred shares held by the Group by40.5 million and 3.6 million, respectively. The declaration of the stock dividend by BDOincreased the ownership interest of the Group by 1% as a result of the preferred shares held bySMIC.
In June 2012, BDO had a stock rights offering which entitled each eligible stockholder tosubscribe to one common share for every three common shares held as at record date at an offerprice of P=48.6 per rights share. As at June 30, 2012, the Group exercised its rights share and paidP=22,528.7 million equivalent to 463.5 million BDO shares. Upon completion of the regulatoryrequirements by BDO, the shares were issued to SMIC on July 4, 2012.
At various dates in 2012, SMIC sold a total number of 1.2 million BDO shares, equivalent to0.04% of the total outstanding voting shares of BDO at a total cost of P=39.0 million.
China BankIn May 2013, China Bank declared a stock dividend to stockholders of record as of July 19, 2013.The BSP and SEC approved the dividend declaration on June 21, 2013.
On August 24, 2012, SEC approved the Amended Articles of Incorporation of China Bank toeffect a ten-for-one stock split of the common shares. This resulted in an increase in the numberof shares from 200 million to 2,000 million, and a reduction in par value of shares from P=100.00 toP=10.00 per share. The stock split by China Bank did not result to a change in the ownershipinterest of the Group.
BelleIn April 2011, the Group, increased its ownership interest in Belle, an associate, by 20.78% and12.58% gross and effective ownership, respectively, via share swap wherein the entire outstandingshares of Premium Leisure Amusement, Inc. (a subsidiary) was exchanged for certain number ofcommon shares of Belle valued at P=1.95 per share (shares swap). The valuation of the PLAIshares was made by an independent appraiser and approved by the SEC on October 6, 2010. Thisis the same valuation used in recording the share swap transaction in its 2011 financial statementsupon receipt of the approval from the Bureau of Internal Revenue on March 31, 2011 and issuanceof stock certificates by Belle on April 14, 2011. The transaction resulted in a net gain on shareswap amounting to P=2,604.2 million, net of the eliminated portion of the gain pertaining to theretained interest of the Group in Belle and is recognized under “Gain on disposal of investmentsand properties - net” account in the consolidated statement of income. The Group will realize thedeferred income as the investment in the associate is disposed.
In 2013, SMIC acquired 100% ownership in Sto. Roberto (see Note 5). The acquisition of Sto.Roberto increased the Group’s effective interest in Belleshares Holdings, Inc. to 99% whichresulted to an increase in the Group’s effective ownership in Belle.
On various dates in 2013 and 2012, the Group sold 20.2 million and 1,509.0 million Belle shares,respectively, on which the Group realized P=10.8 million and P=811.2 million of the deferred gain in2013 and 2012, respectively, and was recognized under “Gain on disposal of investments andproperties - net” account in the consolidated statement of income. The remaining balance of thedeferred gain as at December 31, 2013 and 2012 amounted to P=1,065.7 million andP=1,076.4 million, respectively.

- 52 -
*SGVFS004197*
Atlas
Finalization of 2011 Provisional AccountingIn July 2011, SMIC acquired 316.2 million common shares of Atlas for US$142.2 million(P=5,996.6 million) representing 17.9% equity interest. In 2011, the Group accounted for thepurchase price allocation on provisional basis, pending the information on the fair value of Atlas’net assets. The fair values of the net assets acquired were finalized in June 2012 and goodwillfrom the acquisition formed part of the cost of investment in shares of stock of Atlas.
SMIC has three representations in the BOD of Atlas as at December 31, 2011 and is participatingin operational decisions. Based on these facts and circumstances, management determined that theGroup has significant influence over Atlas and therefore accounted for it as an investment in anassociate.
Convertible Loan of AtlasOn February 29, 2012, SMIC purchased from BDO the P=5,492.7 million convertible loan coveredby Secured Notes Facility Agreement (the Agreement) between Atlas and BDO dated July 25,2011. On May 21, 2012, SMIC gave an irrevocable notice to fully exercise the conversion optionunder the Agreement as the assignee of BDO. On July 13, 2012, upon completion of thenecessary regulatory approval, the shares were issued to SMIC resulting in an increase inownership in Atlas from 17.9% to 28.4%.
Fast Retailing Philippines, Inc.In January 2012, Marketwatch Investments Co., Inc., a subsidiary of SM Retail, investedP=100.0 million to acquire 25% ownership of the total outstanding shares of Fast RetailingPhilippines, Inc. accounted as an investment in an associate. The entity is organized with FastRetailing (Singapore) Co. Ltd. to engage in the retail/wholesale trading of merchandise, such asdry goods, wearing apparels and other merchandise, cosmetics, skin care and hair care productsand other related products under the brand name “Uniqlo”.
HPIIn 2011, the Group disposed 134.8 million shares of HPI for a total cost of P=288.2 million. Thedisposal resulted in a gain of P=1.0 million, which is included under “Gain on disposal ofinvestments and properties - net” account in the consolidated statement of income.
In 2011, the Group recognized allowance for impairment loss in investment in HPI amounting toP=395.0 million and is included under “Provision for (reversal of) impairment loss and others”under “Selling, general and administrative expenses” account in the consolidated statement ofincome (see Note 24). The allowance recognized by the Group was based on fair value less costto sell of the investment in reference to the quoted stock price in the market.
In 2013, through the corporate restructuring, HPI became a subsidiary of SMIC, indirectly thoughSM Prime. The acquisition of the controlling interest of HPI was considered as a businesscombination under common control. Thus, this was accounted for as a step-up acquisition usingthe pooling of interest method (Note 5).
In 2013, the Group reversed the allowance for impairment loss in investment in HPI amounting toP=775.0 million and is included under “Provision for (reversal of) impairment loss and others”under “Selling, general and administrative expenses” account in the consolidated statements ofincome (see Note 24). The Group made a reassessment of its investments in shares of stock ofHPI and concluded that the impairment is no longer necessary in reference to the quoted stockprice of HPI in the market.

- 53 -
*SGVFS004197*
SHDCIn February 2013, SHDC became a subsidiary of SM Land through the latter’s acquisition of the51.0% ownership in SHDC for a total consideration of P=20.4 million. This was accounted for as astep-up acquisition using the pooling of interest method (Note 5).
In 2011, SMDC obtained 49% and 21% gross and effective ownership, respectively, in SHDC fora total consideration of P=20.1 million. Consequently, SHDC became an associate of the Group.
Waltermart MallOn January 7, 2013, SM Prime entered into Shareholders Agreement and Share PurchaseAgreement for the acquisition of 51% ownership interest in the following companies (collectively,Waltermart Mall):
§ Winsome Development Corporation§ Willin Sales, Inc.§ Willimson, Inc.§ Waltermart Ventures, Inc.§ Waltermart Development, Inc.
On July 12, 2013, the Deeds of Absolute Sale were executed between SM Prime and shareholdersof Waltermart Mall. Waltermart Mall is involved in shopping mall operations and currently ownsnineteen (19) malls across Metro Manila and Luzon. The investments in Waltermart Mall wereaccounted as investment in joint venture using equity method of accounting because thecontractual arrangement between the parties establishes joint control.
The condensed financial information of the Group’s material associate, BDO, and thereconciliation of its net assets to the carrying amounts in the consolidated financial statementsfollows:
2013 2012(In Millions)
Total assets P=1,672,778 P=1,244,408Total liabilities (1,508,424) (1,087,156)Equity 164,354 157,252Proportion of the Group’s ownership 48% 48%
78,890 75,481Goodwill and others 24,120 23,258Carrying amount of the investment 103,010 98,739
2013 2012 2011(In Millions)
Interest income 56,606 54,014 50,467Interest expense 13,440 17,816 16,688Other expenses – net (20,520) (21,766) (23,191)Net income 22,646 14,432 10,588Share in net income 10,676 6,897 4,986Total other comprehensive income (4,766) 3,303 (168)Total comprehensive income 17,880 17,735 10,676Share in comprehensive income 8,381 8,360 5,033
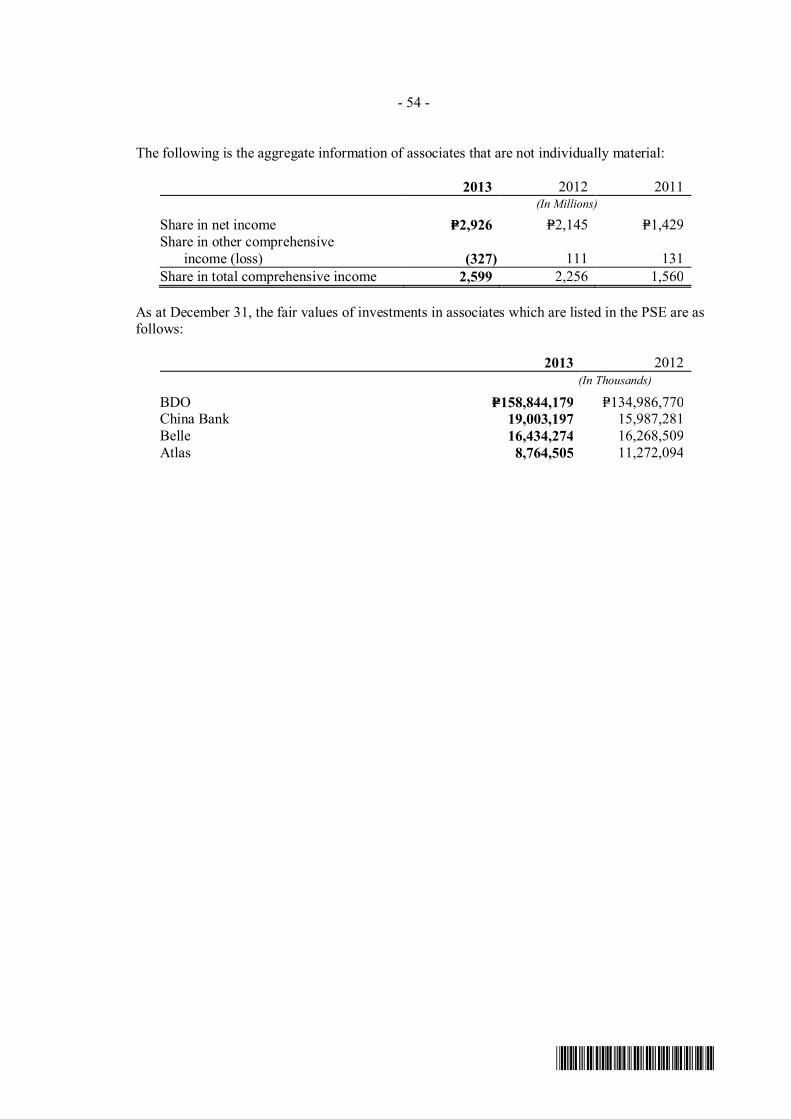
- 54 -
*SGVFS004197*
The following is the aggregate information of associates that are not individually material:
2013 2012 2011(In Millions)
Share in net income P=2,926 P=2,145 P=1,429Share in other comprehensive
income (loss) (327) 111 131Share in total comprehensive income 2,599 2,256 1,560
As at December 31, the fair values of investments in associates which are listed in the PSE are asfollows:
2013 2012(In Thousands)
BDO P=158,844,179 P=134,986,770China Bank 19,003,197 15,987,281Belle 16,434,274 16,268,509Atlas 8,764,505 11,272,094

- 55 -
*SGVFS004197*
14. Property and Equipment
The movements in this account are as follows:
Land
Buildings,Condominium
Units andImprovements
Store Equipmentand
Improvements
DataProcessingEquipment
Furniture,Fixtures
and OfficeEquipment
Machineryand
EquipmentLeasehold
ImprovementsTransportation
EquipmentConstruction
in Progress Total(In Thousands)
CostBalance as at December 31, 2011 P=2,974,095 P=4,655,572 P=6,721,043 P=4,132,561 P=3,457,225 P=2,801,446 P=3,756,493 P=580,594 P=965,169 P=30,044,198Additions 183,851 1,594,292 1,119,843 428,180 767,679 690,525 1,180,589 38,469 611,142 6,614,570Reclassifications (744,956) 764,325 (115,484) 141,191 (184,867) (23,739) 87,977 6,043 (329,884) (399,394)Disposals/retirements – (2,644,901) (148,498) (163,128) (57,536) (99,186) (35,118) (31,879) (11,474) (3,191,720)Balance as at December 31, 2012 2,412,990 4,369,288 7,576,904 4,538,804 3,982,501 3,369,046 4,989,941 593,227 1,234,953 33,067,654Additions – 566,841 1,194,897 325,373 520,580 604,179 1,071,236 66,081 782,608 5,131,795Effect of business combination (see Note 5) – 8,066 865,036 74,265 1,410 1,418 – 2,596 263,643 1,216,434Reclassifications (2,382,990) 67,187 1,410,778 265,870 139,905 (285,449) 1,678,823 30,713 (776,681) 148,156Disposals/retirements (30,000) (605,516) (8,598) (580,863) (29,769) (37,616) (36,577) (5,923) (177,169) (1,512,031)Balance as at December 31, 2013 P=– P=4,405,866 P=11,039,017 P=4,623,449 P=4,614,627 P=3,651,578 P=7,703,423 P=686,694 P=1,327,354 P=38,052,008
Accumulated Depreciation and AmortizationBalance as at December 31, 2011 P=– P=2,508,269 P=4,575,151 P=2,739,647 P=1,595,566 P=1,634,964 P=1,616,711 P=281,536 P=– P=14,951,844Depreciation and amortization – 381,307 825,626 493,886 500,992 387,047 706,389 52,514 – 3,347,761Reclassifications – (127,122) (236,144) (3,049) (42,307) (53,726) 32,125 (99) – (430,322)Disposals/retirements – (1,535,720) (154,118) (120,030) (50,391) (90,035) (18,228) (19,624) – (1,988,146)Balance as at December 31, 2012 – 1,226,734 5,010,515 3,110,454 2,003,860 1,878,250 2,336,997 314,327 – 15,881,137Depreciation and amortization – 338,054 616,380 532,018 603,746 962,994 666,619 54,461 – 3,774,272Effect of business combination (see Note 5) – – 725,138 60,658 75 76 – 1,851 – 787,798Reclassifications – 323,592 966,206 48,100 48,567 (513,915) (309,346) 19,067 – 582,271Disposals/retirements – (558,336) (130,529) (552,812) (16,421) (19,823) (15,873) (3,056) – (1,296,850)Balance as at December 31, 2013 P=– P=1,330,044 P=7,187,710 P=3,198,418 P=2,639,827 P=2,307,582 P=2,678,397 P=386,650 P=– P=19,728,628
Net Book ValueAs at December 31, 2013 P=– P=3,075,822 P=3,851,307 P=1,425,031 P=1,974,800 P=1,343,996 P=5,025,026 P=300,044 P=1,327,354 P=18,323,380As at December 31, 2012 P=2,412,990 P=3,142,554 P=2,566,389 P=1,428,350 P=1,978,641 P=1,490,796 P=2,652,944 P=278,900 P=1,234,953 P=17,186,517
As at December 31, 2013 and 2012, the Group has no idle property and equipment and the gross carrying amount of fully depreciated property andequipment still in use amounted to P=8,455.8 million and P=4,644.3 million, respectively.

- 56 -
*SGVFS004197*
15. Investment Properties
The movements in this account are as follows:
Land andImprovements and
Land Use Rights
Buildingsand
Improvements
BuildingEquipment,
Furnitureand Others
Construction inProgress Total
(In Thousands)
CostBalance as at December 31, 2011 P=30,570,126 P=94,671,246 P=17,521,166 P=20,668,255 P=163,430,793Additions 4,766,518 10,150,742 2,907,309 10,107,534 27,932,103Reclassifications (186,572) 7,850,434 1,260,406 (13,493,898) (4,569,630)Translation adjustment (159,893) (611,091) (71,572) (220,612) (1,063,168)Balance as at December 31, 2012 34,990,179 112,061,331 21,617,309 17,061,279 185,730,098Additions 4,800,290 5,307,963 1,619,709 14,157,130 25,885,092Effect of business combination (see Note 5) – 20,774,116 – – 20,774,116Reclassifications 746,887 6,770,851 6,196,877 (4,637,452) 9,077,163Translation adjustment 347,920 1,706,129 206,315 587,066 2,847,430Disposals (747,287) (11,389,188) (876,904) (837,905) (13,851,284)Balance as at December 31, 2013 P=40,137,989 P=135,231,202 P=28,763,306 P=26,330,118 P=230,462,615
Accumulated Depreciation, Amortizationand Impairment Loss
Balance as at December 31, 2011 P=1,177,437 P=21,530,088 P=9,323,793 P=123,564 P=32,154,882Depreciation and amortization 72,584 3,229,407 1,408,119 – 4,710,110Reclassifications (323,275) (664,505) (179) – (987,959)Translation adjustment (10,232) (76,254) (31,139) – (117,625)Balance as at December 31, 2012 916,514 24,018,736 10,700,594 123,564 35,759,408Depreciation and amortization 155,598 3,788,648 1,795,066 – 5,739,312Reclassifications (493,837) 8,730,336 1,059,532 – 9,296,031Translation adjustment 47,656 783,816 76,446 – 907,918Disposals (41) (12,698,071) (1,151,131) – (13,849,243)Balance as at December 31, 2013 P=625,890 P=24,623,465 P=12,480,507 P=123,564 P=37,853,426
Net Book ValueAs at December 31, 2013 P=39,512,099 P=110,607,737 P=16,282,799 P=26,206,554 P=192,609,189As at December 31, 2012 P=34,073,665 P=88,042,595 P=10,916,715 P=16,937,715 P=149,970,690
As at December 31, 2013 and 2012, the allowance for impairment loss on land and improvementsand land use rights, and construction amounted to P=923.3 million. There were no reversals ofallowance for impairment loss in 2013 and 2012, respectively.
Included under “Land” account are the 212,119 square meters of real estate properties with acarrying value of P=494.0 million and P=447.0 million as at December 31, 2013 and 2012,respectively, and a fair value of P=13,531.0 million as at August 2007. The land was planned forresidential development in accordance with the cooperative contracts entered into by Mega MakeEnterprises Limited and Affluent Capital Enterprises Limited (Oriental Land) with Grand Chinaand Oriental Land Development Limited on March 15, 2007. The value of these real estateproperties was not part of the consideration paid by SM Prime of P=10,827.0 million to GrandChina and Oriental Land. Accordingly, the assets were recorded at carrying values under“Investment properties” account and a corresponding liability equivalent to the same amount isshown as part of “Tenants’ deposits and others” account in the consolidated balance sheets.
Portions of investment properties located in China with carrying value of P=5,001.0 million andP=4,852.0 million as at December 31, 2013 and 2012, respectively, and estimated fair value ofP=20,109.0 million and P=10,874.0 million as at December 31, 2013 and 2012, respectively, weremortgaged as collaterals to secure the domestic borrowings in China (see Note 20).
Rent income from investment properties, which is primarily attributable to SM Prime, amountedto P=27,929.4 million, P=24,695.6 million and P=20,832.7 million for the years ended December 31,2013, 2012 and 2011, respectively. Consolidated direct operating expenses from investment
- 57 -
*SGVFS004197*
properties which generate income amounted to P=17,075.0 million, P=13,995.2 million andP=12,277.5 million for the years ended December 31, 2013, 2012 and 2011, respectively.
Construction in progress includes shopping mall complex under construction amounting toP=18,279.0 million and P=15,245.0 million, and landbanking and commercial building constructionsamounting to P=5,080.0 million and P=1,430.0 million as at December 31, 2013 and 2012,respectively.
In 2013, shopping mall complex under construction mainly pertains to costs incurred for thedevelopment of SM Seaside City Cebu, SM City Cauayan, SM Tianjin and SM Zibo and theongoing expansions and renovations of SM Megamall, SM City Bacolod and SM City Lipa. In2012, shopping mall complex under construction mainly pertains to costs incurred for thedevelopment of SM Aura Premier, SM City BF-Paranaque, SM Seaside City Cebu, SM Tianjinand SM Zibo and the ongoing expansions and renovations of SM Megamall, SM City Bacolod,SM City Clark, SM City Dasmariñas, and SM City Sta. Rosa.
Shopping mall complex under construction includes cost of land amounting to P=2,149.0 millionand P=1,615 million as at December 31, 2013 and 2012, respectively.
Construction contracts with various contractors related to the construction of the above-mentionedprojects amounted to P=82,058.0 million and P=53,965.0 million as at December 31, 2013 and 2012,respectively, inclusive of overhead, cost of labor and materials and all other costs necessary for theproper execution of the works. The outstanding contracts are valued at P=28,857.0 million andP=14,393.0 million as at December 31, 2013 and 2012, respectively.
Interest capitalized to the construction of investment properties amounted to P=77.1 million andP=130.0 million in 2013 and 2012, respectively. Capitalization rates used ranged from 5.83% to7.20% and 5.75% to 6.13% for the years ended December 31, 2013 and 2012, respectively.
The fair value of the investment properties amounted to P=555,039.4 million as at February 28,2013 based on a report by an independent and accredited appraiser. The fair value represents theprice that would be received to sell the investment properties in an orderly transaction betweenmarket participants at the measurement date.
In conducting the appraisal, the independent appraiser used the income approach. Below are thekey inputs used in the valuation:
Discount rate 10.00%Capitalization rate 7.40%Average growth rate 5.00%
The fair value disclosures of the investment properties are categorized under Level 3 as these werebased on unobserved inputs.
While fair value of the investment properties was not determined as at December 31, 2013, theGroup’s management believes that there were no conditions present in 2013 that wouldsignificantly reduce or increase the fair value of the investment properties from that determined onFebruary 28, 2013.
The Group has no restriction on the realizability of its investment properties and no obligation toeither purchase, construct or develop or for repairs, maintenance and enhancements.

- 58 -
*SGVFS004197*
16. Land and Development and Condominium Units for Sale
This account consists of the following:
2013 2012(In Thousands)
Condominium units for sale (see Note 11) P=6,213,523 P=2,670,943Land and development:Current portion (see Note 11) 12,542,783 –Noncurrent portion 25,666,930 30,197,862
P=44,423,236 P=32,868,805
Condominium units for saleCondominium units for sale pertain to completed projects of SMDC, HPI, Costa and ICDC.These are included under “Other current assets” account in the consolidated balance sheets(see Note 11).
The movements in “Condominium units for sale” account are as follows:
2013 2012(In Thousands)
Balance at beginning of year P=2,670,943 P=1,115,878Transfer from land and development 7,332,175 2,624,448Additions 393,905 89,698Recognized as costs of real estate sold (4,183,500) (1,159,081)Balance at end of year P=6,213,523 P=2,670,943
The condominium units for sale are stated at cost as at December 31, 2013 and 2012. There is noallowance for inventory write-down as at December 31, 2013 and 2012.
Land and developmentLand and development, include land and cost of ongoing condominium projects.
The movements in “Land and development” account are as follows:
2013 2012(In Thousands)
Balance at the beginning of year P=30,197,862 P=23,012,453Land acquired during the year 5,483,396 4,909,701Development cost incurred 15,280,134 15,384,282Borrowing cost capitalized 1,654,579 1,003,610Recognized as costs of real estate sold (7,727,066) (11,204,375)Transfer to condominium units for sale (7,332,175) (2,624,448)Transfer from (to) property and equipment
(see Note 14) 652,983 (208,897)Transfer to investment property (see Note 15) – (74,464)Balance at end of year 38,209,713 P=30,197,862Less current portion (see Note 11) 12,542,783 –Noncurrent portion P=25,666,930 P=30,197,862

- 59 -
*SGVFS004197*
The average rates used to determine the amount of borrowing costs eligible for capitalizationranged from 3.6% to 5.1% in 2013 and 3.3% to 8.3% in 2012.
SMDCLand and development costs attributable to SMDC pertain to the ongoing residentialcondominium projects. Estimated cost to complete the projects amounted to P=32,645.0 millionand P=29,012.9 million as at December 31, 2013 and 2012, respectively.
SMDC acquired LLCI, GLC and MSDPC for P=600.0 million, P=1,500.0 million andP=498.0 million, respectively, in 2012. The purchases of these subsidiaries were accounted for asasset acquisition. At acquisition date, these subsidiaries own parcels of land which are to bedeveloped into commercial/residential condominium projects.
CostaCosta’s land and development projects located at Hamilo Coast in Nasugbu, Batangas consist ofcondominium buildings and macro-infrastructure. The total estimated liability on completedprojects amounts to P=400.1 million and P=364.2 million as at December 31, 2013 and 2012,respectively.
In 2012, Costa completed the construction of Miranda and Carola condominium buildings. Thecompleted condominium buildings were accordingly classified as part of “Condominium units forsale” in 2012. As at December 31, 2013 and 2012, the development of macro-infrastructure is stillongoing.
HPIEstimated cost to complete HPI’s ongoing projects amounted to P=1,364.6 million at December 31,2013. As at December 31, 2013, the land and development account includes land held for futuredevelopment amounting to P=1,519.1 million which was the payment received by HPI from BelleCorporation (Belle) for its subscription to HPI’s capital stock before the tender offer by SM Landand parcels of land subsequently acquired by HPI from Belle after its subscription.
Land and development are stated at cost as at December 31, 2013 and 2012. There is noallowance for inventory write-down as at December 31, 2013 and 2012.
17. Intangibles and Other Noncurrent Assets
Intangible AssetsThis account consists of:
2013 2012(In Thousands)
Goodwill P=14,221,912 P=9,321,057Less accumulated impairment loss 91,619 91,619Net book value 14,130,293 9,229,438
Trademarks and brand names 6,124,762 6,124,762P=20,255,055 P=15,354,200
Goodwill is allocated to SM Prime, Supervalue, Inc. (SVI), Super Shopping Market, Inc. (SSMI),Prime Metroestate, Inc. and others as separate cash generating units.
- 60 -
*SGVFS004197*
Trademarks and brand names pertain to that of the supermarket and hypermarket business of theGroup which were acquired in a business combination in 2006. The trademarks and brand nameswere assessed to have an indefinite life and was valued using the Relief-from-Royalty Method.The royalty rate was 3.5%, which was the prevailing royalty rate in 2006 in the retail assortedcategory where the two entities fall.
The recoverable amount of goodwill, trademarks and brand names have been determined based onvalue-in-use caluculations using the cash flow projections from the financial budgets approved bysenior management covering a three-year period and fair value less costs of disposal calculationsof the underlying net assets of the CGUs.
Value-in-use. The calculation of value-in-use is most sensitive to pre-tax discount rates. Thepre-tax discount rates applied to cash flow projections ranged from 12.30% to 12.34% and 6.61%to 9.14% as at December 31, 2013 and 2012, respectively. The discount rates were determinedbased on the yield of ten-year government bonds at the beginning of the forecasted year. Discountrates reflect the current market assessment of the risks to each cash generating unit and wereestimated based on the average percentage of weighted average cost of capital for the industry.The rate was further adjusted to reflect the market assessment of any risk specific to the CGU forwhich future estimates of cash flows have not been adjusted. The increase in discount rates in2013 was due to change in the comparable companies used in the value-in-use computation.
Management assessed that no reasonably possible change in pre-tax discount rates and future cashinflows would cause the carrying value of goodwill, trademarks and brand names in 2013 and2012 to materially exceed its recoverable amount.
Fair value less cost of disposal. The fair values of the assets and liabilities of the CGUs weredetermined by independent appraisers and in reference to the available market price for quotedinstruments. Management assessed that no reasonably possible change in the fair values wouldcause the carrying value of goodwill in 2013 and 2012 to materially exceed its recoverableamount.
Other Noncurrent AssetsThis account consists of:
2013 2012(In Thousands)
Receivables from real estate buyers (see Note 10) P=10,636,503 P=14,401,513Deposits and advance rentals 6,362,347 8,149,028Advances for project development (see Note 22) 3,607,169 1,962,578Derivative assets (see Notes 29 and 30) 2,643,487 109,979Deferred input VAT 1,554,256 962,629Defined benefit asset (see Note 26) 615,982 452,910Escrow fund (see Note 22) 556,206 98,996Long-term notes (see Note 22) 218,124 306,724Others 2,259,381 1,322,879
P=28,453,455 P=27,767,236

- 61 -
*SGVFS004197*
§ Deposits and advance rentals substantially pertain to the lease agreements entered into by SMPrime for certain parcels of land where some of its malls are constructed. The leaseagreements provide that the security deposits will be applied to future rentals. Consequently,the said deposits and advance rentals are not remeasured at amortized cost.
§ Long-term notes pertain to unquoted and unsecured subordinated debt instruments whichcarry fixed interest rates per annum ranging from 7.0% to 8.5% as at December 31, 2013 and2012. The P=200.0 million will mature on November 21, 2017, P=88.6 million will mature onMay 29, 2018 and the remaining P=218.1 million will mature on March 20, 2019. In May 2013and November 2012, the Group received full payment from BDO for the early redemption ofthe long-term note amounting to P=88.6 million and P=200.0 million, respectively.
§ Escrow fund amounting to P=426.2 million and P=99.0 million as at December 31, 2013 and2012, respectively, pertains mainly to the amounts deposited in the account of an escrow agentas required by the Housing and Land Use Regulatory Board (HLURB) in connection withSMDC’s temporary license to sell prior to HLURB’s issuance of a license to sell andcertificate of registration. In 2013, the Parent Company deposited cash in escrow amountingto P=130.0 million in the account of an escrow agent as required by the SEC in connection withthe corporate restructuring.
18. Bank Loans
This account consists of:
2013 2012(In Thousands)
Parent Company:U.S. dollar-denominated loans P=2,219,750 P=2,052,500Peso-denominated loans 6,550,000 11,783,400
Subsidiaries -Peso-denominated loans 18,818,509 17,958,075
P=27,588,259 P=31,793,975
The U.S. dollar-denominated loans amounting to US$50.0 million with peso equivalent ofP=2,219.8 million and P=2,052.5 million as at December 31, 2013 and 2012, respectively, bearinterest at three-month London Inter-Bank Offered Rate (LIBOR) plus margin (see Note 29).
The peso-denominated loans bear annual interest rates ranging from 1.06% to 6.75% and 3.25% to5.00% in 2013 and 2012, respectively.
These loans have maturities of less than one year (see Note 29).
Interest expense on bank loans amounted to P=3,960.4 million, P=3,253.7 million andP=2,288.8 million in 2013, 2012 and 2011, respectively (see Note 25).

- 62 -
*SGVFS004197*
19. Accounts Payable and Other Current Liabilities
This account consists of:
2013 2012(In Thousands)
Trade P=39,580,013 P=34,304,241Nontrade 8,013,509 2,276,078Payable arising from acquisition of land 4,838,686 6,100,508Accrued expenses 3,967,472 1,881,254Payable to government agencies 3,671,601 2,334,796Due to related parties (see Note 22) 2,091,305 3,265,015Accrued interest 1,784,520 2,537,777Derivative liabilities (see Note 29 and 30) 845,429 2,493,651Gift checks redeemable and others 3,295,792 2,672,556
P=68,088,327 P=57,865,876
The terms and conditions of the above liabilities follow:
§ Trade payables primarily consist of liabilities to suppliers and contractors, which arenoninterest-bearing and are normally settled on a 30 to 60 days term.
§ Nontrade payables, accrued interest and others are expected to be settled within the nextfinancial year.
§ Payable arising from acquisition of land is expected to be settled within the following year.
§ The terms and conditions relating to due to related parties are discussed in Note 21.
§ Gift checks are redeemable at face value.
§ Payable to government agencies mainly consists of output tax which are normally settledwithin the next financial year.
§ Accrued expenses pertain to accrued and unpaid selling, general and administrative expenseswhich are normally settled within the next financial year.

- 63 -
*SGVFS004197*
20. Long-term Debt
This account consists of:
2013 2012Gross Amount Debt Issue Cost Net Amount Gross Amount Debt Issue Cost Net Amount
(In Thousands)Parent CompanyU.S. dollar-denominated: Fixed rate bonds P=56,053,998 (P=365,270) P=55,688,728 P=61,813,938 (P=449,782) P=61,364,156 Convertible bonds 3,732,919 (60,787) 3,672,132 9,407,559 (183,247) 9,224,312 Five-year term loans 13,318,500 (16,893) 13,301,607 – – –Peso-denominated: Seven-year and ten-year
fixed rate corporatenotes – – – 4,995,000 (37,757) 4,957,243
Five-year fixed ratecorporate notes – – – 6,699,043 (36,984) 6,662,059
Five-year and seven-yearretail bonds 9,400,000 (13,794) 9,386,206 9,400,000 (32,107) 9,367,893
Seven-year and ten-yearretail bonds 13,082,270 (89,961) 12,992,309 14,282,270 (118,549) 14,163,721
Bank loans collateralizedwith time deposits 3,000,000 (3,457) 2,996,543 3,000,000 (6,635) 2,993,365
Other bank loans 9,350,000 (294,476) 9,055,523 8,050,000 (10,945) 8,039,055SubsidiariesU.S. dollar-denominated: Five-year term loans 11,986,650 (141,857) 11,844,793 11,083,500 (186,538) 10,896,962 Two-year, three-year and
five-year bilateralloans 1,109,875 (5,994) 1,103,881 1,026,250 (5,008) 1,021,242
Five-year syndicated loan 22,197,500 (473,025) 21,724,475 Other U.S. dollar loans 4,439,500 (55,869) 4,383,631 2,463,000 (24,888) 2,438,112China yuan-renminbi
denominated: Three-year loan 961,827 – 961,827 1,111,112 – 1,111,112 Five-year loan 2,235,771 – 2,235,771 2,272,374 – 2,272,374Peso-denominated: Three-year and five-year
fixed rate notes 17,075,000 (80,100) 16,994,900 18,313,000 (84,747) 18,228,253 Five-year and ten-year
fixed and floating ratenotes 7,375,500 (47,692) 7,327,808 7,500,000 (57,081) 7,442,919
Five-year, seven-year andten-year fixed andfloating rate notes 4,316,400 (25,877) 4,290,523 5,000,000 (33,540) 4,966,460
Five-year, seven-year andten-year corporatenotes 6,596,000 (25,068) 6,570,932 6,860,000 (36,161) 6,823,839
Five-year and ten-yearcorporate notes 1,100,000 (6,906) 1,093,094 1,100,000 (7,849) 1,092,151
Five-year floating ratenotes 4,900,000 (20,390) 4,879,610 4,950,000 (29,172) 4,920,828
Five-year, seven-year andten-year fixed ratenotes 8,200,000 (51,445) 8,148,556 800,000 (4,658) 795,342
Five-year bilateral loans 500,000 (1,547) 498,453 500,000 (2,009) 497,991 Other bank loans 11,026,060 (21,325) 11,004,735 9,133,550 (20,510) 9,113,040
211,957,770 (1,801,733) 210,156,037 189,760,596 (1,368,167) 188,392,429Less current portion 34,858,218 (291,599) 34,566,619 13,889,278 (29,720) 13,859,558Noncurrent portion P=177,099,552 (P=1,510,134) P=175,589,418 P=175,871,318 (P=1,338,447) P=174,532,871

- 64 -
*SGVFS004197*
Parent Company
Fixed Rate Bonds
US$500.0 million Senior BondsOn October 17, 2012, SMIC issued US$500.0 million senior bonds, with peso equivalent ofP=22,197.5 million and P=20,525.0 million as at December 31, 2013 and 2012, which bear a fixedinterest rate of 4.25% per annum, payable semi-annually in arrears. The bonds will mature onOctober 17, 2019.
US$400.0 million Exchanged BondsOn October 13, 2010, SMIC issued US$400.0 million bonds with peso equivalents ofP=17,023.9 million and P=15,641.8 million as at December 31, 2013 and 2012, respectively, whichbear a fixed interest rate of 5.5% per annum, payable semi-annually in arrears and will mature onOctober 13, 2017. This issuance is comprised of US$186.3 million (P=7,356.2 million) additionalbonds, and US$82.9 million (P=3,199.4 million) and US$130.8 million (P=5,086.2 million)exchanged bonds from the existing US$350.0 million 6.75% bonds due 2013 andUS$500.0 million 6.0% bonds due 2014, respectively. The exchange was not accounted for as anextinguishment but merely a modification of terms because the terms of the exchanged bonds arenot substantially different from the existing bonds (i.e., the difference between the present value ofthe cash flows of the exchanged bonds and the present value of the remaining cash flows of theexisting bonds discounted using the original effective interest rate did not exceed 10%).
US$500.0 million BondsOn September 22, 2009, SMIC issued US$500.0 million bonds, with peso equivalent ofP=16,832.6 million and P=15,564.4 million as at December 31, 2013 and 2012, which bear a fixedinterest rate of 6.0% per annum, payable semi-annually in arrears. The bonds will mature onSeptember 22, 2014.
US$350.0 million BondsOn July 17, 2008, SMIC issued US$350.0 million bonds, with peso equivalent of nil andP=10,082.8 million as at December 31, 2013 and 2012, respectively, which bear a fixed interest rateof 6.75% per annum, payable semi-annually in arrears. The bonds matured on July 20, 2013.
Convertible Bonds
US$250.0 million Convertible BondsOn February 15, 2012, SMIC issued at face value 1.625% coupon US$250.0 million(P=9,407.6 million) convertible bonds, with a yield to maturity of 2.875% due on February 15,2017 at 106.67%. The bonds bear coupon interest of 1.625% and has a yield-to-maturity of2.875% at inception. Interest on the bonds is payable semi-annually in arrears. The bonds containmultiple embedded derivatives (i.e., conversion option, call option and put option) which wasbifurcatedby SMIC at inception. See Note 29 for further discussion.
Unless previously redeemed, converted or purchased and cancelled, the holder has the right toconvert its outstanding bonds for SMIC’s common shares at any time, on or after June 15, 2012until the close of business on February 5, 2017, at an initial conversion price of P=781.45 per sharetranslated into U.S. dollars at a fixed conversion rate of P=42.711 to US$1.00. Effective July 8,2013, the new conversion price is P=624.625 after giving effect to the 25% stock dividendsdeclared on April 25, 2013. If a bondholder exercises its conversion option, the Company canchoose either to settle the bonds in cash or issue common shares. At various dates in 2013, the

- 65 -
*SGVFS004197*
bondholders of US$150.8 million (P=5,778.9 million) opted to convert their holdings into8,390,334 of SMIC’s shares. No conversion options were exercised as at December 31, 2012.
The put option entitles the bondholders to require the Parent Company to redeem all or some of itsbonds on February 15, 2015 (put date) at 103.89%.
Lastly, the call option gives right to the Parent Company to redeem the Bonds, in whole but not inpart at their early redemption amount on the date fixed for redemption, provided, however, that nosuch redemption may be made unless the closing price of the shares of the Parent Company(translated into US Dollars at the prevailing rate) for each of the 30 consecutive trading days, thelast of which occurs no more than five days prior to redemption notice, was at least 130% of theapplicable early redemption amount divided by the conversion ratio.
US$300.0 million Convertible BondsOn March 19, 2007, SMIC issued at face value zero coupon US$300.0 million convertible bondswith a yield to maturity of 3.5% due on March 20, 2012 at 118%. The bonds contain multipleembedded derivatives (i.e., conversion option, call option and put option) which were bifurcatedby SMIC at inception. See Note 29 for further discussion.
Unless previously redeemed, converted or purchased and cancelled, the holder has the right toconvert its outstanding bonds (conversion option) for SMIC’s common shares at any time, on orafter June 30, 2007 until the close of business on March 13, 2012. Starting April 25, 2007, theconversion price is equal to P=453.39 a share, after giving effect to the 4.27% stock dividend. Atvarious dates in 2012, the bondholders of US$16.0 million (P=813.6 million) and US$1.7 million(P=82.2 million) bonds, respectively, opted to convert their holdings into 1,710,587 and 181,364 ofSMIC’s shares (see Note 20). The fair value of the related derivative liability derecognized uponconversion amounted to US$4.2 million (P=181.50 million) in 2012 (see Notes 29 and 30).
The remaining value of convertible bond amounting to US$4.7 million (P=201.4 million) maturedon March 20, 2012, resulted to a gain of P=28.8 million, shown under “Gain (loss) on fair valuechanges on derivatives - net” account in the consolidated statements of income. The fair value ofthe related derivative liability derecognized upon maturity amounted to US$3.9 million(P=28.8 million) (see Note 29).
The put option entitles the bondholders to require the Parent Company to redeem all or some of itsbonds on March 19, 2010 (put date) at 110.97%. A total of US$246.3 million (P=11,253.5 million)bonds were redeemed as a result of the exercise of the holders of the put option, which resulted ina gain of P=844.6 million shown under “Gain (loss) on fair value changes on derivatives - net”account in the 2010 consolidated statements of income. The fair value of the related derivativeliability derecognized upon early redemption amounted to US$35.2 million (P=1,609.7 million)(see Note 30).
Lastly, the call option gives right to the Parent Company to redeem the remaining Bonds, in wholebut not in part at their early redemption amount on the date fixed for redemption, provided,however, that no such redemption may be made unless the closing price of the shares of the ParentCompany (translated into US Dollars at the prevailing rate) for each of the 30 consecutive tradingdays, the last of which occurs no more than five days prior to redemption notice, was at least130% of the applicable early redemption amount divided by the conversion ratio.
- 66 -
*SGVFS004197*
Five-year U.S. Dollar LoansIn 2013, the Company obtained a five-year loan amounting to US$300.0 million with Phillippinepeso equivalent of P=13,318.5 million as at December 31, 2013 which bears floating interest rate ofsix-month LIBOR plus margin. Portion of the loan amounting to US$180.0 million is hedgedagainst interest rate and foreign exchange risks using cross currency swap contract (see Notes 29and 30).
Seven-year and Ten-year Fixed Rate Corporate NotesOn September 26, 2011, SMIC issued fixed rate corporate notes comprised of seven-year orSeries A Notes and ten-year or Series B Notes due on September 26, 2018 and September 26,2021, respectively. The total issuance amounted to P=916.0 million and P=4,084.0 million for theSeries A and Series B Notes, respectively.
The Series A Notes have a term of seven years from the issue date, with a fixed interest rateequivalent to 5.75% per annum payable semi-annually in arrears starting March 26, 2012. TheSeries B Notes have a term of ten years from the issue date, with a fixed interest rate equivalent to6.625% per annum payable semi-annually in arrears starting March 26, 2012.
The Series A and B Notes have principal repayment of 0.1% of the principal amount in annualinstallments that will commence on the twelfth (12th) month from the issue date, with the lastinstallment payment to be made on maturity date.
The Series A and B Notes were pre-terminated on April 16, 2013. Outstanding balance as atDecember 31, 2012 for the Series A and B Notes amounted to P=915.1 million andP=4,079.9 million, respectively.
Five-year Fixed Rate Corporate NotesOn February 7, 2011, SMIC issued corporate notes amounting to P=6,700.0 million, which bear afixed interest rate of 6.17% per annum, payable semi-annually in arrears. The corporate notes willmature on February 8, 2016. The notes have principal repayment of P=1.0 million that willcommence on the 12th month from the issue date, with the last installment payment to be made onmaturity date. Outstanding balance as at December 31, 2012 amounting to P=6,699.0 million waspre-terminated on March 27, 2013.
Seven-year and Ten-year Retail BondsOn July 16, 2012, SMIC issued fixed rate bonds, which comprised of seven-year or Series CBonds and ten-year or Series D Bonds due on July 16, 2019 and July 16, 2022, respectively. Thetotal issuance amounted to P=5,623.5 million and P=8,658.8 million for the Series C and Series DBonds, respectively.
The Series C Bonds have a term of seven years from the issue date, with a fixed interest rateequivalent to 6.00% per annum payable semi-annually in arrears starting January 16, 2013. TheSeries D Bonds have a term of ten years from the issue date, with a fixed interest rate equivalent to6.94% per annum payable semi-annually in arrears starting January 16, 2013.
At various dates in 2013, the SMIC redeemed P=1,317.7 million for Series C and P=600.0 millionfor Series D Bonds.
Outstanding balance as at December 31, 2013 for Series C and Series D bonds amounted toP=5,023.5 million and P=8,058.8 million, respectively.

- 67 -
*SGVFS004197*
Five-year and Seven-year Retail BondsOn June 25, 2009, SMIC issued fixed rate bonds, which comprised of five-year or Series A Bondsand seven-year or Series B Bonds due on June 26, 2014 and June 25, 2016, respectively. The totalissuance amounted to P=8,400.0 million and P=1,000.0 million for the Series A and Series B Bonds,respectively.
The Series A Bonds have a term of five years and one day from the issue date, with a fixed interestrate equivalent to 8.25% per annum payable semi-annually in arrears starting December 26, 2009.The Series B Bonds have a term of seven years from the issue date, with a fixed interest rateequivalent to 9.10% per annum payable semi-annually in arrears starting December 25, 2009.
Outstanding balance as at December 31, 2013 and 2012 amounted to P=9,400.0 million.
Bank Loans Collateralized with Time DepositsOn January 8, 2010, SMIC obtained two five-year term loans amounting to P=1,500.0 million each.The loans are based on a three-month Philippine Dealing System Treasury-Fixing (PDST-F) rateplus an agreed margin. Interest on these loans is payable quarterly in arrears.
On October 16, 2007, SMIC obtained a five-year term loan amounting to P=6,000.0 million, whichbears interest based on a three-month PDST-F rate plus an agreed margin, payable quarterly inarrears. On October 12, 2011, SMIC paid P=50.0 million of this loan. The remaining valueamounting to P=5,950.0 million matured on October 16, 2012.
These loans are collateralized by a portion of SMIC’s time deposits amounting toUS$475.0 million with peso equivalents of P=21,087.6 million and P=19,498.8 million as atDecember 31, 2013 and 2012, respectively (see Note 8).
Other Peso Bank LoansThis account includes the following:
2013 2012(In Thousands)
Ten-year term loans P=100,000 P=2,050,000Seven-year term loans 9,250,000 3,000,000Five-year term loans – 3,000,000
P=9,350,000 P=8,050,000
§ In August 2013, SMIC obtained a seven-year term loan amounting to P=2,000.0 million whichbears a fixed interest rate of 4.47% per annum.
§ In June 2013, the Company obtained a seven-year term loan amounting to P=3,000.0 millionwhich bears a fixed interest rate of 4.39% per annum.
§ In April 2013, SMIC obtained two seven-year term loans and a ten-year term loan amountingto P=2,250.0 million and P=100.0 million, which bear fixed interest rates of 4.39% and 4.64%per annum, respectively.
§ In January 2008, SMIC obtained two ten-year term loans amounting to P=1,050.0 million andP=500.0 million, which bear fixed interest rates of 6.85% and 6.71% per annum, respectively.On various dates in 2013, SMIC prepaid the P=1,050.0 million and P=500.0 million fixed rateloans. Outstanding balances of these loans amounted to nil and P=1,550.0 million as atDecember 31, 2013 and 2012, respectively.

- 68 -
*SGVFS004197*
§ In April 2008, SMIC obtained seven-year and ten-year term loans amounting toP=500.0 million each, which bear fixed interest rates of 8.56% and 8.79% per annum,respectively. The seven-year term loan has annual principal repayment of P=0.5 million thatwill commence on the 12th month from the issue date, with the last installment payment to bemade on maturity date. On April 25, 2012, SMIC paid the total outstanding balance of theseven-year term loan amounting to P=498.5 million. Outstanding balance of ten-year termloans amounted to P=500.0 million as at December 31, 2013, was prepaid by SMIC onApril 25, 2013.
§ In March 2008, SMIC obtained a seven-year term loan amounting to P=1,000.0 million, whichbears a fixed interest rate of 7.28% per annum. Outstanding balance as at December 31, 2012amouting to P=1,000.0 million was prepaid by SMIC on March 6, 2013.
§ The seven-year term loans also include P=2,000.0 million and P=1,000.0 million fixed rate loanswith interest rates of 6.90% and 6.91%, respectively. It likewise includes P=2,000.0 millionfloating rate loan with interest based on three-month PDST-F plus an agreed margin. Theloans will mature in October and November 2014. On January 31, 2011 and November 23,2012, SMIC prepaid the P=2,000.0 million and P=1,000.0 million fixed rate loans, respectively.Outstanding balance as at December 31, 2013 and 2012 amounted to P=2,000.0 million..
§ In February 2009, SMIC obtained a five-year term loan amounting to P=3,000.0 million whichbears a floating interest rate based on a six-month PDST-F plus margin. Outstanding balanceas at December 31, 2012 amounted to P=3,000.0 million.
Subsidiaries
U.S. Dollar-denominated Five-Year Term LoansThis represents a US$270.0 million unsecured loan obtained on various dates in 2012 and 2011from a US$270.0 million facility. The loans bear interest rates based on LIBOR plus spread, witha bullet maturity on March 21, 2016 (see Notes 29 and 30).
U.S. Dollar-denominated Five-Year Term Syndicated LoansThis consists of the following:
§ US$300.0 million unsecured loan obtained on various dates in 2013. The loan bears aninterest rate based on LIBOR plus spread, with a bullet maturity on March 25, 2018. Portionof the loan amounting to US$150 million is hedged against interest rate and foreign exchangerisks using cross currency swap contracts (see Notes 29 and 30).
§ US$200.0 million unsecured loan obtained on January 29, 2013. The loan bears an interestrate based on LIBOR plus spread, with a bullet maturity on January 29, 2018. This loan ishedged against interest rate and foreign exchange risks using cross currency swap contracts(see Notes 29 and 30).
U.S. Dollar-denominated Two-Year, Three-Year and Five-Year Bilateral LoansThis consists of the following:
§ US$40.0 million and US$10.0 million, out of US$50 million five-year bilateral unsecuredloan, were obtained in 2013 and 2012, respectively. The loan bears interest rate based onLIBOR plus spread, with a bullet maturity on August 30, 2017 (see Note 30).

- 69 -
*SGVFS004197*
§ US$30.0 million and US$20.0 million five-year bilateral unsecured loan drawn onNovember 30, 2010 and April 15, 2011, respectively. The loans bear interest rate based onLIBOR plus spread, with a bullet maturity on November 30, 2015 (see Notes 30 and 31).
Other U.S. Dollar LoansThis consists of the following:
§ US$75.0 million unsecured loans were obtained in November 2008. The loans bear interestrates based on LIBOR plus spread, with bullet maturities ranging from two to five years. TheCompany prepaid the US$20.0 million and the US$30.0 million unsecured loans on June 1,2009 and November 30, 2010, with original maturity dates of November 19, 2010 andNovember 28, 2011, respectively (see Notes 29 and 30). The remaining balance ofUS$25.0 million matured on November 20, 2013.
§ US$25.0 million five-year bilateral unsecured loan drawn on November 20, 2013. The loansbear interest rate based on LIBOR plus spread, with a bullet maturity on November 20, 2018(see Notes 29 and 30).
China Yuan Renminbi-denominated Five-Year LoanThis consists of the following:
§ A five-year loan obtained on August 26, 2009 amounting to ¥350.0 million to finance theconstruction of shopping malls. The loan is payable in semi-annual installments until 2014.The loan has a floating rate with an annual re-pricing at prevailing rate dictated by CentralBank of China less 10%. The loan carries an interest rate of 5.76% in 2013 and 2012(see Note 29).
§ A five-year loan obtained on August 27, 2010 amounting to ¥150.0 million to finance theconstruction of shopping malls. Partial drawdown totaling ¥61.0 million was made as atDecember 31, 2013. The loan is payable in 2015. The loan has a floating rate with an annualre-pricing at prevailing rate dictated by Central Bank of China less 10%. The loan carries aninterest rate of 5.76% in 2013 and 2012 (see Note 29).
China Yuan Renminbi-denominated Three-Year LoanThis represents a three-year loan obtained on March 28, 2011 amounting to ¥187.0 million out of¥250.0 million loan facility to finance the construction of shopping malls. The Company prepaidportion of this loan amounting to ¥37.0 million in 2013 and ¥18.0 million each in 2012. The loanhas a floating rate with an annual re-pricing at prevailing rate dictated by Central Bank of Chinaless 5% and will mature on March 27, 2014. The loan bears interest rate of 6.20% in 2013 and2012 (see Note 29).
The China yuan renminbi-denominated loans are secured by investment properties in China(see Note 15).
Philippine Peso-denominated Three-Year and Five-Year Fixed Rate NotesThis consists of the following:
§ On December 27, 2012, SMDC obtained long-term loan amounting to P=2,000.0 million froma local bank with an interest rate of 4.72%, payable quarterly and will mature onDecember 23, 2015.

- 70 -
*SGVFS004197*
§ Peso-denominated fixed rate corporate notes amounting to P=6,313.0 million, issued by SMDCon April 27, 2012. Of the total principal, P=6.0 million shall be paid annually starting onApril 27, 2013 up to April 27, 2017 and the remaining shall be paid on July 27, 2017. Thenotes have fixed interest rate of 6.0% payable semi-annually. The notes were pre-terminatedin June 2013 (see Note 29).
§ Series “A” and Series “B” peso-denominated fixed rate corporate notes amounting toP=2,000.0 million and P=8,000.0 million, respectively, issued by SMDC on June 1, 2010. TheSeries “A” and Series “B” notes have fixed interest rates of 6.8% and 7.7%, which are payablesemi-annually, and with maturity dates of June 1, 2013 and June 2, 2015, respectively. Thenotes were pre-terminated in June 2013 (see Note 29).
Philippine Peso-denominated Five-Year and Ten-Year Floating and Fixed Rate NotesThis represents five-year and ten-year floating and fixed rate notes obtained on June 19, 2012amounting to P=3,450.0 million and P=1,000.0 million for the floating and P=680.0 million andP=2,370.0 million for the fixed, respectively. The loans bear an interest rate based on PDST-F plusmargin for the floating and 6.22% and 6.81% for the five-year and ten-year fixed, respectively.The loans have bullet maturities in 2017 and 2022, respectively. The Company prepaid a portionof fixed rate notes amounting to P=50.0 million on March 19, 2013. The related unamortized debtissuance costs charged to expense amounted to P=0.4 million in 2013 (see Note 29).
Philippine Peso-denominated Five-Year, Seven-Year and Ten-Year Fixed and Floating Rate NotesThis represents a five-year floating, five-year, seven-year and ten-year fixed rate notes obtained onJanuary 12, 2012 amounting to P=200.0 million, P=1,012.0 million, P=133.0 million, andP=3,655.0 million, respectively. The loans bear an interest rate based on PDST-F plus margin forthe five-year floating and 5.86%, 5.97% and 6.10% for the five-year, seven-year and ten-yearfixed, respectively. The loans have bullet maturities in 2017, 2019 and 2022, respectively. TheCompany prepaid a portion of fixed rate notes amounting to P=634.0 million on April 12, 2013.The related unamortized debt issuance costs charged to expense amounted to P=5.0 million in 2013(see Note 29).
Philippine Peso-denominated Five-Year, Seven-Year and Ten-Year Corporate NotesThis represents a five-year floating and five-year, seven-year and ten-year fixed rate notesamounting to P=3,000.0 million, P=1,134.0 million, P=52.0 million and P=814.0 million, respectively,out of P=7,000.0 million facility obtained on December 20, 2010. The remaining P=2,000.0 millionfloating rate note was obtained on June 13, 2011. The loans bear an interest rate based on PDST-Fplus margin for the five-year floating and 5.79%, 5.89% and 6.65% for the five-year, seven-yearand ten-year fixed, respectively. The loans have bullet maturities in 2015, 2017 and 2020,respectively. The Company prepaid a portion of fixed rate notes amounting to P=196.0 million onMarch 20, 2013. The related unamortized debt issuance costs charged to expense amounted toP=2.0 million in 2013 (see Note 29).
Philippine Peso-denominated Five-Year and Ten-Year Corporate NotesThis represents a five-year floating and fixed rate and ten-year fixed rate notes obtained onApril 14, 2009 amounting to P=200.0 million, P=3,700.0 million and P=1,100.0 million, respectively.The loans bear an interest rate based on PDST-F plus margin for the five-year floating and 8.4%and 10.11% for the five-year and ten-year fixed, respectively. The loans have bullet maturities in2014 and 2019, respectively. The Company prepaid the P=200.0 million and P=3,700.0 millionloans on April 15, 2012, with original maturity date of April 15, 2014. The related unamortizeddebt issuance costs charged to expense amounted to P=17.0 million in 2012 (see Note 30).

- 71 -
*SGVFS004197*
Philippine Peso-denominated Five-Year Floating Rate NotesThis represents five-year floating rate notes obtained on March 18, 2011 and June 17, 2011amounting to P=4,000.0 million and P=1,000.0 million, respectively. The loans bear an interest ratebased on PDST-F plus margin and will mature on March 19, 2016 and June 18, 2016, respectively(see Note 29).
Philippine Peso-denominated Five-Year, Seven-Year and Ten-Year Fixed Rate NotesThis consists of the following:
§ On June 17, 2008, SM Prime obtained five-year, seven-year and ten-year fixed rate notesamounting to P=1,000.0 million, P=1,200.0 million and P=800.0 million, respectively. The loansbear fixed interest rates of 9.31%, 9.60% and 9.85%, respectively, and will mature onJune 17, 2013, 2015 and 2018, respectively. The loans amounting to P=1,000.0 million,P=1,200.0 million and P=800.0 million were prepaid on June 17, 2011, 2012 and 2013,respectively. The related unamortized debt issuance costs charged to expense amounted toP=4.0 million in 2011, P=5.0 million in 2012 and P=4.0 million in 2013 (see Notes 29 and 30).
§ Series “A” and Series “B” peso-denominated fixed rate corporate notes amounting toP=3,740.0 million and P=2,460.0 million, respectively, issued by SMDC on June 3, 2013. TheSeries “A” and Series “B” notes have fixed interest rates of 5.6% and 5.9%, which are payablesemi-annually, and with maturity dates of June 2020 and June 2023, respectively(see Note 29).
§ On June 28, 2013, SMDC issued peso-denominated fixed rate corporate notes amounting toP=2,000.0 million to a local bank. Of the total principal, P=2.0 million shall be paid annuallystarting June 30, 2014 up to June 30, 2019 and the remaining will be paid on June 28, 2020.The loan bears fixed interest rate at 5.7%, payable semi-annually (see Note 29).
Philippine Peso-denominated Five-Year Bilateral LoansThis consists of the following:
§ Five-year term loan obtained on September 28, 2007 and November 6, 2007 amounting toP=250.0 million to finance the construction of a project called “SM by the Bay.” The loan ispayable in equal quarterly installments of P=16.0 million starting December 2008 up toSeptember 2012 and carries an interest rate based on PDST-F plus an agreed margin(see Note 29).
§ Five-year term loan obtained on October 24, 2011 amounting to P=500.0 million and willmature on October 24, 2016. The loan carries an interest rate based on PDST-F plus anagreed margin (see Note 29).
Other Bank Loans - SubsidiariesThis account includes the following:
2013 2012(In Thousands)
Three-year term loan P=315,000 P=‒Five-year term loans 7,511,060 7,933,550Ten-year term loan 3,200,000 1,200,000
P=11,026,060 P=9,133,550
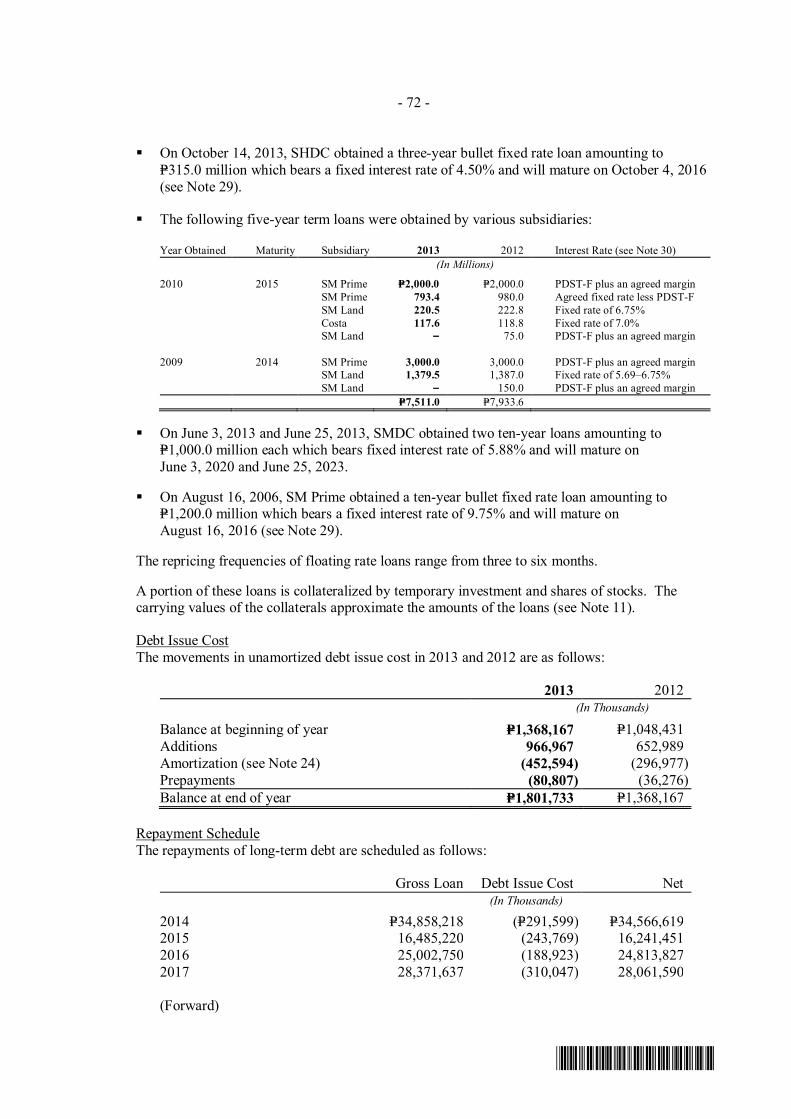
- 72 -
*SGVFS004197*
§ On October 14, 2013, SHDC obtained a three-year bullet fixed rate loan amounting toP=315.0 million which bears a fixed interest rate of 4.50% and will mature on October 4, 2016(see Note 29).
§ The following five-year term loans were obtained by various subsidiaries:
Year Obtained Maturity Subsidiary 2013 2012 Interest Rate (see Note 30)(In Millions)
2010 2015 SM Prime P=2,000.0 P=2,000.0 PDST-F plus an agreed marginSM Prime 793.4 980.0 Agreed fixed rate less PDST-FSM Land 220.5 222.8 Fixed rate of 6.75%Costa 117.6 118.8 Fixed rate of 7.0%SM Land – 75.0 PDST-F plus an agreed margin
2009 2014 SM Prime 3,000.0 3,000.0 PDST-F plus an agreed marginSM Land 1,379.5 1,387.0 Fixed rate of 5.69–6.75%SM Land – 150.0 PDST-F plus an agreed margin
P=7,511.0 P=7,933.6
§ On June 3, 2013 and June 25, 2013, SMDC obtained two ten-year loans amounting toP=1,000.0 million each which bears fixed interest rate of 5.88% and will mature onJune 3, 2020 and June 25, 2023.
§ On August 16, 2006, SM Prime obtained a ten-year bullet fixed rate loan amounting toP=1,200.0 million which bears a fixed interest rate of 9.75% and will mature onAugust 16, 2016 (see Note 29).
The repricing frequencies of floating rate loans range from three to six months.
A portion of these loans is collateralized by temporary investment and shares of stocks. Thecarrying values of the collaterals approximate the amounts of the loans (see Note 11).
Debt Issue CostThe movements in unamortized debt issue cost in 2013 and 2012 are as follows:
2013 2012(In Thousands)
Balance at beginning of year P=1,368,167 P=1,048,431Additions 966,967 652,989Amortization (see Note 24) (452,594) (296,977)Prepayments (80,807) (36,276)Balance at end of year P=1,801,733 P=1,368,167
Repayment ScheduleThe repayments of long-term debt are scheduled as follows:
Gross Loan Debt Issue Cost Net(In Thousands)
2014 P=34,858,218 (P=291,599) P=34,566,6192015 16,485,220 (243,769) 16,241,4512016 25,002,750 (188,923) 24,813,8272017 28,371,637 (310,047) 28,061,590
(Forward)
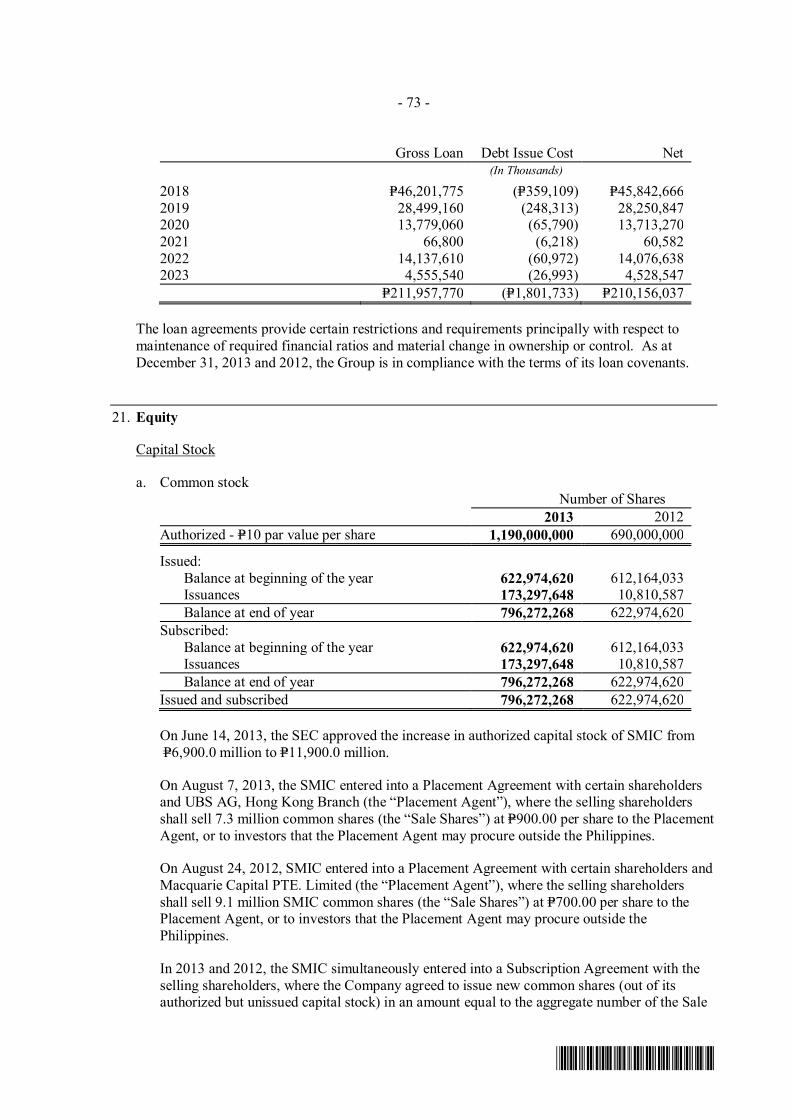
- 73 -
*SGVFS004197*
Gross Loan Debt Issue Cost Net(In Thousands)
2018 P=46,201,775 (P=359,109) P=45,842,6662019 28,499,160 (248,313) 28,250,8472020 13,779,060 (65,790) 13,713,2702021 66,800 (6,218) 60,5822022 14,137,610 (60,972) 14,076,6382023 4,555,540 (26,993) 4,528,547
P=211,957,770 (P=1,801,733) P=210,156,037
The loan agreements provide certain restrictions and requirements principally with respect tomaintenance of required financial ratios and material change in ownership or control. As atDecember 31, 2013 and 2012, the Group is in compliance with the terms of its loan covenants.
21. Equity
Capital Stock
a. Common stockNumber of Shares
2013 2012Authorized - P=10 par value per share 1,190,000,000 690,000,000
Issued:Balance at beginning of the year 622,974,620 612,164,033Issuances 173,297,648 10,810,587Balance at end of year 796,272,268 622,974,620
Subscribed:Balance at beginning of the year 622,974,620 612,164,033Issuances 173,297,648 10,810,587Balance at end of year 796,272,268 622,974,620
Issued and subscribed 796,272,268 622,974,620
On June 14, 2013, the SEC approved the increase in authorized capital stock of SMIC from P=6,900.0 million to P=11,900.0 million.
On August 7, 2013, the SMIC entered into a Placement Agreement with certain shareholdersand UBS AG, Hong Kong Branch (the “Placement Agent”), where the selling shareholdersshall sell 7.3 million common shares (the “Sale Shares”) at P=900.00 per share to the PlacementAgent, or to investors that the Placement Agent may procure outside the Philippines.
On August 24, 2012, SMIC entered into a Placement Agreement with certain shareholders andMacquarie Capital PTE. Limited (the “Placement Agent”), where the selling shareholdersshall sell 9.1 million SMIC common shares (the “Sale Shares”) at P=700.00 per share to thePlacement Agent, or to investors that the Placement Agent may procure outside thePhilippines.
In 2013 and 2012, the SMIC simultaneously entered into a Subscription Agreement with theselling shareholders, where the Company agreed to issue new common shares (out of itsauthorized but unissued capital stock) in an amount equal to the aggregate number of the Sale
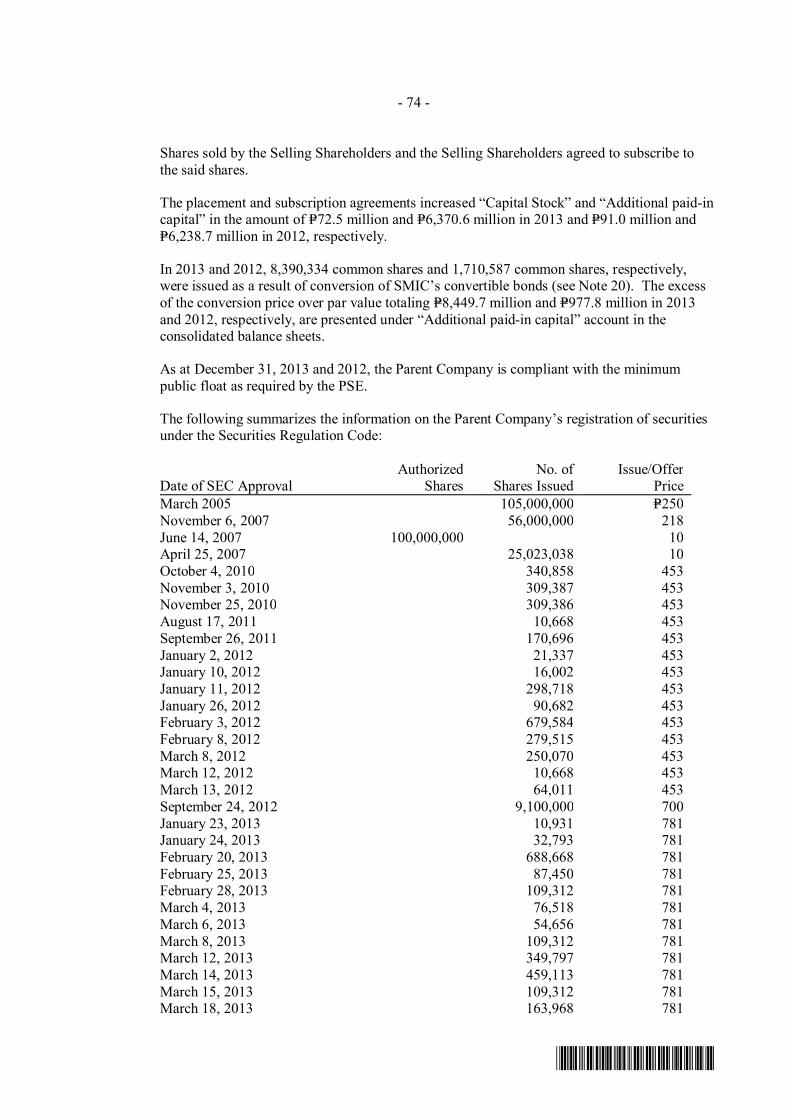
- 74 -
*SGVFS004197*
Shares sold by the Selling Shareholders and the Selling Shareholders agreed to subscribe tothe said shares.
The placement and subscription agreements increased “Capital Stock” and “Additional paid-incapital” in the amount of P=72.5 million and P=6,370.6 million in 2013 and P=91.0 million andP=6,238.7 million in 2012, respectively.
In 2013 and 2012, 8,390,334 common shares and 1,710,587 common shares, respectively,were issued as a result of conversion of SMIC’s convertible bonds (see Note 20). The excessof the conversion price over par value totaling P=8,449.7 million and P=977.8 million in 2013and 2012, respectively, are presented under “Additional paid-in capital” account in theconsolidated balance sheets.
As at December 31, 2013 and 2012, the Parent Company is compliant with the minimumpublic float as required by the PSE.
The following summarizes the information on the Parent Company’s registration of securitiesunder the Securities Regulation Code:
Date of SEC ApprovalAuthorized
SharesNo. of
Shares IssuedIssue/Offer
PriceMarch 2005 105,000,000 P=250November 6, 2007 56,000,000 218June 14, 2007 100,000,000 10April 25, 2007 25,023,038 10October 4, 2010 340,858 453November 3, 2010 309,387 453November 25, 2010 309,386 453August 17, 2011 10,668 453September 26, 2011 170,696 453January 2, 2012 21,337 453January 10, 2012 16,002 453January 11, 2012 298,718 453January 26, 2012 90,682 453February 3, 2012 679,584 453February 8, 2012 279,515 453March 8, 2012 250,070 453March 12, 2012 10,668 453March 13, 2012 64,011 453September 24, 2012 9,100,000 700January 23, 2013 10,931 781January 24, 2013 32,793 781February 20, 2013 688,668 781February 25, 2013 87,450 781February 28, 2013 109,312 781March 4, 2013 76,518 781March 6, 2013 54,656 781March 8, 2013 109,312 781March 12, 2013 349,797 781March 14, 2013 459,113 781March 15, 2013 109,312 781March 18, 2013 163,968 781

- 75 -
*SGVFS004197*
Date of SEC ApprovalAuthorized
SharesNo. of
Shares IssuedIssue/Offer
PriceMarch 19, 2013 218,625 781March 20, 2013 153,037 781March 22, 2013 120,243 781March 25, 2013 207,693 781April 2, 2013 546,563 781April 3, 2013 174,900 781April 5, 2013 163,969 781April 10, 2013 109,312 781April 11, 2013 109,312 781April 12, 2013 109,312 781April 15, 2013 54,656 781April 16, 2013 109,312 781April 17, 2013 109,312 781April 18, 2013 229,556 781April 19, 2013 32,793 781April 22,2013 109,312 781April 23, 2013 185,830 781April 24, 2013 87,449 781April 26, 2013 54,656 781May 6, 2013 120,243 781May 7, 2013 382,594 781May 8, 2013 65,587 781May 9, 2013 21,862 781May 10, 2013 207,693 781May 13, 2013 54,656 781May 16, 2013 109,312 781May 17, 2013 546,562 781May 20, 2013 54,656 781May 24, 2013 163,968 781May 28, 2013 185,831 781May 29, 2013 207,693 781June 4, 2013 163,968 781June 5, 2013 54,656 781June 6, 2013 32,793 781June 7, 2013 21,862 781June 14, 2013 500,000,000 10June 24, 2013 10,931 781July 5, 2013 109,312 781July 18, 2013 82,053 625July 19, 2013 164,108 625July 26, 2013 82,054 625July 29, 2013 41,027 625July 30, 2013 136,757 625August 1, 2013 157,629,986 10August 1, 2013 7,250,000 900October 17, 2013 27,328 10October 17, 2013 68,378 625October 25, 2013 136,755 625November 1, 2013 27,351 625
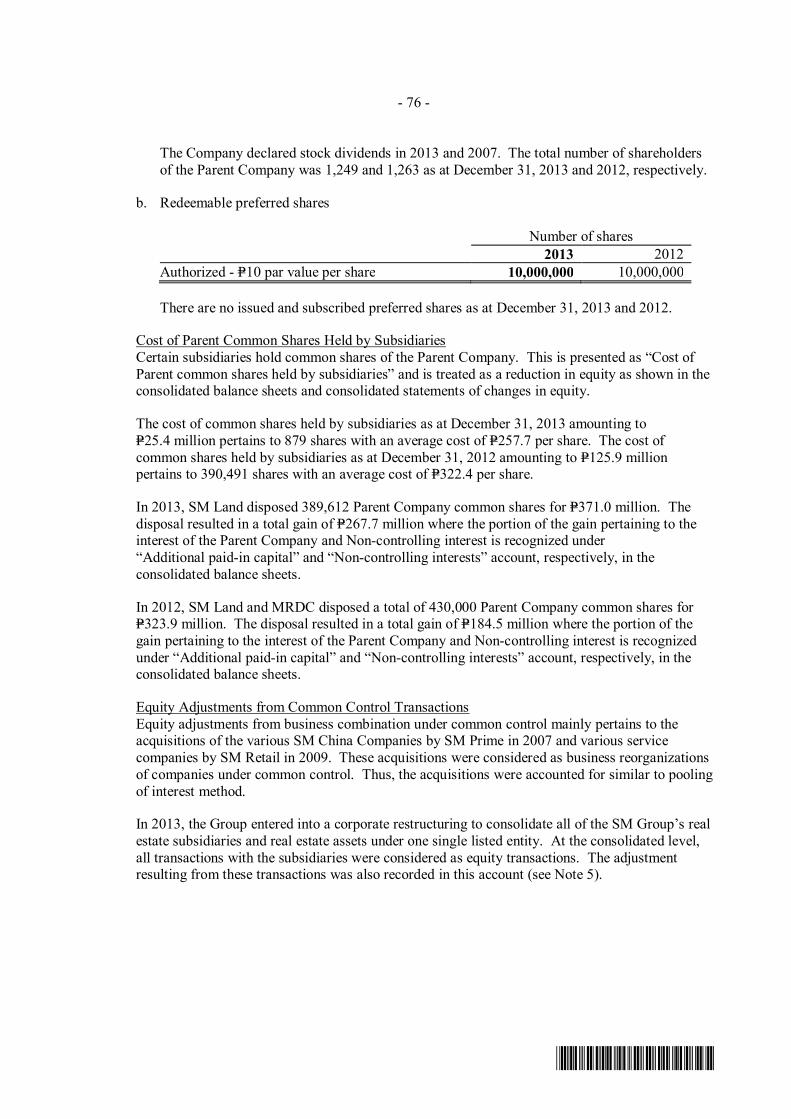
- 76 -
*SGVFS004197*
The Company declared stock dividends in 2013 and 2007. The total number of shareholdersof the Parent Company was 1,249 and 1,263 as at December 31, 2013 and 2012, respectively.
b. Redeemable preferred shares
Number of shares2013 2012
Authorized - P=10 par value per share 10,000,000 10,000,000
There are no issued and subscribed preferred shares as at December 31, 2013 and 2012.
Cost of Parent Common Shares Held by SubsidiariesCertain subsidiaries hold common shares of the Parent Company. This is presented as “Cost ofParent common shares held by subsidiaries” and is treated as a reduction in equity as shown in theconsolidated balance sheets and consolidated statements of changes in equity.
The cost of common shares held by subsidiaries as at December 31, 2013 amounting toP=25.4 million pertains to 879 shares with an average cost of P=257.7 per share. The cost ofcommon shares held by subsidiaries as at December 31, 2012 amounting to P=125.9 millionpertains to 390,491 shares with an average cost of P=322.4 per share.
In 2013, SM Land disposed 389,612 Parent Company common shares for P=371.0 million. Thedisposal resulted in a total gain of P=267.7 million where the portion of the gain pertaining to theinterest of the Parent Company and Non-controlling interest is recognized under“Additional paid-in capital” and “Non-controlling interests” account, respectively, in theconsolidated balance sheets.
In 2012, SM Land and MRDC disposed a total of 430,000 Parent Company common shares forP=323.9 million. The disposal resulted in a total gain of P=184.5 million where the portion of thegain pertaining to the interest of the Parent Company and Non-controlling interest is recognizedunder “Additional paid-in capital” and “Non-controlling interests” account, respectively, in theconsolidated balance sheets.
Equity Adjustments from Common Control TransactionsEquity adjustments from business combination under common control mainly pertains to theacquisitions of the various SM China Companies by SM Prime in 2007 and various servicecompanies by SM Retail in 2009. These acquisitions were considered as business reorganizationsof companies under common control. Thus, the acquisitions were accounted for similar to poolingof interest method.
In 2013, the Group entered into a corporate restructuring to consolidate all of the SM Group’s realestate subsidiaries and real estate assets under one single listed entity. At the consolidated level,all transactions with the subsidiaries were considered as equity transactions. The adjustmentresulting from these transactions was also recorded in this account (see Note 5).

- 77 -
*SGVFS004197*
Retained Earnings
a. Appropriated
On December 14, 2012, the BOD approved the appropriation of P=35,000.0 million retainedearnings.
On April 25, 2013, the BOD approved to reverse P=8,000.0 million of the appropriation.As at December 31, 2013, the appropriated retained earnings is intended for the followingprojects:
Projects Timeline 2013(In Thousands)
Hotel projects 2013–2015 P=8,000,000Commercial buildings 2012–2016 10,000,000Acquisition of investments 2012–2018 9,000,000
P=27,000,000
b. Unappropriated
On April 25, 2013, the BOD approved the declaration of cash dividends of 118.0% of the parvalue or P=11.80 per share for a total amount of P=7,402.0 million in favor of stockholders onrecord as at May 24, 2013. This was paid on June 20, 2013. On the same date, the BODapproved the declaration of 25% stock dividends in favor of stockholders on record to be fixedby the SEC.
On June 24, 2013 and July 12, 2013, the SEC approved the issuance of 157,000,000 and629,986 shares as stock dividends to stockholders on record as of July 8, 2013. The stockdividends were issued on August 1, 2013.
On April 26, 2012, the BOD approved the declaration of cash dividends of 104.0% of the parvalue or P=10.40 per share for a total amount of P=6,383.6 million in favor of stockholders onrecord as at May 22, 2012. This was paid on June 21, 2012.
On April 27, 2011, the BOD approved the declaration of cash dividends of 90.4% of the parvalue or P=9.04 per share for a total amount of P=5,532.3 million in favor of stockholders onrecord as at May 27, 2011. This was paid on June 22, 2011.
The balance of retained earnings includes the accumulated equity in net earnings ofsubsidiaries, associates and joint ventures amounting to P=108,146.6 million andP=93,346.9 million as at December 31, 2013 and 2012, respectively. Such amounts are notavailable for distribution until such time that the Parent Company receives the dividends fromthe respective subsidiaries, associates and joint ventures.
- 78 -
*SGVFS004197*
22. Related Party Transactions
Parties are considered to be related if one party has the ability, directly and indirectly, to controlthe other party or exercise significant influence over the other party in making financial andoperating decisions. Parties are also considered to be related if they are subject to commoncontrol.
The following are the significant transactions with related parties:
a. Rent
The Group have existing lease agreements for office and commercial spaces with relatedcompanies (retail entities under common stockholder, banking group and other related partiesunder common stockholder).
b. Management and Service Fees
The Group pays management fees to Shopping Center Management Corporation, LeisureCenter, Inc., West Avenue Theaters Corporation and Family Entertainment Center, Inc. (relatedparties under common stockholder) for the management of the office and mall premises. TheGroup also provides manpower and other services to related parties under commonstockholder.
SMIC and SM Retail also receive management and service fees from retail entities undercommon stockholder for management, consultancy, manpower and other services.
c. Dividend Income
The Group has investment in certain related parties under common stockholder classified asAFS equity instruments. The Group earn income from these investments upon the declarationof dividends by the investees.
d. Cash Placements and Loans
The Group has certain bank accounts and cash placements that are maintained with BDOand China Bank (Bank Associates). Such accounts earn interest based on prevailing marketinterest rates (see Notes 7, 8 and 17).
The Group also availed of bank loans and long-term debt from BDO and China Bank and paysinterest based on prevailing market interest rates (see Notes 18 and 20).
e. Others
The Group, in the normal course of business, has outstanding receivables from and payables torelated companies as at reporting period which are unsecured and normally settled in cash.
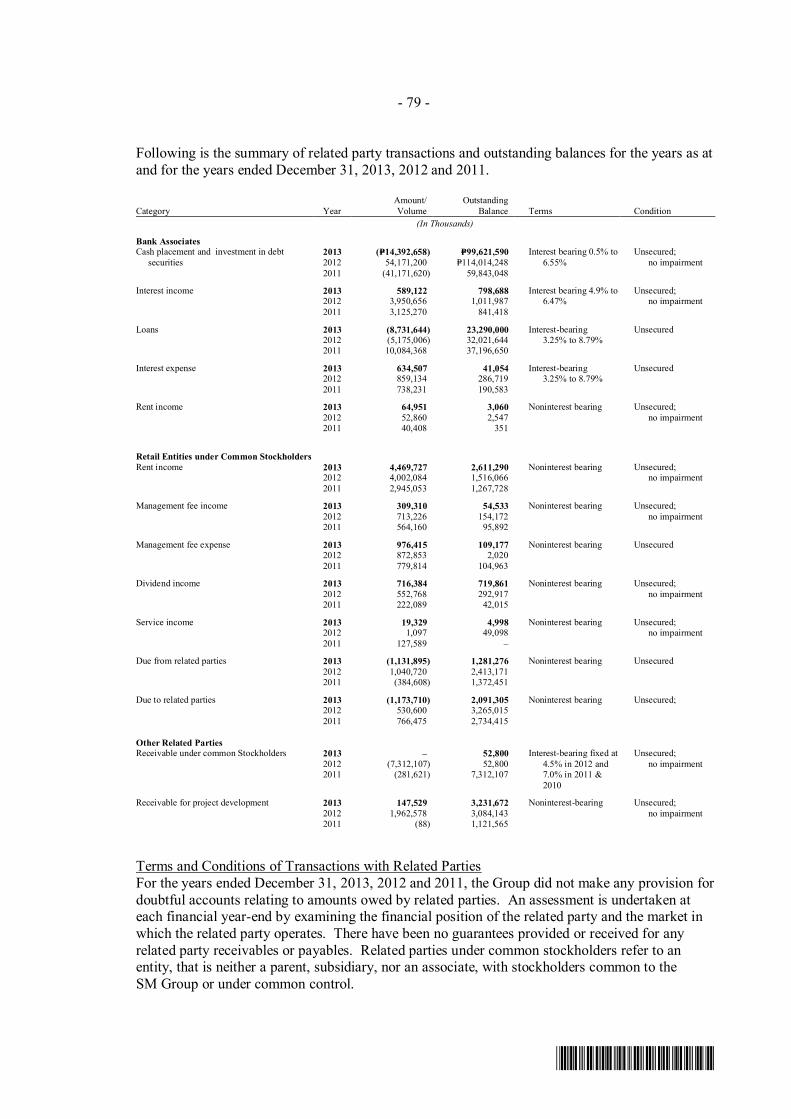
- 79 -
*SGVFS004197*
Following is the summary of related party transactions and outstanding balances for the years as atand for the years ended December 31, 2013, 2012 and 2011.
Category YearAmount/Volume
OutstandingBalance Terms Condition
(In Thousands)
Bank AssociatesCash placement and investment in debt
securities2013 (P=14,392,658) P=99,621,590 Interest bearing 0.5% to
6.55%Unsecured;
no impairment2012 54,171,200 P=114,014,2482011 (41,171,620) 59,843,048
Interest income 2013 589,122 798,688 Interest bearing 4.9% to6.47%
Unsecured;no impairment2012 3,950,656 1,011,987
2011 3,125,270 841,418
Loans 2013 (8,731,644) 23,290,000 Interest-bearing3.25% to 8.79%
Unsecured2012 (5,175,006) 32,021,6442011 10,084,368 37,196,650
Interest expense 2013 634,507 41,054 Interest-bearing3.25% to 8.79%
Unsecured2012 859,134 286,7192011 738,231 190,583
Rent income 2013 64,951 3,060 Noninterest bearing Unsecured;no impairment2012 52,860 2,547
2011 40,408 351
Retail Entities under Common StockholdersRent income 2013 4,469,727 2,611,290 Noninterest bearing Unsecured;
no impairment2012 4,002,084 1,516,0662011 2,945,053 1,267,728
Management fee income 2013 309,310 54,533 Noninterest bearing Unsecured;no impairment2012 713,226 154,172
2011 564,160 95,892
Management fee expense 2013 976,415 109,177 Noninterest bearing Unsecured2012 872,853 2,0202011 779,814 104,963
Dividend income 2013 716,384 719,861 Noninterest bearing Unsecured;no impairment2012 552,768 292,917
2011 222,089 42,015
Service income 2013 19,329 4,998 Noninterest bearing Unsecured;no impairment2012 1,097 49,098
2011 127,589 –
Due from related parties 2013 (1,131,895) 1,281,276 Noninterest bearing Unsecured2012 1,040,720 2,413,1712011 (384,608) 1,372,451
Due to related parties 2013 (1,173,710) 2,091,305 Noninterest bearing Unsecured;2012 530,600 3,265,0152011 766,475 2,734,415
Other Related PartiesReceivable under common Stockholders 2013 – 52,800 Interest-bearing fixed at
4.5% in 2012 and7.0% in 2011 &2010
Unsecured;no impairment2012 (7,312,107) 52,800
2011 (281,621) 7,312,107
Receivable for project development 2013 147,529 3,231,672 Noninterest-bearing Unsecured;no impairment2012 1,962,578 3,084,143
2011 (88) 1,121,565
Terms and Conditions of Transactions with Related PartiesFor the years ended December 31, 2013, 2012 and 2011, the Group did not make any provision fordoubtful accounts relating to amounts owed by related parties. An assessment is undertaken ateach financial year-end by examining the financial position of the related party and the market inwhich the related party operates. There have been no guarantees provided or received for anyrelated party receivables or payables. Related parties under common stockholders refer to anentity, that is neither a parent, subsidiary, nor an associate, with stockholders common to theSM Group or under common control.
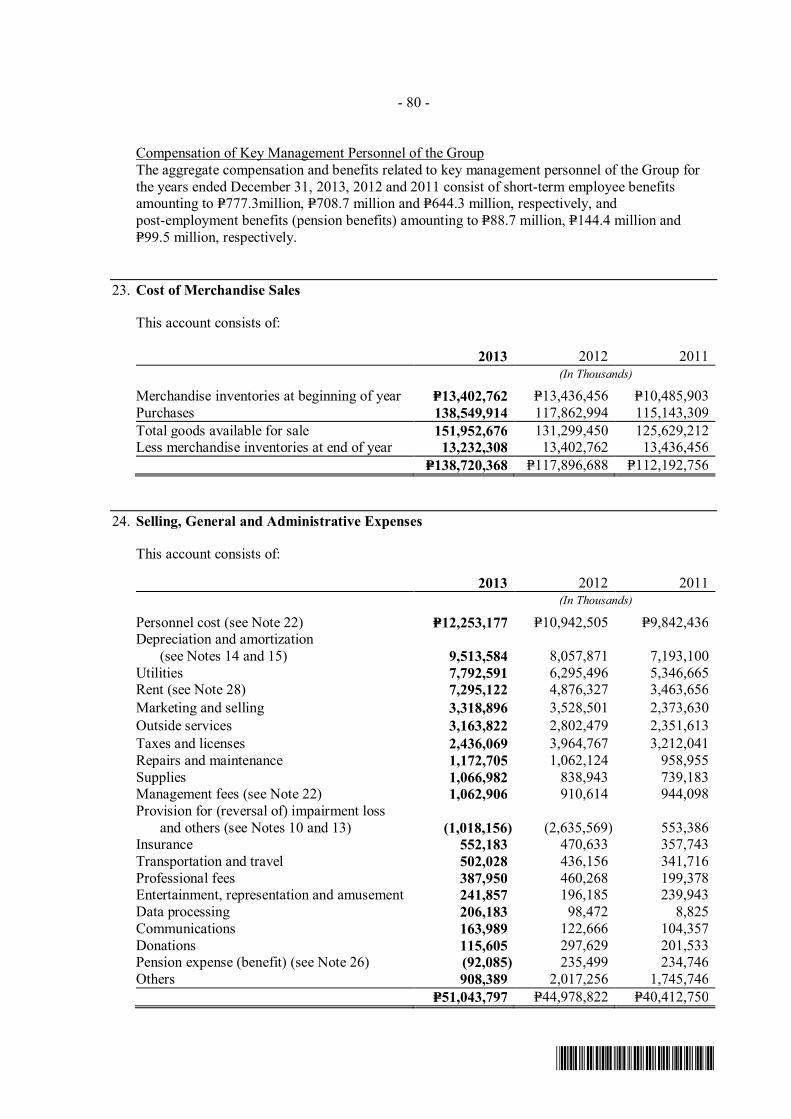
- 80 -
*SGVFS004197*
Compensation of Key Management Personnel of the GroupThe aggregate compensation and benefits related to key management personnel of the Group forthe years ended December 31, 2013, 2012 and 2011 consist of short-term employee benefitsamounting to P=777.3million, P=708.7 million and P=644.3 million, respectively, andpost-employment benefits (pension benefits) amounting to P=88.7 million, P=144.4 million andP=99.5 million, respectively.
23. Cost of Merchandise Sales
This account consists of:
2013 2012 2011(In Thousands)
Merchandise inventories at beginning of year P=13,402,762 P=13,436,456 P=10,485,903Purchases 138,549,914 117,862,994 115,143,309Total goods available for sale 151,952,676 131,299,450 125,629,212Less merchandise inventories at end of year 13,232,308 13,402,762 13,436,456
P=138,720,368 P=117,896,688 P=112,192,756
24. Selling, General and Administrative Expenses
This account consists of:
2013 2012 2011(In Thousands)
Personnel cost (see Note 22) P=12,253,177 P=10,942,505 P=9,842,436Depreciation and amortization
(see Notes 14 and 15) 9,513,584 8,057,871 7,193,100Utilities 7,792,591 6,295,496 5,346,665Rent (see Note 28) 7,295,122 4,876,327 3,463,656Marketing and selling 3,318,896 3,528,501 2,373,630Outside services 3,163,822 2,802,479 2,351,613Taxes and licenses 2,436,069 3,964,767 3,212,041Repairs and maintenance 1,172,705 1,062,124 958,955Supplies 1,066,982 838,943 739,183Management fees (see Note 22) 1,062,906 910,614 944,098Provision for (reversal of) impairment loss
and others (see Notes 10 and 13) (1,018,156) (2,635,569) 553,386Insurance 552,183 470,633 357,743Transportation and travel 502,028 436,156 341,716Professional fees 387,950 460,268 199,378Entertainment, representation and amusement 241,857 196,185 239,943Data processing 206,183 98,472 8,825Communications 163,989 122,666 104,357Donations 115,605 297,629 201,533Pension expense (benefit) (see Note 26) (92,085) 235,499 234,746Others 908,389 2,017,256 1,745,746
P=51,043,797 P=44,978,822 P=40,412,750
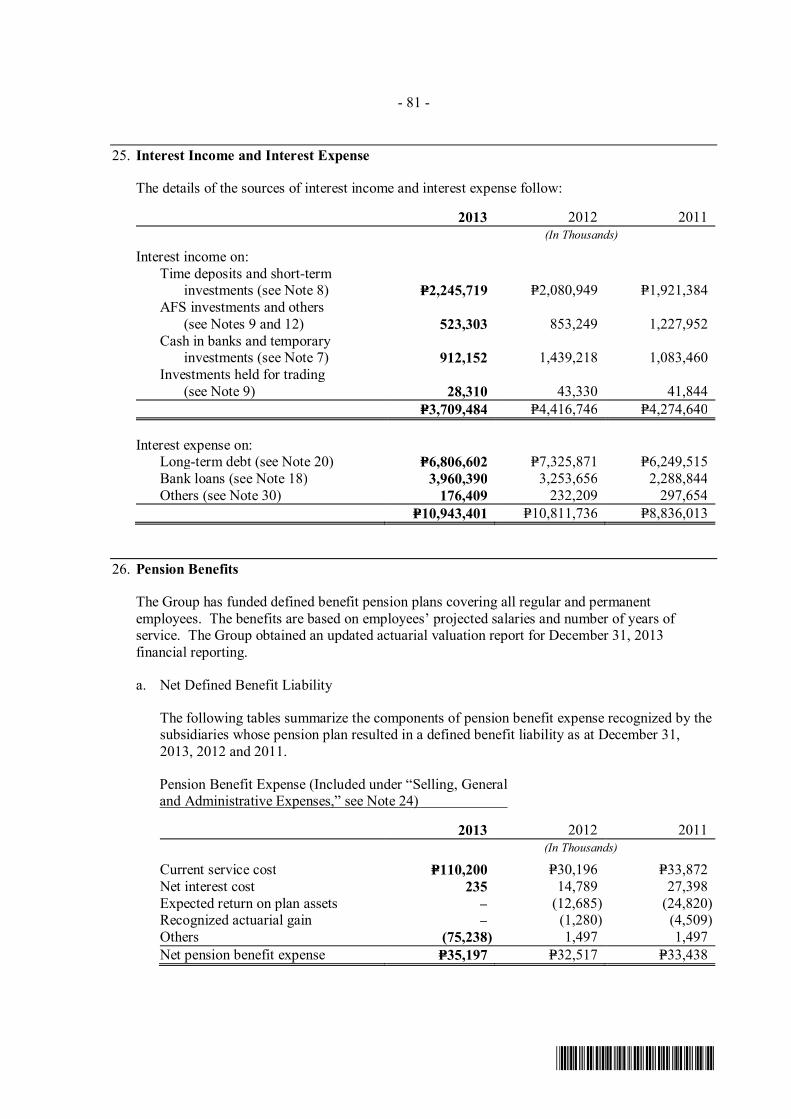
- 81 -
*SGVFS004197*
25. Interest Income and Interest Expense
The details of the sources of interest income and interest expense follow:
2013 2012 2011(In Thousands)
Interest income on:Time deposits and short-term
investments (see Note 8) P=2,245,719 P=2,080,949 P=1,921,384AFS investments and others
(see Notes 9 and 12) 523,303 853,249 1,227,952Cash in banks and temporary
investments (see Note 7) 912,152 1,439,218 1,083,460Investments held for trading
(see Note 9) 28,310 43,330 41,844P=3,709,484 P=4,416,746 P=4,274,640
Interest expense on:Long-term debt (see Note 20) P=6,806,602 P=7,325,871 P=6,249,515Bank loans (see Note 18) 3,960,390 3,253,656 2,288,844Others (see Note 30) 176,409 232,209 297,654
P=10,943,401 P=10,811,736 P=8,836,013
26. Pension Benefits
The Group has funded defined benefit pension plans covering all regular and permanentemployees. The benefits are based on employees’ projected salaries and number of years ofservice. The Group obtained an updated actuarial valuation report for December 31, 2013financial reporting.
a. Net Defined Benefit Liability
The following tables summarize the components of pension benefit expense recognized by thesubsidiaries whose pension plan resulted in a defined benefit liability as at December 31,2013, 2012 and 2011.
Pension Benefit Expense (Included under “Selling, Generaland Administrative Expenses,” see Note 24)
2013 2012 2011(In Thousands)
Current service cost P=110,200 P=30,196 P=33,872Net interest cost 235 14,789 27,398Expected return on plan assets – (12,685) (24,820)Recognized actuarial gain – (1,280) (4,509)Others (75,238) 1,497 1,497Net pension benefit expense P=35,197 P=32,517 P=33,438
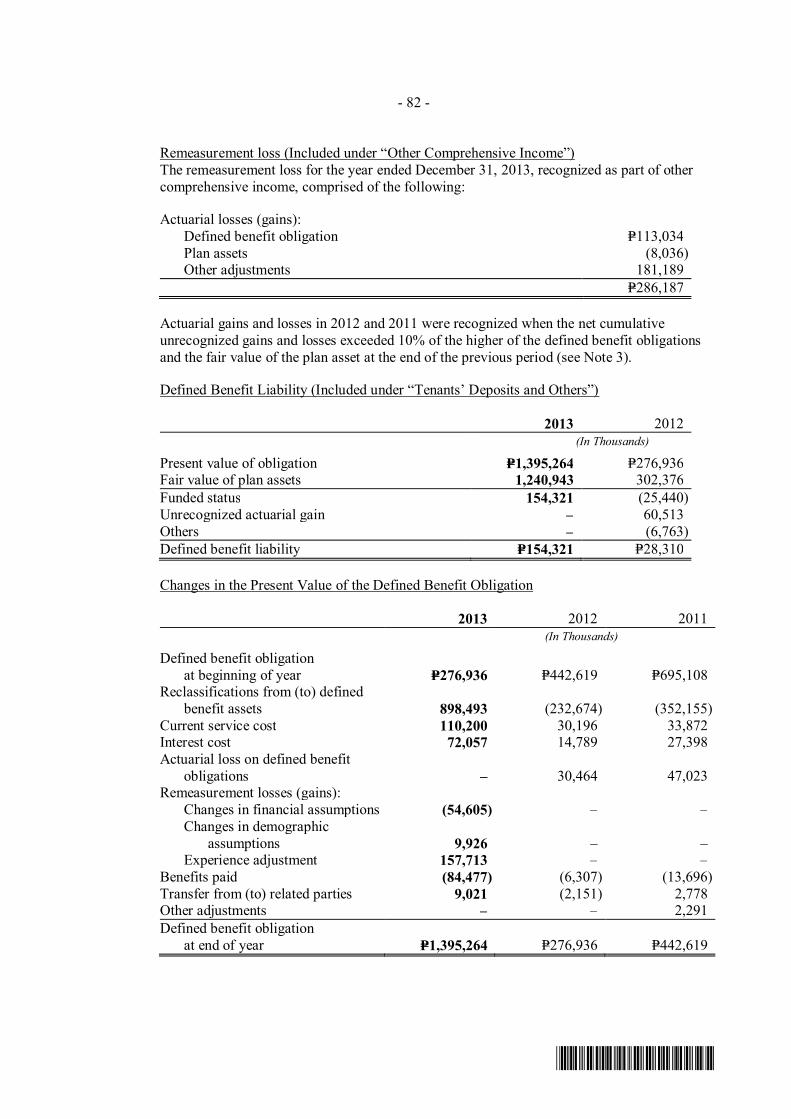
- 82 -
*SGVFS004197*
Remeasurement loss (Included under “Other Comprehensive Income”)The remeasurement loss for the year ended December 31, 2013, recognized as part of othercomprehensive income, comprised of the following:
Actuarial losses (gains):Defined benefit obligation P=113,034Plan assets (8,036)Other adjustments 181,189
P=286,187
Actuarial gains and losses in 2012 and 2011 were recognized when the net cumulativeunrecognized gains and losses exceeded 10% of the higher of the defined benefit obligationsand the fair value of the plan asset at the end of the previous period (see Note 3).
Defined Benefit Liability (Included under “Tenants’ Deposits and Others”)
2013 2012(In Thousands)
Present value of obligation P=1,395,264 P=276,936Fair value of plan assets 1,240,943 302,376Funded status 154,321 (25,440)Unrecognized actuarial gain – 60,513Others – (6,763)Defined benefit liability P=154,321 P=28,310
Changes in the Present Value of the Defined Benefit Obligation
2013 2012 2011(In Thousands)
Defined benefit obligationat beginning of year P=276,936 P=442,619 P=695,108
Reclassifications from (to) definedbenefit assets 898,493 (232,674) (352,155)
Current service cost 110,200 30,196 33,872Interest cost 72,057 14,789 27,398Actuarial loss on defined benefit
obligations – 30,464 47,023Remeasurement losses (gains):
Changes in financial assumptions (54,605) – –Changes in demographic
assumptions 9,926 – –Experience adjustment 157,713 – –
Benefits paid (84,477) (6,307) (13,696)Transfer from (to) related parties 9,021 (2,151) 2,778Other adjustments – – 2,291Defined benefit obligation
at end of year P=1,395,264 P=276,936 P=442,619

- 83 -
*SGVFS004197*
Changes in the Fair Value of Plan Assets
2013 2012 2011(In Thousands)
Fair value of plan assetsat beginning of year P=302,376 P=494,554 P=732,189
Reclassifications from (to) definedbenefit assets 878,655 (253,032) (343,747)
Actual contributions 55,510 28,169 102,835Actuarial gain on plan assets – 28,458 10,104Expected return on plan assets – 12,685 24,820Interest income 71,822 – –Remeasurement gain - return on plan
assets 8,036 – –Benefits paid (84,477) (6,307) (13,696)Transfer from (to) related parties 9,021 (2,151) 2,778Other adjustments – – (20,729)Fair value of plan assets at end
of year P=1,240,943 P=302,376 P=494,554
Unrecognized Actuarial Gain
2013 2012 2011(In Thousands)
Net cumulative unrecognizedactuarial gain at beginning of year P=60,513 P=131,766 P=219,047
Actuarial gain (loss) on: –Plan assets – 28,458 10,104Defined benefit obligation – (30,464) (47,023)
Reclassifications to defined benefitassets – (67,967) (24,722)
Recognized actuarial gain – (1,280) (4,509)Other adjustments (60,513) – (21,131)Net cumulative unrecognized
actuarial gain at end of year P=– P=60,513 P=131,766

- 84 -
*SGVFS004197*
b. Net Defined Benefit Asset
The following tables summarize the components of pension benefit expense recognized by thesubsidiaries whose pension plan resulted in a defined benefit asset as at December 31, 2013,2012 and 2011.
Pension Benefit Expense (Income) (Included under “Selling, Generaland Administrative Expenses,” see Note 24)
2013 2012 2011(In Thousands)
Current service cost P=240,698 P=232,910 P=206,172Net interest cost (income) (39,644) 177,343 150,945Expected return on plan assets – (186,269) (162,260)Recognized actuarial loss (gain) – (13,888) 10,583Effect of asset limit 445 (2,860) 1,435Others (328,781) (4,254) (5,567)Net pension benefit expense (income) (P=127,282) P=202,982 P=201,308
Remeasurement gain (Included under “Other Comprehensive Income”)The remeasurement gain for the year ended December 31, 2013, recognized as part of othercomprehensive income, is comprised of the following:
Actuarial losses (gains):Defined benefit obligation P=6,276Plan assets (55,722)Changes in the effect of the asset ceiling (35,730)Other adjustments 293
(P=84,883)
Actuarial gains and losses in 2012 and 2011 were recognized when the net cumulativeunrecognized gains and losses exceeded 10% of the higher of the defined benefit obligationsand the fair value of the plan asset at the end of the previous period (see Note 3).
Defined Benefit Asset (Recorded as part of “Other Noncurrent Assets,” see Note 17)
2013 2012(In Thousands)
Present value of obligation P=2,640,893 P=3,234,528Fair value of plan assets 3,343,406 3,967,810Funded status (702,513) (733,282)Amount not recognized due to asset limit 86,531 (7,404)Unrecognized actuarial gain – 292,384Others – (4,608)Defined benefit asset (P=615,982) (P=452,910)
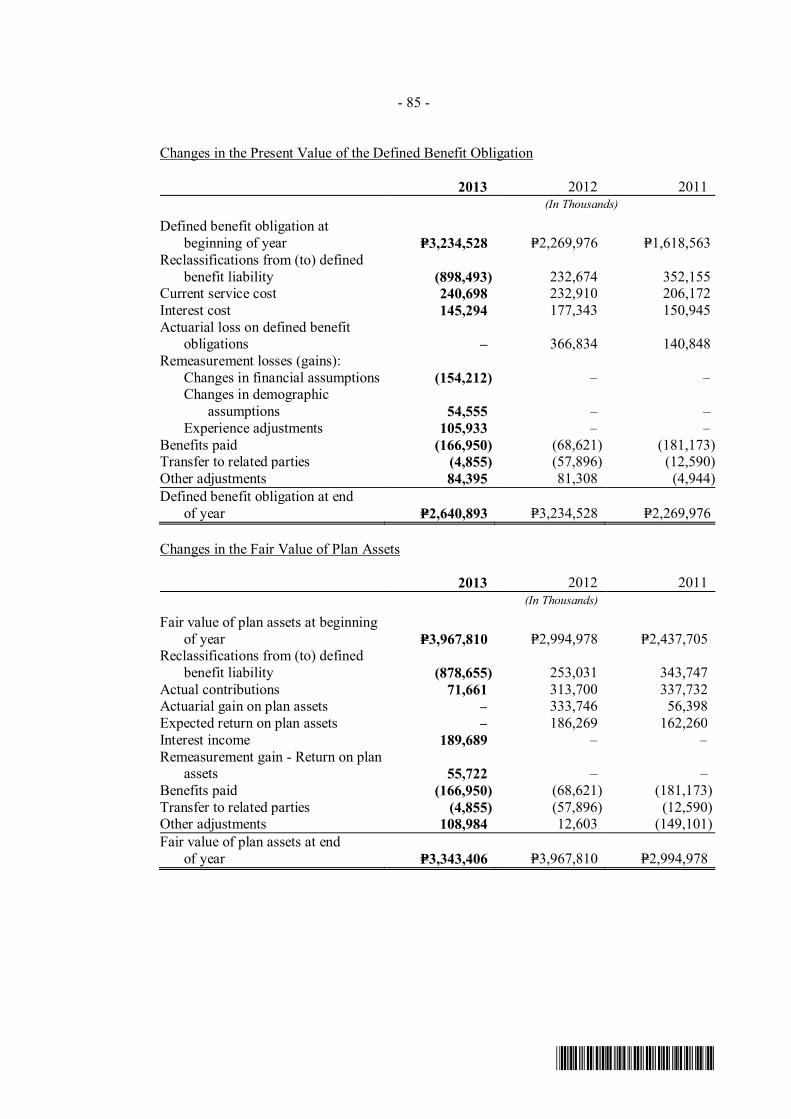
- 85 -
*SGVFS004197*
Changes in the Present Value of the Defined Benefit Obligation
2013 2012 2011(In Thousands)
Defined benefit obligation atbeginning of year P=3,234,528 P=2,269,976 P=1,618,563
Reclassifications from (to) definedbenefit liability (898,493) 232,674 352,155
Current service cost 240,698 232,910 206,172Interest cost 145,294 177,343 150,945Actuarial loss on defined benefit
obligations – 366,834 140,848Remeasurement losses (gains):
Changes in financial assumptions (154,212) – –Changes in demographic
assumptions 54,555 – –Experience adjustments 105,933 – –
Benefits paid (166,950) (68,621) (181,173)Transfer to related parties (4,855) (57,896) (12,590)Other adjustments 84,395 81,308 (4,944)Defined benefit obligation at end
of year P=2,640,893 P=3,234,528 P=2,269,976
Changes in the Fair Value of Plan Assets
2013 2012 2011(In Thousands)
Fair value of plan assets at beginningof year P=3,967,810 P=2,994,978 P=2,437,705
Reclassifications from (to) definedbenefit liability (878,655) 253,031 343,747
Actual contributions 71,661 313,700 337,732Actuarial gain on plan assets – 333,746 56,398Expected return on plan assets – 186,269 162,260Interest income 189,689 – –Remeasurement gain - Return on plan
assets 55,722 – –Benefits paid (166,950) (68,621) (181,173)Transfer to related parties (4,855) (57,896) (12,590)Other adjustments 108,984 12,603 (149,101)Fair value of plan assets at end
of year P=3,343,406 P=3,967,810 P=2,994,978

- 86 -
*SGVFS004197*
Unrecognized Actuarial Gain
2013 2012 2011(In Thousands)
Net cumulative unrecognizedactuarial gain at beginning of year P=292,384 P=321,952 P=510,542
Actuarial gain (loss) on: –Defined benefit obligation – (366,834) (140,848)Plan assets – 333,746 56,398
Reclassifications from defined benefitliability – 67,968 24,722
Recognized actuarial (gain) loss – (13,888) 10,583Other adjustments (292,384) (50,560) (139,445)Net cumulative unrecognized
actuarial gain at end of year P=– P=292,384 P=321,952
The expected overall rate of return on assets is determined based on historical returns, applicableto the period over which obligation is to be settled. These are reflected in the principalassumptions below.
2013 2012Discount rate 4%–6% 4%–7%Expected rate of return on assets N/A 5%-8%Future salary increases 10% 10%–11%
The assets of the Retirement Plan are held by a trustee bank. The investing decisions of the Planare made by the Board of Trustees of the Retirement Plan. The following table presents thecarrying amounts and estimated fair values of the assets of the Retirement Plan:
2013 2012CarryingAmount Fair Value
CarryingAmount Fair Value
(In Thousands)
Cash and cash equivalents P=117,834 P=117,834 P=171,751 P=171,751Investment in debt and other
securities 714,898 714,898 450,728 450,728Investment in common trust funds 1,723,165 1,723,165 1,736,086 1,736,086Investment in equity securities 123,443 123,443 183,913 183,913Investment in government securities 1,865,037 1,865,037 1,692,804 1,692,804Others 39,972 39,972 34,904 34,904
P=4,584,349 P=4,584,349 P=4,270,186 P=4,270,186
The Retirement Plans’ assets and investments consist of the following:
§ Cash and cash equivalents includes regular savings and time deposits.
§ Investments in debt and other securities, consisting of both short-term and long-term corporateloans, notes and bonds, which bear interest ranging from 5.45% to 8.46% and have maturitiesfrom April 2014 to September 2022;
§ Investment in common trust funds consists of unit investment trust fund.

- 87 -
*SGVFS004197*
§ Investment in equity securities consists of listed and unlisted equity securities.
§ Investments in government securities, consisting of retail treasury bonds that bear interestranging from 5.00% to11.14% and have maturities from July 2013 to October 2037; and
§ Other financial assets held by the Retirement Plan are primarily accrued interest income oncash deposits and debt securities held by the Plan.
The following table summarizes the outstanding balances and transactions of the Retirement Planwith the reporting entity and BDO Unibank, Inc., a related party as at and for the year endedDecember 31, 2013 and December 31, 2012:
2013 2012(In Thousands)
Balances:Cash and cash equivalents P=110,392 P=171,151Investment in common trust funds 1,723,165 1,736,086
Transactions:Interest income from cash and cash equivalents 3,456 2,826Gains from Investment in common trust funds 54,711 456,634
The Group expects to contribute about P=341.9 million to its defined benefit pension plan in 2014.
The sensitivity analysis below has been determined based on reasonably possible changes of eachsignificant assumption on the defined benefit obligation as at December 31, 2013 assuming allother assumptions were held constant:
Increase(Decrease) in
Basis Points
Increase (Decrease) inDefined Benefit
Obligation(In Thousands)
Discount rates 100 (4,325)(100) 4,927
50 (275,558)(50) 306,110
Future salary increases 100 584,572(100) (489,141)
No attrition of rates – 3,070,593
The Group has no specific matching strategies between the retirement plan assets and the definedbenefit obligation.
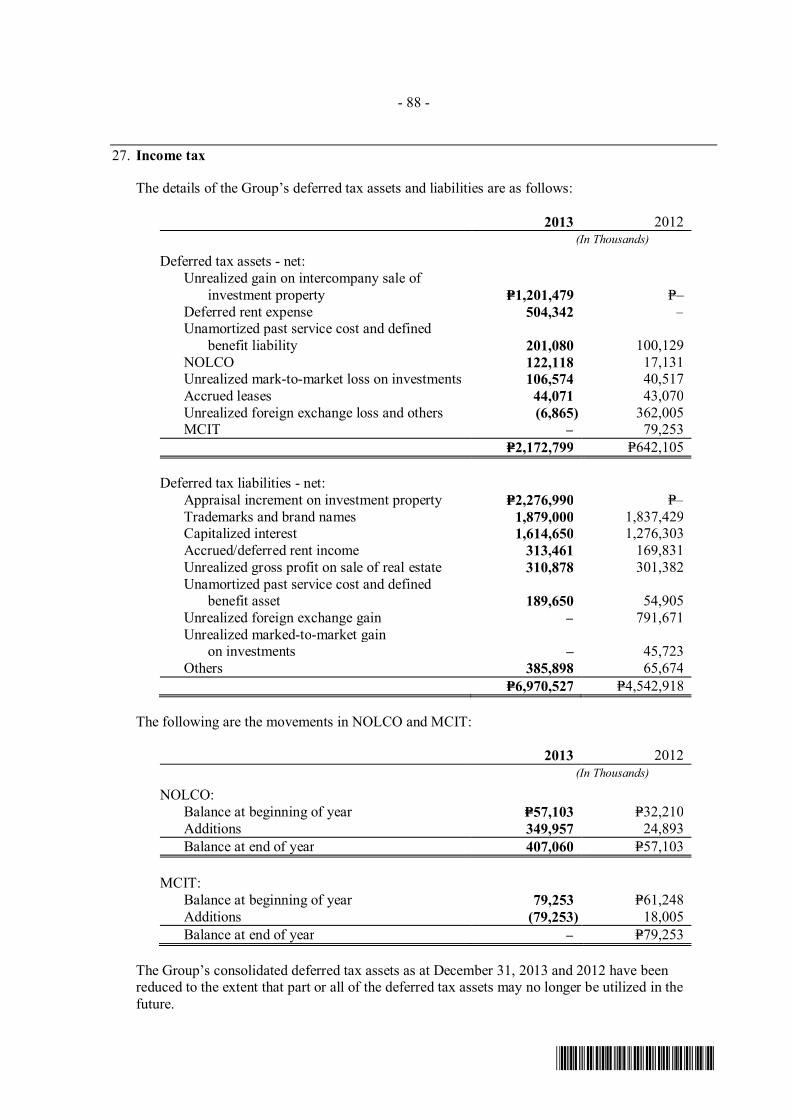
- 88 -
*SGVFS004197*
27. Income tax
The details of the Group’s deferred tax assets and liabilities are as follows:
2013 2012(In Thousands)
Deferred tax assets - net:Unrealized gain on intercompany sale of
investment property P=1,201,479 P=–Deferred rent expense 504,342 –Unamortized past service cost and defined
benefit liability 201,080 100,129NOLCO 122,118 17,131Unrealized mark-to-market loss on investments 106,574 40,517Accrued leases 44,071 43,070Unrealized foreign exchange loss and others (6,865) 362,005MCIT – 79,253
P=2,172,799 P=642,105
Deferred tax liabilities - net:Appraisal increment on investment property P=2,276,990 P=–Trademarks and brand names 1,879,000 1,837,429Capitalized interest 1,614,650 1,276,303Accrued/deferred rent income 313,461 169,831Unrealized gross profit on sale of real estate 310,878 301,382Unamortized past service cost and defined
benefit asset 189,650 54,905Unrealized foreign exchange gain – 791,671Unrealized marked-to-market gain
on investments – 45,723Others 385,898 65,674
P=6,970,527 P=4,542,918
The following are the movements in NOLCO and MCIT:
2013 2012(In Thousands)
NOLCO:Balance at beginning of year P=57,103 P=32,210Additions 349,957 24,893Balance at end of year 407,060 P=57,103
MCIT:Balance at beginning of year 79,253 P=61,248Additions (79,253) 18,005Balance at end of year – P=79,253
The Group’s consolidated deferred tax assets as at December 31, 2013 and 2012 have beenreduced to the extent that part or all of the deferred tax assets may no longer be utilized in thefuture.

- 89 -
*SGVFS004197*
The components of deductible temporary differences of certain balance sheet items and thecarryforward benefits of unused MCIT and NOLCO, which pertain to the Parent Company, forwhich no deferred tax assets have been recognized in the consolidated balance sheets, are asfollows:
2013 2012(In Thousands)
Allowance for impairment losses P=488,683 P=1,889,215Net unrealized foreign exchange loss 381,078 2,011,810Defined benefit liability 65,597 –Past service cost 54,917 36,672Non-refundable advance rentals 24,920 66,456NOLCO – 1,630,269Accretion on convertible bonds – 297,707MCIT – 122,669
P=1,015,195 P=6,054,798
NOLCO and MCIT amounting to P=1,752.9 million as at December 31, 2012 was applied in 2013.
The reconciliation between the statutory tax rates and the Group’s effective tax rates on incomebefore income tax is as follows:
2013 2012 2011Statutory income tax rate 30% 30% 30%Add (deduct) income tax effects
of reconciling items:Equity in net earnings of associates (9) (7) (5)Dividend income exempt from tax (1) (1) (1)Interest income subjected to final tax (2) (3) (3)Gain on sale of shares of stock – – (3)Others (2) (3) (2)
Change in unrecognized deferred tax assets (4) – (1)Effective income tax rates 12% 16% 15%
28. Lease Agreements
Parent CompanyThe Parent Company’s lease agreements with its tenants are generally granted for a term of one totwenty-five years. Tenants likewise pay a fixed monthly rent which is calculated by reference to afixed sum per square meter of area leased except for a few tenants, which pay either a fixedmonthly rent or a percentage of gross sales, whichever is higher.
Upon inception of the lease agreement, tenants are required to pay certain amounts of deposits.Tenants’ deposits amounted to P=10,527.6 million and P=11,691.8 million as at December 31, 2013and 2012, respectively.

- 90 -
*SGVFS004197*
The minimum lease receivables under the noncancellable operating leases of the Parent Companyas at December 31 are as follows:
2013 2012(In Thousands)
Within one year P=791,487 P=738,122After one year but not more than five years 2,902,785 2,230,084After five years 1,792,043 5,512,218Balance at end of year P=5,486,315 P=8,480,424
SM Prime
As Lessor. The lease agreements of SM Prime and its subsidiaries with their tenants are generallygranted for a term of one year, with the exception of some of the larger tenants operatingnationally, which are granted initial lease terms of five years, renewable on an annual basisthereafter. Upon inception of the lease agreement, tenants are required to pay certain amounts ofdeposits. Tenants likewise pay either a fixed monthly rent, which is calculated by reference to afixed sum per square meter of area leased, or pay rent on a percentage rental basis, whichcomprises of a basic monthly amount and a percentage of gross sales or a minimum set amount,whichever is higher.
Also, SM Prime and its subsidiaries’ lease agreements with its commercial property tenants aregenerally granted for a term of one year, with the exception of some tenants, which are grantedinitial lease terms of 2 to 20 years, renewable on an annual basis thereafter. Upon inception of thelease agreement, tenants are required to pay certain amounts of deposits. Tenants pay either afixed monthly rent or a percentage of sales, depending on the terms of the lease agreements,whichever is higher.
SM Prime’s future minimum rent receivables for the noncancellable portions of the operatingcommercial property leases follow:
2013 2012(In Millions)
Within one year P=1,277 P=1,244After one year but not more than five years 4,427 5,071After more than five years 1,367 1,626
P=7,071 P=7,941
As Lessee. SM Prime and its subsidiaries also lease certain parcels of land where some of theirmalls are situated or constructed. The terms of the lease are for periods ranging from 15 to 50years, renewable for the same period under the same terms and conditions. Rental payments aregenerally computed based on a certain percentage of the gross rental income or a certain fixedamount, whichever is higher.
Also, SM Prime and its subsidiaries have various operating lease commitments with third partyand related parties. The noncancellable periods of the lease range from 2 to 30 years, mostlycontaining renewal options. Several lease contracts provide for the payment of additional rentalbased on certain percentage of sales of the tenants.

- 91 -
*SGVFS004197*
The minimum lease payables under the noncancellable operating leases of SM Prime as atDecember 31 are as follows:
2013 2012(In Millions)
Within one year P=735 P=428After one year but not more than five years 3,261 1,810After five years 27,330 21,042Balance at end of year P=31,326 P=23,280
29. Financial Risk Management Objectives and Policies
The Group’s principal financial instruments, other than derivatives, comprise of bank loans,long-term debt, AFS investments, investments held for trading, time deposits and short-terminvestments and cash and cash equivalents. The main purpose of these financial instruments is tofinance the Group’s operations. The Group has other financial assets and liabilities such asreceivables and accounts payable and other current liabilities, which arise directly from itsoperations.
The Group also enters into derivative transactions, principally, cross currency swaps, interest rateswaps, foreign currency call options, non-deliverable forwards and foreign currency range options.The purpose is to manage the interest rate and foreign currency risks arising from the Group’soperations and its sources of finance.
The main risks arising from the Group’s financial instruments are interest rate risk, foreigncurrency risk, liquidity risk, credit risk and equity price risk. The BOD reviews and agreespolicies for managing each of these risks and they are summarized in the following tables. TheGroup’s accounting policies in relation to derivatives are set out in Note 3.

- 92 -
*SGVFS004197*
Interest Rate RiskThe following tables set out the carrying amount, by maturity, of the Group’s long-term financial liabilities that are exposed to interest rate risk as atDecember 31, 2013 and 2012:
2013
Below 1 Year 1–2 Years 2–3 Years 3–5 Years Over 5 Years TotalDebt Issue
Cost/Discount Carrying Amount(In Thousands)
Fixed RateForeign Currency Loans: US$400 million fixed rate bonds $– $– $383,463 $– $– P=17,023,867 (P=112,588) P=16,911,280 Interest rate – – 5.50% – – US$500 million fixed rate bonds 379,156 – – – – 16,832,631 (42,037) 16,790,593 Interest rate 6.00% – – – – US$250 million convertible bonds – – – 84,084 – 3,732,919 (60,787) 3,672,132 Interest rate – – – 1.63% – US$500 million Senior bonds – – – – 500,000 22,197,500 (210,645) 21,986,855 Interest rate – – – – 4.25%Peso Loans: Three-year, five-year, seven-year and
ten-year fixed rate notes P=– P=– P=2,000,000 P=18,757,800 P=11,605,600 32,363,400 (175,781) 32,187,619 Interest rate – – 4.72% 4.00%-6.81% 5.90%-10.11% Five-year and seven-year retail bonds 8,400,000 – 1,000,000 – – 9,400,000 (13,795) 9,386,205 Interest rate 8.25% – 9.10% – – Seven-year and ten-year retail bonds – – – – 13,082,270 13,082,270 (89,961) 12,992,309 Interest rate – – – – 6.00%-6.94% Ten-year corporate notes – – – – 1,100,000 1,100,000 (6,906) 1,093,094 Interest rate – – – – 10.11% Other bank loans 1,379,500 1,538,100 315,000 – 7,350,000 10,582,600 (26,880) 10,555,720 Interest rate 5.00%-5.68% 5.00%-9.75% 4.50% – 4.03%-5.88%Variable RateForeign Currency Loans: US$ five-year term loans – – $570,000 – – 25,305,150 (426,877) 24,878,273 Interest rate – – LIBOR+margin% – – China Yuan renminbi loans ¥386,761 ¥62,782 – – – 3,197,597 – 3,197,597
(Forward)
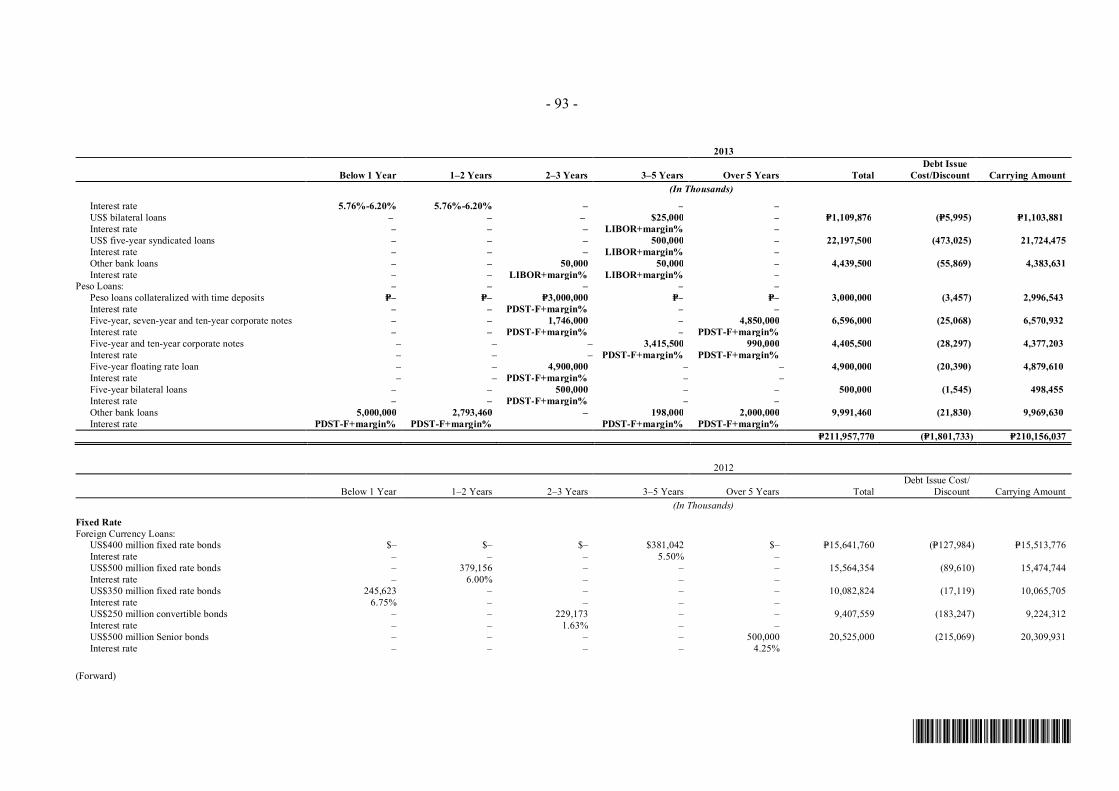
- 93 -
*SGVFS004197*
2013
Below 1 Year 1–2 Years 2–3 Years 3–5 Years Over 5 Years TotalDebt Issue
Cost/Discount Carrying Amount(In Thousands)
Interest rate 5.76%-6.20% 5.76%-6.20% – – – US$ bilateral loans – – – $25,000 – P=1,109,876 (P=5,995) P=1,103,881 Interest rate – – – LIBOR+margin% – US$ five-year syndicated loans – – – 500,000 – 22,197,500 (473,025) 21,724,475 Interest rate – – – LIBOR+margin% – Other bank loans – – 50,000 50,000 – 4,439,500 (55,869) 4,383,631 Interest rate – – LIBOR+margin% LIBOR+margin% –Peso Loans: – – – – – Peso loans collateralized with time deposits P=– P=– P=3,000,000 P=– P=– 3,000,000 (3,457) 2,996,543 Interest rate – – PDST-F+margin% – – Five-year, seven-year and ten-year corporate notes – – 1,746,000 – 4,850,000 6,596,000 (25,068) 6,570,932 Interest rate – – PDST-F+margin% – PDST-F+margin% Five-year and ten-year corporate notes – – – 3,415,500 990,000 4,405,500 (28,297) 4,377,203 Interest rate – – – PDST-F+margin% PDST-F+margin% Five-year floating rate loan – – 4,900,000 – – 4,900,000 (20,390) 4,879,610 Interest rate – – PDST-F+margin% – – Five-year bilateral loans – – 500,000 – – 500,000 (1,545) 498,455 Interest rate – – PDST-F+margin% – – Other bank loans 5,000,000 2,793,460 – 198,000 2,000,000 9,991,460 (21,830) 9,969,630 Interest rate PDST-F+margin% PDST-F+margin% PDST-F+margin% PDST-F+margin%
P=211,957,770 (P=1,801,733) P=210,156,037
2012
Below 1 Year 1–2 Years 2–3 Years 3–5 Years Over 5 Years TotalDebt Issue Cost/
Discount Carrying Amount(In Thousands)
Fixed RateForeign Currency Loans: US$400 million fixed rate bonds $– $– $– $381,042 $– P=15,641,760 (P=127,984) P=15,513,776 Interest rate – – – 5.50% – US$500 million fixed rate bonds – 379,156 – – – 15,564,354 (89,610) 15,474,744 Interest rate – 6.00% – – – US$350 million fixed rate bonds 245,623 – – – – 10,082,824 (17,119) 10,065,705 Interest rate 6.75% – – – – US$250 million convertible bonds – – 229,173 – – 9,407,559 (183,247) 9,224,312 Interest rate – – 1.63% – – US$500 million Senior bonds – – – – 500,000 20,525,000 (215,069) 20,309,931 Interest rate – – – – 4.25%
(Forward)

- 94 -
*SGVFS004197*
2012
Below 1 Year 1–2 Years 2–3 Years 3–5 Years Over 5 Years TotalDebt Issue Cost/
Discount Carrying Amount(In Thousands)
Peso Loans: Three-year, five-year, seven-year and
ten-year fixed rate notes P=2,078,500 P=78,500 P=10,078,500 P=8,077,400 P=6,650,100 26,963,000 (144,816) 26,818,184 Interest rate 5.86%-6.81% 5.86%-6.81% 5.86%-7.73% 5.86%-6.81% 5.86%-9.85% Five-year and seven-year retail bonds – 8,400,000 – 1,000,000 – 9,400,000 (32,108) 9,367,892 Interest rate – 8.25% – 9.10% – Seven-year and Ten-year retail bonds – – – – 14,282,270 14,282,270 (118,549) 14,163,721 Interest rate – – – – 6.00%-6.94% Five-year fixed rate notes 1,000 1,000 1,000 6,696,043 – 6,699,043 (36,984) 6,662,059 Interest rate 6.17% 6.17% 6.17%– 6.17% – Five-year and ten-year corporate notes – – – – 1,100,000 1,100,000 (7,849) 1,092,151 Interest rate – – – 10.11% Seven-year and ten-year corporate notes 5,000 5,000 5,000 10,000 4,970,000 4,995,000 (37,757) 4,957,243 Interest rate 5.75%-6.63% 5.75%-6.63% 5.75%-6.63% 5.75%-6.63% 5.75%-6.63% Five-year, seven-year and ten-year corporate notes 20,000 20,000 1,097,300 66,145 756,555 1,960,000 (10,332) 1,949,668 Interest rate 5.79%-6.65% 5.79%-6.65% 5.79%-6.65% 5.89%-6.65% 6.65% Other bank loans 8,750 1,380,500 1,339,300 1,200,000 2,050,000 5,978,550 (13,070) 5,965,480 Interest rate 6.75% 5.69%-6.75% 3.6%-7.28% 9.75% 6.71%-8.79%Variable RateForeign Currency Loans: US$ five-year term loans $– $– $– $280,000 $– 11,494,000 (195,854) 11,298,146 Interest rate – – – LIBOR+margin % – China Yuan renminbi loans 77,476 375,168 60,900 – – 3,383,486 – 3,383,486 Interest rate 5.76%-6.20% 5.76%-6.20% 5.76% – US$ bilateral loans $25,000 $– $– $– $– P=1,026,250 (P=5,008) P=1,021,242 Interest rate LIBOR+margin % – $– – – Other bank loans $– $– $50,000 $– $– 2,052,500 (15,572) 2,036,928 Interest rate – – LIBOR+margin % – –Peso Loans: Peso loans collateralized with time deposits – – 3,000,000 – – 3,000,000 (6,635) 2,993,365 Interest rate – – PDST-F+margin% – – Five-year, seven-year and ten-year corporate notes 30,000 30,000 2,880,000 – – 2,940,000 (25,829) 2,914,171 Interest rate PDST-F+margin% – PDST-F+margin% – – Five-year floating rate loan 96,500 96,500 96,500 8,360,500 950,000 9,600,000 (64,382) 9,535,618 Interest rate PDST-F+margin% PDST-F+margin% PDST-F+margin% PDST-F+margin% PDST-F+margin% Five-year bilateral loans – – – 500,000 – 500,000 (2,009) 497,991 Interest rate – – – PDST-F+margin% – Other bank loans 30,000 5,180,000 4,955,000 3,000,000 – 13,165,000 (18,384) 13,146,616 Interest rate PDST-F+margin% PDST-F+margin% PDST-F+margin% PDST-F+margin% –
P=189,760,596 (P=1,368,167) P=188,392,429

- 95 -
*SGVFS004197*
Fixed rate financial instruments are subject to fair value interest rate risk while floating ratefinancial instruments are subject to cash flow interest rate risk.
Repricing of floating rate financial instruments is mostly done at intervals of three months or sixmonths.
The Group’s policy is to manage its interest cost using a mix of fixed and variable rate debts. TheGroup’s guideline is to keep between 50% to 60% of its borrowings at fixed interest rates. Tomanage this mix in a cost-efficient manner, the Group enters into interest rate swaps andcross-currency swaps, in which the Group agrees to exchange, at specified intervals, the differencebetween fixed and variable rate interest amounts calculated by reference to an agreed notionalamount. The interest rate swaps economically hedge the underlying debt obligations. The cross-currency swaps were designated by the Group under cash flow hedge accounting (see Note 30).As at December 31, 2013 and 2012, after taking into account the effect of the swaps,approximately 63% of the Group’s borrowings are kept at a fixed rate of interest, consideringmarket conditions.
Interest Rate Risk Sensitivity Analysis. The following table demonstrates the sensitivity to areasonably possible change in interest rates, with all other variables held constant of the Group’sincome before income tax and equity after income tax, through the impact of floating ratefinancial liabilities and debt securities classified as at FVPL and AFS investments, respectively.
Increase(Decrease)
in Basis Points
Effecton Income
Before Tax
Effect onEquity AfterIncome Tax
(In Millions)
2013 100 (P=836.4) (P=129.8)50 (418.2) (65.3)
(100) 836.4 135.9(50) 418.2 67.5
2012 100 (437.2) (133.5)50 (218.6) (58.9)
(100) 437.2 174.8(50) 218.6 95.2
Fixed rate debts, although subject to fair value interest rate risk, are not included in the sensitivityanalysis as these are carried at amortized costs. The assumed movement in basis points forinterest rate sensitivity analysis is based on currently observable market environment, showing asignificantly higher volatility as in prior years.
Foreign Currency RiskThe Group’s exposure to foreign currency risk arises as the Parent Company and SM Prime havesignificant investments and debt issuances which are denominated in U.S. dollars. To manage itsforeign exchange risk, stabilize cash flows and improve investment and cash flow planning, theGroup enters into foreign currency swap contracts, foreign cross-currency swaps, foreign currencycall options, non-deliverable forwards and foreign currency range options (see Note 30) with theaim of reducing and/or managing the adverse impact of changes in foreign exchange rates onfinancial performance and cash flows.

- 96 -
*SGVFS004197*
The following tables show the Group’s foreign currency-denominated financial assets andliabilities and their peso equivalents as at December 31, 2013 and 2012:
2013US$ PhP=
(In Thousands)
Current assets:Cash and cash equivalents $5,999 P=266,316Time deposits and short-term investments 705,501 31,320,708AFS investments 5,250 233,074Receivables 448,365 19,905,182
Noncurrent assets:AFS investments 124,785 5,539,822Time deposits 585,000 25,971,075Derivative assets 39,059 1,734,034
Total foreign currency-denominated financial assets 1,913,959 84,970,211Current liabilities:
Bank loans 50,000 2,219,750Accounts payable and other current liabilities 34,985 1,553,191
Noncurrent liabilities:Long-term debt - net of current portion 2,183,908 96,954,602Derivative liabilities 3,603 159,974
Total foreign currency-denominated financial liabilities 2,272,496 100,887,517Net foreign currency-denominated financial liabilities $358,537 P=15,917,306
2012US$ PhP=
(In Thousands)
Current assets:Cash and cash equivalents $20,355 P=835,593Time deposits and short-term investments 111,941 4,595,167AFS investments 17,875 733,752Receivables 334,142 13,716,529
Noncurrent assets:AFS investments 146,028 5,994,458Time deposits 1,095,480 44,969,454Derivative assets 2,679 109,973Other noncurrent assets 24,151 991,431
Total foreign currency-denominated financial assets 1,752,651 71,946,357Current liabilities:
Bank loans 50,000 2,052,500Accounts payable and other current liabilities 92,297 3,788,792Current portion of long-term debt 245,623 10,082,824
Noncurrent liabilities:Long-term debt - net of current portion 1,762,239 72,339,915Derivative liabilities 5,952 244,330
Total foreign currency-denominated financial liabilities 2,156,111 88,508,361Net foreign currency-denominated financial liabilities $403,460 P=16,562,004
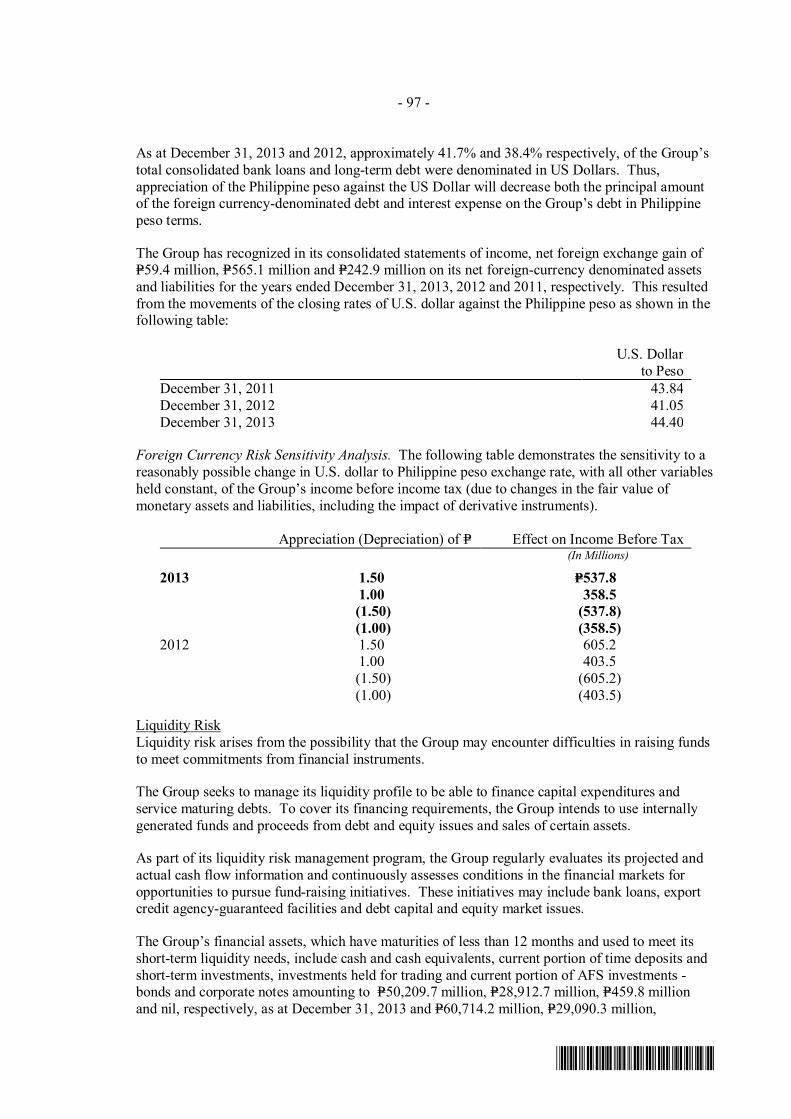
- 97 -
*SGVFS004197*
As at December 31, 2013 and 2012, approximately 41.7% and 38.4% respectively, of the Group’stotal consolidated bank loans and long-term debt were denominated in US Dollars. Thus,appreciation of the Philippine peso against the US Dollar will decrease both the principal amountof the foreign currency-denominated debt and interest expense on the Group’s debt in Philippinepeso terms.
The Group has recognized in its consolidated statements of income, net foreign exchange gain ofP=59.4 million, P=565.1 million and P=242.9 million on its net foreign-currency denominated assetsand liabilities for the years ended December 31, 2013, 2012 and 2011, respectively. This resultedfrom the movements of the closing rates of U.S. dollar against the Philippine peso as shown in thefollowing table:
U.S. Dollarto Peso
December 31, 2011 43.84December 31, 2012 41.05December 31, 2013 44.40
Foreign Currency Risk Sensitivity Analysis. The following table demonstrates the sensitivity to areasonably possible change in U.S. dollar to Philippine peso exchange rate, with all other variablesheld constant, of the Group’s income before income tax (due to changes in the fair value ofmonetary assets and liabilities, including the impact of derivative instruments).
Appreciation (Depreciation) of P= Effect on Income Before Tax(In Millions)
2013 1.50 P=537.81.00 358.5(1.50) (537.8)(1.00) (358.5)
2012 1.50 605.21.00 403.5(1.50) (605.2)(1.00) (403.5)
Liquidity RiskLiquidity risk arises from the possibility that the Group may encounter difficulties in raising fundsto meet commitments from financial instruments.
The Group seeks to manage its liquidity profile to be able to finance capital expenditures andservice maturing debts. To cover its financing requirements, the Group intends to use internallygenerated funds and proceeds from debt and equity issues and sales of certain assets.
As part of its liquidity risk management program, the Group regularly evaluates its projected andactual cash flow information and continuously assesses conditions in the financial markets foropportunities to pursue fund-raising initiatives. These initiatives may include bank loans, exportcredit agency-guaranteed facilities and debt capital and equity market issues.
The Group’s financial assets, which have maturities of less than 12 months and used to meet itsshort-term liquidity needs, include cash and cash equivalents, current portion of time deposits andshort-term investments, investments held for trading and current portion of AFS investments -bonds and corporate notes amounting to P=50,209.7 million, P=28,912.7 million, P=459.8 millionand nil, respectively, as at December 31, 2013 and P=60,714.2 million, P=29,090.3 million,
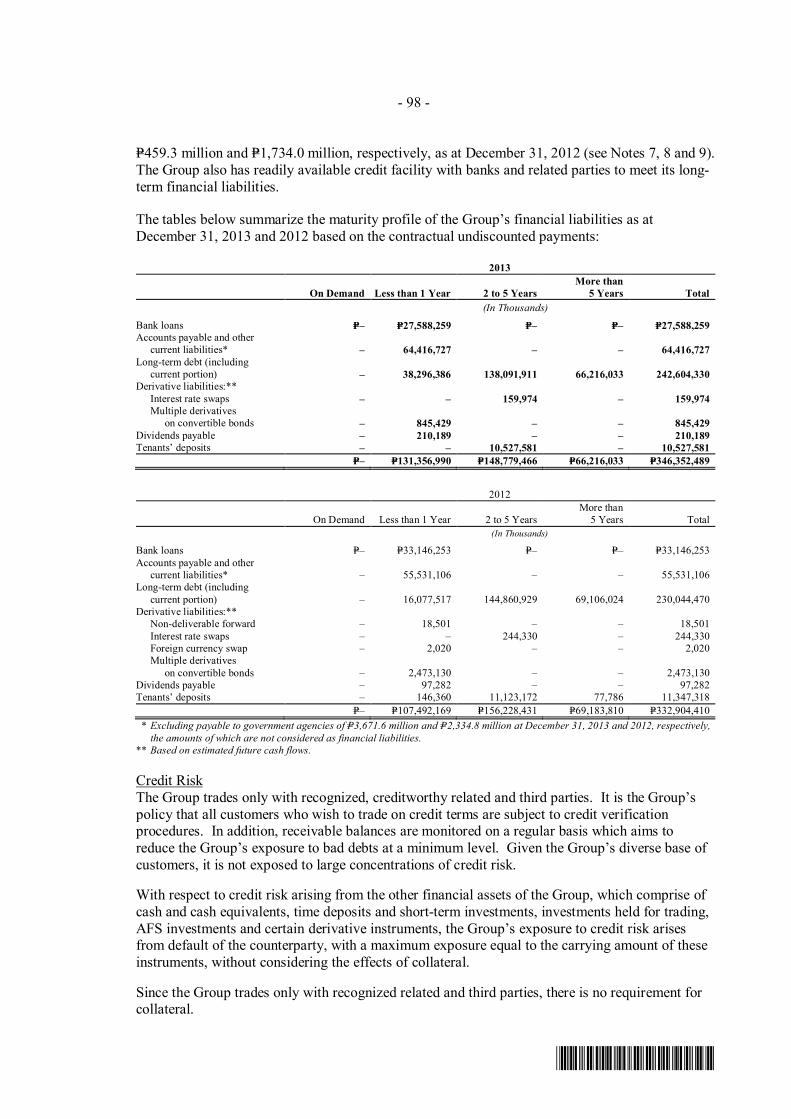
- 98 -
*SGVFS004197*
P=459.3 million and P=1,734.0 million, respectively, as at December 31, 2012 (see Notes 7, 8 and 9).The Group also has readily available credit facility with banks and related parties to meet its long-term financial liabilities.
The tables below summarize the maturity profile of the Group’s financial liabilities as atDecember 31, 2013 and 2012 based on the contractual undiscounted payments:
2013
On Demand Less than 1 Year 2 to 5 YearsMore than
5 Years Total(In Thousands)
Bank loans P=– P=27,588,259 P=– P=– P=27,588,259Accounts payable and other
current liabilities* – 64,416,727 – – 64,416,727Long-term debt (including
current portion) – 38,296,386 138,091,911 66,216,033 242,604,330Derivative liabilities:** Interest rate swaps – – 159,974 – 159,974 Multiple derivatives
on convertible bonds – 845,429 – – 845,429Dividends payable – 210,189 – – 210,189Tenants’ deposits – – 10,527,581 – 10,527,581
P=– P=131,356,990 P=148,779,466 P=66,216,033 P=346,352,489
2012
On Demand Less than 1 Year 2 to 5 YearsMore than
5 Years Total(In Thousands)
Bank loans P=– P=33,146,253 P=– P=– P=33,146,253Accounts payable and other
current liabilities* – 55,531,106 – – 55,531,106Long-term debt (including
current portion) – 16,077,517 144,860,929 69,106,024 230,044,470Derivative liabilities:** Non-deliverable forward – 18,501 – – 18,501 Interest rate swaps – – 244,330 – 244,330 Foreign currency swap – 2,020 – – 2,020 Multiple derivatives
on convertible bonds – 2,473,130 – – 2,473,130Dividends payable – 97,282 – – 97,282Tenants’ deposits – 146,360 11,123,172 77,786 11,347,318
P=– P=107,492,169 P=156,228,431 P=69,183,810 P=332,904,410** Excluding payable to government agencies of P=3,671.6 million and P=2,334.8 million at December 31, 2013 and 2012, respectively,
the amounts of which are not considered as financial liabilities.** Based on estimated future cash flows.
Credit RiskThe Group trades only with recognized, creditworthy related and third parties. It is the Group’spolicy that all customers who wish to trade on credit terms are subject to credit verificationprocedures. In addition, receivable balances are monitored on a regular basis which aims toreduce the Group’s exposure to bad debts at a minimum level. Given the Group’s diverse base ofcustomers, it is not exposed to large concentrations of credit risk.
With respect to credit risk arising from the other financial assets of the Group, which comprise ofcash and cash equivalents, time deposits and short-term investments, investments held for trading,AFS investments and certain derivative instruments, the Group’s exposure to credit risk arisesfrom default of the counterparty, with a maximum exposure equal to the carrying amount of theseinstruments, without considering the effects of collateral.
Since the Group trades only with recognized related and third parties, there is no requirement forcollateral.
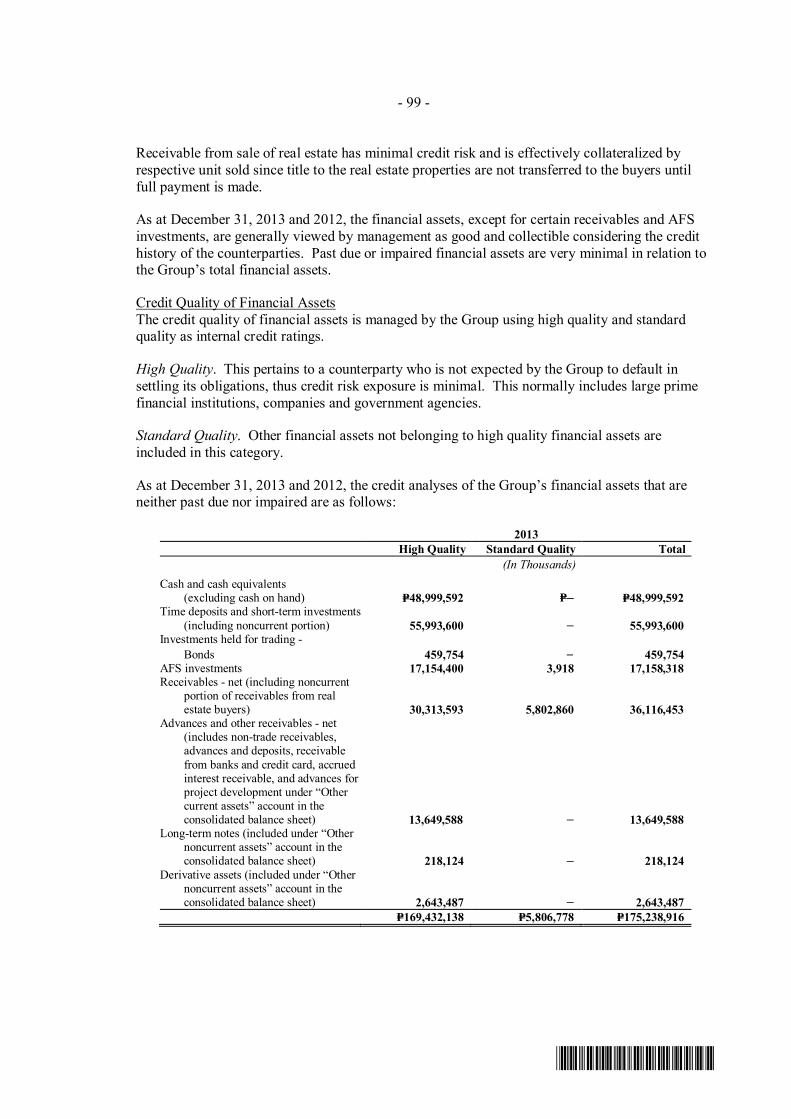
- 99 -
*SGVFS004197*
Receivable from sale of real estate has minimal credit risk and is effectively collateralized byrespective unit sold since title to the real estate properties are not transferred to the buyers untilfull payment is made.
As at December 31, 2013 and 2012, the financial assets, except for certain receivables and AFSinvestments, are generally viewed by management as good and collectible considering the credithistory of the counterparties. Past due or impaired financial assets are very minimal in relation tothe Group’s total financial assets.
Credit Quality of Financial AssetsThe credit quality of financial assets is managed by the Group using high quality and standardquality as internal credit ratings.
High Quality. This pertains to a counterparty who is not expected by the Group to default insettling its obligations, thus credit risk exposure is minimal. This normally includes large primefinancial institutions, companies and government agencies.
Standard Quality. Other financial assets not belonging to high quality financial assets areincluded in this category.
As at December 31, 2013 and 2012, the credit analyses of the Group’s financial assets that areneither past due nor impaired are as follows:
2013High Quality Standard Quality Total
(In Thousands)Cash and cash equivalents
(excluding cash on hand) P=48,999,592 P=– P=48,999,592Time deposits and short-term investments
(including noncurrent portion) 55,993,600 – 55,993,600Investments held for trading - Bonds 459,754 – 459,754AFS investments 17,154,400 3,918 17,158,318Receivables - net (including noncurrent
portion of receivables from realestate buyers) 30,313,593 5,802,860 36,116,453
Advances and other receivables - net(includes non-trade receivables,advances and deposits, receivablefrom banks and credit card, accruedinterest receivable, and advances forproject development under “Othercurrent assets” account in theconsolidated balance sheet) 13,649,588 – 13,649,588
Long-term notes (included under “Othernoncurrent assets” account in theconsolidated balance sheet) 218,124 – 218,124
Derivative assets (included under “Othernoncurrent assets” account in theconsolidated balance sheet) 2,643,487 – 2,643,487
P=169,432,138 P=5,806,778 P=175,238,916
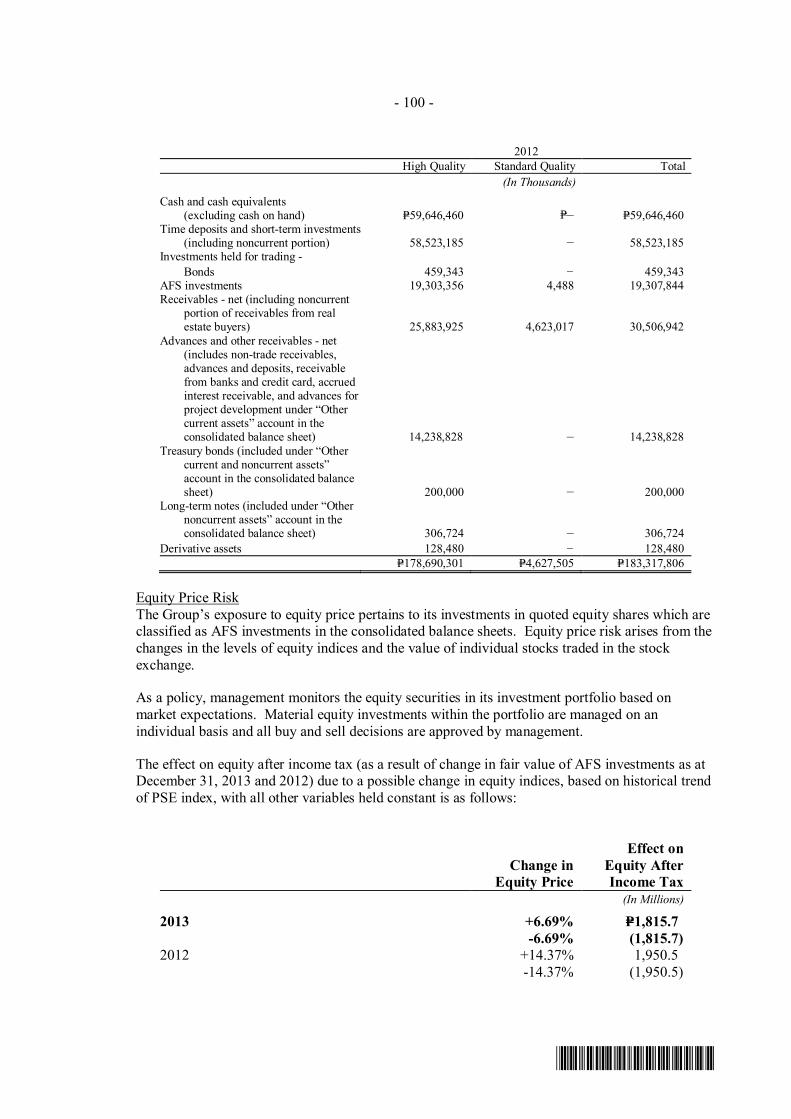
- 100 -
*SGVFS004197*
2012High Quality Standard Quality Total
(In Thousands)Cash and cash equivalents
(excluding cash on hand) P=59,646,460 P=– P=59,646,460Time deposits and short-term investments
(including noncurrent portion) 58,523,185 – 58,523,185Investments held for trading - Bonds 459,343 – 459,343AFS investments 19,303,356 4,488 19,307,844Receivables - net (including noncurrent
portion of receivables from realestate buyers) 25,883,925 4,623,017 30,506,942
Advances and other receivables - net(includes non-trade receivables,advances and deposits, receivablefrom banks and credit card, accruedinterest receivable, and advances forproject development under “Othercurrent assets” account in theconsolidated balance sheet) 14,238,828 – 14,238,828
Treasury bonds (included under “Othercurrent and noncurrent assets”account in the consolidated balancesheet) 200,000 – 200,000
Long-term notes (included under “Othernoncurrent assets” account in theconsolidated balance sheet) 306,724 – 306,724
Derivative assets 128,480 – 128,480P=178,690,301 P=4,627,505 P=183,317,806
Equity Price RiskThe Group’s exposure to equity price pertains to its investments in quoted equity shares which areclassified as AFS investments in the consolidated balance sheets. Equity price risk arises from thechanges in the levels of equity indices and the value of individual stocks traded in the stockexchange.
As a policy, management monitors the equity securities in its investment portfolio based onmarket expectations. Material equity investments within the portfolio are managed on anindividual basis and all buy and sell decisions are approved by management.
The effect on equity after income tax (as a result of change in fair value of AFS investments as atDecember 31, 2013 and 2012) due to a possible change in equity indices, based on historical trendof PSE index, with all other variables held constant is as follows:
Change inEquity Price
Effect onEquity AfterIncome Tax
(In Millions)
2013 +6.69% P=1,815.7-6.69% (1,815.7)
2012 +14.37% 1,950.5-14.37% (1,950.5)

- 101 -
*SGVFS004197*
Capital ManagementCapital includes equity attributable to the owners of the Parent.
The primary objective of the Group’s capital management is to ensure that it maintains a strongcredit rating and healthy capital ratios in order to support its business and maximize shareholdervalue.
The Group manages its capital structure and makes adjustments to it, in the light of changes ineconomic conditions. To maintain or adjust the capital structure, the Group may adjust thedividend payment to shareholders, pay-off existing debts, return capital to shareholders or issuenew shares.
The Group monitors its capital gearing by measuring the ratio of net interest-bearing debt dividedby total capital plus net interest-bearing debt and interest-bearing debt divided by total capital plusinterest-bearing debt. Net interest-bearing debt includes all short-term and long-term debt,reduced by related pledged time deposits, net of cash and cash equivalents, time deposits andshort-term investments, investments in bonds held for trading, AFS investments (redeemablepreferred shares and bonds and corporate notes) and long-term notes included under “Othernoncurrent assets” account, while interest-bearing debt includes all short-term and long-term debt,reduced by related pledged time deposits. The Group’s guideline is to keep the gearing ratio at notlower than 50:50.
As at December 31, 2013 and 2012, the Group’s ratio of net interest-bearing debt to total capitalplus net interest-bearing debt and ratio of interest-bearing debt to total capital plus interest-bearingdebt were as follows:
Net Interest-bearing Debt to Total Capital plus Net Interest-bearing Debt
2013 2012(In Thousands)
Bank loans P=27,588,259 P=31,793,975Long-term debt 210,156,037 188,392,429Less:
Cash and cash equivalents(excluding cash on hand) (48,999,592) (59,646,460)
Time deposits and short-term investments (55,993,600) (58,523,185)AFS investments (bonds and corporate notes) (5,539,822) (7,728,240)Long-term notes included under
“Other noncurrent assets” account (218,124) (306,724)Total net interest-bearing debt (a) 126,993,158 93,981,795Total equity attributable to owners of the Parent 219,433,817 188,074,132Total net interest-bearing debt and equity
attributable to owners of the Parent (b) 346,426,975 P=282,055,927
Gearing ratio (a/b) 37% 33%

- 102 -
*SGVFS004197*
Interest-bearing Debt to Total Capital plus Interest-bearing Debt
2013 2012(In Thousands)
Bank loans P=27,588,259 P=31,793,975Long-term debt 210,156,037 188,392,429Total interest-bearing debt (a) 237,744,296 220,186,404Total equity attributable to owners of the Parent 219,433,817 188,074,132Total interest-bearing debt and equity attributable to
owners of the Parent (b) P=457,178,113 P=408,260,536
Gearing ratio (a/b) 52% 54%
30. Financial Instruments
Fair ValuesThe following table sets forth the carrying values and estimated fair values of financial assets andliabilities, by category and by class, recognized as at December 31, 2013 and 2012:
2013
CarryingValue Total
Quoted Pricesin ActiveMarkets(Level 1)
SignificantObservable
Inputs(Level 2)
SignificantUnobservable
Inputs(Level 3)
(In Thousands)
Assets Measured at Fair ValueFinancial assets at FVPL: Investments held for trading - Bonds P=459,754 P=459,754 P=459,754 P=– P=– Derivative assets 2,643,487 2,643,487 – 2,643,487 –
3,103,241 3,103,241 459,754 2,643,487 –AFS investments: Shares of stock 11,607,236 11,539,018 11,539,018 – – Bonds and corporate notes 5,539,822 5,539,822 5,539,822 – – Club shares 11,260 11,260 11,260 – –
17,158,318 17,090,100 17,090,100 – –20,261,559 20,193,341 17,549,854 2,643,487 –
Assets for which Fair Values are DisclosedLoans and receivables: Cash and cash equivalents 50,209,657 50,209,657 – – 50,209,657 Time deposits and short-term investments
(including noncurrent portion) 55,993,600 58,549,481 – – 58,549,481 Receivables - net (including noncurrent portion
of receivables from real estate buyers) 37,274,237 37,274,237 – – 37,274,237 Advances and other receivables - net (included
under “Other current assets” account in theconsolidated balance sheets) 13,649,588 13,649,588 – – 13,649,588
Long-term notes (included under “Othernoncurrent assets” account in theconsolidated balance sheets) 218,124 264,656 – – 264,656
157,345,206 159,947,619 – – 159,947,619P=177,606,765 P=180,140,960 P=17,549,854 P=2,643,487 P=159,947,619

- 103 -
*SGVFS004197*
2013
CarryingValue Total
Quoted Pricesin ActiveMarkets(Level 1)
SignificantObservable
Inputs(Level 2)
SignificantUnobservable
Inputs(Level 3)
(In Thousands)
Liabilities Measured at Fair ValueFinancial Liabilities at FVPL: Derivative liabilities P=1,005,403 P=1,005,403 P=– P=159,974 P=845,429Liabilities for which Fair Values are DisclosedOther Financial Liabilities: Bank loans 27,588,259 27,588,259 27,588,259 – – Accounts payable and other current liabilities* 64,416,727 64,416,727 – – 64,416,727 Long-term debt (including current portion and
net of unamortized debt issue cost) 210,156,037 224,775,629 – – 224,775,629 Dividends payable 210,189 210,189 – – 210,189 Tenants’ deposits and others 17,967,224 13,047,622 – 13,047,622
320,338,436 330,038,426 27,588,259 – 302,450,167P=321,343,839 P=331,043,829 P=27,588,259 P=159,974 P=303,295,596
*Excluding payable to government agencies of P=3,671.6 million at December 31, 2013, the amounts of which are not considered asfinancial liabilities.
2012
CarryingValue Total
Quoted Pricesin ActiveMarkets(Level 1)
SignificantObservable
Inputs(Level 2)
SignificantUnobservable
Inputs(Level 3)
(In Thousands)
Assets Measured at Fair ValueFinancial assets at FVPL: Investments held for trading - Bonds P=459,343 P=459,343 P=459,343 P=– P=– Derivative assets 128,480 128,480 – 128,480 –
587,823 587,823 459,343 128,480 –AFS investments: Shares of stock 11,618,836 11,516,716 11,516,716 – – Bonds and corporate notes 7,728,240 7,728,240 7,728,240 – – Club shares 5,900 5,900 5,900 – –
19,352,976 19,250,856 19,250,856 – –19,940,799 19,838,679 19,710,199 128,480 –
Assets for which Fair Values are DisclosedLoans and receivables: Cash and cash equivalents 60,714,720 60,714,720 – – 60,714,720 Time deposits and short-term investments
(including noncurrent portion) 58,523,185 62,048,610 – – 62,048,610 Receivables - net (including noncurrent portion
of receivables from real estate buyers) 30,767,065 29,466,700 – – 29,466,700 Advances and other receivables - net (included
under “Other current assets” account in theconsolidated balance sheets) 11,316,886 11,316,886 – – 11,316,886
Long-term notes (included under “Othernoncurrent assets” account in theconsolidated balance sheets) 306,724 331,519 – – 331,519
161,628,580 163,878,435 – – 163,878,435P=181,569,379 P=183,717,114 P=19,710,199 P=128,480 P=163,878,435

- 104 -
*SGVFS004197*
2012
CarryingValue Total
Quoted Pricesin ActiveMarkets(Level 1)
SignificantObservable
Inputs(Level 2)
SignificantUnobservable
Inputs(Level 3)
(In Thousands)
Liabilities Measured at Fair ValueFinancial Liabilities at FVPL: Derivative liabilities P=2,737,981 P=2,737,981 P=– P=264,851 P=2,473,130Liabilities for which Fair Values are DisclosedOther Financial Liabilities: Bank loans 31,793,975 31,793,975 31,793,975 – – Accounts payable and other current liabilities* 55,531,106 55,531,106 – – 55,531,106 Long-term debt (including current portion and
net of unamortized debt issue cost) 188,392,429 230,044,469 – – 230,044,469 Dividends payable 97,282 97,282 – – 97,282 Tenants’ deposits and others 14,500,317 14,976,358 – – 14,976,358
290,315,109 332,443,190 31,793,975 – 300,649,215P=293,053,090 P=335,181,171 P=31,793,975 P=264,851 P=303,122,345
*Excluding payable to government agencies of P=2,334.8 million at December 31, 2012, the amounts of which are not considered asfinancial liabilities.
During the years ended December 31, 2013 and 2012, there were no transfers between Level 1 andLevel 2 fair value measurements and no transfers into and out of Level 3 fair value measurements.
The following methods and assumptions were used to estimate the fair value of each class offinancial instrument for which it is practicable to estimate such value:
Investments Held for Trading. The fair values are based on the quoted market prices of theinstruments.
Cash and Cash Equivalents. The carrying amounts reported in the consolidated balance sheetsapproximate its fair value, due to its short-term nature.
Time Deposits and Short-term Investments. The estimated fair value is based on the discountedvalue of future cash flows using the prevailing interest rates. The discount rates used range from0.18% to 2.09% and 0.50% to 6.55% as at December 31, 2013 and 2012, respectively.
Receivables and Advances and Other Receivables included under “Other current assets” account.The carrying values of short-term receivables approximate their fair values due to their short-termmaturities. The estimated fair value of the noncurrent portion of receivables from real estatebuyers is based on the discounted value of future cash flows using the prevailing interest rates.The discount rates used ranged from 5.0% to 7.5% and 5.5% to 8.0% as at December 31, 2013and 2012, respectively.
Long-term Notes included under “Other noncurrent assets” account. The estimated fair values oflong-term notes are based on the discounted value of future cash flows using the prevailinginterest rates. Discount rates used for long-term notes range is .01% to 3.21% and 0.45% to4.13% as at December 31, 2013 and 2012.
AFS Investments. The fair value of investments that are actively traded in organized financialmarkets is determined by reference to quoted market bid prices at the close of business. Forunlisted equity securities, these are carried at cost less allowance for impairment loss since thereare no quoted prices and due to the unpredictable nature of future cash flows and lack of suitablemethods for arriving at reliable fair value.
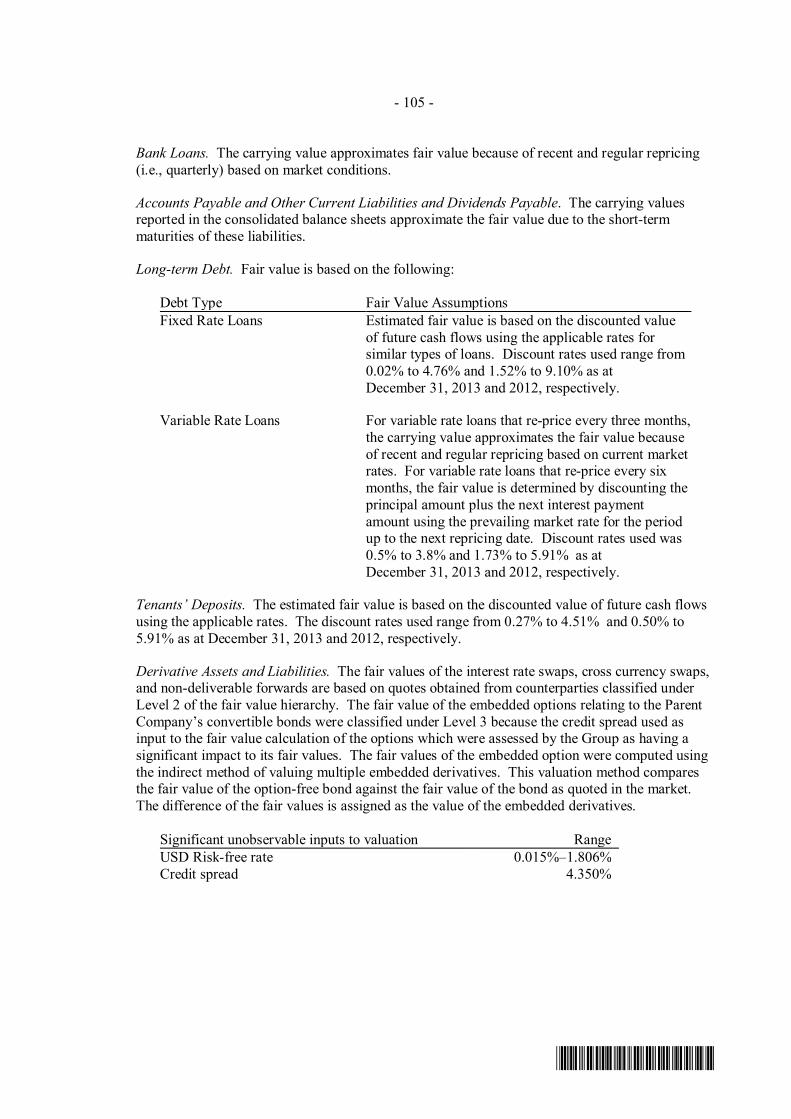
- 105 -
*SGVFS004197*
Bank Loans. The carrying value approximates fair value because of recent and regular repricing(i.e., quarterly) based on market conditions.
Accounts Payable and Other Current Liabilities and Dividends Payable. The carrying valuesreported in the consolidated balance sheets approximate the fair value due to the short-termmaturities of these liabilities.
Long-term Debt. Fair value is based on the following:
Debt Type Fair Value AssumptionsFixed Rate Loans Estimated fair value is based on the discounted value
of future cash flows using the applicable rates forsimilar types of loans. Discount rates used range from0.02% to 4.76% and 1.52% to 9.10% as atDecember 31, 2013 and 2012, respectively.
Variable Rate Loans For variable rate loans that re-price every three months,the carrying value approximates the fair value becauseof recent and regular repricing based on current marketrates. For variable rate loans that re-price every sixmonths, the fair value is determined by discounting theprincipal amount plus the next interest paymentamount using the prevailing market rate for the periodup to the next repricing date. Discount rates used was0.5% to 3.8% and 1.73% to 5.91% as atDecember 31, 2013 and 2012, respectively.
Tenants’ Deposits. The estimated fair value is based on the discounted value of future cash flowsusing the applicable rates. The discount rates used range from 0.27% to 4.51% and 0.50% to5.91% as at December 31, 2013 and 2012, respectively.
Derivative Assets and Liabilities. The fair values of the interest rate swaps, cross currency swaps,and non-deliverable forwards are based on quotes obtained from counterparties classified underLevel 2 of the fair value hierarchy. The fair value of the embedded options relating to the ParentCompany’s convertible bonds were classified under Level 3 because the credit spread used asinput to the fair value calculation of the options which were assessed by the Group as having asignificant impact to its fair values. The fair values of the embedded option were computed usingthe indirect method of valuing multiple embedded derivatives. This valuation method comparesthe fair value of the option-free bond against the fair value of the bond as quoted in the market.The difference of the fair values is assigned as the value of the embedded derivatives.
Significant unobservable inputs to valuation RangeUSD Risk-free rate 0.015%–1.806%Credit spread 4.350%

- 106 -
*SGVFS004197*
To assess the impact of the credit spreads used, the Group performed a sensitivity analysis usingan increase (decrease) assumption in the credit spreads, the result of which is shown below:
Increase (Decrease) in Credit Spread Net Effect on Fair Values of Option(In Thousands)
2013 100 bps (P=124,528)(100) bps 129,032
2012 100 bps (370,183)(100) bps 387,334
Show below is the rollforward analysis of the fair value changes of this financial instrument forthe year ended December 31, 2013:
Balance at beginning of year (P=2,473,130)Fair value changes (1,335,209)Conversions 2,962,910Balance at December 31, 2013 (P=845,429)
The fair value changes during the year were recognized under “Gain or loss on fair value changeson derivatives - net” account and “Foreign exchange gain – net” account in the consolidatedstatement of comprehensive income.
Derivative Financial InstrumentsTo address the Group’s exposure to market risk for changes in interest rates arising primarily fromits long-term floating rate debt obligations and to manage its foreign exchange risks, the Groupentered into various derivative transactions such as cross-currency swaps, interest rate swaps,foreign currency call options, non-deliverable forwards and foreign currency range options. TheGroup also has embedded derivatives bifurcated from the Parent Company’s convertible bonds.
Derivative Assets
2013 2012(In Thousands)
Parent (see Note 17):Cross-currency swaps P=864,677 P=–Non-deliverable forwards – 18,501
SM Prime (see Note 17):Cross-currency swaps 1,668,400 –Interest rate swaps 110,410 109,979
P=2,643,487 P=128,480
Derivative Liabilities
2013 2012(In Thousands)
Parent (see Note 19):Options arising from convertible bonds P=845,429 P=2,473,130Non-deliverable forwards – 18,501Foreign currency swap – 2,020
SM Prime (see Note 29) -Interest rate swaps 159,974 244,330
P=1,005,403 P=2,737,981

- 107 -
*SGVFS004197*
Derivative Instruments Accounted for as Cash Flow Hedges
Cross Currency Swaps. In 2013, the Parent Company and SM Prime entered into cross-currencyswap transactions to hedge both the foreign currency and interest rate exposures on its U.S. dollar-denominated five-year term loans (the hedged loans) obtained on January 29, 2013, April 16, andJune 2013. (see Note 29).
Details of the hedged loans are as follows:
Outstanding Principal Balance Interest Rate Maturity Date(In Thousands)
(In US$) (In PhP=)Parent - Unsecured loans US$180,000 P=7,425,450 6-month US LIBOR + 1.70% May 15, 2018
SM Prime: Unsecured loan US$200,000 P=8,879,000 6-month US LIBOR + 1.70% January 29, 2018 Unsecured loan US$150,000 P=6,659,250 6-month US LIBOR + 1.70% March 23,2018
The table below provides the details of the Group’s outstanding cross-currency swaps as atDecember 31, 2013:
Notional Amounts Receive PayUS$:P=
Rate MaturityFair Value
Gain(In Thousands) (In Thousands)
(In US$) (In PhP=)Parent: Floating-to-Fixed 50,000 2,059,250 6M US LIBOR + 1.70% 4.05% P=41.19 May 15, 2018 P=240,779 Floating-to-Fixed 60,000 2,478,000 6M US LIBOR + 1.70% 4.03% 41.30 May 15, 2018 283,828 Floating-to-Fixed 70,000 2,888,200 6M US LIBOR + 1.70% 3.98% 41.26 May 15, 2018 340,070
SM Prime: Floating-to-Fixed 150,000 6,100,500 6M US LIBOR + 1.70% 3.70% 40.67 January 29, 2018 741,311 Floating-to-Fixed 50,000 2,033,500 6M US LIBOR + 1.70% 3.70% 40.67 January 29, 2018 256,939 Floating-to-Fixed 50,000 2,055,000 6M US LIBOR + 1.70% 3.90% 41.10 March 23, 2018 219,342 Floating-to-Fixed 50,000 2,055,000 6M US LIBOR + 1.70% 3.90% 41.10 March 23, 2018 219,029 Floating-to-Fixed 50,000 2,055,000 6M US LIBOR + 1.70% 3.90% 41.10 March 23, 2018 231,779
Under the floating-to-fixed cross-currency swaps, the Parent Company and SM Prime effectivelyconverted the hedged US dollar-denominated loans into Philippine peso-denominated loans where,at inception, it agreed to swap US dollar principal equal to the face amount of the loans for theiragreed Philippine peso equivalents with the counterparty banks and to exchange, at maturity date,the principal amount originally swapped. The agreements also require the Parent Company andSM Prime to pay fixed interest at the Philippine peso notional amount and receives floatinginterest on the US$ notional amount, on a semi-annual basis, simultaneous with the interestpayments on the hedged loans.
Hedge Effectiveness ResultsAs the terms of the swaps have been negotiated to match the terms of the hedged loans, the hedgeswere assessed to be highly effective. The fair value of the outstanding cross-currency swaps of thethe Group designates as cash flow hedges as at December 31, 2013 amounting to P=2,533.2 milliongain were taken to equity under “Cumulative translation adjustment”. No ineffectiveness wasrecognized in the consolidated statement of income for the twelve-month period endedDecember 31, 2013. Foreign currency translation loss arising from the hedged loans of the Groupamounting to P=1,804.7 million was recognized in the consolidated statement of income for thetwelve-month period ended December 31, 2013. A foreign exchange gain equivalent to the sameamount was recycled from equity to the consolidated statement of income during the same period.
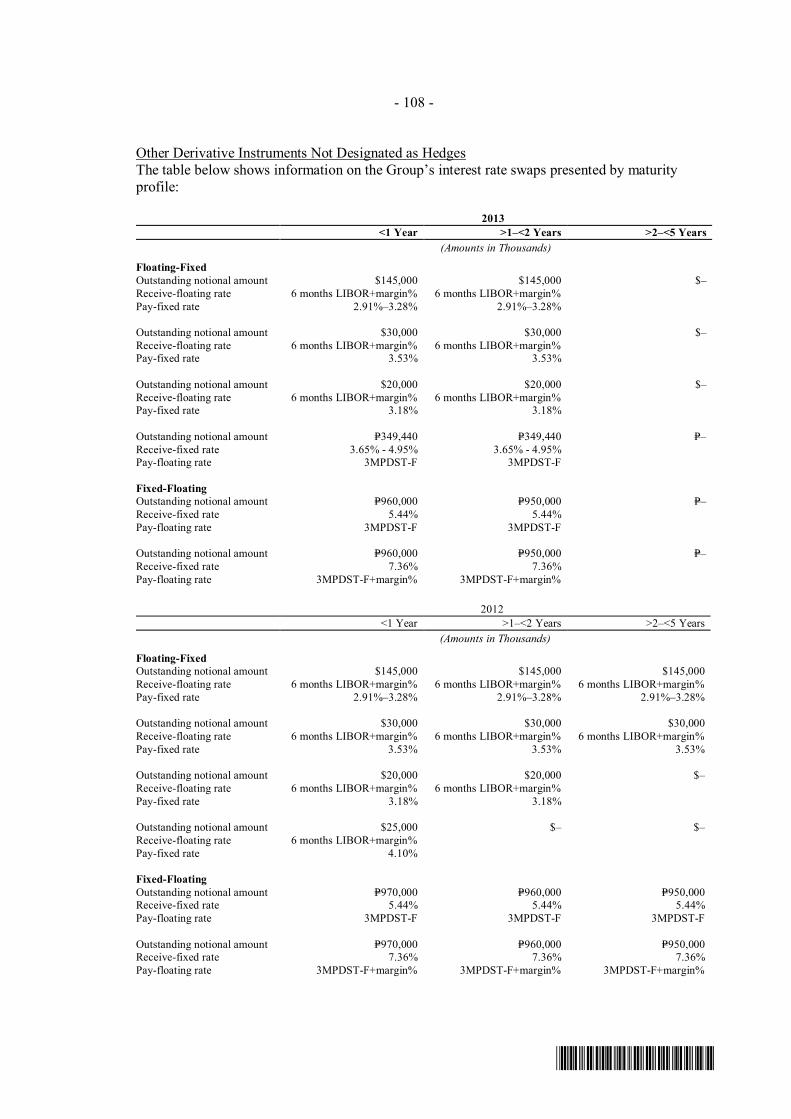
- 108 -
*SGVFS004197*
Other Derivative Instruments Not Designated as HedgesThe table below shows information on the Group’s interest rate swaps presented by maturityprofile:
2013<1 Year >1–<2 Years >2–<5 Years
(Amounts in Thousands)
Floating-FixedOutstanding notional amount $145,000 $145,000 $–Receive-floating rate 6 months LIBOR+margin% 6 months LIBOR+margin%Pay-fixed rate 2.91%–3.28% 2.91%–3.28%
Outstanding notional amount $30,000 $30,000 $–Receive-floating rate 6 months LIBOR+margin% 6 months LIBOR+margin%Pay-fixed rate 3.53% 3.53%
Outstanding notional amount $20,000 $20,000 $–Receive-floating rate 6 months LIBOR+margin% 6 months LIBOR+margin%Pay-fixed rate 3.18% 3.18%
Outstanding notional amount P=349,440 P=349,440 P=–Receive-fixed rate 3.65% - 4.95% 3.65% - 4.95%Pay-floating rate 3MPDST-F 3MPDST-F
Fixed-FloatingOutstanding notional amount P=960,000 P=950,000 P=–Receive-fixed rate 5.44% 5.44%Pay-floating rate 3MPDST-F 3MPDST-F
Outstanding notional amount P=960,000 P=950,000 P=–Receive-fixed rate 7.36% 7.36%Pay-floating rate 3MPDST-F+margin% 3MPDST-F+margin%
2012<1 Year >1–<2 Years >2–<5 Years
(Amounts in Thousands)
Floating-FixedOutstanding notional amount $145,000 $145,000 $145,000Receive-floating rate 6 months LIBOR+margin% 6 months LIBOR+margin% 6 months LIBOR+margin%Pay-fixed rate 2.91%–3.28% 2.91%–3.28% 2.91%–3.28%
Outstanding notional amount $30,000 $30,000 $30,000Receive-floating rate 6 months LIBOR+margin% 6 months LIBOR+margin% 6 months LIBOR+margin%Pay-fixed rate 3.53% 3.53% 3.53%
Outstanding notional amount $20,000 $20,000 $–Receive-floating rate 6 months LIBOR+margin% 6 months LIBOR+margin%Pay-fixed rate 3.18% 3.18%
Outstanding notional amount $25,000 $– $–Receive-floating rate 6 months LIBOR+margin%Pay-fixed rate 4.10%
Fixed-FloatingOutstanding notional amount P=970,000 P=960,000 P=950,000Receive-fixed rate 5.44% 5.44% 5.44%Pay-floating rate 3MPDST-F 3MPDST-F 3MPDST-F
Outstanding notional amount P=970,000 P=960,000 P=950,000Receive-fixed rate 7.36% 7.36% 7.36%Pay-floating rate 3MPDST-F+margin% 3MPDST-F+margin% 3MPDST-F+margin%

- 109 -
*SGVFS004197*
Derivative Liabilities
Options Arising from Investment in Convertible Bonds. The Parent Company invested in US$denominated convertible bonds of a public company which it classified as AFS investments. Thebonds contain multiple embedded derivatives such as long equity call, short call and long putoptions. Such multiple embedded derivatives were bifurcated by the Parent Company from thehost bonds on the respective purchase dates of the bonds and were accounted for as singlecompound derivative. The net positive fair value of the options at inception amounted toP=3.7 million. The long equity call option pertains to the right of the Parent Company to convertthe bonds into common shares of the issuer at the conversion price of P=63.7 (P=26.9 at present) pershare at the fixed exchange rate of P=40.6 per US$1.0 until January 31, 2013, subject to a cashsettlement option on the part of the issuer. The short call option pertains to the right of the issuerto early redeem the bonds on or after February 11, 2010 subject to the conditions stated in thebond agreement. On the other hand, the long put option, which expired on February 11, 2011,pertains to the right of the Parent Company to require the issuer to redeem the bonds at 115.6%.
As at December 31, 2013 and 2012, all outstanding embedded derivatives of the convertible bondshave nil values.
Options Arising from Convertible Bonds. The Parent Company’s and SM Prime’s convertiblebonds contain multiple embedded derivatives such as short equity call option, long call option andshort put option, which were bifurcated and accounted for as single compound derivative.
US$250.0 million Convertible BondsAs at December 31, 2013 and 2012, the negative fair value of the multiple embedded derivatives,which is shown as a current liability in the parent company balance sheets, amounted toP=845.4 million and P=2,473.1 million, respectively. At inception date, the negative fair value of theoptions amounted to P=1,193.9 million. In 2013 and 2012, the Parent Company recognized a netfair value change from these options amounting to P=1,105.7 million loss and P=1,279.2 million losswhich is recognized under “Gain (loss) on fair value changes on derivatives - net” account andP=229.6 million loss which is recognized under “Foreign exchange gain - net” account in theconsolidated statements of income. Also, as a result of the exercise of the conversion option atvarious dates in 2013 (see Note 21), P=2,962.9 million of the option value was transferred fromderivative liabilities to “Additional paid-in capital” (APIC) account in the parent company balancesheets.
US$300.0 million Convertible BondsNet fair value changes of the multiple embedded derivatives recognized in the 2012 parentcompany statement of comprehensive income include P=131.5 million mark-to-market loss andP=28.7 million gain arising from the expiry of options which are reflected under “Gain (loss) on fairvalue changes of derivatives - net” account in the parent company statements of comprehensiveincome. Also, as a result of the exercise of the conversion option at various dates in 2012(see Note 21), P=219.3 million of the option value was transferred from derivative liabilities to“Additional paid-in capital” (APIC) account in the parent company balance sheets.
Interest Rate Swaps. In 2011, the SM Prime entered into floating to fixed US$ interest rate swapagreements with aggregate notional amount of US$145 million. Under the agreements, SM Primeeffectively converts the floating rate U.S. dollar-denominated term loan into fixed rate loan withsemi-annual payment intervals up to March 21, 2015 (see Note 20). As at December 31, 2013 and2012, the floating to fixed interest rate swaps have aggregate negative fair value of P=114 millionand P=158 million, respectively.

- 110 -
*SGVFS004197*
SM Prime also entered into US$ interest rate swap agreement with notional amount ofUS$20 million in 2011. Under the agreement, SM Prime effectively converts the floating rateU.S. dollar-denominated five-year bilateral unsecured loan into fixed rate loan with semi-annualpayment intervals up to November 30, 2014 (see Note 20). As at December 31, 2013 and 2012,the floating to fixed interest rate swap has negative fair value of P=10 million and P=17 million,respectively.
In 2010, the SM Prime entered into the following interest rate swap agreements:
§ A US$ interest rate swap agreement with nominal amount of US$30 million. Under theagreement, SM Prime effectively converts the floating rate U.S. dollar-denominated five-yearbilateral unsecured loan into fixed rate loan with semi-annual payment intervals up toNovember 30, 2015 (see Note 20). As at December 31, 2013 and 2012, the floating to fixedinterest rate swap has negative fair value of P=36 million and P=48 million, respectively.
§ Two Philippine peso interest rate swap agreements with notional amount of P=1,000 millioneach, with amortization of P=10 million every anniversary. The consolidated net cash flows ofthe two swaps effectively converts the Philippine peso-denominated five-year inverse floatingrate notes into floating rate notes with quarterly payment intervals up to June 2015(see Note 20). In 2013, SMPH entered into two floating to fixed opposite-side Philippine pesointerest rate swap agreements for a partial notional amount of P=174.7 million each toeffectively unwind the original swap in line with the Company’s partial prepayment of theloan. As at December 31, 2013, these swaps have negative fair values of P=9 million.
§ A US$ interest rate swap agreement with notional amount of US$20 million. Under theagreement, SM Prime effectively converts the floating rate U.S. dollar-denominated three-yearbilateral unsecured loan into fixed rate loan with semi-annual payment intervals up toJanuary 14, 2013 (see Note 20). As at December 31, 2011, the floating to fixed interest rateswap has a negative fair value of P=3 million. In January 2012, the interest rate swapagreement was preterminated as a result of the prepayment of the underlying loan. Fair valuechanges from the preterminated swap recognized in the consolidated statements of incomeamounted to P=1 million loss in 2012.
In 2009, SM Prime entered into US$ interest rate swap agreements with aggregate notionalamount of US$25 million. Under these agreements, SM Prime effectively converts the floatingrate US dollar-denominated five-year bilateral loan into fixed rate loan with semi-annual paymentintervals up to November 2013 (see Note 20). Fair value changes from the matured swapsrecognized in the consolidated statements of income amounted to P=10 million gain in 2013. As atDecember 31, 2012, the floating to fixed interest rate swaps have negative fair value ofP=22 million.
Foreign Currency Swap. In 2012, the Parent Company entered into sell P= and buy US$ foreigncurrency swap contracts. It also entered into sell US$ and buy P= with the same aggregate notionalamount. Net fair value changes recognized by the Parent Company in the consolidated statementof income amount to P=2.0 million loss and P=9.0 million gain from the outstanding and settledforeign currency swaps, respectively, as at December 31, 2012. In 2013, net fair value changesfrom the settled foreign currency swap contracts included under “Gain (loss) on fair value changeson derivatives – net” account and “Foreign exchange – net” in the consolidated statements ofincome amounted to P=14.0 million gain and P=16.6 million gain, respectively.

- 111 -
*SGVFS004197*
Non-deliverable Forwards. In 2013, 2012 and 2011, the Parent Company and SM Prime enteredinto sell P= and buy US$ forward contracts. It also entered into sell US$ and buy P= with the sameaggregate notional amount. The Group recognized derivative assets amounting to P=18.5 millionfrom the outstanding forward contracts as at December 31, 2012, respectively. Net fair valuechanges from the settled forward contracts of the Group amounted to P=53.0 million andP=87.7 million gain, in 2013 and 2012, respectively.
Fair Value Changes on DerivativesThe net movements in fair value changes of all derivative instruments as at December 31 are asfollows:
2013 2012(In Thousands)
Balance at beginning of year (P=2,609,501) (P=202,741)Net change in fair value 1,251,514 (2,304,958)Fair value of derivatives on settled contracts 2,996,071 (101,802)Balance at end of year P=1,638,084 (P=2,609,501)
In 2013, the net changes in fair value amounting to P=1,251.5 million gain include net mark-to-market gain on derivative instruments accounted for as cash flow hedges amounting to P=2,533.2million, which is included under “Cumulative translation adjustment” account in the consolidatedbalance sheets and net mark-to-market loss on derivative instruments not designated as hedges,which is included under “Gain (loss) on fair value changes on derivatives – net” accountamounting to P=997.5 million and net mark-to-market loss included under “Foreign exchange –net” amounting to P=284.2 million.
In 2012, the net changes in fair value amounting to negative P=2,305.0 million comprise of interestpaid amounting to P=26.8 million, which is included under “Interest expense” account in theconsolidated statements of income, net marked-to-market loss on derivatives amounting toP=1,403.4 million, which is included under “Gain (loss) on fair value changes on derivatives - net”account in the consolidated statements of income, P=1,193.7 million pertaining to the valuation ofthe option on convertible bond, P=219.3 million transferred to “Additional paid-in capital” accountin the consolidated balance sheets and P=99.6 million gain recognized under “Foreign exchangegain – net”.
The reconciliation of the amounts of derivative assets and liabilities recognized in the consolidatedbalance sheets is as follows:
2013 2012(In Thousands)
Derivative assets (see Notes 11 and 17) P=2,643,487 P=128,480Derivative liabilities (see Note 19) (1,005,403) (2,737,981)Balance at end of year P=1,638,084 (P=2,609,501)
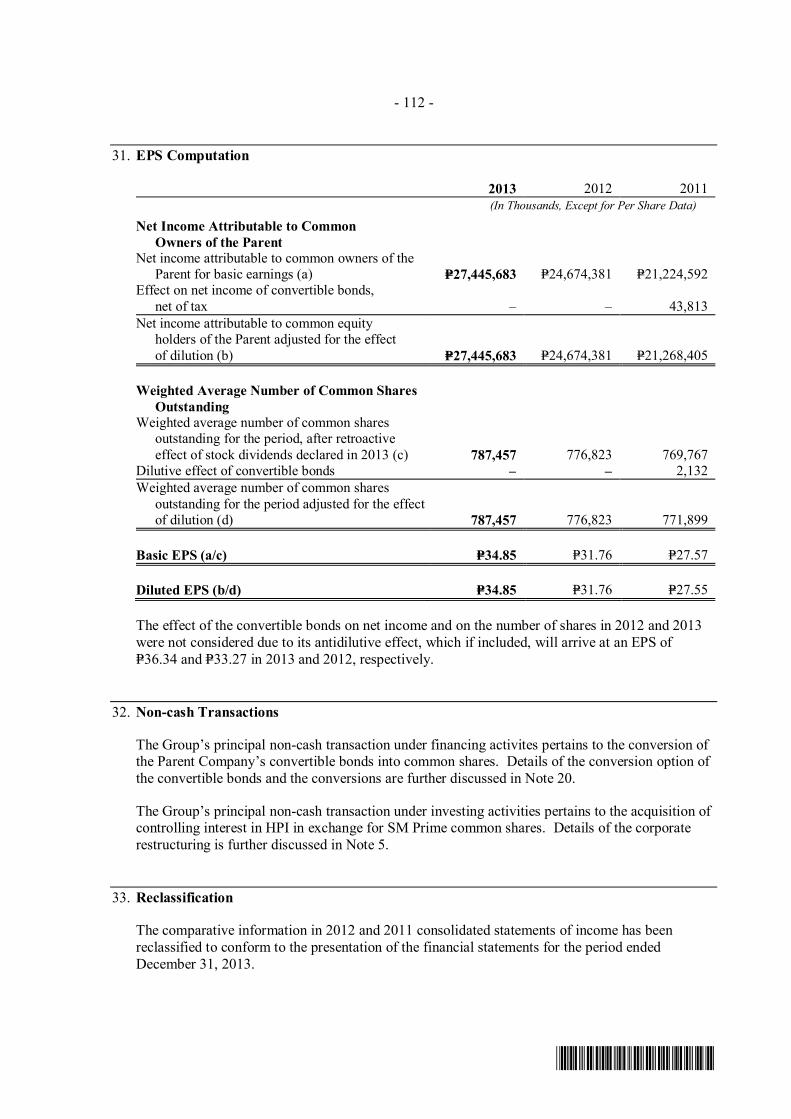
- 112 -
*SGVFS004197*
31. EPS Computation
2013 2012 2011(In Thousands, Except for Per Share Data)
Net Income Attributable to CommonOwners of the Parent
Net income attributable to common owners of theParent for basic earnings (a) P=27,445,683 P=24,674,381 P=21,224,592
Effect on net income of convertible bonds,net of tax – – 43,813
Net income attributable to common equityholders of the Parent adjusted for the effectof dilution (b) P=27,445,683 P=24,674,381 P=21,268,405
Weighted Average Number of Common SharesOutstanding
Weighted average number of common sharesoutstanding for the period, after retroactiveeffect of stock dividends declared in 2013 (c) 787,457 776,823 769,767
Dilutive effect of convertible bonds – – 2,132Weighted average number of common shares
outstanding for the period adjusted for the effectof dilution (d) 787,457 776,823 771,899
Basic EPS (a/c) P=34.85 P=31.76 P=27.57
Diluted EPS (b/d) P=34.85 P=31.76 P=27.55
The effect of the convertible bonds on net income and on the number of shares in 2012 and 2013were not considered due to its antidilutive effect, which if included, will arrive at an EPS ofP=36.34 and P=33.27 in 2013 and 2012, respectively.
32. Non-cash Transactions
The Group’s principal non-cash transaction under financing activites pertains to the conversion ofthe Parent Company’s convertible bonds into common shares. Details of the conversion option ofthe convertible bonds and the conversions are further discussed in Note 20.
The Group’s principal non-cash transaction under investing activities pertains to the acquisition ofcontrolling interest in HPI in exchange for SM Prime common shares. Details of the corporaterestructuring is further discussed in Note 5.
33. Reclassification
The comparative information in 2012 and 2011 consolidated statements of income has beenreclassified to conform to the presentation of the financial statements for the period endedDecember 31, 2013.

- 113 -
*SGVFS004197*
34. Events After the Reporting Period
On February 17, 2014, SMIC signed an Investment and Shareholders Agreement for theacquisition of 34% ownership interest in CityMall Commercial Center, Inc. The remaining 66%of the outstanding capital is held by DoubleDragon Properties Corp.
*SGVFS004197*
INDEPENDENT AUDITORS’ REPORTON SUPPLEMENTARY SCHEDULES
The Stockholders and the Board of DirectorsSM Investments Corporation10th Floor, One E-Com CenterHarbor Drive, Mall of Asia ComplexCBP-1A, Pasay City 1300
We have audited in accordance with Philippine Standards on Auditing, the consolidated financialstatements of SM Investments Corporation and Subsidiaries as at December 31, 2013 and 2012 and foreach of the three years in the period ended December 31, 2013, included in this Form 17-A, and haveissued our report thereon dated March 3, 2014. Our audits were made for the purpose of forming anopinion on the basic financial statements taken as a whole. The schedules listed in the Index toConsolidated Financial Statements and Supplementary Schedules are the responsibility of theCompany’s management. These schedules are presented for purposes of complying with SecuritiesRegulation Code Rule 68, As Amended (2011) and are not part of the basic financial statements.These schedules have been subjected to the auditing procedures applied in the audit of the basicfinancial statements and, in our opinion, fairly state, in all material respects, the information requiredto be set forth therein in relation to the basic financial statements taken as a whole.
SYCIP GORRES VELAYO & CO.
Belinda T. Beng HuiPartnerCPA Certificate No. 88823SEC Accreditation No. 0923-AR-1 (Group A), March 25, 2013, valid until March 24, 2016Tax Identification No. 153-978-243BIR Accreditation No. 08-001998-78-2012, June 19, 2012, valid until June 18, 2015PTR No. 4225152, January 2, 2014, Makati City
March 3, 2014
SyCip Gorres Velayo & Co.6760 Ayala Avenue1226 Makati CityPhilippines
Tel: (632) 891 0307Fax: (632) 819 0872ey.com/ph
BOA/PRC Reg. No. 0001, December 28, 2012, valid until December 31, 2015SEC Accreditation No. 0012-FR-3 (Group A), November 15, 2012, valid until November 16, 2015
A member firm of Ernst & Young Global Limited

- 115 -
SM INVESTMENTS CORPORATION AND SUBSIDIARIES
SCHEDULE A – FINANCIAL ASSETS
FOR THE YEAR ENDED DECEMBER 31, 2013
(Amounts in Thousands, Except Shares Data)
Name of Issuing Entity and
Description of Each Issue
Number of Shares or
Principal Amount of
Bonds and Notes
Amount Shown in the
Balance Sheet
Valued Based on Market
Quotations at Balance
Sheet Date
Interest and Dividend
Income Received
and Accrued
Temporary investments
BDO Unibank, Inc. P=36,715,149 P=– P=505,429
China Banking Corporation 79,609 – 83,694
Others 3,211,913 – 313,567
40,006,671 – 902,690
Time deposits – current and short-term
investments 28,912,650 – 357,686
Investments held for trading and sale:
Bonds and Notes:
Peso Bonds 215,000 226,680 226,680 7,353
Dollar Bonds $5,000 233,074 233,074 20,957
Shares of Stocks:
Common shares:
Edsa Properties Holdings, Inc. 189,550,548 shares 605,614 605,614 23,999
Republic Glass Holdings, Inc. 15,740,512 shares 40,138 40,138 –
Keppel Philippine Holdings, Inc. 580,000 shares 2,674 2,674 58
Picop Resources 40,000,000 shares 8,200 8,200 –
Export & Industry bank 7,829,000 shares 2,035 2,035 –
Benguet Corporation 88,919 shares 565 565 –
1,118,980 1,118,980 52,367
Total Marketable Securities P=70,038,301 P=1,118,980 P=1,312,743
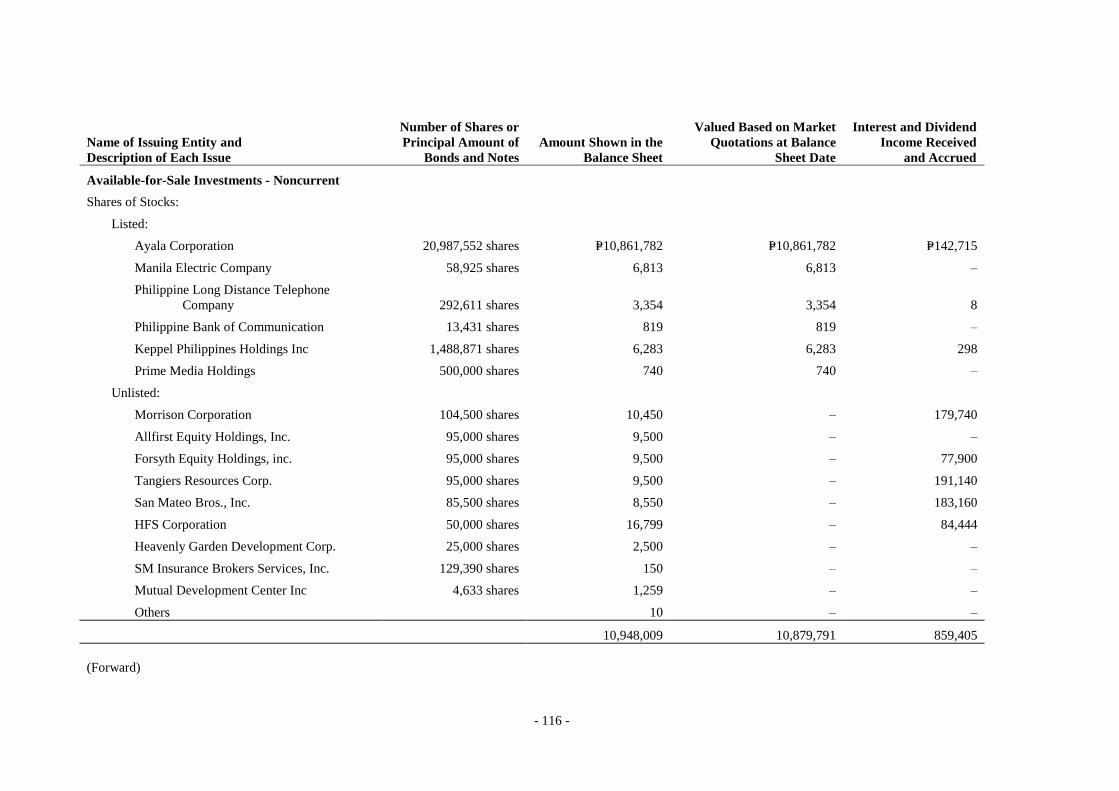
- 116 -
Name of Issuing Entity and
Description of Each Issue
Number of Shares or
Principal Amount of
Bonds and Notes
Amount Shown in the
Balance Sheet
Valued Based on Market
Quotations at Balance
Sheet Date
Interest and Dividend
Income Received
and Accrued
Available-for-Sale Investments - Noncurrent
Shares of Stocks:
Listed:
Ayala Corporation 20,987,552 shares P=10,861,782 P=10,861,782 P=142,715
Manila Electric Company 58,925 shares 6,813 6,813 –
Philippine Long Distance Telephone
Company 292,611 shares 3,354 3,354 8
Philippine Bank of Communication 13,431 shares 819 819 –
Keppel Philippines Holdings Inc 1,488,871 shares 6,283 6,283 298
Prime Media Holdings 500,000 shares 740 740 –
Unlisted:
Morrison Corporation 104,500 shares 10,450 – 179,740
Allfirst Equity Holdings, Inc. 95,000 shares 9,500 – –
Forsyth Equity Holdings, inc. 95,000 shares 9,500 – 77,900
Tangiers Resources Corp. 95,000 shares 9,500 – 191,140
San Mateo Bros., Inc. 85,500 shares 8,550 – 183,160
HFS Corporation 50,000 shares 16,799 – 84,444
Heavenly Garden Development Corp. 25,000 shares 2,500 – –
SM Insurance Brokers Services, Inc. 129,390 shares 150 – –
Mutual Development Center Inc 4,633 shares 1,259 – –
Others 10 – –
10,948,009 10,879,791 859,405
(Forward)

- 117 -
Name of Issuing Entity and
Description of Each Issue
Number of Shares or
Principal Amount of
Bonds and Notes
Amount Shown in the
Balance Sheet
Valued Based on Market
Quotations at Balance
Sheet Date
Interest and Dividend
Income Received
and Accrued
Bonds and corporate notes -
Corporate Bonds $124,785 P=5,539,822 P=5,539,822 P=360,588
5,539,822 5,539,822 360,588
Club Shares:
Cebu Golf & Country Club 1 share 3,900 3,900 –
Baguio Country Club 1 share 1,400 1,400 –
Country Club of Tagaytay Highlands 1 share 500 500 –
Mimosa Golf & Country Club, Inc. 1 share 400 400 –
Camp John Hay 2 shares 200 200 –
Subic Bay Yacht Club 1 share 200 200 –
Splendido Taal Golf Club 1 share 80 80 –
Calatagan Golf Club 1 share 30 30 –
Cresta del Mar 3 shares 35 35 –
Ridge Resort 1 share 15 15 –
Tagaytay Midlands Golf Club, Inc. 9 shares 4,500 4,500 –
11,260 11,260 –
16,499,091 16,430,873 1,219,993
Time Deposits - Noncurrent – 27,080,950 – 1,888,033
Total Noncurrent Financial Assets P=43,580,041 P=16,430,873 P=3,108,026

- 118 -
SM INVESTMENTS CORPORATION AND SUBSIDIARIES
SCHEDULE C – AMOUNTS RECEIVABLE FROM RELATED PARTIES WHICH ARE ELIMINATED DURING THE CONSOLIDATION OF FINANCIAL
STATEMENTS
FOR THE YEAR ENDED DECEMBER 31, 2013
(Amounts in Thousands)
Name and Designation of Debtor
Balance at
beginning of
period
Additions Amount
collected
Amounts
written off Current
Not
Current
Balance at end
of period
Accounts receivable - tenants
Sanford_Marketing Corporation P=24,281 P=202,596 P=200,047 P=– P=26,830 P=– P=26,830
Mainstream Business, Inc. 45,365 299,107 274,256 – 70,216 – 70,216
Market Strategic Firm, Inc. 17,602 195,790 148,068 – 65,324 – 65,324
Major Shopping Management Corporation – 175,355 175,355 – – – –
Metro Main Star Asia Corporation 22,233 195,287 217,520 – – – –
Meridien Business Leader, Inc. 15,938 60,870 76,808 – – – –
Madison Shopping Plaza, Inc. 38,533 227,707 212,398 – 53,842 – 53,842
Multi Stores Corporation 21,569 146,603 140,920 – 27,252 – 27,252
Mandurriao Star, Inc. – 266,957 230,220 – 36,737 – 36,737
Metro Manila Shopping Mecca Corp. 24,842 – 9,597 – 15,245 – 15,245
Mercantile Stores Group, Inc. 45,901 264,642 235,282 – 75,261 – 75,261
Mindanao Shopping Destination Corp. 9,701 58,668 53,534 – 14,835 – 14,835
Manila Southern Associates, Inc. 33,375 224,095 205,351 – 52,119 – 52,119
My ShoppingLane Cebu Corporation – 11,212 11,212 – – – –
Mindanao Shoppers Daily Destination – 14,788 – – 14,788 – 14,788
(Forward)

- 119 -
Name and Designation of Debtor
Balance at
beginning of
period
Additions Amount
collected
Amounts
written off Current
Not
Current
Balance at end
of period
SM Mart, Inc. 77,334 476,176 455,084 – 98,426 – 98,426
Supervalue, Inc. 258,659 2,064,624 2,027,631 – 295,652 – 295,652
Super Shopping Market, Inc. 144,829 1,648,098 1,564,656 – 228,271 – 228,271
SM Retail, Inc. 15,471 83,796 85,682 – 13,585 – 13,585
Accessories_Management Corp. 404 1,979 1,987 – 396 – 396
CF_Mgt. Corp. 363 1,519 1,525 – 357 – 357
LF_Mgt. Corp. 356 1,755 1,742 – 369 – 369
LTBG_Mgmt. Corp. 391 1,604 1,995 – – – –
MF_Mgt. Corp. 365 1,538 1,903 – – – –
MCLG_Mgmt. Corp. 223 904 891 – 236 – 236
Forever Agape and Glory, Inc. – 146,029 146,029 – – – –
SM Development Corp. – 157 – – 157 – 157
Mountain Bliss Resort and Development
Corp. 1,024 5,593 6,617 – – – –
SM Prime Holdings, Inc. 32,255 77,286 103,588 – 5,953 – 5,953
SM Hotels & Conventions Corp. 82,823 158,860 196,005 – 45,678 – 45,678
Highlands Prime, Inc. – 709 – – 709 – 709
SM Investments Corporation 14,084 108,969 123,053 – – – –
P=927,921 P=7,123,273 P=6,908,956 P=– P=1,142,238 P=– P=1,142,238
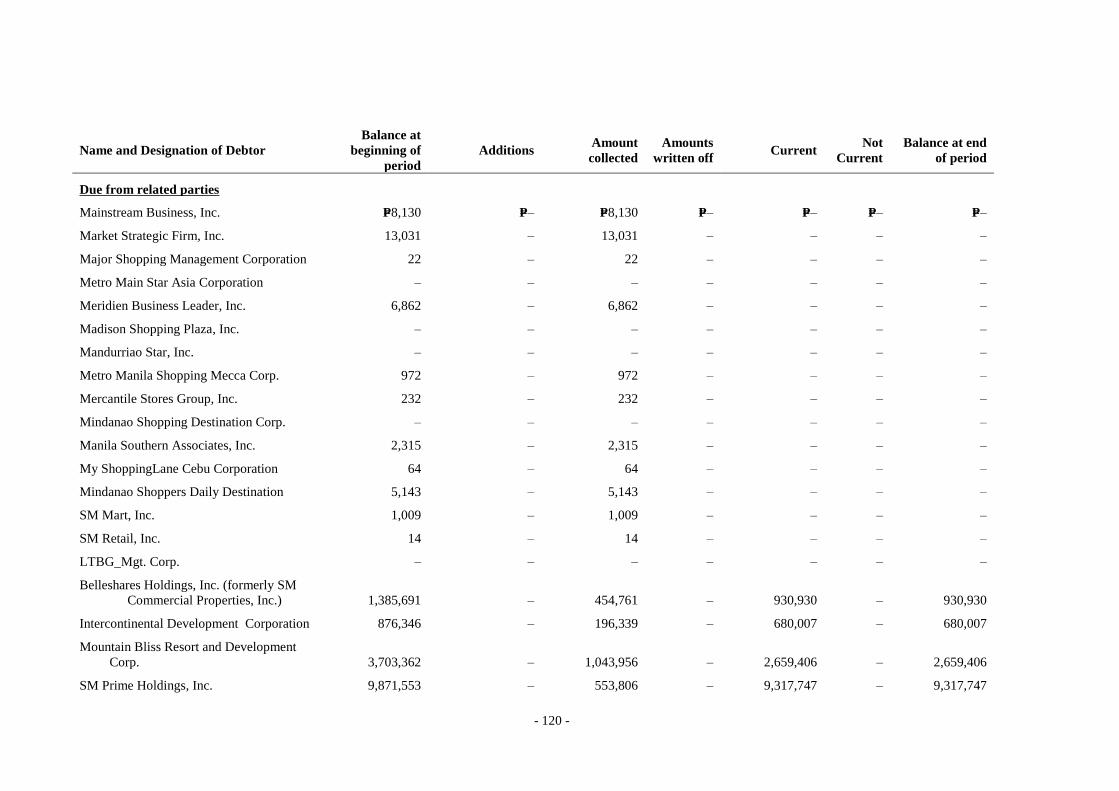
- 120 -
Name and Designation of Debtor
Balance at
beginning of
period
Additions Amount
collected
Amounts
written off Current
Not
Current
Balance at end
of period
Due from related parties
Mainstream Business, Inc. P=8,130 P=– P=8,130 P=– P=– P=– P=–
Market Strategic Firm, Inc. 13,031 – 13,031 – – – –
Major Shopping Management Corporation 22 – 22 – – – –
Metro Main Star Asia Corporation – – – – – – –
Meridien Business Leader, Inc. 6,862 – 6,862 – – – –
Madison Shopping Plaza, Inc. – – – – – – –
Mandurriao Star, Inc. – – – – – – –
Metro Manila Shopping Mecca Corp. 972 – 972 – – – –
Mercantile Stores Group, Inc. 232 – 232 – – – –
Mindanao Shopping Destination Corp. – – – – – – –
Manila Southern Associates, Inc. 2,315 – 2,315 – – – –
My ShoppingLane Cebu Corporation 64 – 64 – – – –
Mindanao Shoppers Daily Destination 5,143 – 5,143 – – – –
SM Mart, Inc. 1,009 – 1,009 – – – –
SM Retail, Inc. 14 – 14 – – – –
LTBG_Mgt. Corp. – – – – – – –
Belleshares Holdings, Inc. (formerly SM
Commercial Properties, Inc.) 1,385,691 – 454,761 – 930,930 – 930,930
Intercontinental Development Corporation 876,346 – 196,339 – 680,007 – 680,007
Mountain Bliss Resort and Development
Corp. 3,703,362 – 1,043,956 – 2,659,406 – 2,659,406
SM Prime Holdings, Inc. 9,871,553 – 553,806 – 9,317,747 – 9,317,747

- 121 -
Name and Designation of Debtor
Balance at
beginning of
period
Additions Amount
collected
Amounts
written off Current
Not
Current
Balance at end
of period
Multi Realty Development Corporation 9,915,493 249,812 56,466 – 10,108,839 – 10,108,839
Tagaytay Resort Development Corp. 26,705 – – – 26,705 – 26,705
SM Investments Corporation 50,308 – 25,943 – 24,365 – 24,365
P=25,867,252 P=249,812 P=2,369,065 P=– P=23,747,999 P=– P=23,747,999
Accounts receivable - management fees
Sanford_Marketing Corporation P=38,089 P=126,636 P=164,697 P=– P=28 P=– P=28
Mainstream Business, Inc. 10,217 66,825 77,042 – – – –
Market Strategic Firm, Inc. 9,625 57,486 67,111 – – – –
Major Shopping Management Corporation 7,764 51,586 59,350 – – – –
Metro Main Star Asia Corporation 6,472 40,281 46,753 – – – –
Meridien Business Leader, Inc. 3,705 25,933 29,638 – – – –
Madison Shopping Plaza, Inc. 8,488 50,772 59,260 – – – –
Multi Stores Corporation 4,483 32,972 37,455 – – – –
Mandurriao Star, Inc. 9,611 60,943 70,554 – – – –
Metro Manila Shopping Mecca Corp. 6,694 41,929 48,623 – – – –
Mercantile Stores Group, Inc. 10,086 61,152 71,238 – – – –
Mindanao Shopping Destination Corp. 2,008 13,158 15,166 – – – –
Manila Southern Associates, Inc. 8,181 50,112 58,293 – – – –
SM Mart, Inc. 20,588 131,633 152,221 – – – –
(Forward)

- 122 -
Name and Designation of Debtor
Balance at
beginning of
period
Additions Amount
collected
Amounts
written off Current
Not
Current
Balance at end
of period
Supervalue, Inc. 69,987 207,234 277,221 – – – –
Super Shopping Market, Inc. 54,497 149,247 203,744 – – – –
SM Commercial Properties, Inc. 6,862 53,040 46,642 – 13,260 – 13,260
P=277,357 P=1,220,939 P=1,485,008 P=– P=13,288 P=– P=13,288
Dividends receivable
Multi Realty Development Corp. P=718,182 P=– P=– P=– P=718,182 P=– P=718,182
Mainstream Business, Inc. – 349,996 199,998 – 149,998 – 149,998
Major Shopping Management Corp – 332,994 179,997 – 152,997 – 152,997
Madison Shopping Plaza, Inc. – 229,997 139,998 – 89,999 – 89,999
Mandurriao Star, Inc. – 149,998 99,999 – 49,999 – 49,999
Mercantile Stores Group, Inc. – 98,996 79,197 – 19,799 – 19,799
Market Strategic Firm, Inc. – 249,998 149,999 – 99,999 – 99,999
Metro Main Star Asia Corp. – 178,197 128,698 – 49,499 – 49,499
Multi Stores Corp – 217,493 112,496 – 104,997 – 104,997
Metro Manila Shopping Mecca Corp. – 199,998 139,999 – 59,999 – 59,999
Meridien Business Leader, Inc. – 59,399 49,499 – 9,900 – 9,900
Accessories_Management Corp. 17,998 13,999 17,998 – 13,999 – 13,999
CF_Mgt Corp. – 12,199 – – 12,199 – 12,199
LF_Mgt Corp. – 13,999 – – 13,999 – 13,999
LTBG_Mgt. Corp. 9,999 15,698 9,999 – 15,698 – 15,698
MF_Mgt. Corp. 5,000 6,499 5,000 – 6,499 – 6,499

- 123 -
Name and Designation of Debtor
Balance at
beginning of
period
Additions Amount
collected
Amounts
written off Current
Not
Current
Balance at end
of period
MCLG_Mgmt. Corp 1,500 5,000 1,500 – 5,000 – 5,000
Hyperhome 19,990 5,000 19,990 – 5,000 – 5,000
Hyperfashion 6,397 – 6,397 – – – –
Sanford_Marketing Corporation 995,960 – 995,960 – – – –
Supervalue, Inc. 2,999,996 1,999,998 2,999,996 – 1,999,998 – 1,999,998
Super Shopping Market, Inc. 1,431,489 999,999 931,493 – 1,499,995 – 1,499,995
Waltermart – 76,500 – – 76,500 – 76,500
P=6,206,511 P=5,215,957 P=6,268,213 P=– P=5,154,255 P=– P=5,154,255

- 124 -
SM INVESTMENTS CORPORATION AND SUBSIDIARIES
SCHEDULE D - INTANGIBLE ASSETS – Other Assets
FOR THE YEAR ENDED DECEMBER 31, 2013
(Amounts in Thousands)
Description
Beginning
Balance Additions at Cost
Charged to Cost
and Expenses
Other changes
Additions
(Deductions)
Charged to Other
Accounts
Ending
Balance
Goodwill P=9,229,438 P=4,900,855 P=– P=– P=– P=14,130,293
Trademarks and brand names 6,124,762 – – – – 6,124,762
Total P=15,354,200 P=4,900,855 P=– P=– P=– P=20,255,055

- 125 -
SM INVESTMENTS CORPORATION AND SUBSIDIARIES
SCHEDULE E - LONG-TERM DEBT
FOR THE YEAR ENDED DECEMBER 31, 2013
(Amounts in Thousands)
Title of Issue and Type of Obligation
Amount Authorized by
Indenture
Amount Shown Under
Caption "Current Portion of
Long-term Debt" in Related
Balance Sheet
Amount Shown Under Caption
"Long-term Debt" in Related
Balance Sheet
Fixed Rate
Foreign Currency Loans:
US$400 million fixed rate bonds P=– P=– P=16,911,280
US$500 million fixed rate bonds – 16,790,593 –
US$250 million convertible bonds – – 3,672,132
US$500 million Senior bonds – – 21,986,855
Peso Loans:
Three-year, five-year, seven-year and
ten-year fixed rate notes
– 79,800 32,107,819
Five-year and seven-year retail bonds – 8,390,202 996,003
Seven-year and ten-year retail bonds – – 12,992,309
Ten-year corporate notes – – 1,093,094
Other bank loans – 1,381,750 9,173,970
Variable Rate
Foreign Currency Loans:
US$ five-year term loans – – 24,878,273
China Yuan renminbi loans – 2,751,030 446,567
US$ bilateral loans – – 1,103,881
US$ five-year syndicated loans – – 21,724,475
Other bank loans – – 4,383,631
(Forward)
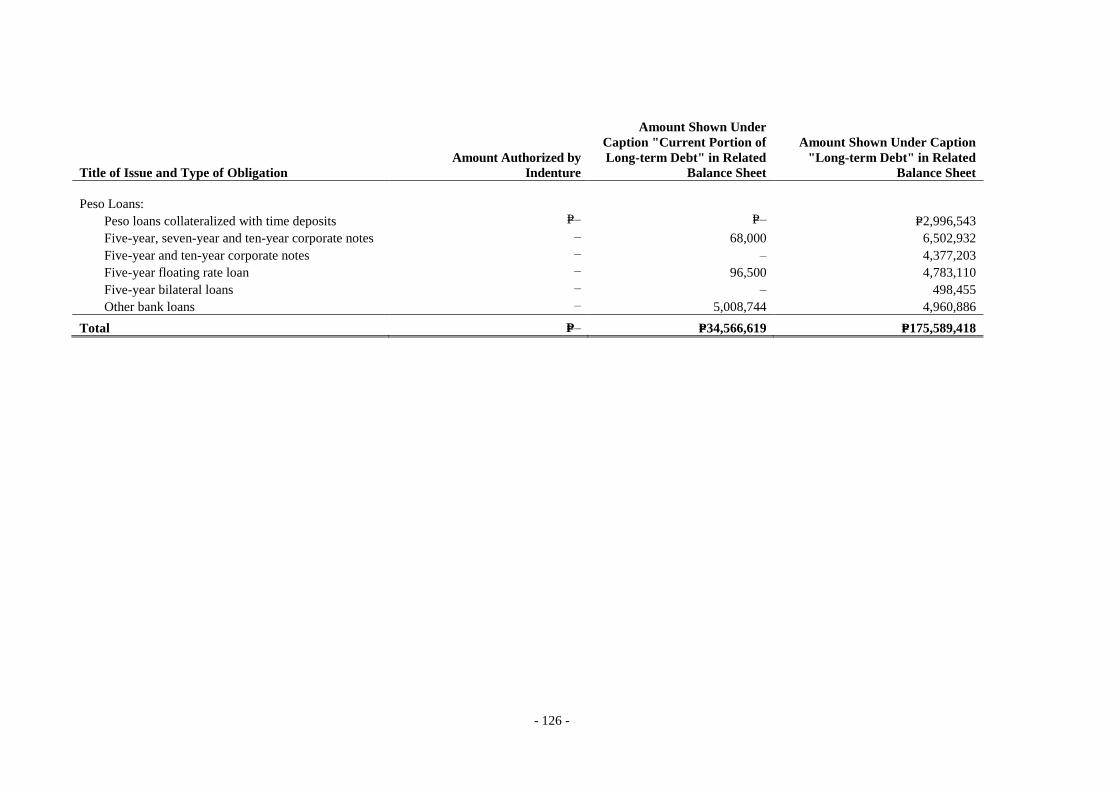
- 126 -
Title of Issue and Type of Obligation
Amount Authorized by
Indenture
Amount Shown Under
Caption "Current Portion of
Long-term Debt" in Related
Balance Sheet
Amount Shown Under Caption
"Long-term Debt" in Related
Balance Sheet
Peso Loans:
Peso loans collateralized with time deposits P=– P=– P=2,996,543
Five-year, seven-year and ten-year corporate notes – 68,000 6,502,932
Five-year and ten-year corporate notes – – 4,377,203
Five-year floating rate loan – 96,500 4,783,110
Five-year bilateral loans – – 498,455
Other bank loans – 5,008,744 4,960,886
Total P=– P=34,566,619 P=175,589,418

- 127 -
SM INVESTMENTS CORPORATION AND SUBSIDIARIES
SCHEDULE H - CAPITAL STOCK
FOR THE YEAR ENDED DECEMBER 31, 2013
Title of Issue
Number of Shares
Authorized
Number of Shares
Outstanding
Number of Shares
Reserved for Options,
Warrants,
Conversions, and
Other Rights
Number of Shares Held by
Affiliates
Directors,
Officers and
Principal
Stockholders Others
Common Stock 1,190,000,000 796,272,268 6,783,160 50,662,542 396,646,302 348,963,424

- 128 -
SM INVESTMENTS CORPORATION AND SUBSIDIARIES
COMPUTATION OF PUBLIC OWNERSHIP
AS OF DECEMBER 31, 2013
"% to total I/O shares" Number of Shares Number of Shares Issued and Outstanding (I/O) 796,272,268
Directors:
Henry Sy, Sr.
Indirect 0.40% 3,182,550
Teresita T. Sy
Direct 7.17% 57,085,450
Henry Sy, Jr.
Direct 7.34% 58,460,450
Harley T. Sy
Direct 7.35% 58,528,292
Jose T. Sio
Direct 0.00% 14
Vicente S. Perez, Jr.
Direct 0.00% 14
Ah Doo Lim
Indirect 0.00% 125
Joseph R. Higdon
Direct 0.00% 125
Subtotal 22.26% 177,257,020
(Forward)

- 129 -
"% to total I/O shares" Number of Shares Officers -
Ma. Ruby Ll. Cano
Indirect 0.00% 4,025
Corazon P. Guidote
Direct 0.00% 2,125
Subtotal 0.00% 6,150
Principal Stockholders:
Felicidad T. Sy
Direct 3.21% 25,522,060
Indirect 1.92% 15,208,113
Hans T. Sy
Direct 8.29% 65,960,450
Indirect 0.00% 9,071
Herbert T. Sy
Direct 8.28% 65,960,450
Elizabeth T. Sy
Direct 5.87% 46,715,484
Indirect 0.00% 7,504
Subtotal 27.57% 219,383,132
Affiliates:
Multi-Realty Development Corporation
Direct 0.00% 1,099
SM Prime Holdings, Inc.
Indirect 0.01% 97,403
Belle Corporation
Direct 0.00% 32,585
(Forward)
Syntrix Holdings Inc
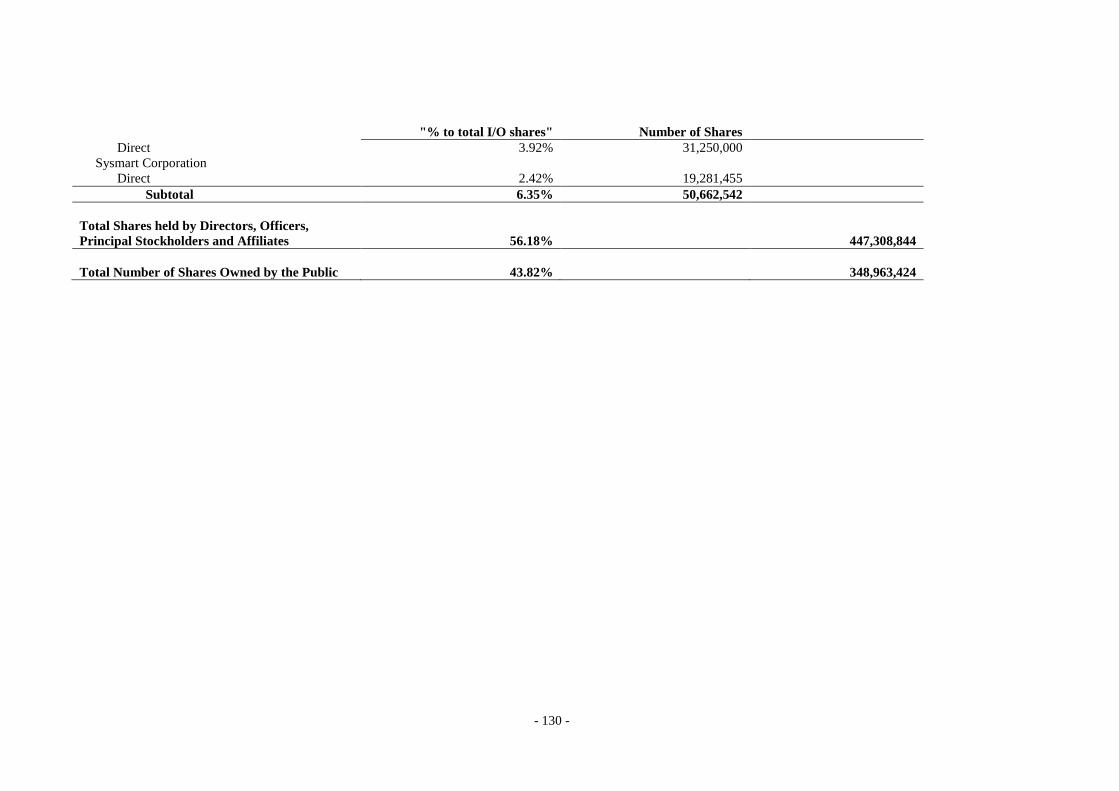
- 130 -
"% to total I/O shares" Number of Shares Direct 3.92% 31,250,000
Sysmart Corporation
Direct 2.42% 19,281,455
Subtotal 6.35% 50,662,542
Total Shares held by Directors, Officers,
Principal Stockholders and Affiliates 56.18% 447,308,844
Total Number of Shares Owned by the Public 43.82% 348,963,424

- 131 -
SM INVESTMENTS CORPORATION AND SUBSIDIARIES
FINANCIAL RATIOS - KEY PERFORMANCE INDICATORS
FOR THE YEARS ENDED DECEMBER 31, 2013 AND 2012
2013 2012
i. Current ratio Current assets 1.23 : 1 1.39 : 1
Current liabilities
ii. Debt-to-equity ratio - gross Total interest-bearing debt 52 : 48 54 : 46
Total equity attributable to equity holders of the parent + Total interest
bearing debt
Debt-to-equity ratio - net
Total interest-bearing debt less cash and cash equivalents excluding cash on
hand, time deposits, investments in bonds held for trading and available
for sale
37 : 63 33 : 67
Total equity attributable to equity holders of the parent + Total interest
bearing debt less cash and cash equivalents excluding cash on hand, time
deposits, investments in bonds held for trading and available for sale
iii. Asset to equity ratio Total assets 2.11 2.15
Total equity
iv. Interest rate coverage ratio Income from operations + Depreciation & Amortization
Interest paid 5.2 5.5
v. Return on assets Net income attributable to equity holders of the parent 4.6% 4.9%
Average assets
vi. Return on equity Net income attributable to equity holders of the parent
Average equity attributable to equity holders of the parent 13.5% 14.3%

- 132 -
RECONCILIATION OF RETAINED EARNINGS
AVAILABLE FOR DIVIDEND DECLARATION
As at December 31, 2013
(Amounts in Thousands)
SM Investments Corporation 10th Floor, One E-Com Center, Harbor Drive,
Mall of Asia Complex, CBP-1A, Pasay City 1300
Unappropriated RE, December 31, 2012
P=1,882,843
Adjustments to beginning unappropriated RE: (see prior
year RE reconciliation): (68,812)
Unappropriated RE, as adjusted to available for
dividend distribution, beginning 1,814,031
Net income during the period closed to Retained Earnings P=12,474,909
Less: Non-actual/unrealized income, net of tax
Rental income from straight-line amortization
in excess of rental payments 51,590
Add: Non-actual lossess
Actuarial loss as at January 1, 2013 recorded
as current year retirement expense 48,548
Net income actually earned/realized during the period
12,471,867
Add (Less):
Cash Dividends declared during the period (7,423,076)
Stock Dividends declared during the period (1,576,573)
Reversal of appropriations 8,000,000 (999,649)
Unappropriated RE, as adjusted to available for
dividend distribution, ending P=13,286,249
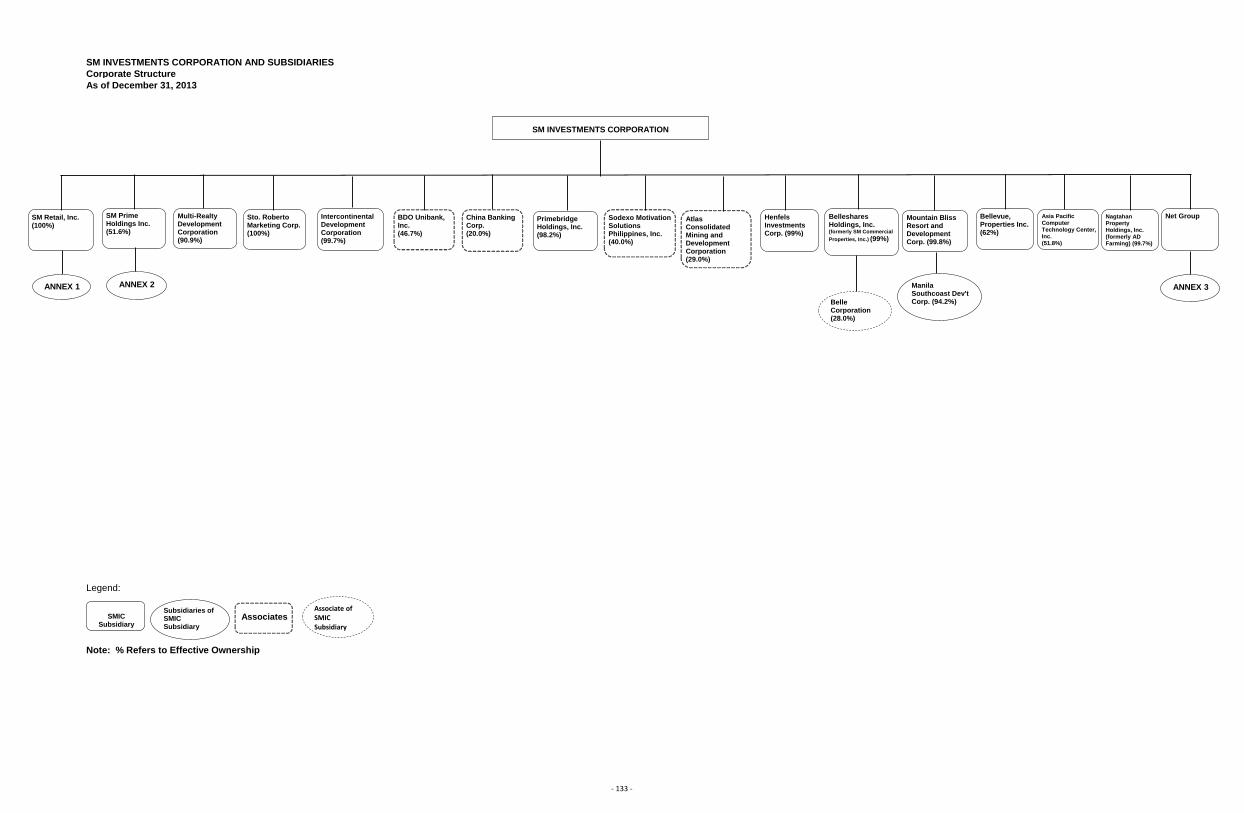
SM INVESTMENTS CORPORATION AND SUBSIDIARIES
Corporate Structure
As of December 31, 2013
Legend:
Note: % Refers to Effective Ownership
SM Retail, Inc. (100%)
Intercontinental Development Corporation (99.7%)
Belleshares Holdings, Inc. (formerly SM Commercial
Properties, Inc.) (99%)
Bellevue, Properties Inc. (62%)
Mountain Bliss Resort and Development Corp. (99.8%)
Sto. Roberto Marketing Corp. (100%)
Asia Pacific Computer Technology Center, Inc. (51.8%)
BDO Unibank, Inc. (46.7%)
China Banking Corp. (20.0%)
SM INVESTMENTS CORPORATION
Belle Corporation (28.0%)
ANNEX 1
ANNEX 2
SMIC
Subsidiary
Subsidiaries of SMIC Subsidiary
Associates Associate of SMIC Subsidiary
Atlas Consolidated Mining and Development Corporation (29.0%)
Primebridge Holdings, Inc. (98.2%)
Sodexo Motivation Solutions Philippines, Inc. (40.0%)
Henfels Investments Corp. (99%)
Manila Southcoast Dev't Corp. (94.2%)
Nagtahan Property Holdings, Inc. (formerly AD Farming) (99.7%)
Net Group
ANNEX 3
SM Prime Holdings Inc. (51.6%)
Multi-Realty Development Corporation (90.9%)
- 133 -

SM INVESTMENTS CORPORATION AND SUBSIDIARIES
Corporate Structure
Annex 1As of December 31, 2013
Legend:
Note: % Refers to Effective Ownership
SM Retail, Inc. (100%)
SM INVESTMENTS CORPORATION
Super Shopping
Market, Inc. (100%)
Sanford Marketing Corp. (99.6%)
Mainstream Business, Inc. (100%)
Market Strategic Firm, Inc. (100%)
Major Shopping Management Corporation (90%)
Metro Main Star Asia Corp. (99%)
Meridien Business Leader, Inc. (99%)
Mindanao Shopping Destination Corp. (75%)
My ShoppingLane Cebu Corporation (75%)
Fast Retailing Philippines, Inc. (25%)
Supervalue, Inc. (100%)
Hyperhome Corp. (99.8%)
Hyperfashion Corp. (99.8%)
Waltermart Supermarket, Inc. (51.0%)
HMS Development Corp. (99%)
Marketwatch Investments Co., Inc. (99.5%)
MH Holdings, Inc. (99.6%)
SMIC Subsidiary
Subsidiaries of SM Retail
Associate of SM Retail
Forever Agape and Glory, Inc. (60%)
LTBG Mgmt. Corp. (100%)
Accessories Management Corp. (100%)
CF_ Mgt.Corp. (100%)
MCLG Mgmt. Corp. (100%)
MF_ Mgt. Corp. (100%)
LF_ Mgt. Corp. (100%)
Manila Southern Associates, Inc. (100%)
Madison Shopping Plaza, Inc. (100%)
Mutli Stores Corporation (75%)
Mandurriao Star, Inc. (100%)
SM Mart, Inc. (65%)
Mercantile Stores Group, Inc. (99%)
Mindanao Shoppers Daily Destination Corp. (75%)
Metro Manila Shopping Mecca Corp. (100%)
- 134 -

SM INVESTMENTS CORPORATION AND SUBSIDIARIES
Corporate Structure
Annex 2
As of December 31, 2013
COMMERCIAL
Legend:
Note: % Refers to Effective Ownership
MALLS RESIDENTIAL LEISURE HOTELS AND CONVENTION
SM Prime Holdings Inc. (51.6%)
SM INVESTMENTS CORPORATION
Consolidated Prime Development Corp. (51.6%)
First Asia Realty Development Corp. (38.3%)
San Lazaro Holdings Corporation (51.6%)
Premier Southern Corp. (51.6%)
Premier Central Inc. (51.6%)
First Leisure Ventures Group Inc. (25.8%)
Affluent Capital Enterprises Limited (51.6%)
Mega Make Enterprises Limited (51.6%)
SM Land (China) Limited (51.6%)
Springfield Global Enterprises Limited (51.6%)
SMIC Subsidiary
Subsidiaries of SM Prime
Tagaytay Resort Development Corp. (51.5%)
Twenty Two Forty One Prop,
Inc. (51.1%)
SM Residences Corp. (51.1%)
Hotel Specialist (Tagaytay), Inc. (46.7%)
Hotel Specialist (Cebu), Inc. (51.5%)
Hotel Specialist (Manila), Inc. (51.5%)
Hotel Specialist (Davao), Inc. (51.5%)
Hotel Specialist (Pico de Loro), Inc. (51.6%)
SMX Convention Specialist Center (51.5%)
SM Hotels and Conventions Corp. (51.6%)
Lasconda Land Company, Inc. (51.1%)
Pico de Loro Beach and Country Club(51.5%)
Costa del Hamilo Inc. (51.6%)
Highlands Prime Inc. (51.5%)
Metro South Davao Property Corp. (51.1%)
Guadix Land, Corp. (51.1%)
SMDC HK Limited (51.1%)
SM Development Corp. (51.1%)
SM Synergy Property Holdings Corp. (51.1%)
Landfactors, Incorporated (51.1%)
Vancouver Lands, Inc. (51.1%)
Magenta Legacy, Inc. (51.6%)
Associated Development Corporation (51.6%)
SM Arena Complex Corp. (51.6%)
Prime Metroestate Inc. (71.0%)
Rappel Holdings Inc. (51.6%)
Southernpoint Properties Corp. (51.6%)
Simply Prestige Limited and Subsidiaries (51.6%)
CHAS Realty and Development Corporation (51.6%)
Summerhills Home Development Corp. (51.4%)
Joint Venture of SM Prime
Waltermart Mall (26.3%)
- 135 -

SM INVESTMENTS CORPORATION AND SUBSIDIARIES
Corporate Structure
Annex 3As of December 31, 2013
Legend:
Note: % Refers to Effective Ownership
Net Group
SM INVESTMENTS CORPORATION
SMIC Subsidiary
Cresent Park 14-678 Property Holdings,Inc. (40%)
14-678 Property Holdings, Inc. (90%)
Crescent Park 6-24 Property Holdings, Inc. (40%)
6-24 Property Holdings, Inc. (90%)
Crescent Park 18-2 Property Holdings, Inc. (40%)
18-2 Property Holdings, Inc. (90%)
Crescent Park 6-3 Property Holdings, Inc. (40%)
6-3 Property Holdings, Inc. (90%)
Crescent Park 19-1 Property Holdings, Inc. (40%)
19-1 Property Holdings, Inc. (90%)
- 136 -
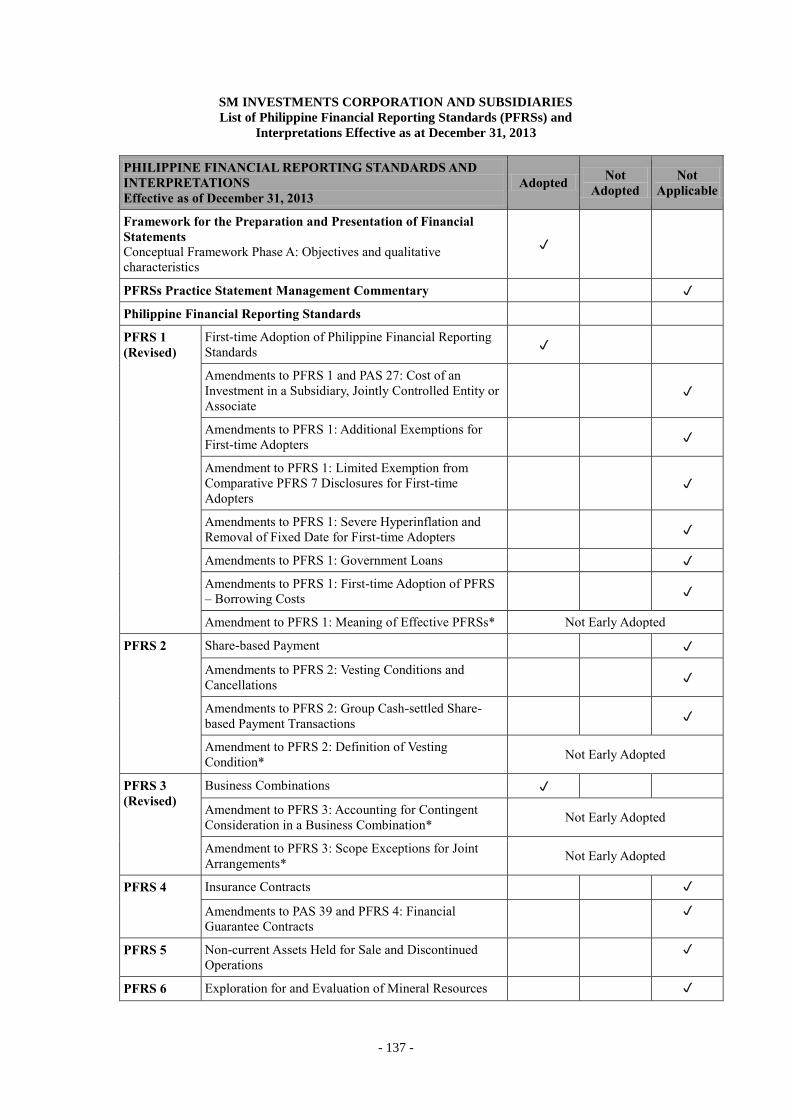
- 137 -
SM INVESTMENTS CORPORATION AND SUBSIDIARIES
List of Philippine Financial Reporting Standards (PFRSs) and
Interpretations Effective as at December 31, 2013
PHILIPPINE FINANCIAL REPORTING STANDARDS AND
INTERPRETATIONS
Effective as of December 31, 2013
Adopted Not
Adopted
Not
Applicable
Framework for the Preparation and Presentation of Financial
Statements
Conceptual Framework Phase A: Objectives and qualitative
characteristics
PFRSs Practice Statement Management Commentary
Philippine Financial Reporting Standards
PFRS 1
(Revised)
First-time Adoption of Philippine Financial Reporting
Standards
Amendments to PFRS 1 and PAS 27: Cost of an
Investment in a Subsidiary, Jointly Controlled Entity or
Associate
Amendments to PFRS 1: Additional Exemptions for
First-time Adopters
Amendment to PFRS 1: Limited Exemption from
Comparative PFRS 7 Disclosures for First-time
Adopters
Amendments to PFRS 1: Severe Hyperinflation and
Removal of Fixed Date for First-time Adopters
Amendments to PFRS 1: Government Loans
Amendments to PFRS 1: First-time Adoption of PFRS
– Borrowing Costs
Amendment to PFRS 1: Meaning of Effective PFRSs* Not Early Adopted
PFRS 2 Share-based Payment
Amendments to PFRS 2: Vesting Conditions and
Cancellations
Amendments to PFRS 2: Group Cash-settled Share-
based Payment Transactions
Amendment to PFRS 2: Definition of Vesting
Condition* Not Early Adopted
PFRS 3
(Revised)
Business Combinations
Amendment to PFRS 3: Accounting for Contingent
Consideration in a Business Combination* Not Early Adopted
Amendment to PFRS 3: Scope Exceptions for Joint
Arrangements* Not Early Adopted
PFRS 4 Insurance Contracts
Amendments to PAS 39 and PFRS 4: Financial
Guarantee Contracts
PFRS 5 Non-current Assets Held for Sale and Discontinued
Operations
PFRS 6 Exploration for and Evaluation of Mineral Resources
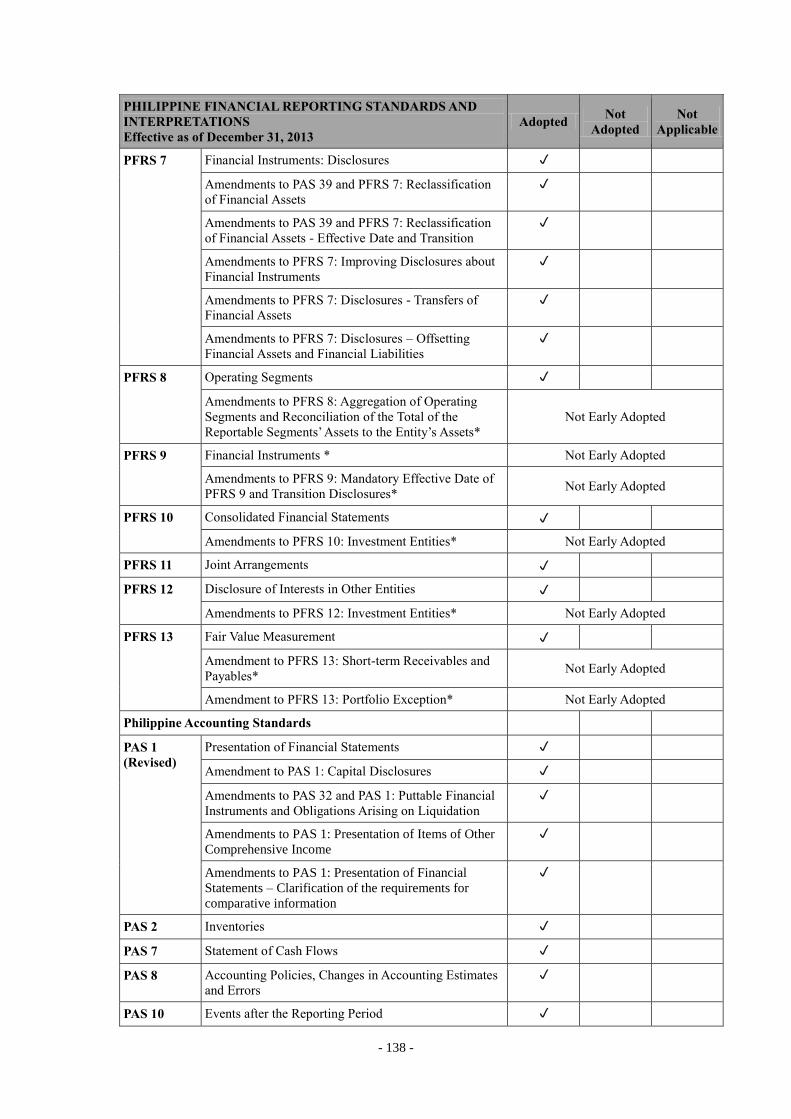
- 138 -
PHILIPPINE FINANCIAL REPORTING STANDARDS AND
INTERPRETATIONS
Effective as of December 31, 2013
Adopted Not
Adopted
Not
Applicable
PFRS 7
Financial Instruments: Disclosures
Amendments to PAS 39 and PFRS 7: Reclassification
of Financial Assets
Amendments to PAS 39 and PFRS 7: Reclassification
of Financial Assets - Effective Date and Transition
Amendments to PFRS 7: Improving Disclosures about
Financial Instruments
Amendments to PFRS 7: Disclosures - Transfers of
Financial Assets
Amendments to PFRS 7: Disclosures – Offsetting
Financial Assets and Financial Liabilities
PFRS 8 Operating Segments
Amendments to PFRS 8: Aggregation of Operating
Segments and Reconciliation of the Total of the
Reportable Segments’ Assets to the Entity’s Assets*
Not Early Adopted
PFRS 9 Financial Instruments * Not Early Adopted
Amendments to PFRS 9: Mandatory Effective Date of
PFRS 9 and Transition Disclosures* Not Early Adopted
PFRS 10 Consolidated Financial Statements
Amendments to PFRS 10: Investment Entities* Not Early Adopted
PFRS 11 Joint Arrangements
PFRS 12 Disclosure of Interests in Other Entities
Amendments to PFRS 12: Investment Entities* Not Early Adopted
PFRS 13 Fair Value Measurement
Amendment to PFRS 13: Short-term Receivables and
Payables* Not Early Adopted
Amendment to PFRS 13: Portfolio Exception* Not Early Adopted
Philippine Accounting Standards
PAS 1
(Revised)
Presentation of Financial Statements
Amendment to PAS 1: Capital Disclosures
Amendments to PAS 32 and PAS 1: Puttable Financial
Instruments and Obligations Arising on Liquidation
Amendments to PAS 1: Presentation of Items of Other
Comprehensive Income
Amendments to PAS 1: Presentation of Financial
Statements – Clarification of the requirements for
comparative information
PAS 2 Inventories
PAS 7 Statement of Cash Flows
PAS 8 Accounting Policies, Changes in Accounting Estimates
and Errors
PAS 10 Events after the Reporting Period
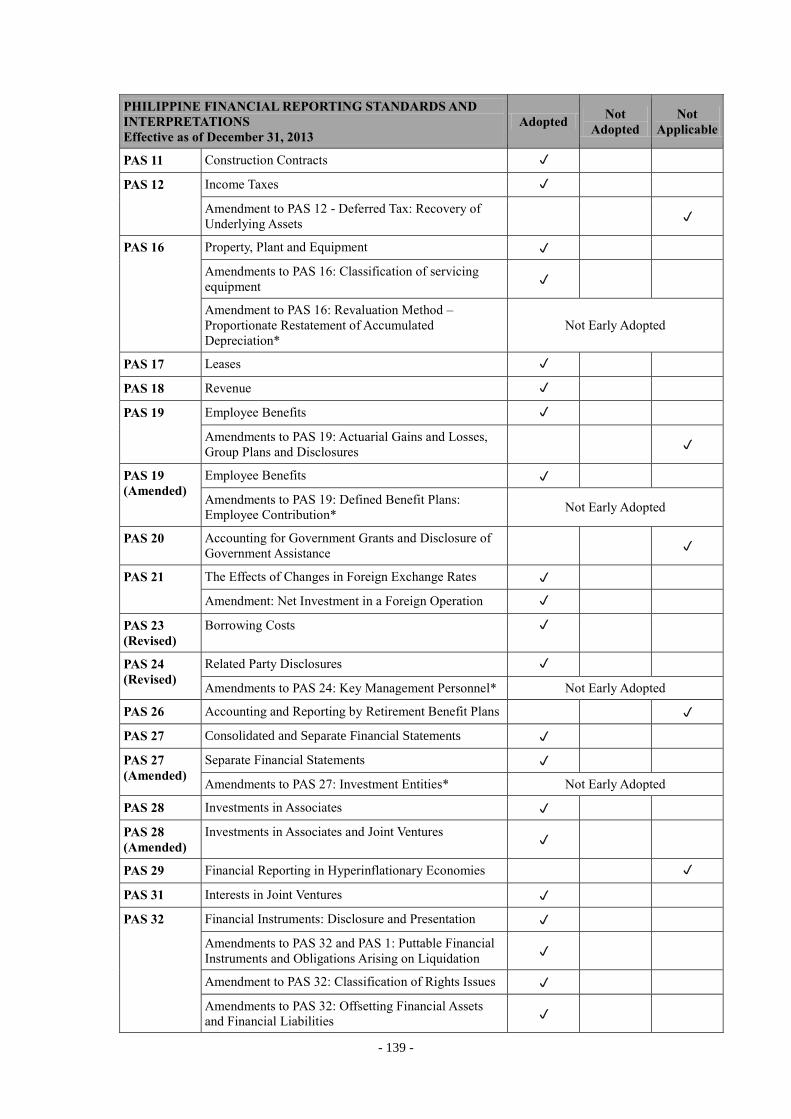
- 139 -
PHILIPPINE FINANCIAL REPORTING STANDARDS AND
INTERPRETATIONS
Effective as of December 31, 2013
Adopted Not
Adopted
Not
Applicable
PAS 11 Construction Contracts
PAS 12 Income Taxes
Amendment to PAS 12 - Deferred Tax: Recovery of
Underlying Assets
PAS 16
Property, Plant and Equipment
Amendments to PAS 16: Classification of servicing
equipment
Amendment to PAS 16: Revaluation Method –
Proportionate Restatement of Accumulated
Depreciation*
Not Early Adopted
PAS 17 Leases
PAS 18 Revenue
PAS 19 Employee Benefits
Amendments to PAS 19: Actuarial Gains and Losses,
Group Plans and Disclosures
PAS 19
(Amended)
Employee Benefits
Amendments to PAS 19: Defined Benefit Plans:
Employee Contribution* Not Early Adopted
PAS 20 Accounting for Government Grants and Disclosure of
Government Assistance
PAS 21 The Effects of Changes in Foreign Exchange Rates
Amendment: Net Investment in a Foreign Operation
PAS 23
(Revised)
Borrowing Costs
PAS 24
(Revised)
Related Party Disclosures
Amendments to PAS 24: Key Management Personnel* Not Early Adopted
PAS 26 Accounting and Reporting by Retirement Benefit Plans
PAS 27 Consolidated and Separate Financial Statements
PAS 27
(Amended)
Separate Financial Statements
Amendments to PAS 27: Investment Entities* Not Early Adopted
PAS 28 Investments in Associates
PAS 28
(Amended)
Investments in Associates and Joint Ventures
PAS 29 Financial Reporting in Hyperinflationary Economies
PAS 31 Interests in Joint Ventures
PAS 32 Financial Instruments: Disclosure and Presentation
Amendments to PAS 32 and PAS 1: Puttable Financial
Instruments and Obligations Arising on Liquidation
Amendment to PAS 32: Classification of Rights Issues
Amendments to PAS 32: Offsetting Financial Assets
and Financial Liabilities

- 140 -
PHILIPPINE FINANCIAL REPORTING STANDARDS AND
INTERPRETATIONS
Effective as of December 31, 2013
Adopted Not
Adopted
Not
Applicable
Amendments to PAS 32: Tax effect of distribution to
holders of equity instruments
Amendments to PAS 32: Offsetting Financial Assets
and Financial Liabilities* Not Early Adopted
PAS 33 Earnings per Share
PAS 34 Interim Financial Reporting
Amendments to PAS 34: Interim financial reporting and
segment information for total assets and liabilities
PAS 36 Impairment of Assets
Amendments to PAS 36: Recoverable Amount
Disclosures for Non-Financial Assets* Not Early Adopted
PAS 37 Provisions, Contingent Liabilities and Contingent
Assets
PAS 38 Intangible Assets
Amendments to PAS 38: Revaluation Method –
Proportionate Restatement of Accumulated
Amortization*
Not Early Adopted
PAS 39
Financial Instruments: Recognition and Measurement
Amendments to PAS 39: Transition and Initial
Recognition of Financial Assets and Financial
Liabilities
Amendments to PAS 39: Cash Flow Hedge Accounting
of Forecast Intragroup Transactions
Amendments to PAS 39: The Fair Value Option
Amendments to PAS 39 and PFRS 4: Financial
Guarantee Contracts
Amendments to PAS 39 and PFRS 7: Reclassification
of Financial Assets
Amendments to PAS 39 and PFRS 7: Reclassification
of Financial Assets – Effective Date and Transition
Amendments to Philippine Interpretation IFRIC–9 and
PAS 39: Embedded Derivatives
Amendment to PAS 39: Eligible Hedged Items
Amendments to PAS 39: Novation of Derivatives and
Continuation of Hedge Accounting* Not Early Adopted
PAS 40 Investment Property
Amendments to PAS 40: Clarifying the
Interrelationship between PFRS 3 and PAS 40 when
Classifying Property as Investment Property or Owner-
Occupied Property*
Not Early Adopted
PAS 41 Agriculture
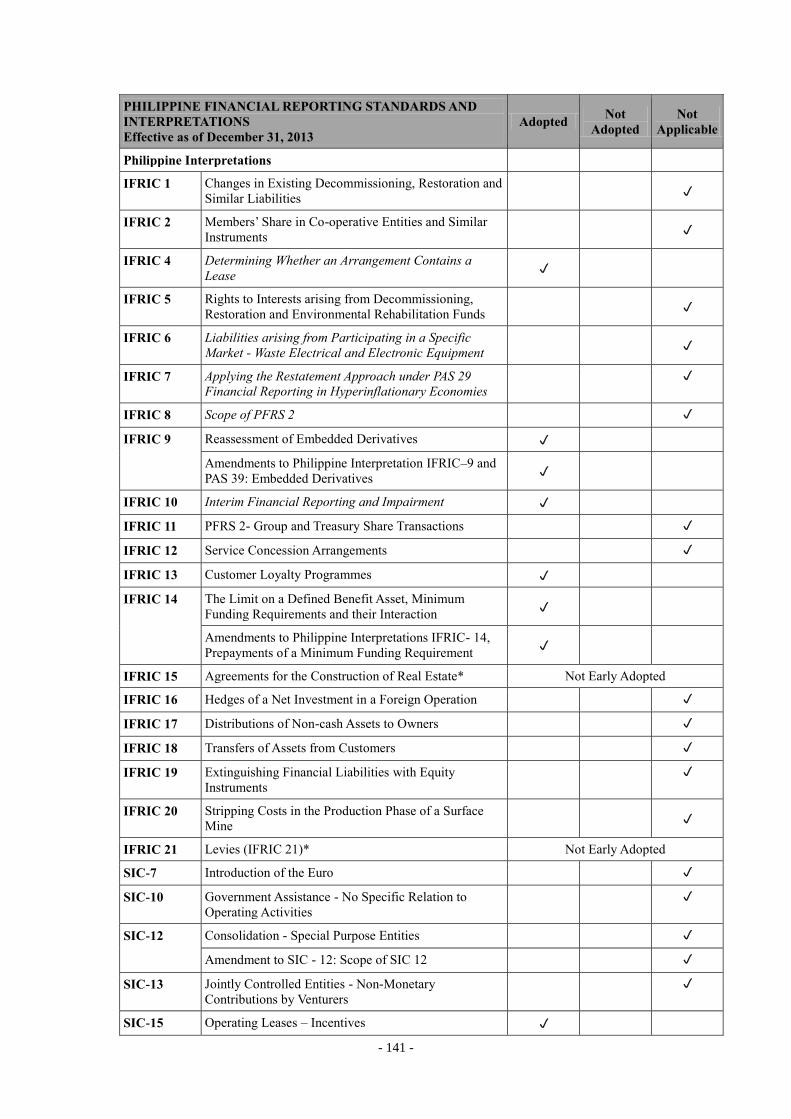
- 141 -
PHILIPPINE FINANCIAL REPORTING STANDARDS AND
INTERPRETATIONS
Effective as of December 31, 2013
Adopted Not
Adopted
Not
Applicable
Philippine Interpretations
IFRIC 1 Changes in Existing Decommissioning, Restoration and
Similar Liabilities
IFRIC 2 Members’ Share in Co-operative Entities and Similar
Instruments
IFRIC 4 Determining Whether an Arrangement Contains a
Lease
IFRIC 5 Rights to Interests arising from Decommissioning,
Restoration and Environmental Rehabilitation Funds
IFRIC 6 Liabilities arising from Participating in a Specific
Market - Waste Electrical and Electronic Equipment
IFRIC 7 Applying the Restatement Approach under PAS 29
Financial Reporting in Hyperinflationary Economies
IFRIC 8 Scope of PFRS 2
IFRIC 9 Reassessment of Embedded Derivatives
Amendments to Philippine Interpretation IFRIC–9 and
PAS 39: Embedded Derivatives
IFRIC 10 Interim Financial Reporting and Impairment
IFRIC 11 PFRS 2- Group and Treasury Share Transactions
IFRIC 12 Service Concession Arrangements
IFRIC 13 Customer Loyalty Programmes
IFRIC 14 The Limit on a Defined Benefit Asset, Minimum
Funding Requirements and their Interaction
Amendments to Philippine Interpretations IFRIC- 14,
Prepayments of a Minimum Funding Requirement
IFRIC 15 Agreements for the Construction of Real Estate* Not Early Adopted
IFRIC 16 Hedges of a Net Investment in a Foreign Operation
IFRIC 17 Distributions of Non-cash Assets to Owners
IFRIC 18 Transfers of Assets from Customers
IFRIC 19 Extinguishing Financial Liabilities with Equity
Instruments
IFRIC 20 Stripping Costs in the Production Phase of a Surface
Mine
IFRIC 21 Levies (IFRIC 21)* Not Early Adopted
SIC-7 Introduction of the Euro
SIC-10 Government Assistance - No Specific Relation to
Operating Activities
SIC-12 Consolidation - Special Purpose Entities
Amendment to SIC - 12: Scope of SIC 12
SIC-13 Jointly Controlled Entities - Non-Monetary
Contributions by Venturers
SIC-15 Operating Leases – Incentives

- 142 -
PHILIPPINE FINANCIAL REPORTING STANDARDS AND
INTERPRETATIONS
Effective as of December 31, 2013
Adopted Not
Adopted
Not
Applicable
SIC-25 Income Taxes - Changes in the Tax Status of an Entity
or its Shareholders
SIC-27 Evaluating the Substance of Transactions Involving the
Legal Form of a Lease
SIC-29 Service Concession Arrangements: Disclosures
SIC-31 Revenue - Barter Transactions Involving Advertising
Services
SIC-32 Intangible Assets - Web Site Costs
* Standards and interpretations which will become effective subsequent to December 31, 2013.