sec 02 climate 2016-03-31
TRANSCRIPT
Section 2: Climate
Climate Impacts Group P a g e | 2-‐1 College of the Environment, University of Washington
SECTION 2 How Is Puget Sound’s Climate Changing?
Observed Changes
OBSERVED The Puget Sound regionA has experienced long-‐term warming, a lengthening of the frost-‐free season, and more frequent nighttime heat waves.
• Air temperatures are increasing in the Puget Sound region. The lowland areas surrounding Puget Sound warmed about +1.3°F (range: +0.7°F to +1.9°F)B between 1895 and 2014, with statistically significant warming occurring in all seasons except for spring.C,D,1 All but six of the years from 1980 to 2014 were warmer than the 20th century average (Figure 2-‐1, Table 2-‐1).1 This trend is consistent with the observed warming over the Pacific Northwest as a whole.2,3
A Throughout this report, the term “Puget Sound” is used to describe the marine waters of Puget Sound and the Strait
of Juan de Fuca, extending to its outlet near Neah Bay. The term “Puget Sound region” is used to describe the entire watershed, including all land areas that ultimately drain into the waters of Puget Sound (see “How to Read this Report”).
B The range shows the 95% confidence limits for the trend estimate. C In this section, trends are only reported if they are statistically significant at or above the 95% confidence level. All
trends are reported for the full length of the available observed record. D These trends were determined using data from the U.S. Climate Divisional Dataset, developed by the National Centers
for Environmental Information (NCEI). NCEI provides long-‐term climate summaries for each of the country’s 344 climate divisions. Results for the “Puget Sound Lowlands” climate division (see inset in Figure 2-‐1) were used in the present analysis, which includes all of the low-‐lying land areas surrounding Puget Sound, where most of the historical weather observations are concentrated. For more information, see: http://www.ncdc.noaa.gov/monitoring-‐references/maps/us-‐climate-‐divisions.php
Puget Sound is experiencing a suite of long-‐term changes that are consistent with those observed globally as a result of human-‐caused climate change. These include increasing air temperatures, a longer frost-‐free season, nighttime warming, and a possible increase in the intensity of heavy rainfall events. Continued increases in average annual and seasonal Puget Sound air temperatures are projected as a result of climate change, as well as increases in extreme heat. Projected changes in annual precipitation are generally small, although summer precipitation is projected to decrease and heavy rainfall events are projected to become more severe. Natural variability can have a strong effect on trends – as evidenced by recent regional cooling – and will continue to influence shorter-‐term (up to several decades) climate trends in the future.
Section 2: Climate
Climate Impacts Group P a g e | 2-‐2 College of the Environment, University of Washington
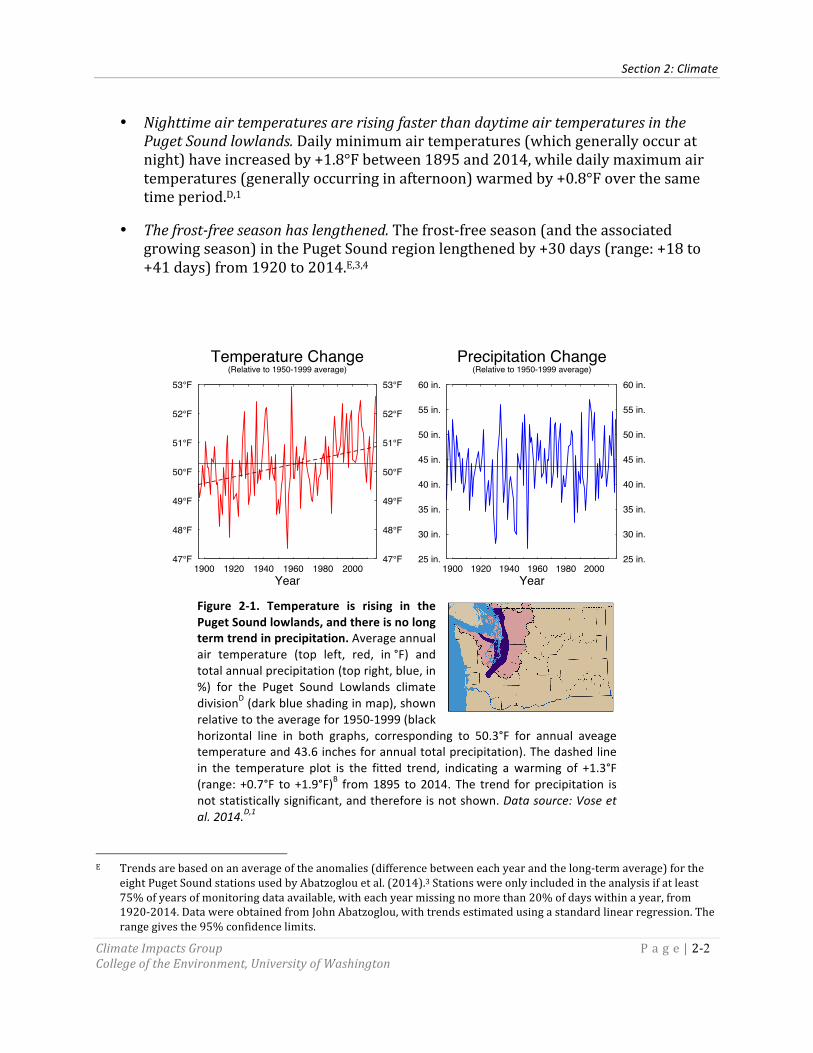
• Nighttime air temperatures are rising faster than daytime air temperatures in the Puget Sound lowlands. Daily minimum air temperatures (which generally occur at night) have increased by +1.8°F between 1895 and 2014, while daily maximum air temperatures (generally occurring in afternoon) warmed by +0.8°F over the same time period.D,1
• The frost-‐free season has lengthened. The frost-‐free season (and the associated growing season) in the Puget Sound region lengthened by +30 days (range: +18 to +41 days) from 1920 to 2014.E,3,4
Figure 2-‐1. Temperature is rising in the Puget Sound lowlands, and there is no long term trend in precipitation. Average annual air temperature (top left, red, in °F) and total annual precipitation (top right, blue, in %) for the Puget Sound Lowlands climate divisionD (dark blue shading in map), shown relative to the average for 1950-‐1999 (black horizontal line in both graphs, corresponding to 50.3°F for annual aveage temperature and 43.6 inches for annual total precipitation). The dashed line in the temperature plot is the fitted trend, indicating a warming of +1.3°F (range: +0.7°F to +1.9°F)B from 1895 to 2014. The trend for precipitation is not statistically significant, and therefore is not shown. Data source: Vose et al. 2014.D,1
E Trends are based on an average of the anomalies (difference between each year and the long-‐term average) for the
eight Puget Sound stations used by Abatzoglou et al. (2014).3 Stations were only included in the analysis if at least 75% of years of monitoring data available, with each year missing no more than 20% of days within a year, from 1920-‐2014. Data were obtained from John Abatzoglou, with trends estimated using a standard linear regression. The range gives the 95% confidence limits.
1900 1920 1940 1960 1980 200047°F
48°F
49°F
50°F
51°F
52°F
53°F
47°F
48°F
49°F
50°F
51°F
52°F
53°F
Year
Temperature Change(Relative to 1950-1999 average)
1900 1920 1940 1960 1980 200025 in.
30 in.
35 in.
40 in.
45 in.
50 in.
55 in.
60 in.
25 in.
30 in.
35 in.
40 in.
45 in.
50 in.
55 in.
60 in.
Year
Precipitation Change(Relative to 1950-1999 average)

Section 2: Climate
Climate Impacts Group P a g e | 2-‐3 College of the Environment, University of Washington
• Warm nights have become more frequent, but daytime heat waves have not changed. Nighttime heat events have become more frequent west of the Cascade Mountains in Oregon and WashingtonF (1901-‐2009).5 No significant trend has been found for daytime heat events.
• Short-‐term trends can differ substantially from the long-‐term trend. The Puget Sound region’s highly variable climate often results in short-‐term cooling trends, as well as warming trends larger than the long-‐term average (Figure 2-‐1, Table 2-‐1). The cooling observed from about 2000 to 2011, for example, is similar to cooling observed at other times in the 20th century, despite overall long-‐term warming.
• Long-‐term air temperature trends are affected by natural variability, although there is continued debate about the extent of its influence. Natural climate variability has a strong influence on trends: one previous study estimated that about half of the observed increase in air temperature in the northern hemisphere (1900-‐1990) is a result of random natural variability.6 A more recent study has presented evidence that over 80% of the observed trend in surface air temperature for Washington, Oregon, and California (1900-‐2012) can be explained by changes in atmospheric circulation (specifically, variations in surface pressure and winds), which may or may not result from human-‐induced warming.7 Others have repeated the analysis using different datasets and found no evidence for the long-‐term change in circulation.8,9
• Measurement biases can affect local trends, but will have a much smaller effect on regional trends. Estimates of air temperature changes over time can be affected by changes in the location, the number of measurements made, and in the instruments used to make the measurements. The air temperature datasets reported here include corrections for these factors.10 Even with these corrections, trend estimates can still be affected by measurement biases, and the effect will be greater when considering smaller regions or areas with sparse observations. Although potentially important for individual stations, the effect on regional average trend estimates is likely to be small: one published study analyzed annual average air temperature trends for the contiguous U.S., and found that these issues had a very small effect on long-‐term trends, and that the bias actually led to an underestimate of the warming trend.11
OBSERVED There has been no discernible long-‐term trend in precipitation for the Puget Sound region.
• Year-‐to-‐year variability in total precipitation is large compared to long-‐term trends. Natural variability has a large influence on regional precipitation, causing ongoing fluctuations between wet years and dry years and wet decades and dry decades.
F Many characteristics of Puget Sound’s climate and climate vulnerabilities are similar to those of the broader Pacific
Northwest region. Results for Puget Sound are expected to generally align with those for western Oregon and Washington, and in some instances the greater Pacific Northwest, with potential for some variation at any specific location.

Section 2: Climate
Climate Impacts Group P a g e | 2-‐4 College of the Environment, University of Washington
• Spring precipitation is increasing, but no other trends are statistically significant. Seasonal and annual precipitation trends are generally not statistically significant, and in all cases are smaller than natural year-‐to-‐year variations. The one exception is spring (Mar-‐May) precipitation, which increased by +27% in the Puget Sound lowlands, from 1895 to 2014.D,1
• Modest increases in heavy rainfall have been documented in Western Washington. Most studies find increases in both the frequency and intensity of heavy precipitation in Western Washington.12,13,14 For example, one study found a statistically-‐significant +23% increase in the annual-‐maximum 48-‐hour event for the Puget Sound region (1981-‐2005 relative to 1956-‐1980).14 Not all trends are statistically significant – results depend on the dates and methods of the analysis.
Natural Climate Variability
NATURAL VARIABILITY Large-‐scale fluctuations in weather patterns and ocean conditions drive short-‐term (up to several decades) natural variability in Puget Sound’s climate. Two of the dominant patterns are the El Niño – Southern Oscillation (ENSO, otherwise known as El Niño and La Niña) and the Pacific Decadal Oscillation (PDO). These climate patterns are associated with variations in ocean temperatures, local surface winds, air temperatures, and precipitation.15 ENSO and PDO are just two examples: other fluctuations in weather patterns can have an effect on the climate of Puget Sound.
! ENSO and PDO are both large-‐scale patterns of climate variability in which sea surface temperatures over large parts of the Pacific Ocean are unusually warm in some places and unusually cool in others. The two patterns are not entirely independent.15,16 The main difference between them is that for ENSO, the largest changes in ocean temperatures are in the tropics, while the associated changes in the North Pacific are much smaller. The opposite is true for the PDO: larger changes in the North Pacific, smaller changes in the tropics. In addition, typical ENSO events are more seasonal and much shorter in duration: ENSO events usually persist for 6-‐18 months, whereas PDO events can persist for 20-‐30 years.17
• Warm ENSO (El Niño) and warm PDO events generally increase the likelihood of warmer coastal ocean and higher air temperatures in winter for the Puget Sound region. Conversely, cool ENSO (La Niña) and cool PDO events generally produce cooler winters. Precipitation is not strongly related to ENSO and PDO events.15,18,19,20
• It is not known how ENSO might change with warming. Some climate models project increases while others project decreases in the frequency of ENSO events. Global model projections of ocean surface temperature show a pattern of change that resembles the changes observed during an El Niño. However, the

Section 2: Climate
Climate Impacts Group P a g e | 2-‐5 College of the Environment, University of Washington
magnitude of the warming due to climate change is much lower. In addition, the global patterns of temperature and precipitation resulting from global warming (e.g., the associated changes in Puget Sound’s climate) do not resemble those observed in El Niño years.21
• Recent research has found that a new type of El Niño, the so-‐called “El Niño Modoki” (or “Central Pacific El Niño”), has become more common in the 20th century, and is projected to become still more common in the 21st century. The changes in large-‐scale weather patterns brought on by an El Niño Modoki, including those affecting Puget Sound’s climate, are very different than those that occur with a typical El Niño event.G,22
Projected Changes
PROJECTED The Puget Sound region is projected to warm rapidly during the 21st century. Prior to mid-‐century, the projected increase in air temperatures is about the same for all greenhouse gas scenarios, a result of the fact that a certain amount of warming is already “locked in” due to past emissions. After about 2050, projected warming depends on the amount of greenhouse gases emitted globally in the coming decades (see Section 1).23,24
• All scenarios project warming. Warming is projected to continue throughout the 21st century (Figure 2-‐2, Table 2-‐2). For the 2050s (2040-‐2069, relative to 1970-‐1999), annual average air temperature is projected to rise +4.2°F to +5.5°F, on average, for a low (RCP 4.5) and a high (RCP 8.5) greenhouse gas scenario.H,I,J Much higher warming is possible after mid-‐century (Figure 2-‐2, Table 2-‐2).23 Lower emissions of greenhouse gases will result in less warming.25
• Warming is projected for all seasons.K The projected increase in summer air temperature is greater than for other seasons.23
G Based on an analysis of 6 global climate model projections and a moderate (A1b) greenhouse gas scenario. H Greenhouse gas scenarios were developed by climate modeling centers for use in modeling global and regional
climate impacts. These are described in the text as follows: "very low" refers to the RCP 2.6 scenario; "low" refers to RCP 4.5 or SRES B1; "moderate” refers to RCP 6.0 or SRES A1B; and "high" refers to RCP 8.5, SRES A2, or SRES A1FI – descriptors are based on cumulative emissions by 2100 for each scenario. See Section 1 for details.
I Greenhouse gas scenarios used in this report generally range from a low (RCP 4.5) to a high (RCP 8.5) greenhouse gas scenario (both of which are used in the recent IPCC report,27 see Section 1). The implications of the lowest greenhouse gas scenario – RCP 2.6, which assumes aggressive reductions in emissions – are not discussed in the text of this section because there are no published projections specific to the Puget Sound region that are based on this scenario.
J Projections stem from 10 global climate model projections, based on both a low (RCP 4.5) and a high (RCP 8.5) greenhouse gas scenario. The 10 global climate models were selected for their ability to accurately represent the climate of the Pacific Northwest.25
K Unless otherwise noted, seasons are defined as follows in this report: Winter (December-‐February), Spring (March-‐May), Summer (June-‐August), Fall (September-‐October).

Section 2: Climate
Climate Impacts Group P a g e | 2-‐6 College of the Environment, University of Washington
Figure 2-‐2. All scenarios project warming in the Puget Sound region for the 21st century; projected changes in annual precipitation are small compared to year-‐to-‐year variability. The graphs show average yearly air temperature and precipitation for the Puget Sound region, relative to the average for 1950-‐1999 (horizontal gray line, corresponding to an annual average temperature of 44°F and an annual total precipitation of 78 inches). The black line shows the average simulated air temperature or precipitation for 1950–2005, based on the individual model results indicated by the thin grey lines. The thick colored lines show the average among model projections for two emissions scenarios (low: RCP 4.5, and high: RCP 8.5 – see Section 1), while the thin colored lines show individual model projections for each scenario. Data source: Downscaled climate projections developed by Abatzoglou and Brown (2011).26,23,27
• More extreme heat is likely, although the increase may be moderated by changes in weather patterns. There is strong agreement among climate models that extreme heat events will become more frequent while extreme cold events will become less frequent.23,24 Recent research has suggested that changes in atmospheric circulation will cause heat waves to increase less rapidly (in terms of both the frequency and intensity of heat events) in coastal areas such as the Puget Sound region.28,29
• Ongoing variability will continue to play a role in regional climate. Natural variability will remain an important feature of global and regional climate, at times amplifying or counteracting the long-‐term trends caused by rising greenhouse gas emissions. Important modes of natural variability for the Puget Sound region include the El Niño/Southern Oscillation (ENSO, otherwise known as El Niño and La Niña) and the Pacific Decadal Oscillation (PDO). Current research is inconclusive as to how ENSO and other modes of climate variability may change as a result of warming (see
Historical
Low Emissions (RCP 4.5)
High Emissions (RCP 8.5)
1950 1975 2000 2025 2050 2075 2100
0°F
5°F
10°F
15°F
0°F
5°F
10°F
15°F
Year
Temperature Difference(Relative to 1950−1999 average)
Year
Precipitation Change(Relative to 1950−1999 average)
1950 1975 2000 2025 2050 2075 2100
−40%
−20%
0%
20%
40%
60%
−40%
−20%
0%
20%
40%
60%

Section 2: Climate
Climate Impacts Group P a g e | 2-‐7 College of the Environment, University of Washington
Section 6).30,31
• The projected warming for the Puget Sound region is large compared to year-‐to-‐year variability. The Puget Sound region is likely to regularly experience average annual air temperatures by mid-‐century that exceed what was observed in the 20th century.L,23
PROJECTED Changes in annual and fall, winter, and spring precipitation will continue to be primarily driven by year-‐to-‐year variations rather than long-‐term trends. All models project a decline in summer precipitation for the Puget Sound region.
• Small changes in annual precipitation are projected. Projected changes in total annual precipitation are small (relative to historical variability)M and show increases or decreases depending on models. The projected changes for the 2050s (2040-‐2069, relative to 1970-‐1999) range from a decline of −2% to an increase of +13%.J,23
• Summer precipitation is projected to decline. In contrast to annual precipitation, all scenarios project drier summers (June-‐August),K for the Puget Sound region.25 Models project a decline of −22%, on average, for the 2050s (2040-‐2069, relative to 1970-‐1999) for both a low and a high greenhouse gas scenario.J,23 One individual model projection shows a −50% decrease in summer precipitation. Because only about 10% of annual precipitation falls in this season, these reductions would not represent a large change in rainfall. However, summer rains help reduce both municipal and agricultural water demand at a time when water availability is limited.
• Projected changes in fall, winter, and spring precipitation are mixed. Although some models project decreases, a majority of models project increases in winter, spring, and fall precipitation for the 2050s (2040-‐2069, relative to 1970-‐1999), ranging from +2 to +11%, on average.J,23
• Winter precipitation extremes are projected to increase. Heavy rainfall events – so-‐called “Atmospheric River” events – are expected to become more severe. Global models project that the heaviest 24-‐hour rain events in western Oregon and WashingtonF will intensify by +22%, on average, by the 2080s (2070-‐2099, relative to 1970-‐1999). These high intensity events are also projected to occur more frequently: occurring about seven days per year (range: four to nine days per year)
L Specifically, all scenarios project that, by mid-‐century (2040-‐2069), average annual air temperature will be warmer
than the warmest year historically (1950-‐1999). M Year-‐to-‐year variations in precipitation are about ±10 to 15%, on average.
Section 2: Climate
Climate Impacts Group P a g e | 2-‐8 College of the Environment, University of Washington
by the 2080s in comparison to two days per year historically.N,32 Another study evaluating extreme rainfall projections for the Sea-‐Tac weather station reported similar results.14
• Research is lacking regarding the effect of climate change on thunderstorms and lightning in the Puget Sound region. Thunderstorms are rare in the Puget Sound region due to cold ocean temperatures and warm upper air. Climate change results in competing effects: reductions in summer precipitation may cause thunderstorm activity to decrease, while increased land surface temperatures may trigger more thunderstorms. Changes in atmospheric circulation could also affect thunderstorm activity.33,34 It is not known how these effects will combine to affect the frequency and intensity of thunderstorms.
• Projected shifts in the storm track are small. Possible increases in variability in the speed or position of the jet stream are speculative and may not significantly affect precipitation in the Puget Sound region. Warming is expected to cause the storm tracks to shift towards the poles, and possibly alter the frequency and magnitude of high and low pressure events. The climate model projections used in IPCC 201326 project a northward shift of about 1° latitude in the average position of the North Pacific storm track – this is a small shift and would not substantially alter the precipitation reaching the Puget Sound region.35 Similarly, climate models do not project a change in wind speed or the strength of low pressure systems. Although some studies suggest that warming will result in a “wavier” (i.e., more variable) storm track,35,36,37 this is considered highly speculative. The behavior of the jet stream is governed by many factors; understanding how these combine to drive changes in its behavior is still an active area of research.38,39 In addition, it is unclear how such changes might affect the Puget Sound region.40
Although the projected change in annual and seasonal precipitation is smaller than historic variability, the change in heavy precipitation is not. Projected changes in annual and seasonal precipitation are generally small, throughout the 21st century, compared to the variability in precipitation resulting from natural year-‐to-‐year fluctuations. In addition, projected changes are not consistent among models: some project increases while others project decreases.24 This is in contrast with the large changes projected for heavy precipitation events, which are expected to exceed the range of variability shortly after mid-‐century.32 [41,42,43,44,45,46
For more details on observed and projected changes in Puget Sound climate, see Tables 2-‐1 and 2-‐2.
N The study evaluated precipitation totals on days with the top 1% (99th percentile) in daily water vapor transport, the
principal driver of heavy rain events in the Pacific Northwest. Projections are based on an analysis of 10 global climate model projections and a high greenhouse gas scenario (RCP 8.5). Projected changes in intensity were evaluated for latitudes ranging from 40 to 49N. Although global models are coarse in spatial scale, previous research has shown that they can adequately capture the dynamics that govern West coast storms and heavy precipitation events.

Section 2: Climate
Climate Impacts Group P a g e | 2-‐9 College of the Environment, University of Washington
Online Tools and Resources
The following tools and resources are suggested in addition to the reports and papers cited in this document.
Historical Observations:
• Trends in temperature, precipitation, and snowpack for individual weather stations across the Pacific Northwest: http://www.climate.washington.edu/trendanalysis/
• Trends in temperature and precipitation for Washington State and specific regions within the state: http://charts.srcc.lsu.edu/trends/
• Centralized resource for observed climate trends and data in Washington State: http://climate.washington.edu/
• Centralized resource for observed climate in the Western U.S.: http://www.wrcc.dri.edu/
Climate Variability:
• NOAA Climate Prediction Center: Provides information on seasonal weather predictions and large-‐scale weather patterns such as El Niño. http://www.cpc.ncep.noaa.gov/
• Joint Institute for the Study Atmosphere and Ocean PDO website: Provides a brief overview, along with figures, links, and references on the Pacific Decadal Oscillation (PDO). http://research.jisao.washington.edu/pdo/
Climate Change Projections:
• Global Climate Model (GCM) projections: Interactive tool to explore global climate model projections of changing temperature and precipitation in the Pacific Northwest, including separate results for coastal and inland areas: http://cig.uw.edu/resources/analysis-‐tools/projections/
• Time of Emergence: This dataset serves data and figures that show the “Time of Emergence” of climate trends throughout the region, defined as the year in which a particular climate trend emerges from natural year-‐to-‐year variability. http://toe.cig.uw.edu
• Local-‐Scale Projections: Interactive tools to visualize MACA (Multivariate Adaptive Constructed Analogs) statistically downscaled climate projections: http://maca.northwestknowledge.net/
Section 2: Climate
Climate Impacts Group P a g e | 2-‐10 College of the Environment, University of Washington
Downscaled Climate Change Projections
• Climate, hydrologic, and vegetation change scenarios. The Pacific Northwest Climate Impacts Research Consortium recently completed a new set of projections, which include changes in climate, hydrology, and vegetation. The projections are produced at a daily time step and a spatial resolution of about four miles, and are based on the newest set of climate model projections (IPCC 2013,27 see Section 1). http://climate.nkn.uidaho.edu/IntegratedScenarios/index.php
• Climate and hydrologic scenarios. The Climate Impacts Group provides downscaled daily historical data and projected future temperature, precipitation, snowpack, streamflow, flooding, minimum flows, and other important hydrologic variables for all watersheds and specific streamflow locations throughout the Columbia River basin and the western U.S. The projections are produced at a daily time step and a spatial resolution of about four miles, and are based on the previous set of climate model projections (IPCC 2007).Error! Bookmark not defined. http://warm.atmos.washington.edu/2860,Error! Bookmark not defined.
Error! Bookmark not defined.
The projections are produced at a daily time step and a spatial resolution of about half a mile, and are based

Section 2: Climate
Climate Impacts Group P a g e | 2-‐11 College of the Environment, University of Washington
(continued from previous page)

Section 2: Climate
Climate Impacts Group P a g e | 2-‐12 College of the Environment, University of Washington
Table 2-‐1. Observed trends in Puget Sound climate.
Variable Observed Change C
Temperature
Annual Warming: +1.3°F (range: +0.7°F to +1.9°F for 1895-‐2014)B,C,D,1
Seasonal Warming in most seasons (1895-‐2014)D,1
Fall Warming: +0.12°F/decade (range: +0.07 to +0.17)
Winter Warming: +0.13°F/decade (range: +0.02 to +0.24) Spring No significant change Summer Warming: +0.13°F/decade (range: +0.07 to +0.19)
Extremes Statistically significant increase in nighttime heat events west of the Cascade Mountains in Oregon and Washington (1901-‐2009).5 No significant trends in daytime heat events.
Freeze-‐free Season Lengthening: +30 days (+3 days/decade for 1920–2014).E,3,4
Precipitation
Annual No significant change (1895-‐2014) D,1
Seasonal Wetter springs (1895-‐2014)D,1
Winter No significant change
Spring Increasing: +2.3%/decade
Summer No significant change
Fall No significant change
Extremes
Most studies find increases in the frequency and intensity of heavy precipitation events, but few are statistically significant. Results depend on the dates and methods of the trend analysis. 12,13,14

Section 2: Climate
Climate Impacts Group P a g e | 2-‐13 College of the Environment, University of Washington
Table 2-‐2. Projected trends in Puget Sound climate.
Variable Projected Long-‐term Change
Temperature
Annual Annual average air temperatures are projected to increase.
Warming is projected for all greenhouse gas scenarios, and the amount of warming depends on the amount of greenhouse gases emitted.
Projected change in Puget Sound average annual air temperature:
2050s (2040-‐2069, relative to the average for 1970-‐1999):J,23
Low emissions (RCP 4.5): +4.2°F (range: +2.9 to +5.4°F) High emissions (RCP 8.5): +5.5°F (range +4.3 to +7.1°F)
2080s (2070-‐2099, relative to the average for 1970-‐1999):J,23
Low emissions (RCP 4.5): +5.5°F (range: +4.1 to +7.3°F)
High emissions (RCP 8.5): +9.1°F (range: +7.4 to +12°F)
Seasonal Warming is projected for all seasons for the Puget Sound.
Projected change in Puget Sound seasonal air temperature:
2050s (2040-‐2069, relative to 1970-‐1999):J,23
Fall Low emissions (RCP 4.5): +4.1°F (range: +2.6 to +5.6°F) High emissions (RCP 8.5): +5.6°F (range: +3.9 to +7.2°F)
Winter Low emissions (RCP 4.5): +3.9°F (range: +2.8 to +5.0°F) High emissions (RCP 8.5): +4.9°F (range: +3.2 to +6.5°F)
Spring Low emissions (RCP 4.5): +3.9°F (range: +2.4 to +5.3°F) High emissions (RCP 8.5): +4.8°F (range: +3.0 to +7.6°F)
Summer Low emissions (RCP 4.5): +5.1°F (range: +3.3 to +7.5°F) High emissions (RCP 8.5): +6.8°F (range: +4.8 to +9.7°F)
2080s (2070-‐2099, relative to the average for 1970-‐1999):J,23
Fall Low emissions (RCP 4.5): +5.2°F (range: +3.7 to +7.1°F) High emissions (RCP 8.5): +9.0°F (range: +6.5 to +11°F)
Winter Low emissions (RCP 4.5): +5.0°F (range: +4.3 to +6.3°F) High emissions (RCP 8.5): +8.3°F (range: +6.0 to +10°F)
Spring Low emissions (RCP 4.5): +5.3°F (range: +3.8 to +8.2°F) High emissions (RCP 8.5): +7.9°F (range: +5.2 to +11°F)

Section 2: Climate
Climate Impacts Group P a g e | 2-‐14 College of the Environment, University of Washington
Variable Projected Long-‐term Change
Summer Low emissions (RCP 4.5): +6.4°F (range: +4.6 to +9.1°F) High emissions (RCP 8.5): +11°F (range: +8.8 to +15°F)
Extremes Heat waves are projected to intensify, while cold snaps are projected to become less severe.
Projected changes in Puget Sound air temperature extremes:
2050s (2040-‐2069, relative to 1970-‐1999):O,23
Temperature of hottest days: +6.5°F (+4.0 to +10.2°F)P Temperature of coolest nights: +5.4°F (+1.3 to +10.4°F)Q
Heating degree days: −1600 deg-‐days (−2300 to −1000)R Cooling degree days: +17 deg-‐days (+5 to +56) Growing degree days: +800 deg-‐days (+500 to +1300)
2080s (2070-‐2099, relative to 1970-‐1999):O,23
Temperature of hottest days: +9.8°F (+5.3 to +15.3°F)P Temperature of coolest nights: +8.3°F (+3.7 to +14.6°F)Q
Heating degree days: −2306 deg-‐days (−3493 to −1387)R Cooling degree days: +52 deg-‐days (+6 to +200) Growing degree days: +1280 deg-‐days (+591 to +2295)
Precipitation
Annual Projected changes in precipitation are small. All models project changes that are small relative to year-‐to-‐year variability.
O Projections are based on 10 global models and two greenhouse gas scenarios (RCP 4.5 and 8.5), statistically
downscaled following the procedures described by Mote et al. 2015.23 For each metric, the average among all twenty scenarios is listed, along with the range in parentheses.
P Projected change in the 99th percentile of daily maximum temperature. Q Projected change in the 1st percentile of daily minimum temperature. R Cooling and heating degree days are measurements used in energy markets to estimate demand. In the United States,
a cooling degree day is counted for each degree the average temperature for a day moves above 75°F. For example, if the average temperature for the day was 80°F, that would count as 5 cooling degree days. One heating degree day is counted for each degree that average daily temperature falls below 65°F. Growing degree days are calculated in the same way as cooling degree days, using a base temperature of 50°F.

Section 2: Climate
Climate Impacts Group P a g e | 2-‐15 College of the Environment, University of Washington
Variable Projected Long-‐term Change
Projected change in annual Puget Sound precipitation:
2050s (2040-‐2069, relative to 1970-‐1999):J,23
Low emissions (RCP 4.5): +4.2% (range: +0.6 to +12%)
High emissions (RCP 8.5): +5.0% (range: −1.9 to +13%)
2080s (2070-‐2099, relative to the average for 1970-‐1999):J,23
Low emissions (RCP 4.5): +6.4% (range: −0.2 to +10%) High emissions (RCP 8.5): +6.9% (range: +1.0 to +9.4%)
Seasonal Precipitation is generally projected to decrease in summer and increase in fall, winter, and spring.
For all seasons except summer, most models project wetter conditions while others project drier conditions.
All models project decreases in summer precipitation.
Projected change in Puget Sound seasonal temperature:
2050s (2040-‐2069, relative to 1970-‐1999):J,23
Fall Low emissions (RCP 4.5): +5.5% (range: −5.7 to +13%) High emissions (RCP 8.5): +6.3% (range: −2.4 to +19%)
Winter Low emissions (RCP 4.5): +9.9% (range: −1.6 to +21%) High emissions (RCP 8.5): +11% (range: +1.8 to +19%)
Spring Low emissions (RCP 4.5): +2.4% (range: −9.4 to +13%) High emissions (RCP 8.5): +3.8% (range: −7.7 to +13%)
Summer Low emissions (RCP 4.5): −22% (range: −45 to −6.1%) High emissions (RCP 8.5): −22% (range: −50 to −1.6%)
2080s (2070-‐2099, relative to 1970-‐1999):J,23
Fall Low emissions (RCP 4.5): +12% (range: +1.6 to −21%) High emissions (RCP 8.5): +10% (range: +1.9 to +15%)
Winter Low emissions (RCP 4.5): +11% (range: +1.3 to +16%) High emissions (RCP 8.5): +15% (range: +6.2 to +23%)
Spring Low emissions (RCP 4.5): +1.6% (range: −3.2 to +9.3%) High emissions (RCP 8.5): +2.5% (range: −6.7 to +11%)
Summer Low emissions (RCP 4.5): −20% (range: −37 to −10%) High emissions (RCP 8.5): −27% (range: −53 to +10%)

Section 2: Climate
Climate Impacts Group P a g e | 2-‐16 College of the Environment, University of Washington
Variable Projected Long-‐term Change
Geography of Change Changes in precipitation are expected to be different from place to place, but it is not known how patterns will shift with warming.
Heavy Precipitation Heavy precipitation events are projected to become more intense. Projected changes in western Oregon and Washington precipitation extremes for the 2080s (2070-‐2099, relative to 1970-‐1999) for a high (RCP 8.5) greenhouse gas scenario:N,32
Annual 99th percentile of 24-‐hour precipitation: +22% (range: +5 to +34%)
Frequency of exceeding the historical 99th percentile of 24-‐hour precipitation:
Historical (1970-‐1999): 2 days / year Future (2070-‐2099): 7 days / year (range: 4 to 9 dys/yr)
1 Vose, R. S. et al., 2014. Improved historical temperature and precipitation time series for US climate divisions. Journal
of Applied Meteorology and Climatology, 53(5), 1232-‐1251. 2 Mote, P. W. et al., 2013. Climate: Variability and Change in the Past and the Future. Chapter 2, 25-‐40, in M.M. Dalton,
P. W. Mote, and A. K. Snover (eds.) Climate Change in the Northwest: Implications for Our Landscapes, Waters, and Communities, Washington D.C.: Island Press.
3 Abatzoglou, J. T. et al., 2014. Seasonal climate variability and change in the Pacific Northwest of the United States. Journal of Climate, 27(5), 2125-‐2142.
4 Menne, M. J. et al., 2012: Global Historical Climatology Network -‐ Daily (GHCN-‐Daily), Version 3.21. NOAA National Climatic Data Center. http://doi.org/10.7289/V5D21VHZ (Accessed in July 2015).
5 Bumbaco, K. A. et al., 2013. History of Pacific Northwest Heat Waves: Synoptic Pattern and Trends. Journal of Applied Meteorology and Climatology, (2013).
6 Wallace, J. M. et al., 1995. Dynamic contribution to hemispheric mean temperature trends. Science, 270(5237), 780-‐783.
7 Johnstone, J. A., & Mantua, N. J. 2014. Atmospheric controls on northeast Pacific temperature variability and change, 1900–2012. Proceedings of the National Academy of Sciences, 111(40), 14360-‐14365.
8 Abatzoglou, J. T. et al., 2014. Questionable evidence of natural warming of the northwestern United States. Proceedings of the National Academy of Sciences, 111(52), E5605-‐E5606.
9 Johnstone, J. A., & Mantua, N. J. 2014. Reply to Abatzoglou et al.: Atmospheric controls on northwest United States air temperatures, 1948–2012.Proceedings of the National Academy of Sciences, 111(52), E5607-‐E5608.
10 Menne, M. J. et al., 2009. The US Historical Climatology Network monthly temperature data, version 2. Bulletin of the American Meteorological Society, 90(7), 993-‐1007.
11 Menne, M. J. et al., 2010. On the reliability of the US surface temperature record. Journal of Geophysical Research: Atmospheres (1984–2012) 115(D11).
12 Madsen, T., & E. Figdor, 2007. When it rains, it pours: global warming and the rising frequency of extreme precipitation in the United States. Report prepared for Environment California Research and Policy Center. 47pp.
13 Mass, C. et al., 2011. Extreme Precipitation over the West Coast of North America: Is There a Trend?. Journal of Hydrometeorology, 12(2), 310-‐318.
14 Rosenberg, E. A. et al., 2010. Precipitation extremes and the impacts of climate change on stormwater infrastructure in Washington State. Climatic Change, 102(1-‐2), 319-‐349.

Section 2: Climate
Climate Impacts Group P a g e | 2-‐17 College of the Environment, University of Washington
15 Moore, S.K., et al., 2008. Local and large-‐scale climate forcing of Puget Sound oceanographic properties on seasonal to
interdecadal timescales. Limnol. Oceanogr., 53(5), 1746-‐1758. 16 Newman, M., Compo, G. P., & Alexander, M. A. (2003). ENSO-‐forced variability of the Pacific decadal
oscillation. Journal of Climate, 16(23), 3853-‐3857. 17 Mantua, N.J. & Hare, S. 2002. The Pacific Decadal Oscillation. J. Ocean. 58, 35-‐44. 18 Rasmusson, E.M. & Wallace, J.M. 1983. Meteorological Aspects of the El Niño/Southern Oscillation. Science 222
(4629), 1195-‐1202. 19 Ropelewski, C.F., & Halpert, M.S. 1986. North American Precipitation and Temperature Patterns Associated with the
El Niño/Southern Oscillation (ENSO). Mon. Wea. Rev., 114, 2352-‐2362. 20 Minobe, S., 1997. A 50-‐70 year climate oscillation over the North Pacific and North America. Geophys. Res. Lett., 24,
683-‐686. 21 Vecchi, G. A., & Wittenberg, A. T. 2010. El Niño and our future climate: where do we stand? Wiley Interdisciplinary
Reviews: Climate Change, 1(2), 260-‐270. 22 Yeh, S. W. et al., 2009. El Niño in a changing climate. Nature, 461(7263), 511-‐514. 23 Mote, P. W. et al., 2015. Integrated Scenarios for the Future Northwest Environment. Version 2.0. USGS
ScienceBase. Data set accessed 2015-‐03-‐02 at https://www.sciencebase.gov/catalog/item/5006eb9de4b0abf7ce733f5c
24 Mote, P. W. et al., 2013. Climate: Variability and Change in the Past and the Future. Chapter 2, 25-‐40, in M.M. Dalton, P.W. Mote, and A.K. Snover (eds.) Climate Change in the Northwest: Implications for Our Landscapes, Waters, and Communities, Washington D.C.: Island Press.
25 Rupp, D. E., et al., 2013. Evaluation of CMIP5 20th century climate simulations for the Pacific Northwest USA. Journal of Geophysical Research: Atmospheres, 118(19), 10-‐884.
26 Abatzoglou, J. T., & Brown, T. J. 2012. A comparison of statistical downscaling methods suited for wildfire applications. International Journal of Climatology, 32(5), 772-‐780. doi: http://dx.doi.org/10.1002/joc.2312
27 (IPCC) Intergovernmental Panel on Climate Change. 2013. Working Group 1, Summary for Policymakers. Available at: http://www.climatechange2013.org/images/uploads/WGIAR5-‐SPM_Approved27Sep2013.pdf
28 Brewer, M. C., & Mass, C. F. 2015. Projected changes in western U.S. large-‐scale summer synoptic circulations and variability in CMIP5 models. Journal of Climate, submitted.
29 Brewer, M. C. 2015. The West Coast Thermal Trough: Climatology, Evolution and Sensitivity to Terrain and Surface Fluxes. Ph.D. Thesis, University of Washington, http://hdl.handle.net/1773/22536
30 Vecchi, G. A., & Wittenberg, A. T. 2010. El Niño and our future climate: where do we stand?. Wiley Interdisciplinary Reviews: Climate Change, 1(2), 260-‐270.
31 Yeh, S. W. et al., 2009. El Niño in a changing climate. Nature, 461(7263), 511-‐514. 32 Warner, M.D., et al. 2015. Changes in Winter Atmospheric Rivers along the North American West Coast in CMIP5
Climate Models. J. Hydrometeor, 16, 118–128. doi: http://dx.doi.org/10.1175/JHM-‐D-‐14-‐0080.1 33 Melillo, J. M. et al., 2014. Climate change impacts in the United States: the third national climate assessment. US Global
change research program, 841. 34 Kunkel, K. E. et al., 2013. Monitoring and understanding trends in extreme storms: State of knowledge. Bulletin of the
American Meteorological Society, 94(4), 499-‐514. 35 Barnes, E. A., & Polvani, L. 2013. Response of the midlatitude jets, and of their variability, to increased greenhouse
gases in the CMIP5 models. Journal of Climate, 26(18), 7117-‐7135. 36 Liu, J. et al., 2012. Impact of declining Arctic sea ice on winter snowfall. Proceedings of the National Academy of
Sciences, 109(11), 4074-‐4079. 37 Petoukhov, V. et al., 2013. Quasiresonant amplification of planetary waves and recent Northern Hemisphere weather
extremes. Proceedings of the National Academy of Sciences, 110(14), 5336-‐5341. 38 Barnes, E. A., & Screen, J. A. 2015. The impact of Arctic warming on the midlatitude jet-‐stream: Can it? Has it? Will
it?. Wiley Interdisciplinary Reviews: Climate Change, 6(3), 277-‐286. 39 Thomas, K. (Ed.). 2014. Linkages Between Arctic Warming and Mid-‐Latitude Weather Patterns:: Summary of a
Workshop. National Academies Press.

Section 2: Climate
Climate Impacts Group P a g e | 2-‐18 College of the Environment, University of Washington
40 Salathé, E. S. et al., 2015. Final Project Report: Regional Modeling for Windstorms and Lightning. Report prepared for
Seattle City Light by the Climate Impacts Group, University of Washington, Seattle. 41 (IPCC) Intergovernmental Panel on Climate Change. 2007. Working Group 1, Summary for Policymakers. Available at:
http://ipcc.ch/publications_and_data/ar4/wg1/en/contents.html 42 Hamlet, A.F. et al., 2013. An overview of the Columbia Basin Climate Change Scenarios Project: Approach, methods,
and summary of key results. Atmosphere-‐Ocean 51(4): 392-‐415. doi: 10.1080/07055900.2013.819555 43 Salathé, E. P. et al., 2013. Uncertainty and Extreme Events in Future Climate and Hydrologic Projections for the Pacific
Northwest: Providing a Basis for Vulnerability and Core/Corridor Assessments. Project Final Report to the PNW Climate Science Center. Available at: http://cses.washington.edu/cig/data/WesternUS_Scenarios.pdf
44 Thrasher, B. et al., 2013. Downscaled Climate Projections Suitable for Resource Management. Eos Transactions, American Geophysical Union, 94(37), 321-‐323.
45 Salathe Jr, E. P. et al., 2010. Regional climate model projections for the State of Washington. Climatic Change, 102(1-‐2), 51-‐75.
46 Salathé Jr, E. P. et al., 2014. Estimates of twenty-‐first-‐century flood risk in the Pacific Northwest based on regional climate model simulations. Journal of Hydrometeorology, 15(5), 1881-‐1899.