sebnem kalemli Özcan - debt overhang, rollover risk, and corporate investment: evidence from the...
TRANSCRIPT
Debt Overhang, Rollover Risk, and CorporateInvestment: Evidence from the European Crisis
S. ebnem Kalemli-Ozcan, University of Maryland, CEPR and NBER
Luc Laeven, ECB and CEPR
David Moreno, University of Maryland and Central Bank of Chile
BIS-OECD-IMF Conference on Weak Productivity, January 2018
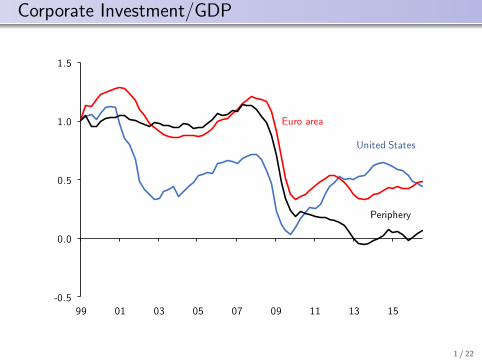
Corporate Investment/GDP
United States
Euro area
Periphery
-0.5
0.0
0.5
1.0
1.5
99 01 03 05 07 09 11 13 15
1 / 22
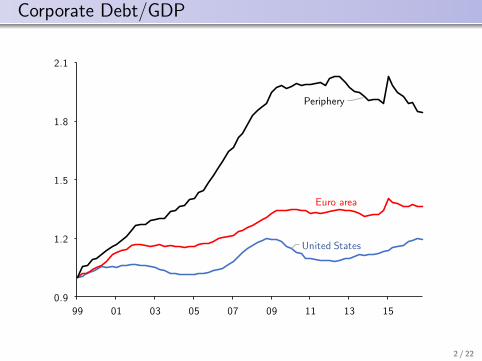
Corporate Debt/GDP
United States
Euro area
Periphery
0.9
1.2
1.5
1.8
2.1
99 01 03 05 07 09 11 13 15
2 / 22
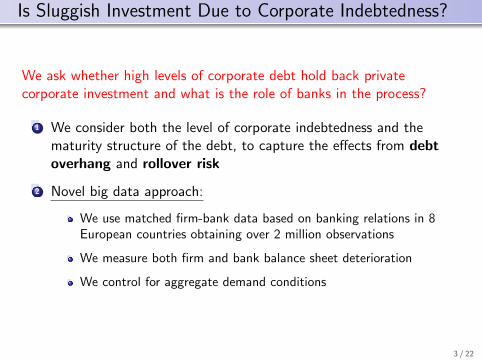
Is Sluggish Investment Due to Corporate Indebtedness?
We ask whether high levels of corporate debt hold back privatecorporate investment and what is the role of banks in the process?
1 We consider both the level of corporate indebtedness and thematurity structure of the debt, to capture the effects from debtoverhang and rollover risk
2 Novel big data approach:
We use matched firm-bank data based on banking relations in 8European countries obtaining over 2 million observations
We measure both firm and bank balance sheet deterioration
We control for aggregate demand conditions
3 / 22
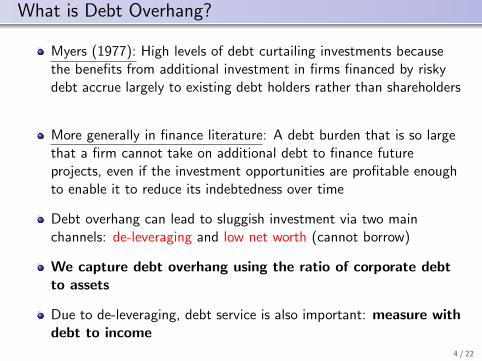
What is Debt Overhang?
Myers (1977): High levels of debt curtailing investments becausethe benefits from additional investment in firms financed by riskydebt accrue largely to existing debt holders rather than shareholders
More generally in finance literature: A debt burden that is so largethat a firm cannot take on additional debt to finance futureprojects, even if the investment opportunities are profitable enoughto enable it to reduce its indebtedness over time
Debt overhang can lead to sluggish investment via two mainchannels: de-leveraging and low net worth (cannot borrow)
We capture debt overhang using the ratio of corporate debtto assets
Due to de-leveraging, debt service is also important: measure withdebt to income
4 / 22
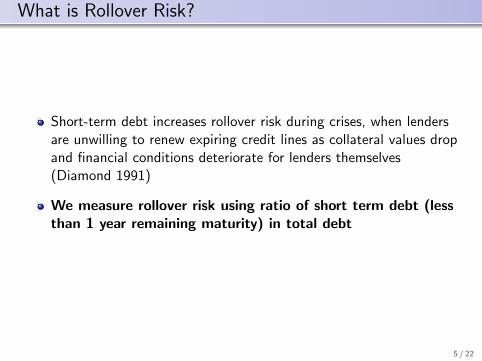
What is Rollover Risk?
Short-term debt increases rollover risk during crises, when lendersare unwilling to renew expiring credit lines as collateral values dropand financial conditions deteriorate for lenders themselves(Diamond 1991)
We measure rollover risk using ratio of short term debt (lessthan 1 year remaining maturity) in total debt
5 / 22
Corporate Indebtedness as an Overlooked Channel
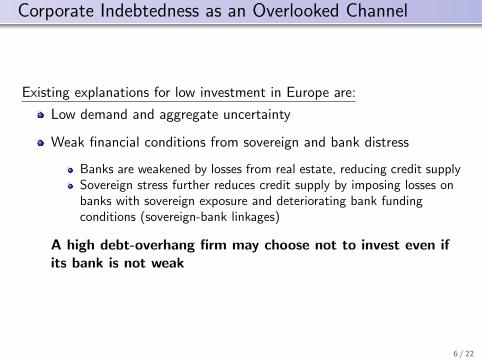
Existing explanations for low investment in Europe are:
Low demand and aggregate uncertainty
Weak financial conditions from sovereign and bank distress
Banks are weakened by losses from real estate, reducing credit supplySovereign stress further reduces credit supply by imposing losses onbanks with sovereign exposure and deteriorating bank fundingconditions (sovereign-bank linkages)
A high debt-overhang firm may choose not to invest even ifits bank is not weak
6 / 22

Our Contribution
1 Focus on identifying corporate indebtedness for investment slump,conditional on other channels
2 Pan-European setting where we exploit heterogeneity not only ofbanks but also of sovereigns for real outcomes
3 Use a unique hand-matched firm-bank-sovereign data from allEurope that includes small firms
Major difference from the literature that mostly focuses on the listedfirms (1 percent of our sample)Small firms make up a large fraction of economic activity in Europe(70 percent)Cannot switch to alternative sources of fundingDebt overhang effects are presumably larger in small firms givenhigher information asymmetry and riskiness
7 / 22
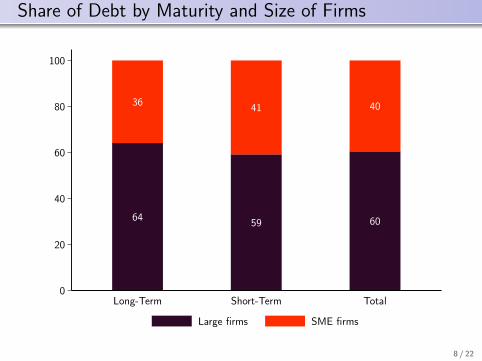
Share of Debt by Maturity and Size of Firms
64
36
59
41
60
40
0
20
40
60
80
100
Long-Term Short-Term Total
Large firms SME firms
8 / 22
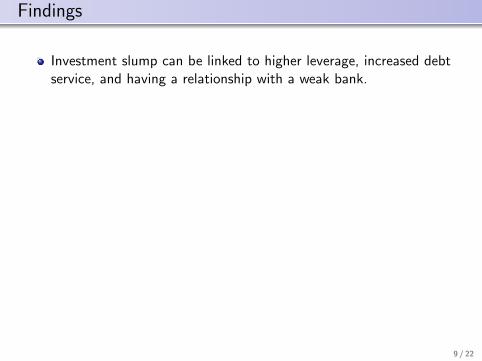
Findings
Investment slump can be linked to higher leverage, increased debtservice, and having a relationship with a weak bank.
Firms with a higher share of long-term debt increase theirinvestment since the rollover risk for those firms is lower.
⇒ This result is driven by firms linked to weak banks. These firmsincrease investment more if they have a higher share of long-termdebt, suggesting these firms are less exposed to rollover risk.
The direct negative effect of weak banks on the average firm’sinvestment disappears once demand shocks are controlled for,although the differential effects remain.
The debt overhang and rollover risk channels explain about 60percent of the actual decline in aggregate corporate investmentduring the crisis.
9 / 22
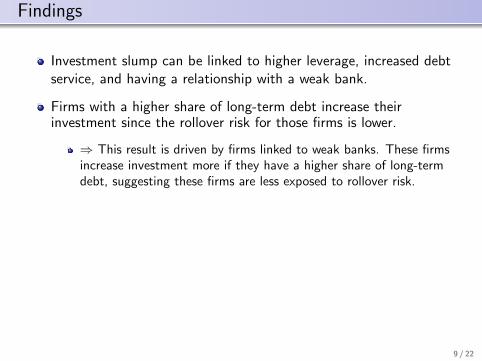
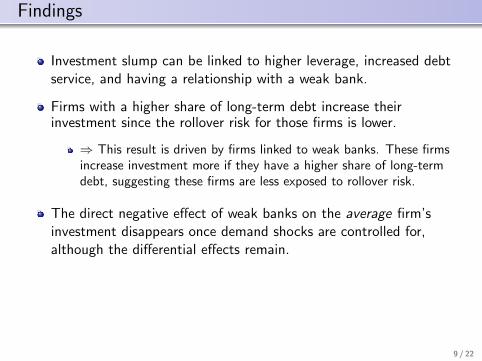
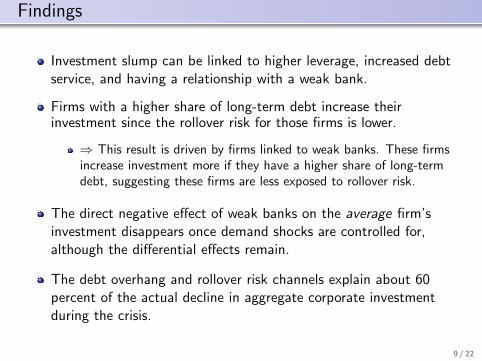
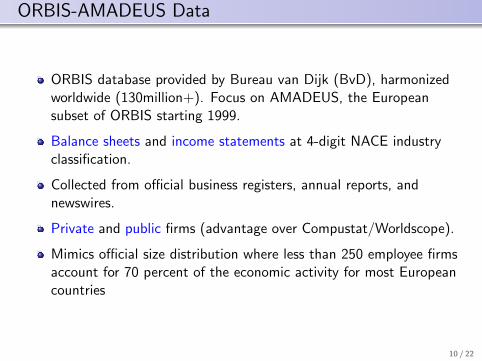
ORBIS-AMADEUS Data
ORBIS database provided by Bureau van Dijk (BvD), harmonizedworldwide (130million+). Focus on AMADEUS, the Europeansubset of ORBIS starting 1999.
Balance sheets and income statements at 4-digit NACE industryclassification.
Collected from official business registers, annual reports, andnewswires.
Private and public firms (advantage over Compustat/Worldscope).
Mimics official size distribution where less than 250 employee firmsaccount for 70 percent of the economic activity for most Europeancountries
10 / 22
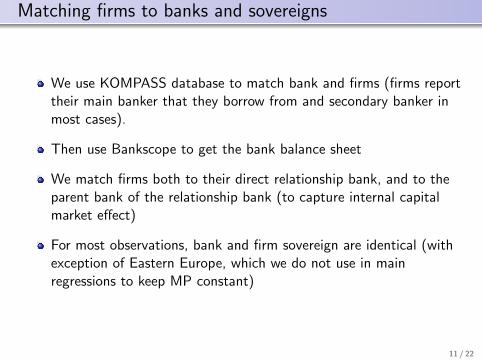
Matching firms to banks and sovereigns
We use KOMPASS database to match bank and firms (firms reporttheir main banker that they borrow from and secondary banker inmost cases).
Then use Bankscope to get the bank balance sheet
We match firms both to their direct relationship bank, and to theparent bank of the relationship bank (to capture internal capitalmarket effect)
For most observations, bank and firm sovereign are identical (withexception of Eastern Europe, which we do not use in mainregressions to keep MP constant)
11 / 22
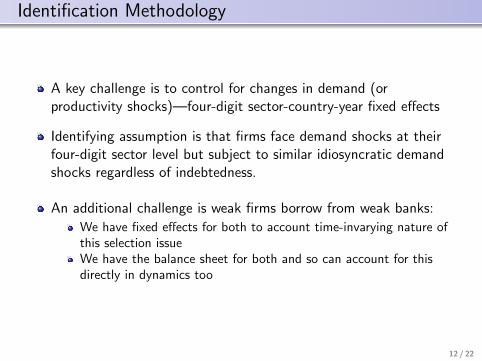
Identification Methodology
A key challenge is to control for changes in demand (orproductivity shocks)—four-digit sector-country-year fixed effects
Identifying assumption is that firms face demand shocks at theirfour-digit sector level but subject to similar idiosyncratic demandshocks regardless of indebtedness.
An additional challenge is weak firms borrow from weak banks:
We have fixed effects for both to account time-invarying nature ofthis selection issueWe have the balance sheet for both and so can account for thisdirectly in dynamics too
12 / 22
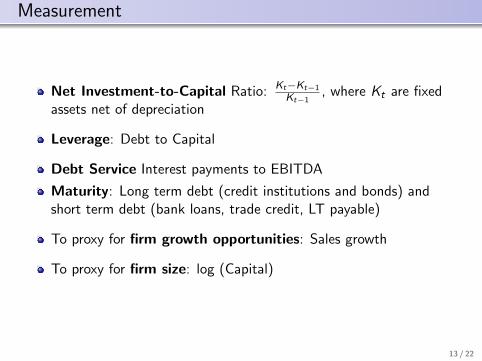
Measurement
Net Investment-to-Capital Ratio: Kt−Kt−1
Kt−1, where Kt are fixed
assets net of depreciation
Leverage: Debt to Capital
Debt Service Interest payments to EBITDA
Maturity: Long term debt (credit institutions and bonds) andshort term debt (bank loans, trade credit, LT payable)
To proxy for firm growth opportunities: Sales growth
To proxy for firm size: log (Capital)
13 / 22
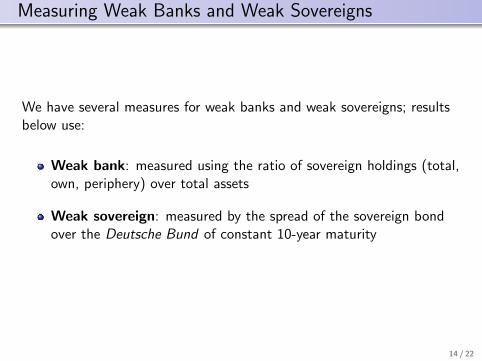
Measuring Weak Banks and Weak Sovereigns
We have several measures for weak banks and weak sovereigns; resultsbelow use:
Weak bank: measured using the ratio of sovereign holdings (total,own, periphery) over total assets
Weak sovereign: measured by the spread of the sovereign bondover the Deutsche Bund of constant 10-year maturity
14 / 22
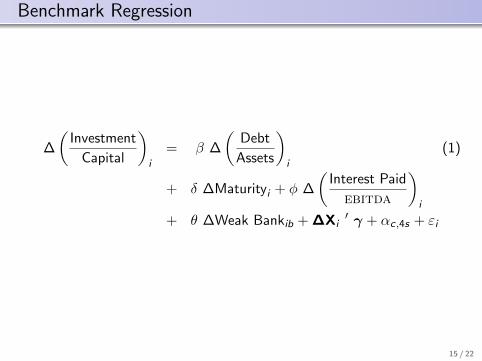
Benchmark Regression
∆
(Investment
Capital
)i
= β ∆
(Debt
Assets
)i
(1)
+ δ ∆Maturityi + φ ∆
(Interest Paid
ebitda
)i
+ θ ∆Weak Bankib + ∆Xi′ γ + αc,4s + εi
15 / 22
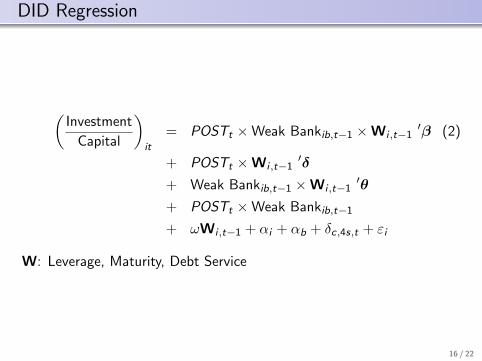
DID Regression
(Investment
Capital
)it
= POSTt ×Weak Bankib,t−1 ×Wi ,t−1′β (2)
+ POSTt ×Wi ,t−1′δ
+ Weak Bankib,t−1 ×Wi ,t−1′θ
+ POSTt ×Weak Bankib,t−1
+ ωWi ,t−1 + αi + αb + δc,4s,t + εi
W: Leverage, Maturity, Debt Service
16 / 22
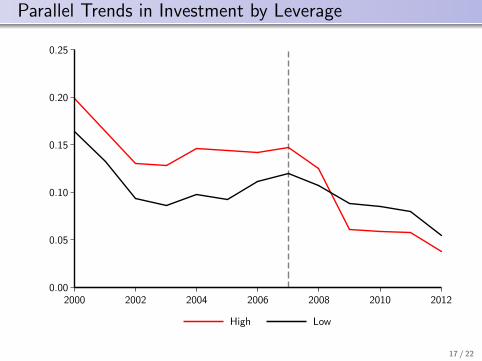
Parallel Trends in Investment by Leverage
0.00
0.05
0.10
0.15
0.20
0.25
2000 2002 2004 2006 2008 2010 2012
High Low
17 / 22
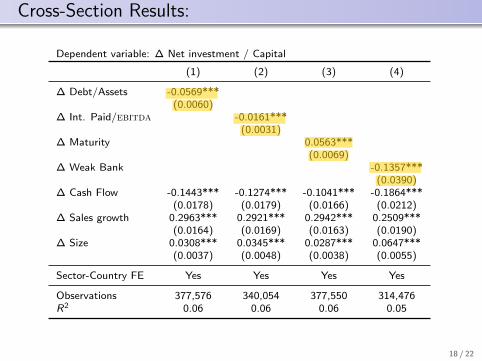
Cross-Section Results:
Dependent variable: ∆ Net investment / Capital
(1) (2) (3) (4)
∆ Debt/Assets -0.0569***(0.0060)
∆ Int. Paid/ebitda -0.0161***(0.0031)
∆ Maturity 0.0563***(0.0069)
∆ Weak Bank -0.1357***(0.0390)
∆ Cash Flow -0.1443*** -0.1274*** -0.1041*** -0.1864***(0.0178) (0.0179) (0.0166) (0.0212)
∆ Sales growth 0.2963*** 0.2921*** 0.2942*** 0.2509***(0.0164) (0.0169) (0.0163) (0.0190)
∆ Size 0.0308*** 0.0345*** 0.0287*** 0.0647***(0.0037) (0.0048) (0.0038) (0.0055)
Sector-Country FE Yes Yes Yes Yes
Observations 377,576 340,054 377,550 314,476R2 0.06 0.06 0.06 0.05
18 / 22
Cross-Section Results:
Dependent variable: ∆ Net investment / Capital
∆ All Sovereign ∆ OwnSovereign
∆ OwnSovereign
(Periphery)
∆ Debt/Assets -0.0559*** -0.0536*** -0.0535***(0.0086) (0.0095) (0.0095)
∆ Int. Paid/ebitda -0.0131*** -0.0119*** -0.0119***(0.0037) (0.0040) (0.0040)
∆ Maturity 0.0531*** 0.0575*** 0.0575***(0.0081) (0.0083) (0.0083)
∆ Weak Bank -0.0670* -0.2754*** -0.2581**(0.0358) (0.0992) (0.1075)
∆ Cash Flow -0.1793*** -0.1770*** -0.1769***(0.0230) (0.0238) (0.0238)
∆ Sales growth 0.2905*** 0.2957*** 0.2957***(0.0192) (0.0175) (0.0175)
∆ Size 0.0143*** 0.0146*** 0.0146***(0.0044) (0.0047) (0.0047)
Sector-Country FE Yes Yes Yes
Observations 294,255 226,412 226,412R2 0.07 0.07 0.07
19 / 22
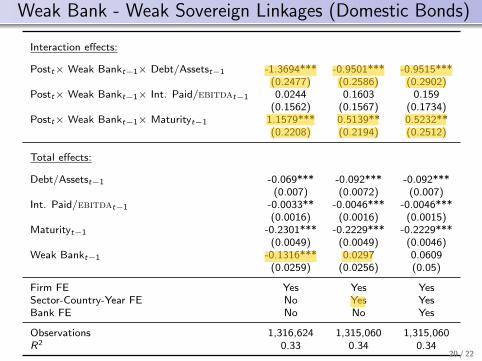
Weak Bank - Weak Sovereign Linkages (Domestic Bonds)
Interaction effects:
Postt× Weak Bankt−1× Debt/Assetst−1 -1.3694*** -0.9501*** -0.9515***(0.2477) (0.2586) (0.2902)
Postt× Weak Bankt−1× Int. Paid/ebitdat−1 0.0244 0.1603 0.159(0.1562) (0.1567) (0.1734)
Postt× Weak Bankt−1× Maturityt−1 1.1579*** 0.5139** 0.5232**(0.2208) (0.2194) (0.2512)
Total effects:
Debt/Assetst−1 -0.069*** -0.092*** -0.092***(0.007) (0.0072) (0.007)
Int. Paid/ebitdat−1 -0.0033** -0.0046*** -0.0046***(0.0016) (0.0016) (0.0015)
Maturityt−1 -0.2301*** -0.2229*** -0.2229***(0.0049) (0.0049) (0.0046)
Weak Bankt−1 -0.1316*** 0.0297 0.0609(0.0259) (0.0256) (0.05)
Firm FE Yes Yes YesSector-Country-Year FE No Yes YesBank FE No No Yes
Observations 1,316,624 1,315,060 1,315,060R2 0.33 0.34 0.34
20 / 22
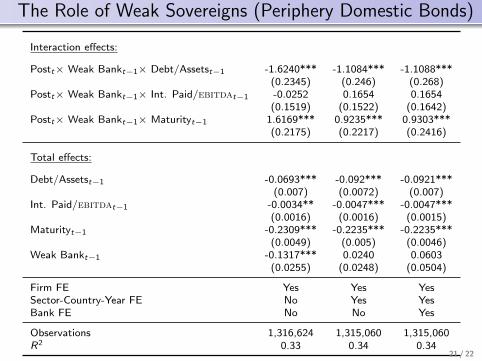
The Role of Weak Sovereigns (Periphery Domestic Bonds)
Interaction effects:
Postt× Weak Bankt−1× Debt/Assetst−1 -1.6240*** -1.1084*** -1.1088***(0.2345) (0.246) (0.268)
Postt× Weak Bankt−1× Int. Paid/ebitdat−1 -0.0252 0.1654 0.1654(0.1519) (0.1522) (0.1642)
Postt× Weak Bankt−1× Maturityt−1 1.6169*** 0.9235*** 0.9303***(0.2175) (0.2217) (0.2416)
Total effects:
Debt/Assetst−1 -0.0693*** -0.092*** -0.0921***(0.007) (0.0072) (0.007)
Int. Paid/ebitdat−1 -0.0034** -0.0047*** -0.0047***(0.0016) (0.0016) (0.0015)
Maturityt−1 -0.2309*** -0.2235*** -0.2235***(0.0049) (0.005) (0.0046)
Weak Bankt−1 -0.1317*** 0.0240 0.0603(0.0255) (0.0248) (0.0504)
Firm FE Yes Yes YesSector-Country-Year FE No Yes YesBank FE No No Yes
Observations 1,316,624 1,315,060 1,315,060R2 0.33 0.34 0.34
21 / 22
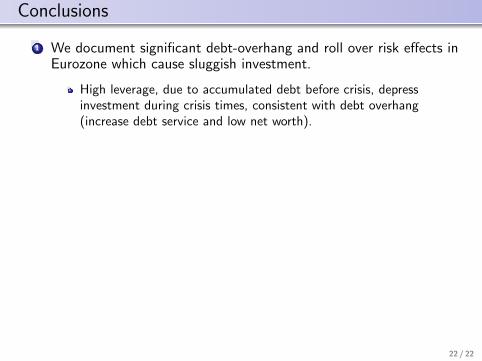
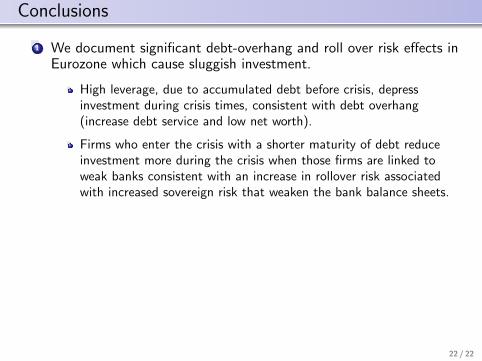
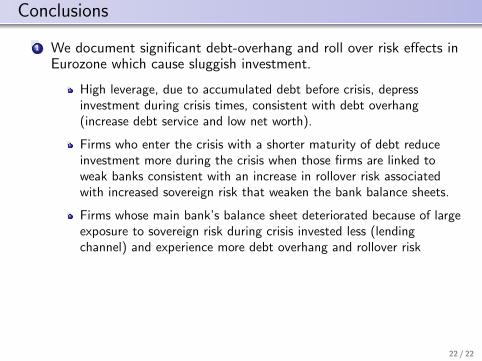
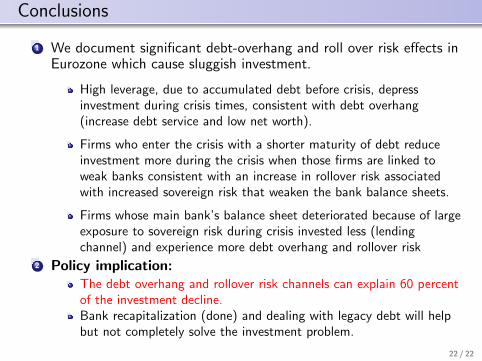
Conclusions
1 We document significant debt-overhang and roll over risk effects inEurozone which cause sluggish investment.
High leverage, due to accumulated debt before crisis, depressinvestment during crisis times, consistent with debt overhang(increase debt service and low net worth).
Firms who enter the crisis with a shorter maturity of debt reduceinvestment more during the crisis when those firms are linked toweak banks consistent with an increase in rollover risk associatedwith increased sovereign risk that weaken the bank balance sheets.
Firms whose main bank’s balance sheet deteriorated because of largeexposure to sovereign risk during crisis invested less (lendingchannel) and experience more debt overhang and rollover risk
2 Policy implication:The debt overhang and rollover risk channels can explain 60 percentof the investment decline.Bank recapitalization (done) and dealing with legacy debt will helpbut not completely solve the investment problem.
22 / 22

EXTRA SLIDES
20 / 22
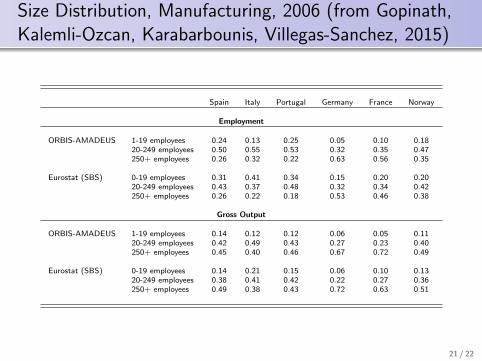
Size Distribution, Manufacturing, 2006 (from Gopinath,Kalemli-Ozcan, Karabarbounis, Villegas-Sanchez, 2015)
Spain Italy Portugal Germany France Norway
Employment
ORBIS-AMADEUS 1-19 employees 0.24 0.13 0.25 0.05 0.10 0.1820-249 employees 0.50 0.55 0.53 0.32 0.35 0.47250+ employees 0.26 0.32 0.22 0.63 0.56 0.35
Eurostat (SBS) 0-19 employees 0.31 0.41 0.34 0.15 0.20 0.2020-249 employees 0.43 0.37 0.48 0.32 0.34 0.42250+ employees 0.26 0.22 0.18 0.53 0.46 0.38
Gross Output
ORBIS-AMADEUS 1-19 employees 0.14 0.12 0.12 0.06 0.05 0.1120-249 employees 0.42 0.49 0.43 0.27 0.23 0.40250+ employees 0.45 0.40 0.46 0.67 0.72 0.49
Eurostat (SBS) 0-19 employees 0.14 0.21 0.15 0.06 0.10 0.1320-249 employees 0.38 0.41 0.42 0.22 0.27 0.36250+ employees 0.49 0.38 0.43 0.72 0.63 0.51
21 / 22
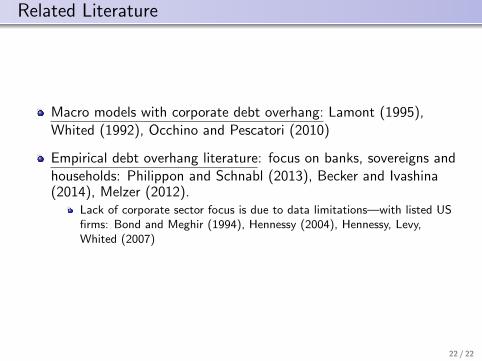
Related Literature
Macro models with corporate debt overhang: Lamont (1995),Whited (1992), Occhino and Pescatori (2010)
Empirical debt overhang literature: focus on banks, sovereigns andhouseholds: Philippon and Schnabl (2013), Becker and Ivashina(2014), Melzer (2012).
Lack of corporate sector focus is due to data limitations—with listed USfirms: Bond and Meghir (1994), Hennessy (2004), Hennessy, Levy,Whited (2007)
22 / 22