seasonal patterns and controls on methane and carbon dioxide fluxes in forested swamp pools
TRANSCRIPT

This article was downloaded by: [University of Lethbridge]On: 04 October 2014, At: 04:27Publisher: Taylor & FrancisInforma Ltd Registered in England and Wales Registered Number:1072954 Registered office: Mortimer House, 37-41 Mortimer Street,London W1T 3JH, UK
Geomicrobiology JournalPublication details, including instructions forauthors and subscription information:http://www.tandfonline.com/loi/ugmb20
Seasonal Patterns andControls on Methane andCarbon Dioxide Fluxes inForested Swamp PoolsDaniel N. Miller, William C. Ghiorse, JosephB. YavittPublished online: 29 Oct 2010.
To cite this article: Daniel N. Miller, William C. Ghiorse, Joseph B. Yavitt(1999) Seasonal Patterns and Controls on Methane and Carbon Dioxide Fluxesin Forested Swamp Pools, Geomicrobiology Journal, 16:4, 325-331, DOI:10.1080/014904599270578
To link to this article: http://dx.doi.org/10.1080/014904599270578
PLEASE SCROLL DOWN FOR ARTICLE
Taylor & Francis makes every effort to ensure the accuracy of allthe information (the “Content”) contained in the publications on ourplatform. However, Taylor & Francis, our agents, and our licensorsmake no representations or warranties whatsoever as to the accuracy,completeness, or suitability for any purpose of the Content. Anyopinions and views expressed in this publication are the opinions andviews of the authors, and are not the views of or endorsed by Taylor& Francis. The accuracy of the Content should not be relied upon andshould be independently verified with primary sources of information.Taylor and Francis shall not be liable for any losses, actions, claims,proceedings, demands, costs, expenses, damages, and other liabilitieswhatsoever or howsoever caused arising directly or indirectly inconnection with, in relation to or arising out of the use of the Content.
This article may be used for research, teaching, and private studypurposes. Any substantial or systematic reproduction, redistribution,reselling, loan, sub-licensing, systematic supply, or distribution in any

form to anyone is expressly forbidden. Terms & Conditions of accessand use can be found at http://www.tandfonline.com/page/terms-and-conditions
Dow
nloa
ded
by [
Uni
vers
ity o
f L
ethb
ridg
e] a
t 04:
27 0
4 O
ctob
er 2
014

Seasonal Patterns and Controls on Methane andCarbon Dioxide Fluxes in Forested Swamp Pools
DANIEL N. MILLERWILLIAM C. GHIORSE
Section of MicrobiologyCornell UniversityIthaca, New York, USA
JOSEPH B. YAVITT
Department of Natural ResourcesCornell UniversityIthaca, New York, USA
We measured seasonal patterns in the � uxes of CH4 and CO2 in a forested wetland incentral New York State from 1992 to 1995. The site was a red maple–hemlock swampwith permanentpools (» 30 cm deep), exceptwhen the poolsdried duringseveredroughtin 1995. Annual CH4 emissions from the pools to the atmosphere averaged 4.3 (§ 2.4)mol m ¡ 2 during 1993 to 1995 and ranged from 1.9 mol m ¡ 2 in 1993 to 6.7 mol m ¡ 2 in1995. CO2 emissions from the pools during 1993 and 1994 were 10.5 and 11.9 mol m ¡ 2,accounting for 84.6% and 75.6% of the gaseous carbon export during 1993 and 1994,respectively.A combination of temperatureand carbon availability in� uenced seasonalCH4 and CO2 � uxes more than other environmentalfactors (temperature,water columndepth,O2, CH4, dissolvedorganic carbon,NH +
4 , or dissolved inorganiccarbon).Basedon an observed 12±C threshold temperature, linear regression models explained from31% to 77% of seasonal gas � ux variability. Compared with other forested wetlands,this site produced substantially greater CH4 � uxes, and the CH4 � ux accounted for agreater proportion of the total carbon � ux from the system.
Keywords greenhouse gases, methane, wetland
Methane, an important greenhouse gas, has been increasing in the atmosphere by » 1% peryear (Khalil and Rasmussen 1990), but this rate has varied considerably from year to year(Dlugokencky et al. 1994). The various wetland ecosystems are important sources of CH4
and account for » 40% of the CH4 emitted annually to the atmosphere (Bartlett and Harriss1993). Methane emissions from wetlands are quite variable, both temporally and spatially,and many studieshave tried to explain thisvariability in terms of water table level (Aselmannand Crutzen 1989; Bubier et al. 1995; Dise 1993; Moore and Knowles 1989, 1990), netprimary production (Whiting and Chanton 1993), soil temperature or water content (Crillet al. 1988, 1991; Dise 1993; Moore and Knowles 1990; Pulliam 1993), and organic carboninputs (Amaral and Knowles 1994; Delwiche and Cicerone 1993; Wilson et al. 1989).
Received 3 May 1999; accepted 28 July 1999.This research was supported by funds from the NIEHS/Superfund Basic Research and Education Program
(Grant ES 05950-03). We especially thank Sean Dineen for his skillful assistance in collecting and analyzing gas� ux and DOC samples. We also thank Patti Lisk for her secretarial assistance. Finally, we thank two anonymousreviewers for careful review of an earlier manuscript and their insightful comments.
Address correspondence to Daniel N. Miller at his current address: USDA-ARS, U. S. Meat Animal ResearchCenter, PO Box 166, Clay Center, NE 68933, USA. E-mail: [email protected]
Geomicrobiology Journal, 16:325–331, 1999Copyright C° 1999 Taylor & Francis
0149-0451/99 $12.00 + .00 325
Dow
nloa
ded
by [
Uni
vers
ity o
f L
ethb
ridg
e] a
t 04:
27 0
4 O
ctob
er 2
014
326 D. N. Miller et al.
Few studies have considered CH4 emissions from forested wetlands, even though theyemit more CH4 (annually) than any other natural wetland type and represent 20% of globallydistributedwetlands (Aselmann and Crutzen 1989). These few studies show highly variableseasonal � uxes attributed to many environmental factors, including precipitation, temper-ature, and organic carbon inputs. Unfortunately, very little is known about their annualvariation in CH4 and CO2 � uxes. Furthermore, forested wetlands have often been convertedto agriculture. For instance, forested wetlands were the primary wetland type in upstateNew York and would have been a signi� cant source of atmospheric CH4 before intensiveagriculture practices developed.For these reasons, it is essential to document the long-termpatterns in CH4 emissions at forested wetlands to understand regional contributions to theglobal CH4 budget both in the past and in the future.
The purpose of this study was to evaluate the emission rates of CH4 and CO2 from atemperate, forested swamp to the atmosphere and to identify environmental controls asso-ciated with those rates. In particular, the relationship of CH4 and CO2 � uxes to physicalfactors (temperature and water column depth) and chemical factors (dissolvedoxygen,CH4,dissolved inorganic carbon [DIC], dissolved organic carbon [DOC], and NH4 concentra-tions) were investigated. Furthermore, a study period over 3 years (1992 to 1995) allowedus to examine annual and interannual patterns in CH4 and CO2 emissions and to set thestage for a long-term evaluation of CH4 emissions from this particular � eld site. Finally,this study provides detailed background information on the CH4 biogeochemistry of this� eld site in a continuing study of the site’s microbial ecology (Ghiorse 1984; Miller 1996).
This research was conducted at Sapsucker Woods near Ithaca, New York (42±28.50 N,76±26.50 W) a mixed red mapleand eastern hemlockswamp. Themeanannualtemperature is7.8±C, and annual precipitation is 89.9 cm. Several shallow, interconnectedpools dominatethe landscape, ranging from 0 to 40 cm deep and each covering 1–30 m2. The sediment iscomposed of partially decomposed leaf litter 40 cm deep and overlies an impermeable claylayer. No emergent vascularplants and no roots were observed in sediment cores from pools.
A single large pool ( » 20 m2) was selected for intensive study. At roughly 2-weekintervals from October 1992 through October 1995, water column oxygen and temperaturepro� les were measured by using a water-sampling device with oxygen (YSI Model 51Boxygen meter) and temperature (Fluke 51 K/J thermometer) probes. Water samples (30 ml)were also collectedand analyzed for dissolvedCH4 and DIC by gas chromatography (Yavittet al. 1993); for DOC by coulometric titration (UIC Inc., Joliet, IL); and for ammonium bycontinuous-�ow automatedanalysis (Orion Scienti� c, Pleasantville,NY) with the indolphe-nol blue method. Gaseous CH4 and CO2 emissions were also collected at two to three siteswithin the designated pool by using open-bottom chambers equipped with air-samplingports and � otation rings. Five 10-ml gas samples from each chamber were collected at10-min intervals for 40 min and analyzed by gas chromatography within 5 h. Because gas� ux rates were not normally (gaussianly) distributed, each rate measurement was naturallog-transformed for statistical purposes. Daily CH4 and CO2 emission rates between sampledates were calculated by linear interpolation.Annual emissions represent the sum of all thedaily � ux rates (measured and interpolated) over the entire ice-free portion of the year.
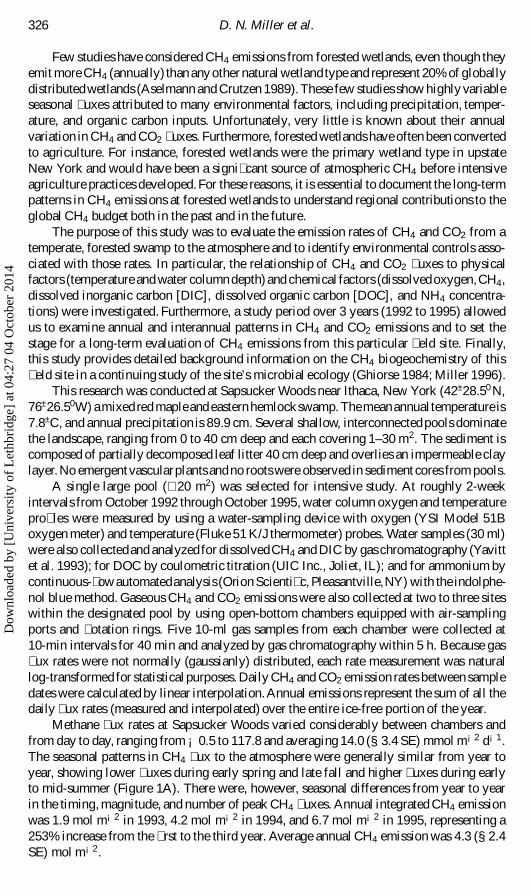
Methane � ux rates at Sapsucker Woods varied considerably between chambers andfrom day to day, ranging from ¡ 0.5 to 117.8 and averaging 14.0 (§ 3.4 SE) mmol m ¡ 2 d ¡ 1.The seasonal patterns in CH4 � ux to the atmosphere were generally similar from year toyear, showing lower � uxes during early spring and late fall and higher � uxes during earlyto mid-summer (Figure 1A). There were, however, seasonal differences from year to yearin the timing, magnitude, and number of peak CH4 � uxes. Annual integrated CH4 emissionwas 1.9 mol m ¡ 2 in 1993, 4.2 mol m ¡ 2 in 1994, and 6.7 mol m ¡ 2 in 1995, representing a253% increase from the � rst to the third year. Average annual CH4 emission was 4.3 (§ 2.4SE) mol m ¡ 2.
Dow
nloa
ded
by [
Uni
vers
ity o
f L
ethb
ridg
e] a
t 04:
27 0
4 O
ctob
er 2
014

Greenhouse Gas Fluxes in a Forested Swamp 327
FIGURE 1 Seasonal and annual changes in gaseous � uxes and environmental factors atSapsucker Woods. Fluxes from the water column were measured over 40 min with � oating� ux chambers. Environmental factors were measured at the sediment–water interface. Errorbars are the SE of ln-transformed � uxes from all � ux chambers.
Carbondioxide� uxes,measured during1993and 1994,were also spatial and seasonallyvariable, ranging from ¡ 37.0 to 138.0 mmol m ¡ 2 d ¡ 1, but the seasonal pattern was verysimilar during both 1993 and 1994 (Figure 1A). Carbon dioxide � uxes were highest fromearly spring through early summer, and then decreased in late July at the same time that theCH4 � uxes decreased. After a brief period of low CO2 � ux, � uxes increased to their earlysummer values until the water column froze over in December. Average CO2 � ux over thestudy was 46.8 (§ 7.5 SE) mmol m ¡ 2 d¡ 1. Annual integrated CO2 emission was 10.5 molm ¡ 2 in 1993 and 11.9 mol m ¡ 2 in 1994. The 2-year annual average CO2 emission was 11.2(§ 1.0 SE) mmol m ¡ 2.
Drastic changes in water table position signi� cantly affect CH4 and CO2 � uxes fromforested wetlands, the CH4 � ux being larger and the CO2 � ux lower when the water table isabove the sediment/soil surface than when the water table is below the sediment/soil surface(Amaral and Knowles 1994; Bubier et al. 1995; Dise 1993; Harriss et al. 1982; Moore andKnowles 1990). Indeed, very large CH4 ef� uxes of methane trapped in the sediment occur
Dow
nloa
ded
by [
Uni
vers
ity o
f L
ethb
ridg
e] a
t 04:
27 0
4 O
ctob
er 2
014
328 D. N. Miller et al.
as the water table drops below the sediment surface (Dise 1993; Moore et al. 1990; Deniervan der Gon et al. 1996). At our site, normal changes in water column depth during 1993and 1994 (Figure 1B) correlated poorly with CH4 � ux (r = ¡ 0.12) but moderately wellwith CO2 � ux (r = 0.52). As expected, a large CH4 release was observed during the 1995drought as the CH4 trapped in the sediments was released.
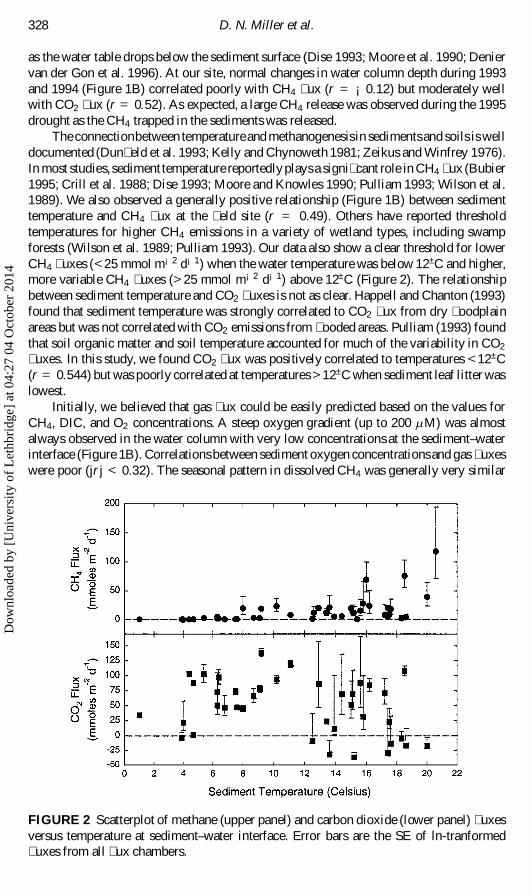
The connectionbetween temperatureand methanogenesisin sedimentsand soils is welldocumented (Dun� eld et al. 1993; Kelly and Chynoweth 1981; Zeikus and Winfrey 1976).In most studies, sediment temperature reportedlyplays a signi� cant role in CH4 � ux (Bubier1995; Crill et al. 1988; Dise 1993; Moore and Knowles 1990; Pulliam 1993; Wilson et al.1989). We also observed a generally positive relationship (Figure 1B) between sedimenttemperature and CH4 � ux at the � eld site (r = 0.49). Others have reported thresholdtemperatures for higher CH4 emissions in a variety of wetland types, including swampforests (Wilson et al. 1989; Pulliam 1993). Our data also show a clear threshold for lowerCH4 � uxes (<25 mmol m ¡ 2 d ¡ 1) when the water temperature was below 12±C and higher,more variable CH4 � uxes (>25 mmol m ¡ 2 d ¡ 1) above 12±C (Figure 2). The relationshipbetween sediment temperature and CO2 � uxes is not as clear. Happell and Chanton (1993)found that sediment temperature was strongly correlated to CO2 � ux from dry � oodplainareas but was not correlated with CO2 emissions from � ooded areas. Pulliam (1993) foundthat soil organic matter and soil temperature accounted for much of the variability in CO2
� uxes. In this study, we found CO2 � ux was positively correlated to temperatures <12±C(r = 0.544) but was poorly correlated at temperatures >12±C when sediment leaf litter waslowest.
Initially, we believed that gas � ux could be easily predicted based on the values forCH4, DIC, and O2 concentrations. A steep oxygen gradient (up to 200 l M) was almostalways observed in the water column with very low concentrations at the sediment–waterinterface (Figure 1B). Correlationsbetween sediment oxygen concentrationsand gas � uxeswere poor ( j r j < 0.32). The seasonal pattern in dissolved CH4 was generally very similar
FIGURE 2 Scatterplot of methane (upper panel) and carbon dioxide (lower panel) � uxesversus temperature at sediment–water interface. Error bars are the SE of ln-tranformed� uxes from all � ux chambers.
Dow
nloa
ded
by [
Uni
vers
ity o
f L
ethb
ridg
e] a
t 04:
27 0
4 O
ctob
er 2
014

Greenhouse Gas Fluxes in a Forested Swamp 329
from year to year, with two peak concentrations observed at the sediment–water interfaceduring early summer and again in late fall (Figure 1C). There were, however, substantialdifferences in the timing,duration,and magnitudeof peak CH4 concentrations.As expected,CH4 � ux correlated most strongly with dissolved CH4 (r = 0.67), but a substantial amountof CH4 � ux variability remained unexplained. Surprisingly, the correlation between CO2
� ux and DIC was quite poor (r = 0.03).Studies of other wetlands have also reported the close association between CH4 � ux
and carbon availability to the anaerobic microbial community (Amaral and Knowles 1994;Delwiche and Cicerone 1993; Kelly and Chynoweth 1981; Wilson et al. 1989). At Sap-sucker Woods swamp, the presence of leaf litter is an indicator of carbon availability and aprerequisite for CH4 � ux. On a yearly cycle, leaf litter is almost completely broken downby midsummer, a time when both CH4 and CO2 � uxes are signi� cantly reduced. DOC con-centrations, presumably originating from leaf decomposition, are also lowest during thistime (Figure 1D). As expected, DOC concentrations increased as new leaf litter entered thewater column in the fall.
Ammonium, which may inhibit CH4 consumption, was measured from August 1993to December 1994 and was quite dynamic. Correlations between gas � ux and ammoniumconcentrations were quite poor ( j r j < 0.28). We also examined the data set for any delayedresponses in CH4 and CO2 � uxes by lagging the � ux data by one sampling time interval, butcorrelations did not improve. Similarly, correlations between gas � uxes and environmentalgradients (difference between water surface and sediment measurements) did not improve.
We developed empirical models for CH4 and CO2 emissions with the various environ-mental factors at temperature above and below the 12±C threshold, using stepwise multipleregression analysis in the MINITAB statistical software package (Minitab Inc., State Col-lege, PA). Dissolved CH4 and temperature were the best predictors of CH4 � uxes whensediment–water interface temperatures were above and below 12±C (r2 = 0.59 and 0.77,respectively). At temperatures <12±C, temperature was the only signi� cant factor in theCO2 � ux regression models (r2 = .31). For CO2 � uxes at temperatures >12±C, CH4, DIC,and water column depth were signi� cant predictors (r2 = 0.69).
Accurate predictions of future global atmospheric CH4 concentrations depend on acomprehensive knowledge of CH4 emissions from various wetland types and the year-to-year variability within individualwetlands. Although the range of CH4 � uxes from pools atSapsuckerWoods swamp was similar to reported rates for other swamps and wetland ponds,our average daily CH4 � ux for the entire study period was substantially greater. Similarly,average annual CH4 emission (4.3 § 1.4 mol m ¡ 2) was signi� cantly greater from SapsuckerWoods swamp than from other swamps. Furthermore, emissions during individual yearsfrom just this single site varied from 1.9 to 6.7 mol CH4 m ¡ 2. Annual differences in CH4
emission may be related to a variety of factors, including seasonal deviations from normaltemperature and precipitation and variation in the timing and magnitude of organic carboninputs. Warmer than normal temperatures in October and November 1994 probably led toa greater CH4 � ux during fall. Thus, annual CH4 emission was larger that year. In 1995,an extreme deviation in temperature and precipitation lowered the water table and all theCH4 trapped was released, resulting in a large annual emission. Additionally, the timingand magnitude of organic carbon inputs would also affect annual CH4 � ux. Smaller-scalepatchiness of leaf litter inputs may account for the large differences observed in CH4 � uxbetween chambers during an individual sampling event.
Ultimately, net CH4 emission is the balance between CH4 productionby methanogens,which is controlled in part by temperature and substrate availability,and CH4 consumptionby methane-oxidizing bacteria. Studies of shallow wetlands show that CH4 consumptionoccurs in the water column (Pulliam 1993) or at the sediment–water interface (Happell andChanton 1993; King 1990; Yavitt et al. 1992). This internal sink for CH4 can account for
Dow
nloa
ded
by [
Uni
vers
ity o
f L
ethb
ridg
e] a
t 04:
27 0
4 O
ctob
er 2
014

330 D. N. Miller et al.
as much as 90% of the CH4 released from anaerobic zones. Although O2, CH4, Cu, andnitrogenavailabilityaffect methanotrophyin pure cultures (Graham et al. 1993), it is unclearwhat environmental factors control methane-oxidizing activity in forested wetlands.
Forested wetlands are also signi� cant sources of CO2, another greenhouse gas that hasbeen increasing since the beginning of the industrial revolution (Dickinson and Cicerone1986). Although this increase is widely attributed to anthropomorphic sources, swampforests are signi� cant sources of CO2 ranging from 16.5 to 102.2 mol m ¡ 2 yr¡ 1 (Happelland Chanton 1993). Until recently, multiyear studies measuring CO2 emissions from wet-lands and their potential effects in global climate change have been very few. Large CO2
emissions from � oodplain and swamp forest ecosystems are attributed to root respiration(Pulliam 1993; Happell and Chanton 1993). At our site, no roots were observed in sedimentcore pro� les spanning the entire 40-cm sediment layer, which accounts for our lower CO2
emissions. It is surprising to � nd that CO2 emissions were so consistent from 1993 to 1994,a period when CH4 emissions more than doubled.Clearly, the processes that control annualexports differ between CH4 and CO2 emissions.
Annual carbon emissions re� ect the balance between total carbon inputs (leaf litter andphotosynthesis) and carbon storage in the sediments. Unlike other forest swamps, our sitehasvery littlepeat accumulation,thus,most of thecarbon inputeach year is convertedto CH4
and CO2. Although total carbon � ux from Sapsucker Woods was lower than other swamps,total carbon (C) export (12.4 and 16.1 mol m ¡ 2 yr¡ 1) falls within the reported range of 8.3 to36.3 mol m ¡ 2 yr¡ 1 for above-ground litter production at other swamp forests (Happell andChanton 1993; Moore and Knowles 1990). The proportion of total carbon emitted as CH4
from forested swamp ecosystems may be more important because CH4 is 25 times morepotent than CO2 as a greenhouse gas (Rodhe 1990). Forest swamp ecosystems typicallyemit <7% of total gaseous carbon exports as CH4 (Happell and Chanton 1993). On anannual basis, CH4 emissions from our site were much larger and accounted for 15.3% and26.1% of the gaseous carbon exports during 1993 and 1994, respectively.The importanceofsites such as Sapsucker Woods swamp, which have high annual variability and emit a highpercentage of gases as CH4, needs to be reevaluated to make more accurate predictions offuture global warming as a result of accumulatinggreenhouse gases. Furthermore, physicaland chemical environmental factors cannot explain all of the seasonal and annual variationin greenhouse gas emissions from this forested wetland. A detailed understanding of themicrobial processes that govern CH4 and CO2 formation and consumption is needed forour understanding of greenhouse gas emissions from wetlands and future global warming.
References
Amaral JA, Knowles R. 1994. Methane metabolism in a temperate swamp. Appl Environ Microbiol60:3945–3951.
Aselmann I, Crutzen PJ. 1989. Global distribution of natural freshwater wetlands and rice paddies,their net primary productivity, seasonality and possible methane emissions. J Atmos Chem8:307–358.
BartlettKB, Harriss RC. 1993. Review and assessmentof methane emissions from wetlands. Chemo-sphere 26:261–320.
Bubier JL, Moore TR, BellisarioL, Comer NT. 1995.Ecological controlson methane emissions froma northernpeatlandcomplex in the zone of discontinuouspermafrost,Manitoba,Canada. GlobalBiogeochem Cycles 9:455–470.
Crill PM, Bartlett KB, Harriss RC, Gorham E, Verry ES, Sebacher DL, Madzar L, Sanner W. 1988.Methane � ux from Minnesota peatlands. Global Biogeochem Cycles 2:371–384.
Crill PM, Harriss RC, Bartlett KB. 1991. Methane � uxes from terrestrial wetland environments,91-109. In: JE Rogers, WB Whitman, editors. Microbial production and consumption of green
Dow
nloa
ded
by [
Uni
vers
ity o
f L
ethb
ridg
e] a
t 04:
27 0
4 O
ctob
er 2
014

Greenhouse Gas Fluxes in a Forested Swamp 331
house gases: methane, nitrogen oxides, and halomethanes. Washington, DC: American Societyfor Microbiology, p 91–109.
Delwiche CC, Cicerone RJ. 1993. Factors affecting methane production under rice. Global Bio-geochem Cycles 7:143–155.
Denier van der Gon HAC, van Breemen N, Neue HU, Lantin RS, Aduna JB, Alberto MCR, Wass-mann R. 1996. Release of entrapped methane from wetland rice � elds upon soil drying. GlobalBiogeochem Cycles 10:1–7.
Dickinson RE, Cicerone RJ. 1986. Future global warming from atmospheric trace gases. Nature319:109–115.
Dise NB. 1993. Methane emission from Minnesota peatlands:spatial and seasonalvariability.GlobalBiogeochem Cycles 7:123–142.
Dlugokencky EJ, Steele LP, Lang PM, Masarie KA. 1994. The growth rate and distribution of atmo-spheric methane. J Geophys Res 99:17021–17043.
Dun� eld P, Knowles R, Dumont R, Moore TR. 1993. Methane production and consumption in tem-perate and subarctic peat soils: response to temperatureand pH. Soil Biol Biochem 25:321–326.
GhiorseWC. 1984.Bacterial transformationsofmanganesein wetlandenvironments.In:MJ Klug,CAReddy, editors. Current perspectives in microbial ecology, Washington, DC: American Societyfor Microbiology, p 615–622.
Graham DW, Chaudhary JA, Hanson RS, Arnold RG. 1993. Factors affecting competition betweenType I and Type II methanotrophs in two-organism, continuous-�ow reactors. Microb Ecol25:1–17.
Happell JD, Chanton JP. 1993. Carbon remineralization in a north Florida swamp forest: effects ofwater level on the pathways and rates of soil organic matter decomposition.Global BiogeochemCycles 7:475–490.
HarrissRC, SebacherDI, Day FP Jr. 1982.Methane � ux in the Great Dismal Swamp. Nature 297:673–674.
Kelly CA, Chynoweth DP. 1981. The contributionsof temperature and of the input of organic matterin controlling rates of sediment methanogenesis.Limnol Oceanogr 26:891–897.
Khalil MAK, Rasmussen RA. 1990. Atmosphericmethane: recentglobal trends.Environ Sci Technol24:549–553.
King GM. 1990. Dynamics and controls of methane oxidation in a Danish wetland sediment. FEMSMicrob Ecol 74:309–324.
Miller DN. 1996. Biogeochemical, microbiological, and molecular insights into the controls onmethane emissions from a forested wetland. Ph.D. thesis. Ithaca, NY: Cornell University.
Moore TR, Knowles R. 1989. The in� uence of water table levels on methane and carbon dioxideemissions from peatland soils. Can J Soil Sci 69:33–38.
Moore TR, Knowles R. 1990. Methane emissions from fen, bog, and swamp peatlands in Quebec.Biogeochem, 11:45–61.
Moore TR, Roulet N, Knowles R. 1990. Spatial and temporal variations of methane � ux from sub-arctic/northern boreal fens. Global Biogeochem Cycles 4:29–46.
Pulliam WM. 1993. Carbon dioxide and methane exports from a Southeastern � oodplain swamp.Ecol Monogr 63:29–53.
Rodhe H. 1990. A comparison of the contributionof various gases to the greenhouse effect. Science248:1217–1219.
WhitingGJ, ChantonJP. 1993.Primary productioncontrolof methaneemission fromwetlands.Nature364:794–795.
Wilson JO, Crill PM, Bartlett KB, Sebacher DI, Harriss RC, Sass RL. 1989. Seasonal variation ofmethane emissions from a temperate swamp. Biogeochemistry 8:55–71.
Yavitt JB, Angell LL, Fahey TJ, Cirmo CP, Driscoll CT. 1992. Methane � uxes, concentrations, andproduction in two Adirondack beaver impoundments. Limnol Oceanogr 37:1057–1066.
Yavitt JB, Wieder RK, Lang GE. 1993. CO2 and CH4 dynamics of a Sphagnum-dominated peatlandin West Virginia. Global Biogeochem Cycles 7:259–274.
Zeikus JG, Winfrey MR. 1976. Temperature limitationof methanogenesis in aquatic sediments.ApplEnviron Microbiol 31:99–107.
Dow
nloa
ded
by [
Uni
vers
ity o
f L
ethb
ridg
e] a
t 04:
27 0
4 O
ctob
er 2
014