seasonal and successional streamflow response to forest …€¦ · · 2004-05-19absolute...
TRANSCRIPT
Seasonal and successional streamflow response to forest cutting
and regrowth in the northwest and eastern United States
Julia A. Jones and David A. Post1
Department of Geosciences, Oregon State University, Corvallis, Oregon, USA
Received 12 December 2003; revised 15 January 2004; accepted 16 February 2004; published 21 May 2004.
[1] This study examined daily streamflow response over up to four decades in northwestconifer forest and eastern deciduous forest sites in the United States. We used novelmethods to analyze daily observations of climate and streamflow spanning more than900 basin years of record at 14 treated/control basin pairs where forest removal andregrowth experiments were underway in the period 1930–2002. In the 1 to 5-year periodafter forest removal, maximum daily increases ranged from 2 to 3 mm at deciduous forestsites, to 6 to 8 mm at conifer forest sites. Significant spring surpluses persisted for upto 35 years in conifer forest basins, but winter and spring streamflow deficits appearedafter 10 to 15 years of forest regrowth in eastern deciduous forest basins. In all 5-yrposttreatment periods, absolute changes in daily streamflow were significantly more likelyduring moist, warm seasons, or during snowmelt seasons, but relative changes were morelikely during warm seasons irrespective of moisture status. Both relative and absolutestreamflow changes in the 1 to 5 and 15 to 25-year periods after forest removal weresignificantly positively related to the age of the forest at the time it was cut. Easterndeciduous forests had been disturbed by logging or hurricane 12 to 56 years prior to forestremoval, while Pacific Northwest conifer forests had been not experienced logging orwildfire for 90 to 450 years. Paired basin experiments provide a continuous, andcontinuously changing, record of vegetation structure, composition, and climate, and theireffects on streamflow. INDEX TERMS: 1860 Hydrology: Runoff and streamflow; 1803 Hydrology:
Anthropogenic effects; 1863 Hydrology: Snow and ice (1827); KEYWORDS: Caspar Creek experimental forest,
Coweeta experimental forest, Coyote Creek, Fernow experimental forest, H. J. Andrews Forest, Hubbard
Brook experimental forest
Citation: Jones, J. A., and D. A. Post (2004), Seasonal and successional streamflow response to forest cutting and regrowth in the
northwest and eastern United States, Water Resour. Res., 40, W05203, doi:10.1029/2003WR002952.
1. Introduction
[2] Paired-basin forestry experiments are a major sourceof data on climate, streamflow, and vegetation for testing oftheoretical propositions in hydrology. Yet to date, thehydrologic implications of paired basin experiments havebeen largely examined for individual experiments, or inreviews or meta-analyses [e.g., Bosch and Hewlett, 1982;Robinson et al., 2003] combining results from studies usingdisparate methods. Hydrologic modeling efforts frequentlyemploy paired-basin data, but inferences are limited byuncertainty about many parameters, including vegetation-climate-soil interactions [Beven, 2002].[3] Studies of eco-physiology, global change, and
stream ecology are providing hydrologists with challenginghypotheses about vegetation and climate coupling to hydrol-ogy. Eco-physiology studies argue that forest structureand composition develop during succession to reduce stresson plants and optimally use resources, including moisture[Eagleson, 2002]. Studies of global change, including
climate change, indicate that streamflow responds tochanges in temperature and rainfall [Hodgekins et al.,2003] with concurrent changes in vegetation cover andspecies composition [e.g., Shafer et al., 2001]. Streamecologists advocate restoration policies based on streamflowvariability [Poff et al., 1997], as well as habitat structure.Results from paired-basin experiments can contribute tothese issues, by revealing the coupling among vegetation,atmosphere, soil, and streamflow at spatial and temporalscales intermediate between plot- and reach-scale studiescharacteristic of eco-physiology and stream ecology, and thecoarse scales of climate and land use change modeling.[4] In paired basin experiments, both increases and
decreases in streamflow may occur in both relative andabsolute terms at different seasons or time periods aftertreatment, providing clues about causal mechanisms, andgeomorphic and ecological consequences, of vegetationchange. In published studies, the largest relative changesin streamflow occurred in summer months after removal ofeastern deciduous forest [Douglass and Swank, 1972, 1975;Swank et al., 2001; Hornbeck et al., 1997; Martin et al.,2000] and western conifer forest [Rothacher, 1975; Harr etal., 1979, 1982]. However, in conifer sites, the largestabsolute streamflow increases occurred during wet wintermonths [Rothacher, 1970; Lewis et al., 2001]. Lags of
1Now at CSIRO Land and Water, Aitkenvale, Queensland, Australia.
Copyright 2004 by the American Geophysical Union.0043-1397/04/2003WR002952$09.00
W05203
WATER RESOURCES RESEARCH, VOL. 40, W05203, doi:10.1029/2003WR002952, 2004
1 of 19

several months between periods of vegetation water use andstreamflow responses have been reported from southeasterndeciduous forest sites [Swank et al., 1988].[5] Both hydrologic and ecological causal mechanisms
have been invoked to explain varied streamflow responsesin paired basin experiments. In the northwestern UnitedStates, conifer forest removal may modify cloudwaterinterception [Harr, 1982] as well as snowpack dynamics[Harr, 1981; Berris and Harr, 1987] during wet (winter)seasons. In the eastern United States, vegetation species inearly succession may be higher water users per unit leaf areathan the species removed, reducing summer streamflows[Hornbeck et al., 1997; Swank et al., 2001]. Also, conifersmay use more water over greater periods of the year thandeciduous forests, reducing fall, winter, or spring flows[Swank and Douglass, 1974; Swank et al., 1988].[6] Differences among basins where forest removal
experiments have been conducted lend themselves to testingthe generality of hypotheses about causes and consequencesof vegetation change for streamflow. The eastern US has a
mesic climate with wet summers whereas the northwesternUS has a xeric climate with dry summers. Northern andhigh-elevation basins have seasonal snow, but basins atlower latitudes or elevations have transient snowpacks or nosnow. Basins in the eastern US have deciduous forestsmostly regenerating from logging or other disturbances inthe early 20th century, whereas basins in the northwesternUS have conifer forests that have been protected fromlogging and wildfire since at least 1900. Thus season, foresttype, and forest age, both time since treatment and age ofthe forest when it was removed, all may influence stream-flow response to forest removal.[7] Technological developments also lend themselves to a
broad analysis of paired-basin forest removal experiments[Jones and Swanson, 2001]. Records of up to sixty years ofcontinuous streamflow and associated measurements noware available from many sites [Post et al., 1998]. Many ofthese records are available through online data harvesters(e.g., hydro-DB [Baker et al., 2000]). New methods arebeing developed for testing hypotheses with long-termstreamflow data sets [e.g., Jones and Grant, 1996; Jones,2000; Post and Jones, 2001]. Finally, increased computerpower and growth of the Internet now permit data sets frommany sites to be readily compiled and analyzed in onelocation.
2. Conceptual Model
[8] Hydrologic responses to forest canopy removal andregrowth can be predicted from the hydrologic cycle(Figure 1). Because forest vegetation is coupled to theatmosphere, the snowpack, and the soil, three major classesof hydrologic responses to forest removal and regrowthinvolve changes in forest canopy interactions with: (1) theatmosphere and soils (i.e., cloudwater interception Pc,canopy interception Ci, evaporation from the canopy andsoils Ce and Se, and transpiration St, Figure 1), (2) snow-pack accumulation and melt (i.e., snow accumulation Na,sublimation Ne, and snowmelt Nr, Figure 1), and (3) soilmoisture storage (i.e., additions and losses Sa and Sr,Figure 1).[9] We tested the following hypotheses.[10] H1. Forest vegetation affects streamflow through
evapotranspiration, interception, and soil moisture storage.Therefore streamflow responses to forest removal shouldoccur when temperature is conducive to evapotranspiration,or during periods of snowmelt. Evapotranspiration effectsare large in absolute terms at times of year when soils aremoist (Se, St, Sa and Sr are large), but they are large inrelative terms at times of year when temperature is condu-cive to transpiration irrespective of soil moisture (Se and Stare large but Sa and Sr are small). Snow interception effectsare large in absolute terms at times of year when soils aremoist and snowmelt is occurring (Sa, Sr, and Nr are large).In sites with cold snowpacks, young deciduous forestsproduce smaller snowpacks (Na, Ne, and Ce increase)compared to older deciduous forests, but in sites with warmsnowpacks, young conifer forests produce larger snowpacks(Na, Ne, and Ce decrease) compared to older conifer forests.Alternatively, streamflow responses to forest removal mayoccur during times of year when neither evapotranspirationnor snowmelt is occurring, because soil moisture storagereservoirs exert a lagged effect.
Figure 1. Ten fluxes involving moisture storage reservoirs(boxes) in vegetation canopies, snowpacks, and soils inforested basins. Inputs to the system are from precipitation(P) and cloudwater interception (Pc); output is streamflow(Q). Fluxes into and out of the canopy are interception (Ci),throughfall (Cr) and evaporation (Ce). Fluxes into and out ofthe snowpack are snow accumulation (Na), sublimation andevaporation (Ne), and snowmelt (Nr). Fluxes into and out ofthe soil are soil water accumulation (Sa) and release (Sr),evaporation (Se) and transpiration (St).
2 of 19
W05203 JONES AND POST: SEASONAL AND SUCCESSIONAL STREAMFLOW W05203

[11] H2: The forest vegetation effect on streamflowdepends upon forest structure and composition, which varywith the age of vegetation. Two measures of forest age arerelevant: the age of the forest in the treated basin (time sincetreatment) and the difference in ages of the forests betweenthe treated and control basins (which is equivalent to the timesince most recent pre-treatment forest disturbance). Youngforests use more water than older forests at times of yearwhen temperature is conducive to transpiration, irrespectiveof soil moisture (Se and St are larger relative to Sa and Sr foryoung than older forests). Therefore streamflow responsewill decline rapidly in the first few decades of forestregrowth, and forests aged 10 to 30 years will producesummer streamflow deficits relative to older forests. How-ever, as forests age, structure and composition change so asto better utilize water available at times of year whentranspiration is temperature- or moisture-limited. Thereforestreamflow responses will be positively related to the differ-ence in forest age between the treated and control basins.
3. Study Sites
[12] Study sites were located in six experimental forests,three in the Pacific Northwest of the United States, andthree in the eastern United States (Table 1). As of 2002,Pacific Northwest sites (the Andrews, Coyote Creek, andCaspar Creek Experimental Forests) had conifer forests upto 500-yrs old and dry summers. Eastern sites (the HubbardBrook, Fernow, and Coweeta Experimental Forests) had<100 yr old deciduous forests and wet summers. Thenorthernmost sites (Andrews, Hubbard Brook) had seasonalsnowpacks. Mean annual precipitation ranged from1000 mm to over 2000 mm at both conifer and deciduoussites (Table 1).[13] Forest age was determined as the time since the most
recent severe disturbance documented at that site (Table 1).The most recent disturbances included wildfire and loggingin conifer forests, and hurricane and logging in deciduousforest (Table 1). Conifer forest types included westernhemlock (Andrews), mixed-conifer (Coyote Creek) andredwood forests (Caspar Creek). Deciduous forest typesincluded northern hardwoods (Hubbard Brook) and oak-hickory forests (Fernow, Coweeta) (Table 1).[14] Each site consisted of one or more paired-watershed
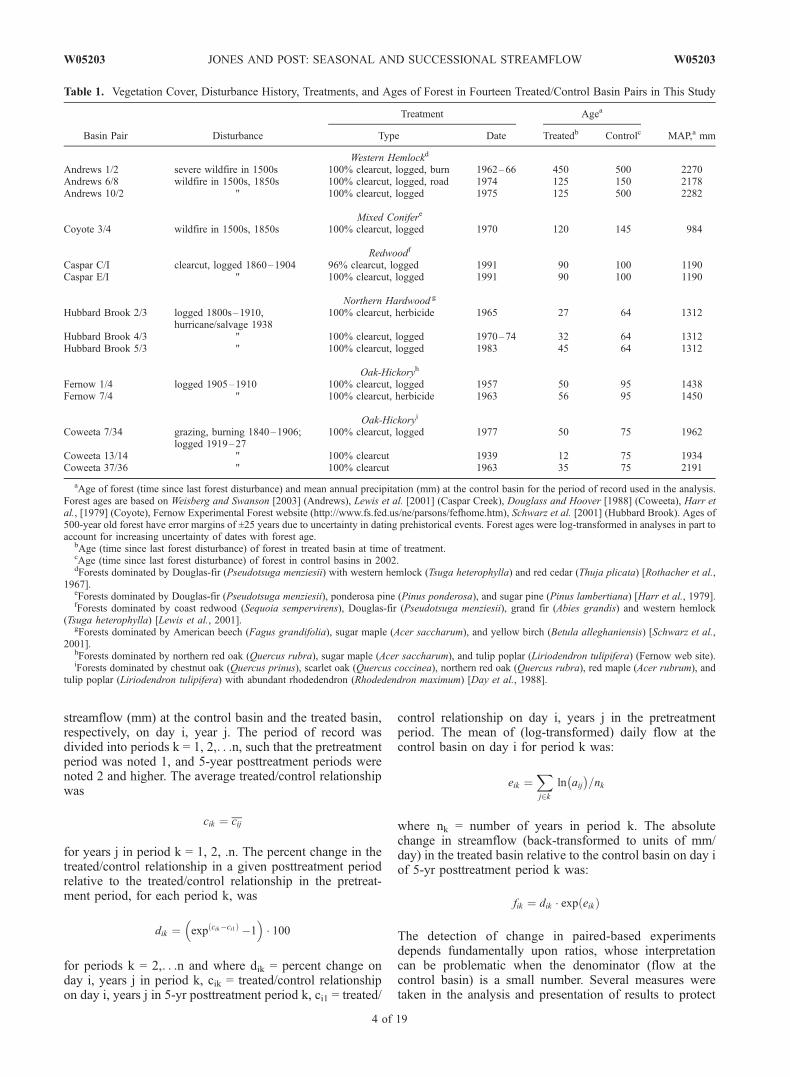
experiments in which 100% of forest cover had beenharvested and an unharvested control basin exists (Table 1).Forest harvest treatments at the fourteen treated basinsoccurred over more than half a century, from the 1930s to1990 (Figure 2). In ten of these cases forest harvest occurredin a single year, but in four cases harvest occurred overseveral years (Table 1, Figure 2). Treatment involvedlogging (removal of wood products) in ten treated water-sheds. In four cases wood products were not removed, andin two of these four cases herbicide was applied for severalyears after logging (Table 1). Because of differing distur-bance histories, 90 to 450 yr-old forests were removed in theconifer sites, but 12 to 56 yr-old forests were removed in thedeciduous forest sites (Table 1).[15] Long-term records of streamflow and climate have
been collected at 26 basins (14 treated, 12 control) from thesix study sites. Basin size ranged from 9 to 96 hectares, andstreamflow and climate records span periods ranging from17 years to 63 years (Figure 2). Pre-treatment records were
6 or more years in length in all but one treated basin, andposttreatment records ranged from 11 to over 40 years(Figure 2). Most of the basins ranged in size from 20 to50 ha, and the ages of most harvested forest ranged from 30to 125 years (Table 2, Figure 2).
4. Methods
4.1. Datasets and Data Collection
[16] Mean daily streamflow, precipitation, minimum andmaximum temperature, and snowpack data from five ofthe six sites are publicly available on the worldwide weband were collected electronically through Hydro-DB, anautomated data harvester http://www.fsl.orst.edu/hydrodb/).Data from the sixth site (Coweeta Experimental Forest) arenot publicly available, but they were provided by U.S.Forest Service scientists (L. Swift and W. Swank) forperiods of record through 1995. The resulting primary dataset consisted of over 750,000 observations spanning morethan 900 watershed-years of streamflow records. Originalstreamflow data in units of L/s were converted to mm/day(unit area discharge):
mm
day¼ 8:64 � L
s� A
where A is basin area in hectares. We used a water yearfrom 1 October to 30 September. For Caspar Creek manyvalues from late April to early November were missingvalues.[17] The initial data set comprised records from 26 basins
(14 treated, 12 control). We present results from 14 treated/control pairs (Table 2). In 11 of these 14 pairs we used thetreated/control pairs established by the original researchers.In three cases, we used an alternative to the original controlbasin (Table 2). In these three cases, Coweeta 7/34 (7/2),Coweeta 13/14 (13/18), and Andrews 10/2 (10/9), theoriginal control basins (in parentheses) were less than 15 hain size. The average standard deviation of daily flow atcontrol basins in mm (y) was significantly negatively relatedto basin size in hectares (x) (y = 2.29 exp(�0.034x); r2 =0.84; n = 12). Therefore streamflow changes were notdetectable using the original (<15 ha) basins, but they weredetectable when the same treated basins were compared tolarger, nearby control basins. Moreover, in one case(Andrews 10/9) the original treated/control relationshipwas suspect because a flume change 15 months prior tothe treatment produced significant changes in streamflow atthe control basin (Andrews 9).
4.2. Calculating Streamflow Responses to ForestRemoval and Regrowth
[18] The change in streamflow in the treated basin rela-tive to the pretreatment treated/control relationship wascalculated by day of year and averaged for 5-yr periodsafter forest removal, following Jones and Grant [1996] andJones [2000]. The treated/control relationship was
cij ¼ lnbij� �aij� �
" #
where cij = the (ln-transformed) ratio of streamflow at thetreated and control basins, day i, year j; aij and bij = unit area
W05203 JONES AND POST: SEASONAL AND SUCCESSIONAL STREAMFLOW
3 of 19
W05203
streamflow (mm) at the control basin and the treated basin,respectively, on day i, year j. The period of record wasdivided into periods k = 1, 2,. . .n, such that the pretreatmentperiod was noted 1, and 5-year posttreatment periods werenoted 2 and higher. The average treated/control relationshipwas
cik ¼ cij
for years j in period k = 1, 2, .n. The percent change in thetreated/control relationship in a given posttreatment periodrelative to the treated/control relationship in the pretreat-ment period, for each period k, was
dik ¼ exp cik�ci1ð Þ �1� �
� 100
for periods k = 2,. . .n and where dik = percent change onday i, years j in period k, cik = treated/control relationshipon day i, years j in 5-yr posttreatment period k, ci1 = treated/
control relationship on day i, years j in the pretreatmentperiod. The mean of (log-transformed) daily flow at thecontrol basin on day i for period k was:
eik ¼Xj2k
ln aij� �
=nk
where nk = number of years in period k. The absolutechange in streamflow (back-transformed to units of mm/day) in the treated basin relative to the control basin on day iof 5-yr posttreatment period k was:
fik ¼ dik � exp eikð Þ
The detection of change in paired-based experimentsdepends fundamentally upon ratios, whose interpretationcan be problematic when the denominator (flow at thecontrol basin) is a small number. Several measures weretaken in the analysis and presentation of results to protect
Table 1. Vegetation Cover, Disturbance History, Treatments, and Ages of Forest in Fourteen Treated/Control Basin Pairs in This Study
Basin Pair Disturbance
Treatment Agea
MAP,a mmType Date Treatedb Controlc
Western Hemlockd
Andrews 1/2 severe wildfire in 1500s 100% clearcut, logged, burn 1962–66 450 500 2270Andrews 6/8 wildfire in 1500s, 1850s 100% clearcut, logged, road 1974 125 150 2178Andrews 10/2 " 100% clearcut, logged 1975 125 500 2282
Mixed Conifere
Coyote 3/4 wildfire in 1500s, 1850s 100% clearcut, logged 1970 120 145 984
Redwoodf
Caspar C/I clearcut, logged 1860–1904 96% clearcut, logged 1991 90 100 1190Caspar E/I " 100% clearcut, logged 1991 90 100 1190
Northern Hardwood g
Hubbard Brook 2/3 logged 1800s–1910,hurricane/salvage 1938
100% clearcut, herbicide 1965 27 64 1312
Hubbard Brook 4/3 " 100% clearcut, logged 1970–74 32 64 1312Hubbard Brook 5/3 " 100% clearcut, logged 1983 45 64 1312
Oak-Hickoryh
Fernow 1/4 logged 1905–1910 100% clearcut, logged 1957 50 95 1438Fernow 7/4 " 100% clearcut, herbicide 1963 56 95 1450
Oak-Hickoryi
Coweeta 7/34 grazing, burning 1840–1906;logged 1919–27
100% clearcut, logged 1977 50 75 1962
Coweeta 13/14 " 100% clearcut 1939 12 75 1934Coweeta 37/36 " 100% clearcut 1963 35 75 2191
aAge of forest (time since last forest disturbance) and mean annual precipitation (mm) at the control basin for the period of record used in the analysis.Forest ages are based on Weisberg and Swanson [2003] (Andrews), Lewis et al. [2001] (Caspar Creek), Douglass and Hoover [1988] (Coweeta), Harr etal., [1979] (Coyote), Fernow Experimental Forest website (http://www.fs.fed.us/ne/parsons/fefhome.htm), Schwarz et al. [2001] (Hubbard Brook). Ages of500-year old forest have error margins of ±25 years due to uncertainty in dating prehistorical events. Forest ages were log-transformed in analyses in part toaccount for increasing uncertainty of dates with forest age.
bAge (time since last forest disturbance) of forest in treated basin at time of treatment.cAge (time since last forest disturbance) of forest in control basins in 2002.dForests dominated by Douglas-fir (Pseudotsuga menziesii) with western hemlock (Tsuga heterophylla) and red cedar (Thuja plicata) [Rothacher et al.,
1967].eForests dominated by Douglas-fir (Pseudotsuga menziesii), ponderosa pine (Pinus ponderosa), and sugar pine (Pinus lambertiana) [Harr et al., 1979].fForests dominated by coast redwood (Sequoia sempervirens), Douglas-fir (Pseudotsuga menziesii), grand fir (Abies grandis) and western hemlock
(Tsuga heterophylla) [Lewis et al., 2001].gForests dominated by American beech (Fagus grandifolia), sugar maple (Acer saccharum), and yellow birch (Betula alleghaniensis) [Schwarz et al.,
2001].hForests dominated by northern red oak (Quercus rubra), sugar maple (Acer saccharum), and tulip poplar (Liriodendron tulipifera) (Fernow web site).iForests dominated by chestnut oak (Quercus prinus), scarlet oak (Quercus coccinea), northern red oak (Quercus rubra), red maple (Acer rubrum), and
tulip poplar (Liriodendron tulipifera) with abundant rhodedendron (Rhodedendron maximum) [Day et al., 1988].
4 of 19
W05203 JONES AND POST: SEASONAL AND SUCCESSIONAL STREAMFLOW W05203
against misleading interpretations from ratios. Streamflowdata were filtered before analysis to remove very low flows.Days with streamflow less than 0.01 mm were treated asmissing values, and streamflow changes were calculatedonly for days with less than two missing values in anyfive-year posttreatment period. Both absolute and relativechanges were calculated to identify instances where verylarge relative changes were small in absolute terms.Relative changes (dik) and absolute changes (fik) weresmoothed with a 15-day window to reduce the effect of largechanges on any given day, and figure axes were restrictedto exclude the occasional values that are improbably large.
Statistical analyses were either non-parametric tests basedon counts of days exceeding some threshold of dik and fik, orregressions of average percent changes by season rather thandaily values.
4.3. Hypothesis Tests
[19] Hypotheses involving seasons were tested using chi-squared tests of independence of streamflow changes byseason [Ramsay and Schaefer, 1996]. Days with absolutestreamflow changes were tested for independence to(1) moist periods when temperatures are conducive toevapotranspiration, and (2) snowmelt periods. Days with
Figure 2. Periods of record of the fourteen small paired-watershed experiments examined in this study.Vertical lines indicate dates of forest harvest and herbicide treatments (where relevant). Experiments arearranged by forest type (conifer, deciduous) in the treated/control pair and age (time since most recentforest disturbance) of the treated watershed. Vertical lines indicate the date of forest removal. Sometreatments lasted for multiple years: forests were harvested over 5 yrs at Andrews 1, Fernow 7 andHubbard Brook 4; herbicide was applied for 3 years at Hubbard Brook 2 and Fernow 7. Some treatedwatersheds (Andrews 10, Coweeta 7, Coweeta 13) were compared to more than one control watershed.
Table 2. Eighteen Treated/Control Basin Pairs Examined in This Study
Treated/ControlBasin Pair
Basin Size, ha Streamflow Record, Years
Treated Control Total Pretreatment Posttreatment
Andrews 1/2a 96 60 1953–2002 9 41Andrews 6/8a 15 22 1964–2002 10 28Andrews 10/2a 10 60 1969–2002 6 27Andrews 10/9 10 9 1969–2002 6 27Caspar C/Ia 26 21 1986–2002 6 11Caspar E/Ia 27 21 1986–2002 6 11Coyote 3/4a 49 50 1964–81 6 11Coweeta 7/2 59 13 1965–96 12 20Coweeta 7/34a 59 33 1965–96 12 20Coweeta 13/2 16 12 1937–62 2 23Coweeta 13/14a 16 61 1937–62 2 23Coweeta 13/18 16 13 1937–62 2 23Coweeta 37/36a 44 49 1944–96 20 43Fernow 1/4a 30 39 1951–2001 6 44Fernow 7/4a 29 39 1957–2001 6 38Hubbard Brook 2/3a 16 42 1958–96 7 31Hubbard Brook 4/3a 36 42 1958–96 12 26Hubbard Brook 5/3a 22 42 1958–96 25 13
aResults from fourteen basin pairs are examined in detail.
W05203 JONES AND POST: SEASONAL AND SUCCESSIONAL STREAMFLOW
5 of 19
W05203

Table 3. Seasons, Defined by Dates, Discharge, Runoff Ratio, Minimum and Maximum Temperatures From Control Basinsa
Control Basin
Moist
Dry or Moist Warm Water YearCool Snow Accumulation Snowmelt
Andrews 2Dates 10/1–12/7 12/8–2/8 2/9–6/12 6/13–9/30 10/1–9/30Discharge, mm 230 525 546 44 1344Runoff ratio, % 36 74 72 28 59Min temperature, �C 3 �1 3 10 4Max temperature, �C 9 4 13 25 14
Andrews 8Dates 9/11–12/6 12/7–2/10 2/11–6/24 6/25–9/10 10/1–9/30Discharge, mm 178 434 524 23 1160Runoff ratio, % 28 67 70 24 53Min temperature, �C 4 �1 4 11 5Max temperature, �C 12 5 14 26 14
Andrews 9Dates 9/12–12/2 12/3–3/2 3/3–3/27 3/28–9/11 10/1–9/30Discharge, mm 190 690 128 213 1222Runoff ratio, % 31 70 66 45 54Min temperature, �C 4 �1 �1 8 4Max temperature, �C 11 4 6 21 14
Coyote 4Dates 11/5–12/25 12/26–2/4 2/5–5/20 5/21–11/4 10/1–9/30Discharge, mm 124 162 201 24 511Runoff ratio, % 51 115 57 10 52Min temperature, �C 1 0 3 9 5Max temperature, �C 7 6 12 22 15
Caspar IDates 11/23–4/24 – – 4/25–11/22 10/1–9/30Discharge, mm 32 – – 415 447Runoff ratio, % 12 – – 46 38Min temperature, �C 10 – – 6 8Max temperature, �C 19 – – 12 16
Hubbard Brook 3Dates – 10/1-3/16 3/17–5/15 5/16–9/30 10/1–9/30Discharge, mm – 346 348 144 837Runoff ratio, % – 58 171 28 63Min temperature, �C – �7 0 11 �3Max temperature, �C – 2 10 21 6
Fernow 4Dates 10/11–4/30 – – 5/1–10/10 10/1–9/30Discharge, mm 486 – – 156 642Runoff ratio, % 63 – – 23 44Min temperature, �C �2 – – 11 4Max temperature, �C 8 – – 23 15
Coweeta 14Dates 10/17–4/17 – – 4/18–10/16 10/1–9/30Discharge, mm 578 – – 385 962Runoff ratio, % 57 – – 49 54Min temperature, �C 0 – – 12 6Max temperature, �C 14 – – 26 20
Coweeta 34Dates 10/17–4/17 – – 4/18–10/16 10/1–9/30Discharge, mm 658 – – 509 1167Runoff ratio, % 59 – – 58 59Min temperature, �C 0 – – 12 6Max temperature, �C 14 – – 26 20
Coweeta 36Dates 10/17–4/17 – – 4/18–10/16 10/1–9/30Discharge, mm 1100 – – 587 1687Runoff ratio, % 89 – – 61 77Min temperature, �C 0 – – 12 6Max temperature, �C 14 – – 26 20
6 of 19
W05203 JONES AND POST: SEASONAL AND SUCCESSIONAL STREAMFLOW W05203

relative streamflow changes were tested for independence towarm periods. For each period k, absolute streamflowchanges were defined as all days i for which the 15-daysmoothed values of
fik > s ln aij� ��
where s[ln(aij)] was the back-transformed, smoothedstandard deviation of aij for all years j in the period ofrecord. Thus nabs,k is the count of days i in the water year forwhich fik, the absolute change in the treated/controlrelationship days in period k, exceeds the variation in theentire record of streamflow on that day at the controlwatershed. Relative streamflow changes were defined as alldays i for which the 15-day smoothed values of
dik > 25
Thus nrel,k is a count of days i in the water year on which thetreated/control relationship in streamflow in period kchanged by more than 25%.[20] Counts of days with absolute and relative changes
(nabs,k, nrel,k) were subdivided by season. Every day of thewater year at each control basin was classified into one offour seasons based on soil moisture, temperature, andsnowmelt (Table 3). Two seasons occurred at basins lackingsnowpacks: (1) warm (and dry at conifer basins, moist atdeciduous basins), and (2) moist, cool. Basins with snow-packs had two additional seasons: (3) moist, snow accumu-lation and (4) moist, snowmelt. Seasons were defined basedon mean values over the entire period of record at eachcontrol basin for each day i of minimum and maximumtemperatures (Tmin,i, Tmax,i), precipitation (Pi), streamflow(Qi), and snow water equivalent (Si). Warm, moist periodswere defined as all days i for which Tmin,i > T*min, Pi > P*,and Qi > Q*, where T*min is a temperature threshold of 5�Cfor deciduous forests and 0.1�C for conifer forests, and P*
and Q* are moisture thresholds of 2 mm and 0.5 mm,respectively. Warm periods were defined as all days i forwhich Tmin,i > T*min, and (for warm, dry periods at coniferbasins) Pi < P* and Qi < Q*. Periods in which snowpackswere present were divided into days for which Si > Si-1(accumulation) or Si < S i-1 (melt).[21] Hypotheses involving succession were tested by
linear regression [Ramsay and Schaefer, 1996]. Responsevariables were the sum of daily streamflow changes fik byseason and for the whole water year, and these sums aspercents of seasonal or annual streamflow (Table 3). Theindependent variable was the difference in age between thecontrol and treated basin (Table 1). Data points in regres-sions were coded by basin types: (1) conifer, seasonal snow;(2) conifer, transient or no snow; (3) deciduous, seasonalsnow; (4) deciduous, transient or no snow (Table 4).
5. Results
5.1. Summer Precipitaton and Snowmelt Effects onDaily Streamflow
[22] Daily streamflow responds to summer precipitationand snowpack characteristics of the basins. The PacificNorthwest (conifer forest) has dry summers, whereas theeast (deciduous forest) has wet summers (Tables 3 and 4,Figure 3). In conifer forest basins with transient or no snow(Andrews 9, Coyote 4, Caspar I), smoothed daily stream-flow peaks in January or February and declines rapidlystarting in March, as precipitation declines and minimumtemperatures rise above 0�C. In deciduous forest basinswith transient or no snow (Fernow, Coweeta), streamflowpeaks in March, just before leafout, and declines rapidly,despite constant precipitation, after minimum temperaturesrise above 5�C. In conifer basins with seasonal snow(Andrews 2, Andrews 8), streamflow remains elevated aftersnowmelt in March, April, and May (Figure 3). In thedeciduous forest basin with a seasonal snowpack (HubbardBrook), streamflow declines after December as the snow-pack forms, rises to a maximum in mid-April duringsnowmelt, begins to decline in late April, and continues todecline rapidly after minimum temperatures rise above 5�Cin May (Figure 3).
5.2. Seasonal Effects
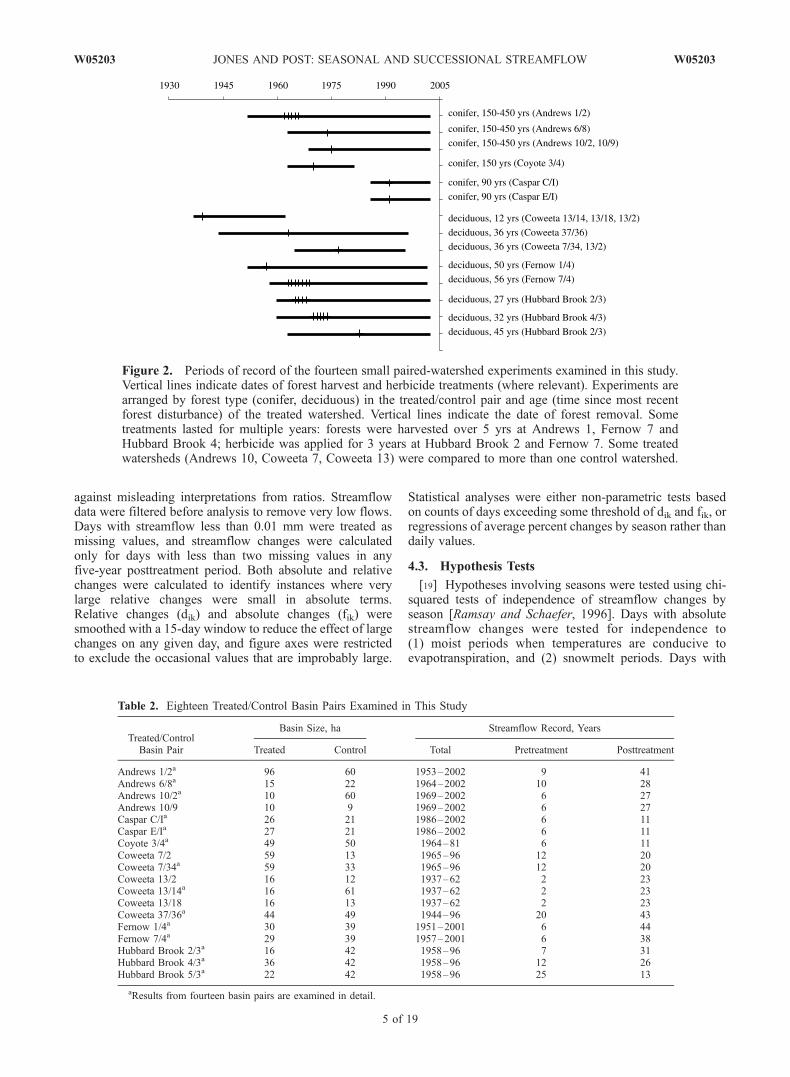
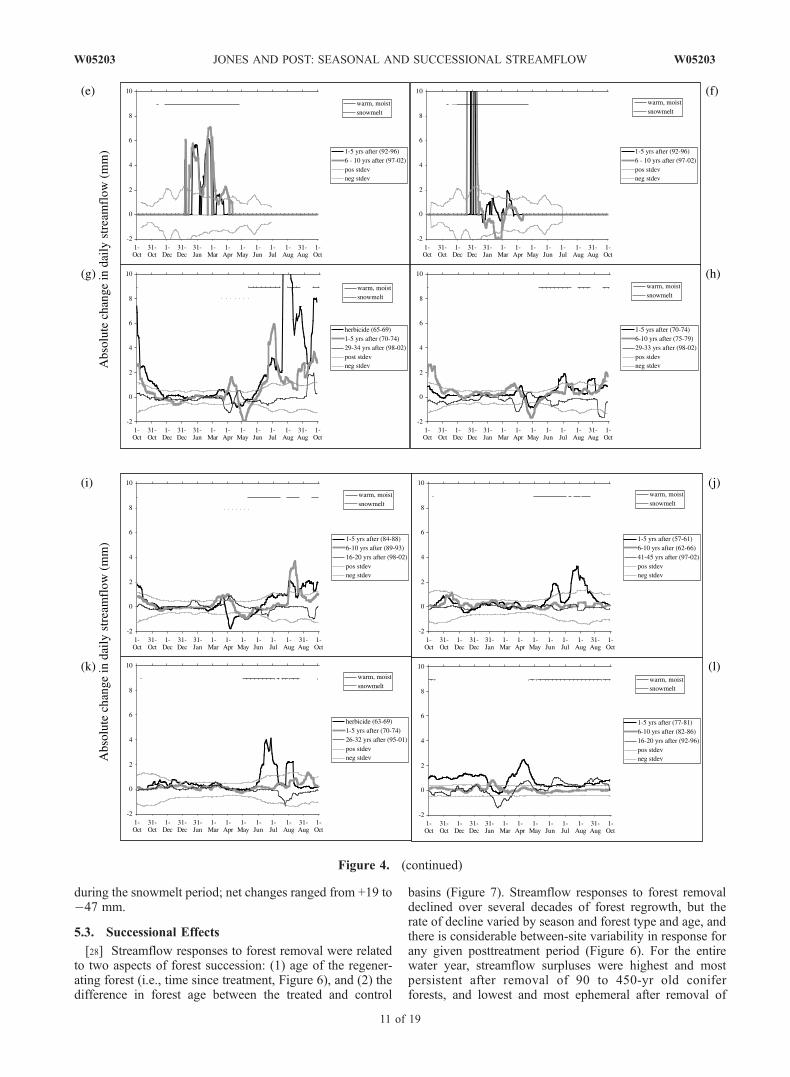
[23] Large streamflow changes, in both absolute andrelative terms, were associated with vegetation change,but they occurred during different seasons and timeperiods in various basin pairs. Absolute changes in dailystreamflow after 100% forest removal were stronglyseasonal, and ranged from slight decreases of up to�2 mm/day, to no change at all, to increases of as muchas 8 mm/day (Figure 4). In conifer forest basins, dailystreamflow increased by as much as 6 to 8 mm during thefall, and 2 to 6 mm in the winter and spring, in the 1 to 5-yrperiod after forest removal. Some increases persisted forup to 35 years. In deciduous forest basins, streamflowchanges were both positive and negative, and occurredduring summer, snowmelt, and other periods. Except inone herbicided basin where initial increases were larger
Note to Table 3aDates are given in month/day. Seasons are defined in the text. Runoff ratio is streamflow/precipitation � 100. The warm season is moist in eastern
forests, and dry in Pacific Northwest forests.
Table 4. Numbers of Treated/Control Basin Pairs by Basin Typea
>100 Year-OldConifer Forest,Dry Summer
<95 Year-OldDeciduous Forest,
Wet Summer Number of Pairs
Seasonalsnowpack
Andrews 1/2 Hubbard Brook 2/3 5Andrews 6/8 Hubbard Brook 4/3
Hubbard Brook 5/3Transient snowor no snow
Andrews 10/2 Fernow 1/4 9Coyote 3/4 Fernow 7/4Caspar C/I Coweeta 7/34Caspar E/I Coweeta 13/14
Coweeta 37/36Number of pairs 6 8 14
aTypes are conifer, no seasonal snow; conifer, seasonal snow; deciduous,no seasonal snow; deciduous, seasonal snow. Basin types are based onvegetation type and forest age in control basin as of 2002 (time since mostrecent forest disturbance), summer precipitation, and presence/absence of aseasonal snowpack. A seasonal snowpack persists throughout the winter,whereas a transient snowpack may persist for only a few days to a fewweeks [Harr, 1981]. Snow seasonality is based on long-term records (snowdata at Hubbard Brook) and modeling [Perkins, 1997].
W05203 JONES AND POST: SEASONAL AND SUCCESSIONAL STREAMFLOW
7 of 19
W05203

(Figure 4g), daily streamflow in deciduous basins increasedby no more than 2 to 3 mm in the 1 to 5-yr period after forestremoval. After a decade of forest regrowth, streamflowsurpluses became deficits in several deciduous basins.[24] Relative changes in daily streamflow after 100%
forest removal also were strongly seasonal, and rangedfrom initial increases of a few tens to hundreds of percent(Figure 5). In conifer forest basins, daily streamflow in-creased by several hundred percent during the late summer/early fall (and late spring, at Caspar Creek, but results areaffected by missing data) in the 1 to 5-yr period after forestremoval. By 25 to 35 years after forest removal, maximum
summer deficits ranged from �30 to �50% (Figure 5). Indeciduous forest basins, daily streamflow increases rangedfrom more than several hundred percent (in herbicidedbasins), 200–300% (at Hubbard Brook and Fernow), to afew tens of percent (Coweeta), in late summer and earlyfall in the 1 to 5-yr period after forest removal. By 25 to35 years after forest removal, maximum summer streamflowdeficits ranged from �50% (Hubbard Brook and Fernow)to �30% (Coweeta) (Figure 5).[25] Seasons were accurate predictors of when stream-
flow change occurred. Absolute streamflow change wassignificantly associated with warm moist periods in three of
Table 5. Absolute Streamflow Changes in Warm, Moist Seasons After Forest Removal and During Forest Regrowth at Fourteen Pairs of
Small Experimental Basins in Pacific Northwest Conifer and Eastern Deciduous Forests, USAa
Hypothesis/Season
Years After Forest Removal
Treatment 1 to 5 6 to 10 11 to 15 16 to 20 21 to 25 26 to 30 31 to 35 36 to 40 41 to 45
Conifer ForestsAndrews 1/2Change (mm) 318 414 293 229 246 238 197 152Odds ratio 5b 203d 8d 7d 13d 6d 6d 4c
Andrews 6/8Change (mm) 421 237 240 268 205 104Odds ratio 1 2 43d 2b 2 7b
Andrews 10/2Change (mm) 108 95 91 �16 �30 �31Odds ratio 4c 7d 10d 3b 4b 2Coyote 3/4Change (mm) 265 284Odds ratio 5d 8d
Caspar C/IChange (mm) 196 274Odds ratio – –Caspar E/IChange (mm) 124 520Odds ratio – –
Deciduous ForestsHubbard Brook 2/3Change (mm) 661 262 51 �17 �21 �25 �59 4Odds ratio 7d 3b 0.4 0.4 0.1 0.2 0.2 0.2Hubbard Brook 4/3Change (mm) 101 79 37 �36 �61 �61 �51Odds ratio 0.1 0.1 – 0.1 0.1 0.3 0.2Hubbard Brook 5/3Change (mm) 131 87 0 �27Odds ratio 0.4 0.3 0.2 0.3Fernow 1/4Change (mm) 156 16 16 27 34 52 2 �8Odds ratio 48d 0.1 – 0.1 4 1.6 0.1 –Fernow 7/4Change (mm) 66 149 60 9 �16 �5 8 �38Odds ratio – – – – – – – –Coweeta 7/34Change (mm) 105 1 �57 86Odds ratio 0.2c 0.1b 4b 3b
Coweeta 13/14Change (mm) 17 14 �28 �39 �63Odds ratio 0.8 0.5 0.2d 0.6 4c
Coweeta 37/36Change (mm) 164 61 55 – �28 �46 �47Odds ratio 13d 2 3b – 0.1b 0.5 0.3b
aChange and odds ratios are shown for each basin pair and postharvest time period. Blanks indicate no data for that time period. Dashes indicate that nochi-squared test could be conducted, because one or more cells of the 2 � 2 table contained no observations. An odds ratio >1 means that days with anabsolute streamflow response were more likely to occur during the warm, moist season, and an odds ratio <1 means that days with an absolute streamflowresponse were less likely to occur during the warm, moist season.
bChi-squared tests of independence between absolute streamflow changes and the warm, moist season were significant at p < 0.05.cChi-squared tests of independence between absolute streamflow changes and the warm, moist season were significant at p < 0.001.dChi-squared tests of independence between absolute streamflow changes and the warm, moist season were significant at p < 0.0001.
8 of 19
W05203 JONES AND POST: SEASONAL AND SUCCESSIONAL STREAMFLOW W05203

Figure 3. Mean daily precipitation (mm), snowpack (mm of snow water equivalent), streamflow (mm),maximum and minimum temperatures (�C) in ten control basins used in this study. Forest type (coniferversus deciduous), presence/absence of seasonal snowpack, and forest age in 2002 are noted. (a) Conifer,seasonal snow, 500 and 150 years (Andrews 2, Andrews 8); (b) conifer, transient/no snow, 150 years(Andrews 9); (c) conifer, transient/no snow, 150 years (Coyote 4); (d) conifer, no snow, 100 yrs (Caspar I);(e) deciduous, seasonal snow, 64 years (Hubbard Brook 3); (f) deciduous, transient snow, 95 years(Fernow 4); (g) deciduous, no snow, 75 years (Coweeta 2); (h) deciduous, no snow, 75 years (Coweeta 36).
W05203 JONES AND POST: SEASONAL AND SUCCESSIONAL STREAMFLOW
9 of 19
W05203
four conifer basins, whereas absolute changes for the mostpart were independent of warm, moist seasons in thedeciduous forest basins (Table 5). Days with absolutestreamflow changes were three to many times more likelyto occur during warm, moist periods than other periods inthese six basin pairs, but they were no more, or slightly lesslikely to occur during warm moist periods in four deciduousforest basins. Net increases of 100 to 400 mm occurred infall and spring in conifer forest basins, and net increases of100 to 200 mm occurred in summer in deciduous forestbasins (Table 5).[26] Relative streamflow change was significantly asso-
ciated with warm periods in all basins (Table 6). Relativestreamflow changes in the 1 to 5-yr period after forestremoval were significantly associated with periods of warmtemperatures (summer), and amounted to net increases of 5to 200% of summer flows (Table 6). However, in one caseinvolving removal of 12-yr old forest (Coweeta 13/14),relative streamflow responses were not associated withseason, and in another case (Coweeta 7/34), relative stream-flow changes were significantly associated with cold peri-
ods. In conifer forest basins, summer streamflow changesdisappeared by 5 to 10 years after forest removal. By 25 to35 years after forest removal in conifer forest basins, asignificantly higher than expected number of days hadsummer streamflow deficits exceeding �25%, but the netchanges in summer streamflow ranged from +6 to �48%(Table 6). In contrast, streamflow changes were significantlymore likely during the summer in all periods after forestremoval in most of the deciduous forest basins, but the netchanges in summer streamflow ranged from +33% (Fernow1/4) to �42% (Hubbard Brook 2/3) (Table 6).[27] In basins with snowpacks, absolute streamflow
changes were significantly associated with periods of snow-melt in all 5-yr periods after forest removal (Table 7). Inconifer forest basins with seasonal snowpacks (Andrews 1/2and 6/8), these changes amounted to net increases of 100 to200 mm during the snowmelt period (Table 7). In the coniferforest basin with a transient snowpack (Andrews 10), initialstreamflow surpluses became streamflow deficits relative tothe control, which has a seasonal snowpack (Andrews 2). Inthe deciduous forest basins, streamflow deficits occurred
Figure 4. Absolute change in daily streamflow (mm) by day of water year (1 October - 30 September)for 5-year periods after forest removal at fourteen treated/control basin pairs. At the six conifer forest pairs,forest age (time since most recent forest disturbance) and snow conditions were (a) 462 year-old Douglas-fir/western hemlock forest, seasonal snow (Andrews 1/2); (b) 125-to 450-year old Douglas-fir/westernhemlock forest, seasonal snow (Andrews 6/8); (c) 125 year old Douglas-fir/western hemlock forest,transient snow (Andrews 10/2); (d) 125-year old mixed-conifer forest, transient/no snow (Coyote 3/4);(e) 90-year old coast redwood/Douglas-fir forest, no snow (Caspar C/I); (f ) 90-year old coast redwood/Douglas-fir forest, no snow (Caspar E/I). At the eight deciduous forest pairs, forest age (time since mostrecent forest disturbance) and snow conditions were (g) 27 year-old deciduous forest, seasonal snow(Hubbard Brook 2/3); (h) 32 year old deciduous forest, seasonal snow (Hubbard Brook 4/3); (i) 45 year oldforest, seasonal snow (Hubbard Brook 5/3); (j) 50-year old red oak/sugar maple forest, transient/no snow(Fernow 1/4); (k) 56-year old red oak/sugar maple forest, transient/no snow (Fernow 7/4); (l) 50-year olddeciduous forest, no snow (Coweeta 7/34); (m) 12-year old deciduous forest, no snow (Coweeta 13/14);(n) 36-year old deciduous forest, no snow (Coweeta 37/36).
10 of 19
W05203 JONES AND POST: SEASONAL AND SUCCESSIONAL STREAMFLOW W05203
during the snowmelt period; net changes ranged from +19 to�47 mm.
5.3. Successional Effects
[28] Streamflow responses to forest removal were relatedto two aspects of forest succession: (1) age of the regener-ating forest (i.e., time since treatment, Figure 6), and (2) thedifference in forest age between the treated and control
basins (Figure 7). Streamflow responses to forest removaldeclined over several decades of forest regrowth, but therate of decline varied by season and forest type and age, andthere is considerable between-site variability in response forany given posttreatment period (Figure 6). For the entirewater year, streamflow surpluses were highest and mostpersistent after removal of 90 to 450-yr old coniferforests, and lowest and most ephemeral after removal of
Figure 4. (continued)
W05203 JONES AND POST: SEASONAL AND SUCCESSIONAL STREAMFLOW
11 of 19
W05203

12 to 56-yr old deciduous forests (Figure 6a). Coniferforests with transient snow or no snow had intermediateresponses in annual streamflow. Surpluses during thesnowmelt period persisted for up to four decades afterremoval of conifer forests from basins with a seasonalsnowpack (Figure 6b). Streamflow surpluses in warm,moist seasons were higher and more persistent in coniferforest basins compared to deciduous forests (Figure 6c).By 20–25 years after forest removal (period 5), stream-flow deficits had developed in August in all but onetreated basin (Figure 6d). Although absolute changes weresmall, August streamflow 15 years after forest removalhad declined by 60 to 80% relative to pretreatmentAugust streamflow (Figure 6d).
[29] The age of forest at the time it was harvested (whichis equivalent to the difference in age between the forest inthe control and the treated basin) explains additional vari-ability in streamflow response beyond that explained byseason or time since treatment (Figure 7). Streamflowresponse in both absolute (Figure 7) and relative (data notshown) terms increased log-linearly, from treated basinswith deciduous forests that were 12 to 56 years youngerthan their control basins, to treated basins with coniferforests 90 to 460 years younger than their control basins.Changes in annual streamflow, in streamflow during thewarm, moist season, and in the snowmelt period weresignificantly positively related to forest age, in both the1 to 5- and 15 to 25- yr periods after forest removal
Figure 4. (continued)
Figure 5. Relative (%) change in daily streamflow (mm) by day of water year (1 October–30 September) for 5-year periods after forest removal at fourteen treated/control basin pairs. See Figure 4for basin names, forest types, and ages.
12 of 19
W05203 JONES AND POST: SEASONAL AND SUCCESSIONAL STREAMFLOW W05203

(Figure 7). Fitted relationships explained from 45 to 92%of variation in absolute changes (Figure 7) and from 37 to65% of variation in percent changes in streamflow (datanot shown). Even when the ‘‘conifer-seasonal snow’’ pointsin Figure 7 were removed, six of eight regressions werestill significant, with r2 values ranging from 0.40 to 0.81.Change in streamflow during the cold season was notrelated to forest age in the 1 to 5-yr period, but was related
to forest age in the 15 to 25-yr period after forest removal(Figures 7g and 7h).
6. Discussion
[30] Streamflow response to experimental forest removaland regrowth in fourteen treated/control basin pairs in thePacific Northwest and eastern United States indicates that
Figure 5. (continued)
W05203 JONES AND POST: SEASONAL AND SUCCESSIONAL STREAMFLOW
13 of 19
W05203
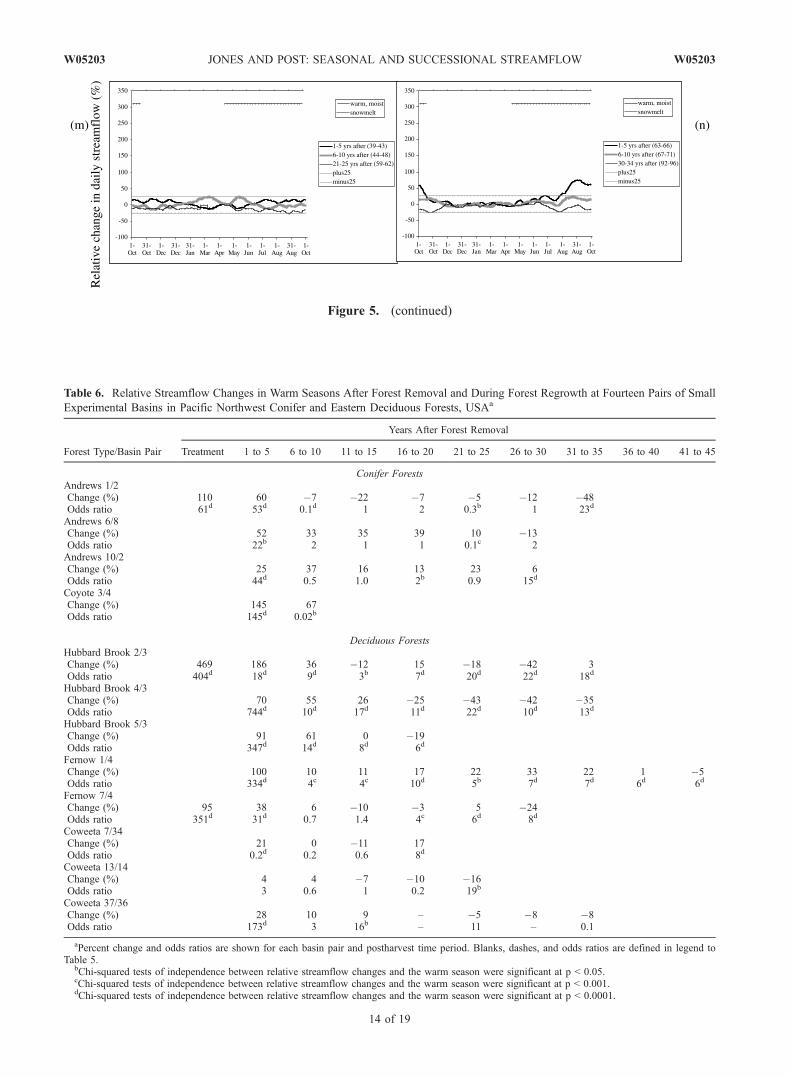
Figure 5. (continued)
Table 6. Relative Streamflow Changes in Warm Seasons After Forest Removal and During Forest Regrowth at Fourteen Pairs of Small
Experimental Basins in Pacific Northwest Conifer and Eastern Deciduous Forests, USAa
Forest Type/Basin Pair
Years After Forest Removal
Treatment 1 to 5 6 to 10 11 to 15 16 to 20 21 to 25 26 to 30 31 to 35 36 to 40 41 to 45
Conifer ForestsAndrews 1/2Change (%) 110 60 �7 �22 �7 �5 �12 �48Odds ratio 61d 53d 0.1d 1 2 0.3b 1 23d
Andrews 6/8Change (%) 52 33 35 39 10 �13Odds ratio 22b 2 1 1 0.1c 2Andrews 10/2Change (%) 25 37 16 13 23 6Odds ratio 44d 0.5 1.0 2b 0.9 15d
Coyote 3/4Change (%) 145 67Odds ratio 145d 0.02b
Deciduous ForestsHubbard Brook 2/3Change (%) 469 186 36 �12 15 �18 �42 3Odds ratio 404d 18d 9d 3b 7d 20d 22d 18d
Hubbard Brook 4/3Change (%) 70 55 26 �25 �43 �42 �35Odds ratio 744d 10d 17d 11d 22d 10d 13d
Hubbard Brook 5/3Change (%) 91 61 0 �19Odds ratio 347d 14d 8d 6d
Fernow 1/4Change (%) 100 10 11 17 22 33 22 1 �5Odds ratio 334d 4c 4c 10d 5b 7d 7d 6d 6d
Fernow 7/4Change (%) 95 38 6 �10 �3 5 �24Odds ratio 351d 31d 0.7 1.4 4c 6d 8d
Coweeta 7/34Change (%) 21 0 �11 17Odds ratio 0.2d 0.2 0.6 8d
Coweeta 13/14Change (%) 4 4 �7 �10 �16Odds ratio 3 0.6 1 0.2 19b
Coweeta 37/36Change (%) 28 10 9 – �5 �8 �8Odds ratio 173d 3 16b – 11 – 0.1
aPercent change and odds ratios are shown for each basin pair and postharvest time period. Blanks, dashes, and odds ratios are defined in legend toTable 5.
bChi-squared tests of independence between relative streamflow changes and the warm season were significant at p < 0.05.cChi-squared tests of independence between relative streamflow changes and the warm season were significant at p < 0.001.dChi-squared tests of independence between relative streamflow changes and the warm season were significant at p < 0.0001.
14 of 19
W05203 JONES AND POST: SEASONAL AND SUCCESSIONAL STREAMFLOW W05203

forest effects on streamflow are strongly seasonal, anddepend upon the age or successional stage of the forest.The analysis involved a complete re-analysis of primarydata using a novel approach to paired-basin analysis, ratherthan relying upon reviews or meta-analyses of publishedstudies as in Bosch and Hewlett [1982] or Robinson et al.[2003]. Our findings may differ slightly from publishedvalues for specific sites [Rothacher, 1970, 1975; Douglassand Swank, 1972; Harr et al., 1979, 1982; Swift and Swank,1981; Hornbeck et al., 1993, 1997; Martin et al., 2000;Lewis et al., 2001; Swank et al., 2001] because of differ-ences in watershed pairing, use of daily average flows, andlog-transformation of data. The results are relevant to eco-physiology, global change modeling, and stream ecology aswell as hydrology, and they highlight the future potential forpaired basin experiments.[31] Atmospheric stresses (i.e., temperature, vapor pres-
sure) and soil moisture stresses imposed on individualplants [e.g., Eagleson, 2002] scale up to influence stream-flow at the small watershed scale, producing streamflowresponses to forest removal and regrowth that were con-centrated during seasons when moisture and temperature areconducive to evapotranspiration. Evapotranspirationdepends upon (among other things) soil moisture, netinterception, and evaporation from the canopy (Figure 1).Streamflow responses were larger in absolute terms afterremoval of conifer compared to deciduous forests, forbasins with similar mean annual precipitation, confirmingthe site-specific work of Swank and Douglass [1974].Conifers are adapted to use water throughout the year, aslong as soil moisture and temperatures are not limiting,whereas transpiration in deciduous trees is limited to periodswhen leaves are present. Plant-level differences betweenconifer and deciduous forests were accentuated at the basin
scale in this study, because coniferous forests were olderthan deciduous forests, and evapotranspiration from decid-uous understory and early successional components of theregenerating conifer stands was limited by dry summerstypical of these western sites.[32] Changes in forest canopy interactions with the
snowpack over the course of succession provide a possiblealternative mechanism for documented long-term changesin snowmelt runoff [Hodgekins et al., 2003]. Seasonalsnowpack volume, and hence the snow water equivalentavailable to melt in the spring, depends upon the balance ofadditions and losses to sublimation and melt (Figure 1).Removal of deciduous forest canopies increases the expo-sure of cold snowpacks to winter sunlight in climates ofeastern forests, and characteristically dense regeneratingstands (e.g., of pin cherry [Marks, 1974] may interceptmore snow, enhancing sublimation and reducing snowpackvolume. Therefore in the first decade after removal ofdeciduous forest canopies, snowmelt occurred earlier andstreamflow was reduced during the snowmelt period com-pared to 40 to 60 yr-old forests (Figures 4g–4i). This effectwas reversed after two or three decades of forest regener-ation, and snowmelt occurred later, but streamflowremained reduced during the snowmelt period comparedto the control. In contrast, removal of conifer forest cano-pies decreases interception and increases the exposure ofwarm snowpacks to radiative heat losses, cooling mixedrain/snow to snow, in climates of Pacific Northwestforests [Harr, 1981]. Moreover, sparse regenerating stands[Halpern, 1989; Acker et al., 2002] may intercept less snow.All these factors enhance snow accumulation and increasesnowpack volume [Marks et al., 1998; Storck et al., 2002].Therefore in the first decade after removal of conifer forestcanopies, snowmelt occurred earlier and streamflow was
Table 7. Absolute Streamflow Changes in Snowmelt Periods After Forest Removal and During Forest Regrowth at Fourteen Pairs of
Small Experimental Basins in Pacific Northwest Conifer and Eastern Deciduous Forests, USAa
Forest Type/Basin Pair
Years After Forest Removal
Treatment 1 to 5 6 to 10 11 to 15 16 to 20 21 to 25 26 to 30 31 to 35 36 to 40 41 to 45
Conifer ForestsAndrews 1/2Change (mm) 167 170 154 153 159 139 141 103Odds ratio 7b 11d 5d 8d 6d 4c 8d 7d
Andrews 6/8Change (mm) 139 139 180 237 171 126Odds ratio 4c 4c 8d 9d 6d 12d
Andrews 10/2Change (mm) 6 14 21 �17 �24 �14Odds ratio 4c 11d 4c 5d 9d 6d
Deciduous ForestsHubbard Brook 2/3Change (mm) �10 �8 �27 �17 �47 �19 �17 �18Odds ratio 0.7 12d 160d 91d 185d 60d 100d 75d
Hubbard Brook 4/3Change (mm) �1 �12 �5 �25 1 �4 �13Odds ratio 172d 227d – 118d 73d 40d 60d
Hubbard Brook 5/3Change (mm) �41 0 10 19Odds ratio 372d 384d 75d 40d
aChange and odds ratios are shown for each basin pair and postharvest time period. Blanks, dashes, and odds ratios are defined in legend to Table 5.bChi-squared tests of independence between absolute streamflow changes and the snowmelt season were significant at p < 0.05.cChi-squared tests of independence between absolute streamflow changes and the snowmelt season were significant at p < 0.001.dChi-squared tests of independence between absolute streamflow changes and the snowmelt season were significant at p < 0.0001.
W05203 JONES AND POST: SEASONAL AND SUCCESSIONAL STREAMFLOW
15 of 19
W05203

increased during the snowmelt period compared to 125 to500 year-old forests (Figures 4a and 4b). After two or threedecades of forest regeneration, snowmelt occurred later, andstreamflow during the snowmelt period remained elevated,compared to the control.[33] Streamflow variability in winter may be coupled to
forest vegetation through lagged effects transmitted by soilmoisture reservoirs. Lagged effects were limited to circum-stances when moisture was held at high tensions, such aswhen soil moisture content was low or soils were very fine-textured. Soil moisture at high tensions has low hydraulicconductivity, so a ‘‘pulse’’ of increased or decreased soilmoisture could take months to travel from the rooting zonethrough a small basin to the gage. Thus in deciduous sites,maximum streamflow responses in summer appeared nearthe middle or end of the warm period (Figures 4g–4k, 4n).In two cases (Figures 4l and 4m) the maximum streamflowresponse appeared several months after the end of thesummer, an effect noted by earlier workers [Swank et al.,1988].[34] The strong relationships of streamflow change to two
aspects of forest age (time since treatment and age of theforest at the time it was removed) support the notion thatforest succession results in more efficient use of fixedmoisture resources [Eagleson, 2002]. Forest age is a proxyfor forest condition, which influences hydrologic processes.Specifically, time since treatment, and time since mostrecent severe disturbance are proxies for leaf area, sapwood
densities, species composition, and canopy structure, whichin turn are proxies for interception, evaporation, and tran-spiration. Thus as noted by Hornbeck et al. [1993, 1997]and Swank et al. [2001], young (10 to 30-year old) forestsregenerating from disturbance were higher water users perunit leaf area than older forests (12 to 450 years older).However, based on 14 basin pairs in both conifer anddeciduous forests, young forests (10 to 30 yrs old) werehigher water users than old forests (70 to 450 yrs old) onlyin relative terms during late summer periods (August). Infact, the converse was true: removal of old (90 to 450-yearold) conifer forests had a larger absolute effect on stream-flow than removal of young (13 to 56-year old) deciduousforests. As forest succession proceeds over 50, 100, or500 years, many factors (the increasing age of individualtrees, changes in water use by new species succeeding in theoverstory and understory, altered interception capacity, ordevelopment of a canopy epiphyte community) may in-crease the ability of a forest community to capture and storewater. Disturbance history can help predict the ranges ofstreamflow responses to forest removal, but further work[e.g., Link, 2001] is needed to elucidate the many hydro-logic mechanisms that operate in aging forests.[35] Streamflow responses to forest removal observed in
this study indicate that forest vegetation effects on stream-flow variability may have consequences for stream ecology[e.g., Poff et al., 1997]. In basins draining northwesternconifer forests, persistent absolute streamflow increases
Figure 6. Effect of time since treatment (5-yr period after forest removal) on absolute changesin streamflow (mm) in fourteen treated/control basin pairs. (a) Entire water year, (b) snowmeltperiod, (c) warm, moist period without snow (summer for deciduous forest sites, fall for conifer forest sites),(d) August lowflow period. X axis values are 1 = treatment period, 2 = 1 to 5-years after forest removal, . . .,10 = 41 to 45 after forest removal.
16 of 19
W05203 JONES AND POST: SEASONAL AND SUCCESSIONAL STREAMFLOW W05203

during spring, combined with persistent relative summerdeficits, imply that stream organisms are subjected to biggerranges of streamflow variability in young compared to old-growth forest stands. Basins draining young eastern forests
also may experience higher streamflow variability com-pared to older forests as a result of the combined effectsof forest canopy on streamflow through changes in snowaccumulation and melt, and summer water use.
Figure 7. Effect of forest age at the time of harvest (time since most recent forest disturbance) onabsolute change in water yield for various seasons and stages of succession. Entire water year: (a) 1 to5 year and (b) 15 to 25 year periods after forest removal. Warm, moist season, fall for conifers, summerfor deciduous forest: (c) 1 to 5 year and (d) 15 to 25 year periods after forest removal. Snowmelt season:(e) 1 to 5 year and (f) 15 to 25 year periods after forest removal. Cold season (winter): (g) 1 to 5 year and(h) 15 to 25 year periods after forest removal. Herbicided basin (Hubbard Brook 2) was excluded fromregression for the warm, moist season, 1 to 5 year period after forest removal. Least-squares fitted log-linear models and r2 values are shown.
W05203 JONES AND POST: SEASONAL AND SUCCESSIONAL STREAMFLOW
17 of 19
W05203
[36] The methods used in this study represent a departurefrom prior work, and indicate the potential for continuedanalyses of paired-basin experiments.[37] 1. The treated/control relationship in paired-basin
experiments, rather than a black and white one, can beviewed as a function of continuous, and continuouslychanging, differences between basins in vegetation struc-ture, composition, and climate. Thus multiple basins may beused as controls for a given treated basin, and the responsesmay be compared.[38] 2. Paired-basin records provide the opportunity to
quantify and compare streamflow responses at multipletemporal scales, including storm events, seasons, succes-sional periods, and decadal climate change. Work is neededto examine how streamflow responses at seasonal andsuccessional timescales, addressed in this study, interactwith streamflow responses at the storm event scale [e.g.,Jones, 2000; Lewis et al., 2001], and at the scale of decadalclimate change [e.g., Greenland et al., 2003].[39] 3. Small paired-basin experiments permit compari-
son of streamflow responses across vegetation types andtreatments, climates, and basin scales. This analysis, whichwas restricted to <100-ha, mountainous, temperate decidu-ous and conifer forest basins, could be extended withadditional replicates of these basin types, or records fromother climates, other treatments (e.g., fire), or other vegeta-tion types. The very high streamflow variability at basins of<20 ha may obscure some important streamflow changes, sorecords from larger basin scales should be included inanalyses. Relevant data are available through Hydro-DB[Baker et al., 2000].[40] Prediction of streamflow from ungaged basins is a
major ongiong challenge for hydrologists (see e.g., thePUB initiative, http://iahs.info). This study indicates thatto some extent streamflow can be predicted from climate,forest type, and disturbance history effects on hydrologicprocesses. The approaches presented in this paper provideuseful advances for understanding and prediction of hydro-logic response.
[41] Acknowledgments. This research was supported by NationalScience Foundation grants DEB-95-26987 (LTER Intersite Hydrology),DEB-80-12162, BSR-85-14325, BSR-90-11663, and DEB-96-32921 (H. J.Andrews Long-term Ecological Research (LTER)); by NSF grants to theCoweeta and Hubbard Brook LTERs. The USDA Forest Service largelysupports long-term streamflow and climate monitoring at the followingsites: Andrews (Pacific Northwest Research Station), Caspar Creek (PacificSouthwest Research Station), Coweeta (Southern Research Station),Fernow, and Hubbard Brook (Northeastern Forest Experiment Station).The USDA Forest Service Washington office (D. Ryan, P. Dunn) providedfunding for the development of hydro-DB. Data and expertise wereprovided by F. Bierlemaier, C. Creel, G. Downing, R. Fredriksen,D. Henshaw, A. Levno, G. Lienkaemper, J. Moreau, S. Remillard(Andrews); J. Lewis (Caspar); N. Gardiner, W. Swank, L. Swift (Coweeta);M. B. Adams (Fernow); and J. Campbell, C. Cogbill, J. Hornbeck,W. Martin (Hubbard Brook). We would like to thank J. J. Major and F. J.Swanson for helpful discussions. J. Hornbeck, J. Lewis, J. McDonnell, L.Reid, W. Swank, and two anonymous reviewers provided helpful commentson the manuscript.
ReferencesAcker, S. A., C. B. Halpern, M. E. Harmon, and C. T. Dyrness (2002),Trends in bole biomass accumulation, net primary production, and treemortality in Pseudotsuga menziesii forests of contrasting age, TreePhysiol., 22, 213–217.
Baker, K. S., B. J. Benson, D. L. Henshaw, D. Blodgett, J. H. Porter, andS. G. Stafford (2000), Evolution of a multisite network information
system: The LTER information management paradigm, BioScience,50(11), 963–978.
Berris, S. N., and R. D. Harr (1987), Comparative snow accumulationand melt during rainfall in forested and clear-cut plots in the westernCascades of Oregon, Water Resour. Res., 23(1), 135–142.
Beven, K. (2002), Toward an alternative blueprint for a physically baseddigitally simulated hydrologic response modelling system, Hydrol. Pro-cesses, 16, 189–206.
Bosch, J. M., and J. D. Hewlett (1982), A review of catchment experimentsto determine the effect of vegetation changes on water yield and evapo-transpiration, J. Hydrol., 55, 3–23.
Day, F. P., Jr., D. L. Phillips, and C. D. Monk (1988), Forest communitiesand patterns, in Forest hydrology and ecology at Coweeta, edited by W. T.Swank and D. A. Crossley, pp. 141–149, Springer-Verlag, New York.
Douglass, J. E., and M. D. Hoover (1988), History of Coweeta, in Foresthydrology and ecology at Coweeta, edited by W. T. Swank and D. A.Crossley, pp. 17–31, Springer-Verlag, New York.
Douglass, J. E., and W. T. Swank (1972), Streamflow modification throughmanagement of eastern forests, Res. Pap. SE-94, U.S. Dep. Agric. For.Serv. Southeastern Exp. Stn., Asheville, N. C.
Douglass, J. E., and W. T. Swank (1975), Effects of management practiceson water quality and quantity: Coweeta Hydrologic Laboratory, NorthCarolina, General Tech. Rep. NE-13, U.S. Dep. Agric. For. Serv. North-east For. Exp. Stn., Asheville, N. C.
Eagleson, P. S. (2002), Ecohydrology: Darwinian expression of vegetationform and function, Cambridge Univ. Press, New York.
Greenland, D., D. G. Goodin, and R. C. Smith (2003), Climate variabilityand ecosystem response at long-term ecological research sites, OxfordUniv. Press, New York.
Halpern, C. B. (1989), Early successional patterns of forest species: Inter-actions of life history traits and disturbance, Ecology, 70, 704–720.
Harr, R. D. (1981), Some characteristics and consequences of snowmeltduring rainfall in western Oregon, J. Hydrol., 53, 277–304.
Harr, R. D. (1982), Fog drip in the Bull Run municipal watershed, Oregon,Water Resour. Bull., 18(5), 785–789.
Harr, R. D., R. L. Fredriksen, and J. Rothacher (1979), Changes in stream-flow following timber harvest in southwestern Oregon, Res. Pap. PNW-249, U.S. For. Serv. Pacific Northwest Res. Stn., Corvallis, Oreg.
Harr, R. D., A. Levno, and R. Mersereau (1982), Streamflow changes afterlogging 130-yr-old Douglas fir in two small watersheds, Water Resour.Res., 18(3), 637–644.
Hodgekins, G. A., R. W. Dudley, and T. G. Huntington (2003), Changesin the timing of high river flows in New England over the 20th century,J. Hydrol., 278, 244–252.
Hornbeck, J. W., M. B. Adams, E. S. Corbett, E. S. Verry, and J. A. Lynch(1993), Long-term impacts of forest treatments on water yield: A sum-mary for northeastern USA, J. Hydrol., 150, 323–344.
Hornbeck, J. W., C. W. Martin, and C. Eagar (1997), Summary of wateryield experiments at Hubbard Brook Experimental Forest, New Hamp-shire, Can. J. For. Res., 27, 2043–2052.
Jones, J. A. (2000), Hydrologic processes and peak discharge response toforest removal, regrowth, and roads in 10 small experimental basins,western Cascades, Oregon, Water Resour. Res., 36(9), 2621–2642.
Jones, J. A., and G. E. Grant (1996), Peak flow responses to clear-cuttingand roads in small and large basins, western Cascades, Oregon, WaterResour. Res., 32(4), 959–974.
Jones, J. A., and F. J. Swanson (2001), Hydrologic inferences from compar-isons among small basin experiments,Hydrol. Processes, 15, 2363–2366.
Lewis, J., S. R. Mori, E. T. Keppeler, and R. R. Ziemer (2001), Impacts oflogging on storm peak flows, flow volumes, and suspended sedimentloads in Caspar Creek, California, in Land Use and Watersheds: HumanInfluence on Hydrology and Geomorphology in Urban and Forest Areas,Water Sci. and Appl. Ser., vol. 2, edited by M. S. Wigmosta and S. J.Burges, pp 85–125, AGU, Washington, D. C.
Link, T. E. (2001), The water and energy dynamics of an old-growthseasonal temperate rainforest, Ph.D. dissertation, Environ. Sci. GraduateProgram, Oreg. State Univ., Corvallis.
Marks, D., J. Kimball, D. Tingey, and T. Link (1998), The sensitivity ofsnowmelt processes to climate conditions and forest cover during rain-on-snow: A case study of the 1996 Pacific Northwest flood, Hydrol.Processes, 12, 1569–1587.
Marks, P. L. (1974), The role of pin cherry in the maintenance of stability innorthern hardwood ecosystems, Ecol. Monogr., 44, 73–88.
Martin, C. W., J. W. Hornbeck, G. E. Likens, and D. C. Buso (2000),Impacts of intensive harvesting on hydrology and nutrient dynamics ofnorthern hardwood forests, Can. J. For. Res., 57(Suppl. 2), 19–29.
18 of 19
W05203 JONES AND POST: SEASONAL AND SUCCESSIONAL STREAMFLOW W05203

Perkins, R. M. (1997), Climate and physiographic controls on peakflowgeneration in the western Cascades, Oregon, Ph.D. dissertation, Dept. ofForest Science, Oreg. State Univ., Corvallis.
Poff, N. L., J. D. Allan, M. B. Bain, J. R. Karr, K. L. Prestegaard, B. D.Richter, R. E. Sparks, and J. C. Stromberg (1997), The natural flowregime: A paradigm for river conservation and restoration, BioScience,47, 769–784.
Post, D. A., and J. A. Jones (2001), Hydrologic regimes at four long-termecological research sites in New Hampshire, North Carolina, Oregon, andPuerto Rico, Adv. Water Resour., 24, 1195–1210.
Post, D. A., G. E. Grant, and J. A. Jones (1998), Ecological hydrology:Expanding opportunities in hydrologic sciences, Eos Trans. AGU,79(43), 517.
Ramsay, F. L., and D. W. Schaefer (1996), The Statistical Sleuth, 742 pp.,Duxbury, Boston, Mass.
Robinson, M., et al. (2003), Studies of the impact of forests on peak flowsand baseflows: A European perspective, For. Ecol. Manage., 1186, 85–97.
Rothacher, J. (1970), Increases in water yield following clear-cut logging inthe Pacific Northwest, Water Resour. Res., 6(2), 653–658.
Rothacher, J. (1975), Regimes of streamflow and their modification bylogging, in Forest Land Uses and Environment, edited by J. T. Krygierand J. D. Hall, pp. 40–54, Oreg. State Univ. Press, Corvallis.
Rothacher, J., C. T. Dyrness, and R. L. Fredriksen (1967), Hydrologic andrelated characteristics of three small watersheds in the Oregon Cascades,54 pp., U. S. Dep. Agric. For. Serv., Pacific Northwest For. and RangeExp. Stn., Ashville, N. C.
Schwarz, P. A., T. J. Fahey, C. W. Martin, T. G. Siccama, and A. Bailey(2001), Structure and composition of three northern hardwood-coniferforests with different disturbance histories, For. Ecol. Manage., 144,201–212.
Shafer, S. L., P. J. Bartlein, and R. S. Thompson (2001), Potential changesin the distributions of Western North America tree and shrub taxa underfuture climate scenarios, Ecosystems, 4, 200–215.
Storck, P., D. P. Lettenmaier, and S. M. Bolton (2002), Measurement ofsnow interception and canopy effects on snow accumulation and melt ina mountainous maritime climate, Oregon, United States, Water Resour.Res., 38(11), 1223, doi:10.1029/2002WR001281.
Swank, W. T., and J. E. Douglass (1974), Streamflow greatly reduced byconverting deciduous hardwood stands to white pine, Science, 185, 857–859.
Swank, W. T., L. W. Swift Jr., and J. E. Douglass (1988), Streamflowchanges associated with forest cutting, species conversions, and naturaldisturbances, in Forest Hydrology and Ecology at Coweeta, edited byW. T. Swank and D. A. Crossley, pp. 297–312, Springer-Verlag, NewYork.
Swank, W. T., J. M. Vose, and K. J. Elliott (2001), Long-term hydrologicand water quality responses following commercial clearcutting of mixedhardwoods on a southern Appalachian catchment, For. Ecol. Manage.,143, 163–178.
Swift, L. W., and W. T. Swank (1981), Long-term responses of streamflowfollowing clearcutting and regrowth, Hydrol. Sci. Bull., 26, 245–256.
Weisberg, P. J., and F. J. Swanson (2003), Regional synchroneity in wildfireregimes of western Oregon and Washington, USA, For. Ecol. Manage.,172, 17–28.
����������������������������J. A. Jones, Department of Geosciences, Oregon State University,
Corvallis, OR 97331, USA. ([email protected])D. A. Post, CSIRO Land and Water, PMB PO Aitkenvale, Queensland
4814, Australia. ([email protected])
W05203 JONES AND POST: SEASONAL AND SUCCESSIONAL STREAMFLOW
19 of 19
W05203