seasonal and inter-annual variations of arctic cyclones
TRANSCRIPT

Seasonal and inter-annual variations of Arctic cyclones and theirlinkage with Arctic sea ice and atmospheric teleconnectionsWEI Lixin1*, QIN Ting1, LI Cheng1, 2
1 Key Laboratory of Research on Marine Hazards Forecasting, National Marine Environmental Forecasting Center,State Oceanic Administration, Beijing 100081, China
2 Physical Oceanography Laboratory, Ocean University of China, Qingdao 266100, China
Received 27 June 2017; accepted 17 August 2017
©The Chinese Society of Oceanography and Springer-Verlag Berlin Heidelberg 2017
Abstract
The seasonal and inter-annual variations of Arctic cyclone are investigated. An automatic cyclone trackingalgorithm developed by University of Reading was applied on the basis of European Center for Medium-rangeWeather Forecasts (ECMWF) ERA-interim mean sea level pressure field with 6 h interval for 34 a period. Themaximum number of the Arctic cyclones is counted in winter, and the minimum is in spring not in summer.About 50% of Arctic cyclones in summer generated from south of 70°N, moving into the Arctic. The number ofArctic cyclones has large inter-annual and seasonal variabilities, but no significant linear trend is detected for theperiod 1979–2012. The spatial distribution and linear trends of the Arctic cyclones track density show that thecyclone activity extent is the widest in summer with significant increasing trend in CRU (central Russia)subregion, and the largest track density is in winter with decreasing trend in the same subregion. The linearregressions between the cyclone track density and large-scale indices for the same period and pre-period sea icearea indices show that Arctic cyclone activities are closely linked to large-scale atmospheric circulations, such asArctic Oscillation (AO), North Atlantic Oscillation (NAO) and Pacific-North American Pattern (PNA). Moreover,the pre-period sea ice area is significantly associated with the cyclone activities in some regions.
Key words: Arctic cyclones, automated detection and tracking algorithm, large-scale climate indices, sea ice areaindex, regression analysis
Citation: Wei Lixin, Qin Ting, Li Cheng. 2017. Seasonal and inter-annual variations of Arctic cyclones and their linkage with Arctic sea iceand atmospheric teleconnections. Acta Oceanologica Sinica, 36(10): 1–7, doi: 10.1007/s13131-017-1117-9
1 IntroductionArctic cyclone is the most active atmospheric system in a po-
lar region. Its spatial scale is from several tens kilometer to thou-sands and lifetime from hours to days. The cyclone activity, fol-lowing with big gale, liquid or solid precipitation, low visibilityand great wave, has big impact on solar radiation on the surface,heat and moisture flux transportation in air and ocean, also seaice deformation and drifting in the Arctic Ocean. Its variabilityalso is an indicator of the climate change at northern high latit-ude. On August 2012, a strong cyclone went into the central Arc-tic and lingered there for several days (http://eoimages.gsfc.nasa.gov/images/imagerecords/78000/78808/arctic_vir_2012220_lrg.jpg), causing more attention about the summer cycloneactivity and its effect on sea ice melting and drifting.
Owing to the rare in-situ data in polar regions, the widelystudies of the Arctic cyclones have started since the 1970s for theachievement of satellite observations, and more information ofthe cyclone number, distribution and cloud pattern are collected.The use of the automatic cyclone identification and tracking al-gorithms to reanalysis or modeled data enhanced our ability tobetter understand the Arctic cyclone climatology. There aremainly two measures to tracking cyclones, one is Eulerian ap-proach, which calculates the variance or covariance of a filteredmean sea level pressure (MSLP) or geopotential height fields
which stand for synoptic time scales (about 2.5–8.0 d) (Black-mon, 1976; Ulbrich and Christoph, 1999), the other is Lagrangianmeasure, tracking cyclonic features from one reanalysis time tothe next, e.g., minima in a sea-level pressure or maxima in a rel-ative vorticity (Serreze and Barry, 1988; Serreze, 1995; Zhang etal., 2004; Serreze and Barrett, 2008; Simmonds et al., 2008; Sim-monds and Keay, 2009; Simmonds and Rudeva, 2014). A numberof studies have focused on the Arctic cyclone activity related toother factors, such as North Atlantic Oscillation (NAO), The Pa-cific Decadal Oscillation (PDO), El Niño–Southern Oscillation(ENSO), and Pacific–North American Pattern (PNA) (Gulev et al.,2001; Notaro et al., 2006; Wang et al., 2006), sea ice melting andmoving (Screen and Simmonds, 2011). In recent years, the GCMsimulations are carried out to investigate the variabilty of the Arc-tic cyclone activity under global warming with different green-house gas concentrations (Leckebusch and Ulbrich, 2004; Pintoet al., 2006; Orsolini and Sorteberg, 2009).
In this study, the Reading University automatic trackingscheme (Hodges et al., 1994, 1996) was used to calculate the cyc-lone trajectories and system density, and a new climatology ofcyclones in the Arctic Ocean was presented. The variability of thecyclone activity and its association with the same period large-scale atmospheric mode and pre-period Arctic sea ice area arealso examined.
Foundation item: The Chinese Polar Environment Comprehensive Investigation and Assessment Programmes under contract No.2016-04-03; the National Key Research and Development Program of China under contract No. 2016YFC1402701.*Corresponding author, E-mail: [email protected]
Acta Oceanol. Sin., 2017, Vol. 36, No. 10, P. 1–7
DOI: 10.1007/s13131-017-1117-9
http://www.hyxb.org.cn
E-mail: [email protected]

2 Data and methodThe ECMWF ERA-interim is selected as the primary data. This
is a new generation reanalysis data after ERA-40, overlapped in atime period for 1989–2002, but used more complicated assimila-tion system, many improvement are given. The assimilatingmodel has T255 spectral resolution in the horizontal and 60levels in the vertical with 6 h temporal resolution. Here, the datacover a 34 a period from 1979 to 2012.
The cyclone tracking scheme derived by Hodges (1994, 1996)University of Reading is used to locate cyclones from the meansea level pressure of the ERA-interim reanalysis. This schemeidentifies the low-pressure system based on the pressure minim-um or maximum in the relative vorticity. It has been used tostudy the climatological activities of an extratropical cyclone inthe Northern Hemisphere (e.g., Hoskins and Hodges, 2005; Mes-quita et al., 2009), and in the Southern Hemisphere (Uotila et al.,2011; Wei et al., 2016). Note that only those lifetime are not lessthan 12 h and the minimum central pressure not greater than1 000 hPa, appearing in the field from 70° to 85°N are counted. Adata set is established including a set of parameters for describ-ing cyclone characteristics. In this study, the domain selected isfrom 70° to 85°N in order to avoid the biases associated with fast
cyclones which pass one or more boxes during one time step(Gulev et al., 2001) near the polar point. These biases tend to un-derestimate storm counts and are mostly pronounced at the highlatitude. The seasons are divided for spring (MAM), summer(JJA), autumn (SON) and winter (DJF).
3 Seasonal and interannual variations of Arctic cycloneTable 1 provides statistics of the Arctic cyclones during
1979–2012 in each season. The average number has a distinctseasonal cycle, there are the most cyclones in winter, but theleast in spring not in summer, however this is not always true foreach year. The total number has great interannual variations, themaximum number can reach two times of the minimum inspring or summer. The cyclone intensity (based on the averagedminimum sea level pressure of the cyclone center) does also havean obvious seasonal variation, it is much weaker in summer ascompared with the other three seasons. The percentage of in-tense cyclones (the central pressure less than 980 hPa) in eachseason indicates weak cyclones in summer, as only 6.4%. But inspring, autumn and winter, the percentages of intense cyclonesare 11.8%, 16.0% and 17.4%, respectively.
Statistics show that the percentages of seasonal cyclonescrossing 70°N are 46.7%, 50.4%, 39.0% and 37.2% from spring towinter, respectively. The percentage of the cyclones generatedfrom south of 70°N in summer is the highest of the four seasons,which is very close to the results of Sorteberg and Walsh (2008).The crossing cyclones account up 50% of the total cyclone occur-rence at north of 70°N, the activities of them are a key factor af-fecting the Arctic weather, climate and air-sea-ice interaction. Asto an explosive event, which is defined as the pressure deepenednot less than 12 hPa in 12 h interval, a big gap is observed in eachseason. There are only 18 explosive cyclones were tracked during34 summers from 1979 to 2012, with the maximum deepeningrate of 18.2 hPa/(12 h). In contrast, the number in winter is 490,with the maximum deepening rate of 24.9 hPa/(12 h).
We divided the study domain into five regions (Fig. 1) follow-ing Julienne et al. (2011) .The regions are CHU (Chukchi and EastSiberian Seas), CRU (central Russia), GNB (Greenland, Norwegi-an and Barents Seas), GRL (Greenland) and HNA (high-latitude
70°N85°N
150°W
60°W
20°W
45°E
150°E
HNA
GR
L
GN
B
CRU
CH
U
Fig. 1. Five regions applied in this study: HNA (150°–60°W), GRL(20°–60°W), GNB (20°W–45°E), CRU (45°–150°E) and CHU(150°E–150°W).
Table 1. Statistics of cyclones over the Arctic Ocean from 1979 to 2012 in each seasonParameter Spring Summer Autumn Winter
Total number 2 064 2 276 2 464 2 759
Average number 60.7 66.6 72.5 83.6
Maximum number 85 (1990) 97 (1989/2012) 99 (2012) 116 (1992
Minimum number 42 (2006) 48 (1990) 55 (2002) 56 (1985)
Percentage of cyclones less than 980 hPa/%
11.8 6.4 16.0 21.5
Annual number of cyclones less than 980 hPa
7.1 4.5 11.7 17.4
Percentage of cyclones crossing into 70°N/%
46.7 50.4 39.0 37.2
Annual number of cyclones crossing into 70°N
28.3 33.7 28.3 30.2
Minimum central pressure/hPa
945.6 (7, March 1997at 71.4°N, 175.4°W)
964.7 (6, August 1995at 77.5°N, 86.3°W)
941.5 (17, November 1996at 80.6°N, 114.1°E)
936.1 (7, January 2001at 81.6°N, 7.4°E)
Average intensity/hPa 986.7 990.8 985.5 981.2
Total number of explosive events
159 18 191 470
Maximum deepening rate of explosive processes/ hPa·(12 h)–1
22.1 (26, March 2004 at 72.7°N, 173.0°W)
18.2 (22, August 1983 at 72.2°N, 20.5°E)
25.4 (14, November 2011 at 73.9°N, 48.1°E)
24.9 (7, January 1980 at 74.5°N, 0.16°E)
2 WEI Lixin et al. Acta Oceanol. Sin., 2017, Vol. 36, No. 10, P. 1–7
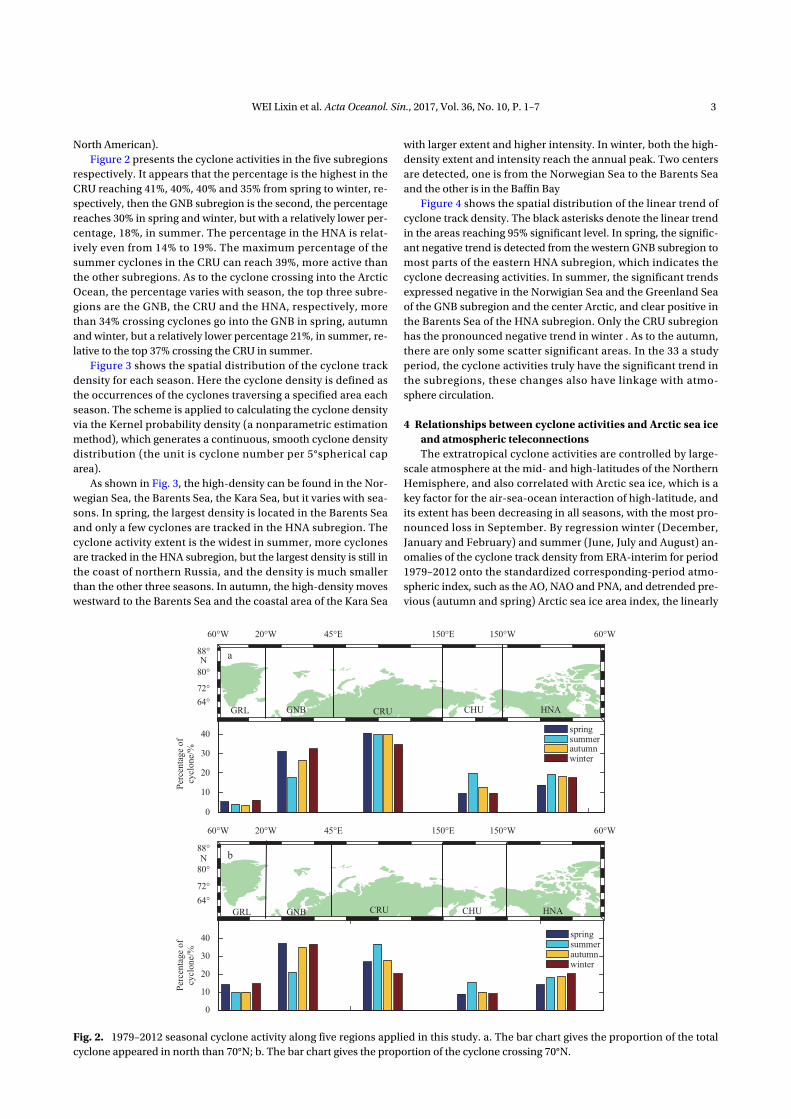
North American).Figure 2 presents the cyclone activities in the five subregions
respectively. It appears that the percentage is the highest in theCRU reaching 41%, 40%, 40% and 35% from spring to winter, re-spectively, then the GNB subregion is the second, the percentagereaches 30% in spring and winter, but with a relatively lower per-centage, 18%, in summer. The percentage in the HNA is relat-ively even from 14% to 19%. The maximum percentage of thesummer cyclones in the CRU can reach 39%, more active thanthe other subregions. As to the cyclone crossing into the ArcticOcean, the percentage varies with season, the top three subre-gions are the GNB, the CRU and the HNA, respectively, morethan 34% crossing cyclones go into the GNB in spring, autumnand winter, but a relatively lower percentage 21%, in summer, re-lative to the top 37% crossing the CRU in summer.
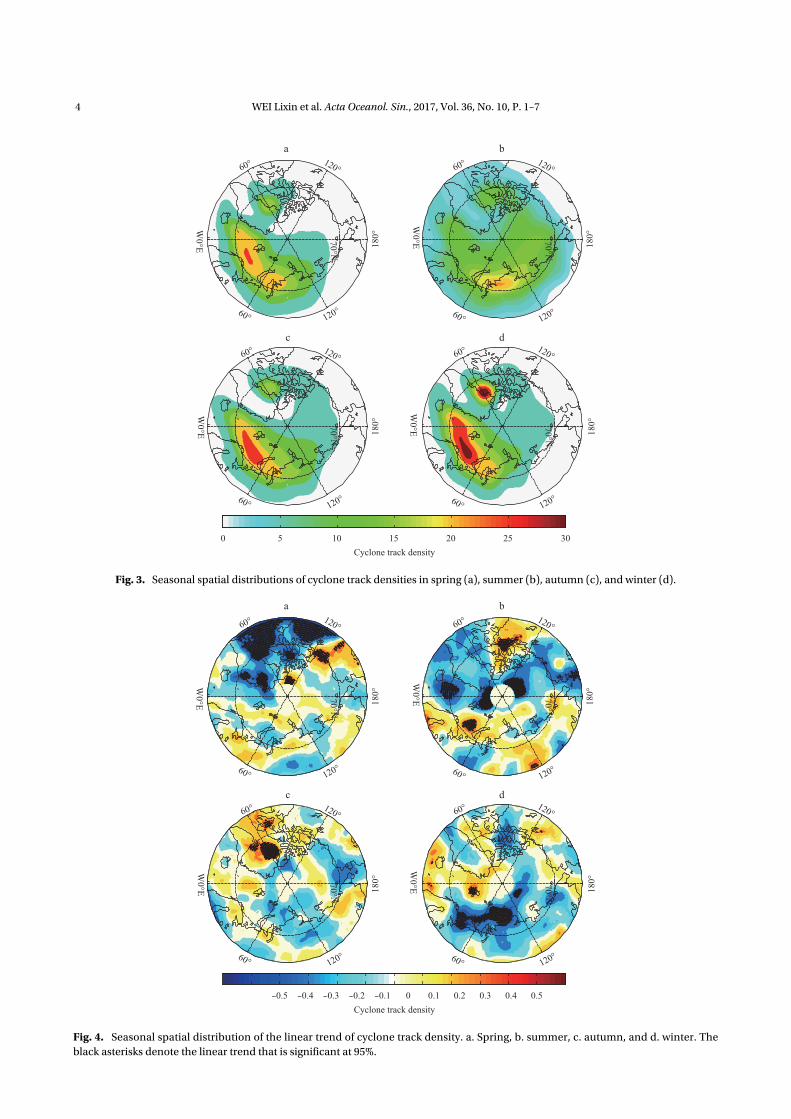
Figure 3 shows the spatial distribution of the cyclone trackdensity for each season. Here the cyclone density is defined asthe occurrences of the cyclones traversing a specified area eachseason. The scheme is applied to calculating the cyclone densityvia the Kernel probability density (a nonparametric estimationmethod), which generates a continuous, smooth cyclone densitydistribution (the unit is cyclone number per 5°spherical caparea).
As shown in Fig. 3, the high-density can be found in the Nor-wegian Sea, the Barents Sea, the Kara Sea, but it varies with sea-sons. In spring, the largest density is located in the Barents Seaand only a few cyclones are tracked in the HNA subregion. Thecyclone activity extent is the widest in summer, more cyclonesare tracked in the HNA subregion, but the largest density is still inthe coast of northern Russia, and the density is much smallerthan the other three seasons. In autumn, the high-density moveswestward to the Barents Sea and the coastal area of the Kara Sea
with larger extent and higher intensity. In winter, both the high-density extent and intensity reach the annual peak. Two centersare detected, one is from the Norwegian Sea to the Barents Seaand the other is in the Baffin Bay
Figure 4 shows the spatial distribution of the linear trend ofcyclone track density. The black asterisks denote the linear trendin the areas reaching 95% significant level. In spring, the signific-ant negative trend is detected from the western GNB subregion tomost parts of the eastern HNA subregion, which indicates thecyclone decreasing activities. In summer, the significant trendsexpressed negative in the Norwigian Sea and the Greenland Seaof the GNB subregion and the center Arctic, and clear positive inthe Barents Sea of the HNA subregion. Only the CRU subregionhas the pronounced negative trend in winter . As to the autumn,there are only some scatter significant areas. In the 33 a studyperiod, the cyclone activities truly have the significant trend inthe subregions, these changes also have linkage with atmo-sphere circulation.
4 Relationships between cyclone activities and Arctic sea iceand atmospheric teleconnectionsThe extratropical cyclone activities are controlled by large-
scale atmosphere at the mid- and high-latitudes of the NorthernHemisphere, and also correlated with Arctic sea ice, which is akey factor for the air-sea-ocean interaction of high-latitude, andits extent has been decreasing in all seasons, with the most pro-nounced loss in September. By regression winter (December,January and February) and summer (June, July and August) an-omalies of the cyclone track density from ERA-interim for period1979–2012 onto the standardized corresponding-period atmo-spheric index, such as the AO, NAO and PNA, and detrended pre-vious (autumn and spring) Arctic sea ice area index, the linearly
0
10
20
30
40
Per
centa
ge
of
cycl
one/
%
64°
72°
80°
88°
60°W 150°E 60°W20°W 45°E 150°W
60°W 150°E 60°W20°W 45°E 150°W
springsummerautumnwinter
CHU HNAGRL GNB CRU
a
0
10
20
30
40
Per
centa
ge
of
cycl
one/
%
64°
72°
80°
88°N
springsummerautumnwinter
GRL GNB CRU CHU HNA
b
N
Fig. 2. 1979–2012 seasonal cyclone activity along five regions applied in this study. a. The bar chart gives the proportion of the totalcyclone appeared in north than 70°N; b. The bar chart gives the proportion of the cyclone crossing 70°N.
WEI Lixin et al. Acta Oceanol. Sin., 2017, Vol. 36, No. 10, P. 1–7 3
70°N
120° 60°
W0°E
60° 120°
180°
70°N
120° 60°
W0°E
60° 120°
180°
70°N
120° 60°
W0°E
60° 120°
180°
70°N
120° 60°
W0°E
60° 120°
180°
a
c d
b
0 5 10 15 20 25 30
Cyclone track density
Fig. 3. Seasonal spatial distributions of cyclone track densities in spring (a), summer (b), autumn (c), and winter (d).
70°N
120° 60°
W0°E
60° 120°
180°
70°N
120° 60°
W0°E
60° 120°
180°
70°N
120° 60°
W0°E
60° 120°
180°
70°N
120° 60°
W0°E
60° 120°
180°
a
c d
b
Cyclone track density
-0.5 -0.4 -0.3 -0.2 -0.1 0 0.1 0.2 0.3 0.4 0.5
Fig. 4. Seasonal spatial distribution of the linear trend of cyclone track density. a. Spring, b. summer, c. autumn, and d. winter. Theblack asterisks denote the linear trend that is significant at 95%.
4 WEI Lixin et al. Acta Oceanol. Sin., 2017, Vol. 36, No. 10, P. 1–7

congruent between Arctic cyclone activities and the interannualvariability of the atmospheric circulation and sea ice area are ex-amined. The large-scale circulation indices (NAO/AO and PNA)are obtained from http://www.esrl.noaa.gov/psd/data/cli-mateindices and a sea ice index is obtained from http://nsidc.org/data/seaice_index. Figures 5a and b give the histograms ofnormalized large-scale indices and detrended sea ice area indexin summer and winter. Here we regressed the seasonal anom-alies of the cyclone track density fields onto the same period AO,NAO, PNA indices and pre-period detrended Arctic sea ice areaindex. The regression coefficient reveals that the cyclones activit-ies are closely linked to the large-scale circulation indices and the
sea ice area index. The threshold regression coefficient at 95%confidence level is 0.33.
Figure 6 shows the linear regression of the summer trackdensity with actual AO, NAO, PNA and the detrended spring seaice area. It reveals that the summer Arctic cyclone activity anom-alies are closely linked to the AO and NAO variabilities, and theregression distribution patterns are very similar, but the AO oneshows wider area reaching significant level. In Fig. 6a, the signi-ficant regression extends from the Denmark Strait and the Green-land Sea, across the central Arctic Ocean to the Baffin Bay andthe Canada Basin, which means more cyclones activities in theseregions following the anomalously positive AO index. On the op-
AO, PNA, NAO, previous season sea ice
1980 1985 1990 1995 2000 2005 2010
-3
-2
-1
0
1
2
Year
Index
val
ue
1980 1985 1990 1995 2000 2005 2010
-3
-2
-1
0
1
2
Year
Index
val
ue
a b
Fig. 5. The histograms of normalized large-scale indices: index in summer, sea ice area in previous season (spring) (a); and index inwinter, the detrended sea ice area in previous season (autumn) (b).
80°N
120° 60°
W0°E
60° 120°
180°
80°N
120° 60°
W0°E
60° 120°
180°
80°N
120° 60°
W0°E
60° 120°
180°
80°N
120° 60°
W0°E
60° 120°
180°
a
c d
b
Regression coefficient
-0.150 -0.125 -0.100 -0.075 -0.050 -0.025 0 0.025 0.050 0.075 0.100 0.125 0.150
Fig. 6. The linear regression coefficient of the cyclone summer track density on large-scale indices for the period 1979–2012. a. TheAO, b. the NAO, c. the PNA, and d. the detrended sea ice area in previous season (spring). The asterisks denote the regression about95% confidence level.
WEI Lixin et al. Acta Oceanol. Sin., 2017, Vol. 36, No. 10, P. 1–7 5

posite, the regions with the negative regression value are onlylocated over the Laptev Sea below significant level. The positivesignificant regression area is larger in Fig. 6a than that in Fig. 6b.In contrast, the negative correlation areas are larger and deeperin Fig. 6b than in Fig. 6a, especially in the Laptev Sea.
In Fig. 6c, the area of the negative regression between the an-omaly track density and the PNA index covers most part of theArctic Ocean, with the significant area located from north part ofGreenland Island, high latitude of North America to the BeaufortSea, and small part of East Siberian Sea. This means that the an-omalously negative PNA is associated with the increased activit-ies of the Arctic cyclones. The PNA impact on the track density isopposite to that of the AO and the NAO in most of the regionnorth of 70°N.
Since the late 1970s, benefited from the satellite observation,the sea ice data in the Arctic have been available for researchpurpose. The sea ice extent and area have experienced dramaticdecreasing, and induced a series variations in local and globalclimates (Stroeve, 2007; Comiso, 2008). In order to get know-ledge about the relationship between the cyclone activities andthe sea ice interannual variability, the linear regression betweenthe anomaly summer cyclone activities and the standardized de-
trended spring sea ice area was carried out. An independent lin-ear regression pattern from that of AO, NAO and PNA was re-vealed, some significant differences are noticed. In Fig. 6d, it re-veals that following anomalously low ice coverage in spring, thesummer cyclone activities over the Barents Sea and the Kara seaincreased substantially, in north of the Greenland sea, it showsthe opposite regression relationship.
Figure 7 shows the regression map between the cyclonewinter track density and the actual AO,NAO,PDA, detrended au-tumn sea ice area. The sign of regression value is opposite to thecorresponding maps in Figs 6a and b. Following the positiveAO/NAO index, the cyclone activities in the Greenland Sea andthe Baffin Bay decreased, and the significant extent is larger forthe NAO than the AO. In Fig. 7c, it reveals that the linear correla-tion between the winter cyclone track density and the PNA ismuch lower than that in summer. On the contrary, in Fig. 7d, theautumn sea ice has more closely linked to the winter cycloneactivities, following sea ice decreasing in autumn, the cyclonetrack density anomaly is positive in north of the Greenland Sea,and negative in the Barents Sea and east part of the Kara Sea. Toa large extent, this pattern is opposite to that of the summer trackdensity with spring sea ice area.
5 ConclusionsIn this study, the information of the Arctic cyclones is ob-
tained by a particular cyclone automatic identification and track-ing scheme, which is applied to the ERA-interim reanalysis forthe sea level pressure during the period 1979–2012. The criteria ofthis study is confined on the cyclones lifetime not being less than
12 h, the centre pressure not being greater than 1 000 hPa and thedomain from 70° to 85°N. Seasonal and interannual variations ofthe Arctic cyclone are calculated.
Our results show that the number of the cyclones in the Arc-tic has strong seasonal variations, the maximum is in winter andthe minimum is in spring not in summer, because more cyclones
80°N
120° 60°
W0°E
60° 120°
180°
80°N
120° 60°
W0°E
60° 120°
180°
80°N
120° 60°
W0°E
60° 120°
180°
80°N
120° 60°
W0°E
60° 120°
180°
a
c d
b
Regression coefficient
-0.20 -0.15 -0.10 -0.05 0 0.05 0.10 0.15 0.20
Fig. 7. The linear regression coefficient of the cyclone winter track density on large-scale indices for the period 1979–2012. a. The AO,b. the NAO, c. the PNA, and d. the detrended sea ice area in previous season (autumn). The asterisks denote the regression about 95%confidence level.
6 WEI Lixin et al. Acta Oceanol. Sin., 2017, Vol. 36, No. 10, P. 1–7

generated from south of 70°N across into the Arctic Oceanthrough the CRU in summer. The time series of cyclone counts inthe four seasons also show large interannual variations and havedifferent linear trends, but none of them reach the significantlevel (figures omitted).
The cyclone activities highly associate with large-scale atmo-spheric indices, but this association varies with season, the AO isthe most important large-scale circulation indicator that closelylinks to the Arctic cyclone activities in summer with the positivecorrelation, but this link is reversed with much shrunk extent inwinter. Moreover, the distribution patterns of the cyclone trackdensity regressed on the AO and the NAO are very similar, re-flecting the close physical relationship between them. The PNA isalso an important large-scale tele-connection pattern affectingthe cyclone activities in the Arctic. To highlight this, Notaro(2006) pointed out that the Atlantic cyclone activity maximumover Newfoundland is dominantly influenced by the PNA pat-tern. Here, we found that the PNA has mostly the opposite im-pact on cyclones compared with the AO,NAO, particularly overthe CHU and HNA regions in summer.
For the past a few years, the Arctic sea ice has been experien-cing accelerated decline in all season. The replacement of highlyreflective sea ice by open water increases the ocean surface fluxof heat and moisture into the atmosphere, which in turn has sub-stantial impacts on the winter atmospheric circulation. In thisstudy, we also examined the linearly links between the cyclonetrack density and the interannual variability of the preseasonArctic sea ice area. The regression map reveals that the cyclonetrack density in the Arctic Ocean is closely linked to the Arctic seaice variability, the pattern linked to the reduction of Spring,Au-tumn sea ice shows clearly different interannual variability relat-ive to the classical winter AO,NAO pattern.
This study shows that the complexity of the Arctic cycloneactivity, it controlled by several factors, none of the patterns(AO,NAO, PNA, sea ice) alone sufficiently explains the variabilit-ies of cyclone counts and activities. This indicates that to obtainan overall view on the Arctic cyclone activity, all relevant pat-terns need to be considered. And the relationships between thesefactors and cyclones may change with time, as pointed out byGulev et al. (2001).
ReferencesBlackmon M L. 1976. A climatological spectral study of the 500 mb
geopotential height of the Northern Hemisphere. Journal of theAtmospheric Sciences, 33(8): 1607–1623
Comiso J C, Parkinson C L, Gersten R, et al,. 2008. Accelerated de-cline in the arctic sea ice cover. Geophysical Research Letters,35(1): 179–210
Gulev S K, Zolina O, Grigoriev S. 2001. Extratropical cyclone variabil-ity in the Northern Hemisphere winter from NCEP/NCARreanalysis data. Climate Dynamics, 17(10): 795–809
Hodges K I. 1994. A general method for tracking analysis and its ap-plication to meteorological data. Monthly Weather Review,122(11): 2573–2586
Hodges K I. 1996. Spherical nonparametric estimators applied to theUGAMP model integration for AMIP. Monthly Weather Review,124(12): 2914–2932
Hoskins B J,Hodges K I. 2005. A new perspective on the Southern
Hemisphere winter storm tracks. Journal of Climate, 18(20):4108–4129
Julienne C S, Mark C S, Andrew B, et al. 2011. Attribution of recentchanges in autumn cyclone associated precipitation in the Arc-tic. Tellus A, 63:10.1111/tea.2011.63. issue-4: 653–663
Leckebusch G C, Ulbrich U. 2004. On the relationship between cyc-lones and extreme windstorm events over Europe under cli-mate change. Global & Planetary Change, 44(1): 181–193
Mesquita M D, Hodges K I, Atkinson D E, et al. 2009. Sea-ice Changesin the Sea of Okhotsk: Relationship with Northern HemisphereStorm Tracks. San Francisco, CA: American Geophysical Uni-on, Fall Meeting 2009 Abstract.
Notaro M, Wang W C, Gong, W. 2006. Model and observational ana-lysis of the northeast US regional climate and its relationship tothe PNA and NAO patterns during early winter.Monthly Weath-er Review, 134: 3479–3505
Orsolini Y J, Sorteberg A. 2009. Projected changes in Eurasian andArctic summer cyclones under global warming in the Bergenclimate model. Atmospheric and Oceanic Science Letters, 2(1):62–67
Pinto J G, Spangehl T, Ulbrich U, et al. 2006. Assessment of wintercyclone activity in a transient ECHAM4-OPYC3 GHG experi-ment. Meteorologische Zeitschrift, 15(3): 279–291
Serreze M C. 1995. Climatological aspects of cyclone developmentand decay in the arctic. Atmosphere-Ocean, 33(1): 1–23
Serreze M C, Barrett A P. 2008. The summer cyclone maximum overthe central Arctic Ocean. Atmosphere-Ocean, 33(1): 1–23
Serreze M C, Barry R G. 1988. Synoptic activity in the Arctic Basin,1979-1985. Journal of Climate, 1: 1276–1295
Screen J A, Simmonds I. 2011. Erroneous Arctic temperature trends inthe ERA-40 reanalysis: a closer look. Journal of Climate, 24(10):2620–2627
Simmonds I, Burke C, Keay K. 2008. Arctic climate change as mani-fest in cyclone behavior. Journal of Climate, 21(22): 5777–5796
Simmonds I, Keay K. 2009. Extraordinary September Arctic sea ice re-ductions and their relationships with storm behavior over1979–2008. Geophysical Research Letters, 36(19): 158–168
Simmonds I, Rudeva I. 2014. A comparison of tracking methods forextreme cyclones in the Arctic Basin. Tellus A,66,25252
Sorteberg A, Walsh J E. 2008. Seasonal cyclone variability at 70°N andits impact on moisture transport into the Arctic. Tellus, 60A:570–586
Stroeve J, Holland M M, Meier W, et al. 2007. Arctic sea ice decline:faster than forecast. Geophysical Research Letters, 34(9):529–536
Ulbrich U, Christoph M. 1999. A shift of the NAO and increasingstorm track activity over Europe due to anthropogenic green-house gas forcing. Climate Dynamics, 15(7): 551–559
Uotila P, Vihma T, Pezza A B, et al. 2011. Relationships between Ant-arctic cyclones and surface conditions as derived from high-resolution numerical weather prediction data. Journal of Geo-physical Research: Atmospheres, 116(D7):D07109
Wang X L, Swail V R, Zwiers F W. 2006. Climatology and changes ofextratropical cyclone activity: comparison of ERA-40 withNCEP–NCAR reanalysis for 1958–2001. Journal of Climate,19(13): 3145
Wei L, Qin T. 2016. Characteristics of cyclone climatology and variabi-lity in the Southern Ocean. Acta Oceanologica Sinica, 35(7):59–67
Zhang X, Walsh J E, Zhang J. 2004. Climatology and interannual vari-ability of Arctic cyclone activity: 1948-2002. Journal of Climate,17: 2300–2317
WEI Lixin et al. Acta Oceanol. Sin., 2017, Vol. 36, No. 10, P. 1–7 7