the arctic winter ice cover is showing significant warming signals. accelerated decline in the...
TRANSCRIPT
The Arctic winter ice cover is showing significant warming signals.
Accelerated decline in the Arctic Seasonal Sea Ice CoverJosefino C. Comiso - Code 614.1 - NASA Goddard Space Flight Center
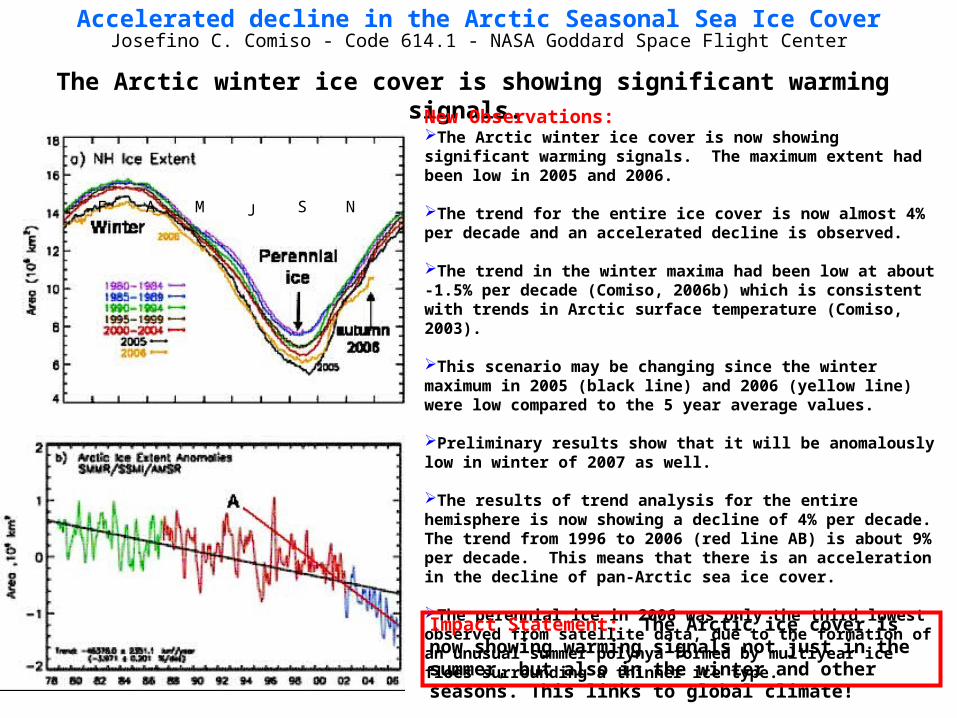
New Observations: The Arctic winter ice cover is now showing significant warming signals. The maximum extent had been low in 2005 and 2006.
The trend for the entire ice cover is now almost 4% per decade and an accelerated decline is observed.
The trend in the winter maxima had been low at about -1.5% per decade (Comiso, 2006b) which is consistent with trends in Arctic surface temperature (Comiso, 2003).
This scenario may be changing since the winter maximum in 2005 (black line) and 2006 (yellow line) were low compared to the 5 year average values.
Preliminary results show that it will be anomalously low in winter of 2007 as well.
The results of trend analysis for the entire hemisphere is now showing a decline of 4% per decade. The trend from 1996 to 2006 (red line AB) is about 9% per decade. This means that there is an acceleration in the decline of pan-Arctic sea ice cover.
The perennial ice in 2006 was only the third lowest observed from satellite data, due to the formation of an unusual summer polynya formed by multiyear ice floes surrounding a thinner ice type.
Impact Statement: The Arctic ice cover is now showing warming signals not just in the summer, but also in the winter and other seasons. This links to global climate!
F A M J S N

Accelerated decline in the Arctic Seasonal Sea Ice CoverJosefino C. Comiso-Code 614.1-NASA Goddard Space Flight Center
Conclusions: The hemispherical trend is still modest at about 4% per decade but an acceleration in the trend is apparent with the decline being about 9% per decade in the last 10 years. With warming trends in the region being about a factor of three higher than global trends, and with ice-albedo-feedback effects, the near term scenario is for the sea ice cover to continue to retreat.
Impact Statement: The Arctic ice cover is now showing warming signals not just in the summer, butalso in the winter and other seasons. This links to global climate!
Likely Near Term Scenario:
The perennial ice (purple color) has been shrinking rapidly at 9% per decade. An acceleration of the decrease is apparent in data from the last 5 years. An unusual summer polynya is a manifestation of thinner ice types would melt during the summer.
Now, the winter maxima and the hemispherical ice cover have started declining at a rate comparable to that of the perennial ice during the last decade. This ice trend is consistent with greenhouse warming not just in the summer but also in the winter.

• Problem:
– NASA Global Precipitation Mission (GPM) extends precipitation measurement to latitudes where falling snow makes a significant contribution to the hydrological cycle. Further, new channels have been added to GPM’s Core satellite radar and radiometer instruments that are more sensitive to the frozen particles in clouds.
• Purpose:– We must develop GPM snowfall retrieval algorithms and validation datasets prior to launch in 2013.
• Objectives:– Describe the microphysical properties of falling snow (size, shape, number, density)– Compute radiative properties as related to microwave radiances and radar reflectivities– Improve cloud-resolving models of falling snow events for satellite-simulator retrieval databases– Test prototypes of cold-season ground validation methodology in international environments– Develop working microwave snow retrieval algorithms before GPM launch
• Procedure:
– Intensive snowfall observations during IOP-3 of C3VP in January 2007, Ontario, Canada.– Deploy UMASS Advanced Multi-Frequency Radar (AMFR) with matched beams at GPM frequencies
– Deploy ground-based particle measurement systems including CSU 2D Video Disdrometer, NASA Parsivel Laser Disdrometers (Ali Tokay, 613.1), and NASA Snow Video Imager (Larry Bliven, 614.6).
– Participate/direct coordinated ground and airborne operations during C3VP field campaign.
– Leveraged analysis using NASA deployed instrumentation with C3VP-contributed radar, gauge and airborne microphysical measurements.• Results (Please see graphics on next slide):
– Very successful air/ground-based microphysical data collections on several snowfall events.
– Snow crystal growth, shape and size were collected concomitant to ground, aircraft, and satellite sampling.
– Figure 1 shows 2D-P in situ images of snow particles as the aircraft spirals from 3 to 2km in the cloud layer where the snow crystals change into aggregates.
– Fig. 2 provides ground-based C-Band radar for the same 1/22/07 event.
– Figures 3 and 4 show a link between liquid water equivalent rain rate (Fig. 4) and satellite TB images at 183 GHz (Figs. 3A and 3B). The strong TB depression for Fig. 3B is evident at the higher precipitation rate in Fig 4.
– Further reduction of dataset required to assess impacts for algorithm development and validation.
Satellite Falling Snow Retrieval: NASA Participation in the Canadian CloudSat/CALIPSO Validation Project (C3VP)Gail Skofronick-Jackson Code 614.6, Walter A. Petersen, Univ. Alabama-Huntsville
Impact Statement: This collaborative effort provides a rich dataset for developing falling snow detection and estimation algorithms for GPM.

Much stronger Tb signal @183 +/- 7 GHz for precipitation rates > 1.5 mm/hr
Threshold for detection? Precipitation depth, distribution, ice particle habit? Surface ?
260
256
252
248
260
256
252
248
AMSU-B 0338 UTC
NOAA 17AMSU-B 0630 UTC
NOAA 18
AMSU-B: Weak Tb signal @183 +/- 7 GHz at precip rates of 0.5-.7 mm/hr
~3.1 km
~2.0 km
~2.5 km
IWC 0.5 - 0.7 g m-3
IWC 0.1- 0.3 g m-3
AIRBORNE GROUND RADAR SAMPLE SAMPLE
Rapid growth of branched crystals and aggregation (3-5 km)
Rapid transition at 2.5 km to large aggregates [O(1.5 cm)] AIRCRAFT
2 km
4 km
King City C-band RHI 331o
Top of large aggregate zone
Large Aggregates
Snow Crystals
Precip. Rates
.5 - 2.5 mm hr-1
(LWEQ)
A B
Figure 1 Figure 2
Fig. 3A Fig. 3B
Fig. 4
Satellite Falling Snow Retrieval: NASA Participation in the Canadian CloudSat/CALIPSO Validation Project (C3VP)Gail Skofronick-Jackson Code 614.6, Walter A. Petersen, Univ. Alabama-Huntsville
Impact Statement: This collaborative effort provides a rich dataset for developing falling snow detection and estimation algorithms for GPM.

Impacts on Plant-Pollinator Interactions Due to Climate Changes in Central Maryland W. Esaias, Code 614.2
Problem: Climate and land cover/land use changes are impacting plant-pollinator interactions, with unknown consequences on terrestrial ecosystems and agriculture.Purpose: Measurements of Honey Bee hive weights reveal nectar flow dynamics, which can be compared to satellite derived models of phenological change. They are at the right scale for inclusion in coupled ecosystem/climate models. Numbers of measurements must be increased dramatically: the simple, robust technique and widespread hive abundance make this possible, but a regional demonstration is needed.
Results: Time series of hive weights show that the Central MD Nectar Flow occurs one month earlier than 30 years ago, due to urban warming, fully consistent with independent phenological and temperature records in the area. A volunteer network of > 25 beekeepers will collect data throughout Maryland in 2007. GSFC is providing IT web-based infrastructure to enable comparison with EOS satellite observations and climate data records.
IMPACT STATEMENT: Scale-hive monitoring may provide a long- sought after approach for relating variations in plant-pollinator interactions directly to satellite data and ecosystem-climate impact studies on a national and global scale.
-20
0
20
40
60
80
100
120
29-Apr 13-May 27-May 10-Jun
Weig
ht
(Pou
nd
s)
-2
0
2
4
6
8
10
12
Pou
nds/
day
100
110
120
130
140
150
160
170
180
1920 1940 1960 1980 2000
Nect
ar
Flo
w M
etr
ics
Day o
f Ye
ar
Hive Weight (red/left) and Daily Gain (green/right) 2006
Recent Advancement in Nectar Flow Dates in Central Maryland

GRACE Enables New Estimates of Evapotranspiration
Matthew Rodell, Hiroko Kato, and Ben Zaitchik, Hydrological Sciences BranchBackground: Scientists use high precision observations of Earth’s gravity field from NASA’s Gravity Recovery and Climate Experiment (GRACE) satellites to infer monthly changes in total land water storage (groundwater, soil moisture, snow, and surface water). This unique data source provides new insight on water cycle processes, including evapotranspiration. Objective:
We estimated monthly ET averaged over the Mississippi River basin (Figure 1) using GRACE derived water storage changes (dS) with measurements of precipitation (P) and river discharge (R).
Based on the Law of Conservation of Mass, we know that ET = P – dS – R over a given region. This is known as the “water budget” of the land surface.
Impact Statement: GRACE satellite observations provide estimates of evapotranspiration. These will lead to improved weather and climate forecasts
Figure 1. Evapotranspiration (mm/year) over the Mississippi River basin for 2003-05, estimated by the Catchment land surface model.
Results and Discussion:Our GRACE-based ET estimates compared favorably with those from computer models of atmospheric and land surface processes. Figure 2 (next slide) is a graph of estimated ET (mm/day) vs. time. The black circles represent GRACE-based estimates, and the colored symbols represent computer model estimates. Each line is a fitted seasonal cycle for one set of estimates. We compared results from the atmospheric models of three operational forecast centers:
National Oceanographic and Atmospheric Administration (NOAA/GDAS)European Centre for Medium-range Weather Forecasts (ECMWF)Air Force Weather Agency (AFWA). We also compared ET estimates from four land surface models: NASA’s Global Land Data Assimilation System (GLDAS) driving the Noah, CLM2, and Mosaic models, and the Catchment land surface model. The accuracy of the new estimates is good enough that they can be used to evaluate such computer models (Table 1), which may lead to future improvements in weather and climate prediction. Of the atmospheric models, AFWA’s had the best combination of low bias and high correlation coefficient. GLDAS/Noah performed the best of the land models and overall.

Units: mm/day
GRACE NOAA/GDAS
ECMWF AFWA GLDAS/Noah
GLDAS/CLM2
GLDAS/Mosaic
Catchment LSM
Mean 1.53 2.53 1.99 1.98 1.64 1.34 1.75 1.84
Bias 1.00 0.47 0.46 0.12 -0.19 0.22 0.32
r 0.90 0.91 0.91 0.92 0.92 0.92 0.89
Table 1. Basin-mean evapotranspiration (mm/day) estimated using the GRACE technique and seven computer models. Also shown are the bias and correlation coefficient (r) relative to GRACE.
Figure 2. Time series (symbols) and seasonal cycles (lines) of evapotranspiration (mm/day) averaged over the Mississippi River basin, estimated using the GRACE technique and seven computer models.
-1
0
1
2
3
4
5
6Ja
n-0
3
Ap
r-03
Jul-
03
Oct
-03
Jan
-04
Ap
r-04
Jul-
04
Oct
-04
Jan
-05
Ap
r-05
Jul-
05
Oct
-05
Jan
-06
Ap
r-06
Eva
po
tran
spir
atio
n,
mm
/day
NOAA/GDAS ECMWF AFWA
GLDAS/Noah GLDAS/CLM2 GLDAS/Mosaic
Catchment LSM GRACE
-1
0
1
2
3
4
5
6Ja
n-0
3
Ap
r-03
Jul-
03
Oct
-03
Jan
-04
Ap
r-04
Jul-
04
Oct
-04
Jan
-05
Ap
r-05
Jul-
05
Oct
-05
Jan
-06
Ap
r-06
NOAA/GDAS ECMWF AFWA
GLDAS/Noah GLDAS/CLM2 GLDAS/Mosaic
Catchment LSM GRACE/3B42 Time Period
Impact Statement: GRACE satellite observations provide estimates of evapotranspiration. These will lead to improved weather and climate forecasts
GRACE Enables New Estimates of EvapotranspirationMatthew Rodell, Hiroko Kato, and Ben Zaitchik, Hydrological Sciences Branch