sdr 159/2012 absenteeism from secondary schools, 2011/12 · sdr 159/2012 25 september 2012...
TRANSCRIPT
SDR 159/2012 25 September 2012
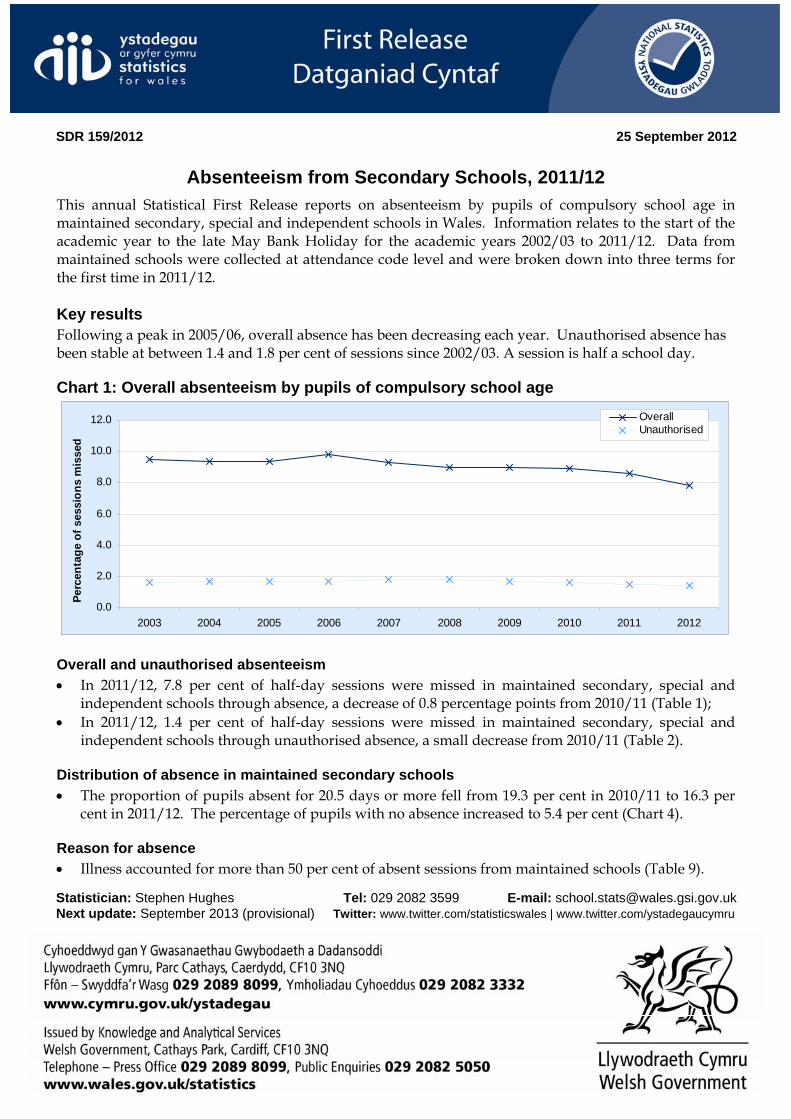
Absenteeism from Secondary Schools, 2011/12 This annual Statistical First Release reports on absenteeism by pupils of compulsory school age in maintained secondary, special and independent schools in Wales. Information relates to the start of the academic year to the late May Bank Holiday for the academic years 2002/03 to 2011/12. Data from maintained schools were collected at attendance code level and were broken down into three terms for the first time in 2011/12. Key results Following a peak in 2005/06, overall absence has been decreasing each year. Unauthorised absence has been stable at between 1.4 and 1.8 per cent of sessions since 2002/03. A session is half a school day.
Chart 1: Overall absenteeism by pupils of compulsory school age
0.0
2.0
4.0
6.0
8.0
10.0
12.0
2003 2004 2005 2006 2007 2008 2009 2010 2011 2012
Perc
enta
ge o
f ses
sion
s m
isse
d
OverallUnauthorised
Overall and unauthorised absenteeism • In 2011/12, 7.8 per cent of half-day sessions were missed in maintained secondary, special and
independent schools through absence, a decrease of 0.8 percentage points from 2010/11 (Table 1); • In 2011/12, 1.4 per cent of half-day sessions were missed in maintained secondary, special and
independent schools through unauthorised absence, a small decrease from 2010/11 (Table 2). Distribution of absence in maintained secondary schools • The proportion of pupils absent for 20.5 days or more fell from 19.3 per cent in 2010/11 to 16.3 per
cent in 2011/12. The percentage of pupils with no absence increased to 5.4 per cent (Chart 4). Reason for absence • Illness accounted for more than 50 per cent of absent sessions from maintained schools (Table 9).
Statistician: Stephen Hughes Tel: 029 2082 3599 E-mail: [email protected] Next update: September 2013 (provisional) Twitter: www.twitter.com/statisticswales | www.twitter.com/ystadegaucymru
Introduction Chart 1 shows authorised and unauthorised absenteeism from secondary schools in Wales since the 2002/03 academic year. The tables that follow break down the percentage of half-day sessions missed due to absenteeism by school type, gender, local authority, free school meal entitlement, etc. Charts 2 and 3 show the change in the range of local authority-level absenteeism over time and Chart 4 helps users to understand how the proportions of pupils absent for varying lengths of time have changed.
Tables 8 to 10 report on the term- and code-level data collected from maintained secondary schools for the first time in 2011/12. Table 8 shows the overall and unauthorised absenteeism rates of maintained secondary schools by school term. Table 9 displays the distribution of reasons for absence, i.e. the percentage of overall absence accounted for by each attendance reason for absence. Table 10 shows the percentage of sessions missed from maintained secondary schools by reason for absence.
Investigation will be carried out into how best to incorporate term-level data into more tables in subsequent editions of this Statistical First Release. These changes may also be brought into effect in the Statistical First Release ‘Absenteeism from Primary Schools, 2011/12.’ Contents page Chart 1 Overall absenteeism by pupils of compulsory school age 1 Table 1 Overall absenteeism by pupils of compulsory school age, by sector 3 Table 2 Unauthorised absenteeism by pupils of compulsory school age, by sector 3 Table 3 Absenteeism by pupils of compulsory school age, by gender 4 Table 4 Absenteeism by pupils of compulsory school age in all maintained secondary
schools, by proportion entitled to free school meals, 2011/12 4
Table 5 Absenteeism by pupils of compulsory school age in all maintained secondary and special schools, by local authority
5
Chart 2 Range of local authorities’ rates of overall absenteeism by pupils of compulsory school age
6
Chart 3 Range of local authorities’ rates of unauthorised absenteeism by pupils of compulsory school age
7
Table 6 Distribution of pupils in maintained secondary schools by length of overall absence, 2011/12
8
Table 7 Distribution of pupils in maintained secondary schools by their overall absence rates, 2011/12
8
Chart 4 Distribution of pupils in maintained secondary schools by length of overall absence 9 Table 8 Absenteeism by pupils of compulsory school age in maintained secondary schools,
by term, 2011/12 9
Table 9 Distribution of reasons for absence by pupils of compulsory school age in maintained secondary schools, by reason for absence, 2011/12
10
Table 10 Percentage of sessions missed by pupils of compulsory school age from maintained secondary schools, by reason for absence, 2011/12
10
2
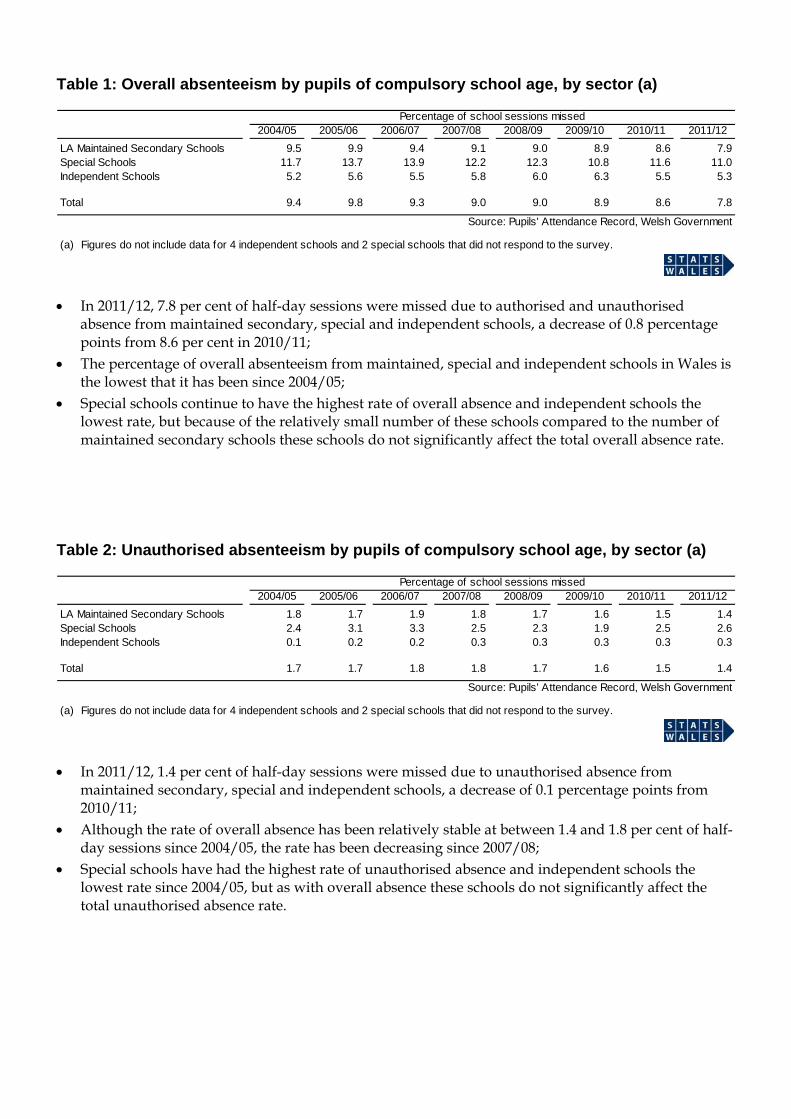
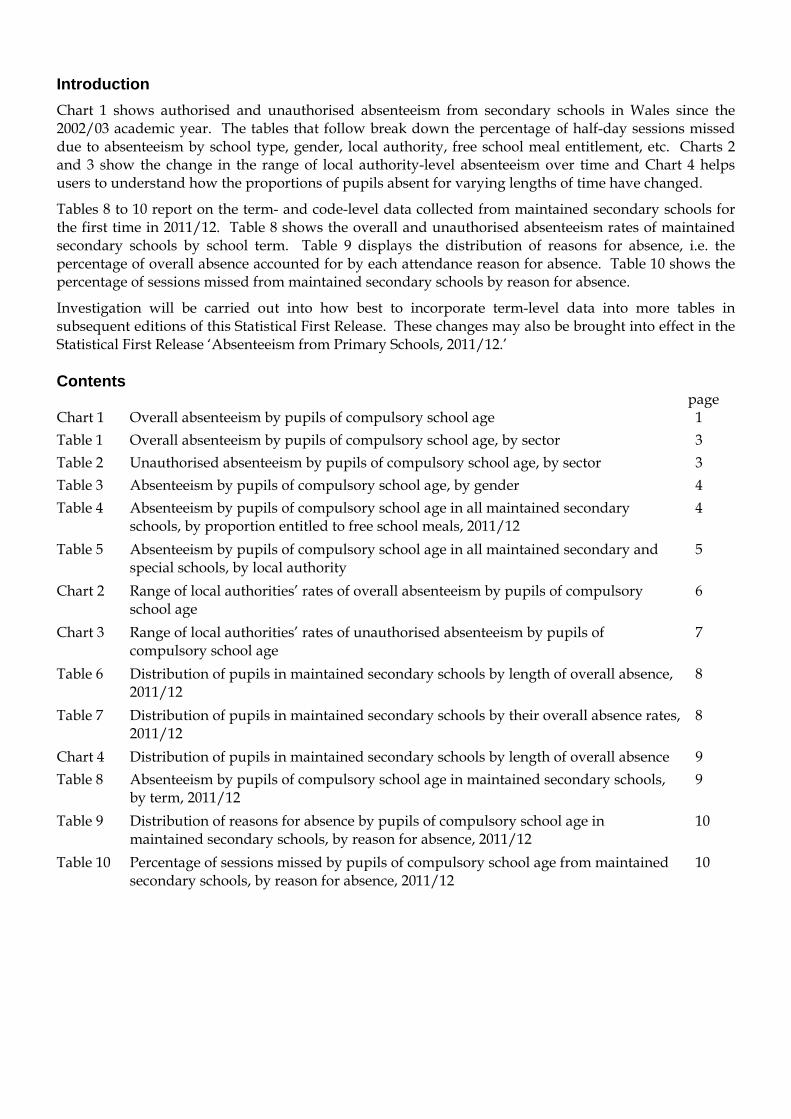
Table 1: Overall absenteeism by pupils of compulsory school age, by sector (a)
2004/05 2005/06 2006/07 2007/08 2008/09 2009/10 2010/11 2011/12LA Maintained Secondary Schools 9.5 9.9 9.4 9.1 9.0 8.9 8.6 7.9Special Schools 11.7 13.7 13.9 12.2 12.3 10.8 11.6 11.0Independent Schools 5.2 5.6 5.5 5.8 6.0 6.3 5.5 5.3
Total 9.4 9.8 9.3 9.0 9.0 8.9 8.6 7.8
Source: Pupils' Attendance Record, Welsh Government
(a) Figures do not include data for 4 independent schools and 2 special schools that did not respond to the survey.
Percentage of school sessions missed
• In 2011/12, 7.8 per cent of half-day sessions were missed due to authorised and unauthorised
absence from maintained secondary, special and independent schools, a decrease of 0.8 percentage points from 8.6 per cent in 2010/11;
• The percentage of overall absenteeism from maintained, special and independent schools in Wales is the lowest that it has been since 2004/05;
• Special schools continue to have the highest rate of overall absence and independent schools the lowest rate, but because of the relatively small number of these schools compared to the number of maintained secondary schools these schools do not significantly affect the total overall absence rate.
Table 2: Unauthorised absenteeism by pupils of compulsory school age, by sector (a)
2004/05 2005/06 2006/07 2007/08 2008/09 2009/10 2010/11 2011/12LA Maintained Secondary Schools 1.8 1.7 1.9 1.8 1.7 1.6 1.5 1.4Special Schools 2.4 3.1 3.3 2.5 2.3 1.9 2.5 2.6Independent Schools 0.1 0.2 0.2 0.3 0.3 0.3 0.3 0.3
Total 1.7 1.7 1.8 1.8 1.7 1.6 1.5 1.4
Source: Pupils' Attendance Record, Welsh Government
(a) Figures do not include data for 4 independent schools and 2 special schools that did not respond to the survey.
Percentage of school sessions missed
• In 2011/12, 1.4 per cent of half-day sessions were missed due to unauthorised absence from
maintained secondary, special and independent schools, a decrease of 0.1 percentage points from 2010/11;
• Although the rate of overall absence has been relatively stable at between 1.4 and 1.8 per cent of half-day sessions since 2004/05, the rate has been decreasing since 2007/08;
• Special schools have had the highest rate of unauthorised absence and independent schools the lowest rate since 2004/05, but as with overall absence these schools do not significantly affect the total unauthorised absence rate.
3

Table 3: Absenteeism by pupils of compulsory school age in all schools, by gender (a)
2007/08 2008/09 2009/10 2010/11 2011/12Number of schools providing gender information 303 306 311 304 299Percentage of schools providing gender information 97 98 97 98 98
Unauthorised absences:Boys 1.8 1.7 1.6 1.4 1.4Girls 1.8 1.7 1.6 1.5 1.4
All absences:Boys 8.8 8.7 8.7 8.4 7.7Girls 9.3 9.2 9.1 8.8 8.0
Source: Pupils' Attendance Record, Welsh Government
(a) It is not advisable to compare year on year changes for data on absenteeism by gender. Although it became compulsory for maintainedschools to provide gender information in 2007/08, it remains voluntary for special and independent schools, so different numbers ofschools provide this information each year.
Percentage of schools sessions missed
• Historically, girls have had a higher rate of overall absence than boys and this continues to be the
case in 2011/12, however the gap has narrowed; • Girls and boys had the same rate of unauthorised absence in 2011/12, missing 1.4 per cent of half
day sessions for unauthorised reasons. Table 4: Absenteeism by pupils of compulsory school age in all maintained secondary
schools, by proportion entitled to free school meals, 2011/12 (a)
Proportion entitled to free school meals All absences Unauthorised absences Number of schools10% or less 6.3 0.6 5015% or less, but over 10% 7.2 0.9 5820% or less, but over 15% 8.0 1.1 3430% or less, but over 20% 8.9 1.9 52over 30% 10.7 3.6 27
All maintained schools 7.9 1.4 221
Source: Pupils' Attendance Record and PLASC, Welsh Government
(a) Free school meal data are based on a three year average.
Percentage of school sessions missed
• Table 4 suggests that there is a relationship between the proportion of pupils entitled to free school
meals and the rate of absenteeism. It suggests that in general schools with a higher proportion of pupils entitled to free school meals have higher absenteeism rates;
• Free school meals are provided to pupils in low income households, so this suggests that there may be a more general relationship between deprivation and pupil absence.
4

Table 5: Absenteeism by pupils of compulsory school age in all maintained secondary and special schools, by local authority (a)
Local Authority 2008/09 2009/10 2010/11 2011/12 2008/09 2009/10 2010/11 2011/12Isle of Anglesey 9.1 9.4 9.1 7.8 0.9 1.1 1.3 0.7Gw ynedd 9.1 8.7 8.1 7.9 1.3 1.1 1.0 0.9Conw y 8.4 8.1 7.6 7.3 2.1 1.6 1.6 1.5Denbighshire 9.0 8.8 8.3 7.1 2.3 2.0 1.4 1.5Flintshire 7.8 7.8 7.6 7.0 0.7 0.6 0.5 0.5
Wrexham 8.0 8.5 7.6 7.2 1.9 1.8 1.6 1.7Pow ys 8.7 8.3 8.5 7.1 0.8 0.4 0.5 0.4Ceredigion 8.2 8.3 7.5 6.3 1.1 1.1 1.2 1.1Pembrokeshire 8.9 9.3 8.7 7.4 1.4 1.5 0.9 0.5Carmarthenshire 9.2 8.8 9.0 8.6 0.9 0.7 0.8 0.6
Sw ansea 9.3 9.4 9.0 8.0 1.9 2.0 1.6 1.4Neath Port Talbot 8.2 8.3 8.1 7.7 0.5 0.6 0.5 0.5Bridgend 8.8 9.1 8.8 8.1 1.8 1.8 1.7 1.6The Vale of Glamorgan 8.3 8.3 8.7 7.3 1.1 1.3 1.5 1.0Rhondda, Cynon, Taff 10.3 9.5 9.4 9.4 2.3 1.8 1.8 2.1
Merthyr Tydfil 9.2 9.1 8.6 7.6 1.3 1.3 0.9 1.0Caerphilly 9.6 9.5 9.3 8.3 2.0 1.9 2.1 1.8Blaenau Gw ent 9.4 9.4 10.6 9.6 2.0 2.0 2.1 2.4Torfaen 9.7 9.5 8.3 7.7 3.6 3.0 1.3 1.2Monmouthshire 8.2 8.0 7.8 7.0 0.8 0.6 0.6 0.6
New port 9.4 8.7 8.2 8.1 2.2 1.9 2.0 2.1Cardiff 9.5 9.6 9.6 8.3 2.9 2.8 2.9 2.7
Wales (b) 9.0 8.9 8.6 7.8 1.7 1.6 1.5 1.4
Source: Pupils' Attendance Record, Welsh Government
(a) Figures do not include data for 4 independent schools and 2 special schools that did not respond to the survey.(b) Includes independent schools.
Percentage of school sessions missed due to:All absences Unauthorised absences
• In 2011/12 Blaenau Gwent local authority had the highest rate of overall absenteeism from
maintained secondary and special schools (9.6 per cent), while Ceredigion had the lowest rate (6.3 per cent);
• In 2011/12 the highest rate of unauthorised absence (2.7 per cent) was found in Cardiff, while Powys had the lowest rate of unauthorised absence (0.4 per cent).
5

Chart 2: Range of local authorities’ rates of overall absenteeism by pupils of compulsory school age Chart 2 shows how the range of overall absence rates at the local authority level has changed over time and can be used in conjunction with the ‘All absences’ columns in Table 5. For each academic year a line has been drawn from the lowest local authority’s overall absence rate to the highest. For example, in 2011/12 the lowest rate was 6.3 per cent and the highest rate was 9.6 per cent.
For each year the quarter of local authorities with the highest rate of overall absenteeism lie above the blue box, the quarter of local authorities with the lowest rate of overall absenteeism fall below the blue box and the remaining half of local authorities are in the blue box. The Wales average overall absenteeism rate has been plotted to show how the changes in local authority rates relate to the change in Wales as a whole.
6.3
7.57.87.87.57.98.17.87.77.9
9.6
10.6
9.610.310.1
11.011.110.911.011.2
0.0
2.0
4.0
6.0
8.0
10.0
12.0
2003 2004 2005 2006 2007 2008 2009 2010 2011 2012
Perc
enta
ge o
f ses
sion
s m
isse
d
Wales average
• The highest rate of overall absenteeism in 2011/12, 9.6 per cent in Blaenau Gwent, is the lowest that
this value has been since 2002/03, together with 2009/10; • The lowest rate of overall absenteeism in 2011/12 was 1.2 percentage points lower than this value
has been since 2002/03; • The top of the blue box for 2011/12, marking the level below which three quarters of local authorities
fall, is at the same level as the bottom of the blue box for 2010/11, which marks the level below which one quarter of local authorities fall. This means that approximately three quarters of local authorities had lower rates of overall absenteeism than three quarters of schools last year.
6
Chart 3: Range of local authorities’ rates of unauthorised absenteeism by pupils of compulsory school age Chart 3 shows how the range of unauthorised absence rates at the local authority level has changed over time and can be used in conjunction with the ‘Unauthorised absences’ columns in Table 5. For each academic year a line has been drawn from the lowest local authority’s unauthorised absence rate to the highest. For example, in 2011/12 the lowest rate was 0.4 per cent and the highest rate was 2.7 per cent.
For each year the quarter of local authorities with the highest rate of unauthorised absenteeism lie above the blue box, the quarter of local authorities with the lowest rate of unauthorised absenteeism fall below the blue box and the remaining half of local authorities are in the blue box. The Wales average unauthorised absenteeism rate has been plotted to show how the changes in local authority rates relate to the change in Wales as a whole.
0.40.50.40.50.50.70.40.60.50.6
2.72.93.03.63.3
3.73.43.33.33.4
0.0
2.0
4.0
6.0
8.0
10.0
12.0
2003 2004 2005 2006 2007 2008 2009 2010 2011 2012
Perc
enta
ge o
f ses
sion
s m
isse
d
Wales average
• The highest rate of unauthorised absenteeism in 2011/12 was 2.7 per cent, which is the lowest that
this value has been since 2002/03; • The lowest rate of unauthorised absence was 0.4 per cent in Powys, which again is the lowest that
this value has been since 2002/03, together with 2005/06 and 2009/10.
7
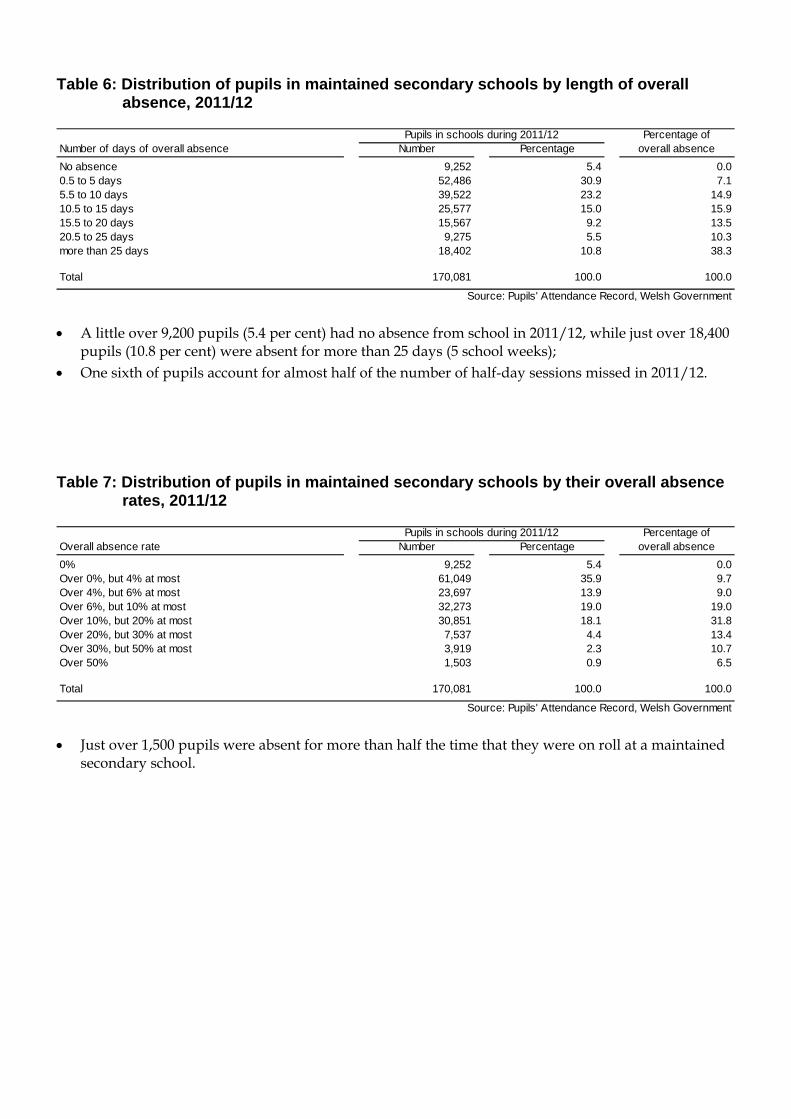
Table 6: Distribution of pupils in maintained secondary schools by length of overall absence, 2011/12
Percentage ofNumber of days of overall absence Number Percentage overall absenceNo absence 9,252 5.4 0.00.5 to 5 days 52,486 30.9 7.15.5 to 10 days 39,522 23.2 14.910.5 to 15 days 25,577 15.0 15.915.5 to 20 days 15,567 9.2 13.520.5 to 25 days 9,275 5.5 10.3more than 25 days 18,402 10.8 38.3
Total 170,081 100.0 100.0
Source: Pupils' Attendance Record, Welsh Government
Pupils in schools during 2011/12
• A little over 9,200 pupils (5.4 per cent) had no absence from school in 2011/12, while just over 18,400
pupils (10.8 per cent) were absent for more than 25 days (5 school weeks); • One sixth of pupils account for almost half of the number of half-day sessions missed in 2011/12. Table 7: Distribution of pupils in maintained secondary schools by their overall absence
rates, 2011/12
Percentage ofOverall absence rate Number Percentage overall absence0% 9,252 5.4 0.0Over 0%, but 4% at most 61,049 35.9 9.7Over 4%, but 6% at most 23,697 13.9 9.0Over 6%, but 10% at most 32,273 19.0 19.0Over 10%, but 20% at most 30,851 18.1 31.8Over 20%, but 30% at most 7,537 4.4 13.4Over 30%, but 50% at most 3,919 2.3 10.7Over 50% 1,503 0.9 6.5
Total 170,081 100.0 100.0
Source: Pupils' Attendance Record, Welsh Government
Pupils in schools during 2011/12
• Just over 1,500 pupils were absent for more than half the time that they were on roll at a maintained
secondary school.
8
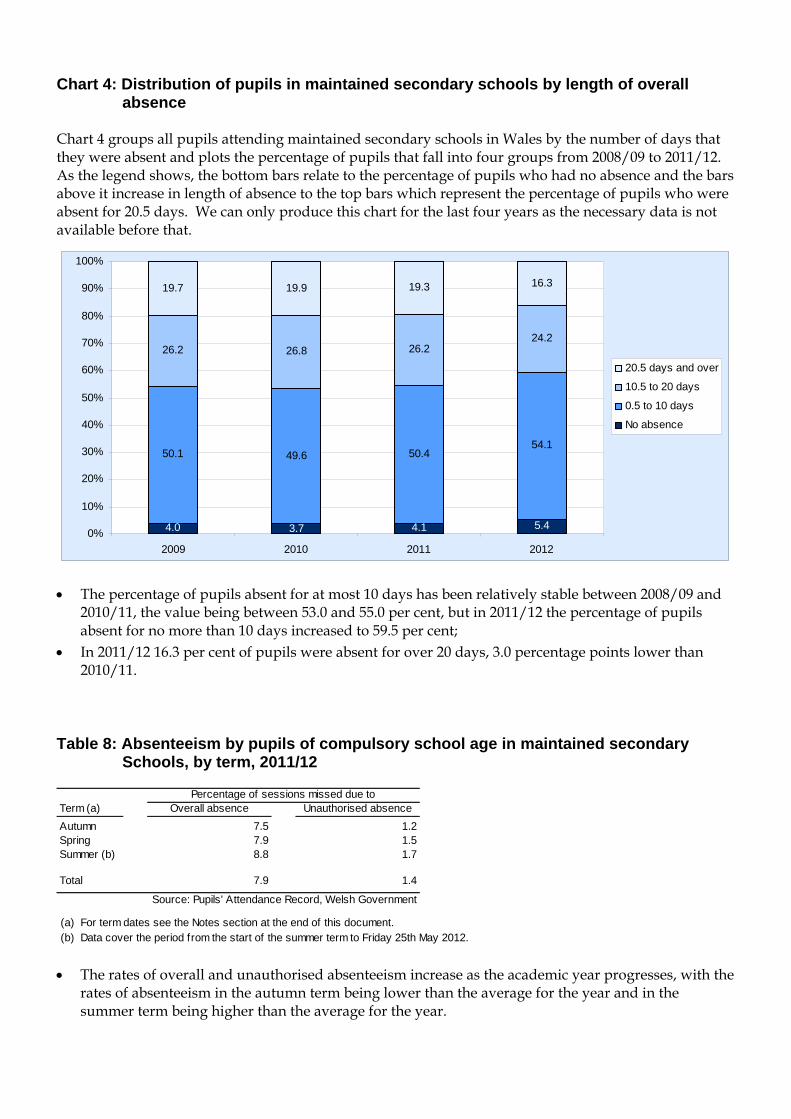
Chart 4: Distribution of pupils in maintained secondary schools by length of overall absence
Chart 4 groups all pupils attending maintained secondary schools in Wales by the number of days that they were absent and plots the percentage of pupils that fall into four groups from 2008/09 to 2011/12. As the legend shows, the bottom bars relate to the percentage of pupils who had no absence and the bars above it increase in length of absence to the top bars which represent the percentage of pupils who were absent for 20.5 days. We can only produce this chart for the last four years as the necessary data is not available before that.
4.0 3.7 4.1 5.4
50.1 49.6 50.454.1
26.2 26.8 26.224.2
19.7 19.9 19.3 16.3
0%
10%
20%
30%
40%
50%
60%
70%
80%
90%
100%
2009 2010 2011 2012
20.5 days and over
10.5 to 20 days
0.5 to 10 days
No absence
• The percentage of pupils absent for at most 10 days has been relatively stable between 2008/09 and
2010/11, the value being between 53.0 and 55.0 per cent, but in 2011/12 the percentage of pupils absent for no more than 10 days increased to 59.5 per cent;
• In 2011/12 16.3 per cent of pupils were absent for over 20 days, 3.0 percentage points lower than 2010/11.
Table 8: Absenteeism by pupils of compulsory school age in maintained secondary Schools, by term, 2011/12
Term (a) Overall absence Unauthorised absenceAutumn 7.5 1.2Spring 7.9 1.5Summer (b) 8.8 1.7
Total 7.9 1.4
Source: Pupils' Attendance Record, Welsh Government
(a) For term dates see the Notes section at the end of this document.(b) Data cover the period from the start of the summer term to Friday 25th May 2012.
Percentage of sessions missed due to
• The rates of overall and unauthorised absenteeism increase as the academic year progresses, with the
rates of absenteeism in the autumn term being lower than the average for the year and in the summer term being higher than the average for the year.
9
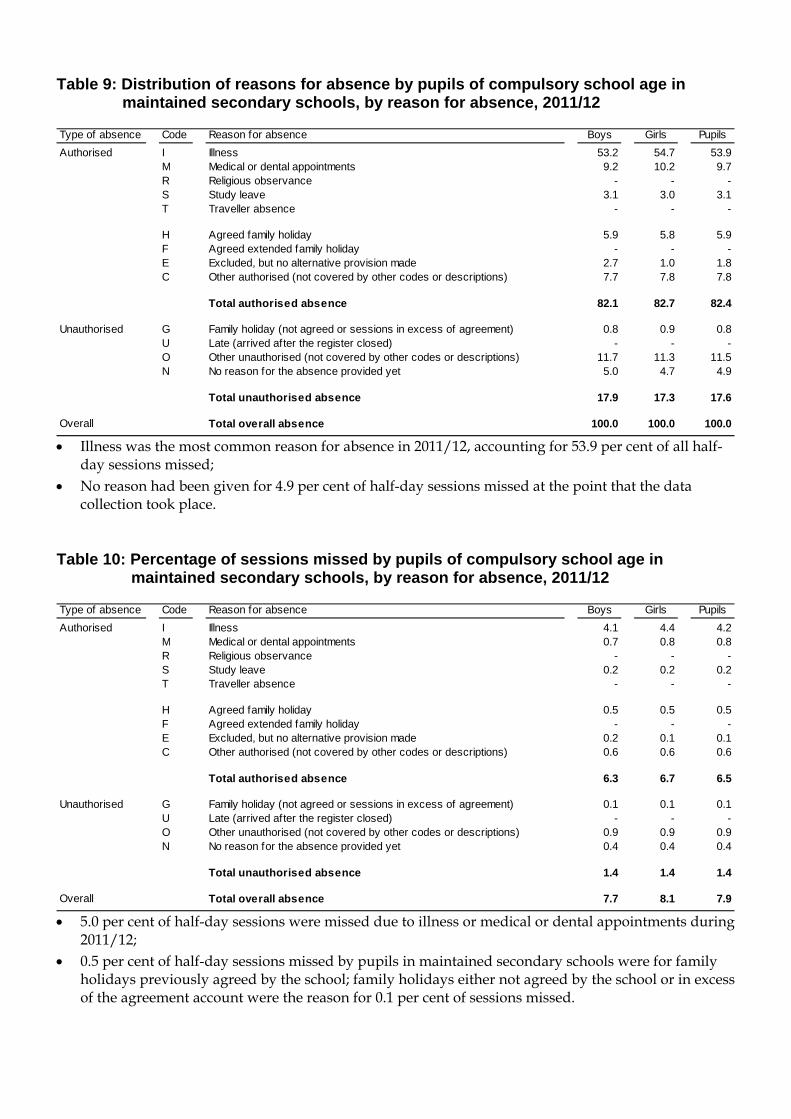
Table 9: Distribution of reasons for absence by pupils of compulsory school age in maintained secondary schools, by reason for absence, 2011/12
Type of absence Code Reason for absence Boys Girls PupilsAuthorised I Illness 53.2 54.7 53.9
M Medical or dental appointments 9.2 10.2 9.7R Religious observance - - -S Study leave 3.1 3.0 3.1T Traveller absence - - -
H Agreed family holiday 5.9 5.8 5.9F Agreed extended family holiday - - -E Excluded, but no alternative provision made 2.7 1.0 1.8C Other authorised (not covered by other codes or descriptions) 7.7 7.8 7.8
Total authorised absence 82.1 82.7 82.4
Unauthorised G Family holiday (not agreed or sessions in excess of agreement) 0.8 0.9 0.8U Late (arrived after the register closed) - - -O Other unauthorised (not covered by other codes or descriptions) 11.7 11.3 11.5N No reason for the absence provided yet 5.0 4.7 4.9
Total unauthorised absence 17.9 17.3 17.6
Overall Total overall absence 100.0 100.0 100.0 • Illness was the most common reason for absence in 2011/12, accounting for 53.9 per cent of all half-
day sessions missed; • No reason had been given for 4.9 per cent of half-day sessions missed at the point that the data
collection took place. Table 10: Percentage of sessions missed by pupils of compulsory school age in maintained secondary schools, by reason for absence, 2011/12
Type of absence Code Reason for absence Boys Girls PupilsAuthorised I Illness 4.1 4.4 4.2
M Medical or dental appointments 0.7 0.8 0.8R Religious observance - - -S Study leave 0.2 0.2 0.2T Traveller absence - - -
H Agreed family holiday 0.5 0.5 0.5F Agreed extended family holiday - - -E Excluded, but no alternative provision made 0.2 0.1 0.1C Other authorised (not covered by other codes or descriptions) 0.6 0.6 0.6
Total authorised absence 6.3 6.7 6.5
Unauthorised G Family holiday (not agreed or sessions in excess of agreement) 0.1 0.1 0.1U Late (arrived after the register closed) - - -O Other unauthorised (not covered by other codes or descriptions) 0.9 0.9 0.9N No reason for the absence provided yet 0.4 0.4 0.4
Total unauthorised absence 1.4 1.4 1.4
Overall Total overall absence 7.7 8.1 7.9 • 5.0 per cent of half-day sessions were missed due to illness or medical or dental appointments during
2011/12; • 0.5 per cent of half-day sessions missed by pupils in maintained secondary schools were for family
holidays previously agreed by the school; family holidays either not agreed by the school or in excess of the agreement account were the reason for 0.1 per cent of sessions missed.
10

The data behind the charts and some of the tables in this release can be found on StatsWales (a free-to-use internet service that allows visitors to view, manipulate, create and download tables and charts). Please select “Schools and Teachers” at the navigation screen of the following site: www.statswales.wales.gov.uk
For further data relating to these tables or attendance data for individual schools please email [email protected].
11
Notes 1 Context 1.1 Policy/Operational All children who are receiving an education at school during the normal school day must be placed on the attendance register. An attendance register records every pupil’s attendance at every session the school is open to pupils and must be called twice a day: at the start of the morning session and once during the afternoon session. The register must show whether each pupil is present, engaged in an approved educational activity off-site (treated as present if they attend that provision), or absent. In addition, where a pupil of compulsory school age is absent, the register must also show whether the absence was authorised or unauthorised.
Improving attendance has been a key Ministerial priority over the past year. The development of an Attendance Analysis Framework and the introduction of School Banding – where attendance forms part of the measure – have both played an important role in raising the profile of attendance in the context of school improvement.
The Attendance Analysis Framework sets out a standardised and robust approach to data analysis. The Framework was developed in consultation with LA data, Education Welfare and school improvement officers and is intended to identify systematic problems in schools and local authorities, and identify ways that these might be addressed.
Using the Framework as a basis an extensive analysis has been carried out on each local authority’s attendance data. The Framework, along with an analysis report which highlighted areas which the Welsh Government felt were weaknesses or strengths were sent to each local authority. Welsh Government officials then met with each authority to discuss the findings.
1.2 Related Publications A similar release relating to absenteeism from maintained primary, special and independent schools in Wales during the 2010/11 academic year entitled ‘Absenteeism from Primary Schools, 2010/11’ was released on 14 December 2011 and can be found here: http://wales.gov.uk/topics/statistics/theme/schools/?lang=en
England publish absenteeism data for primary and secondary schools in the statistical release entitled ‘Pupil Absence in Schools in England, Including Pupil Characteristics’. The latest available statistics can be found here: http://www.education.gov.uk/rsgateway/DB/SFR/index.shtml
Scotland publish absenteeism data for primary and secondary schools in supplementary dataset tables. The latest available statistics can be found on their website: http://www.scotland.gov.uk/Topics/Statistics/Browse/School-Education/AttendanceAbsenceDatasets
Northern Ireland publish primary and post-primary (secondary) school absenteeism data and their latest statistics can be found here: http://www.deni.gov.uk/index/32-statisticsandresearch_pg/32-statistics_and_research_statistics_on_education_pg/32_statistics_and_research_-_statistics_on_education-pupil_attendance.htm
12
2 Data Source The Pupils’ Attendance Record is made up of pupil-level attendance data collected electronically from maintained schools, care of their local authority (LA), and school-level attendance data from special and independent schools collected via a voluntary, paper-based survey. Both collections are carried out by the Statistical Directorate within the Welsh Government. 3 Definitions 3.1 Coverage The absenteeism information in this Statistical First Release relates to the percentage of half-day sessions missed by pupils due to unauthorised and overall absence from the start of the academic year to 25 May 2012. Pupils of compulsory school age (5-15) registered at maintained secondary schools and pupils aged 11-15 registered at special and independent schools are included in the data (ages as on 31st August before the start of the academic year). Attendance data were received from 305 schools with pupils within these age groups in the 2011/12 academic year.
The free school meal data are collected through the January Pupil Level Annual Schools Census (PLASC) and is based on a 3-year average. Where schools have merged, the 3-year average for the new school includes free school meal data for the previous schools for the year or years that they were open prior to merging. 3.2 Types of Absence All (or ‘overall’) absences comprise those which are authorised and unauthorised:
• an authorised absence is an absence with permission from a teacher or other authorised representative of the school. This includes instances of absence for which a satisfactory explanation has been provided (e.g. illness, family bereavement or religious observance);
• an unauthorised absence is an absence without permission from a teacher or other authorised representative of the school. This includes all unexplained or unjustified absences.
Note that pupils undertaking approved and supervised educational activities conducted away from the school (e.g. work experience or educational visits) are deemed to be present at the school. 3.3 Term dates Attendance and absence data were collected on the days that schools were open to pupils between the following dates:
• Autumn term – from 1 September 2011 to 25 December 2011; • Spring term – from 26 December 2011 to 8 April 2012; • Summer term – from 9 April 2012 to 25 May 2012.
13

4 Key Quality Information This section provides a summary of information on this output against five dimensions of quality: Relevance, Accuracy, Timeliness and Punctuality, Accessibility and Clarity, and Comparability. Between September and November 2010 we conducted a public consultation on our Education Statistics outputs in which we asked for feedback on the quality of the outputs. A summary of the responses has been published and is available here: http://wales.gov.uk/consultations/statistics/education/?lang=en 4.1 Relevance The statistics are used both within and outside the Welsh Government to monitor educational trends and as a baseline for further analysis of the underlying data. Some of the key users are:
• Ministers and the Members Research Service in the National Assembly for Wales; • The Department for Education in England; • other government departments; • Local Authorities and schools; • ESTYN, Her Majesty’s Inspectorate of Education and Training in Wales; • Wales Audit Office; • The Department for Education and Skills in the Welsh Government; • other areas of the Welsh Government; • the research community; • students, academics and universities; • individual citizens and private companies and the media.
These statistics are used in a variety of ways. Some examples of these are:
• advice to Ministers; • the all-Wales education core data packs (the replacement for the National Pupil Database); • LA and school comparisons and benchmarks; • to inform the education policy decision-making process in Wales; • development of a national banding system for Wales; • to inform ESTYN during school inspections; • contributes to the National Performance Indicators; • international benchmarking; • the education domain of the Welsh Index of Multiple Deprivation; • to assist in research in educational attainment.
4.2 Accuracy The Welsh Government works closely with schools and local authorities in order to ensure all data are validated before tables are published. Data are collated into an electronic return and submitted to the Welsh Government through DEWi, a secure online data transfer system developed by the Welsh Government. Various stages of automated validation and sense-checking are built into the process to ensure a high quality of data.
During the 2009/10 academic year extreme weather conditions forced a large number of schools to close to protect the welfare of their students. Some schools were able to remain open for pupils who could safely attend. Those who were unable to attend on these days were recorded as having authorised absence, thereby inflating the schools’ overall absence percentages. Since not all schools had partial closures due to the inclement weather, and those that did close for a varying number of days and had a varying percentage of pupils absent, the scale of the effect of these partial closures on local authorities’ absence rates could not be measured.
A new statistical category ‘Not required to attend’ was introduced to the Welsh Government’s attendance data collection in 2010/11. Half-day sessions are recorded in this category in situations when
14
individual pupils’ attendance is not possible but the school remains open, such as when pupils are not able to safely attend school, and will not be counted towards the total number of sessions that they could attend in a year. This means that extreme weather conditions no longer adversely affect either schools’ or local authorities’ attendance percentages. 4.3 Timeliness and Punctuality DEWi was available for uploading files on 28 May 2012, with maintained secondary schools asked to submit attendance data for every pupil aged between 5 and 15 on roll at the school between the start of the academic year and 25 May 2012. Schools and local authorities were then asked to validate their data within a validation period, which, because of difficulties that arose due to the inclusion of term- and code-level attendance data for the first time, was extended to 20 July 2012. Special and independent schools were asked to submit attendance data for pupils aged between 11 and 15 on roll between the start of the academic year and 25 May 2012 by 22 June 2012 and were then sent a summary of their school’s data for validation and verification.
Because of the necessary extension to the validation period the release of this statistical first release was moved back by three weeks to ensure that the data were of satisfactory quality by the time of publication. 4.4 Accessibility and Clarity This Statistical First Release is pre-announced and then published on the Statistics section of the Welsh Government website. It is accompanied by more detailed tables on StatsWales, a free to use service that allows visitors to view, manipulate, create and download data. 4.5 Comparability Pupil-level absence data was collected from maintained secondary schools for the first time in 2007/08. However, the definitions and calculations involved in the collection have not changed, so comparability over time has not been affected.
Since 1999/2000 secondary schools have been asked to provide, on a voluntary basis, their attendance information broken down by gender. In 2007/08 it became compulsory for maintained secondary schools to provide gender information whilst remaining voluntary for special and independent schools. 304 schools (98%) supplied gender data in 2010/11, compared to 311 schools (97%) of schools in 2009/10. It is not advisable to compare year on year changes prior to 2007/08 in absenteeism by gender as different schools responded each year.
Due to the effect that partial closures of schools due to extreme weather conditions during the 2009/10 academic year had on schools’ attendance rates caution should be used when comparing year-on-year changes.
15