scrs assessments of western atlantic bluefin tuna clay e. porch southeast fisheries science center...
TRANSCRIPT
SCRS Assessments of Western Atlantic Bluefin Tuna
Clay E. PorchSoutheast Fisheries Science Center
U.S. National Marine Fisheries Service

OUTLINE
•DATA
•METHODS
•ASSESSMENTS
•PROJECTIONS
•RESULTS OF 2006 ASSESSMENT
•KEY SOURCES OF UNCERTAINTY
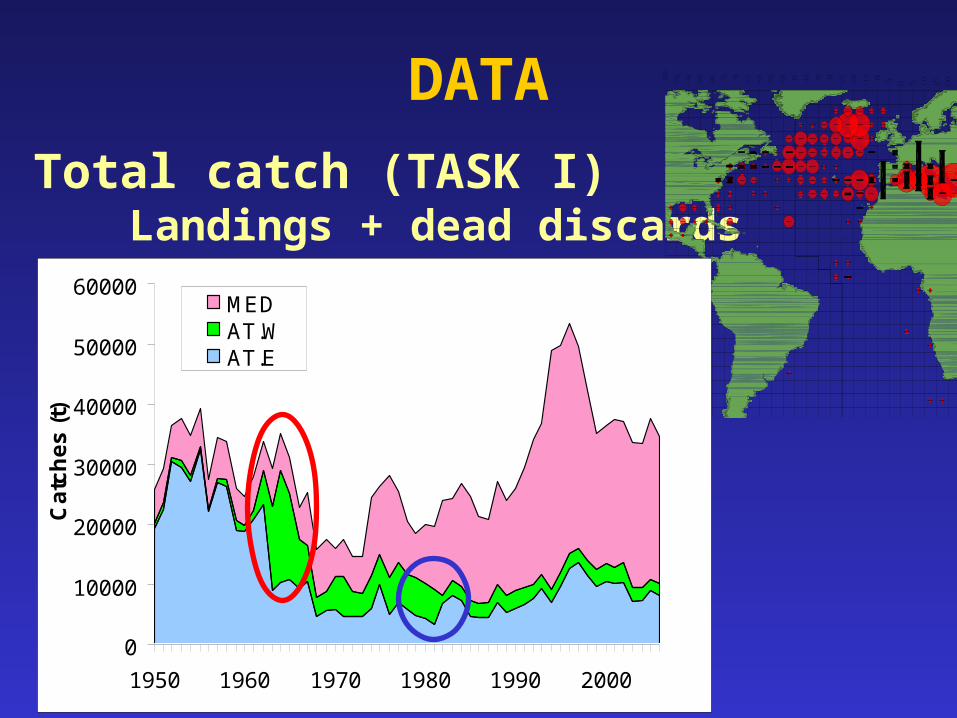
DATA
Total catch (TASK I)Landings + dead discards
0
10000
20000
30000
40000
50000
60000
1950 1960 1970 1980 1990 2000
Ca
tch
es
(t)
MEDAT.WAT.E
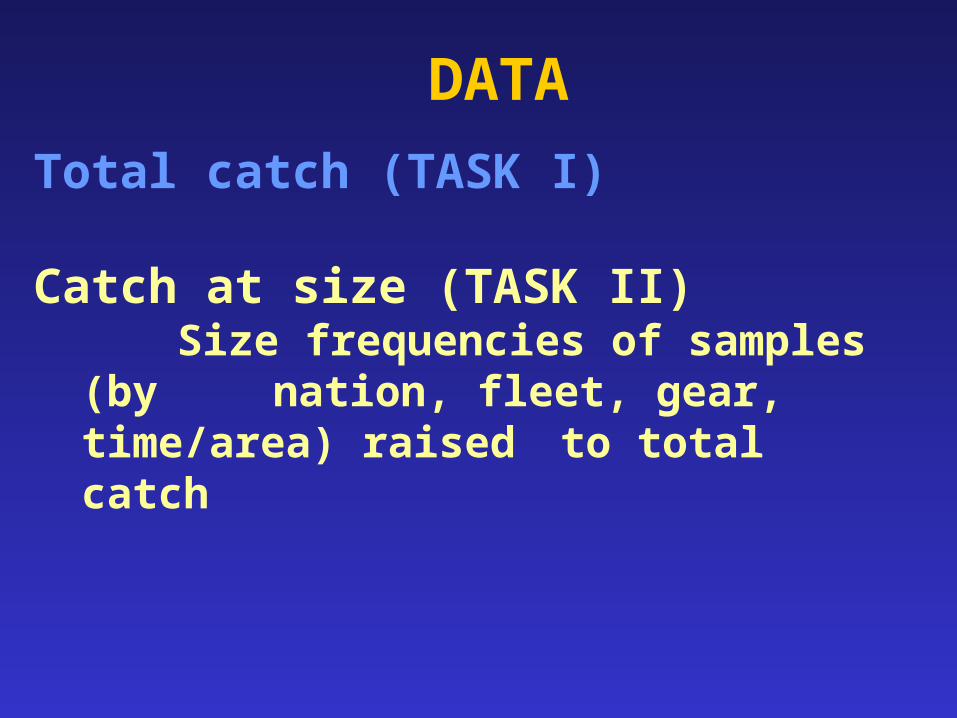
DATA
Total catch (TASK I)
Catch at size (TASK II)Size frequencies of samples
(by nation, fleet, gear, time/area) raised to total catch
ATW LL
0
10
20
30
40
50
60
70
80
90
100
1980
1981
1982
1983
1984
1985
1986
1987
1988
1989
1990
1991
1992
1993
1994
1995
1996
1997
1998
1999
2000
2001
2002
2003
2004
Year
%
ATW oth
0
10
20
30
40
50
60
70
80
90
100
1980
1981
1982
1983
1984
1985
1986
1987
1988
1989
1990
1991
1992
1993
1994
1995
1996
1997
1998
1999
2000
2001
2002
2003
2004
Year
%
ATW PS
0
10
20
30
40
50
60
70
80
90
100
1980
1981
1982
1983
1984
1985
1986
1987
1988
1989
1990
1991
1992
1993
1994
1995
1996
1997
1998
1999
2000
2001
2002
2003
2004
Year
%
ATW LL
0
5,000
10,000
15,000
20,000
25,000
30,000
35,000
40,000
1980
1982
1984
1986
1988
1990
1992
1994
1996
1998
2000
2002
2004
Year
Fis
h in
CA
S
ATW oth
0
5,000
10,000
15,000
20,000
25,000
30,000
35,000
40,000
1980
1982
1984
1986
1988
1990
1992
1994
1996
1998
2000
2002
2004
Year
Fis
h in
CA
S
ATW PS
0
5,000
10,000
15,000
20,000
25,000
30,000
35,000
1980
1982
1984
1986
1988
1990
1992
1994
1996
1998
2000
2002
2004
Year
Fis
h in
CA
S
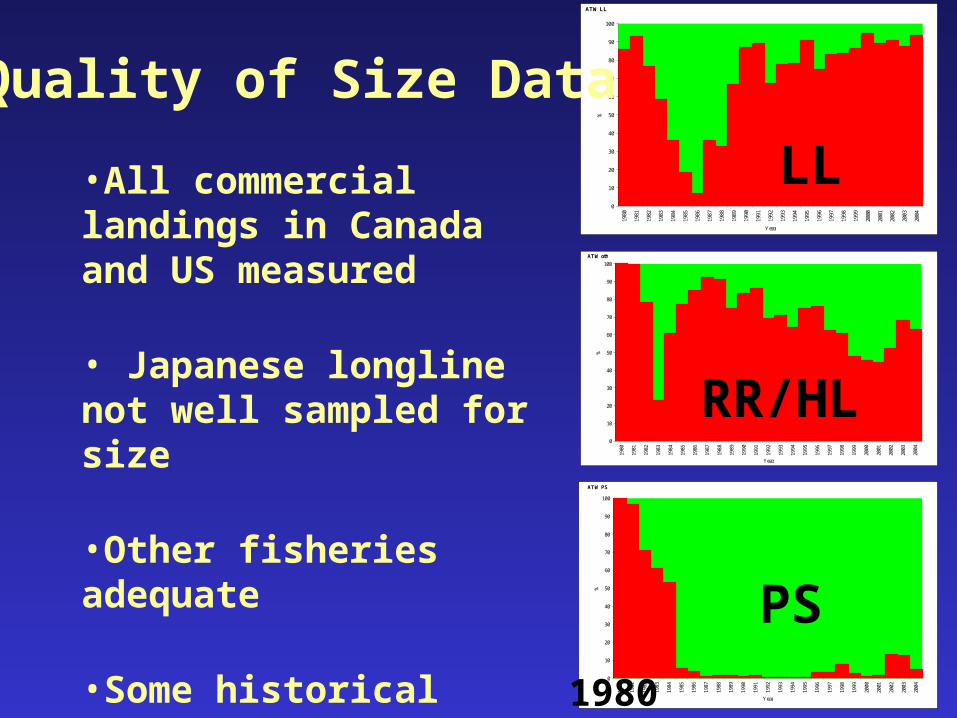
Quality of Size Data
LL
RR/HL
PS
•All commercial landings in Canada and US measured
• Japanese longline not well sampled for size
•Other fisheries adequate
•Some historical gaps (substitutions!)
1980
DATA
Total catch (TASK I)
Catch at size (TASK II)
Indices of abundance (GLM)Larval surveyCanada TL (SWNS, GSL)
10+US RR (NE US, various sizes)
1-10+Japan LL (GOM, Area 2) 2-
10+US LL (GOM)
10+
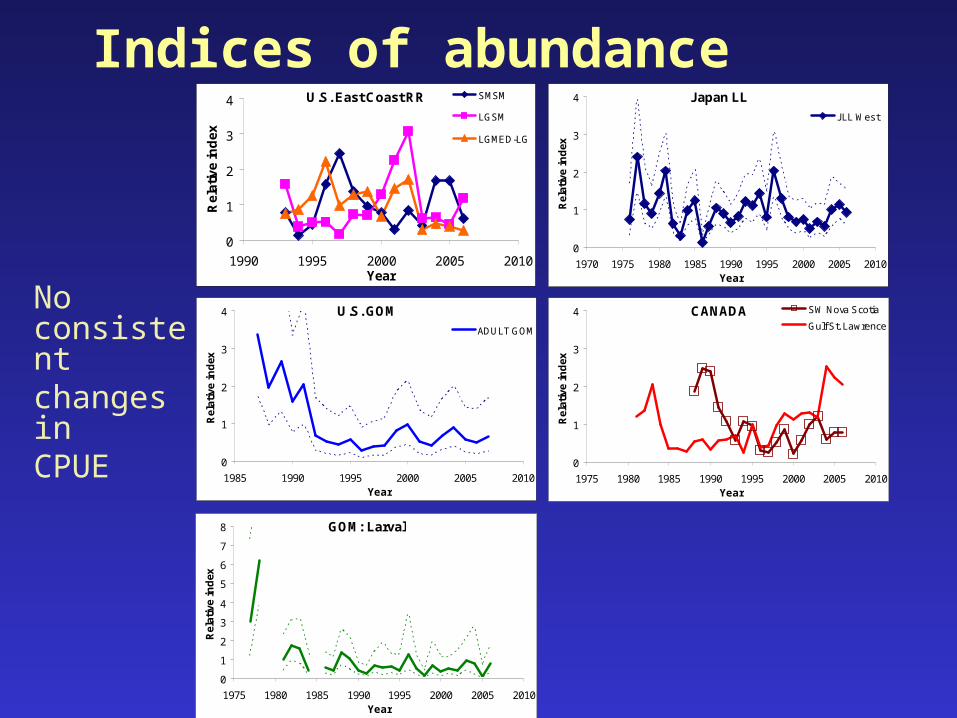
Indices of abundance
No consistent changes inCPUE
U.S. East Coast RR
0
1
2
3
4
1990 1995 2000 2005 2010Year
Rel
ativ
e in
dex
SMSM
LGSM
LGMED-LG
U.S. GOM
0
1
2
3
4
1985 1990 1995 2000 2005 2010Year
Rel
ativ
e in
dex
ADULT GOM
Japan LL
0
1
2
3
4
1970 1975 1980 1985 1990 1995 2000 2005 2010Year
Rel
ativ
e in
dex
JLL West
CANADA
0
1
2
3
4
1975 1980 1985 1990 1995 2000 2005 2010Year
Rel
ativ
e in
dex
SW Nova Scotia
Gulf St. Lawrence
GOM: Larval
0
1
2
3
4
5
6
7
8
1975 1980 1985 1990 1995 2000 2005 2010Year
Rel
ativ
e in
dex
DATA
Total catch (TASK I)
Catch at size (TASK II)
Indices of abundance (GLM)
TaggingConventional Electronic?
METHODS
Converting Catch at size (CAS) to Catch at age (CAA)
•Age data from reading hard parts rare, but size data are more plentiful
•Method of choice has been age slicing
(assigns range of lengths to specific age classes)

Age-slicing (program AGEIT)
1.Assumes growth curve knownconsistently assign too young or old
2.Assumes equal overlap in lengths of adjacent age classes
• smears year classes (smooths CAA)
• difficult to age older fish (plus groups)
3.AlternativesAge-length keys, Multifan
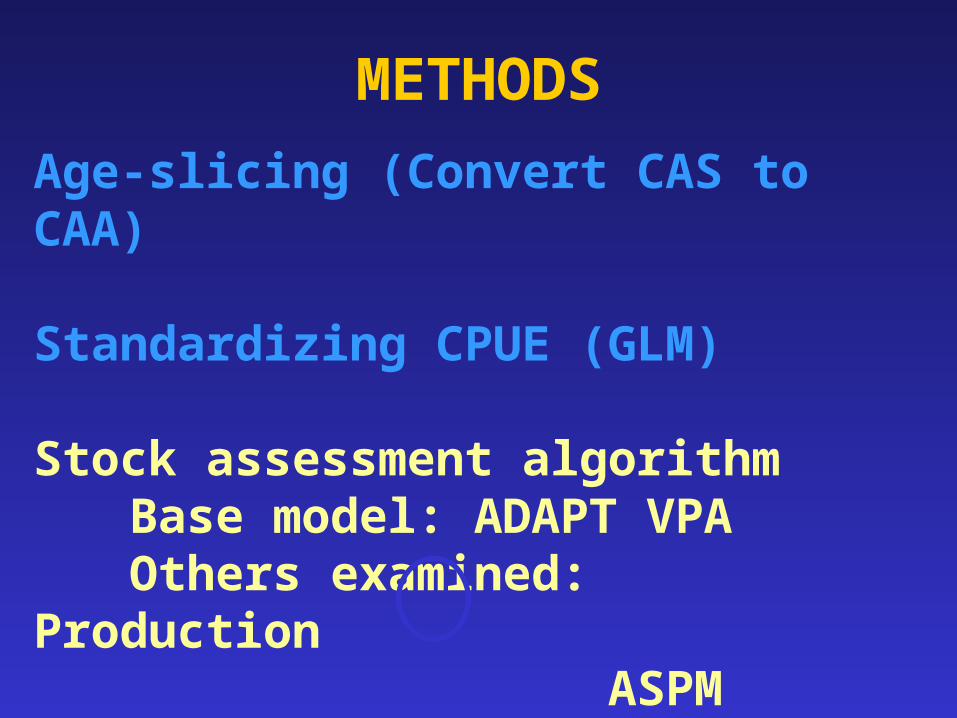
METHODS
Age-slicing (Convert CAS to CAA)
Standardizing CPUE (GLM)
Stock assessment algorithmBase model: ADAPT VPA Others examined:
ProductionASPMSCA
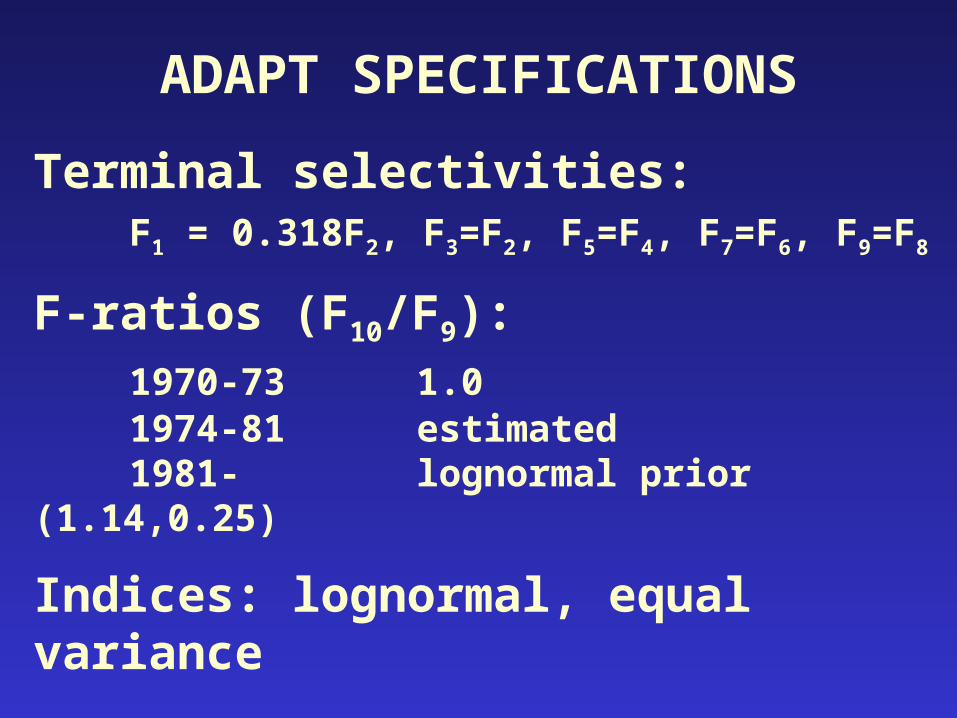
ADAPT SPECIFICATIONS
Terminal selectivities: F1 = 0.318F2, F3=F2, F5=F4, F7=F6, F9=F8
F-ratios (F10/F9):1970-73 1.0 1974-81 estimated1981- lognormal prior
(1.14,0.25)
Indices: lognormal, equal variance
Natural mortality: constant at 0.14
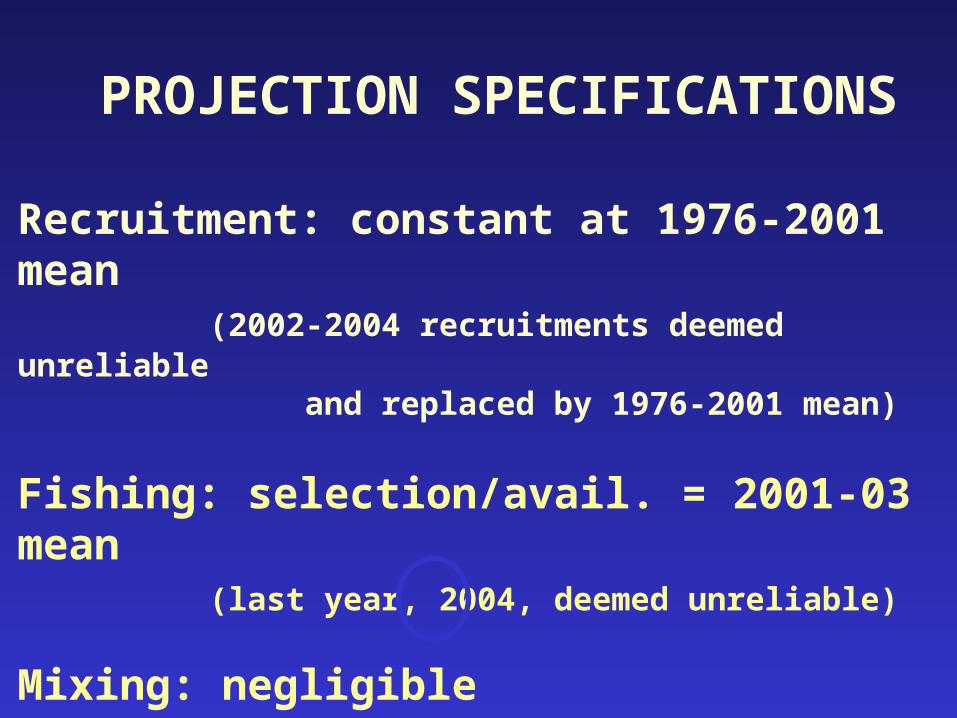
PROJECTION SPECIFICATIONS
Recruitment: constant at 1976-2001 mean
(2002-2004 recruitments deemed unreliable
and replaced by 1976-2001 mean)
Fishing: selection/avail. = 2001-03 mean
(last year, 2004, deemed unreliable)
Mixing: negligible

0
100000
200000
300000
400000
500000
600000
1960 1970 1980 1990 2000 2010
Rec
ruit
s
2002 SA
2006 Base
0
10000
20000
30000
40000
50000
60000
1970 1980 1990 2000 2010
SS
B
2002 SA
2006 Base
0
0.1
0.2
0.3
0.4
0.5
1970 1980 1990 2000 2010
Fis
hin
g m
ort
alit
y 8+
2002 SA
2006 Base
Consistent with 2002 SA Less optimistic estimates of 1994 and 1997 year classes
More optimistic view
of recent F’s
RESULTS OF 2006 ASSESSMENT
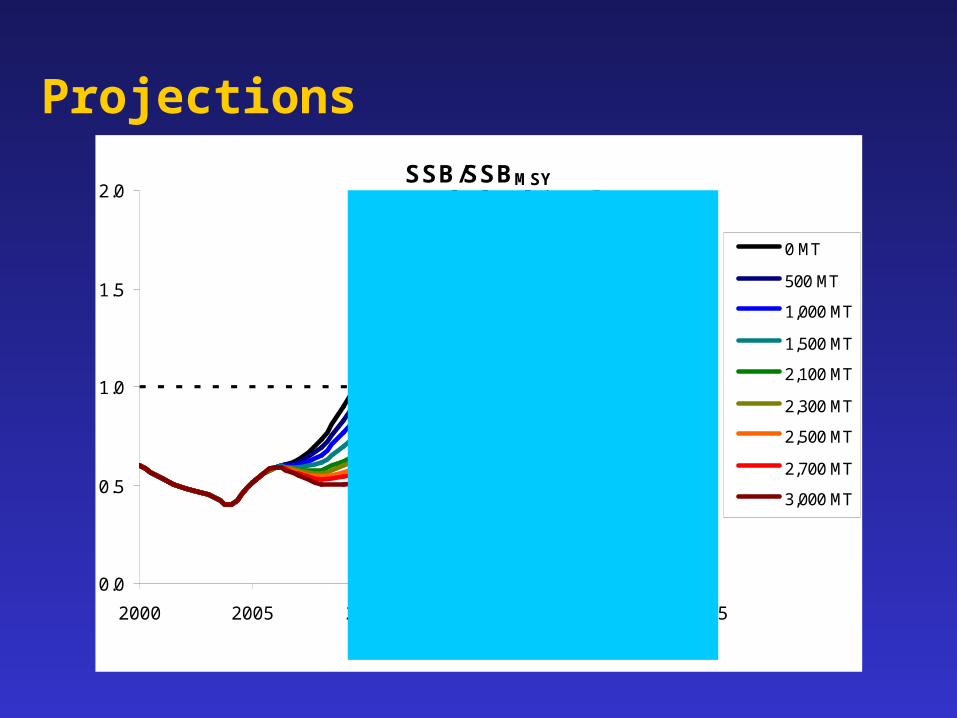
Projections
SSB/SSBMSY
0.0
0.5
1.0
1.5
2.0
2000 2005 2010 2015 2020 2025
Year
0 MT
500 MT
1,000 MT
1,500 MT
2,100 MT
2,300 MT
2,500 MT
2,700 MT
3,000 MT
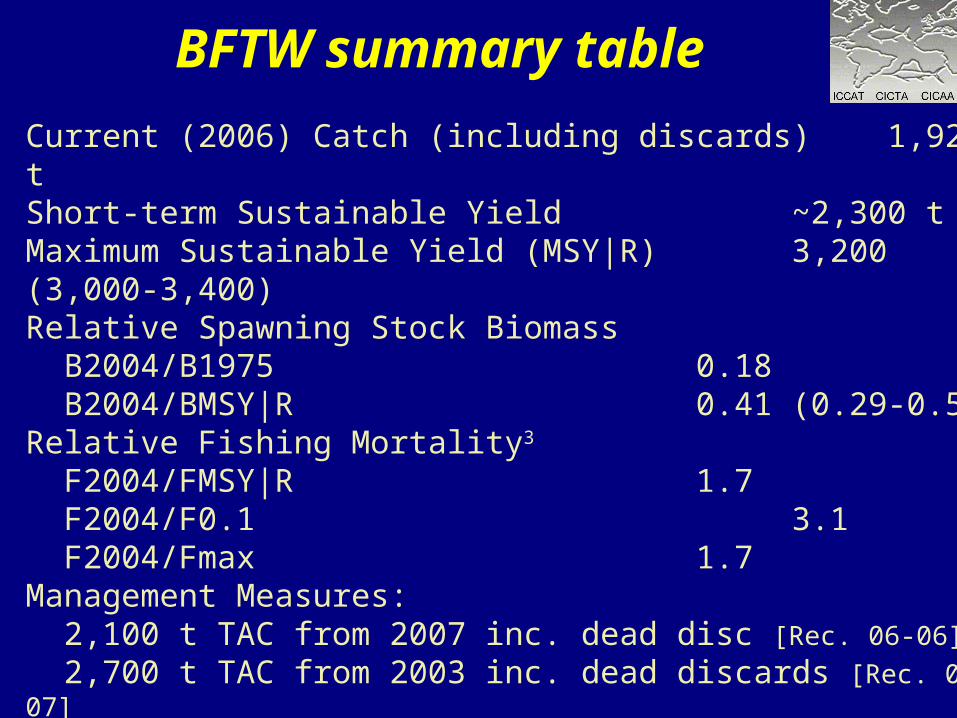
Current (2006) Catch (including discards) 1,929 tShort-term Sustainable Yield ~2,300 tMaximum Sustainable Yield (MSY|R) 3,200 (3,000-3,400)Relative Spawning Stock Biomass B2004/B1975 0.18 B2004/BMSY|R 0.41 (0.29-0.54)Relative Fishing Mortality3
F2004/FMSY|R 1.7 F2004/F0.1 3.1 F2004/Fmax 1.7Management Measures: 2,100 t TAC from 2007 inc. dead disc [Rec. 06-06] 2,700 t TAC from 2003 inc. dead discards [Rec. 02-07] 30 kg (115 cm FL) min. size with 8% tol. [Rec. 98-07] No directed fisheries in Gulf of Mexico [Rec. 98-07]
F2004 is taken to be the geometric mean of the estimates for 2001-2003
BFTW summary table

State of stock: low U.S. catches
• Plausible explanations(1) that availability of fish to the United States fishery was low(2) the overall size of population in the west declined substantially
• Evidence (SCRS/2007/171)(1) Canada and Japan did not have abnormally low catches
CPUE series from Gulf of St. Lawrence at high levels since 2004 CPUE series from GOM do not show consistent decline
(2) some abundance indices suggest decline declining size composition in some areas small changes in F suggested by tag data despite declining catches
• Conclusion(1) No strong evidence to favor either explanation over the other(2) However, the failure of a fishery to take half of its TAC for several
years, and other new evidence reviewed by the committee, heightened concern that the estimate of stock status from the 2006 assessment may be optimistic
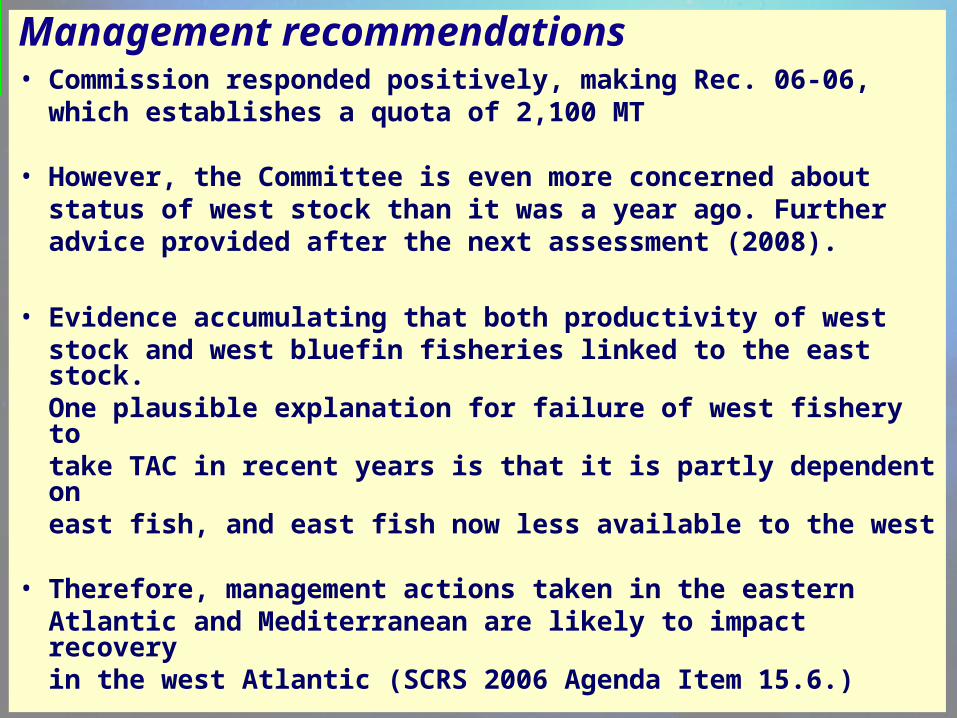
Management recommendations
• Commission responded positively, making Rec. 06-06, which establishes a quota of 2,100 MT
• However, the Committee is even more concerned about status of west stock than it was a year ago. Further advice provided after the next assessment (2008).
• Evidence accumulating that both productivity of west stock and west bluefin fisheries linked to the east stock. One plausible explanation for failure of west fishery totake TAC in recent years is that it is partly dependent on
east fish, and east fish now less available to the west • Therefore, management actions taken in the eastern
Atlantic and Mediterranean are likely to impact recovery in the west Atlantic (SCRS 2006 Agenda Item 15.6.)

BFT Statement of work
Data Submission:“It is essential, in particular,
that catch, catch-at-age and tagging data through 2006 be final a few months prior to the meeting to allow preparatory works andanalyses.
Data through 2006 end March 2008Data for 2007 1 week prior
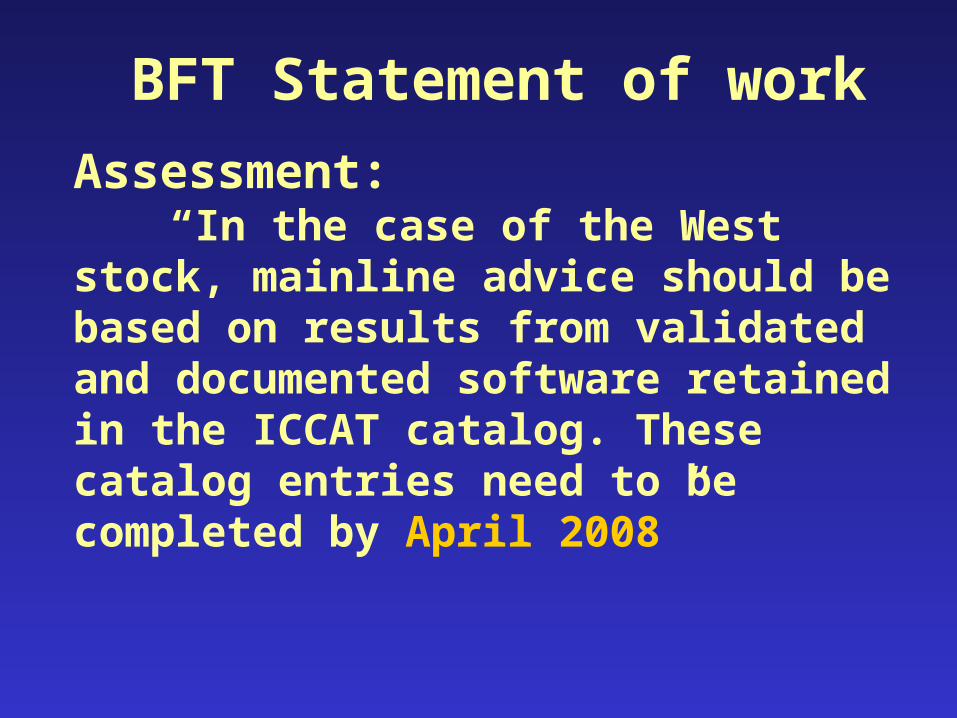
BFT Statement of work
Assessment:“In the case of the West stock,
mainline advice should be based on results from validated and documented software retained in the ICCAT catalog. These catalog entries need to be completed by April 2008”
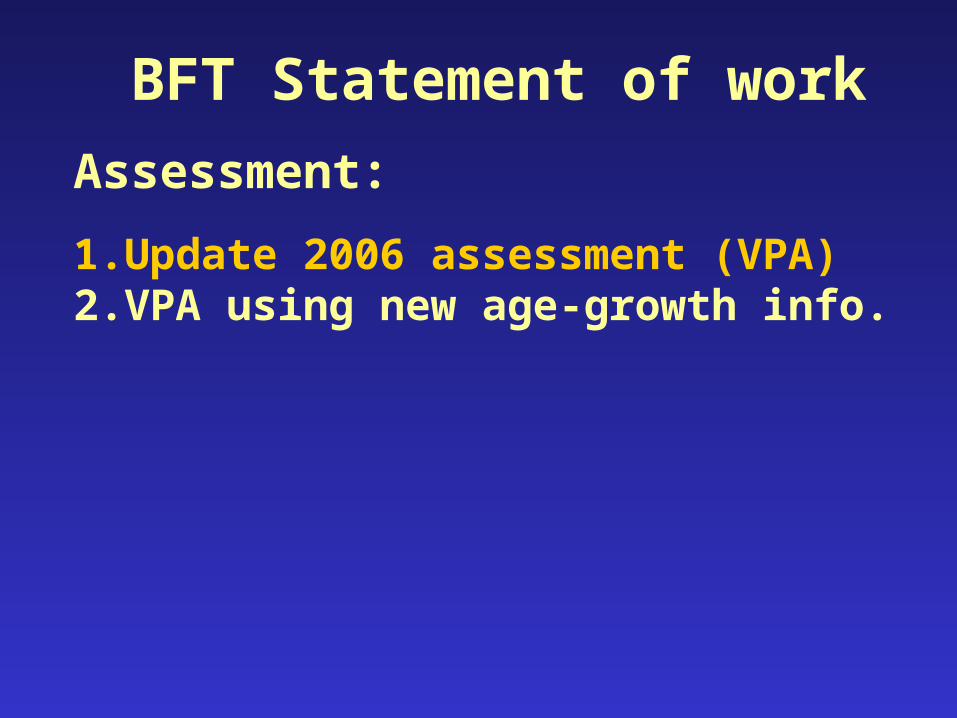
BFT Statement of work
Assessment:
1.Update 2006 assessment (VPA)2.VPA using new age-growth info.

0
50
100
150
200
250
300
350
400
0 5 10 15 20 25 30 35
Age
Len
gth
(F
L, cm
)
Predicted (Turner and Restrepo)
SC Age
Predicted (Neilson and Campana)
West Atlantic Otolith Readings by S. Campana Shown in Comparison With theTurner and Restrepo (1994) Growth Curve

BFT Statement of work
Assessment:
1.Update 2006 assessment (VPA)2.VPA using new age-growth info.3.VPA using new reproductive
info.
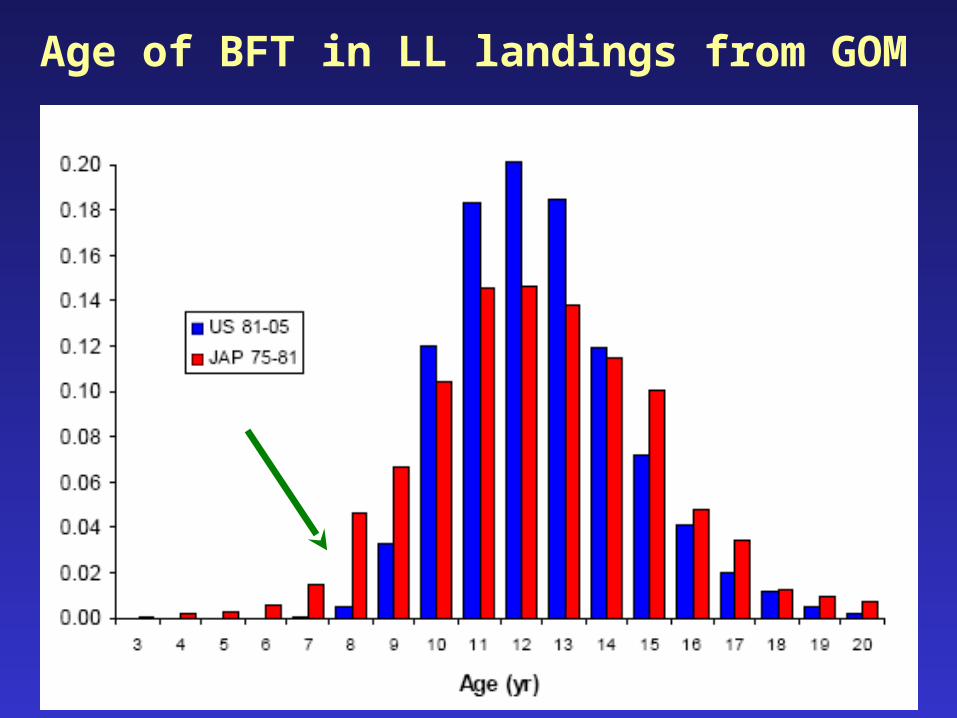
Age of BFT in LL landings from GOM
BFT Statement of work
Assessment:
1.Update 2006 assessment (VPA)2.VPA using new age-growth info.3.VPA using new reproductive
info.4.VPA with mixing
• Using conventional tag data• Using electronic tagging data• Using results from otolith
comp.
BFT Statement of work
Assessment:
1.Update 2006 assessment (VPA)2.VPA using new age-growth info.3.VPA using new reproductive
info.4.VPA with mixing
• Using conventional tag data• Using electronic tagging data• Using results from otolith
comp.5.Alternative models
Multi-area tag-recapture
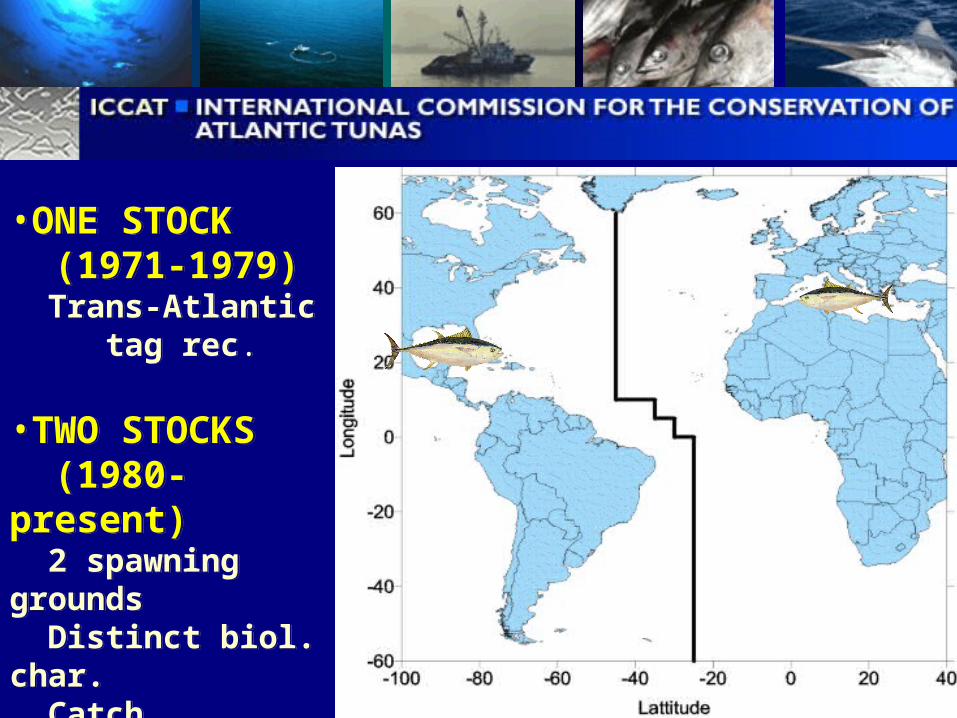
•ONE STOCK (1971-1979) Trans-Atlantic
tag rec.
•TWO STOCKS (1980-present) 2 spawning grounds Distinct biol. char. Catch distribution Small interchange
•ONE STOCK (1971-1979) Trans-Atlantic
tag rec.
•TWO STOCKS (1980-present) 2 spawning grounds Distinct biol. char. Catch distribution Small interchange
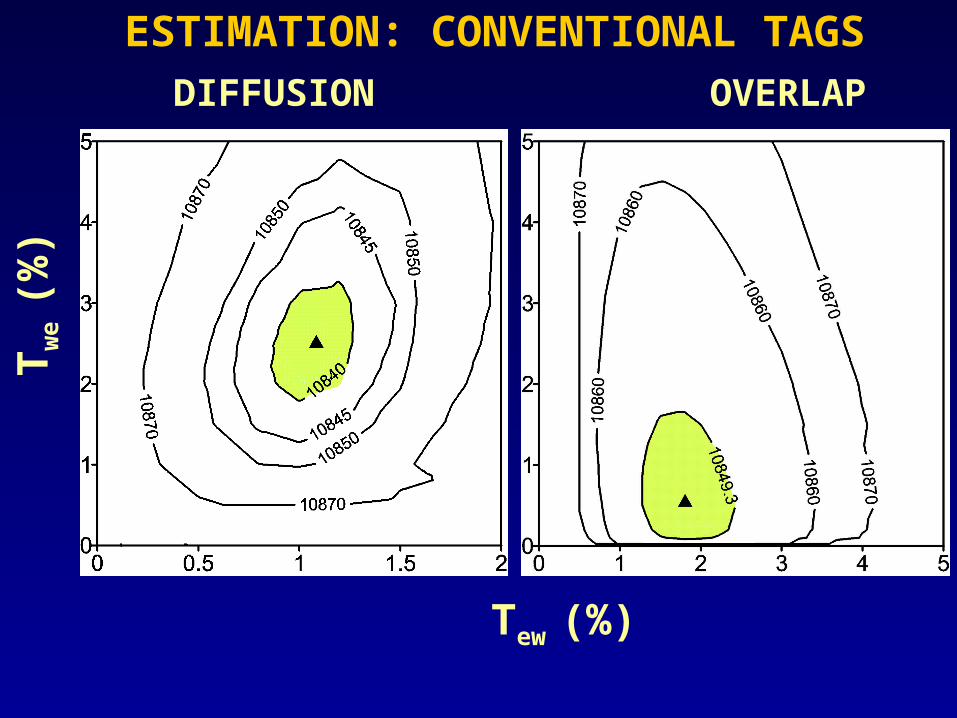
ESTIMATION: CONVENTIONAL TAGS
Tew (%)
Tw
e (%
)DIFFUSION OVERLAP
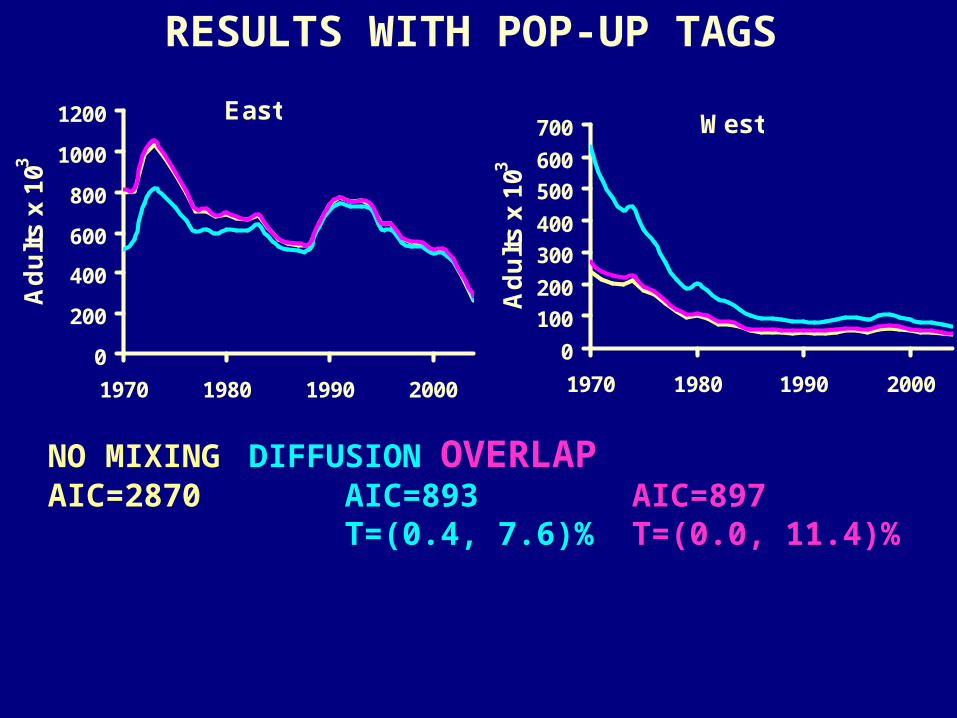
NO MIXING DIFFUSION OVERLAP AIC=2870 AIC=893 AIC=897
T=(0.4, 7.6)% T=(0.0, 11.4)%
RESULTS WITH POP-UP TAGS
East
0
200
400
600
800
1000
1200
1970 1980 1990 2000
Ad
ult
s x
103
West
0
100
200
300
400
500
600
700
1970 1980 1990 2000
Ad
ult
s x
103
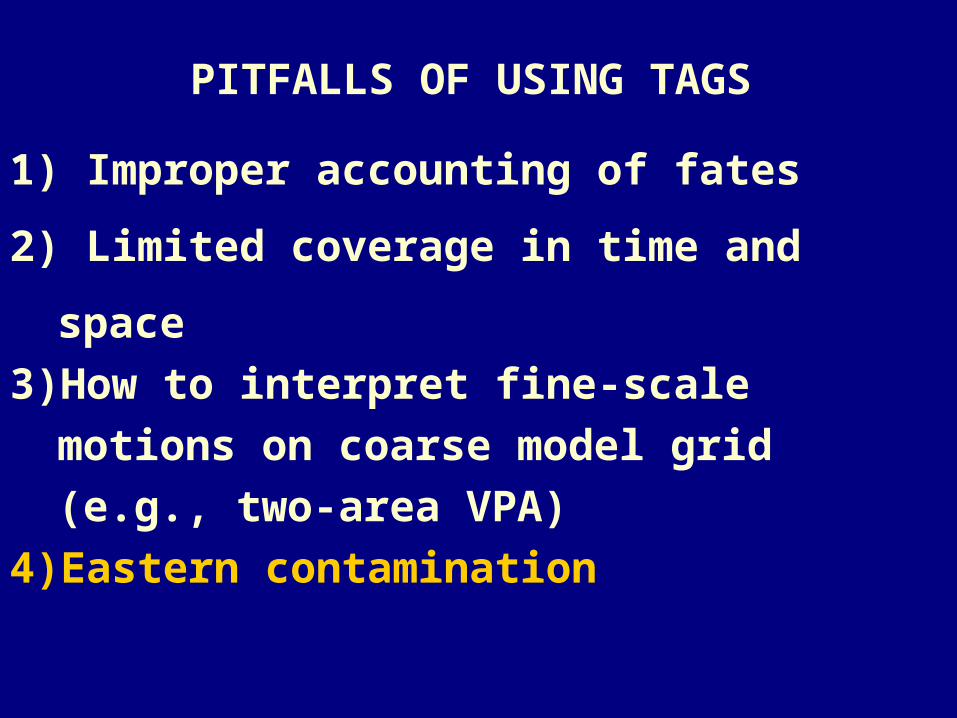
1) Improper accounting of fates
2) Limited coverage in time and space3)How to interpret fine-scale motions
on coarse model grid (e.g., two-area VPA)
4)Eastern contamination
PITFALLS OF USING TAGS
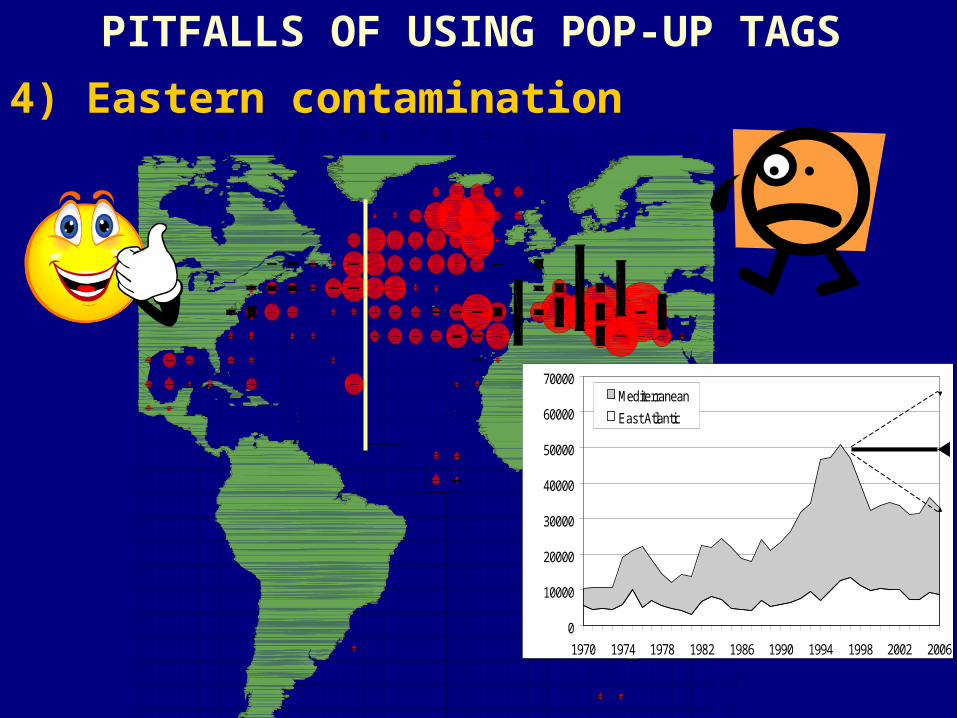
4) Eastern contamination
PITFALLS OF USING POP-UP TAGS
0
10000
20000
30000
40000
50000
60000
70000
1970 1974 1978 1982 1986 1990 1994 1998 2002 2006
Mediterranean
East Atlantic

Otolith microconstituent
analysis
L = nsy pasy log pasy
Assuming samples taken at
randon from catch
WHAT ELSE?
^
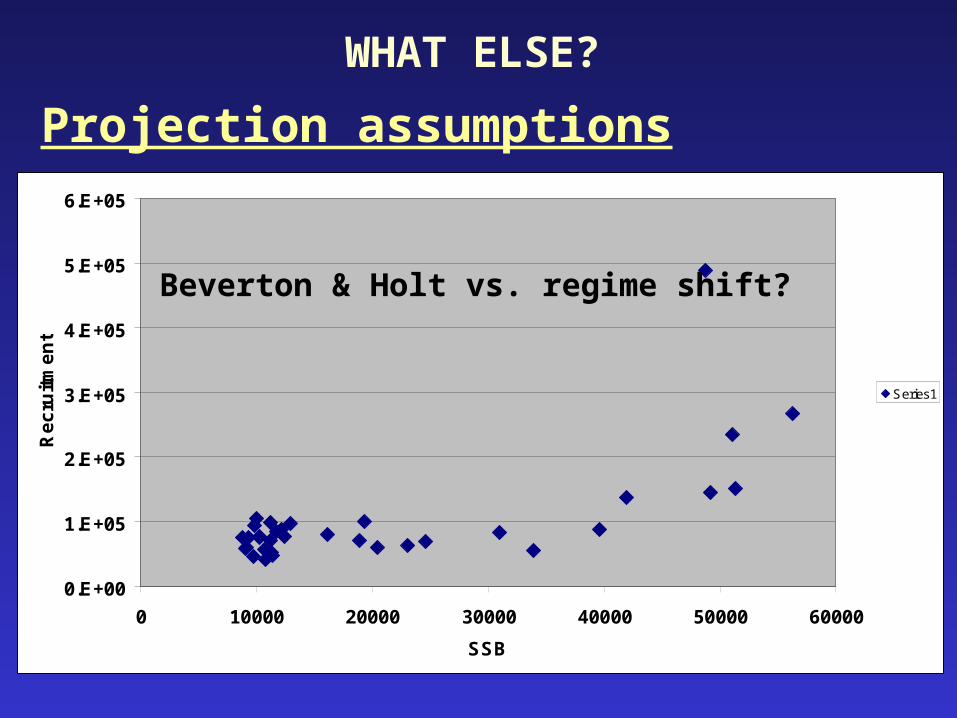
Projection assumptions
WHAT ELSE?
0.E+00
1.E+05
2.E+05
3.E+05
4.E+05
5.E+05
6.E+05
0 10000 20000 30000 40000 50000 60000
SSB
Re
cru
itm
en
t
Series1
Beverton & Holt vs. regime shift?

Photo acknowledgmentsBarbara BlockMolly LutcavageEric PrinceNOAA Photo Gallery
Photo acknowledgmentsBarbara BlockMolly LutcavageEric PrinceNOAA Photo Gallery
QUESTIONS?