screening of fungi for soil remediation potential
TRANSCRIPT

Screening of Fungifor Soil Remediation Potential
RICHARD T. LAMAR
EarthFax Development Corporation Logan, Utah
LAURA M. MAIN AND DIANE M. DIETRICH
Institute for Microbial and Biochemical Technology USDA-Forest Service Madison, Wisconsin
JOHN A. GLASER
U.S. Environmental Protection Agency Cincinnati, Ohio
17-1 INTRODUCTION
Successful application of bioremediation for treating xenobiotic-contaminated soils requires the identification and implementation of physiochemical and/or nutritional conditions that favor optimum growth and xenobioticdegrading activities of indigenous (biostimulation) or inoculated (bioaugmentation) xenobiotic-degrading microbes. Biostimulation involves the selection of microbes based primarily on their xenobiotic-degrading abilities. In addition to selecting organisms with superior pollutant-degrading abilities. the bioaugmentation approach allows for selection of microbes based on additional physiological, biochemical, or ecological characteristics that may confer to them, exceptional bioremediation performance. These include attributes such as superior growth rates, competitive ecological strategies and tolerances to high contaminant concentrations, specific nutritional capabilities, and pH or temperature growth optima that could be exploited to obtain dominant colonization and ultimately remediation of a contaminated soil volume by the inoculated organism.
Extensive laboratory study of a group of wood decay basidiomycetes, collectively called white-rot fungi, has demonstrated their ability to degrade a wide variety of contaminants. This ability makes these organisms attractive for
Copyright © 1999 American Society of Agronomy, Crop Science Society of America. Soil Science Society of America, 677 S. Segoe Rd., Madison, WI 53711. USA. Bioremediation of Contaminated Soils, Agronomy Monograph no. 37.

438 LAMAR ET AL.
use in the remediation of contaminated soils, particularly soils that are contaminated with complex mixtures of hazardous chemicals. The potential use of these organisms for soil remediation using the bioaugmentation approach has been demonstrated in a number of field studies in which the fungal treatment of pentachlorophenol (PCP)-contaminated soils (Lamar & Dietrich, 1990) and soils contaminated with both PCP and creosote (Lamar et al., 1993, 1994, Davis et al., 1993), was evaluated. Most of the work on pollutant degradation and soil remediation by white-rot fungi has focused on very few species and predominantly on Phanerochaete chrysosporium. The few reports concerning the evaluation of alternative fungal species have focused on the abilities and selected organisms to degrade specific xenobiotics in liquid culture or on their tolerances to specific xenobiotics. Of relevance to the present research are reports on relative abilities to degrade PCP by a wide range of fungal species from different taxonomic and ecological groups (Zabel et al., 1985; Seigle-Murandi et al., 1991, 1992; Steiman et al., 1994; Benoit-Guyod et al., 1994) and on relative abilities to degrade polycyclic aromatic hydrocarbon (PAH) components of creosote by several white-rot fungi (Field et al., 1992). There also have been several reports on the tolerance of white-rot fungi to PCP (Alleman et al., 1993, 1992; Lamar et al., 1990b). Although these studies have demonstrated significant differences among organisms in their abilities to degrade PCP or other xenobiotics and in their sensitivities to the PCP, the relevance of the results of these studies to bioremediation performance has not been addressed.
Relationships between biochemical or physiological parameters to pollutant transformation or mineralization have been evaluated. Production of lignin (Lip) and manganese (MnP) peroxidases and decolorization of the dye Poly R by several species of white-rot fungi were found to correlate well with PCP removal in liquid culture by these organisms (Lin et al., 1991). In our own work, 29 strains comprising six species of white-rot fungi were evaluated for bioremediation performance (Lamar et al., 1990b). The fungal strains were evaluated in several stages that involved determinations of growth rates, sensitivity to PCP, ability to mineralize PCP in liquid culture and finally ability to deplete PCP in soil. After each stage the most promising strains were selected for continued evaluation. Using this method the potential usefulness of P. sordida for remediation of PCP-contaminated soils was identified and this potential has since been confirmed in the field (Lamar & Dietrich, 1990; Lamar et al., 1993, 1994; Davis et al., 1993).
None of the aforementioned studies have elucidated physiological, biochemical, or ecological factors that would be useful for identification and selection of fungi with superior soil remediation performance. The purpose of the present investigation was to determine if physiological and/or biochemical factors such as growth rate, tolerance to and ability to degrade PCP or creosote have use for predicting the potential bioremediation performance of fungi. Because we have focused the initial development of a fungal-based soil remediation technology on PCP- and/or creosote-contaminated soils, the groups of fungi that were evaluated in this study were organisms isolated or known to grow on PCP- or creosote-treated wood.

SCREENING OF FUNGI 439
17-2 MATERIALS AND METHODS
17-2.1 Approach
The optimum temperature and growth rates for a select group of basidiomycetous and deuteromycetous fungi were determined. Each strain was examined for its sensitivity to PCP, ability to mineralize PCP in liquid culture, and to deplete PCP in soil. The fungi also were tested for their tolerance to creosote, and their ability to degrade PAHs in creosote-treated wood.
17-2.2 Fungi
Fungal strains used in this study were obtained from the Center for Forest Mycology Research (Forest Products Laboratory, Madison, WI), American Type Culture Collection (12301 Parklawn Drive, Rockville, MD 20852), C.J.K. Wang (SUNY College of Environmental Science and Forestry, 1 Forestry Drive, Syracuse, NY 13210-2788). and A. cuboidea from E. Schmidt (College of Natural Resources, Dep. of Forest Products, Kaufert Laboratory, 2004 Folwell Avenue, St. Paul, MN 55108; Table 17-1). Although three of the strains received from U.K. Wang were identical to those obtained from ATCC, isolates from both
Table 17-1 Basidiomycete and deuteromycete strains investigated.
Species Culture no. Type of rot Isolated from W = white treated wood B = brown
S = soft
Basidiomycetes†
Antrodia carbonica MD-280 B creosote A. xantha ME-508 B creosote Bjerkandera adusta FP-135160-Sp W unidentified
(ATCC 62023) Gloeophyllum trabeum Mad-5096-15-R B penta‡
Hyphoderma praetemissum MB-145 W penta Irpex lacteus Mad-517 W mine timber
Phanerochaete chrysosporium# (ATCC 11245) BKM-F-1767 W
P. sordida# (ATCC 24725) HHB-8922-Sp W
Phlebia brevispora MD-192 W treated wood (ATCC 46918)
P. subserialis RLG-10693-Sp W unidentified (ATCC 62007)
Posita placenta MD-506 B creosote Sistotrema brinkmannii ME-632 B creosote Sistotrema sp. P-193-Sp B unidentified Trametes versicolor MD-277 W copper sulfide/
sodium chromate
440 LAMAR ET AL.
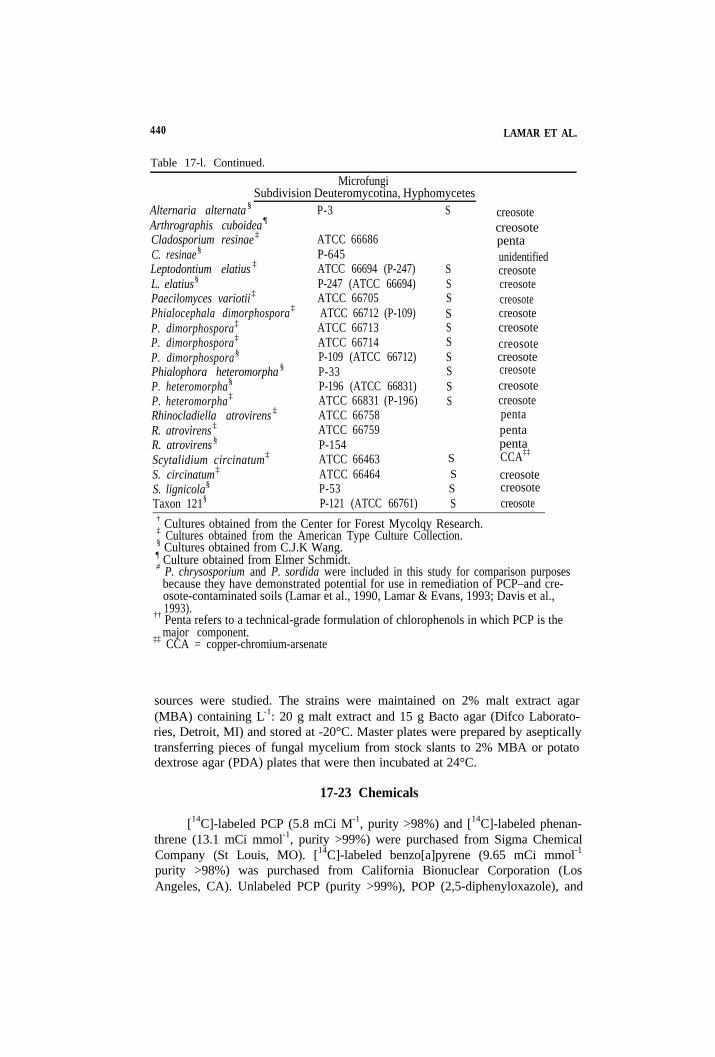
Table 17-l. Continued.
MicrofungiSubdivision Deuteromycotina, Hyphomycetes
Alternaria alternata §
Arthrographis cuboidea ¶
Cladosporium resinae ‡
C. resinae§
Leptodontium elatius ‡
L. elatius§
Paecilomyces variotii ‡
Phialocephala dimorphospora ‡
P. dimorphospora‡
P. dimorphospora‡
P. dimorphospora§
Phialophora heteromorpha §
P. heteromorpha§
P. heteromorpha‡
Rhinocladiella atrovirens ‡
R. atrovirens ‡
R. atrovirens §
Scytalidium circinatum‡
S. circinatum‡
S. lignicola§
Taxon 121§
P-3
ATCC 66686P-645ATCC 66694 (P-247)P-247 (ATCC 66694)ATCC 66705ATCC 66712 (P-109)ATCC 66713ATCC 66714P-109 (ATCC 66712)P-33P-196 (ATCC 66831)ATCC 66831 (P-196)ATCC 66758ATCC 66759P-154ATCC 66463ATCC 66464P-53P-121 (ATCC 66761)
S creosote creosote penta unidentified
S creosote S creosote S creosote S creosote S creosote S creosote S creosote S creosote S creosote S creosote
penta penta penta
S CCA‡‡
S creosote S creosote S creosote
† Cultures obtained from the Center for Forest Mycolqy Research.‡ Cultures obtained from the American Type Culture Collection.§ Cultures obtained from C.J.K Wang.¶ Culture obtained from Elmer Schmidt.# P. chrysosporium and P. sordida were included in this study for comparison purposes
because they have demonstrated potential for use in remediation of PCP–and creosote-contaminated soils (Lamar et al., 1990, Lamar & Evans, 1993; Davis et al.,1993).†† Penta refers to a technical-grade formulation of chlorophenols in which PCP is the
‡‡ major component.CCA = copper-chromium-arsenate
sources were studied. The strains were maintained on 2% malt extract agar (MBA) containing L-1: 20 g malt extract and 15 g Bacto agar (Difco Laboratories, Detroit, MI) and stored at -20°C. Master plates were prepared by aseptically transferring pieces of fungal mycelium from stock slants to 2% MBA or potato dextrose agar (PDA) plates that were then incubated at 24°C.
17-23 Chemicals
[14C]-labeled PCP (5.8 mCi M-1, purity >98%) and [14C]-labeled phenanthrene (13.1 mCi mmol-1, purity >99%) were purchased from Sigma Chemical Company (St Louis, MO). [14C]-labeled benzo[a]pyrene (9.65 mCi mmol-1
purity >98%) was purchased from California Bionuclear Corporation (Los Angeles, CA). Unlabeled PCP (purity >99%), POP (2,5-diphenyloxazole), and

SCREENING OF FUNGI 441
sodium dithionite were obtained from Aldrich Chemical Company (Milwaukee, WI). Water was purified with a Mini-Q Water System (Millipore Corp., Bed-ford, MA). Poly-Fluor liquid scintillation cocktail was purchased from Packard (Meriden, CT). Soil moist (JRM Chemical, Cleveland, OH) consisted of 99.7% cross-linked polyacrylamide and 0.3% inert ingredients. The coal tar creosote was obtained from Koppers Industries (Pittsburgh, PA). The POPOP (p-bis-[2(5-Phenyloxazolylo]-benzene) was obtained from Research Products International Corporation (Elk Grove Village, IL). All solvents were HPLC grade. All other chemicals were the highest available grade.
17-2.4 Dry Weight Determinations
The moisture contents of soil and wood were determined gravimetrically after drying at about 80°C for 18 h. Hyphal mats from liquid cultures were collected by vacuum. filtration on preweighed filters (G6 glass fiber filters, Fischer Scientific Co., Pittsburgh,.PA), rinsed with distilled water, allowed to air dry for 3 d, and then weighed.
17-25 Determination of Temperature Growth Optima and Growth Rates
The optimum temperature for growth of each strain was determined by measuring hyphal extension rates. For this study, 2% MEA plates were inoculated with 6-mm plugs taken from the actively growing margin of fungal colonies from master plates, and incubated at 6, 12, 16, 20, 22, 24, 28, 30, 32, 36, 40, and 44°C. Three plates were prepared for each strain at each temperature, and kept in open Zip-Loc bags. The hyphal extension rate was recorded as the average daily increase in colony diameter (mm) measured in two perpendicular directions. If the cultures demonstrated no growth after 7 d, they were removed from the incubators and kept at 24°C. After 3 d, cultures that did not grow were presumed to have been killed. Those that grew were assumed to have been inhibited by the initial incubation temperature.
17-2.6 Sensitivity to Pentachlorophenol or Creosote
The sensitivity of the fungi to PCP or creosote was determined by measuring the rate of hyphal extension on yeast malt peptone glucose (YMPG) agar that contained different concentrations of PCP or creosote. The concentrations for PCP were 0, 5, 10, and 15 mg L–1 and for creosote 0, 100, 250, 500, and 1000 mg L–1. The YMPG agar consisted of (per 750 mL): 7.5 g of glucose, 7.5 g of malt extract, 1.5 g of bacto-peptone, 1.5 g of yeast extract, 0.75 g of asparagine, 1.5 g KH2PO4 0.75 g MgSO4i7 H2O, 0.75 g of thiamine, 17.25 g of Bacto-agar, and 725 mL of distilled H2O. Both the PCP and creosote were dissolved in acetone prior to addition to the agar. The volume of acetone added to the agar was constant for the controls and all concentrations of PCP and creosote. The plates were inoculated with 6-mm fungal plugs as previously described, kept in Zip-Lot bags and incubated at 24°C. Three replicates were prepared for the controls and every fungus at each concentration. Mycelial growth was measured daily, as described previously, for 14 d and hyphal extension rates were determined.
442 LAMAR ET AL.
17-2.7 Mineralization of Pentachlorophenol in Liquid Culture
Fungi were incubated in stationary-phase cultures containing 10 mL of N-limited BIII culture medium (Kirk et al., 1978) in 125-mL Erlenmeyer flasks. Culture medium contained (per L): 10 g Of glucose, 1 mg of thiamine HCl, 221 mg of ammonium tartrate, 1 g of KH2PO4, 0.5 g of MgSO4•7 H2O, 1 g of Ca(H2PO4)2, and 10 mL of mineral solution in 2.2~dimethylsuccinic acid buffer (1.46 g L–1) adjusted to pH 4.5. Inoculum consisted of one 6-mm plug taken from the active growing region from each fungal master plate. Control flasks were pre-pared using an agar plug from a sterile plate. Three replicates were prepared for each fungus and the control. On Day 3, each culture received approximately 90 000 dpm of [14C]PCP in 100L of N,N- dimethylformamide. Cultures were incubated at 24°C in complete darkness for 30 d.
Culture flasks were fitted with inlet-outlet ports to permit flushing of culture headspaces. Inlet ports were protected from contamination by a piece of sterile cotton. Outlet ports were connected to volatile traps (Orbo 43, Supelco, Bellefonte, PA) and then to a bubbler tube containing 10 mL of CO2-trapping scintillation fluid. Scintillation fluid was composed of toluene cocktail, methanol, and ethanolamine (5:4:1; v/v/v). Toluene cocktail contained 4 g of PPD L–1 and 0.1 g of POPOP L–1 in toluene. Headspaces of all cultures were evacuated with O2 every 3 to 4 d. The first evacuation was 3 d after the addition of [C14]PCP, The amount of trapped 14CO2 was determined by transferring the 10 mL of scintillation cocktail to a 20-mL scintillation vial for counting radioactivity present. Counting was performed on a 1214 Rackbeta liquid scintillation counter (Pharmacia). The dry weight of hyphal mats was determined after harvesting as described above.
17-2.8 Depletion of Pentachlorophenol in Soil
Marshan sandy loam (fine-loamy over sandy or sandy-skeletal, mixed, mesic Typic Haplaquoll) was air dried, sieved (<2 mm), and stored in plastic bags at 4°C. The soil was sterilized by fumigating with Bromo Gas (Great Lakes Chemical Corp., West Lafayette, IN; 98% methyl bromide-2% chloropicrin). Soil physical and chemical properties were reported by Lamar et al. (1990a). Nonlabeled PCP was dissolved in acetone and added to the sterile soil to obtain a final concentration of 100 mg kg–1. The moisture content was adjusted to 39% using sterile distilled water.
To determine the ability of the fungi to degrade PCP in the soil, approximately 5 g of PCP-amended soil (wet weight, 39% moisture content) was placed in sterile 20-mL vials fitted with polyurethane foam stoppers. Cultures were inoculated by aseptically placing seven 6-mm plugs from fungal master plates on the soil surface. Two sets of control cultures were prepared containing PCP-amended soil with either seven sterile agar plugs or none. The vials were incubated for 30 d at 24°C. Three replicates were performed for each culture.
For analysis of PCP, the agar plugs were removed and the 5 g of soil transferred to 25 × 150 mm culture tubes (Corning, Corning, NY) with Teflon-lined screw caps. In order to determine percentage of moisture of the soil, every fifth sample had approximately 1 g of soil removed for gravimetric determination of

SCREENING OF FUNGI 443
moisture content. Approximately 100 mg of Na2S2O4 were added to each tube. The samples were then extracted twice, under N, with 20-mL of hexane-acetone (1:1) acidified to pH 2 with H2SO4, for 1 h on a rotating tumbler shaker at about 33 revolutions min–1. The extracts were pooled in a clean tube, dried by passing them through a column of anhydrous Na2SO4 and collected in a culture tube (20 × 150 mm). The Na2SO4 was prepared by muffling for 4 h at 350°C and all glass-ware was muffled for 1 h at 450°C. Culture tubes containing the extracts were placed in a Zymark (Hopkinton, MA) Turbo Vap ZW700 evaporator held at 35°C and evaporated, under N, to approximately 5 mL. The 5 mL volume was filtered through a 0.5µm MILLEX-SR filter (Millipore Products, Bedford, MA) into a 10-mL volumetric flask and the final volume adjusted with hexane. To determine the effectiveness of the extraction procedure, selected soil samples were spiked with approximately 40 000 dpm of [14C]-labeled PCP prior to extracting. Following extraction, the amount of 14C associated with 0.5-mL aliquots of the extracts was determined as described above, and the percentage of recovery calculated. Recoveries averaged 87%. Extracts were stored at -20°C in amber vials with Teflon-lined screw caps.
Extracts were analyzed for PCP by gas chromatography using electron capture detection, as described previously (Lamar et al., 1993). 2,4,6-Tribromophe-no1 was used as the internal standard and Sylon BSA (Supelco) was used as the derivatizing reagent. Gas chromatographic analyses of extracts were performed on a Hewlett Packard Model 5890A or 5890II gas chromatograph equipped with a 63Ni electron capture detector, a Model 7673A autosampler, and split-splitless capillary column injection ports. Operating temperatures for both instruments were injector 220°C and detector 300°C; carrier gas, He; and makeup gas, N2. The columns were a DB-5 fused-silica capillary column (30 m × 0.321 mm) with a film thickness 0.25 µm (J&W Scientific, Folsom, CA). Injections were splitless with split off for 1 min. The temperature program was initial temperature 60°C; hold for 1 min; ramp A, 10°C min–1 for 9 mm (60-150°C); ramp B, 2°C min–1 for 20 min (150-190°C); and hold at 190°C for 5 min. Data are reported as percent-age decrease of the PCP concentration after 30 d.
17-2.9 Degradation of Creosote in Creosote-Treated Wood
Nonsterile creosote-treated wood (railroad ties, approximately 30 yr of age) was cut into cubes (2.5-3.5 cm3). Approximately 10.4 g of wood cubes were placed in a sterile 256-mL jelly jar with a lid modified to allow adequate aeration and minimize moisture loss by gluing a piece of microporous polypropylene film (Cell-Guard, Hoechst Celanese Corp., Somerville, NJ) over a 32 mm diam. hole, on the underside of the lid. Jars and lids were sterilized by autoclaving at 121°C for 20 min. Because of the hydrophobic nature of the creosote-treated wood, it was impossible to adjust the moisture content to a level that would be optimum for fungal growth (e.g., 60%). Therefore 0.1 g of Soil Moist was added to the Wood in each jar to absorb the water that was not adsorbed by the wood and to release the water as needed. For each isolate fungal cultures were prepared by aseptically adding agar pieces, infested with the proper fungus, from one-half of a master plate prepared with PDA, to the cubed wood. Control cultures were pre-pared by adding one-half of the agar from a sterile PDA plate to the wood cubes.
444 LAMAR ET AL.
Three replicates were prepared for each fungal isolate and the control. The cultures were incubated at 24°C in complete darkness for 30 d.
Prior to extraction, the agar pieces and soil moist were scraped from the woo d cubes and the wood cubes were ground in a commercial coffee grinder until the wood was light and fluffy ( about 1 - 2 min). Initial PAH concentrations were determined using nontreated wood cubes. A sample was taken from each culture to determined moisture content of the ground wood, gravimetrically. Approximately 1 g (wet weight) was mixed with 6 g of anhydrous sodium sulfate in a culture tube 25 X 150 mm). Each sample was extracted by sonicating in 20 mL of acetone-methylene chloride (1:1, v/v) for 2 min at power setting 5 using a Heat System (Farmingdale, NY) XL2020 sonicator with a microtip probe. The wood was allowed to settle to the bottom of the tubes for about 1 to 2 h and the extraction solvents were vacuum filtered through a G6 glass fiber filter (Fischer Scientific Co., Pittsburgh, PA) into a disposable culture tube (20 × 150 mm). The ground wood was then extracted a second time using the same solvent system, After the second extraction, the extraction solvent-wood mixture was poured onto the filter surface. The wood trapped on the filters was rinsed with 5 mL methylene chloride and then 5 mL acetone. The two extracts were combined and evaporated to dryness under N at 40°C using a Turbo Vap. The residue was solubilized in 10 mL of acetonitrile in disposable culture tubes (20 × 150 mm) sealed with parafilm and incubated for 1 h at 24°C. The tubes were gently vortexed and decanted into 12-mL amber screw cap vials with Teflon-lined caps and stored at 24°C.
To assess the extraction efficiency, randomly selected ground wood samples were spiked with about 100 000 dpms each of [14C]phenanthrene or [14C]benzo[a]pyrene dissolved in acetone. Following the extraction, 0.5 mL aliquots of the concentrated extraction solvents were counted and the percentage of recoveries calculated. Phenanthrene recoveries averaged 85% and benzo[a]pyrene recoveries averaged 69%.
The extracts were analyzed for 14 different PAH components (Table 17-8) by high-performance liquid chromatography (HPLC) using a Hewlett Packard 1090L Series II equipped with a diode-array detector, as described in Lamar et al. (1994). Separations were achieved on a Vydac 201TP Cl8 analytical column (0.46 × 25 cm; Separation Group, Hesparia, CA), preceded by a Vydac 211GCC54T Cl8 guard column. Analyte peaks were identified based on their elution times and ultraviolet absorption spectra when compared with pure PAH standards. For quantitation, interferences due to poorly-resolved components in the complex mixtures were minimized by monitoring the different analytes for absorbance at wavelengths that gave the greatest selectivity for each analyte. Thus, acenapthene was monitored at 228 nm, fluorene, and phenanthrene at 2.58 nm, chrysene at 265 mn, fluoranthene and benzo[a ]anthracene at 280 nm, benzo[b]fluoranthene, benzo[k ]fluoranthene, and dibenzo[a,h]anthracene at 300 nm, pyrene at 312 nm, and benzo[a]pyrene, benzo[g,h,i]perylene and indeno[l,2,3- cd]pyrene at 382 nm.
17-2.10 Statistical Analysis
Analysis of variance (ANOVA, a = 0.05) was used to test for equality of means for PCP mineralization efficiency, percentage of PCP depletion from soil
SCREENING OF FUNGI 445
and PAH concentration in wood. If by ANOVA, treatment means were shown to be significantly different, Fisher’s protected LSD (a = 0.05) was performed to identify treatment differences.
17-3 RESULTS
17-3.1 Temperature Growth Optima, Temperature Growth Range, and Growth Rates
All tested strains grew between 12 and 32°C except for Sistotrema sp., which grew to a maximum temperature of 24°C (Table 17-2). Only two fungi, the basidiomycete Phlebia subserialis and the dueteromycete Cladosporium resinae, grew at all temperatures evaluated. There were no differences between the taxonomic groups in temperature growth ranges; however, in general, the basidiomycetes had greater hyphal extension rates than the deutemmycetes. Mean growth rates for the basidiomycetes ranged from 5.5 mm d–1 for A. carbonica to 47.3 mm d–1 for P. subserialis. Phlebia subserialis and P. brevispora possessed the greatest hyphal extension rates (Table 17-2). Rank in terms of hyphal extension rates for the basidiomycetes was as follows: P. sabserialis > P. brevispora > I. lacteus > B. adusta > T. versicolor > S. brinkmannii > P. placenta > G. trabeum > A. xantha > Sistotrema sp. = H. praetermissum > A. carbonica. The optimum temperature for growth of basidiomycete strains fell in the range of 22 to 40°C.
With a few exceptions the dueteromycetes had very low (>5 mm d–1) hyphal extension rates (Table 17-2). Arthrographus cuboidea had the greatest hyphal extension rate (21.2 mm d–1). Ranking of these organisms from highest to lowest extension rates was as follows: A. cuboidea > P. variottii > A. alternata > C. resinae (P-545) > S. lignicola > S. circinatum (ATCC 66464) > C. resinae (ATCC 66686) > S. circinatum (ATCC 66463) > P. dimorphospora (ATCC 66712) > P. dimorphospora (ATCC 66713) P. dimorphospora (P-109) > P. dimorphospora (ATCC 66714) > L. elatius (ATCC 66694) L. elatius (P-247) P. heteromorpha (ATCC 66831) > P. heteromorpha (P-196) > Taxon 121 > P. heteromorpha (P-33) > R. atrovirens (P-154) > R. atrovirens (ATCC 66758) > R. atrovirens (ATCC 66759). Temperature growth optima for the dueteromycetes ranged from 22 to 36°C. Different isolates of the same species generally exhibited the same optimum growth temperature, temperature range for growth, and hyphal extension rates (Table 17-2):
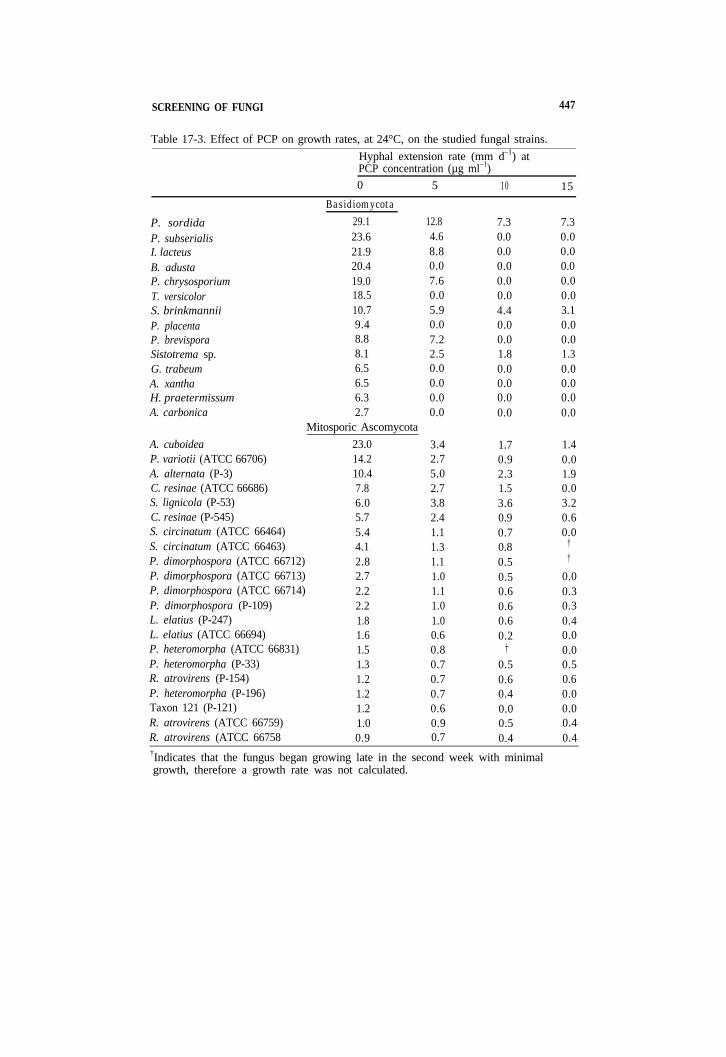
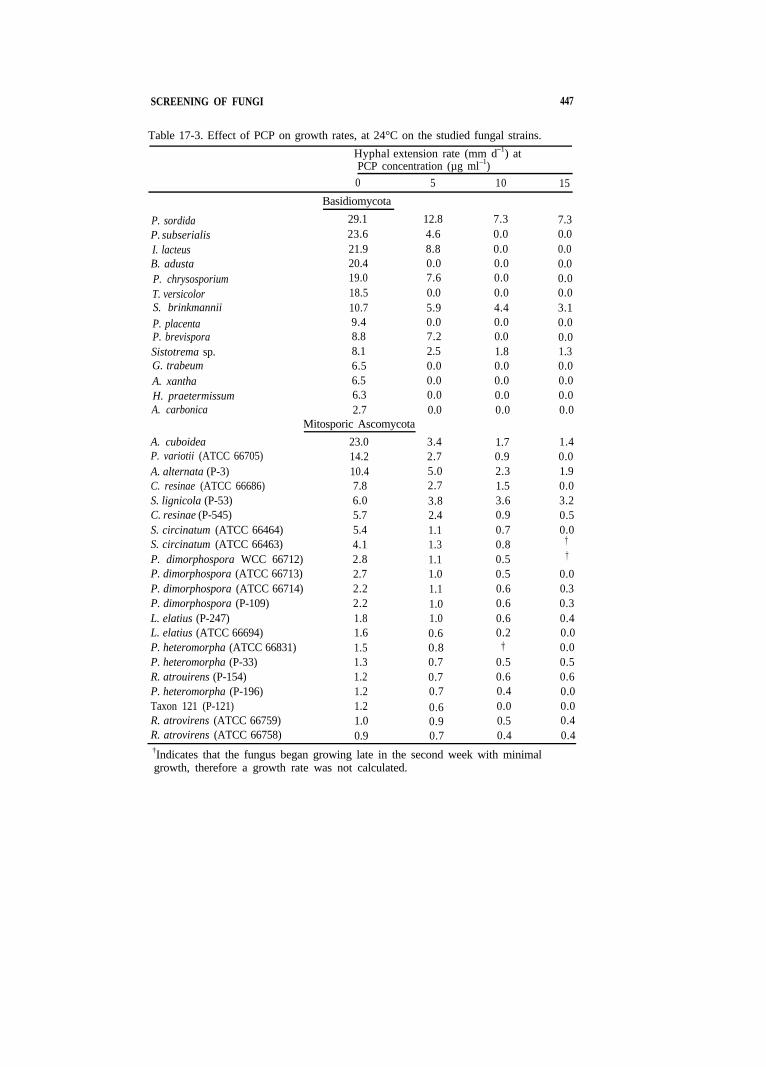
17-3.2 Sensitivity of the Strains to Pentachlorophenol
The tested isolates varied greatly in their sensitivity to PCP (Table 17-3). Basidiomycetes were more sensitive to PCP than deuteromycetes, with only one-half of the former able to grow in the presence of 5 mg L–1PCP. Basidiomycete genera that were relatively less sensitive to PCP were Irpex Phanerochaete, Phlebia, and Sistotrema. The other tested strains were unable to grow when PCP was present. Of all the tested fungi, P. sordida demonstrated the most rapid growth rate at all concentrations of PCP. All duetemmycete strains were able to grow up to 10 mg L–1, with the exception of Taxon 121 (Table 17-3).

446 LAMAR ET AL.
Table 17-2. Temperature range for growth, optimum temperature, and maximum growth rate at the optimum temperature for selected fungi.
Optimum temperature Growth range Growth rate†
A. carbonicaA. xanthaB. adustaG. trabeumH. praetermissumI. lacteusP. chrysosporium‡
P. sordida§
P. brevisporaP. subserialisP. placentaS. brinkmanniiSistotrema sp.T. versicolor
A. alternata (P-3) A. cubaidea C. resinae (ATCC 66666) C. resinae (P-545) L. elatius (ATCC 66694)L. elatius (P-247)P. variotti (ATCC 66705)
°C Basidiomycota
242828
28-36243640
24-363028
24-282422
23-32 Mitosporic Ascomycota
24 28
22-36 36
22-24 22
32-36 P. dimorphospara (ATCC 66712) 24 P. dimorphospora (ATCC 66713) 24 P. dimorphospora (ATCC 66714) 22-24 P. dimorphospora (P-109) 24 P. heteromorpha (ATCC 66631) 3 0 - 3 2 P. heteromorpha (P-33) 28 P. heteromorpha (P-196) 322 R. atrovirens (ATCC 66753) 24 R. atrovirens (ATCC 66759) 24 R. atrovirens (P-154) 22-24 S. circinatum (ATCC 66463) 24 S. circinatum (ATCC 66464) 24 S. lignicola (P-53) 30 Taxon 121 (P-121) 30
°C mm d–1
12-36 5.5 6-36 7.3 6-36 21.7 12-40 8.8 6-36 6.2 6-40 24.2 12-50 35-42
14-40 26.8 6-40 36.9 6-44 47.3 12-36 9.4 6-32 11.5 6-24 6.2 6-40 19.8
6-36 10.4 6-36 21.2 6-44 4.7 6/-44 6.8 6-32 2.2 6-32 2.2 12-44 15.6 6-36 3.5 6-36 3.4 6-36 3.0 6-36 3.4 16-40 2.2 12-40 1.8 12-40 2.1 12-36 1.3 12-36 1.2 12-26 1.4 6-36 4.2 6-36 4.9 6-40 5.3 16-40
† Most rapid growth rate observed.‡ Burdsall and Eslyn (1974).§ Lamar et al. (1990).
SCREENING OF FUNGI 447
Table 17-3. Effect of PCP on growth rates, at 24°C, on the studied fungal strains. Hyphal extension rate (mm d–1) at PCP concentration (µg ml–1) 0 5 10 15
P. sordida P. subserialis I. lacteus B. adustaP. chrysosporiumT. versicolorS. brinkmanniiP. placentaP. brevisporaSistotrema sp.G. trabeumA. xanthaH. praetermissumA. carbonica
A. cuboideaP. variotii (ATCC 66706)A. alternata (P-3)C. resinae (ATCC 66686) S. lignicola (P-53) C. resinae (P-545)
Basidiomycota 29.1 12.8 23.6 4.6 21.9 8.8 20.4 0.0 19.0 7.6 18.5 0.0 10.7 5.9 9.4 0.0 8.8 7.2 8.1 2.5 6.5 0.0 6.5 0.0 6.3 0.0 2.7 0.0
Mitosporic Ascomycota 23.0 3.4 14.2 2.7 10.4 5.0 7.8 2.7
7.3 7.3 0.0 0.0 0.0 0.0 0.0 0.0 0.0 0.0 0.0 0.0 4.4 3.1 0.0 0.0 0.0 0.0 1.8 1.3 0.0 0.0 0.0 0.0 0.0 0.0 0.0 0.0
1.7 1.4 0.9 0.0 2.3 1.9 1.5 0.0 3.6 3.2 0.9 0.6 0.7 0.0 0.8 †
0.5 †
0.5 0.0 0.6 0.3 0.6 0.3 0.6 0.4 0.2 0.0
† 0.0 0.5 0.5 0.6 0.6 0.4 0.0 0.0 0.0 0.5 0.4 0.4 0.4
S. circinatum (ATCC 66464)S. circinatum (ATCC 66463)P. dimorphospora (ATCC 66712)P. dimorphospora (ATCC 66713)P. dimorphospora (ATCC 66714)P. dimorphospora (P-109)L. elatius (P-247)L. elatius (ATCC 66694)P. heteromorpha (ATCC 66831)P. heteromorpha (P-33)R. atrovirens (P-154)P. heteromorpha (P-196)Taxon 121 (P-121)R. atrovirens (ATCC 66759)R. atrovirens (ATCC 66758
6.0 3.8 5.7 2.4 5.4 1.1 4.1 1.3 2.8 1.1 2.7 1.0 2.2 1.1 2.2 1.0 1.8 1.0 1.6 0.6 1.5 0.8 1.3 0.7 1.2 0.7 1.2 0.7 1.2 0.6 1.0 0.9 0.9 0.7
†Indicates that the fungus began growing late in the second week with minimal growth, therefore a growth rate was not calculated.
SCREENING OF FUNGI 447
Table 17-3. Effect of PCP on growth rates, at 24°C on the studied fungal strains.
Hyphal extension rate (mm d–1) at PCP concentration (µg ml–1) 0 5 10 15
Basidiomycota
P. sordida 29.1 12.8 7.3 7.3 P. subserialis 23.6 4.6 0.0 0.0 I. lacteus 21.9 8.8 0.0 0.0 B. adusta 20.4 0.0 0.0 0.0 P. chrysosporium 19.0 7.6 0.0 0.0 T. versicolor 18.5 0.0 0.0 0.0 S. brinkmannii 10.7 5.9 4.4 3.1 P. placenta 9.4 0.0 0.0 0.0 P. brevispora 8.8 7.2 0.0 0.0 Sistotrema sp. 8.1 2.5 1.8 1.3 G. trabeum 6.5 0.0 0.0 0.0 A. xantha 6.5 0.0 0.0 0.0 H. praetermissum 6.3 0.0 0.0 0.0 A. carbonica 2.7 0.0 0.0 0.0
Mitosporic Ascomycota A. cuboidea 23.0 3.4 1.7 1.4 P. variotii (ATCC 66705) 14.2 2.7 0.9 0.0 A. alternata (P-3) 10.4 5.0 2.3 1.9 C. resinae (ATCC 66686) 7.8 2.7 1.5 0.0 S. lignicola (P-53) 6.0 3.8 3.6 3.2 C. resinae (P-545) 5.7 2.4 0.9 0.5 S. circinatum (ATCC 66464) 5.4 1.1 0.7 0.0 S. circinatum (ATCC 66463) 4.1 1.3 0.8 †
P. dimorphospora WCC 66712) 2.8 1.1 0.5 †
P. dimorphospora (ATCC 66713) 2.7 1.0 0.5 0.0 P. dimorphospora (ATCC 66714) 2.2 1.1 0.6 0.3 P. dimorphospora (P-109) 2.2 1.0 0.6 0.3 L. elatius (P-247) 1.8 1.0 0.6 0.4 L. elatius (ATCC 66694) 1.6 0.6 0.2 0.0 P. heteromorpha (ATCC 66831) 1.5 0.8 † 0.0 P. heteromorpha (P-33) 1.3 0.7 0.5 0.5 R. atrouirens (P-154) 1.2 0.7 0.6 0.6 P. heteromorpha (P-196) 1.2 0.7 0.4 0.0 Taxon 121 (P-121) 1.2 0.6 0.0 0.0 R. atrovirens (ATCC 66759) 1.0 0.9 0.5 0.4 R. atrovirens (ATCC 66758) 0.9 0.7 0.4 0.4 †Indicates that the fungus began growing late in the second week with minimal growth, therefore a growth rate was not calculated.

448 LAMAR ET AL.
17-3.3 Mineralization of Pentachlorphenol in Liquid Culture
Percentage of mineralization of PCP by tested basidiomycetes was quite variable and ranged from about 1% for Sistotrema sp. to about 45% for B. adusta and T. versicolor (Table 17-4). The percentage of PCP mineralized by the latter two organisms were far superior to any of the other tested strains. A group of organisms comprised of H. praetermissum, I. lacteus, P chrysosporium, P. sordida, and P. subserialis also mineralized a significant percentage of PCP (about 20 to 29%). The other tested isolates mineralized < 2% PCP. Although the deuteromycetes produced mycelial mats in the BIII medium, none of the tested isolates mineralized >2% PCP.
Amount of fungal biomass (i.e., mycelial mat weight) did not relate directly with percentage of mineralization: regression of mycelial mat weight on percentage of mineralization gave an R2 = 0.386, P = 0.0101. For example, some isolates like P. brevispora produced relatively large mats (0.038 g mat-‘) but mineralized only small amounts of PCP (Table 174). Other organisms like H. praetermissum, I. lacteus, and P. chrysosporium, were able to mineralize significant amounts of PCP with intermediate-sized mats (0.021-0.24 g mat–1). Because of the lack of a direct relationship between percentage of mineralization and mycelial mat weight, the fungi were compared on the basis of mineralization efficiency (i.e., % PCP mineralization/weight mycelial mat). Although their mineralization efficiencies were not significantly greater than several white-rot fungi, the mycelium of the brown-tot fungi G. trabeum and P. placenta possessed the
Table 17-4. Pentachlorophenol mineralized (%) in BIII medium by basidiomycetes.†
Mycelial mat Mineralization weights
T. versicolor B. adusta P. subserialis P. chrysosporium I. lacteusH. praetermissumP. sordida (old)P. sordida (new)G. trabeumP. placentaA. carbonicaP. brevisporaSistotrema sp.S. brinkmanniiControl A. xantha
% mg 45.1 ± 8.0 43 ± 11 44.8 ± 3.3 45 ± 6 29.4 ± 1.1 45 ± 7 28.7 ± 6.2 24 ± 4 25.1 ± 2.3 21 ± 2 25.0 ± 1.2 22 ± 1 20.3 ± 3.9 55 ± 5 12.4 ± 0.5 38 ± 2 11.5 ± 0.3 9 ± 1 10.1 ± 0.4 8 ± 1 8.0 ± 1.0 4 ± 2 3.6 ± 1.2 38 ± 11 1.2 ± 0.2 10 ± 2 1.1 ± 0.7 25 ± 1 0.7 ± 0.3 0.5 ± 0.3 4 ± 1
† Although the deuteromycetes grew in the BIII medium, they did not mineralize > 2% of the PCP, therefore these results were not included in the table.

SCREENING OF FUNGI 449
Table 17-5. Mineralization efficiency for PCP of the basidiomycetes (% comulative mineralization per gram of mycelial weight produced after 30 d).
Mineralization efficiency
G. trabeumP. placentaP. chrysosporiumI. lacteusH. praetermissumT. versicolorB. adustaP. subserialisP. sordida (old)P. sordida (new)A. carbonicaA. xanthaSistotrema sp.P. brevisporaS. brinkmannii
13.5 ± 1.7a†
12.9 ± 2.7a 12.5 ± 4.5a 11.8 ± 1.8a 11.2 ± 0.7a
10.6 ± 1.3ab 10.1 ± 1.4ab 6.6 ± 0.8bc 3.7 ± 1.0cd 3.3 ± 0.2cd 1.8 ± 6.9d 1.3 ± 0.3d 1.1 ± 0.0d 0.9 ± 0.2d 0.42 ± 0.0d
† Values followed by the same letter are not significantly different as determined by Fisher’s Protected least significant difference multiple comparison procedure (a = 0.05).
greatest capacity for mineralizing PCP under the experimental conditions (Table 17-5); however, with the exception of those two organisms, white-rot fungi possessed greater mineralization efficiencies than brown-rot fungi.
17-3.4 Depletion of Pentachlorophenol in Soil
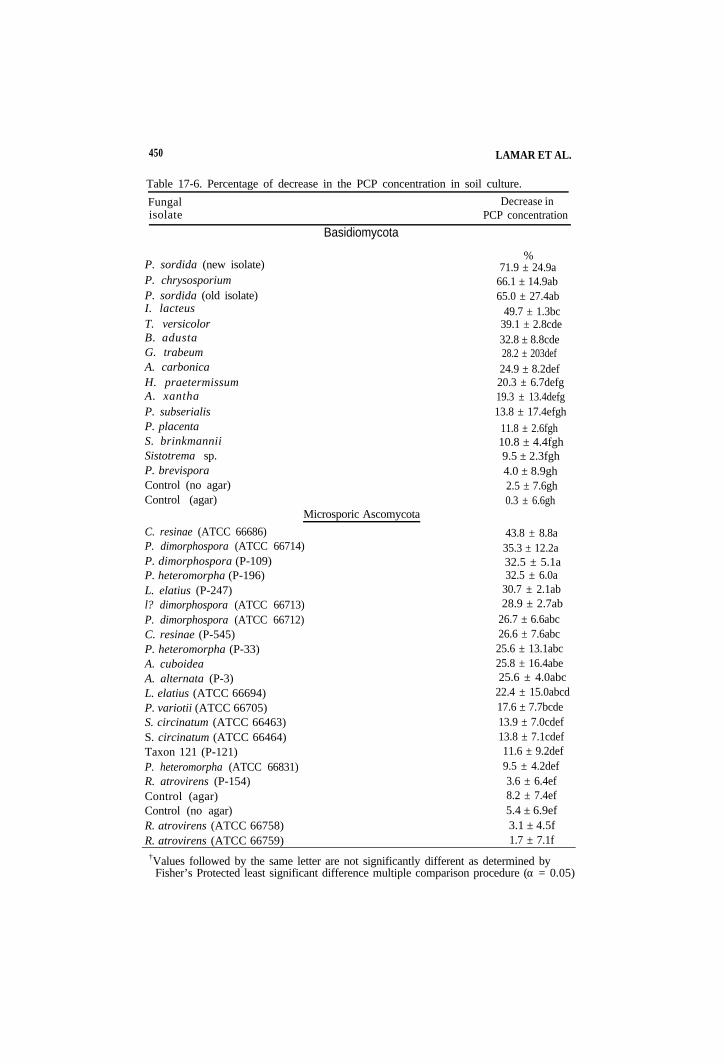
The abilities of both basidiomycetous and dueteromycetous fungi to decrease the concentration of PCP in soil varied greatly (Table 17-6). The most effective basidiomycete was P. sordida Interestingly this isolate decreased the PCP concentration by about 7% more than the same P. sordida isolate that had been transferred on 2% malt agar, repeatedly, during a 7 yr period. Other basidiomycetes that caused PCP decreases that were significantly greater than those observed in control cultures were the white-rot fungi P. chtysosporium, I. lacteus, T. versicolor, and B. adusta and the brown-rot fungi G. trabeum and A. carbonica (Table 17-6).
The most effective PCP-degrading dueteromyetes were C. resinae, two isolates of Phialocephala dimorphospora, and one isolate of Phialophora heteromorpha (Table 17-6). Although these organisms caused significant percentage decreases in the PCP concentration (about 33-44%), their decreases were not as great as those caused by the most effective basidiomycetes. In several cases, the percentage decrease of PCP caused by different isolates of the same species varied greatly. For example, the percentage decreases effected by isolates of Phialophora heteromorpha were 32.5, 25.8, and 9.5%, respectively, for isolates P-196, P-33, and ATCC66831 (Table 17-6). The percentage PCP decreases caused by two isolates of R. atrovirens were less then was observed in control cultures.
450 LAMAR ET AL.
Table 17-6. Percentage of decrease in the PCP concentration in soil culture.
Fungal Decrease in isolate PCP concentration
P. sordida (new isolate)P. chrysosporiumP. sordida (old isolate)I. lacteus T. versicolorB. adustaG. trabeumA. carbonicaH. praetermissumA. xanthaP. subserialisP. placentaS. brinkmanniiSistotrema sp.P. brevisporaControl (no agar) Control (agar)
C. resinae (ATCC 66686)
Basidiomycota
% 71.9 ± 24.9a
66.1 ± 14.9ab 65.0 ± 27.4ab
49.7 ± 1.3bc 39.1 ± 2.8cde 32.8 ± 8.8cde 28.2 ± 203def 24.9 ± 8.2def 20.3 ± 6.7defg 19.3 ± 13.4defg 13.8 ± 17.4efgh
11.8 ± 2.6fgh 10.8 ± 4.4fgh 9.5 ± 2.3fgh 4.0 ± 8.9gh 2.5 ± 7.6gh 0.3 ± 6.6gh
Microsporic Ascomycota
43.8 ± 8.8a P. dimorphospora (ATCC 66714) 35.3 ± 12.2a P. dimorphospora (P-109) 32.5 ± 5.1a P. heteromorpha (P-196) 32.5 ± 6.0a L. elatius (P-247) 30.7 ± 2.1ab l? dimorphospora (ATCC 66713) 28.9 ± 2.7ab P. dimorphospora (ATCC 66712) 26.7 ± 6.6abc C. resinae (P-545) 26.6 ± 7.6abc P. heteromorpha (P-33) 25.6 ± 13.1abc A. cuboidea 25.8 ± 16.4abe A. alternata (P-3) 25.6 ± 4.0abc L. elatius (ATCC 66694) 22.4 ± 15.0abcd P. variotii (ATCC 66705) 17.6 ± 7.7bcde S. circinatum (ATCC 66463) 13.9 ± 7.0cdef S. circinatum (ATCC 66464) 13.8 ± 7.1cdef Taxon 121 (P-121) 11.6 ± 9.2def P. heteromorpha (ATCC 66831) 9.5 ± 4.2def R. atrovirens (P-154) 3.6 ± 6.4ef Control (agar) 8.2 ± 7.4ef Control (no agar) 5.4 ± 6.9ef R. atrovirens (ATCC 66758) 3.1 ± 4.5f R. atrovirens (ATCC 66759) 1.7 ± 7.1f
†Values followed by the same letter are not significantly different as determined by Fisher’s Protected least significant difference multiple comparison procedure (a = 0.05)

SCREENING OF FUNGI 451
17-3.5 Sensitivity of Strains to Creosote
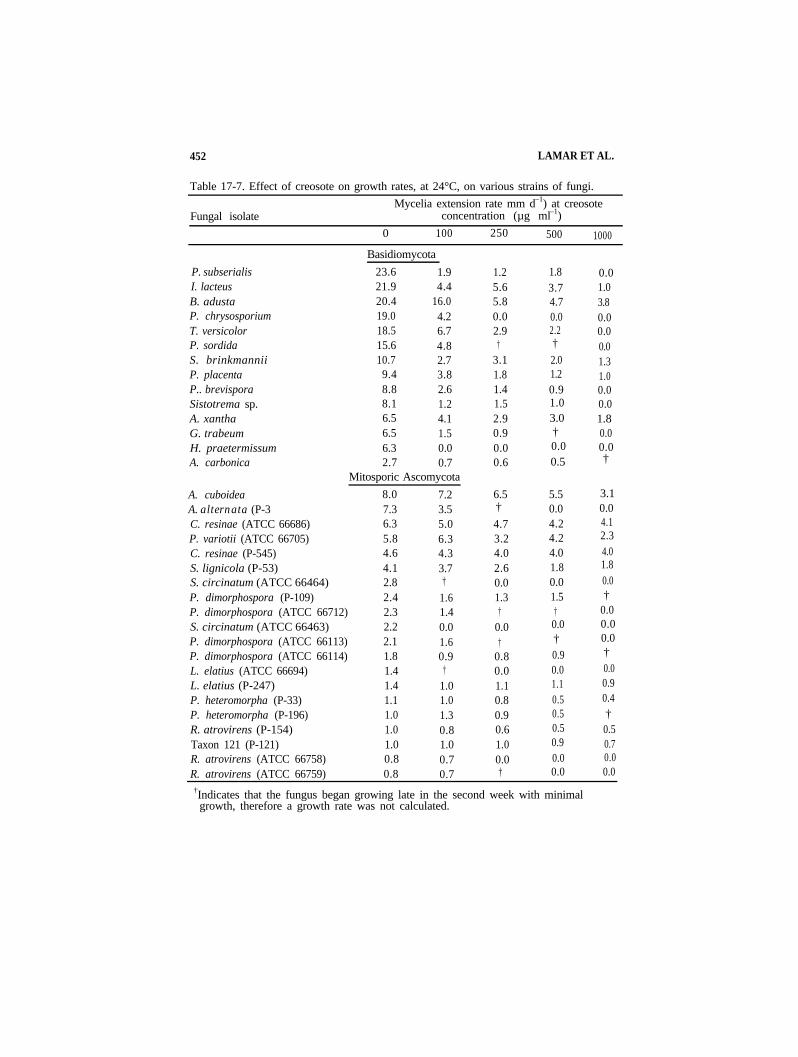
The majority of the basidiomycetes grew up to 500 ppm creosote before growth was completely inhibited (Table 17-7). Several isolates including A. xantha, B. adusta, I. lacteus, P. placenta, and S. brinkmanii were able to grow in the presence of 1000 g L–1creosote. Hyphoderma praetermissum was the most sensitive isolate and it failed to grow in the presence of 100 µg L–1. The most creosote-tolerant deuteromycete was C. resinae. The hyphal extension rate of this organism was only slightly decreased in the presence of 1000 g L–1 creosote. There was some intraspecific variation in creosote tolerance among deuteromycete isolates. For example, Leptodontium elatius strain ATCC 66694 did not tolerate 100 mg L–1, whereas strain P-247 was able to grow in the presence of 1000 µg L–1 creosote.
17-3.6 Degradation of Polycyclic Aromatic Hydrocarbons in Creosote-Treated wood
Concentration of PAH analyses in nonsterile, creosote-treated wood cubes were significantly less in fungal inoculated and control cultures compared with those found in nontreated wood samples (Table 17-8). Inoculation with either basidiomycetes or deuteromycetes did not always result in concentrations that were significantly less than those found in wood amended with sterile agar (controls). Residual concentrations of acenapthene, fluorene, and phenanthrene in fungal inoculated wood cubes were never significantly less than those found in control treated cubes (Table 17-8). Decreases in the PAH analyte concentrations in control wood cubes may have been due to the presence of dueteromycete and/or bacterial strains naturally associated with the creosote-treated wood. Two dueteromycete fungi, Curvularia sp. and Alternaria alternata were identified growing on wood cubes and agar from the control treatment. Residual concentrations of anthracene, fluoranthene, pyrene, benzo[a]anthracene, chrysene, benzo[b ]fluoranthene, benzo[ k]fluoranthene, benzo[a]pyrene, dibenzo[a]anthracene, benzo[g,h,i]perylene, indeno[1,2,3-c,d]pyrene were significantly less in some fungal-treated blocks than in control blocks (Table 17--8). In particular, treatment with the basidiomycyes G. trabeum and P. brevispora and the dueteromycetes C. resinae (ATCC 66686) and S. circinatum (ATCC 66463), resulted in residual concentration of theses compounds that were significantly less than those found in wood from control cultures (Table 17-8).
17-4 DISCUSSION
Identification of the most effective fungus for a particular set of contaminatn-soil conditions and provision of environmental conditions in the field, that give optimum growth and xenobiotic-degrading activities of the selected fungus, are the keys to successful application of fungal bioaugmentation. Ideally fungi would be selected on the basis of biochemical, physiological, and ecological attributes that would confer to them superior performance under a particular set of contaminant-media (e.g., soil) conditions. Currently treatability studies, using
452 LAMAR ET AL.
Table 17-7. Effect of creosote on growth rates, at 24°C, on various strains of fungi. Mycelia extension rate mm d–1) at creosote
Fungal isolate concentration (µg ml–1) 0 100 250 500 1000
P. subserialis I. lacteus B. adusta P. chrysosporium T. versicolor P. sordida S. brinkmannii P. placenta P.. brevispora Sistotrema sp. A. xantha G. trabeum H. praetermissum A. carbonica
A. cuboideaA. alternata (P-3C. resinae (ATCC 66686) P. variotii (ATCC 66705) C. resinae (P-545) S. lignicola (P-53)
Basidiomycota 23.6 1.9 21.9 4.4 20.4 16.0 19.0 4.2 18.5 6.7 15.6 4.8 10.7 2.7 9.4 3.8 8.8 2.6 8.1 1.2 6.5 4.1 6.5 1.5 6.3 0.0 2.7 0.7
Mitosporic Ascomycota 8.0 7.2 7.3 3.5 6.3 5.0 5.8 6.3
1.2 1.8 0.0 5.6 3.7 1.0 5.8 4.7 3.8 0.0 0.0 0.0 2.9 2.2 0.0
† † 0.0 3.1 2.0 1.3 1.8 1.2 1.0 1.4 0.9 0.0 1.5 1.0 0.0 2.9 3.0 1.8 0.9 † 0.0 0.0 0.0 0.0 0.6 0.5 †
6.5 5.5 3.1 † 0.0 0.0 4.7 4.2 4.1 3.2 4.2 2.3 4.0 4.0 4.0 2.6 1.8 1.8
0.0 0.0 0.0 1.3 1.5 †
† † 0.0 0.0 0.0 0.0
† † 0.0
0.8 0.9 †
0.0 0.0 0.0 1.1 1.1 0.9 0.8 0.5 0.4 0.9 0.5 † 0.6 0.5 0.5 1.0 0.9 0.7 0.0 0.0 0.0 † 0.0 0.0
S. circinatum (ATCC 66464)P. dimorphospora (P-109)P. dimorphospora (ATCC 66712)S. circinatum (ATCC 66463)P. dimorphospora (ATCC 66113)P. dimorphospora (ATCC 66114)L. elatius (ATCC 66694)L. elatius (P-247)P. heteromorpha (P-33)P. heteromorpha (P-196)R. atrovirens (P-154)Taxon 121 (P-121)R. atrovirens (ATCC 66758)R. atrovirens (ATCC 66759)
4.6 4.3 4.1 3.7 2.8 † 2.4 1.6 2.3 1.4 2.2 0.0 2.1 1.6 1.8 0.9 1.4 † 1.4 1.0 1.1 1.0 1.0 1.3 1.0 0.8 1.0 1.0 0.8 0.7 0.8 0.7
†Indicates that the fungus began growing late in the second week with minimalgrowth, therefore a growth rate was not calculated.

Tabl
e 17
-8.
Con
cent
ratio
ns (
mg
kg–1
) of
ext
ract
ed P
AH
s in
cre
osot
e-tre
ated
woo
d bl
ocks
bef
ore
(initi
al)† a
nd a
fter
6 w
ks o
f tre
atm
ent
with
sel
ecte
d fu
ngi
and
cont
rols
† (n
onin
ocul
ated
). PA
Hs‡
AC
P FL
U
PHE
AN
T FL
A
PYR
B
AA
C
HR
B
BF
BK
F B
AP
DA
A
BG
P IP
B
asid
iom
ycot
a B
. ad
usta
22
11
10
9 61
34
9 26
0 12
1 14
1 10
1a
47a
82a
17
26a
33a
G. t
rabe
um
14
12
72
45a
270a
22
4a
109a
12
2a
89a
41a
65a
14a
23a
29a
H.
prae
term
issu
m
24
19
106
65
331
249a
12
5 13
8 99
a 45
a 76
a 16
25
a 32
a I.
lact
eus
18
15
89
6435
827
8 13
9 15
711
5 52
86
a 19
30
38
P
. chr
ysos
pori
um
18
16
101
59
327
250a
12
4 13
8 95
a 44
a 76
a 15
a 23
a 30
a P
. sor
dida
21
17
10
6 64
34
3 26
2 12
9 14
3 10
6 48
a 83
a 17
38
35
a P.
bre
visp
ora
16
14
82
49a
310a
24
7a
121a
13
6a
95a
43a
75a
15a
24a
31a
P. s
ubse
rial
is
26
22
129
74
402
309
149
166
125
57
107
20
36
45
P. p
lace
nta
21
16
104
62
336
253
126
143
105
48a
86a
17
29
36a
S.
brin
kman
nii
21
19
104
63
346
267
128
143
103a
47
a 85
a 16
28
a 35
a T.
ver
sico
lor
23
20
125
67
371
278
134
149
101a
46
a 84
a 16
a 25
a 32
a M
itosp
oric
Asc
omyc
ota
A.
alte
rnat
a 21
20
11
0 57
31
0a
24a
116a
13
0a
93a
43a
77a
15a
25a
32a
A. c
uboi
dea
37b
32b
186b
94
46
3 32
5 15
3 16
8 10
6 49
91
16
a 25
a 32
a C
. re
sina
e (A
TCC
666
86)
18
15
86
5la
30
8a
243a
12
2a
136a
10
1a
46a
81e
18
29
36a
C. r
esin
ae (P
-545
) 19
16
10
4 57
35
6 27
8 13
8 15
5 11
3 52
89
a 20
31
40
P
. uar
iotii
26
22
11
7 67
33
3 24
8a
121a
13
5a
96a
43a
72a
15a
23a
30a
S. c
irci
natu
m (
AT
CC
664
63)
22
18
94
53a
269a
20
7a
99a
110a
75
a 35
a 61
a 12
a 17
a 23
a S.
cir
cina
tum
(A
TC
C 6
6464
) 15
13
80
50
a 30
9a
266a
13
4 15
0 12
1 55
94
21
35
44
S.
lig
nico
la
25
18
110
59
373
291
141
158
115
52
87a
20
32
40
Con
trol
23
20
111
77
423
326
159
177
134
62
116
22
38
48
Init
ial
194b
13
9b
791b
32
2b
1497
b 10
11b
507b
5
63
b 4
08
b
186b
35
5b
69b
112b
14
2b
§ Mea
ns w
ithin
col
umns
fol
low
ed b
y an
a o
rb a
re s
igni
fican
tly l
ess
or g
reat
er,
resp
ectiv
ely,
tha
n th
e co
ntro
l as
det
erm
ined
by
Fish
er’s
pro
tect
ed l
east
si
gnifi
cant
diff
eren
ce m
ultip
le c
ompa
rison
pro
cedu
re (
a =
0.0
5).
† Abb
revi
atio
ns:
Ace
napt
hene
(A
CP)
, Fl
uore
ne (
FLU
), Ph
enan
thre
ne (
PHE)
, A
nthr
acen
e (A
NT)
, Fl
uora
nthe
ne (
FLA
), Py
rene
(PY
R),
Ben
zo[a
]ant
hrac
ene
(BA
A),
Chr
ysen
e (C
HR
), B
enzo
[b]f
luor
anth
ene
(BB
F),
Ben
zo[k
]flu
oran
th
ene
(BK
F),
Ben
zo[a
]pyr
ene
(BA
P),
Dib
enzo
[a,h
]ant
hrac
ene
(DA
A),
Ben
zo[g
,h,i ]
pery
lene
(B
GP)
, and
Ind
eno[
1,2,
3-c,
d]py
rene
(I
P).
† Ini
tial
valu
es a
re f
rom
non
-inoc
ulat
ed c
reos
ote-
treat
ed w
ood
at t
he s
tart
of t
he e
xper
imen
t. C
ontro
l va
lues
are
fro
m c
reos
ote-
treat
ed w
ood
whi
ch w
as
amen
ded
with
hal
f th
e ag
ar f
rom
a s
teril
e PD
A p
late
. Th
e co
ntro
l tre
atm
ent
cont
aine
d tw
o co
ntam
inan
t fu
ngi
whi
ch w
ere
iden
tifie
d as
Cur
vula
ria
sp.
and
Alte
rnar
iaal
tern
atat

454 LAMAR ET AL.
representative soil samples, are employed to select the best fungus to use on a particular soil. Because of the laborious and time-consuming nature of these studies, the number of fungi that can be evaluated is limited and results do not yield information on what biochemical, physiological, and/or ecological attributes are responsible for superior bioremediation performance.
Much of the knowledge of the biochemistry and physiology of pollutant degradation by white-rot fungi has been generated from experiments in which the degradation of a pollutant by a fungus grown in defined aqueous media is deter-mined or by evaluating the activity of crude extracts or purified enzymes from aqueous fungal cultures on various pollutants in in vitro experiments. While providing valuable insights into the biochemistry and physiology of pollutant degradation by selected fungi, the applicability of the results of the results of aqueous culture work to complex environments like polluted soils, is questionable. This is because of the complex effects of physiochemical and biological soil factors on both the fungus, its pollutant-degrading system, and the pollutant. For example, in the present work, neither percent mineralization of PCP in liquid culture ( r2 = 0.276, P = 0.0536) or mineralization efficiency (r2 = 0.168, P = 0.146) of basidiomycetes correlated well with their abilities to decrease the concentration of PCP in soil. Thus these attributes were not useful for predicting bioremediation performance of these organisms in the PCP-contaminated Marshan soil. Phanerochaete chrysosporium was found to convert PCP in soil to primarily nonvolatile products, both soil bound and extractable, whereas loss via mineralization was negligible (Lamar et al., 1990). If the fate of PCP in soils inoculated with other white-rot fungi is similar to that in soils inoculated with P. chrysosporium it is not surprising that the ability of a fungus to mineralize PCP in aqueous media does not necessarily correlate well with its ability to degrade PCP in soil. Measurement of the activities of fungal enzymes in aqueous culture (Lin et al., 1991; Okeke et al., 1994), disappearance of pollutants (Lin et al., 1991; Fletcher et al., 1994) and decolorization of various dyes (Lin et al., 1991; Fletcher et al., 1994 Field et al., 1993) also have been suggested as corollaries of fungal degradative abilities. In particular the activities of Lips, MnPs, and laccases associated with the ligninolytic system of white-rot fungi and with pollutant degradation by these organisms have been measured, however, white-rot fungi have been shown to produce different combinations of ligninolytic enzymes and to produce different sets of isozymes of the same enzyme, when grown in different media. For example, P. chrysosporium produced different LiP mRNA transcripts in soil compared with those produced in liquid media (Lamar et al., 1995). Therefore, transformation and mineralization abilities in aqueous media may have little potential for predicting degradative abilities in contaminated soils.
In addition to a demonstrated ability to degrade a contaminant, two factors that do show potential for predicting bioremediation performance, at least for degradation of PCP by white-rot and brown-rot basidiomycetes, are hyphal extension rate and sensitivity to contaminant. The three most effective strains for removal of PCP from the Marshan soil, P. sordida, P. chrysosporium and I. lacteus (Table 17-6), all had rapid hyphal extensions rates and high tolerances to PCP, relative to the other tested basidiomycetes. Although T. versicolor and B. adusta possessed rapid growth rates (Table 17-2) and superior abilities to mineralize PCP in liquid culture (Table 17-4). they were both extremely sensitive to

SCREENING OF FUNGI 455
the presence of the chlorophenol (Table 17-3) and were only intermediate in their relative abilities to decrease the concentration of PCP in soil (Table 17-6).
The soil remediation potential of dueteromycetous fungi has not been evaluated previously. As a group, they varied greatly in their ability to transform PCP (Benoit-Guyd et al., 1994) and in general were more tolerant of PCP than were basidiomycetes as shown in the present work (Table 17-3) and by Zabel et al. (1985); however, despite a general greater tolerance to PCP, the dueteromycete strains that decreased the soil PCP concentration by the greatest percentages, C. resinae, P. dimorphospora, and P. heteromorpha, were not as effective as the most competent basidiomycetes (Table 17-6). Also, in contrast to the basidiomycetes, neither relative sensitivity to PCP or growth rate were related to the ability of deuteromycetes to deplete PCP in soil. Cladosporium resinae (ATCC 66686) was not very tolerant of PCP and like most of the dueteromycetes, grew very slowly. Therefore, characteristics that prove to be valuable for predicting the bioremediation performance of an ecological group, such as white-rot fungi, may have little or no value for predicting the performance of fungi from other groups.
For degradation of PAHs in wood, tolerance to contaminant and hyphal extension rate were not useful for predicting the contaminant-degrading ability of a fungus. The most effective fungi for degrading PAHs in wood were the brown-rot basidiomycete, G. trabeum, particularly for the lower molecular weight PAHs, and the dueteromycete, S. circinatum (ATCC 66463). Both of these organ-isms possessed low hyphal extension rates and were sensitive to creosote. The usefulness of tolerance to contaminant and hyphal extension rate, in the present study, to predict the ability of basidiomycetes to deplete PCP in soil but not PAHs in wood illustrates that different attributes of fungal growth and pollutant-degrading abilites will be important under different conditions.
The results of the present work indicate that simple measures of contaminant-degrading ability or tolerance to a pollutant(s), while important, will not alone provide sufficient information for selection of fungi for use in bioaugmentation of contaminated soils. As was demonstrated in the present work for P. sordida, one fungus may be a superior performer under one set of contaminant-media conditions (e.g., PCP-contaminated soil) and be average or mediocre under another set of conditions (e.g., creosote-treated wood). More information on the bioremediation performance of well characterized fungi on soils that represent a range of soil physical, chemical, and biological characteristics and pollutants is necessary to build a data base of information from which to base selection of superior fungal strains to evaluate for application to specific contaminant-media conditions.
Such a data base would ideally include fungal characteristics such as growth rates, growth temperature ranges and optima, sensitivities to and abilities to degrade specific contaminants, bioremediation performance in well characterized media and relative competitive abilities. The later is a key factor that has been almost completely ignored in the evaluation of fungi for use in bioaugmentation. The ability of a fungus to colonize a contaminated soil volume and to execute contaminant degradation with little or minimal effects from indigenous microbes is at least as important as the ability to degrade the contaminant. Important media characteristics would include pH, levels of available nutrients, particularly C and N, identification of contaminants and their concentrations and identification of indigenous microbial populations. More information on the performance of fungi

456 LAMAR ET AL.
under well characterized contaminant-media conditions, may allow the identification of general attributes that will permit the efficient selection of appropriate fungi for use under specific contaminant-media conditions. Therefore future stud-ids concerned fungal contaminant degradation in complex media should be designed with additional purpose of adding information to such data base.
REFERENCES

Bioremediationof Contaminated
Soils
Coeditors D.C. AdrianoJ.-M. Bollag
W.T. Frankenberger, Jr.R.C. Sims
Managing Editor: David M. Kral
Associate Editor: Marion K. Viney
Editor-in-Chief ASA Publications: J. L. Hatfield
Editor-in-Chief CSSA Publications: J. J. Volenec
Editor-in-Chief SSSA Publications: J. M. Bigham
Number 37 in the series
AGRONOMY American Society of Agronomy, Inc.
Crop Science Society of America, Inc Soil Science Society of America, Inc.
Madison, Wisconsin, USA
1999