screening fungi for thermostable phytases and …
TRANSCRIPT

SCREENING FUNGI FOR THERMOSTABLE PHYTASES AND
COMPARING THE THERMO STABILITY OF A CURRENT PHYTASE
PRODUCED UNDER LIQUID CULTURE AND SOLID SUBSTRATE
CULTURE CONDITIONS
Submitted in partial fulfilment of the
requirements for the degree
Department of Animal and Wildlife Sciences
Faculty of Biological and Agricultural Sciences
©© UUnniivveerrssiittyy ooff PPrreettoorriiaa
CONTENTS:
Chapter 1 LITERATURE REVIEW.1.1. Introduction 8
1.2. Phytic acid 8
1.3. Phosphorus pollution 10
1.4. Phytase 12
1.5. Phytase source 13
1.6. Phytase supplementation 14
1.7. Evaluating supplementary phytase 15
1.8. Factors affecting supplementation response 16
1.8.1. Calcium, phosphorous and cholecalciferol interactions 17
1.8.2. Influence of dietary energy 18
1.8.3. Influence of animal factors 19
1.8.4. Influence of pelleting on phytase activity 21
1.9. Conclusion 23
Chapter2 MOTIVATION.
2.1. Introduction
2.2. Phytase research project
PHASE I SEARCH FOR A THERMOSTABLE PHYTASE
Chapter 3 FUNGAL SCREENING STUDY.
3.1. Introduction 29
3.2. Materials and methods 30
3.2.1. Source of organisms 30
3.2.2. Preparation of the slant culture 30
3.2.3. Preparation of the broth culture 30
3.2.4. Preparation and inoculation of solid substrate flask cultures 31
3.2.5. Enzyme extraction 32
3.2.6. Enzyme assay 323.3 Results 333.4. Discussion 34
3.5. Conclusion 35
PHASE II THERMO STABILITY OF TWO COMMERCIAL PHYTASES
Chapter 4 BROILER TRIAL.
4.1. Introduction
4.2. Materials and methods
4.2.1. Broiler source
4.2.2. Vaccination
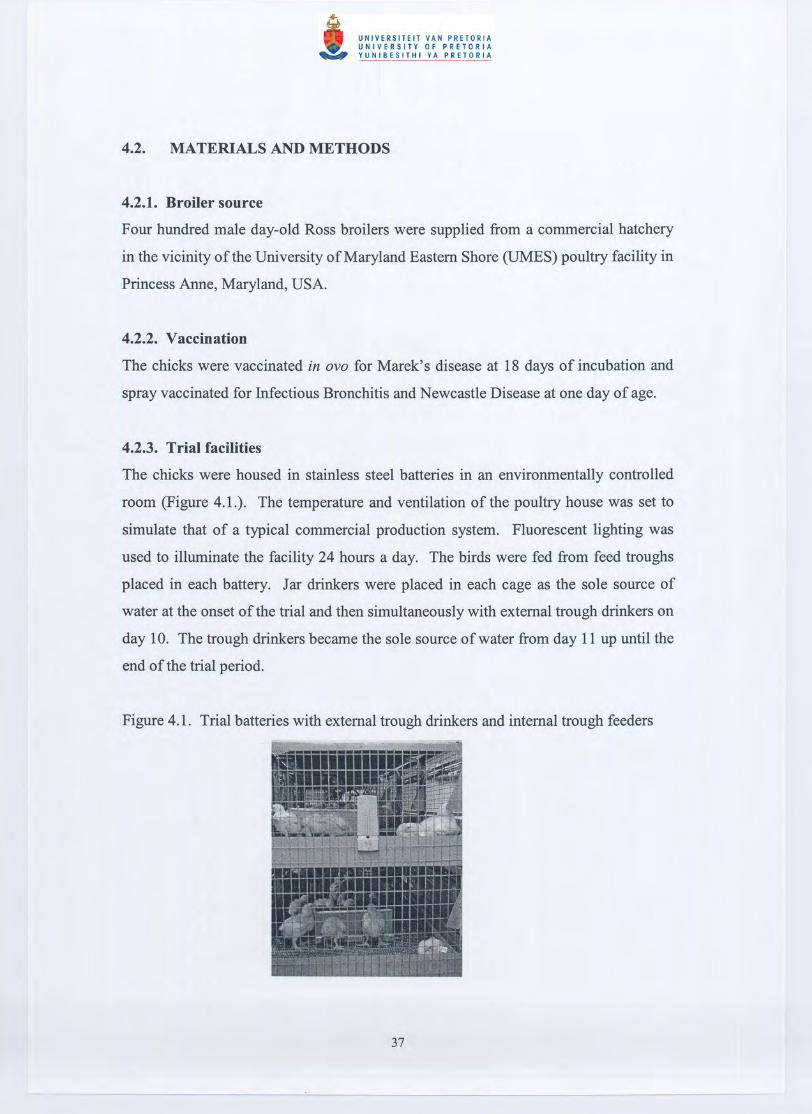
4.2.3. Trial facilities
4.2.4. Bird allotment
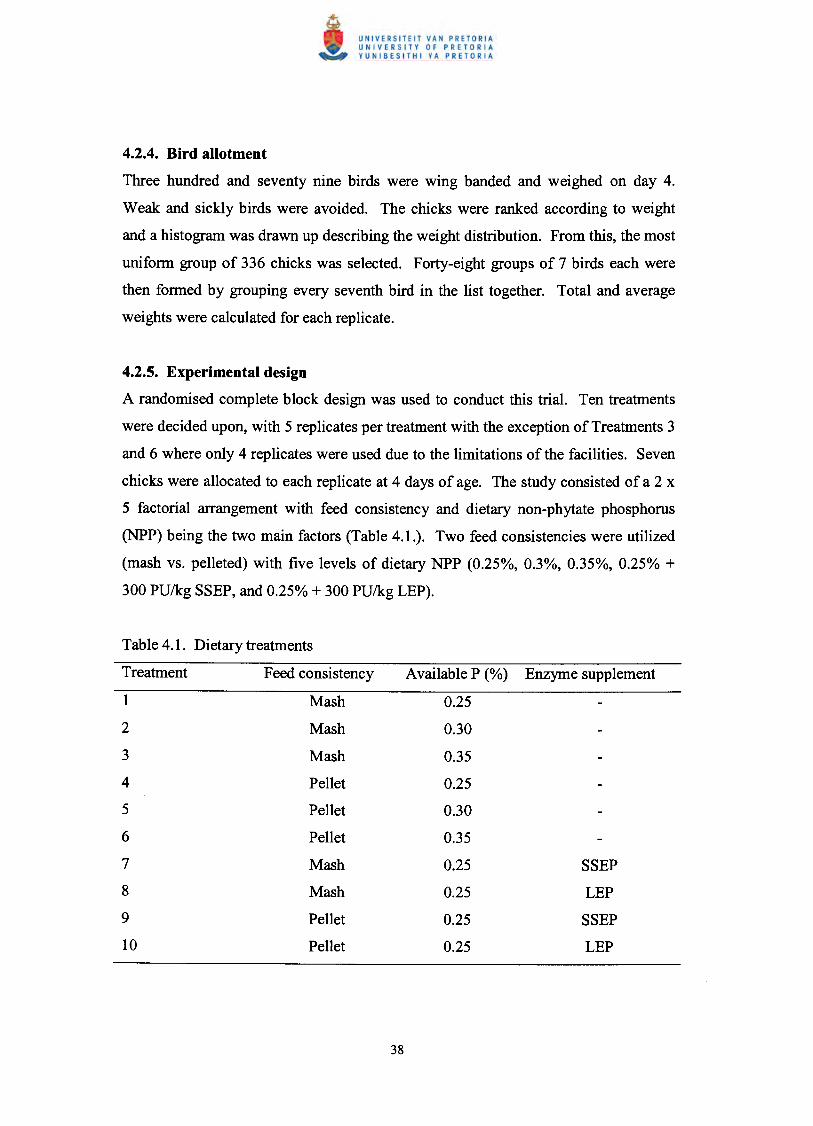
4.2.5. Experimental design
4.2.6. Experimental diets
4.2.7. Variables monitored
4.2.8. Determination of phosphorus equivalency values for phytase
4.2.9. Determination of phytase activity in feed
4.2.10. Determination of phosphorus digestibility
4.2.11. Statistical analysis
4.3. Results
4.3.1. Growth results (days 4 - 18)
4.3 .1.1. Average weight gain (g/bird)
4.3 .1.2. Average feed intake (g/bird)
4.3.1.3.
4.3.2.
4.3.2.1.
4.3.2.2.
4.3.2.3.
4.3.3.
4.3.4.
4.3.5.
4.4.
4.4.1.
4.4.2.
4.4.3.
4.4.4.
Feed conversion ratio (gain/feed)
Production results (days 4 - 18)
Percent bone ash
Percent toe ash
Bone breaking strength (kg)
In vitro assay results
Phosphorus equivalency values for phytase
Phosphorus digestibility
Discussion
Growth response
Production response on mash diets
Production response on pelleted diets
In vitro testing vs. animal response

4.4.6. Phosphorus digestibility 69
4.5. Conclusion 70
4.6. Critical evaluation 72
4.7. Future research proposals 73
Chapter 5 GENERAL CONCLUSIONS. 74
Chapter 6 REFERENCES. 75
List of Tables:
Table 1.1. Effects of dietary phosphorous on the levels of phosphorous
faecal excretion 11
Table 1.2. Phytase activity of pelleted feed produced under various
pelleting conditions 22
Table 3.1. Propagation guidelines for fungal cultures 31
Table 3.2. Phytase yield for six varieties of fungi cultivated under solid
substrate culture conditions 33
Table 4.1. Dietary treatments 38
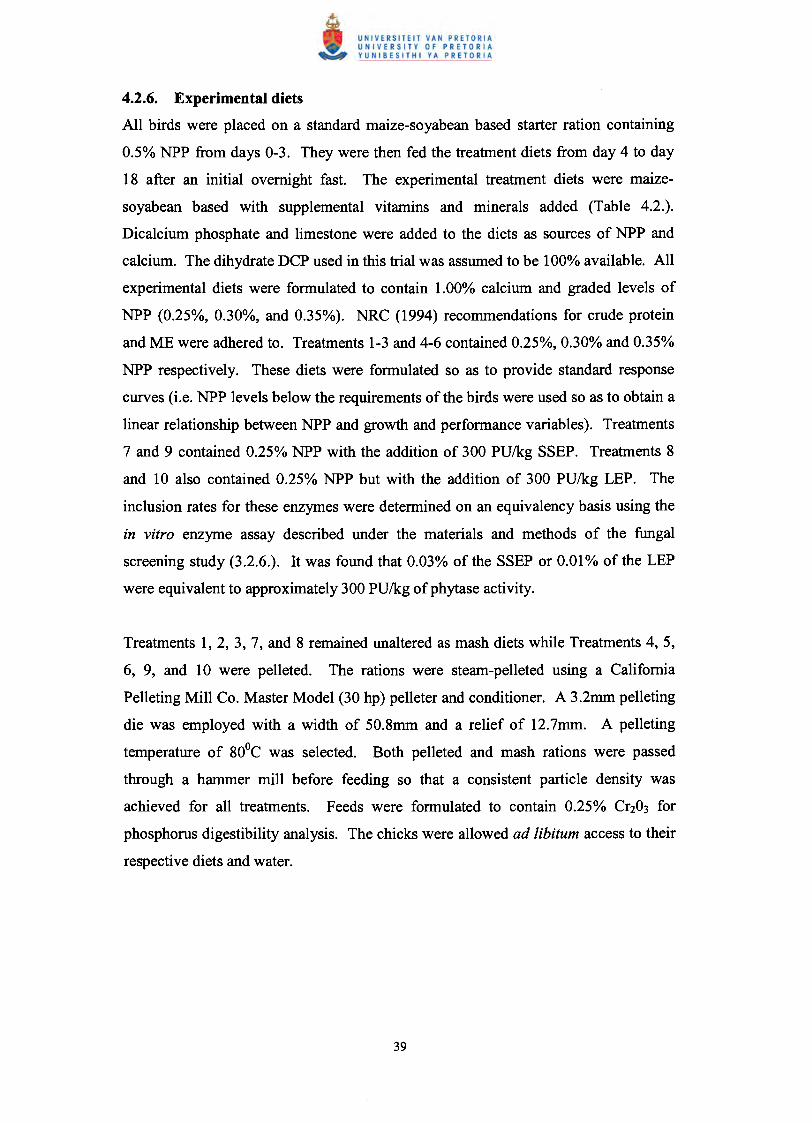
Table 4.2. Composition and calculated analysis of experimental diets 40
Table 4.3. Least Square Means for average weight gains (gibird) for
the mash and pelleted treatments (P = 0.0099) 47
Table 4.4. Least Square Means for average weight gain (gibird)
over the different levels of non-phytate phosphorus 47
Table 4.5. Least Square Means for average feed intake (gibird)
for the mash and pelleted treatments (P = 0.0475) 48
Table 4.6. Least Square Means for average feed intake (gibird)
over the different levels of non-phytate phosphorus 48
Table 4.7. Least Square Means for the gain/feed ratio for the
mash and pelleted treatments (P = 0.7391) 49
Table 4.8. Least Square Means for the feed/gain ratio
over different levels ofNPP 49
Table 4.9. Percent bone ash of broilers fed two different sources
of phytase with and without pelleting 50
Table 4.10. Percent toe ash of broilers fed two different sources
of phytase with and without pelleting 52
Table 4.11. Bone breaking strength (kg) of broilers fed two different
sources of phytase with and without pelleting 54
Table 4.12. Linear response equations for the percent toe and bone ash
and bone breaking strength measurements over mash and
pelleted maize soyabean diets 57
Table 4.13. Calculated phosphorus equivalency values for mash and
pelleted diets supplemented with 300PUlkg of SSEP phytase 58

Table 4.14. Calculated phosphorus equivalency values for mash and
pelleted diets supplemented with 300PUlkg ofLEP phytase 59
Table 4.15. Percentage total phosphorus digestibility of broilers fed
two different sources of phytase with and without pelleting 60
List of Figures:
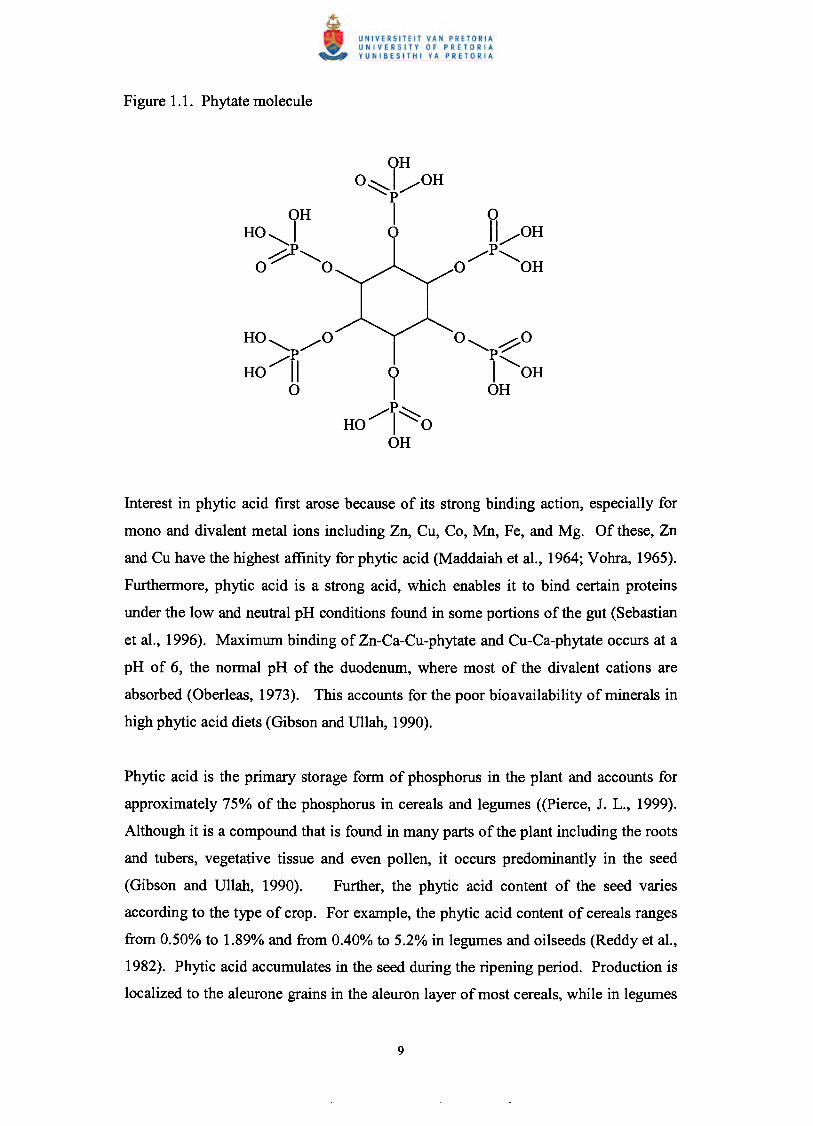
Figure 1.1. Phytate molecule 9
Figure 4.1. Trial batteries with external trough drinkers and
internal trough feeders 37
Figure 4.2. Bone breaking strength determination using the
Instron machine 41
Figure 4.3. Inverse regression description 43
Figure 4.4. Estimating NPP released by 300PUlkg SSEP on
mash with 95% fiducial limits from % bone ash 44
Figure 4.5. Effects ofpelleting and phytase source on % bone ash 51
Figure 4.6. Effects ofpelleting and phytase source on % toe ash 53
Figure 4.7. Effects ofpelleting and phytase source on bone breaking
strength 55

1.1. INTRODUCTION
Phosphorus is the second most abundant mineral in the body accounting for over one-
fourth of the total minerals present. It is essential in many organic compounds
including nucleotides such as ATP, nucleic acids, phospholipids and a myriad of other
compounds needed for metabolism. It also plays a part in almost every biochemical
pathway in the body. However, only 20% of the body's phosphorus is found in the
soft tissues where these reactions take place. The remaining 80% is found in the bone
matrix (Pierce, J. L., 1999).
A phosphorus deficiency can lead to a number of disorders such as rickets, a
reduction in bone mineralization, reduced egg production and decreased feed intake.
It is for this reason that an adequate supply of dietary phosphorus must be supplied to
the animal. This is of special importance for monogastric animals, as they do not
possess the enzymes necessary to release inorganic phosphorus from phytic acid, the
organic molecule that binds most phosphorus. Ruminants, however, are able to take
advantage of this source of phosphorus through an abundance of microbial enzymes
produced in the rumen (Pierce, J. L., 2000).
1.2. PHYTIC ACID
Phytic acid is the compound that accounts for the primary source of phosphorus and
inositol in plant seeds that are used as feed ingredients ((Pierce, J. L., 1999). Phytic
acid consists of an inositol nucleus with six radicals (Figure 1.1.). It exists as phytate
(myo-inositoll,2,3,4,5,6-hexakisphosphate), a complex salt, in plant tissue where it is
deposited as globular inclusions in single-membrane storage microbodies in the seed
(Raboy et aI., 1990).
I...........-P:::::-.....
HO I~oOH
Interest in phytic acid first arose because of its strong binding action, especially for
mono and divalent metal ions including Zn, Cu, Co, Mn, Fe, and Mg. Of these, Zn
and Cu have the highest affinity for phytic acid (Maddaiah et aI., 1964; Vohra, 1965).
Furthermore, phytic acid is a strong acid, which enables it to bind certain proteins
under the low and neutral pH conditions found in some portions of the gut (Sebastian
et aI., 1996). Maximum binding of Zn-Ca-Cu-phytate and Cu-Ca-phytate occurs at a
pH of 6, the normal pH of the duodenum, where most of the divalent cations are
absorbed (Oberleas, 1973). This accounts for the poor bioavailability of minerals in
high phytic acid diets (Gibson and Ullah, 1990).
Phytic acid is the primary storage form of phosphorus in the plant and accounts for
approximately 75% of the phosphorus in cereals and legumes ((Pierce, J. L., 1999).
Although it is a compound that is found in many parts of the plant including the roots
and tubers, vegetative tissue and even pollen, it occurs predominantly in the seed
(Gibson and Ullah, 1990). Further, the phytic acid content of the seed varies
according to the type of crop. For example, the phytic acid content of cereals ranges
from 0.50% to 1.89% and from 0.40% to 5.2% in legumes and oilseeds (Reddy et aI.,
1982). Phytic acid accumulates in the seed during the ripening period. Production is
localized to the aleurone grains in the aleuron layer of most cereals, while in legumes
and oil-seeds, the majority ofphytic acid production takes place in the endosperm and
cotyledons. The exception to the typical monocot localization patterns is maize where
88% of the phytic acid is found in the germ as opposed to the aleuron layer (Gibson
and Ullah, 1990).
The role of phytic acid in the plant is, first and foremost, one of storage so that
accumulated phosphorus can be liberated during germination and incorporated into
ATP. However, recent studies have also implicated phytic acid as an intermediate in
a number of cell transport systems «Pierce, J. L., 1999). Further, inositol
intermediates are thought to act as secondary messengers in plant and animal cells.
Other possible physiological roles of phytic acid include its use as an energy source
and an initiator of dormancy (Gibson and Ullah, 1990).
1.3. PHOSPHORUS POLLUTION
Plant material is the predominant ingredient in the diets of pigs and poultry. These
monogastric animals are unable to utilize the phytic acid present, which makes up
approximately two thirds of the available phosphorus in most plant feedstuffs.
Endogenous phytase does exist within the gut, however it is not produced in sufficient
quantities to be of any benefit to the animal. Microbes in the large intestine and
caecum of the pig and chicken also produce phytase, but again this is of little
significance to the animal as it is too late in the gut for most of the inorganic
phosphorus released to be absorbed. It is for these reasons that phytic acid is, for all
intense and purposes, unavailable to the animal. A number of publications place the
phosphorous availability estimates for pigs and poultry in the range of between 10 and
30% for a maize soyabean diet (Nelson, 1967; Calvert et aI., 1978; Jongbloed and
Kemme, 1990).
It therefore becomes necessary for the producer to supplement the diet with inorganic
phosphorus in order to avoid a deficiency. However, this leads to the problem of
excessively high levels of phosphorus entering the environment, especially under
intensive production. It is for this reason that both the swine and poultry industries
have drawn sharp criticism for their role in phosphorus contamination of water
systems. Cromwell (1999) surveyed a number of feed manufacturers and found that
they commonly included between 20% and 30% more phosphorus in the feed for pigs
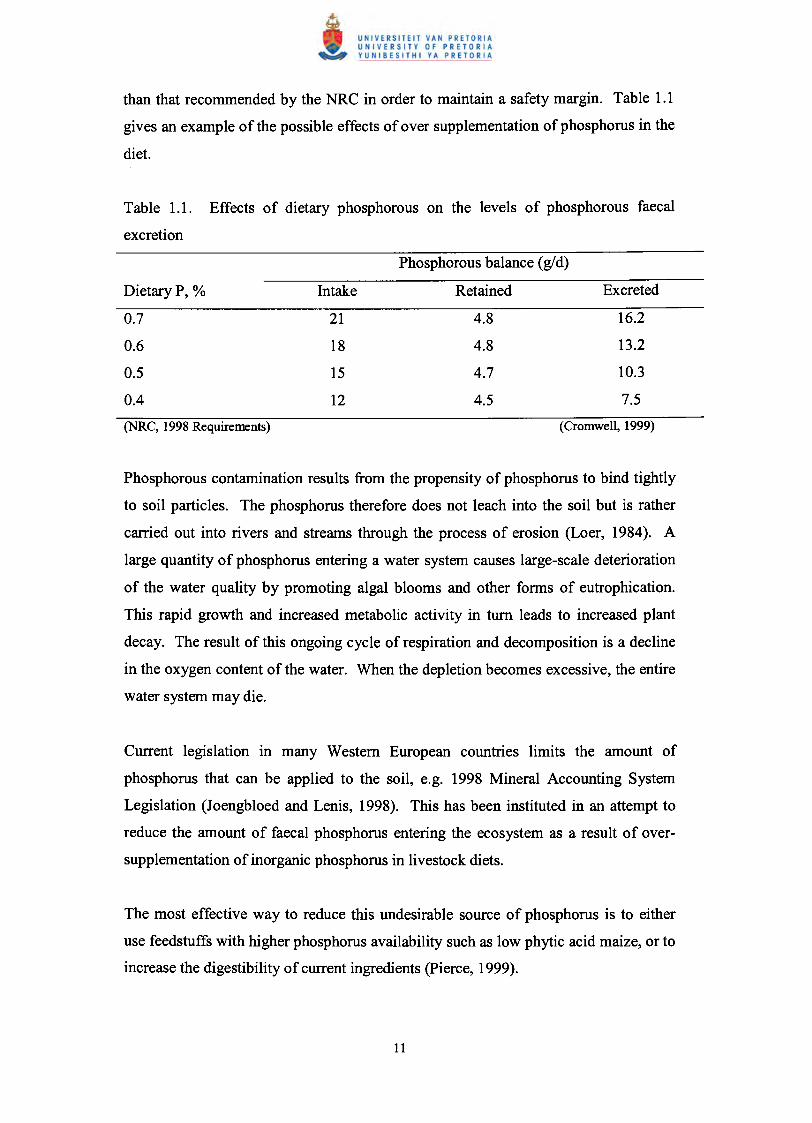
than that recommended by the NRC in order to maintain a safety margin. Table 1.1
gives an example of the possible effects of over supplementation of phosphorus in the
diet.
Table 1.1. Effects of dietary phosphorous on the levels of phosphorous faecal
excretion
Phosphorous balance (gld)
DietaryP, % Intake Retained Excreted
0.7 21 4.8 16.2
0.6 18 4.8 13.2
0.5 15 4.7 10.3
0.4 12 4.5 7.5(NRC, 1998 Requirements) (Cromwell, 1999)
Phosphorous contamination results from the propensity of phosphorus to bind tightly
to soil particles. The phosphorus therefore does not leach into the soil but is rather
carried out into rivers and streams through the process of erosion (Loer, 1984). A
large quantity of phosphorus entering a water system causes large-scale deterioration
of the water quality by promoting algal blooms and other forms of eutrophication.
This rapid growth and increased metabolic activity in turn leads to increased plant
decay. The result of this ongoing cycle of respiration and decomposition is a decline
in the oxygen content of the water. When the depletion becomes excessive, the entire
water system may die.
Current legislation in many Western European countries limits the amount of
phosphorus that can be applied to the soil, e.g. 1998 Mineral Accounting System
Legislation (Joengbloed and Lenis, 1998). This has been instituted in an attempt to
reduce the amount of faecal phosphorus entering the ecosystem as a result of over-
supplementation of inorganic phosphorus in livestock diets.
The most effective way to reduce this undesirable source of phosphorus is to either
use feedstuffs with higher phosphorus availability such as low phytic acid maize, or to
increase the digestibility of current ingredients (Pierce, 1999).
1.4. PHYTASE
Phytase (myo-inositol hexaphosphate phosphohydrolases) is the name given to a
number of enzymes that catalyze the stepwise removal of orthophosphate from phytic
acid (myo-inositol 1,2,3,4,5,6-hexakisphosphate). These enzymes are unique in that
they hydrolyze phosphate from phytic acid as well as from a variety of natural and
synthetic phosphorylated substrates (Gibson and Ullah, 1990).
The International Union of Pure and Applied Chemistry and the International Union
of Biochemistry (UIPAC-IUB) recognize two classes of phytase. The 3-phytase
found in microorganisms and animals, and the 6-phytase found in higher plants. The
3-phytase-enzyme removes orthophosphate from 1, 2, 3, 4, 5, 6, hexakisphosphate
and lower inositol phosphates in a stepwise fashion from the 3-position of phytic acid,
while 6-phosphate starts removing orthophosphate from the 6-position (pierce, 1999).
Characterization of fungal 3-phytase and plant 6-phytase has revealed that they have
very little in common apart from similar pH and temperature optima. Fungal phytase
has a much higher turnover number for phytic acid compared to the soyabean
phytases tested (Gibson and Ullah, 1990).
The phytase most commonly used to supplement animal feed is a fungal 3-phytase.
This phytase has two pH optima, the first at 2.5 where it reaches approximately 60%
of its potential activity and the second at 5.5 where it functions at 100% of its
potential activity (Kies, 1996). The temperature at which hydrolysis is optimal is
between 55 and 58°C (Gibson and Ullah, 1990).
The phytase enzyme is highly specific for the phytic acid molecule. It cleaves
phosphorus from inositol far more readily than from other phosphorylated molecules
by a process referred to as the "Ping-Pong" mechanism. This is the term used to
describe how phosphate is first transferred from phytic acid to the enzyme and then
from the enzyme to water. It is therefore a reaction that requires an aqueous
environment (Kies, 1996).
Phytase supplementation of monogastric animals is a means by which the digestibility
of the indigestible phosphorus fraction of a feed can be improved. The role of phytase
is three-fold. Firstly, to reduce feed costs by reducing the need to supplement with
inorganic phosphorus. This includes that phosphorus supplied by animal protein
sources. Secondly, to release metal-ions and proteins bound to phytic acid to be
absorbed and thirdly, to reduce the burden of high levels of phosphorus on the
environment (pierce et aI., 2000).
A number of studies have been conducted to determine the effect of phytase on the
availability of phytic acid phosphorus as well as nitrogen retention in monogastric
animals. There is a good deal of variation between these studies, however most come
to the same general consensus: that phytase does substantially improve phosphorus
absorption and utilization (Broz et aI., 1994; Cantor., 1998; Davis., 1970; De Bryne.,
2000; Gadien., 1998; Gerber and Wenk, 1998; Gibson and Ullah, 1990; Inborr and
Bedford, 1994; Joengbloed and Kemme, 1990; Joengbloed et aI., 1992; Kemme et aI.,
1997; Kiisskinen and Piironen, 1990; Leske and Coon, 1999; Mitchell and Edwards,
1996; Mitchell and Edwards, 1996; Morz et aI., 1994; Nelson et aI., 1971; Orban et
aI., 1999; Qian et aI., 1997; Sebastian et aI., 1996; Simons et aI., 1990; Sohail and
Roland, 1999; Verschoor, 1990; Yi et aI., 1996 and Zanini and Sazzad, 1999).
The existence of naturally occurring plant phytases has been an established fact for
many years. These were the only practical source of the enzyme until production of
microbial phytase improved. Feeding cereals rich in phytase such as wheat, rye,
triticale and their by-products is an effective means of improving the utilization of
phytic acid phosphorous. Phosphorous availability in wheat is four or five times
higher than that of maize due to the differences in endogenous phytase present
(Coffey, 1994). The problem with plant phytase is its relatively low level of activity.
Fungal phytase production has only recently reached the levels of efficiency required
to make large-scale commercial production a reality. Improvements in techniques
have allowed for the widespread use ofthe enzyme in the pig and poultry industry.
1.5. PHYTASE SOURCES
Phytases have been detected III most varieties of organIsm including plants,
microorganisms and a number of animal tissues.
Phytase occurs in a number of the higher order plants such as rice, wheat, maize, rye,
soyabean, castor bean, and other leguminous oil seeds and in a number of vegetative
tissues including orange juice, tobacco, spinach leaves and a number of roots and
tubers (Nayini and Markakis, 1986). However, it is in the seed that most phytase is
found. Levels of phytase are generally low in ungerminated seeds increasing rapidly
as germination progresses. This increasing enzyme activity is associated with a
concomitant decrease in phytic acid. Very large increases in phytase have been
detected. Maize seeds demonstrate a 200% increase in phytase activity during
germination (Chang, 1967) and some varieties of pea show an increase ranging from
800 to 3000% over the first five days of germination (Chen and Pan, 1977). There is
still uncertainty as to whether phytase is produced in the growing seed or whether
synthesis is triggered by phosphorus depletion during the process of germination
(Gibson and Ullah, 1990).
Most of the 6-phytases that are found in higher plants have a pH optimum of between
5.0 and 5.6 and an optimum temperature in the range of 45 to 60°C. The Km(substrate concentration that gives a reaction velocity equal to one-half the maximum
velocity) for these enzymes lies between 2.22 x 10⁻⁴to 0.99 x 10⁻³ mM (Wodzinski
and Ullah, 1996).
Most of the microbial phytase work has been concentrated on filamentous fungi as
few bacteria are capable of synthesizing phytase in significant quantities
extracellularly. This, combined with the fact that bacterial phytase has a pH optimum
that is neutral to alkaline, limits the use of this source of phytase as a feed additive
«pierce, J. L., 1999).
The prospect of using filamentous fungi as a source of phytase has been well
researched and exploited. Extensive screening for phytase activity has revealed that
phytase production is highest in Aspergilli (Shieh and Ware, 1968; Howson and
Davis, 1983). The most prolific producer of extracellular phytase found to date is the
strain A. niger 3135. This strain produces a phytase with two pH optima; one of 5.5
and the other of around 2.0 and a temperature optimum of between 50 and 55°C.
1.6. PHYTASE SUPPLEMENTATION
Phytase supplementation can substantially improve apparent phosphorus availability
and therefore reduce the quantity of total phosphorus in the excreta. This improved
utilization of dietary phosphorus is the primary reason for the superior growth and
performance of animals fed phytase on low phosphorus diets. Orban et al. (1999)
investigated the effect of feeding microbial phytase to White Pekin ducks between 3
and 6 weeks of age. They were able to demonstrate a linear increase in feed intake
when low phosphorus diets were supplemented with dietary phytase. Furthermore,
weight gain showed a quadratic response to the increased non-phytate phosphorus. It
was concluded that supplementary phytase could reduce the requirement for inorganic
phosphorus to the extent that it would become unnecessary to provide such
phosphorus to meet the growth and performance requirements of ducks during the
finisher phase (3-7 weeks).
Broz et al. (1993) also demonstrated a dose response pattern between chick
performance and phytase supplementation on a low phosphorus diet. They were able
to show significant gains in both growth rate and food intake with increasing levels of
phytase (125, 250, or 500 PU/kg). This was attributed to improved phosphorus
availability. Of significance is the fact that only moderate improvements in feed
conversion were noted. These results are in agreement with research conducted by
Kiiskinen and Piironen (1990) with leghorns and Sebastian et al. (1996) as well as
Zanini and Sazzad (1999), again with broilers.
Simons et al. (1990) recorded similar results with their broiler experiments. However,
they differed with regards to feed conversion response to phytase supplementation.
They found that the addition of phytase to the diet improved feed conversions up until
2 weeks of age. This improvement decreased over the next two weeks so that, at 4
weeks of age, no significant response could be detected. Reasons for this
phenomenon remain unclear, however it was postulated that phosphorus requirements
at 4 weeks of age are much lower than phosphorus requirements at 2 weeks. The
birds may also have become better adapted to utilizing phytic acid-phosphorus at thelater stage of growth.
1.7. EVALUATING SUPPLEMENTARY PHYTASE
The phosphorous released into the blood stream as a result of phytase
supplementation is partitioned between growth and bone mineralization. It is
therefore necessary to evaluate both growth performance and bone development
parameters. In poultry, bone ash, bone mineral content, bone density and bone
breaking strength have all been successfully employed to measure phosphorus
availability and bone mineralization response to phytase while body weight gain and
feed intake are powerful physiological indicators of plasma phosphorus
concentrations (Orban et al. 1999).
These growth and performance parameters have been used to establish equivalency
values for phytase on a number of diets for feed formulation purposes. Yi et al.
(1996) established inorganic phosphorus equivalency values for phytase by feeding
graded levels of phytase to broilers on soyabean meal-based semi-purified diets and
corn-soyabean meal-based diets. Body weight-gain and toe ash responses were used
to generate equations, which were then used to calculate equivalency values. The
results of these experiments gave average equivalency values of 1.146 U = Ig
phosphorus and 785 U = Ig phosphorus for the soybean meal-based semi-purified
diets and maize-soyabean meal-based diets respectively.
Leske and Coon (1999) used a bioassay to determine the effect of phytase on phytic
acid hydrolysis and phosphorus retention for a number of different feed ingredients
using broilers and layers. Each feed ingredient was included into the diet as the sole
source of phosphorus and the amount of phytic acid phosphorus hydrolysed recorded,
with and without the addition of supplementary phytase. This procedure is an
alternative to the more traditional methods described above. It has the advantage of
providing direct information about the effect of phytase on phytic acid phosphorous
utilization and retention while avoiding the mandatory two-week growth period. The
bioassay technique is also able to accurately quantify the retention of total phosphorus
in individual feedstuffs. This makes it possible to identify all those factors that affect
phytic acid retention enabling the accurate formulation of diets for phosphorus,thereby avoiding costly over-supplementation.

A number of factors may lead to the variability in animal response often associated
with phytase supplementation other than the variability in plant phytic acid
phosphorus and the different phytase sources already discussed.
1.8.1. Calcium, phosphorous and cholecalciferol interactions
The effectiveness with which phytase is able to improve the utilization of phytic acid
phosphorus and calcium is strongly influenced by the ratio of calcium to total
phosphorus (Ca:tP) (Qian et aI, 1996; Quamme, 1985; Wise, 1983; Pointillart et aI.,
1985; Qian et aI., 1997) and the level of cholecalciferol (vitamin D3) in the diet (Qian
et aI, 1996; Quamme, 1985; Wise, 1983).
The level of calcium in the diet is thought to be the most important factor to affect the
phytase supplementation response. Excess calcium causes an increase in the Ca:tP
ratio, which in turn results in increased binding of calcium to the available phytic acid
present, forming an insoluble complex which is less accessible to phytase (Qian et aI.,
1996). Quamme (1983) hypothesised that the relationship between increased calcium
and reduced phytase activity was as a consequence of an increased intestinal pH,
brought about by higher levels of calcium in the gut. The higher pH values decrease
the activity of supplementary phytases, which are most active at pH 2.5 and pH 5.5.
The pH also has a drastic effect on the active transport of phosphorus due to the
electrochemical nature of phosphorus uptake. Quamme (1985) reported that at pH 6.5
Na+ and H2P04- where transported across the intestinal wall at the same rate whereas
at pH 7.5 two sodium ions were transported for each phosphate ion. Wise (1983) and
Pointillart et aI. (1985) proposed another theory: that calcium is able to repress
phytase activity by directly competing for the enzyme's active site. However, this is
improbable as calcium and phosphorus have different charges and therefore different
binding affinities for the enzyme (Pierce, 1999). The level of non-phytate phosphorus
(NPP) in the diet is also of critical importance as the depressing effect of calcium is
far greater when NPP is low. Qian et aI. (1997) established that the maximum
response to phytase is achieved when the Ca:tP ratio was in the range of 1.1:1 to 1.4:1
for turkey poults.

Conversely, phytase may improve calcium absorption and retention by hydrolyzing
phytic acid. This releases calcium bound to phytic acid as well as other insoluble
salts. It appears that phytase supplementation improves the utilization ofN, P, Ca and
Zn on a percentage of intake basis by liberating these minerals from the phytic acid
molecule (Zanini and Sazzad, 1999). Phytase supplementation also increases the
concentration of calcium and zinc in the tibia (Zanini and Sazzad, 1999; Yi, 1995).
The vitamin D3 (cholecalciferol) status of the animal also plays a crucial role in the
utilization and retention of phosphorus in the body. Cholecalciferol enhances the
enterocytes of the small intestine facilitating the uptake of phosphorus and its
subsequent transport into the plasma compartment. This transport system appears to
be independent of the intestinal calcium transport system (Deluca et aI., 1989;
Edwards, 1993). However, the Ca:tP ratio of a diet does affect the efficacy with
which cholecalciferol enhances phytic acid phosphorus digestion (Qian et aI., 1997).
Mohammed et aI. (1991) demonstrated that by lowering dietary levels of calcium
while elevating cholecalciferol, greater utilization of phytic acid-phosphorus was
achieved thus reducing requirements for inorganic phosphorus. Qian et aI. (1997)
added cholecalciferol at high levels to the diets of birds and were able to enhance
calcium and phosphorus retention by 5 to 12 %.
Vitamin D3 appears to have an independent yet synergistic relationship with
supplementary phytase. This is emphasized by the superiority of the combination
treatment of phytase and D3 over either individual treatment on its own, suggesting
that a different mechanism of action is at work for each. Once phytic acid is
hydrolyzed by phytase, D3 then increases the uptake of the freed phosphorus possibly
by acting as a DNA replication ligand for the up regulation of phosphate transport
receptors (Quamme, 1985). There is also evidence that suggests that cholecalciferol
increases the intestinal phytase and alkaline phosphatase activity in chicks (Davies et
aI. 1996). Qian et aI. (1997) achieved the maximum response with supplemental
phytase when they fed it to broiler chicks at levels of 600-900 U of phytase/kg with
dietary Ca:tP ratios of 1.1: 1 to 1.4: 1, and a D3 level of 660flg/kg diet.
1.8.2. Influence of dietary energy
Zanini and Sazzad (1999) demonstrated that the AME content of the diet is positively
correlated to the excretion of N, P, Ca, and Zn and negatively correlated to the
concentration of phosphorus and calcium in the tibia. The lower absorption may be as
a result of the formation of insoluble complexes or soaps between these minerals and
free fatty acids. However, there are also strong interactions between phytase
supplementation and AME. This is supported by the fact that birds fed on a high
AME diet without supplemental phytase demonstrate a lower absorption of nutrients
as a result of the formation of insoluble salts. However, if supplementary phytase is
added to these high-energy diets, utilization of the above mentioned elements as a
percentage of intake is significantly improved and results in a higher percentage of
bone ash.
1.8.3. Influence of animal factors
Apart from the variation between different animal species in their ability to utilize
phytic acid phosphorus, variation exists between breeds and strains as well as between
animals ofthe same strain under similar or dissimilar physiological conditions.
The ability of poultry to utilize phytic acid-phosphorus has been well debated. The
capacity of birds to utilize this source of phosphorus depends upon a number of
factors which may include the bird's age, dietary fiber content, and the level and
source of calcium and phosphorus. This has led to much controversy over the degree
of utilization. Values vary from 0 % (Nelson, 1976; Matyka et aI., 1990) to 60 %
(Edwards, 1993; Mohammed et aI., 1991) to as high as 82 % (Temperton and Cassidy,
1964). This is further complicated by the fact that phosphorus utilization and
retention is enhanced in phosphorus deficient birds (Temperton and Cassidy, 1964;
Edwards and Ve1tmann, 1983).
Edwards (1982) conducted a study to determine the effect of breed and strain of
poultry on the utilization of phosphorus in diets that contain suboptimal levels of
phosphorus. It was established that broiler cockerel chickens utilize phosphorus less
efficiently than Single Comb White Leghorn cockerel chickens (SCWL) under low
phosphorus conditions thus suggesting that breed differences do exist.
Punna and Roland (1999) investigated the variation in the ability of individual birds
within the same broiler strain to utilize phytic acid-phosphorus by feeding male
broilers a phosphorous deficient diet from day-old to four weeks of age. Livability,
feed consumption, growth rate, and bone quality were used as test parameters. Faeces
collection after Week 2 and Week 4 revealed that those birds which demonstrated
normal growth, no leg problems and no visible signs of a phosphorus deficiency were
able to utilize phosphorus far more efficiently than birds which did display problems.
The identification of variation between individual broiler chicks of the same strain is
important for future work on defining phosphorus requirements in poultry rations. It
also serves as a tool for potential genetic selection. Work in these fields could help to
reduce phosphorus requirements as well as phosphorous pollution.
Kemme et aI. (1997) investigated the influence of physiological status on the ability
of phytase to render phytic acid-phosphorus available in pigs. Five physiological
classes of pig were used in the trial and all were fed diets identical in composition. It
was found that phytase increased digestible phosphorus in all cases, however the
improvements decreased in the order of lactating sows, growing-finishing pigs, sows
at the end of pregnancy, piglets and finally sows in mid-pregnancy. The reason for
this variation between animals of different physiological age was attributed to
variation in gastric emptying, stomach capacity and pH of gastric contents. This is
important, as the main site of activity for phytase is the stomach (Jongbloed et aI.,
1992). The importance of gastric conditions was emphasized by Morz et aI. (1994)
who used apparent total tract digestibilities (ATTD) and apparent ileal digestibilities
(AID) to investigate the effect of feeding regimen (frequency and level) and microbial
phytase on the apparent digestibility and retention of nutrients bound to phytic acid.
They concluded that the feeding regimen employed determines the pattern of gastric
emptying, digesta flow rates, and changes in the pH at different regions in the
gastrointestinal tract (Low, 1989). These factors, in turn, influence the efficacy of the
phytase present. It was established that phytase supplementation, increased total
nutrient intake per unit time and increased feeding frequency all improved ATTD of
dry matter although not as a percentage of the total intake.
These experiments point towards the existence of a significant degree of variation
between breeds, strains, individual animals and different physiological conditions,
which could be exploited to select for improved phosphorus efficiency. These trials
also demonstrate that diet formulation could be tailored to the requirement of the
individual animal category.
1.8.4. Influence of pelleting on phytase activityPelleting is a fundamental part of modem feed processing and is used to improve feed
efficiencies as well as feed handling characteristics. The principal reason for pelleting
poultry diets is to kill pathogenic bacteria while at the same time reducing mould
growth (patterson, 1969; Mossel, 1971; Scott et aI., 1975). However, the process also
has a number of other beneficial effects that make it very useful.
Pelleting improves the performance of birds in terms of body weight and feed intake
although the reasons for these improvements are not fully understood (Nir et aI.,
1994). Much of the increase in the body weight gains of birds fed pellets is attributed
to raised intakes, however other factors play an important role. Improvements in
performance are also achieved by increasing the availability of various nutrients. The
most significant example of this is the gelatinization of starch under the high
temperatures and pressures of pelleting. Gelatinization of starch increases its
solubility (Nir, 1994; Theander and Westerlund, 1984). This in turn improves
intestinal amylase efficiency so that only one fourth to one fifth of the amylase used
in a ground maize diet is necessary to liberate the same amount of glucose from a
pelleted maize diet. Pelleting also reduces the separation of ingredients into their
different components thereby ensuring the animal receives a balanced diet
(McEllhiney, 1985).
Feed manufacturers currently employ aggressive pelleting techniques to improve the
quality of their feed. A commercially attractive phytase should therefore be able to
withstand the high temperatures (60 to 90Ge) reached. However, the capacity of
enzymes such as phytase to withstand such temperatures is questionable (Inborr and
Bedford, 1994).
A considerable number of trials have been undertaken in an effort to establish the
thermostability of feed enzymes under a variety of pelleting conditions. Uncertainties
exist as to the conditions under which enzyme stability is affected due to the fact that
,'\ to C} ?wo,'Z..S
io ~0?/'O ~ &S
no truly satisfactory method of accurately determining enzYmeactivity in the finished
feed is available (Lyons and Walsh, 1993; Cowan and Rasmussen, 1993). Current
procedures involve incubation of the finished feed over extended incubation times
followed by a standard assay. Animal response trials provide an alternative to in vitro
techniques and many have clearly demonstrated that enzYmesupplemented feeds that
have undergone pelleting still yield beneficial results for the animal. Lyons and
Walsh (1993) and Inborr and Bedford (1994) attributed this to components of the feed
in bulk, which they reasoned must exert a protective or stabilizing effect on enzYmes.
Partial enzYme deactivation does occur during pelleting, however the degree of
inactivation depends on the relationship between the pressure and temperature to
which the feed is exposed and the length of time it is exposed for. This relationship
was investigated by Inborr and Bedford (1994) who supplemented a broiler diet with
a p-glucanase at 3 different levels, 0, 1 and 109 kg-l and pelleted at 75, 85 or 95°C.
They concluded that pelleting temperature had a negative quadratic effect on enzYme
stability. However, they also found that bird performance was only affected when
feed was pelleted at temperatures over 85°C while conditioning time did not seem to
influence chick performance or feed intake. Furthermore, Vranjes et al. (1994) were
able to detect the effects of carbohydrases on broiler performance even after feed wasextruded at 110°C.
Simons et al. (1990) reported that the effect of shear pressure on phytase activity
appears to be small. Even after feed containing supplementary phytase was subjected
to high-energy inputs through the pelleting process, most of the initial activity
remained. It was concluded that it is mainly the high temperatures reached as a result
of the high-energy inputs that are responsible for phytase deactivation (Table 1.2.).

Table 1.2. Phytase activity of pelleted feed produced under vanous pelleting
conditions
Temperature of Temperature of Energy
the meal before the pellets after input
the press e) pelleting (0) (Watt h/kg)
50 78 20
50 81 25
65 84 17
65 87 23
Phytase activity
in the pellets
(units/kg)
240
234
208
115
Remaining
activity
There is disagreement as to the effect of steam pelleting on the apparent absorption of
phosphorus. This may be due to different concentrations of phosphorus in the diet or
inconsistent conditions at pelleting between different trials. Jongbloed and Kemme
(1990) performed three digestibility trials on pigs in which diets and pelleting
conditions were precisely controlled so as to eliminate these confounding effects.
They established that pelleting phytase-deficient diets and legume-seed diets had no
effect on mineral digestibility while pelleting a phytase rich diet did significantly
lower digestibility for DM and minerals. They found that when pelleting
temperatures reach 80°C and above, there is a dramatic decrease in phosphorus
digestibility due to a loss in phytase activity. Simoes Nunes (1993) reported that
temperatures in excess of 60°C strongly reduce phytase activity and that loss of
activity is particularly marked for temperatures higher than 75°C while only 50 %
recovery of phytase activity was obtained when pelleting at 80°C.
Variation in the ability of different fungal phytases to withstand pelleting has also
been investigated. Wys et al. (1998) investigated the thermostable properties of three
histidine-acid phosphatases from Aspergillus niger and Aspergillus fumigatus. Both
the phytases from A. niger and A. fumigatus were denatured when exposed to
temperatures between 55 and 90°C. However, A. fumigatus phytase was able to
regain most of its initial activity after being exposed to temperatures of up to 90°C
due to its ability to refold completely into its native-like, fully active conformation
after denaturation. In contrast, phytase from A. niger underwent irreversible
conformational change and inactivation with losses in activity of between 70 to 80 %.

1.9. CONCLUSION
The importance of phosphorus for the monogastric animal necessitates the
supplementation of low-phosphorus cereal-based diets with inorganic phosphorus.
Unfortunately this has often led to negative consequences for the environment, which
in turn has prompted increased legislation, particularly in Europe, restricting the
amount of phosphorus that can enter the soil through livestock manure. Future
legislation will continue to limit inorganic phosphorus supplementation all over the
world forcing farmers to adopt different strategies to meet the phosphorus
requirements of their animals.
Phytase is an enzyme that is able to catalyse the stepwise removal of orthophosphate
from phytic acid thus increasing the phosphorus digestibility of current feed
ingredients. Phytases are produced by a variety of plant and animal tissues, however
commercial phytase is produced by filamentous fungi. The most prolific producer to
date being the Aspergillus niger strain 3135. Adding phytase to the diet serves three
functions. Firstly, it lowers feed costs by reducing the need to supplement with
inorganic phosphorus. Secondly, it releases metal-ions and proteins to be absorbed
and thirdly it reduces the amount of phosphorus entering the environment in the
manure. Improved phosphorus utilization leads to superior growth and performance
through increased feed intake and weight gain. However, whether improved
phosphorus utilization increases the gain/feed ratio remains unclear.
The advantages of supplementing phytase are offset somewhat by the variability in
animal response. One source of variation is the result of the calcium phosphorus and
vitamin D3 interaction. Calcium influences phosphorus digestion by forming
insoluble complexes with phytic acid that are resistant to phytase attack. In addition
to this, excess calcium may alter the gut pH thus reducing the activity of the enzyme.
The gut pH also affects the active transport of phosphorus due to the electrochemical
nature of the process. Vitamin D3 appears to have an independent yet synergistic
relationship with supplementary phytase. It is thought that D3 enhances the ability of
enterocytes to absorb phosphorus in the small intestine thus facilitating phosphorus
uptake. Another factor that appears to affect phytase supplementation is the AME
content of the diet. This may be due to the formation of insoluble soaps between
calcium and phosphorus and free fatty acids, decreasing the digestion and absorption
of these elements and reducing their concentration in the bone.
The influence of animal factors cannot be ignored. Variation exists between breeds,
strains, and individual animals within the same strain in similar or dissimilar
physiological states. This variation is the raw material needed for future genetic
selection of animals that will be better able to utilize phytic acid phosphorus.
Processing methods such as pelleting also influence the efficacy of feed enzymes such
as phytase. The aggressive techniques employed by modem feed manufacturers
results in the inactivation of much of the enzyme present. Differences in pelleting
conditions, phosphorus concentrations, and amount and type of phytase present lead
to yet more variability.
In spite of these sources of variation, all indications are that phytase has an important
role to play in current monogastric nutrition practices and will probably play an even
more prominent role in future when each feed ingredient will have to justify its place
in the diet.
Environmental concerns and a well-informed public have given the search for
biological alternatives to the traditional practice of supplying pigs and poultry with
hefty safety margins for phosphorus, a new sense of urgency. The search has so far
yielded a number of fungi able to produce the enzyme phytase. This enzyme is
capable of liberating phosphorus from phytic acid, an otherwise inaccessible source of
phosphorus for monogastric animals. Unfortunately phytase, while performing well
when fed in mash feed, is unable to withstand the high temperatures of pelleting. This
is extremely significant in view of the fact that poultry feeds must typically endure
high pelleting temperatures that are used to control pathogens such as Salmonella.
Simoes Nunes (1993) reported that steam-pelleting feed at temperatures in excess of
60°C strongly reduces the activity of phytase produced by the fungus Aspergillus
niger. It was further demonstrated that this reduction increases as temperatures
increase with only 50% of the original activity being detected at 80°C, a pelleting
temperature frequently used. However, due to the nature of the in vitro trials
available at present, which involve assaying samples over extended incubation
periods, accurately quantifying levels of enzyme activity in complex mixes has
proven inaccurate (Lyons and Walsh, 1993). It is for this reason that in vivo studies
are still commonly employed to demonstrate phytase activity in the feed. Further, a
number of publications have used animal response data to demonstrate the existence
of appreciable levels of enzyme activity after pelleting (lnborr and Bedford, 1994;
Spring et aI., 1996; Vukic Vranjes et aI., 1994 and Joengbloed and Kemme 1990).
2.2. PHYTASE RESEARCH PROJECT
This study was carried out to investigate the effectiveness with which existing phytase
enzymes of fungal origin are able to withstand the high temperatures associated with
steam pelleting and to establish whether other phytases of fungal origin could be
produced that would better withstand high temperatures.
The project was carried out in two phases. Phase one involved testing a number of
wild-type fungi for phytase production under solid substrate culture (SSC) conditions
with a view to possible scaled-up production and animal trials. A number of
filamentous fungi capable of producing heat-stable phytases have been cited in the
literature. However, these were only used as a source of foreign DNA. Alternative
vectors were employed for the actual over-production of the enzyme under submerged
liquid culture (LC) conditions. This phase of the study attempted to cultivate these
original donor fungi under SSC conditions with a view to further stimulating over
production of the phytase enzyme through manipulation of the solid substrate (SS)
environment.
Liquid culture fermentation is the fermentation technique traditionally used for the
production of microbially derived enzymes and involves the submersion of the
microorganism in an aqueous solution containing all the nutrients needed for growth.
Two important criteria of LC fermentation include the ability of the system to operate
aseptically for a number of days and provide adequate aeration and agitation to meet
the metabolic requirements of the microorganism. Most common designs are based
on a stirred upright cylinder with sparger aeration (Filer 2000).
SS fermentation is an ancient technology based on the growth of substrates on water-
insoluble substrates in the presence of varying amounts of free water (Mitchell and
Losane, 1992). The single most important feature ofSS fermentation is the low water
content of the medium, which favours the growth of filamentous fungi, which grow
well at water activities of between 0.93 and 0.98 (Filer, 2000). Bacteria and yeasts
grow at a water activity of above 0.99. The substrates used for SS fermentation are
composite and heterogeneous products from agriculture or by-products of agro-
industries (Filer, 2000).
Solid substrate culture conditions were chosen to cultivate these organisms for the
following reasons:
• The production facilities and personnel at Alltech, Inc. laboratories are
geared towards SS cultivation, as this is the method of commercial phytase
production employed by the company.
• Time restraints and the nature of the project made this method the mostsuitable.

• There is increased public resistance to genetically modified organisms
(GMO) entering the food system. Liquid culture production systems employ
GMOs as a rule whereas all sse that we examined utilised non-GMOs.
• The extract obtained from sse contains a number of additional enzymes
with their associated side actions, many of which can contribute to the
overall effectiveness of the enzyme preparation (Mitchell and Lonsane,
1992).
• sse employs media that are relatively simple. This means that there is less
pre-treatment required compared to LC.
• Low water availability in sse helps to select against undesirable
contaminants. Low moisture content may also favour the production of
specific compounds that may not be produced under Le conditions.
• Smaller reactors are needed for sse due to the concentrated nature of the
substrate.
• Forced aeration of sse is eaSIer as interparticle spaces allow for the
diffusion of air to the thin films of water spread over the wide surface area of
the solid substrate.
• Spores can be used to inoculate the SS media thereby avoiding the need for
large seed tanks. Spores also facilitate the even dispersion of the culture
throughout the media.
Phase two of the study was designed to investigate the extent to which currently
available commercial phytases are able to withstand steam pelleting. Two phytases
were tested, a Solid Substrate Enzyme Product (SSEP) phytase, which is produced
under sse conditions and a Liquid Enzyme Product (LEP) phytase, an enzyme
produced under Le conditions. These phytases were added to commercial rations and
steam pelleted. Enzyme activity was then tested using an in vitro enzyme incubation
assay and an animal trial. The results obtained from the pelleted feed were then
compared to those ofthe unpelleted mash.
3.1. INTRODUCTION
The purpose of this trial was to identify organisms that could produce detectable
levels of a heat stable phytase enzyme under sse conditions using standard koji
media (30% soyabean meal and 70% wheat bran) in flasks. Koji media is a common
SS as it promotes good growth of filamentous fungi under sse conditions and is
relatively inexpensive (Raimbault, 1998). This study was embarked upon with a view
to selection of cultures, and the manipulation of growth conditions for enhanced
enzyme production, if significant levels of phytase had been discovered. The final
goal of this phase of the project was to scale-up production of the enzyme using the
sse tray system for eventual use in animal trials, provided that preliminary laboratory
scale trials indicated that such production was feasible.
Six types of filamentous fungi were selected from the literature for this trial, based
upon the reported ability of each to produce a thermophilic phytase. They included
Aspergillus ficuum, Aspergillus terreus, Talaromyces thermophilus, Myceliophthora
thermophila, Aspergillus fumigatus and Thermomyces languginosis. All the phytases
from these wild-type fungi have, in the past, been successfully cloned into and
overexpressed in other fungi or yeasts.
It was hypothesised that alterations to the environment of the wild-type fungus on
sse might promote the over-production of phytase by stimulating the increased
expression of the appropriate gene.
Proposed modifications to the standard culture conditions descried under the materials
and methods were the:
1. growth of cultures on a variety of alternative broth substrates.
2. use of spores as a means of inoculating the SS instead of using a broth culture.
3. utilization of alternative solid substrate culture media.
4. use of a variety of different incubation temperatures.
5. use of a variety of different incubation periods for both the broth and the SSC
flasks.
3.2.1. Source of organisms
The A. terreus, A. jicuum, T. thermophilus and M thermophila fungal strains were
acquired from the American Type Culture Collection (ATCC). Their respective
reference numbers are 1012, 66876, 20186 and 48102. All these organisms were
delivered as freeze-dried double vial preparations. Procedures from the ATCC 2000
pamphlet guide: "Instructions for Rehydration of Freeze-Dried Cultures" were used to
revive and transfer the organisms to test tubes containing liquid media. The fungi
were grown up in these test tubes before finally being transferred to slants for storage
until needed. The A. fumigatus and T. languginosis strains were obtained as slants
from the Alltech, Inc. culture collection.
3.2.2. Preparation of the slant culture
The slants were prepared in 18 x 180mm test tubes. The slant media used were the
same as those used for the liquid media (Table 3.1.) but for the addition of agar at a
rate of 15g per litre. The media were mixed and boiled to dissolve the agar and then
dispensed into test tubes (6ml per tube). The tubes were then sealed with cotton wool
stoppers and sterilised at 121°Cfor 20 min. The tubes were then allowed to coolon a
slightly sloping surface so that the media solidified along the length of the tubes
providing a large area for maximum growth. Inoculation of the slants was performed
according to the ATCC 2000 pamphlet guide: "Instructions for Rehydration of
Freeze-Dried Cultures".
3.2.3. Preparation of the broth culture
ATCC and Alltech, Inc. guidelines (Table 3.1.) were used to formulate a broth media
preparation particular to each type of organism. Two hundred millilitres of this broth
was decanted into each of a number of 500ml conical flasks. The flasks were then
plugged using cotton wool stoppers and sterilised at 121°C for 20 min. After
sterilisation, the flasks were cooled to room temperature and inoculated with agar
from working slants. They were then incubated in a shaking incubator at
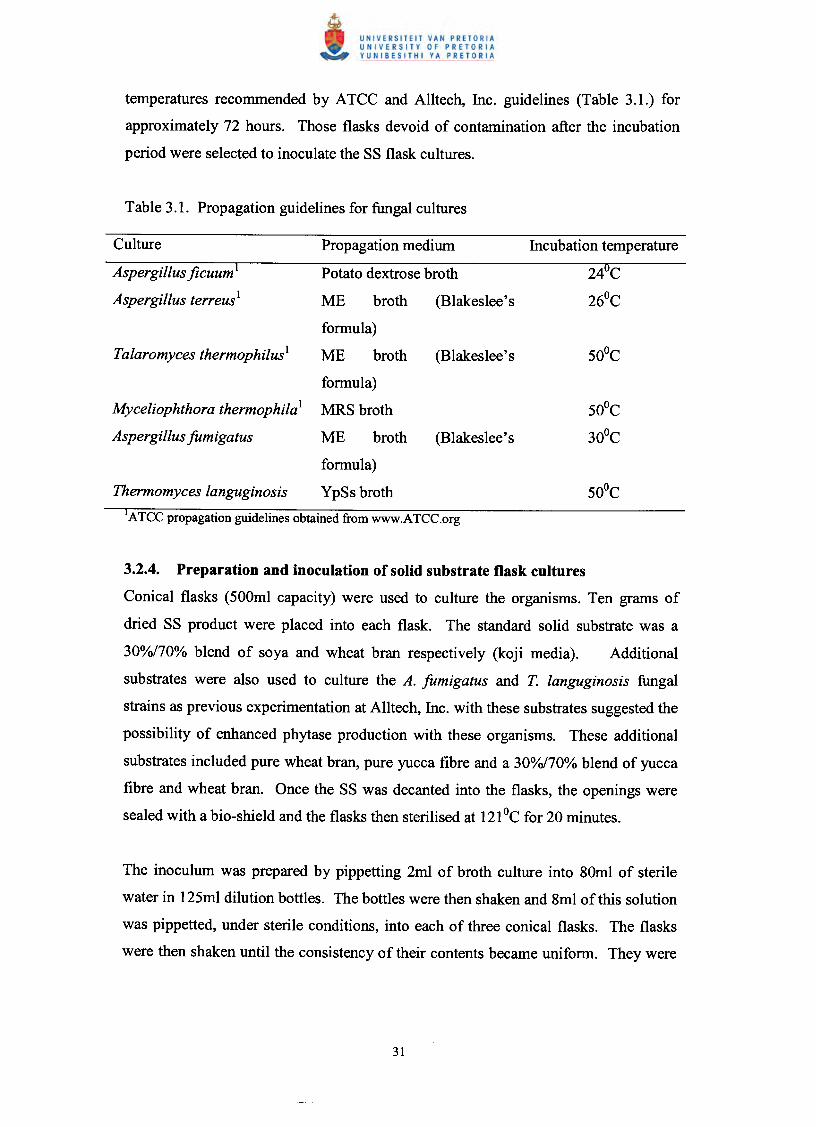
temperatures recommended by ATCC and Alltech, Inc. guidelines (Table 3.1.) for
approximately 72 hours. Those flasks devoid of contamination after the incubation
period were selected to inoculate the SS flask cultures.
Myceliophthora thermophila1
Aspergillus fumigatus
ME broth
formula)
ME broth
formula)
MRS broth
ME broth
formula)
Thermomyces languginosis YpSs brothIATCC propagation guidelines obtained from www.ATCC.org
Incubation temperature
24°C
26°C
Culture
Aspergillus ficuum 1
Aspergillus terreus1
Propagation medium
Potato dextrose broth
Talaromyces thermophilus1
3.2.4. Preparation and inoculation of solid substrate flask cultures
Conical flasks (500ml capacity) were used to culture the organisms. Ten grams of
dried SS product were placed into each flask. The standard solid substrate was a
30%/70% blend of soya and wheat bran respectively (koji media). Additional
substrates were also used to culture the A. fumigatus and T. languginosis fungal
strains as previous experimentation at Alltech, Inc. with these substrates suggested the
possibility of enhanced phytase production with these organisms. These additional
substrates included pure wheat bran, pure yucca fibre and a 30%/70% blend of yucca
fibre and wheat bran. Once the SS was decanted into the flasks, the openings were
sealed with a bio-shield and the flasks then sterilised at 121°Cfor 20 minutes.
The inoculum was prepared by pippetting 2ml of broth culture into 80ml of sterile
water in 125ml dilution bottles. The bottles were then shaken and 8ml ofthis solution
was pippetted, under sterile conditions, into each of three conical flasks. The flasks
were then shaken until the consistency of their contents became uniform. They were

then placed in an incubator for a period of 5 days at the same temperatures
recommended for the incubation of the working broth (Table 3.1.).
3.2.5. Enzyme extraction
Tap water (200ml) at 40°C was poured into each flask. The flasks were placed in an
incubator at 37°C for 2 hours after the contents of each were thoroughly mixed.
Approximately 5ml of the extract from each flask was then filtered through a wire
sieve into separate test tubes.
3.2.6. Enzyme assay
This in vitro phytase assay is based upon the measurement of the amount of ortho-
phosphate released by the enzymatic hydrolysis of sodium phytate under controlled
conditions. The assay was performed at 37°C using phytate nonahydrate (Sigma
Chemical Co. No. P-8810 from com) as a substrate. Extract samples were dissolved
in a 5mM acetate buffer solution (pH 5.5) according to the desired dilution rate. The
samples were then readied by pippetting 0.5ml of each preparation into lOml test
tubes and allowing the solution to equilibrate to temperature. At time zero, 0.5ml of
substrate solution was added to each sample and the mixtures then vortexed. The test
tubes were then incubated for 10 min after which 2ml of a colour stop solution
consisting of one part ammonium molibdate solution (lOmM), one part 5N sulphuric
acid and two parts acetone, was added followed by O.lml of 1M citric acid after a
further 30 sec interval. Activity was measured spectrophotometric ally at 380nm
against a standard curve ofKHzP04 at concentrations of 0.1, 0.2, 0.3, and 0.4 flmol of
phosphorus per ml. Blanks were prepared by pippetting 0.5ml of the sample solution
into 10ml test tubes and adding 2ml of the colour stop solution before vortexing
thoroughly. After this, 0.5ml of substrate solution was added to the test tubes and the
tubes were then vortexed again. Finally, O.lml of the 1M citric acid solution was
added after a 30 second interval and the solution vortexed. Phytase activity was
expressed in phytase units per gram. One phytase unit (PU) is defined as the quantity.of the enzyme required to release I micromole of phosphorus per minute from sodium
phytate under assay conditions. The following formula was used to calculate the
phytase activity per gram:

where ODT equals the sample absorbance and ODm equals the absorbance of the
blank solution. F represents the phosphate concentration (J!mollml) corresponding to
a change in absorbance of 1.0 obtained from the standard curve. W equals the sample
weight in grams.
3.3. RESUL TS
A threshold value of 400 PU/g was set for the flask cultures based upon previous
experience at Alltech, Inc. It was decided that without this minimum level of activity,
under the standard conditions listed in the materials and methods, any further
experimentation with culture selection and alternative conditions would be unlikely to
yield significantly improved results. Phytase production for the six fungi tested is
shown in Table 3.2.
Table 3.2. Phytase yield for six varieties of fungi cultivated under solid substrate
culture conditions
Culture Incubationtemp
Replicates Average yield (PU/g) per treatmeneSoya! Wheat Yucca YuccaWheat bran fibre/ fibrebrant Wheat
brantAspergillus ficuum 24uC
Talaromyces 50°C 8 NDthermophilusMyceliophthora 50°C 4 NDthermophilaAspergillus 30°C 2 8.7 8.5 9.7 9.6fumigatusThermomyces 50°C 1 ND ND ND NDlangu~inosis
Respective 30%170% blend of substrates.
2 PU - phytase unit (1 PU = 1 micromole of phosphorus released/minute from sodium
phytate under assay conditions).
ND - none detected.
None of the fungi tested demonstrated the ability to produce phytase enzyme to any
appreciable extent and therefore all planned further testing was suspended.
3.4. DISCUSSIONFactors involved in the regulation of genes that control the synthesis of the phytase
enzyme in filamentous fungi have been well researched. Ware and Shieh (1967)
discovered that the available inorganic phosphorus content of the medium regulated
the synthesis of the enzyme. It was established that A. niger 3135 produced the
maximum levels of phytase when the inorganic phosphorus was maintained in the
range of 0.001% to 0.005%. The reduction of activity at higher levels of phosphorus
is a general phenomenon and is observed in all moulds and yeasts that produce
phytase (Shieh and Ware 1968). Mandviwala and Khire (2000) demonstrated the
same phenomenon when they used A. niger NeIM 563 for the production of
extracellular phytase on SS media. They observed that enzyme production increased
as the phosphate concentration in the medium increased from approximately 75U g-l
dry mouldy bran (DMB) at Omgphosphate per 100g wheat bran up to 125.5U g-l
DMB at 10mg phosphate per 100g wheat bran. However, above this concentration
the level of phytase detected decreased sharply and at 50mg phosphate per 100g
wheat bran only 70U g-l DBM phytase activity was detected. Mandviwala and Khire
(2000) defined one unit of phytase activity (U) as the amount of enzyme that liberates
1J-lmolphosphorus per minute under the standard assay conditions employed. These
conditions differ from the standard assay conditions described under materials and
methods.
Although vigorous fungal growth on all substrates tested was obtained, it was not
possible to significantly alter the regulation of phytase under the conditions tested. It
was accepted that phytase production probably occurred under the culture conditions
applied, but not at levels that could be detected with the assay procedure employed.
Enzyme regulation and enzyme production were not uncoupled sufficiently so as to
obtain the rate of phytase production necessary to perform animal trials. It was
decided that further testing of these organisms was unlikely to produce significantly
more phytase, even if the modified conditions proposed had been instituted.

3.5. CONCLUSION
Testing under the conditions of the assay revealed that none of the six fungi tested for
phytase production produced sufficient quantities of the enzyme, under the test
conditions employed, to warrant further steps. A more extensive screening process,
using techniques such as UV mutagenesis and selective media, might successfully
uncouple regulation and enzyme production for these six fungal types, to the extent
that producing significant quantities of a heat stable phytase may become feasible.
PHASE II
PHYTASES
Recent investigations into the thermostability of feed enzymes have revealed that
many are able to retain a high degree of activity after being subjected to the extreme
temperatures and pressures associated with steam pelleting. Pelleting temperatures
employed in industry can be as high as 900e and above, although they are more
commonly in the region of 80°C. Some reports from chick performance studies have
suggested that feed enzymes improve nutrient utilization in unpelleted and pelleted
diets to a similar extent, even though in vitro measurements have revealed a reduction
in enzyme efficacy of 50% or more after pelleting (Vukic Vranjes et aI, 1995). Inborr
and Bedford (1994) demonstrated a significant improvement in broiler performance
when enzymes were added to feed. This performance was only affected when feeds
were pelleted at temperatures in excess of 850e. It is thought that additional
interactions may occur between the enzymes and the starch and fibre components of
the feed that have been modified due to pelleting which could explain this
phenomenon (Vukic Vranjes et aI, 1995).
The purpose of this trial was to determine the thermostability of two varieties of
commercial phytase, the Solid Substrate Enzyme Product (SSEP) and the Liquid
Enzyme Product (LEP) (i.e. two different commercial methods of producing the A.
niger phytase described on pages 14 and 15), by means of a chick performance
experiment. It was also the intention of this study to ascertain whether the sse
phytase product begets superior performance as a result of the detectable levels of
side activities present, including cellulase, protease, and xylanase, which are not
present in the Le product. Further, the trial set out to establish whether an in vitro in-
feed assay properly reflects the responses obtained from chick performance
experiments for feed supplemented with phytase.
4.2.1. Broiler source
Four hundred male day-old Ross broilers were supplied from a commercial hatchery
in the vicinity ofthe University of Maryland Eastern Shore (UMES) poultry facility in
Princess Anne, Maryland, USA.
4.2.2. Vaccination
The chicks were vaccinated in ovo for Marek's disease at 18 days of incubation and
spray vaccinated for Infectious Bronchitis and Newcastle Disease at one day of age.
4.2.3. Trial facilities
The chicks were housed in stainless steel batteries in an environmentally controlled
room (Figure 4.1.). The temperature and ventilation of the poultry house was set to
simulate that of a typical commercial production system. Fluorescent lighting was
used to illuminate the facility 24 hours a day. The birds were fed from feed troughs
placed in each battery. Jar drinkers were placed in each cage as the sole source of
water at the onset of the trial and then simultaneously with external trough drinkers on
day 10. The trough drinkers became the sole source of water from day 11 up until the
end of the trial period.
4.2.4. Bird allotment
Three hundred and seventy nine birds were wing banded and weighed on day 4.
Weak and sickly birds were avoided. The chicks were ranked according to weight
and a histogram was drawn up describing the weight distribution. From this, the most
uniform group of 336 chicks was selected. Forty-eight groups of 7 birds each were
then formed by grouping every seventh bird in the list together. Total and average
weights were calculated for each replicate.
4.2.5. Experimental design
A randomised complete block design was used to conduct this trial. Ten treatments
were decided upon, with 5 replicates per treatment with the exception of Treatments 3
and 6 where only 4 replicates were used due to the limitations of the facilities. Seven
chicks were allocated to each replicate at 4 days of age. The study consisted of a 2 x
5 factorial arrangement with feed consistency and dietary non-phytate phosphorus
(NPP) being the two main factors (Table 4.1.). Two feed consistencies were utilized
(mash vs. pelleted) with five levels of dietary NPP (0.25%, 0.3%, 0.35%, 0.25% +300 PU/kg SSEP, and 0.25% + 300 PU/kg LEP).
Table 4.1. Dietary treatments
Treatment Feed consistency Available P (%) Enzyme supplement
1 Mash 0.25
2 Mash 0.30
3 Mash 0.354 Pellet 0.255 Pellet 0.30
6 Pellet 0.357 Mash 0.25 SSEP8 Mash 0.25 LEP
9 Pellet 0.25 SSEP10 Pellet 0.25 LEP
4.2.6. Experimental diets
All birds were placed on a standard maize-soyabean based starter ration containing
0.5% NPP from days 0-3. They were then fed the treatment diets from day 4 to day
18 after an initial overnight fast. The experimental treatment diets were maize-
soyabean based with supplemental vitamins and minerals added (Table 4.2.).
Dicalcium phosphate and limestone were added to the diets as sources of NPP and
calcium. The dihydrate DCP used in this trial was assumed to be 100% available. All
experimental diets were formulated to contain 1.00% calcium and graded levels of
NPP (0.25%, 0.30%, and 0.35%). NRC (1994) recommendations for crude protein
and ME were adhered to. Treatments 1-3 and 4-6 contained 0.25%, 0.30% and 0.35%
NPP respectively. These diets were formulated so as to provide standard response
curves (i.e. NPP levels below the requirements of the birds were used so as to obtain a
linear relationship between NPP and growth and performance variables). Treatments
7 and 9 contained 0.25% NPP with the addition of 300 PU/kg SSEP. Treatments 8
and 10 also contained 0.25% NPP but with the addition of 300 PU/kg LEP. The
inclusion rates for these enzymes were determined on an equivalency basis using the
in vitro enzyme assay described under the materials and methods of the fungal
screening study (3.2.6.). It was found that 0.03% of the SSEP or 0.01% of the LEP
were equivalent to approximately 300 PU/kg of phytase activity.
Treatments 1,2, 3, 7, and 8 remained unaltered as mash diets while Treatments 4, 5,
6, 9, and 10 were pelleted. The rations were steam-pelleted using a California
Pelleting Mill Co. Master Model (30 hp) pelleter and conditioner. A 3.2mm pelleting
die was employed with a width of 50.8mm and a relief of 12.7mm. A pelleting
temperature of 80°C was selected. Both pelleted and mash rations were passed
through a hammer mill before feeding so that a consistent particle density was
achieved for all treatments. Feeds were formulated to contain 0.25% Cr203 for
phosphorus digestibility analysis. The chicks were allowed ad libitum access to their
respective diets and water.
Table 4.2. Composition and calculated analysis of experimental diets
TreatmentsStarter 1&4 2&5 3&6 7&9 8& 10
Ingredient % % % % % %Maize 52.60 53.21 53.10 52.99 53.18 53.20
SBM, dehulled (48%) 38.50 38.50 38.50 38.50 38.50 38.50Soyabean Oil 4.32 4.32 4.32 4.32 4.32 4.32
Dicalcium phosphate 2.00 0.68 0.93 1.18 0.68 0.68Limestone 1.27 1.98 1.84 1.70 1.98 1.98
SSEP phytase 0.03LEPphytase 0.01Salt, iodised 0.50 0.50 0.50 0.50 0.50 0.50DL-methionine 0.25 0.25 0.25 0.25 0.25 0.25
Vitamin/mineral mixl 0.25 0.25 0.25 0.25 0.25 0.25Coccidiostat2 0.05 0.05 0.05 0.05 0.05 0.05Chromic oxide 0.25 0.25 0.25 0.25 0.25 0.25Anti oxidane 0.01 0.01 0.01 0.01 0.01 0.01
Calculated AnalysisME, kcal/kg 3191 3212 3208 3204 3211 3212Crude Protein, % 23.10 23.15 23.14 23.13 23.15 23.15Lysine, % 1.26 1.26 1.26 1.26 1.26 1.26
Methionine, % 0.60 0.60 0.60 0.60 0.60 0.60Cystine, % 0.37 0.37 0.37 0.37 0.37 0.37
Met + Cys, % 0.97 0.97 0.97 0.97 0.97 0.97Threonine, % 0.87 0.87 0.87 0.87 0.87 0.87Calcium, % 1.00 1.00 1.00 1.00 1.00 1.00
Non Phytate P, % 0.50 0.25 0.30 0.35 0.25 0.25Phytase activity, PUl/kg 0 0 0 0 300 300[Supplies per kilogram of diet: vitamin A, 11,025 IV; vitamin D3, 528 IV; vitamin E, 33 IV, B12
0.03mg; vitamin K (as sodium menadione bisulfite complex) 2.8mg; riboflavin 7.7mg; d-pantothenicacid, 17.6mg; thiamine, 2.2mg; niacin 55mg; B6 4.9mg; folic acid l.lmg; choline, 479mg; d-biotin0.22mg; Zn, 75mg; Fe, 40mg; Mn, 64mg; Cu, 10mg, I, 1.9mg; Se, O.3mg.
2Amprolian 25%.3Endox.

4.2.7. Variables monitored
Mortalities were monitored on a daily basis. Dead birds were weighed and their
weights recorded. The feed intake of each pen was also recorded. Faecal samples
were taken from each pen over a 24-hour period starting on day 16. A proximate and
mineral analysis of all feeds as well as a faecal mineral analysis for each pen was
performed at a commercial laboratory. The faeces were analysed for Sulphur,
Potassium, Calcium, Phosphorus, Magnesium, Sodium, Iron, Manganese, Copper and
Zinc. All birds were slaughtered and weighed on day 18. Feeding was suspended 12-
hours prior to the cull. The right tibia of each bird was removed and frozen. The
tibias were then thawed and the flesh and tibial caps removed. The bone breaking
strength was subsequently determined by placing each individual bone across a set of
rollers and applying a constant pressure to each using an Instron machine (Figure
4.2.). The force (kg) required to break through the centre of each bone was recorded.
All pieces of bone were collected after breaking and pooled by pen for percentage
bone ash determination, measured according to AOAC (1976) procedures. The third
toe of each foot was severed between the third and fourth phalangeal joint, pooled
according to pen and dried at 100°C. The toes were then weighed, ashed and
reweighed to determine percent toe ash.
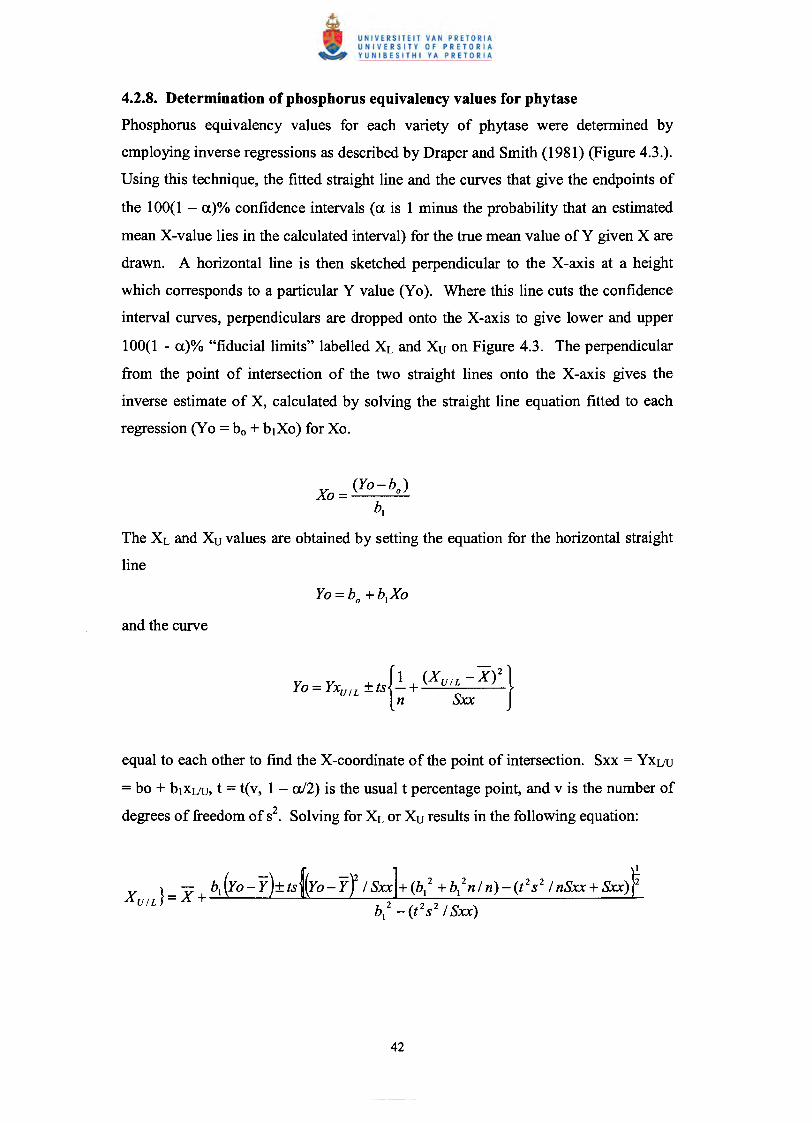
4.2.8. Determination of phosphorus equivalency values for phytase
Phosphorus equivalency values for each variety of phytase were determined by
employing inverse regressions as described by Draper and Smith (1981) (Figure 4.3.).
Using this technique, the fitted straight line and the curves that give the endpoints of
the 100(1 - a)% confidence intervals (a is 1 minus the probability that an estimated
mean X-value lies in the calculated interval) for the true mean value ofY given X are
drawn. A horizontal line is then sketched perpendicular to the X-axis at a height
which corresponds to a particular Y value (Yo). Where this line cuts the confidence
interval curves, perpendiculars are dropped onto the X-axis to give lower and upper
100(1 - a)% "fiducial limits" labelled XL and Xu on Figure 4.3. The perpendicular
from the point of intersection of the two straight lines onto the X-axis gives the
inverse estimate of X, calculated by solving the straight line equation fitted to each
regression (Yo = bo + blXo) for Xo.
Xo = (Yo-bo)
bl
The XL and Xu values are obtained by setting the equation for the horizontal straight
line
{I (XUIL _X)2}YO=YxU1L ±ts -+-----n Sxx
equal to each other to find the X-coordinate of the point of intersection. Sxx = YXuu
= bo + blXuu, t = t(v, 1 - a/2) is the usual t percentage point, and v is the number of
degrees of freedom of S2. Solving for XLor Xu results in the following equation:
/ Sxx + (b12 + bl
2n/ n) _(t2S2 / nSxx + Sxx) 2
bl2 _(t2s2
/ Sxx)
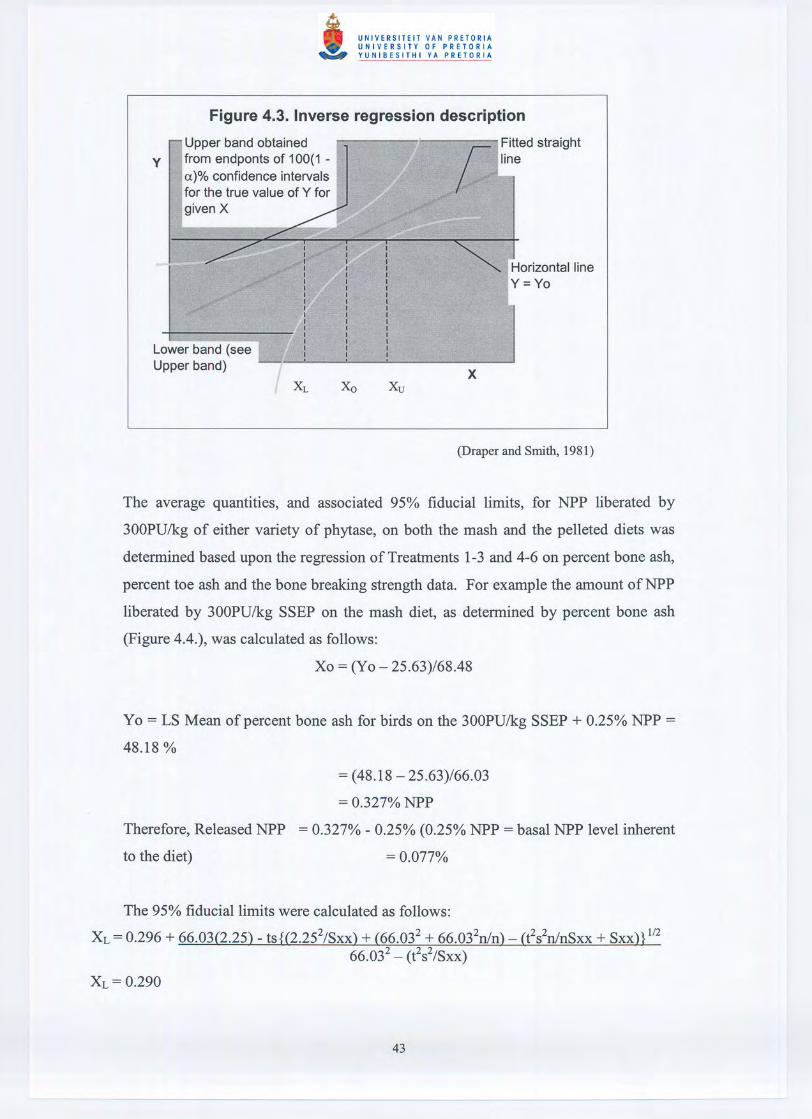
Figure 4.3. Inverse regression description
Upper band obtainedy from endponts of 1OO(1 -
a)% confidence intervalsfor the true value of Y forgiven X
Horizontal lineY=Yo
Lower band (seeUpper band)
The average quantities, and associated 95% fiducial limits, for NPP liberated by
300PUlkg of either variety of phytase, on both the mash and the pelleted diets was
determined based upon the regression of Treatments 1-3 and 4-6 on percent bone ash,
percent toe ash and the bone breaking strength data. For example the amount ofNPP
liberated by 300PUlkg SSEP on the mash diet, as determined by percent bone ash
(Figure 4.4.), was calculated as follows:
Xo = (Yo - 25.63)/68.48
Yo = LS Mean of percent bone ash for birds on the 300PUlkg SSEP + 0.25% NPP =
48.18 %
= (48.18 - 25.63)/66.03
=0.327%NPP
Therefore, Released NPP = 0.327% - 0.25% (0.25% NPP = basal NPP level inherent
to the diet) = 0.077%
The 95% fiducial limits were calculated as follows:
XL = 0.296 + 66.03(2.25) - ts{(2.252/Sxx) + (66.032 + 66.032n/n) - (t2s2n/nSxx + Sxx)} 1/266.032 - (t2S2/SXX)
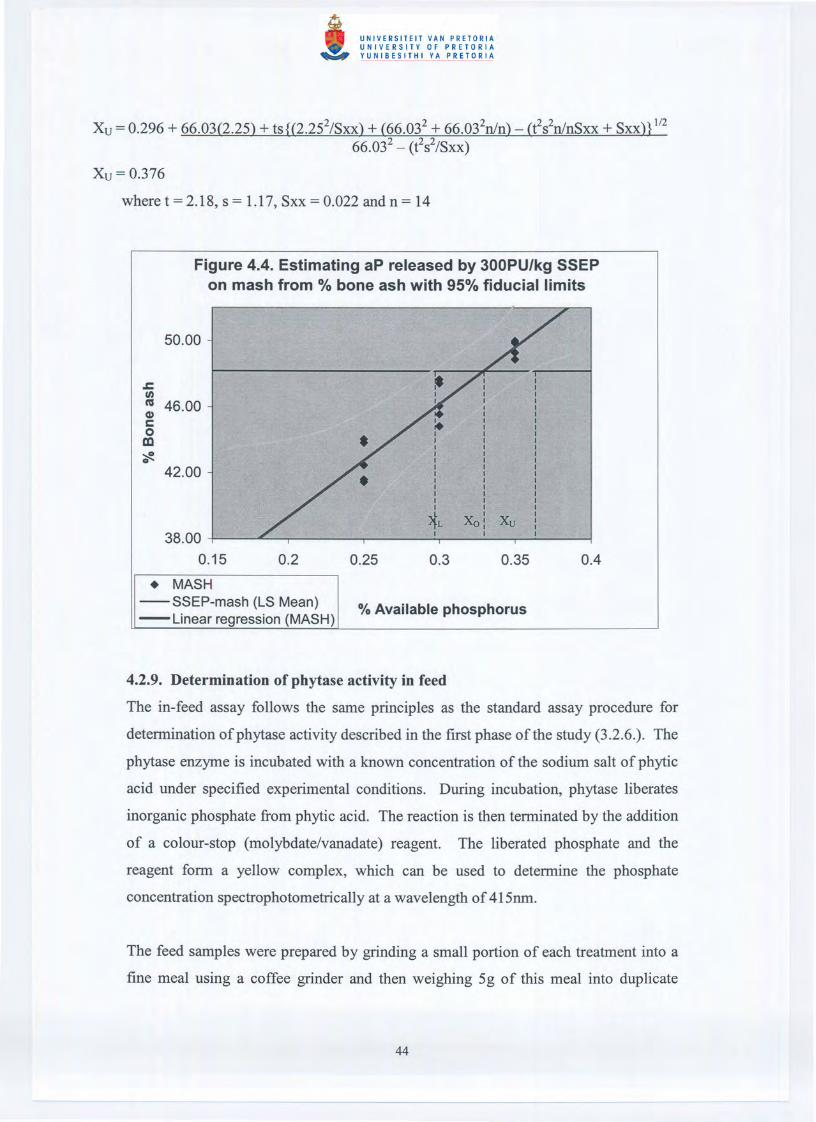
Xu = 0.296 + 66.03(2.25) + ts{(2.252/Sxx) + (66.032 + 66.032n/n) - (t2s2n/nSxx + SxxU 1/2
66.032 - (es2/sxx)
Xu = 0.376
where t = 2.18, s = 1.17, Sxx = 0.022 and n = 14
Figure 4.4. Estimating aP released by 300PU/kg 55EPon mash from % bone ash with 95% fiducial limits
50.00
.c:II)ns 46.00(1)c0en'?ft.42.00
38.000.15
• MASH--SSEP-mash (LSMean)-Linear regression(MASH)
4.2.9. Determination of phytase activity in feed
The in-feed assay follows the same principles as the standard assay procedure for
determination of phytase activity described in the first phase of the study (3.2.6.). The
phytase enzyme is incubated with a known concentration of the sodium salt of phytic
acid under specified experimental conditions. During incubation, phytase liberates
inorganic phosphate from phytic acid. The reaction is then terminated by the addition
of a colour-stop (molybdate/vanadate) reagent. The liberated phosphate and the
reagent form a yellow complex, which can be used to determine the phosphate
concentration spectrophotometric ally at a wavelength of 415nm.
The feed samples were prepared by grinding a small portion of each treatment into a
fine meal using a coffee grinder and then weighing 5g of this meal into duplicate
125ml dilution bottles. The samples were then suspended in 50ml of pre-treatment
buffer (acetate based- pH 5.45-5.55) and shaken for 60 minutes. The top layer from
each bottle was then filtered off with Whatman No. 4 filter paper and 1ml of this
filtered solution poured into each of three test tubes (duplicate reaction tubes and a
single sample blank). At time zero, 4ml of phytic acid solution (2.lOg phytic acid
dodecasodium salt in 250ml acetate buffer- pH 5.45-5.55) was added to the first
reaction test tube, the tube was then vortexed and placed in a water bath at 37°C for
exactly 60 minutes. This was repeated every ten seconds for all sample reaction
tubes. After the incubation, 4ml of the colour-stop reagent was added to each sample
and 15 minutes allowed for colour development to occur. All samples were then
centrifuged for 5 minutes at 3, 000 x g before readings were taken on the
spectrophotometer.
A separate phytase sample with a determined amount of enzyme activity was diluted
so that a reaction curve consisting of six concentrations of the enzyme was obtained.
The levels of activity for the six standards were 0.05, 0.10, 0.25, 0.50, 1.00 and 1.50
PU/ml respectively. Two millilitres of each standard dilution was poured into each of
two test tubes. One of the tubes was used as a reaction tube and underwent the same
treatment as the samples while the other tube was used as a blank.
Sample blanks were prepared by adding 4ml of colour-stop reagent to each tube
containing the sample and then vortexing the mixture. Four millilitres of phytic acid
was then added and the solution vortexed again. Once more, 15 minutes was allowed
for colour development to take place before readings were taken.
Net absorbance was determined by subtracting the absorbance of the blank from that
of the reaction tube. The absorbance and activity data were then graphed, activity on
the X-axis and the absorbance on the Y-axis. The activity of the samples was then
calculated by graphing absorbance against the standard curve using regression
calculations and multiplying by the dilution factor according to the formula:
4.2.10. Determination of Phosphorus digestibility
The digestibility of the total dietary phosphorus in each treatment was calculated from
an indigestible indicator; chromium in the form of chromic oxide (Cr203)' All
treatments were supplemented with 0.25% Cr203. Samples of faecal matter excreted
over a 24 hour period from day 16 of the trial were collected from each pen. The
faecal samples along with samples from each treatment diet were then sent to a
commercial laboratory for determination of the total phosphorus (tP) concentrations.
The average tP concentration for the six diets containing 0.25% NPP was calculated
from Treatments 1, 4, 7, 8, 9 and 10. Similarly, average tP concentrations were
calculated for the 0.30 and 0.35% NPP diets by pooling tP concentrations for
Treatments 2 and 5 and Treatments 3 and 6 respectively. Average tP concentrations
for diets containing 0.25, 0.30 and 0.35% NPP were calculated to be 0.66, 0.75 and
0.78% respectively. Total phosphorus digestibility values were calculated according
to the following formula:
Pd" 'b'Z" 100 [100* %Cr Feed * %tPFaeces]t 1gestl l lty = - ----- -----%Cr Faeces %tPFeed
4.2.11. Statistical analysis
The statistical analysis of the data was performed using the PC-SAS Version 8.01
commercial software. The LS Means test was used to determine the significance of
differences between treatment means at a P < 0.05 level.
4.3.1. Growth results (days 4 -18)
4.3.1.1. Average weight gain (g/bird)
There was no significant interaction between feed consistency and phosphorus level
for the average weight gained by the birds over the course of the trial i.e. similar
responses were obtained on both varieties of feed over the different levels of dietary
NPP and visa versa, therefore only main effects were analysed.
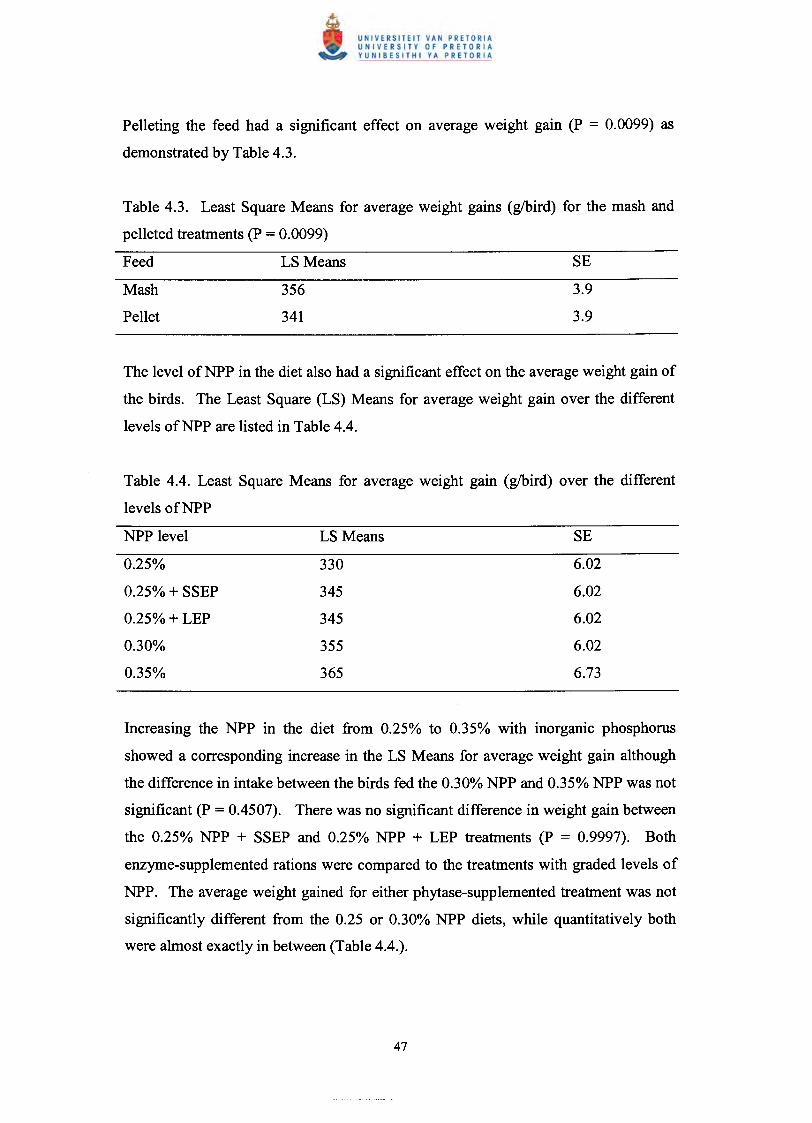
Pelleting the feed had a significant effect on average weight gain (P = 0.0099) as
demonstrated by Table 4.3.
Table 4.3. Least Square Means for average weight gains (g/bird) for the mash and
pelleted treatments (P = 0.0099)
Feed
Mash
Pellet
LS Means
356
341
SE
3.9
3.9
The level of NPP in the diet also had a significant effect on the average weight gain of
the birds. The Least Square (LS) Means for average weight gain over the different
levels ofNPP are listed in Table 4.4.
Table 4.4. Least Square Means for average weight gain (g/bird) over the different
levels ofNPP
NPP level LS Means SE
0.25% 330 6.02
0.25% + SSEP 345 6.02
0.25% + LEP 345 6.02
0.30% 355 6.02
0.35% 365 6.73
Increasing the NPP in the diet from 0.25% to 0.35% with inorganic phosphorus
showed a corresponding increase in the LS Means for average weight gain although
the difference in intake between the birds fed the 0.30% NPP and 0.35% NPP was not
significant (P = 0.4507). There was no significant difference in weight gain between
the 0.25% NPP + SSEP and 0.25% NPP + LEP treatments (P = 0.9997). Both
enzyme-supplemented rations were compared to the treatments with graded levels of
NPP. The average weight gained for either phytase-supplemented treatment was not
significantly different from the 0.25 or 0.30% NPP diets, while quantitatively both
were almost exactly in between (Table 4.4.).
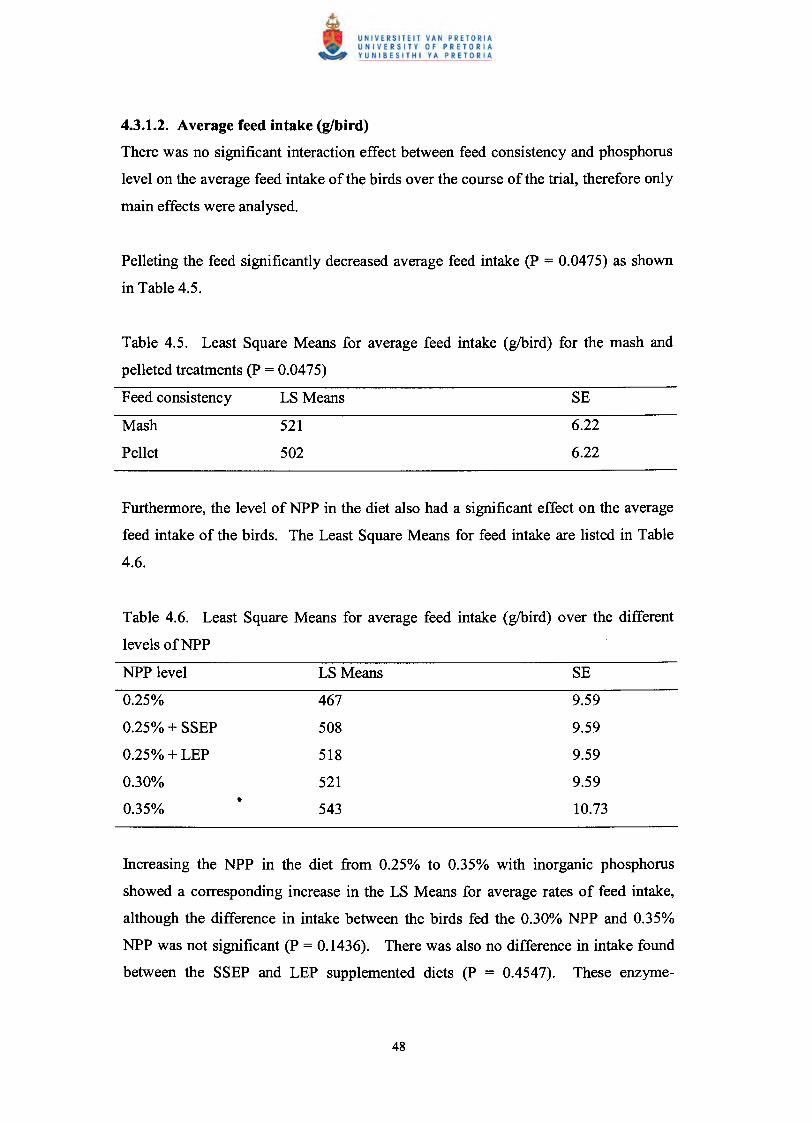
4.3.1.2. Average feed intake (g/bird)
There was no significant interaction effect between feed consistency and phosphorus
level on the average feed intake of the birds over the course of the trial, therefore only
main effects were analysed.
Pelleting the feed significantly decreased average feed intake (P = 0.0475) as shown
in Table 4.5.
Table 4.5. Least Square Means for average feed intake (gIbird) for the mash and
pelleted treatments (P = 0.0475)
Feed consistency LS Means SE
Mash
Pellet
521
502
6.22
6.22
Furthermore, the level of NPP in the diet also had a significant effect on the average
feed intake of the birds. The Least Square Means for feed intake are listed in Table
4.6.
Table 4.6. Least Square Means for average feed intake (gIbird) over the different
levels ofNPP
NPP level LS Means SE
0.25% 467 9.59
0.25%+SSEP 508 9.59
0.25% + LEP 518 9.59
0.30% 521 9.59•0.35% 543 10.73
Increasing the NPP in the diet from 0.25% to 0.35% with inorganic phosphorus
showed a corresponding increase in the LS Means for average rates of feed intake,
although the difference in intake between the birds fed the 0.30% NPP and 0.35%
NPP was not significant (P = 0.1436). There was also no difference in intake found
between the SSEP and LEP supplemented diets (P = 0.4547). These enzyme-
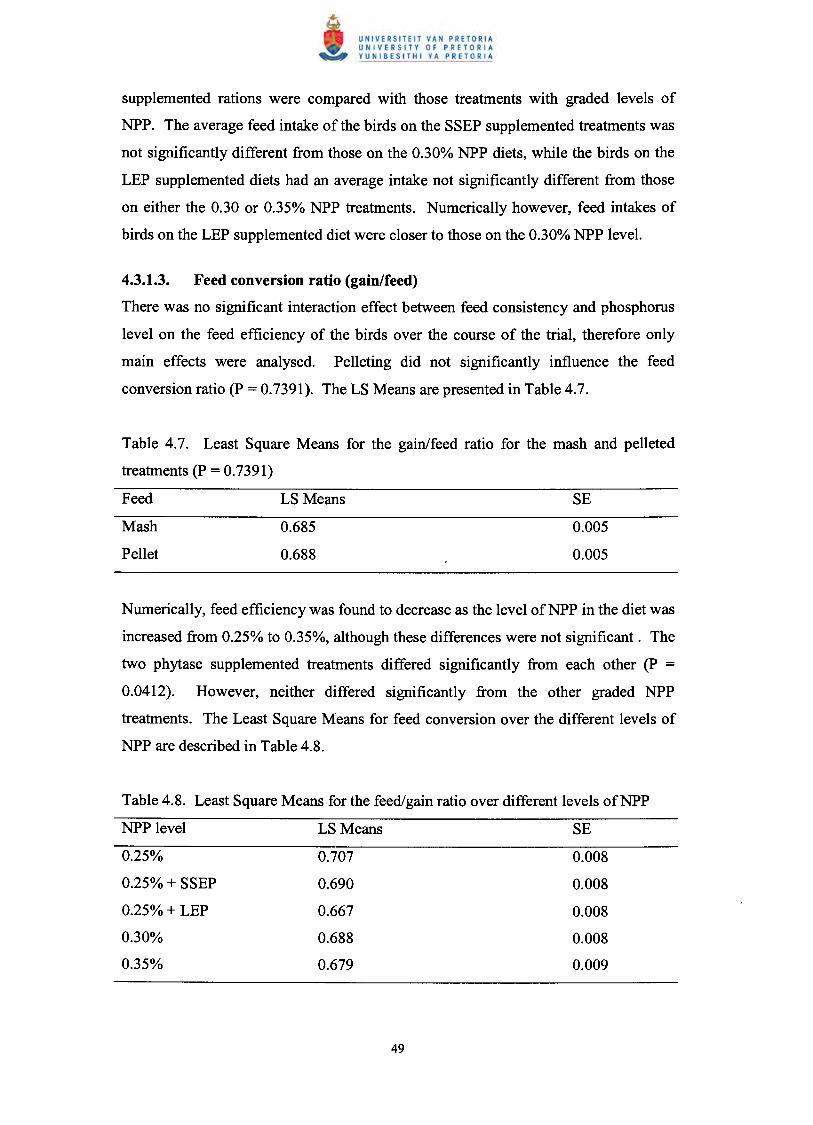
supplemented rations were compared with those treatments with graded levels of
NPP. The average feed intake of the birds on the SSEP supplemented treatments was
not significantly different from those on the 0.30% NPP diets, while the birds on the
LEP supplemented diets had an average intake not significantly different from those
on either the 0.30 or 0.35% NPP treatments. Numerically however, feed intakes of
birds on the LEP supplemented diet were closer to those on the 0.30% NPP level.
4.3.1.3. Feed conversion ratio (gain/feed)
There was no significant interaction effect between feed consistency and phosphorus
level on the feed efficiency of the birds over the course of the trial, therefore only
main effects were analysed. Pelleting did not significantly influence the feed
conversion ratio (P = 0.7391). The LS Means are presented in Table 4.7.
Table 4.7. Least Square Means for the gain/feed ratio for the mash and pelleted
treatments (P = 0.7391)
Feed LS Means
Mash
Pellet
0.685
0.688
SE
0.005
0.005
Numerically, feed efficiency was found to decrease as the level ofNPP in the diet was
increased from 0.25% to 0.35%, although these differences were not significant. The
two phytase supplemented treatments differed significantly from each other (P =
0.0412). However, neither differed significantly from the other graded NPP
treatments. The Least Square Means for feed conversion over the different levels of
NPP are described in Table 4.8.
NPP level LS Means SE
0.25% 0.707 0.008
0.25% + SSEP 0.690 0.008
0.25%+LEP 0.667 0.008
0.30% 0.688 0.008
0.35% 0.679 0.009

4.3.2. Production results (days 4 -18)
4.3.2.1. Percent bone ash
Significant interaction effects were found between feed consistency and NPP level for
the percent bone ash parameter i.e. there was a significant difference in response
between treatments for both varieties of feed over the different levels of dietary NPP
and visa versa, therefore individual treatment means were compared. The data is
presented in Table 4.9 and Figure 4.5.
Table 4.9. Percent bone ash of broilers fed two different sources of phytase with and
without pelleting
Treatment Feed consistency NPP(%) Enzyme supplement Bone ash (%)
1 Mash 0.25 42.68
2 Mash 0.30 42.36
3 Mash 0.35 49.51
4 Pellet 0.25 42.07
5 Pellet 0.30 45.14
6 Pellet 0.35 48.69
7 Mash 0.25 SSEP 48.18
8 Mash 0.25 LEP 48.02
9 Pellet 0.25 SSEP 41.32
10 Pellet 0.25 LEP 45.28
Increasing the percentage NPP in either the mash or the pelleted treatments produced
a linear improvement in percent bone ash (Figure 4.5.). However, neither the pellet
nor the mash treatments demonstrated a significantly superior ability to increase the
percent bone ash accumulation over the other. No significant difference in percent
bone ash was detected between the SSEP and LEP treatments when supplemented on
the mash (P = 0.8431). Furthermore, birds on these two treatments produced
approximately as much bone ash as those on the 0.35% NPP mash treatment.
When comparing the bone ash of the birds fed the pelleted rations it was found that
those fed the 0.25% NPP + SSEP produced a similar amount of bone ash to those onthe 0.25% NPP (P = 0.3588) indicating a loss in enzyme activity with pelleting.

Conversely, the percent bone ash of birds fed the 0.25% NPP + LEP on the pelleted
ration did not differ significantly from those on the 0.30% NPP pelleted ration (P =
0.8632) which suggests that a degree of enzyme activity was retained after pelleting.
Figure 4.5. Effects of pelleting and phytase sourceon % bone ash
38.00SSEP+0.25%NPP
LEP+0.25%NPP
MASHPELLETSSEP-mash
• LEP-mash,K SSEP-pellet• LEP-pellet- Linear (PELLET)- Linear (MASH)
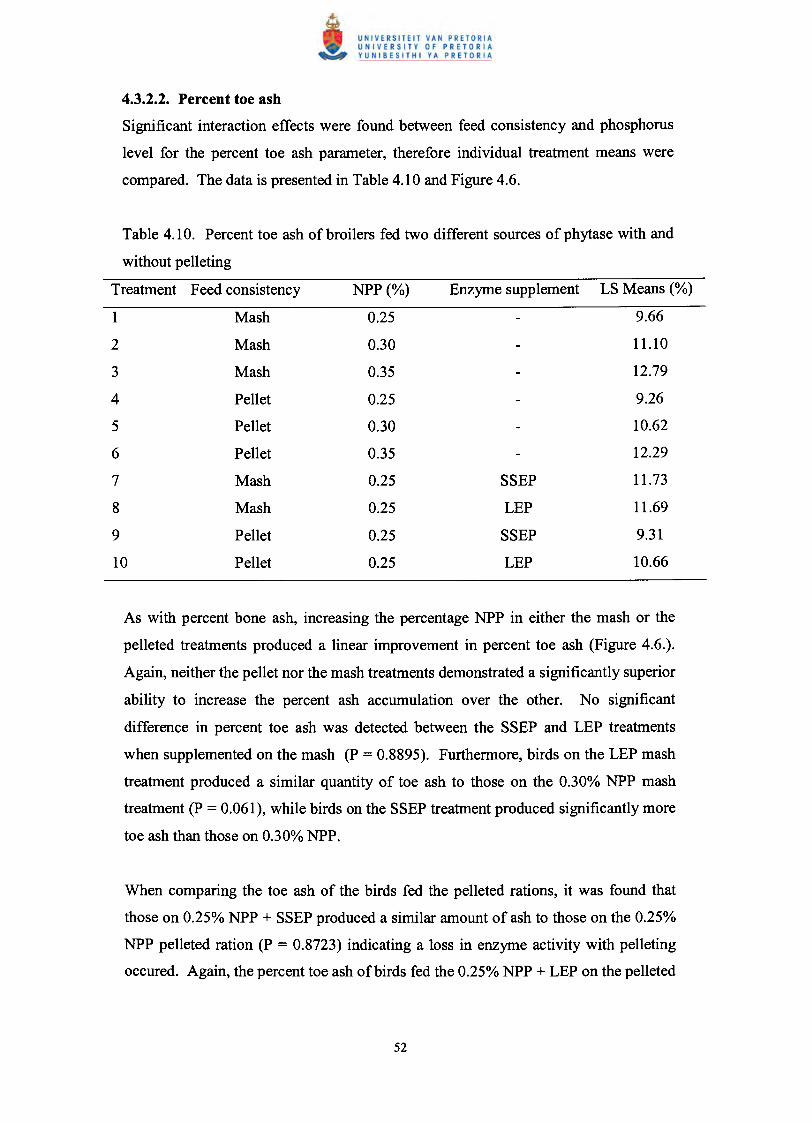
4.3.2.2. Percent toe ash
Significant interaction effects were found between feed consistency and phosphorus
level for the percent toe ash parameter, therefore individual treatment means were
compared. The data is presented in Table 4.10 and Figure 4.6.
Table 4.10. Percent toe ash of broilers fed two different sources of phytase with and
without pelleting
Treatment Feed consistency NPP (%) Enzyme supplement LS Means (%)
1 Mash 0.25 9.66
2 Mash 0.30 11.10
3 Mash 0.35 12.79
4 Pellet 0.25 9.26
5 Pellet 0.30 10.62
6 Pellet 0.35 12.29
7 Mash 0.25 SSEP 11.73
8 Mash 0.25 LEP 11.69
9 Pellet 0.25 SSEP 9.31
10 Pellet 0.25 LEP 10.66
As with percent bone ash, increasing the percentage NPP in either the mash or the
pelleted treatments produced a linear improvement in percent toe ash (Figure 4.6.).
Again, neither the pellet nor the mash treatments demonstrated a significantly superior
ability to increase the percent ash accumulation over the other. No significant
difference in percent toe ash was detected between the SSEP and LEP treatments
when supplemented on the mash (P = 0.8895). Furthermore, birds on the LEP mash
treatment produced a similar quantity of toe ash to those on the 0.30% NPP mash
treatment (P = 0.061), while birds on the SSEP treatment produced significantly more
toe ash than those on 0.30% NPP.
When comparing the toe ash of the birds fed the pelleted rations, it was found that
those on 0.25% NPP + SSEP produced a similar amount of ash to those on the 0.25%
NPP pelleted ration (P = 0.8723) indicating a loss in enzyme activity with pelleting
occured. Again, the percent toe ash of birds fed the 0.25% NPP + LEP on the pelleted

ration did not differ significantly from those on the 0.30% NPP pelleted ration (P =
0.8942) which suggests that a degree of enzYme activity was retained after pelleting.
Figure 4.6. Effects of pelleting and phytase source on %toe ash
14.00 •.t:InClS • • MASHQ) 12.00 -'0
• PELLETto-~ • SSEP-mash0 I10.00 • LEP-mash
~ SSEP-pellet• LEP-pellet
8.00 - Linear (MASH)SSEP+ LEP+ 0.25 0.3 0.35 - Linear (PELLET)0.25% 0.25%NPP NPP % Available phosphorus
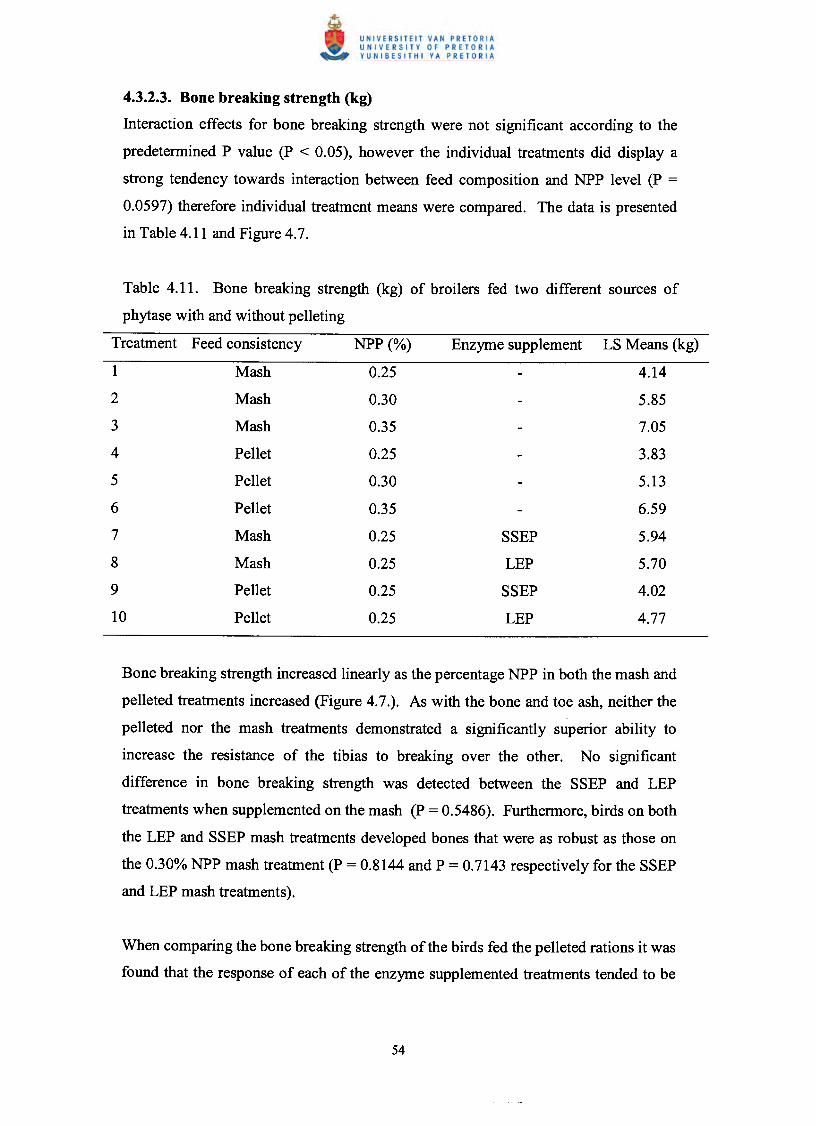
4.3.2.3. Bone breaking strength (kg)
Interaction effects for bone breaking strength were not significant according to the
predetermined P value (P < 0.05), however the individual treatments did display a
strong tendency towards interaction between feed composition and NPP level (P =
0.0597) therefore individual treatment means were compared. The data is presented
in Table 4.11 and Figure 4.7.
Table 4.11. Bone breaking strength (kg) of broilers fed two different sources of
phytase with and without pelleting
Treatment Feed consistency NPP(%) Enzyme supplement LS Means (kg)
1 Mash 0.25 4.14
2 Mash 0.30 5.85
3 Mash 0.35 7.05
4 Pellet 0.25 3.83
5 Pellet 0.30 5.13
6 Pellet 0.35 6.59
7 Mash 0.25 SSEP 5.94
8 Mash 0.25 LEP 5.70
9 Pellet 0.25 SSEP 4.02
10 Pellet 0.25 LEP 4.77
Bone breaking strength increased linearly as the percentage NPP in both the mash and
pelleted treatments increased (Figure 4.7.). As with the bone and toe ash, neither the
pelleted nor the mash treatments demonstrated a significantly superior ability to
increase the resistance of the tibias to breaking over the other. No significant
difference in bone breaking strength was detected between the SSEP and LEP
treatments when supplemented on the mash (P = 0.5486). Furthermore, birds on both
the LEP and SSEP mash treatments developed bones that were as robust as those on
the 0.30% NPP mash treatment (P = 0.8144 and P = 0.7143 respectively for the SSEP
and LEP mash treatments).
When comparing the bone breaking strength ofthe birds fed the pelleted rations it was
found that the response of each of the enzyme supplemented treatments tended to be
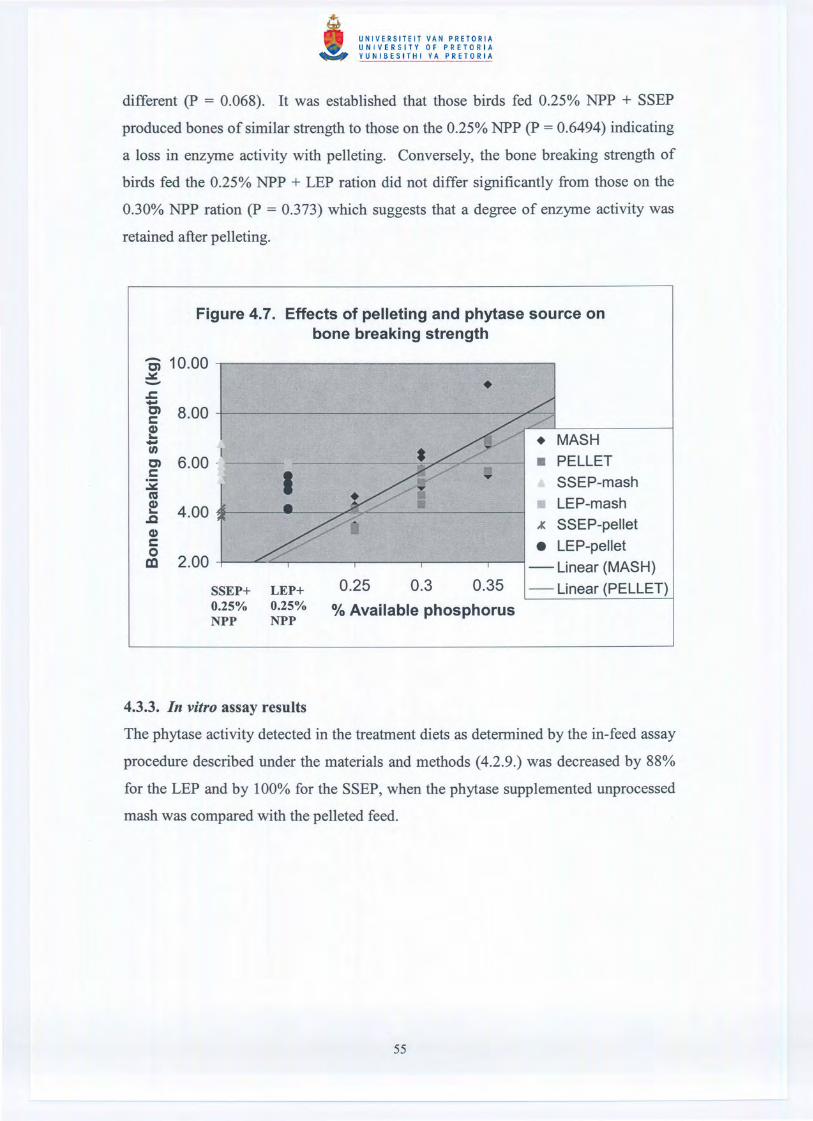
different (P = 0.068). It was established that those birds fed 0.25% NPP + SSEP
produced bones of similar strength to those on the 0.25% NPP (P = 0.6494) indicating
a loss in enzyme activity with pelleting. Conversely, the bone breaking strength of
birds fed the 0.25% NPP + LEP ration did not differ significantly from those on the
0.30% NPP ration (P = 0.373) which suggests that a degree of enzyme activity was
retained after pelleting.
Figure 4.7. Effects of pelleting and phytase source onbone breaking strength
Ci 10.00~-J:-g' 8.00~-~ 6.00-1---c:::i2cu~ 4.00(1)c::or:Q 2.00
SSEP+0.25%NPP
LEP+0.25%NPP
0.25 0.3 0.35
% Available phosphorus
• MASH• PELLETSSEP-mashLEP-mash
.oK SSEP-pellet
• LEP-pellet- Linear (MASH)- Linear (PELLET)
4.3.3. In vitro assay results
The phytase activity detected in the treatment diets as determined by the in-feed assay
procedure described under the materials and methods (4.2.9.) was decreased by 88%
for the LEP and by 100% for the SSEP, when the phytase supplemented unprocessed
mash was compared with the pelleted feed.
4.3.4. Phosphorus equivalency values for phytase
The regression of Treatments 1-3 and 4-6 on percent bone ash, percent toe ash and
bone-breaking strength produced the straight lines described in Table 4.12.
The average quantities, and associated 95% fiducial intervals, for the NPP liberated
by 300PUlkg of either variety of phytase on the mash or pellets, based upon the
calculated regressions (Table 4.12.), are presented in Tables 4.13. and 4.14. The net
equivalency values and corresponding 95% confidence interval for the NPP released
by each of the phytase enzymes were calculated by subtracting the basal amount of
NPP (0.25%) added to each diet from the equivalent percentage NPP value and both
the upper and lower 95% fiducial limits respectively, for each ofthe three parameters.
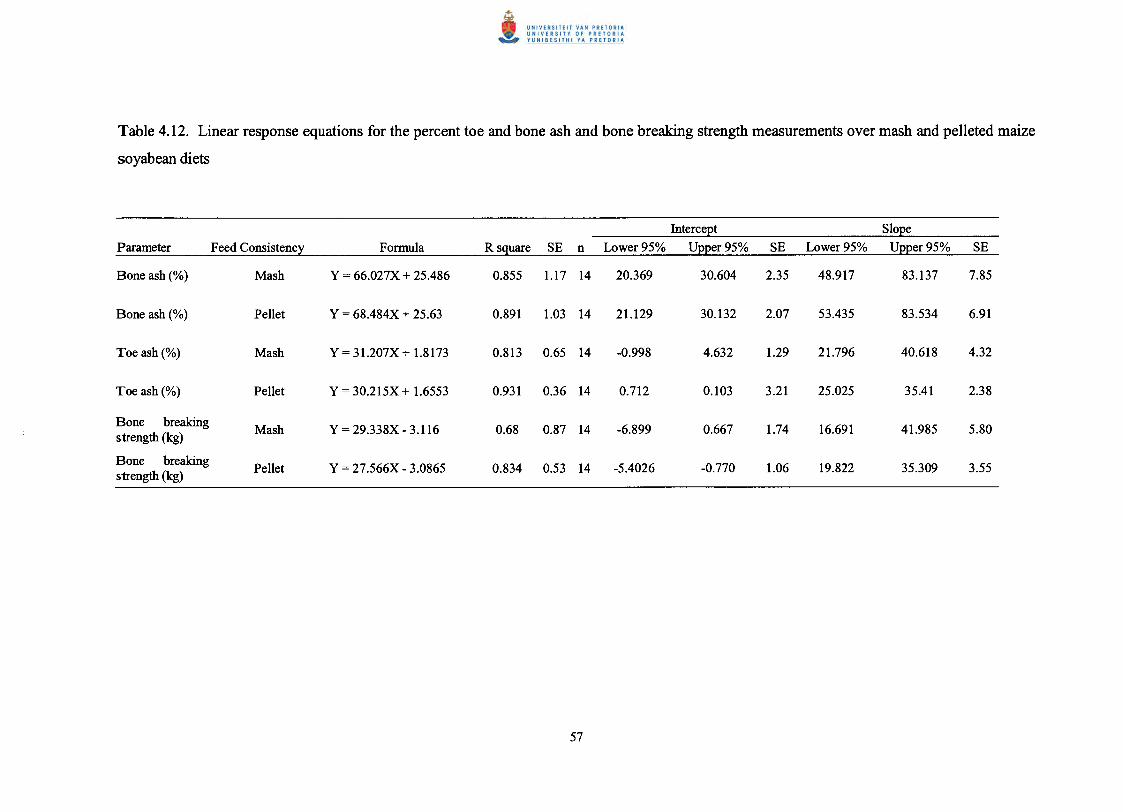
Table 4.12. Linear response equations for the percent toe and bone ash and bone breaking strength measurements over mash and pelleted maize
soyabean diets
Intercept SlopeParameter Feed Consistency Formula R square SE n Lower 95% Upper 95% SE Lower 95% Upper 95% SE
Bone ash(%) Mash Y = 66.027X + 25.486 0.855 1.17 14 20.369 30.604 2.35 48.917 83.137 7.85
Bone ash(%) Pellet Y = 68.484X + 25.63 0.891 1.03 14 21.129 30.132 2.07 53.435 83.534 6.91
Toe ash (%) Mash Y = 31.207X + 1.8173 0.813 0.65 14 -0.998 4.632 1.29 21.796 40.618 4.32
Toeash(%) Pellet Y = 30.215X + 1.6553 0.931 0.36 14 0.712 0.103 3.21 25.025 35.41 2.38
Bone breakingMash Y = 29.338X - 3.116 0.68 0.87 14 -6.899 0.667 1.74 16.691 41.985 5.80strength (kg)
Bone breakingPellet Y = 27.566X - 3.0865 0.834 0.53 14 -5.4026 -0.770 1.06 19.822 35.309 3.55
strength (kg)
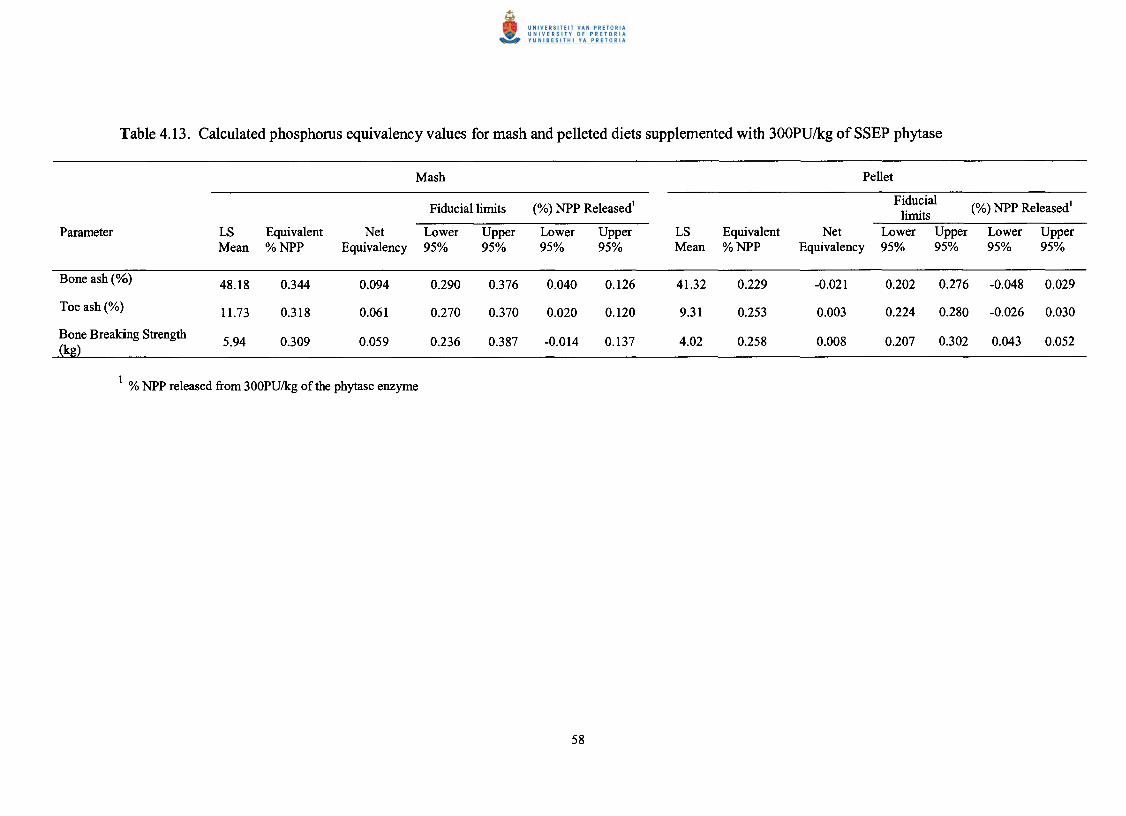
Mash Pellet
Fiducial limits (%) NPP Released!Fiducial (%) NPP Released!limits
Parameter LS Equivalent Net Lower Upper Lower Upper LS Equivalent Net Lower Upper Lower UpperMean %NPP Equivalency 95% 95% 95% 95% Mean %NPP Equivalency 95% 95% 95% 95%
Bone ash(%) 48.18 0.344 0.094 0.290 0.376 0.040 0.126 41.32 0.229 -0.021 0.202 0.276 -0.048 0.029
Toe ash (%) 11.73 0.318 0.061 0.270 0.370 0.020 0.120 9.31 0.253 0.003 0.224 0.280 -0.026 0.030
Bone Breaking Strength5.94 0.309 0.059 0.236 0.387 -0.014 0.137 4.02 0.258 0.008 0.207 0.302 0.043 0.052
(kg)
1 % NPP released from 300PUlkg of the phytase enzyme
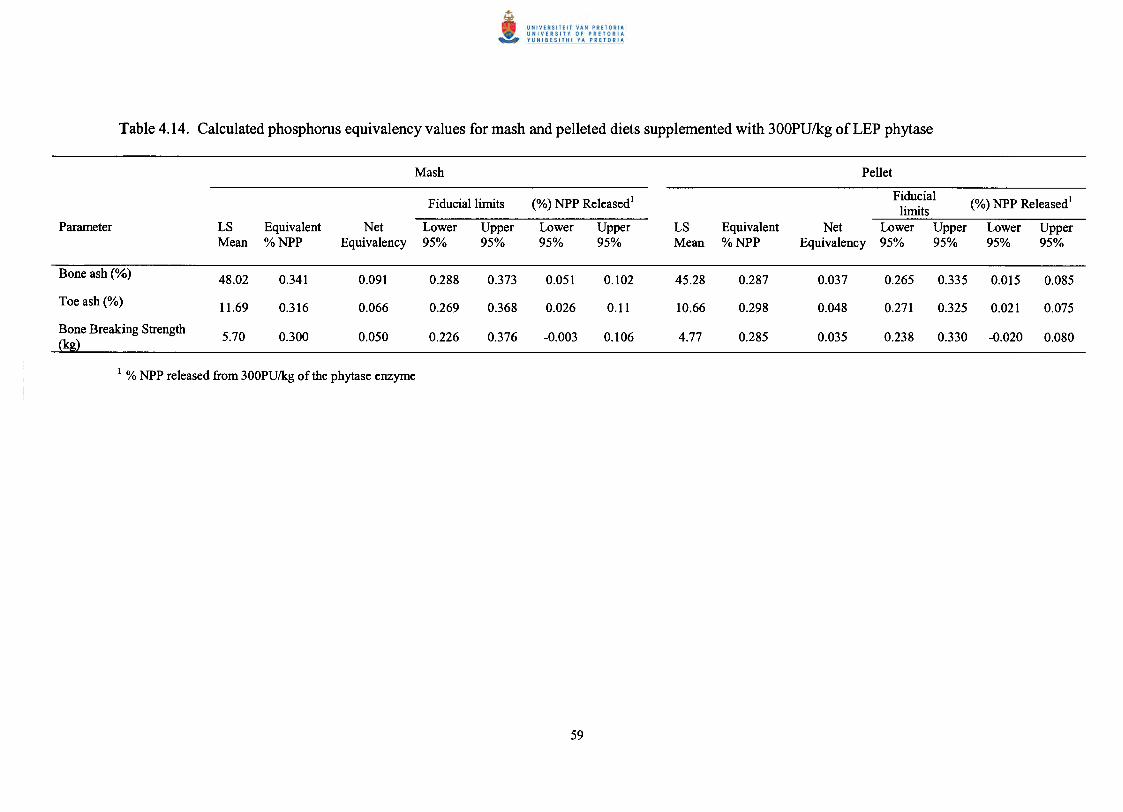
Mash Pellet
Fiducial limits (%) NPP Released I Fiducial (%) NPP Released IlimitsParameter LS Equivalent Net Lower Upper Lower Upper LS Equivalent Net Lower Upper Lower Upper
Mean %NPP Equivalency 95% 95% 95% 95% Mean %NPP Equivalency 95% 95% 95% 95%
Bone ash(%) 48.02 0.341 0.091 0.288 0.373 0.051 0.102 45.28 0.287 0.037 0.265 0.335 0.Q15 0.085
Toe ash (%) 11.69 0.316 0.066 0.269 0.368 0.026 0.11 10.66 0.298 0.048 0.271 0.325 0.021 0.075
Bone Breaking Strength5.70 0.300 0.050 0.226 0.376 -0.003 0.106 4.77 0.285 0.035 0.238 0.330 -0.020 0.080(kg)
I % NPP released from 300PUlkg of the phytase enzyme
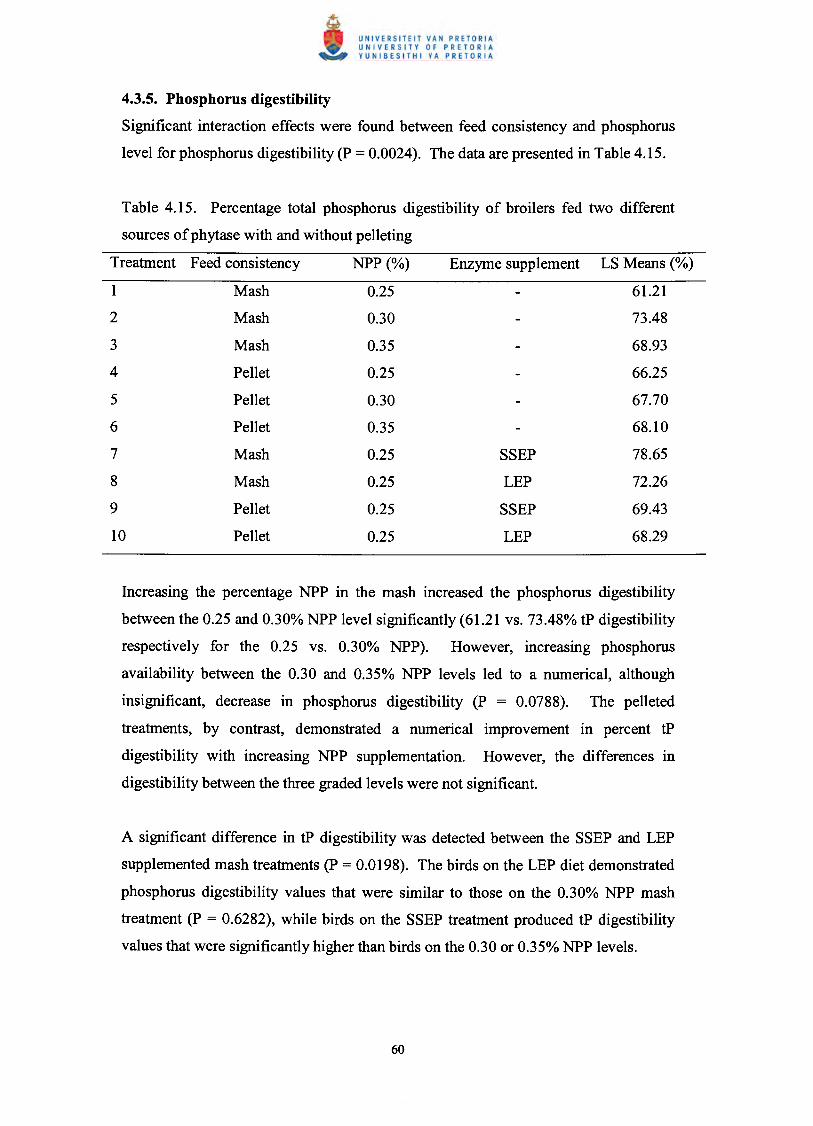
4.3.5. Phosphorus digestibility
Significant interaction effects were found between feed consistency and phosphorus
level for phosphorus digestibility (P = 0.0024). The data are presented in Table 4.15.
Table 4.15. Percentage total phosphorus digestibility of broilers fed two different
sources of phytase with and without pelleting
Treatment Feed consistency NPP(%) Enzyme supplement LS Means (%)
1 Mash 0.25 61.21
2 Mash 0.30 73.48
3 Mash 0.35 68.93
4 Pellet 0.25 66.25
5 Pellet 0.30 67.70
6 Pellet 0.35 68.10
7 Mash 0.25 SSEP 78.65
8 Mash 0.25 LEP 72.26
9 Pellet 0.25 SSEP 69.43
10 Pellet 0.25 LEP 68.29
Increasing the percentage NPP in the mash increased the phosphorus digestibility
between the 0.25 and 0.30% NPP level significantly (61.21 vs. 73.48% tP digestibility
respectively for the 0.25 vs. 0.30% NPP). However, increasing phosphorus
availability between the 0.30 and 0.35% NPP levels led to a numerical, although
insignificant, decrease in phosphorus digestibility (P = 0.0788). The pelleted
treatments, by contrast, demonstrated a numerical improvement in percent tP
digestibility with increasing NPP supplementation. However, the differences in
digestibility between the three graded levels were not significant.
A significant difference in tP digestibility was detected between the SSEP and LEP
supplemented mash treatments (P = 0.0198). The birds on the LEP diet demonstrated
phosphorus digestibility values that were similar to those on the 0.30% NPP mash
treatment (P = 0.6282), while birds on the SSEP treatment produced tP digestibility
values that were significantly higher than birds on the 0.30 or 0.35% NPP levels.
No significant differences in tP digestibility were found when comparing birds fed the
pelleted rations, although numerically, tP digestibility values for the chicks on both
the SSEP and LEP diets were very similar (69.43 vs. 68.29% respectively) and greater
than the tP digestibility values recorded for chicks on the 0.35% NPP diet.
A highly significant 9.22% decrease in tP digestibility from the mash to the pellet (P =
0.0007) was recorded for the SSEP, probably as a result of a loss of phytase activity.
This differed markedly form the LEP where a far smaller 3.97% drop was recorded
between the mash and the pelleted diets (P = 0.1182), suggesting a much lower level
of enzyme deactivation.
Growth response
Positive body weight gain responses to phytase supplementation on unprocessed diets
have been well documented (Yi et aI., 1996; Broz et aI., 1994; Sebastian et aI., 1996
and Simons et aI., 1990). Responses to phytase supplementation in this trial were
obtained, however, these were not as substantial as those reported in the literature
probably due to processing by way of pelleting. No significant interaction was found
between the feed consistency and the level of NPP for average weight gain, therefore
only main effects were analysed. Pelleting had a significant effect on weight gain (p
= 0.0099) with birds on the mash diets gaining substantially more body weight than
birds on the pelleted feed (356 vs. 341g respectively for mash vs. pellet). Significant
differences for gain were also recorded between the 0.25 to 0.35% NPP levels due to
the partial alleviation of the phosphorus deficiency. The average weight gain of birds
on both the SSEP and LEP supplemented diets was very similar (P = 0.9997).
Statistically, neither was significantly different from the 0.25 or 0.30% NPP, however,
quantitatively both were amid these two NPP levels (330, 345, 345 and 358
respectively for the 0.25, 0.25 + SSEP, 0.25 + LEP and 0.30% NPP levels). The
lower than expected body weight gains recorded for the 0.25% NPP + SSEP and
0.25% NPP + LEP treatments were probably due to the significant effect of pelleting
on the survivability of the phytase supplements. Further testing is necessary to
evaluate this.
The feed intake analysis followed a similar pattern to that of the average weight gain
analysis. Again, no significant interaction was found between the feed consistency
and the level of NPP in the diets, therefore only main effects were analysed. The
average feed intake for birds on those diets that were pelleted, as described in the
materials and methods (4.2.6), were markedly lower than birds fed the mash (521 vs.
502g respectively for the mash vs. pellet). This was probably due to a lower level of
NPP in the pelleted diets as a result of phytase deactivation. Average feed intake
increased numerically as the NPP in the diet increased from 0.25 to 0.35% NPP (467,
521 and 543g respectively for the 0.25, 0.30 and 0.35% NPP levels) although the
difference between the 0.30 and 0.35% NPP levels was not significant (P = 0.1436).
While neither of the two enzyme-supplemented NPP levels differed significantly from
the other and birds fed either type of phytase demonstrated average feed intakes
similar to those on the 0.30% NPP rations, numerically, those birds on the LEP had
higher feed intakes than birds on the SSEP (Table 4.6.). This again could be
attributed to poorer survivability ofthe SSEP when subjected to pelleting.
The average feed intake response was in agreement with the results recorded by Broz
et al. (1994). They reported that dietary phytase supplementation on low phosphorus
diets significantly improved feed intake. Yet, not all publications concur as in the
case of Zanini and Sazzad (1999) where no increase in intake was recorded.
However, this may have been due to the higher levels of non-phytate phosphorus
present in the experimental diets (0.4%).
The positive effect of microbial phytase on body weight gain and feed intake in this
trial may in part have been as a consequence of improved protein and amino acid
utilization. Phytic acid has been shown to bind with proteins at a low and neutral pH.
Phytic acid might also form complexes with proteases such as trypsin, and pepsin
(Camus and Laporte, 1976; Singh and Kirkorian, 1982). Yi et al. (1995) reported
enhanced growth performance, ileal nitrogen and amino acid digestibility and
apparent nitrogen and phosphorus retention in turkey poults fed maize soyabean meal
diets supplemented with phytase. Furthermore, it appeared that by adding microbial
phytase, the dietary CP level could be reasonably reduced without an adverse effect
on the body weight gains of birds. Yi et al. (1995) attributed this phenomenon to the
release of a more ideal pattern of available amino acids thus reducing the excretion of
dietary waste products, a process that demands a significant amount of energy on its
own.
There was no significant interaction between feed consistency and phosphorus level
on feed efficiency. Feed efficiency (gain/feed) was not significantly affected by
pelleting (0.6851 vs. 0.6875 respectively for the mash and pellet) and although
differences in the gain/feed ratio were recorded over the graded levels of NPP, these
were not significant (Table 4.8.). Only the enzyme supplemented diets differed
significantly from each other (0.690 vs. 0.667 respectively for the SSEP and LEP).
The higher gain/feed ratio for the 0.25% NPP + SSEP diets may have been due to the
measurable enzymatic side activities produced under sse conditions. Further testing
would be required to validate this. The lack of feed efficiency response is in keeping
with the results obtained from a number of publications (Zanini and Sazzad, 1999;
Broz et aI., 1994; Sebastian et aI., 1996 and Simons et aI., 1990). Sebastian et ai.
(1996) attributed this phenomenon to the simultaneous increase in both body weight
and feed intake.
4.4.2. Production response on mash diets
There was a significant interaction effect between feed consistency and phosphorus
level for the percent bone and toe ash variables, therefore individual treatment means
were compared. The percent bone and toe ash improved significantly with increased
NPP levels regardless of whether birds were on the pelleted or mash diets. Linear
response curves were produced for both (Table 4.12.). Birds on the mash
demonstrated a superior ability to accumulate ash over birds on the pellets for all three
levels of NPP and for both parameters, however the differences were not significant
(Tables 4.9 and 4.11).
The percent bone ash accumulation was improved substantially on the mash
supplemented with phytase, independent of the variety of the enzyme supplemented
(48.18 vs. 48.02% respectively for the SSEP vs. LEP). Furthermore, the percent bone
ash recorded for birds on the enzyme treated mash diets was not significantly different
to those on the 0.35% NPP mash diets (p = 0.1270 and P = 0.0885 respectively for the
SSEP vs. LEP), thus clearly illustrating the ability of the phytase enzyme to liberate
phosphorus from phytic acid.
The pattern of toe ash accumulation with microbial phytase supplementation on the
unprocessed mash was similar to the bone ash accumulation pattern on mash. Again,
neither variety of enzyme product was able to significantly improve ash accumulation
over the other. However, the percent toe ash of birds on the SSEP treatment was
numerically superior to those on the LEP and significantly higher than birds on the
0.30% NPP mash treatment (11.73 vs. 11.69 vs. 11.10% respectively for the 0.25%
NPP + SSEP vs. 0.25% NPP + LEP vs. 0.30% NPP treatments).
The bone and toe ash accumulation patterns obtained with phytase supplementation
were in agreement with the literature. Zanini and Sazzad (1999); Broz et al. (1994)
and Sebastian et al. (1996) all demonstrated that microbial supplementation of
unprocessed, low phosphorus diets improves bone mineralization as a consequence of
increased phosphorus retention and utilization. Furthermore, the percent toe ash data
was consistent with the results obtained by Yi et al. (1996), where graded levels of
NPP and phytase were added to unprocessed diets.
The consistency of the feed and the level of NPP demonstrated a strong tendency
towards interaction for bone breaking strength, although this was not significant by
predetermined limits (P = 0.0597). A comparison of individual treatment means
revealed that the response pattern for bone breaking strength over the different levels
of NPP, for both the mash and pellets, was similar to that described by the individual
treatment means of both the bone and toe ash i.e. a linear response. The bone
breaking strength was improved substantially on the unpelleted, phytase
supplemented mash diets. No significant difference in breaking strength was detected
between the SSEP and LEP mash treatments (5.94 vs. 5.70kg respectively for the
SSEP vs. LEP) although, quantitatively, the SSEP again produced superior results.
The bones from birds on the enzyme treated mash diets showed a similar resistance to
fracturing when compared to those on the 0.30% NPP mash diets (P = 0.8144 and P =0.7143 respectively for the SSEP and LEP). This reaffirms the suggestion that
phytase supplementation on unprocessed diets leads to increased bone mineralization.
The results of the bone breaking strength analysis were found to be in agreement with
the results of Sohail and Roland (1999). They investigated the influence of dietary
phytase on phytic acid phosphorus availability using male broiler chicks and found
that phytase on reduced phosphorus and calcium diets significantly improved bonestrength.
4.4.3. Production response on pelleted diets
The ability of feed enzymes to withstand pelleting is controversial with many varying
degrees of heat resistance having been recorded in the literature. Much of this
disparity might be due to the conditions at pelleting in relation to the presence of
native and supplementary enzymes (Jongbloed and Kemme, 1990).
Most publications to date have referred to the stability of those enzyme complexes
involved in reducing the viscosity of cereal based monogastric feed. These include
cellulase, xylanase, glycanase and pentosanase complexes. Partial ~-glucanase
enzyme recoveries, sufficient to significantly improve animal performance, have been
recorded at pelleting temperatures in excess of 950e (Inborr and Bedford, 1994).
Spring et aI., 1996 reported that cellulase, fungal amylase and pentosanase can be
pelleted at temperatures of up to 80oe, at least. However, Vukic Vranjes et ai. (1995)
found that when pelleting the Trichoderma viride enzyme complex [cellulase, endo-~-
(1:3)(1:4)-glucanase, xylanase], temperatures as low as 700e reduced enzyme efficacy
by 52%.
The resistance of endogenous phytases to heat was shown to decreases dramatically
once pelleting temperatures exceeded 800e (Jongbloed and Kemme, 1990). Simoes
Nunes (1993) confirmed this, recording considerably reduced levels of activity for
microbial phytase produced by Aspergillus niger at pelleting temperatures in excess of
60oe. This was particularly marked for temperatures above of 750e, while only 50%
ofthe original activity existed at 80°C.
The thermostability of an enzyme is a product of its molecular structure. Wyss et ai.
(1998) demonstrated that the phytase from A. niger T213 was a monomeric protein
that was not thermostable, nor did it have the capability to refold properly after heat
denaturation. It was established that at temperatures between 50 and 550e, the
enzyme undergoes an irreversible conformational rearrangement that is associated
with losses in enzymatic activity of 70 to 80%.
The susceptibility of the SSEP and LEP phytases to the extreme temperatures and
pressures of pelleting, as described under materials and methods (4.2.6.), differed
when measured using percent bone ash (P < 0.0001), although both were
manufactured from A. niger phytase genes. The 0.25% NPP + SSEP treatment
produced similar quantities of bone ash to the 0.25% NPP treatments which intimates
a high level of deactivation for the sse enzyme during pelleting. The LEP showed
more resilience towards pelleting, with bone ash accumulation results comparable to
those of the 0.30% NPP treatments. The level of enzyme activity retained after
pelleting was calculated to be approximately 52%, which is similar to the levels found
by Jongbloed and Kemme (1990) and Simoes Nunes (1993).
Percent toe ash, as with percent bone ash, was not significantly improved when diets
supplemented with SSEP were pelleted before being fed, while birds on the pelleted
0.25% NPP + LEP treatment were again able to amass a similar amount of toe ash to
birds on the pelleted 0.30% NPP diet. The degree of residual enzyme activity retained
after pelleting for the LEP, calculated on a percent toe ash basis, was estimated to be
approximately 54%.
The bone breaking strength for the pelleted SSEP and LEP enzyme treatments
exhibited a strong tendency to differ from each other although this difference was not
significant (P = 0.0681). The chicks fed the pelleted 0.25% NPP + SSEP treatment
produced bones of similar strength to those on the pelleted 0.25% NPP treatment, 4.02
vs. 3.83kg respectively (P = 0.6494), while birds given the pelleted 0.25% NPP + LEP
developed bones that were comparable in strength to those on the pelleted 0.30% NPP
diet, 4.77 vs. 5.13kg respectively (P = 0.373). These results imply that little of the
original enzyme activity in the SSEP mash was retained after pelleting, yet a portion
of the LEP remained viable once it had undergone the same process. The degree of
residual enzyme activity retained after pelleting for the LEP, calculated on a bone
breaking strength basis, was also estimated to be approximately 54%.
Pelleting in itself mayor may not affect the absorbability or availability of
phosphorus. Summers et al. (1989); Bayley and Thomson (1969); Bayley et al.
(1975) and Jongbloed (1967) all reported improved absorption of phosphorus with
steam pelleting on mixed feeds including maize-soyabean meal diets. This
phenomenon might have been as a result of the increase in crushed cells, which would
enhance the hydrolysis of phytic acid by native phytases (Jongbloed and Kemme,
1990). Ross et al. (1983), on the other hand, found the NPP of maize unaffected by
pelleting while Harrold et al. (1982) showed a reduction in NPP when pelleting
barely, oats, maize or soyabean meal separately. The disparity in the literature shows
that no definite conclusions can be reached regarding the effectiveness of steam
pelleting on absorbability of phosphorus. This may be due to varying pelleting
conditions, native phytase concentrations and phosphorus concentrations in the diet
(Jongbloed and Kemme, 1990).
In this trial no significant differences were found between the mash or pelleted diets
for percent bone ash, percent toe ash or bone breaking strength when compared across
increasing levels ofNPP from 0.25 to 0.35% NPP. However, quantitatively the mash
diets performed better than the pelleted diets for all three parameters and across all
three levels of NPP. The apparently reduced ability of birds on the pelleted diets to
absorb and assimilate calcium and phosphorus into the skeleton, may have been due
to the destruction of native phytases through heat and pressure. Further research is
needed to investigate this.
4.4.4. In vitro testing vs. animal response
Enzyme activity after pelleting was reduced by 100% and 88% for the SSEP and LEP
respectively when measured using the in vitro in-feed assay technique (4.2.8.).
Although sample numbers were limited, results reflected the disparity between in
vitro and animal trials recorded in a number of different publications (Vukic Vranjes
et aI., 1995; Inborr and Bedford, 1994 and Spring et aI., 1996). The reason for this
disparity might be due to the greater inactivation of enzymes in buffered solutions as a
result of different water contents and therefore different heat conductivities. The
inaccuracies could be exacerbated by the protective effect of the feed components on
enzyme activity (Spring et aI., 1996). Further, the validity of current strategies that
assay for enzyme activity in the final feed over extended incubation times is
questionable, due to the low inclusion rates in the complex final feed product (Lyons
and Walsh, 1993).
4.4.5. Phosphorus equivalency values
The percent bone ash variable provided the most precise estimation of the NPP
liberated by SSEP on both the mash and the pelleted diets followed by the percent toe
ash and then bone breaking strength (Table 4.13.). Based on percent bone ash,
between 0.040 and 0.126% NPP is released by SSEP on the mash. This was
subsequently reduced to between -0.042 and 0.026% NPP when the mash was
pelleted at 80°C in this experiment.
As with the SSEP, the efficacy of the LEP phytase was most precisely estimated from
the percent bone ash data followed by the percent toe ash and bone breaking strength
data respectively (Table 4.14.). Using bone ash, 95% fiducial limits of between 0.038
and 0.123% NPP were calculated for the LEP on the mash, which were reduced to
between 0.015 to 0.085% NPP when the mash was pelleted.
This results from the enzyme on the mash analysis are in general agreement with the
phosphorus equivalency values calculated by Yi et al. (1996) for maize-soyabean
meal diets containing 0.24% phytic acid phosphorus. They found that 250 PU/kg
released 0.02% NPP per 100 Pu.
The calculated phosphorus equivalency values, based on the percent bone and toe ash
and bone breaking strength data, reflected the apparent instability of the SSEP when
pelleted. In contrast, the LEP appeared to retain enough residual activity to liberate a
significant amount of otherwise unavailable phosphorus after being subjected to the
same process.
4.4.6. Phosphorus digestibility
Although few of the differences between the treatment means for tP digestibility were
significant, of importance is the fact that birds on the SSEP mash diet had
significantly higher phosphorus digestibility values compared to the birds on the LEP
mash diets (P = 0.0198). This is supported by the percent bone and toe ash and bone
breaking strength parameters where similar, although insignificant, differences were
found. The pattern suggests that the SSEP may be more effective than the LEP on the
unprocessed mash. However, further trials are required to validate this.
Of greater consequence is the change in digestibility that took place as a result of
pelleting. A substantial 9.22% difference in tP digestibility was recorded for the
SSEP when pelleted, which strongly suggests that a high degree of phytase
deactivation took place. Far less of the LEP appeared to be deactivated by the same
process, as illustrated by the much smaller, insignificant reduction of 3.97% between
the mash and pelleted diets.
4.5. CONCLUSION
Analysis of the bone ash data suggests that both the SSEP and LEP liberated between
0.04 and 0.12% phosphorus from phytic acid when supplemented on the unprocessed
mash diet. This impacted positively on the birds that were on an otherwise
phosphorus deficient diet, improving average weight gains, average feed intakes,
percent bone and toe ash, and average bone breaking strengths. These improvements
may have been enhanced by the increased availability of the Ca, Cu, Zn, amino acids,
protein and digestive enzymes that are normally bound to phytic acid at the regular
pH of the duodenum. The gain/feed ratio was not significantly altered by phytase
supplementation, maybe due to the simultaneous increase in both body weight and
feed intake (Sebastian et aI., 1996).
It was found that chicks fed the SSEP exhibited significantly supenor feed
efficiencies and tP digestibilities and numerically, but not significantly, superior
responses for average weight gain, average feed intake, feed efficiency, percent bone
and toe ash and bone breaking strength to those on the LEP, when compared on the
unprocessed mash. These differences may have been due to the measurable amounts
of protease, xylanase, and cellulase produced under SSC conditions.
Pelleting depressed the activity of both varieties of phytase considerably, as
demonstrated by the reduction in all growth and production parameters. However, the
LEP proved more resistant to high temperature processing, retaining approximately
50% of its initial activity after pelleting at 80°C. Phosphorus equivalency values for
the LEP in the pelleted feed were in the range of 0.015-0.085% NPP while none ofthe
SSEP appeared to survive. This disparity was also reflected by the tP digestibility
values where a 3.97 and 9.22% drop in digestibility was recorded after pelleting for
the LEP and SSEP respectively. Both enzyme products were derived from the same
parent genetic material, therefore the dissimilarity in survivability was probably as a
result of differences in downstream processing. Due to the proprietary nature of the
information regarding the manufacturing process of each enzyme, the exact reason
behind the dissimilarity was not established. However, processing by way of
granulation, absorption of the enzyme to a carrier, coating of the enzyme, or a
combination of these methods may have contributed to the discrepancy (Cowan and
Rasmussen, 1993).

Pelleting, in itself, did not appear to increase phosphorus availability. Numerically,
pelleting even decreased phosphorus availability when the mash vs. pelleted data was
compared over the graded levels of NPP on a percent bone ash, percent toe ash and
bone breaking strength basis. This may have been due to a reduction in the native
phytases present in the feed.
The discrepancy between the in vitro and animal performance trial data was not
unexpected due to the nature of current enzyme assay procedure, which involves
incubating the final feed containing small amounts of enzyme, over extended periods
of time. It follows that until alternative in vitro techniques are found, animal response
trials will probably remain the most sensitive measure of in-feed enzyme activity
(Lyons and Walsh, 1993).
The results of this phase of the study underline the importance of establishing the
degree of enzyme deactivation that is likely to occur during feed processing before
substituting a microbial phytase for inorganic phosphorus. The amount of
deactivation that occurs is particular to the pelleting conditions as well as the enzyme.

4.6. CRITICAL EVALUATION
• The pelleting temperatures recorded were an overall value for the steamed
meal. They did not take into account the localised higher temperatures of the
feed that comes into direct contact with the injected steam (Stott et aI., 1975).
• Due to the nature of the experiment, it was not possible to duplicate typical
commercial broiler housing conditions exactly. This may have altered the
growth response and feeding behaviour of the experimental birds in
comparison to birds in a commercial operation.
• In order to ensure uniformity between treatments, all diets were ground to a
powder before feeding. This may have altered the feeding behaviour and
growth response of the experimental birds compared to those on commercial
diets. Commercial diets are typically coarser and therefore less dense.
• The individual bird weights were not recorded at the end of the trial. Instead,
whole pen weights were recorded. The average weight gain, average feed
intake and feed efficiency variability could have been considerably reduced
by weighing each bird at the end of the trial, as this would have led to the
identification of outliers.
• Open feeders were used in this trial so that in the event of a feed jam the
chicks would still have had ready access to their diets. A certain amount of
wastage was caused by some of the chicks feeding from on top of the feeders
rather than from the gravity-fed troughs along the sides. It was assumed that
this wastage was relatively uniform for all the pens. Improved feeders may
have provided more accurate results.
• Only two samples for each enzyme treatment, on either the mash or the
pelleted diets, were tested using the in vitro techniques due to time
constraints. Further sampling would have provided more reliable results.

4.7. FUTURE RESEARCH PROPOSALS
• In this experiment only one pelleting temperature and one rate of enzyme
inclusion were applied to the test diets due to the limitations of the trial
facilities. It would be of practical importance to compare the two enzymes
across a range of different pelleting temperatures and enzyme inclusion rates
to establish a pattern for commercial phytase supplementation.
• Valuable information might be obtained by comparing the two enzymes,
again, across a range of different pelleting temperatures and enzyme
inclusion rates, but on different poultry diets. It would be interesting to know
how the enzymes behave on a number of the typical South African poultry
diets.
• It would be beneficial to further define the effects of any possible side
activities present in the extract produced under sse conditions. Small
improvements in efficiency may impact significantly on profitability in the
context of large-scale commercial production. Further, if these additional
enzymes do affect production, their ability to survive commercial pelleting
conditions would be of interest.
• Further investigation into how downstream processing can be applied to
improve the thermostability of the phytase enzyme, particularly the phytase
produced under sse conditions, could be undertaken.

The first phase of this study failed to produce a thermostable fungal phytase. A more
extensive screening process of the six fungal types examined, using techniques such
as UV mutagenesis and selective media, may successfully uncouple regulation and
enzyme production to the extent that sufficient quantities of a heat stable phytase are
produced.
Of the two commercial phytases tested in the second phase of the trial, the enzyme
produced under liquid culture conditions (LEP) seemed to be better able to withstand
the pelleting conditions described under the materials and methods (3.2.6). The
enzyme produced under sse conditions (SSEP) appeared to be completely destroyed
at 80oe. This contrasted with the performance of the two enzymes on the mash,
where the SSEP appeared to generate slightly better results. The difference III
thermo stability was probably due to differences in downstream processing.
Allred, J. B., R. E. Fry, L. S. Jensen, and J. McGinnis. 1957. Studies with chicks on
improvement in nutritrive value of feed ingredients by pelleting. Poult. Sci.
36:1284-1289.
A.O.A.C. 1995. Official methods of analysis (16th ed.), AOAC International.
Gaithersburg, Maryland, USA.
A.T.C.C. 2000 pamphlet guide: "Instructions for Rehydration of Freeze-Dried
Cultures".
Bayley, H. S., et al. 1975. Influence of steam pelleting and dietary calcium level on
the utilization of phosphorus by the pig. J. Anim. Sci., 40:857-863.
Bayley, H. S. and R. G. Thomson. 1969. Phosphorus requirements of growing pigs
and effects of steam pelleting on phosphorus availability. J. Anim. Sci. 28:484-
491.
Broz, J., P. Oldale, A. H. Perrin-Voltz, G. Rychen, J. Schulze, and C. Simoes Nunes.
1994. Effect of supplemental phytase on performance and phosphorus
utilization in broiler chickens fed a low phosphorus diet without addition of
inorganic phosphates. Br. Poult. Sci. 35: 273-280.
Calvert, C. C., R. J. Besecker, M. P. Plumlee, T. R. Cline, and D. M. Forsyth. 1978.
Apparent digestibility of phosphorus in barley and com for growing swine. J.
Anim. Sci. 47:420-426.
Camus, M. C., and J. C. Laporte. 1976. Inhibition de la proteolyse pepsique en vitro
par de ble. Role de l'acide phytique des issues. Ann. Bioi. Biochem. Biophys.
16:719-729.
Cantor, A. H. 1998. Using enzymes to increase the phosphorus availability in poultry
diets. Pages 349-353. In: Proceedings ofthe Fourteenth Annual Biotechnology
in the Feed Industry Symposium. Lexington, KY, USA.
Chang, C. W. 1967. Study of phytase and fluoride effects in germinating com seeds.
Plant Physiol. 44:129-142.
Chen, L. H., and S. H. Pan. 1977. Decrease in phytates during germination of pea
seeds (Pisum sativa). Nutr. Rep. Int. 16:125-131.
Choi, J. H., B. S. So, K. S. Ryu, and S. L. Kang. 1986. Effects of pelleted or
crumbled diets on the performance and the development of the digestive organs
of broilers. Poult. Sci. 65:594-597.
Church, D. C. 1976. Excretion and Digestion. Pages 125-128. In: Digestive
Physiology and Nutrition of Ruminants Volume 1 - Digestive Physiology. 2nd
edition. Published by D. C. Church.
Coffey, R. D. 1994. Bioavailability of Phosphorus in Various Feedstuffs for Pigs and
Chicks. Ph. D. Dissertation. University of Kentucky, Lexington.
Cowan, W. D., and P. B. Rasmussen. 1993. Thermostability of microbial expander
and pelleting processes and application systems for post pelleting addition.
Pages 263-267. In: Proceedings of the First Symposium of Enzymes in Animal
Nutrition. Kartause Ittingen, Switzerland.
Cromwell, G. L. 1999. Modifying manure by modifying diets. Presented at the
Nebraska Pork Exposition. February 3. Columbus, NE, USA
Davies, M. I., G. M. Ritcey, and I. Motzok. 1970. Intestinal phytase and alkaline
phosphotase of chicks: influence of dietary calcium, inorganic and phytate
phosphorus and vitamin D3• Poult. Sci. 49:1280-1286.

De Bruyne, K. 2000. New strategies in supplementation of phosphorus discussed.
Pages 11-13,22,23. Feedstuffs. March 6, 2000.
Deluca, H. F. 1989. Vitamin D, calcium, and metabolic bone disease. Page 109. In:
Nutrition and the Origins of Disease. H. F. Deluca, ed. Academic Press, Inc.,
New York, NY.
Draper, N. R. and H. Smith. 1981. Inverse Regression (Straight Line Case). Pages
47-51. In: Applied Regression Analysis, Second edition. John Wiley and
Sons, Inc., New York, Chichester, Brisbane and Toronto.
Edwards, H. M. 1982. Effect of breed and strain on utilization of suboptimal levels
of phosphorus in the ration. Pout. Sci. 62:77-84.
Edwards, H. M., Jr. 1993. Dietary 1,25-dihydroxycholecalciferol supplementation
increases natural phytate phosphorus utilization in chickens. J. Nutr. 123:567-
577.
Edwards, H. M., Jr., and J. R. Veltmann, Jr. 1983. The role of calcium and
phosphorus in the etiology of tibial dyschondroplasia. Paul. Sci. 113:1568-
1575.
Filer, K. 2000. Production of enzymes for the feed industry using solid substrate
fermentation. Pages 131-152. In: Biotechnology in the Feed Industry.
Proceedings of Alltech's 16th Annual Symposium. Eds Lyons and Jacques.
Nottingham University Press.
Gadient, M., L. Volker, and W. Schuep. 1993. Experiences with enzymes in feed
manufacturing. Pages 255-262. In: Proceedings of the First Symposium of
Enzymes in Animal Nutrition. Kartause Ittingen, Switzerland.
Gerbert, S., and C. Wenk. 1998. Allzyme phytase: The Swiss experiences. Pages
321-330. In: Proceedings of the Fourteenth Annual Biotechnology in the Feed
Industry Symposium. Lexington, KY, USA.
Gibson. D. M., and A. B. J. Ullah. 1990. Phytases and their action on phytic acid.
Pages 77-92. In: Inositol Metabolism in Plants. Wiley-Liss, Inc. New York.
Harrold, R. L., J. N. Johnson, W. D. Slanger, and C. N. Haugse. 1982. The
bioavailable phosphorus content of some common North Dakota feedstuffs. N
D. Farm. Res. 40:22-24.
Hayes, S. H., G. L. Cromwell, T. S. Stahly, and T. H. Johnson. 1979. Availability of
phosphorus in com, wheat and barley for the chick. J. Anim. Sci. 49:992-999.
Howson, S. T., and R. P. Davis. 1983. Production of phytase hydrolyzing enzyme by
some fungi. Enz. Microbiol. Technol. 5:377-382.
Inborr, J., M. R. Bedford. 1994. Stability of feed enzymes to steam pelleting during
feed processing. Anim. Feed Sci. Technol. 46:179-196.
Jensen, L. S., L. H. Merill, C. V. Reddy, and J. McGinnis. 1962. Observations on
eating patterns and rate of food passage of birds fed pelleted and unpelleted
diets. Poult. Sci. 41:1414-1419.
Jongbloed, A. W. 1987. Phosphorus in the feeding of pigs; effect of diet on the
absorption and retention of phosphorus by growing pigs. LV.V.O. Rep. No.
179, Leyland, The Netherlands.
Jongbloed, A. W., and P. A. Kemme. 1990. Effect of pelleting mixed feeds on
phytase activity and the apparent absorbability of phosphorus and calcium in
pigs. Animal Feed Science and Technology. 28:233-242.
Jongbloed, A. W., and N. P. Lenis. 1998. Environmental concerns about animal
manure. J. Anim. Sci. 76:2641-2648.

Jongbloed, A. W., Z. Morz, and P. A. Kemme. 1992. The effect of supplementary
Aspergillus niger phytase in diets for pigs on concentration and apparent
digestibility of dry matter, total phosphorus, and phytic acid in different
sections of the alimentary tract. J. Anim. Sci. 70: 1159-1168.
Johnston, S. L., and Southern, L. L. 2000. The effect of phytase addition on
metabolisable energy in diets for chicks and pigs. Multi-State Poultry Meeting
May 23-25.
Kemme, P. A., A. W. Jongbloed, Z. Morz, and A. C. Beynen. 1997. The efficacy of
Aspergillus niger phytase in rendering phytate phosphorus available in pigs is
influenced by pig physiological status. J. Anim. Sci. 75:2129-2138.
Kies, K. 1996. Phytase-Mode of action. Pages 205-212. In: Phytase in Animal
Nutrition and Waste Management: A BASF Reference Manual. BASF,
Parsippany, NJ.
Kiiskinen, T., and J. Piironen. 1990. Effect of phytase supplementation on utilization
of phosphorus in chicken diets. Pages 376-380. In: Proceedings of the 8th
European Poultry Conference, Barcelona.
Leske, K. L., and C. N. Coon. 1999. A bioassay to determine the effect of phytase on
phytate phosphorus hydrolysis and total phosphorus retention of feed
ingredients as determined with broilers and laying hens. Poult. Sci. 78:1151-
1157.
Loer, R. C. 1984. Pollution control for agriculture. Academic press, Inc. Orlando
Fl.
Low, A. G. 1989. Research into the digestive physiology of pigs. Pages 1-15. In: E.
J. van Weerden and J. Huisman ed. Nutrition and Digestive Physiology in
Monogastiric Farm Animals. Pudoc, Wageningen, The Netherlands.

Lyons, T. P., and A. Walsh. 1993. Application of enzymes in feed manufacturing.
Pages 241-254. In: Proceedings of the First Symposium of Enzymes in Animal
Nutrition. Kartause Ittingen, Switzerland.
Maddaiah, V. T., A. A. Kumick, and B. L. Reid. 1964. Phytic acid studies. Proc.
Soc. Exp. Bioi. Med. 115:391-393.
Mandviwala, T. N., and J. M. Khire. 2000. Production of high activity thermostable
phytase from thermotolerant Aspergillus niger in solid state fermentation.
Journal of Industrial Microbiology & Biotechnology. 24:237-243.
Matyka, S., W. Korol, and G. Bogusz. 1990. The retention of phytin P from diets
with fat supplements in broiler chickens. Anim. Feed Sci. Tech. 31:223-230.
McEllhiney R. R. 1985. Feed Manufacturing Technology III. American Feed
Industry Association. Arlington, VA, USA.
Mitchell, R. D., and H. M. Edwards. 1996. Effects of phytase and 1,25-
dihydroxycholecalciferol on phytate utilization and the quantitative requirement
for calcium and phosphorus in young broiler chickens. Poult. Sci. 75:95-110.
Mitchell, R. D., and H. M. Edwards. 1996. Additive effects of 1,25-
dihydroxycholecalciferol and phytase on phytate phosphorus utilization and
related parameters in broiler chickens. Poult. Sci. 75:111-119.
Mitchell, D. A., and B. K. Lonsane. 1992. Chapter 1: Definition, Characteristics and
Potential. Pages 1-13. In: H. Doelle, D. A. Mitchell, and C. E. Rolz ed. Solid
Substrate Cultivation. Elsevier Applied Science, London and New York.
Mohammed, A., M. J. Gibney, and T. G. Taylor. 1991. The effects of dietary levels
of inorganic phosphorus, calcium and cholecalciferol on the digestibility of
phytate-P by the chick. Bri. J. Nutr. 66:251-259.
Morz, Z., A. W. Joengbloed, and P. A. Kemme. 1994. Apparent digestibility and
retention of nutrients bound to phytate complexes as influenced by microbial
phytase and feeding regimen in pigs. J. Anim. Sci. 72:126-133.
Mossel, D. A. A. 1971. Physiological and metabolic attributes of microbial groups
associated with foods. J. Appl. Bacteriol. 34:95-118.
Nayini, N. R, and P. Markakis. 1986. Phytases. Pages 101-118. In: Graf, E. ed.
Phytic Acid Chemistry and Applications. Pilatus Press, Minneapolis, MN.
Nelson, T. S. 1967. The utilization of phytate phosphorus by poultry-A review.
Poult. Sci. 46:862-871.
Nelson, T. S. 1976. The hydrolysis ofphytin phosphorus by chicks and laying hens.
Poult. Sci. 55:2262-2264.
Nelson, T. S., T. R Shieh, R J. Wodzinski, and J. H. Ware. 1971. Effect of
supplemental phytase on the utilization of phytate phosphorus by chicks. J.
Nutri. 101:1289-1294.
Nir, I., Y. Twina, E. Grossman and Z. Nitsan. 1994. Quantitative effects ofpelleting
on performance, gastrointestinal tract and behaviour of meat-type chckens. Bri.
Poult. Sci. 35:589-602.
NRC. 1994. Nutrient Requirements of Poultry (9th Ed.). National Academy Press,
Washington, DC.
Oberleas, D. 1973. Phytates. Page 363. In: Toxicants Occuring Naturally in Foods.
2nd edition. National Academy Press, Washington, DC.
Orban, J. I., o. Adeola, and R Stroshine. 1999. Microbial phytase in finisher diets of
white pekin ducks: Effect on growth performance, plasma phosphorus
concentration, and leg bone characteristics. Poult. Sci. 78:366-377.
Pasamontes, L., M. Haiker, M. Wyss, M. Tessier, and A. P. G. M. van Loon. 1997.
Gene cloning, purification, and characterization of a heat-stable phytase from
the fungus Aspergillus fumigatus. Appl. Environmental. Microbial. 63:1696-
1700.
Patterson, J. T. 1969. Salmonellae in meat and poultry, poultry plant cooling waters
and effluent, and animal feeding stuffs. Appl. Bacterial. 32:329-337.
Pettersson, D., H. Graham, and P. Arnan. 1991. The nutritive value for broiler
chickens of pelleting and enzyme supplementation of a diet containing barley,
wheat and rye. Anim. Feed Sci. Technol. 33:1-14.
pfirter, H. P., and M. V. Vranjes. 1993. Influence of extrusion of broiler feeds before
pelleting on the effect of added enzymes. Pages 281-282. In: Proceedings of
the First Symposium of Enzymes in Animal Nutrition. Kartause Ittingen,
Switzerland.
Pierce, J. L. 1999. Nutritional assessment of conventional and low phytic acid com
for pigs and chickens. Ph. D. Dissertation. University of Kentucky,
Lexington.
Pierce, J. 2000. Phytase, Production and Pollution. Pages 1-20. In: T. P. Lyons and
D. J. A. Cole ed. Concepts in Pig Science. Nottingham University Press,
Nottingham, UK.
Pointillart A., A. Pourdin, M. Thomasset, and M. E. Jay. 1985. Phosphorus
utilization, intestinal phosphatase and hormone control of calcium metabolism
in pigs fed phytic phosphorus: soybean or rapeseed diets. Nutr. Rep. Int.
32:155-167.
Punna, S., and D. A. Roland. 1999. Variation in phytate phosphorus utilization
within the same broiler strain. J. Appl. Poultry Res. 8:10-15.
Qian, H., E. T. Kornegay, and D. M. Denbow. 1996. Phosphorus equivalence of
microbial phytase in turkey diets as influenced by calcium to phosphorus ratios
and phosphorus levels. Poult. Sci. 75:69-81.
Qian, H., E. T. Kornegay, and D. M. Denbow. 1997. Utilization of phytate
phosphorus and calcium as influenced by microbial phytase, cholecalciferol,
and the calcium:total phosphorus ratio in broiler diets. Poult. Sci. 76:37-46.
Quamme, G. A. 1985. Phosphate transport in intestinal brush-border membrane
vesicles: effect of pH and dietary phosphate. Am J Physiol 1985 249(2 Pt
1):GI68-76.
Raboy, V., D. B. Dickinson, M. G. Neufer. 1990. A survey of maize kernel mutants
for variation in phytic acid. Maydica 35:383-390.
Ravindran, V. 2000. The effect of Natuphos phytase on the availability of protein
and amino acids-a review. Proceedings of the Multi-State Poultry Meeting
May 23-25. Indianapolis, Indiana.
Raimbault, M. 1998. General and microbiological aspects of solid substrate
fermentation. Electronic Journal of Biotechnology. 1:1-15. (www.ejb.orj)
Reddy, C. V., L. S. Jensen, L. H. Merill, and J. McGinnis. 1962. Influence of
mechanical alteration of dietary density on energy available for chick growth.
J. Nutr. 77:428-432.
Reddy N. R., S. K. Sathe, D. K. Salunkhe. 1982. Phytates in legumes and cereals.
Adv. Food. Res. 28:1-92.
Ross, R. D., G. L. Cromwell, and T. S. Stahly. 1983. Biological availability of the
phosphorus in high moisture and pelleted com. J. Anim. Sci. 57:96 (Abstract).
Sebastian, S., S. P. Touchbum, E. R. Chavez, and P.C. Lague. 1996. The effects of
supplemental microbial phytase on the performance and utilization of dietary
calcium, phosphorus, copper, and zinc in broiler chickens fed com-soybean
meal diets. Poult. Sci. 75:729-736.
Shieh, T. R., and J. H. Ware. 1968. Survey of microorganisms for the production of
extracellular phytase. Appl. Microbial. 16:1348-1351.
Simoes Nunes, C. 1993. Evaluation of phytase resistance in swine diets to different
pelleting temperatures. Pages 269-271 In: Proceedings of the First Symposium
of Enzymes in Animal Nutrition. Kartause Ittingen, Switzerland.
Simons, P. C. M., H. A. J. Versteegh, A. W. Joengb1oed,P. A. Kemme, P. Slump, K.
D. Bos, M. G. E. Wolters, R. F. Beudeker, and G. J. Verschoor. 1990.
Improvement of phosphorus availability by microbial phytase in broilers and
pigs. Br. J. Nutr. 64:525-540.
Singh, M., and A. D. Krikorian. 1982. Inhibition of trypsin activity in vitro by
phytase. J. Agric. Food. Chern. 30:799-800.
Sohail, R. R., and D. A. Roland. 1999. Influence of supplemental phytase on
performance of broilers four to six weeks of age. Poult. Sci. 78:550-555.
Spring, P., K. E. Newman, C. Wenk, R. Messikommer, and M. Vukic Vranjes. 1996.
Effect of pelleting temperature on the activity of different enzymes. Poult. Sci.
75:357-361.
Stott, J. A., J. E. Hodgeson, and J. C. Chaney. 1975. Incidence of Salmonellae in
animal feeds and the effect of pelleting on content of Enteriobacteriaceae. J.
Appl. Bacterial. 39:41-46.
Summers, J. D., S. J. Slinger and G. Cisneros. 1967. Some factors affecting the
biological availability of phosphorus in wheat by-products. Cereal. Chern.
44;318-323.
Temperton, H. and J. Cassidy. 1964. Phosphorus requirements of poultry. I. The
utilization of phytin phosphorus by the chick as indicated by balance
experiments. Br. Poult. Sci. 5:75-80.
Theander, 0., and E. Westerlund. 1984. Chemical modification of starch by heat
treatment and further reactions of the product formed. Pages 202-207. In: P.
Zeuthen, J. C. Cheftel, C. Eriksson, M. Jul, H. Leniger, P. Linko, G. Varela,
and G. Vos, ed. Thermal Processing and Quality of Foods. Elsevier, London.
Ullah, A. H. J., and K. Sethumadhaven. 1998. Differences in active site environment
of Aspergillus ficuum phytases. Biochemical and Biophysical Research
Communications. 243:458-462.
Verschoor. 1990. Improvement of phosphorus availability by microbial phytase in
broilers and pigs. Bri. J. Nutr. 64:525-540.
Vohra, P., G. A. Grey, and F. H. Kratzer. 1965. Phytic acid-metal complexes. Proc.
Soc. Exp. Bioi. Med. 120:447-449.
Vranjes, M., H. P. pfirter, and C. Wenk. 1994. Influence of processing treatment and
type of cereal on the effect of dietary enzymes in broiler diets. Anim. Feed Sci.
techno!' 46:261-270.
Vranjes, M., H. P. pfirter, and C. Wenk. 1995. Influence of processing on dietary
enzyme effect and nutritive value of diets for laying hens. Can. J. Anim. Sci.
75:453-460.
Wise, A. 1983. Dietary factors determining the biological activities ofphytate. Nutr.
Abstr. Rev. 53:791-806.
Wodzinski. R. J., and A. B. J. Ullah. 1996. Phytase. Pages 263-302. In: Advances in
Applied Microbiology, Volume 42. Academic Press, Inc.
Wyss, M., R. Brugger, A. Kronenberger, R. Remy, R. Fimbel, G. Oesterhelt, M.
Lehmann, and A. P. G. M. van Loon. 1999. Biochemical characterization of
fungal phytases (myo-inositol hexakisphosphate phosphohydrolases): Catalytic
properties. Appl. Environmental. Microbiol. 65:367-373.
Wyss, M., L. Pasamontes, A. Friedlein, R. Remy, M. Tessier, A. Kronenberger, A.
Middendorf, M. Lehmann, L. Schnoebelen, U. Rothlisberger, E. Kusznir, G.
Wahl, F. Muller, H. Lahm, K. Vogel, and A. P. G. M. van Loon. 1999.
Biophysical characterization of fungal phytases (myo-inositol hexakisphosphate
phosphohydrolases): Molecular size, glycosylation pattern, and engineering of
proteolytic resistance. Appl. Environmental. Microbiol. 65:359-366.
Wyss, M., L. Pasamontes, R. Remy, J. Kohler, E. Kusznir, M. Gadient, F. Muller, and
A. P. G. M. van Loon. 1998. Comparison ofthe thermo stability properties of
three acid phosphotases from moulds: Aspergillus fumigatus phytase, A. niger
phytase, and A. niger pH 2.5 acid phosphatase. Appl. Environmental.
Microbiol. 64:4446-4451.
Vi, Z., E. T. Kornegay, V. Ravindran, and D. M. Denbow. 1996. Improving phytate
phosphorus availability in com and soybean meal for broilers using microbial
phytase and calculation of phosphorus equivalency values of phytase. Poult.
Sci. 75:240-249.
Zanini, S. F., and M. H. Sazzad. 1999. Effects of microbial phytase on growth and
mineral utilization in broilers fed on maize soyabean-based diets. Br. Poult.
Sci. 40:348-352.