scout for teachers workshop - education.nsw.gov.au · scout for teachers resource june 2018 v1.2...
TRANSCRIPT

Scout for Teachers Workshop
Part 2 – Presentation Guide

Scout for Teachers Resource June 2018 V1.2 Page 2 of 30
Table of Contents
1. Overview ............................................................................................................................. 3
Running sheet ................................................................................................................................. 4
2. Welcome to Scout .............................................................................................................. 6
2.1 Workshop Agenda ........................................................................................................... 6
2.2 SMART to Scout Transition ............................................................................................ 7
2.3 SMART to Scout Transition QRG for Teachers ............................................................ 8
2.4 What is Scout? ................................................................................................................. 9
2.4 Data Governance and Privacy ..................................................................................... 10
2.5 Scout for Schools Data Sources .................................................................................. 11
2.6 Report Access ............................................................................................................... 12
2.7 Granular and Aggregate Report ................................................................................... 13
2.8 Scout User Support ....................................................................................................... 13
3. Live System Demonstration ............................................................................................. 14
3.1 Exploring the Reports .................................................................................................... 18
4. Getting to know your students ......................................................................................... 29
5. Evaluation and Close ....................................................................................................... 30
6. Presenter Resources ....................................................................................................... 30
Scout for Teachers Resource June 2018 V1.2 Page 3 of 30
1. Overview
The workshop reference materials are divided into two parts.
Part 1 – Preparation Guide.
This document contains detailed information about the Scout website, how to access Scout
and the functionality and navigation features of Power BI. Presenters should familiarise
themselves with all the information to help them deliver a successful session.
Part 2 – Presentation Guide
This document is s the presentation for the workshop. Use this in conjunction with the
PowerPoint presentation. The teacher’s resource is also available on the website to assist
teacher.
Part 2
This section contains the presenter led instructions, the running sheet, suggested timeframe
for the presentation and presenter notes which correspond with the PowerPoint
presentation. The live demonstration section (Section 2), includes all information and
screenshots to assist the presenter.

Scout for Teachers Resource June 2018 V1.2 Page 4 of 30
Running sheet
Topic Duration
Welcome & Introduction (Presenter led- Scout PowerPoint Presentation)
Ask participants to login
Housekeeping
WH & S
Workshop Agenda
SMART to Scout Transition
SMART to Scout Transition QRG for Teachers
What is Scout
Data Governance and Privacy
Scout for Schools Data Sources
Report access
Granular & Aggregate reports
Scout User Support
20 mins
Live System Presentation (Presenter Led) Log into Scout via Staff Portal.
When redirected to Scout website explain the following – - Resource Library, which assists in answering Scout queries and also contain the Technical How to guide - Training page which contains links to training materials, recorded webinars, and the training schedule - Access Scout Reports, which leads to a paragraph and link to Terms of Use within Scout and the Access Scout Reports link to access Scout.
Explain to participants as this is their first time logging into Scout their landing page will be My Workspace.
Explain the Navigation Pane on the left hand side will assist in navigating within Scout.
Show them that they can access their available apps by clicking on Apps in navigation pane.
Show the following functionalities: hamburger which allows users to minimise and expand the navigation pane and sign out which is imperative for users to do every time they access Scout.
Explain when they log in again they will default to the recent view which will present to them a list of all the apps they accessed when they were last in Scout.
20 mins
Navigation & Interpreting Scout Reports
Listed below are suggested reports to deliver and the focus features to highlight of each report. The focus features and important information to present are detailed in 3.1 Exploring the Reports
NAPLAN Performance app Student Single View
o highlight pre-selected slicers NAPLAN 5, Year 5 & reading for all NAPLAN reports
o search o hover o slicers o reports explanation o eraser o breadcrumbs
60 mins

Scout for Teachers Resource June 2018 V1.2 Page 5 of 30
Student Growth o graphs o sort o breadcrumbs
NAPLAN reading and Numeracy over Time o slicers o hover o reports explanation o reset to default o breadcrumbs
NAPLAN Results o slicers o tabs o show data o back to report o breadcrumbs
NAPLAN Item Analysis App
Student Item Analysis- Numeracy: TABLE
o slicers o search/eraser
CHART o persistent filters o cross highlighting o breadcrumbs
Student Item Analysis- Reading o slicers o cross highlighting o breadcrumbs
School Item Analysis- Non -Writing o sort o slicers o breadcrumbs
Crime Statistics & Trends o drill down o drill up o breadcrumbs
Health Statistics o show data o tabs o recent
Getting to know your students with Scout 15 mins
Evaluation and Close 5 mins

Scout for Teachers Resource June 2018 V1.2 Page 6 of 30
2. Welcome to Scout
Assist participants with logging into Scout.
Participants to add the Scout icon to their Essentials. Refer to instructions on Slide 1
To gain access to Scout reports, users must complete the mandatory online learning. For
anyone who has not completed this module, they will not have access and therefore will
need to work together with someone with equivalent access rights.
2.1 Workshop Agenda
By the end of this workshop you will be able to describe Scout, your responsibilities when accessing Scout and demonstrate your ability to use Scout.
The workshop is in 4 sections:
Part 1 – SMART to Scout
- Transition from SMART to Scout
- SMART to Scout QRG
Part 2- Introduction to Scout
‒ Describe Scout, what it will deliver and why it is beneficial.
‒ Explain Data Governance and Privacy.
‒ Identify which Scout reports you will have access to.
‒ Access the support structure available.
Part 3 – Live System Demonstration
‒ Access and navigate the Scout website.
‒ Log in to Scout.
‒ Exploring Scout Reports
Part 4 – Evaluation and Close
‒ Complete training evaluation.
Note: If this course is being delivered to an audience from several schools (Open
Workshop) participants will have the opportunity to use live data for their school in
exercises in Part 3. Approval must be sought from a principal to demonstrate using a
schools live data.
Slide 4
Slide 3

Scout for Teachers Resource June 2018 V1.2 Page 7 of 30
2.2 SMART to Scout Transition Slide 6

Scout for Teachers Resource June 2018 V1.2 Page 8 of 30
2.3 SMART to Scout Transition QRG for Teachers
The images above show the current SMART reports and the equivalent report/s in Scout.
Slide 7 & 8

Scout for Teachers Resource June 2018 V1.2 Page 9 of 30
2.4 What is Scout?
Please note: The data sources that a user has access to is dependent on their role and the
education sector to which they belong.
Scout is the reporting platform for education.
Scout is supported by a Microsoft platform called Power BI.
Scout is a cloud based application, accessible via the Scout website, from most devices and current browsers.
Scout is vital for use in schools and provides access to reports, created from multiple data sources. It contains reports on student, school, staff and communities.
Scout draws information from multiple sources and converts it into easy to read reports. Users can explore a wide range of reports without the need to access numerous different applications.
Scout reports are useful for planning, analysis, research, reporting and evidence based decision-making.
The data is presented in a variety of formats, tailored for specific roles.
Please be aware that the reports draw a lot of data, therefore if accessing Scout through the BI App it is recommended that devices are connected directly to the internet.
Slide 10

Scout for Teachers Resource June 2018 V1.2 Page 10 of 30
2.4 Data Governance and Privacy
Please refer to page 5 in your resource pack. This provides a brief outline of your Data Governance and Privacy responsibilities, that you must agree to and abide by.
Data Owners and Stewards are responsible for each set of data within Scout. These owners have provided their agreement to include their data in Scout.
Data Owners define the conditions with the use of their data. They ensure that you, as the users, understand the strengths and limitation of the data, and how to appropriately interpret, use and share their data.
Note: If users are not sure about what is appropriate use of data, contact Scout User
Support team. Details are on the Scout support page of the scout website.
Slide 11
Scout for Teachers Resource June 2018 V1.2 Page 11 of 30
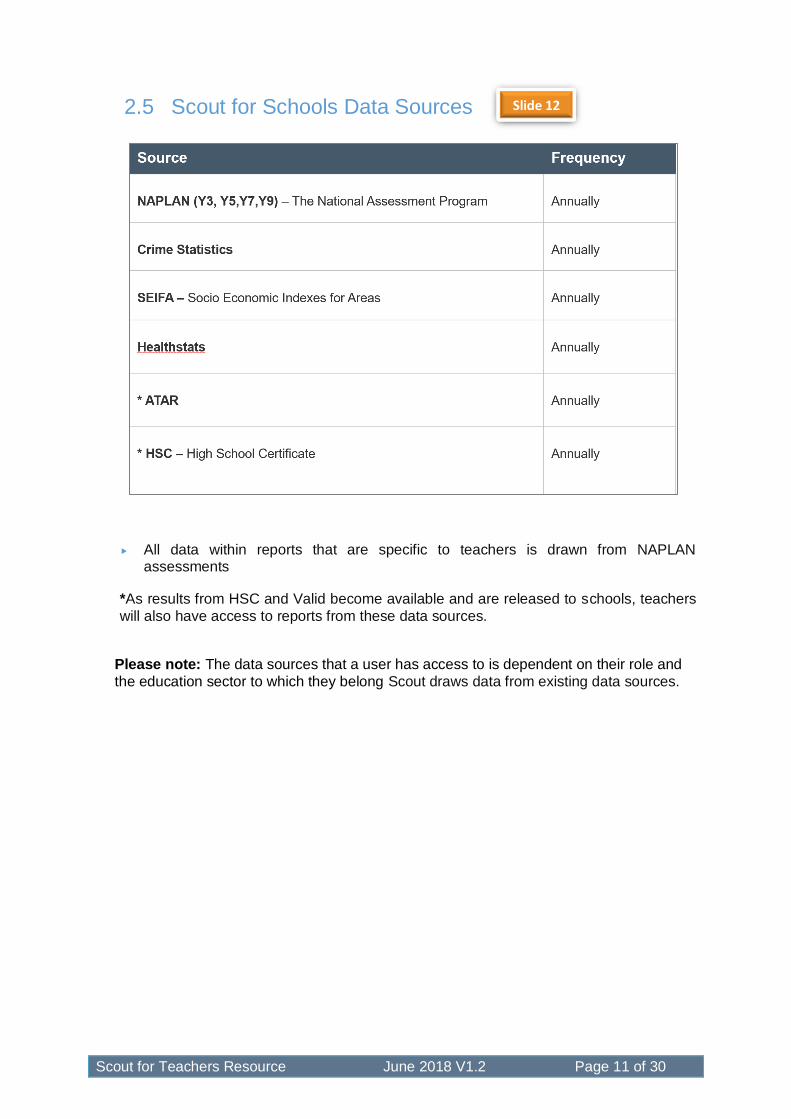
2.5 Scout for Schools Data Sources
.
All data within reports that are specific to teachers is drawn from NAPLAN assessments
*As results from HSC and Valid become available and are released to schools, teachers
will also have access to reports from these data sources.
Please note: The data sources that a user has access to is dependent on their role and
the education sector to which they belong Scout draws data from existing data sources.
Slide 12

Scout for Teachers Resource June 2018 V1.2 Page 12 of 30
2.6 Report Access
Initially teachers will only have access to four Apps – NAPLAN Item Analysis, NAPLAN Online Item Analysis, NAPLAN Performance and Community Profiles. However, over time the range of reports will increase to meet the needs of teachers.
The teachers NAPLAN Performance app is a subset of reports that are currently available in the Student Performance app that is accessed by Principals, DP’s, HT’s and AP’s.
The Employees App that Principals have access to, containing nine reports relating to staff including the Professional Development and Accreditation reports. As assistant principals and head teachers may be required to access these reports a separate App was developed that contains these two reports only. Access to these reports is not automatic and require the principal to approve and submit the Access Approval form.
School Finance reports are only available to Assistant Principals, however if head teachers require access to these reports the principal must submit an approval form also.
Slide 13

Scout for Teachers Resource June 2018 V1.2 Page 13 of 30
2.7 Granular and Aggregate Report
Scout contains two types of reports – Granular and Aggregate. Teachers will have access to
both.
Granular Reports: provide personal identifiable information about students and staff
e.g. NAPLAN Item Analysis report
Aggregate Reports: do not provide personal identifiable information.
2.8 Scout User Support
Please refer to the Participant Resource page 6 for information regarding how to contact Scout User Support.
When calling User Support to report an issue, please include as much detail as possible including the following: – screenshot of the page and a detailed description of the issue.
Slide 14
Slide 15

Scout for Teachers Resource June 2018 V1.2 Page 14 of 30
3. Live System Demonstration Log on to Scout using the DoE portal
Invite participants to work alongside the demonstration if they wish
Regularly check in with participants and ask if they have any questions.
Before accessing the reports demonstrate the following areas from the Scout home page –
Resource Library: users are encouraged to visit this section when they have a query in relation to Scout as it contains all important information relating to reports and scout functionality in the form of - Reports Explained, Technical How to Guides and FAQs (Frequently Asked Questions).
Use the hyperlinks to navigate to Reports explained and the Technical how to guides.
Scout for Teachers Resource June 2018 V1.2 Page 15 of 30
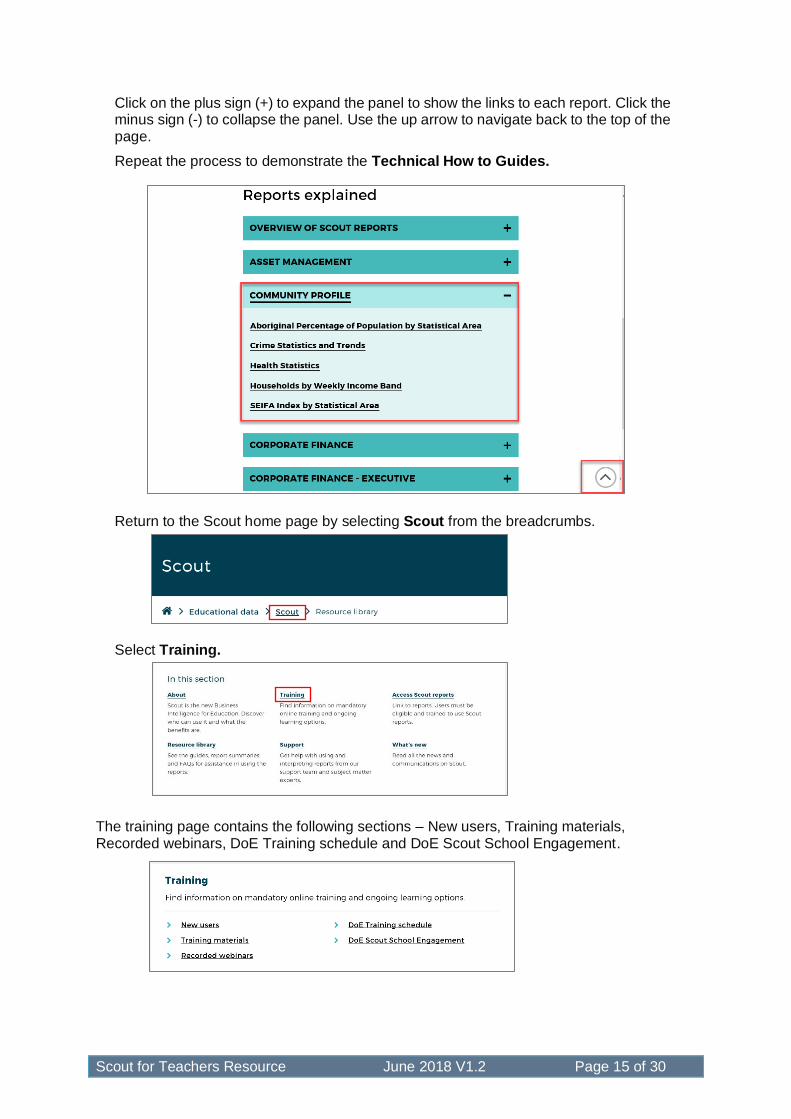
Click on the plus sign (+) to expand the panel to show the links to each report. Click the minus sign (-) to collapse the panel. Use the up arrow to navigate back to the top of the page.
Repeat the process to demonstrate the Technical How to Guides.
Return to the Scout home page by selecting Scout from the breadcrumbs.
Select Training.
The training page contains the following sections – New users, Training materials, Recorded webinars, DoE Training schedule and DoE Scout School Engagement.
Scout for Teachers Resource June 2018 V1.2 Page 16 of 30
Open each section and highlight the following information -
Training materials – contains support resources for training.
Recorded webinars – links to recorded webinars and associated PowerPoint
presentations are located in this section.
DoE Training schedule – information relating to upcoming training and
webinars sessions are provided here.
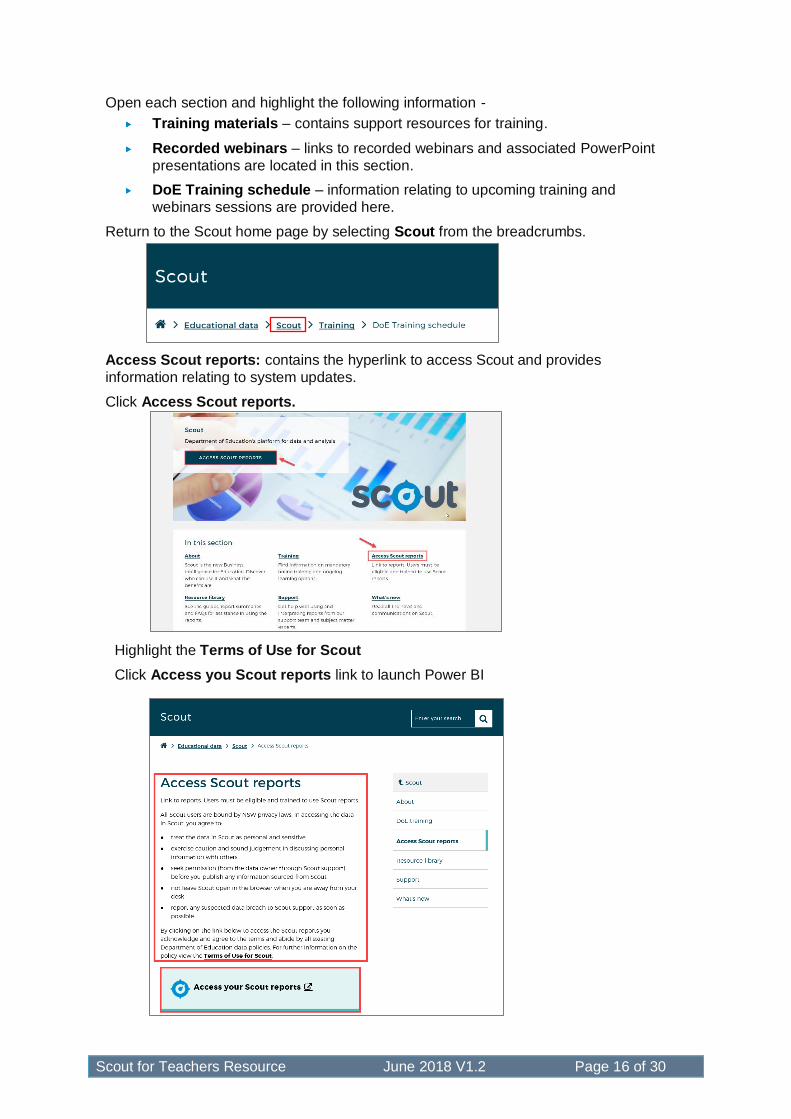
Return to the Scout home page by selecting Scout from the breadcrumbs.
Access Scout reports: contains the hyperlink to access Scout and provides
information relating to system updates.
Click Access Scout reports.
Highlight the Terms of Use for Scout
Click Access you Scout reports link to launch Power BI

Scout for Teachers Resource June 2018 V1.2 Page 17 of 30
Power BI will default to the My Workspace page
Please note: If participants do not see the screen below refer to Part 1- Preparation Guide
to assist them accessing the reports.
Click Apps.
The Apps page – displays all Apps available to a user based on their role and educational
sector.
From the App page demonstrate the following navigational features of Scout.
1. Navigation Pane - enables easy navigation through the pages of Scout
2. Hamburger - by clicking this icon the Navigation Pane collapses to increase the size
of the display area. To revert back to the expanded view, click the icon again.
3. Log out – use this icon to log out of Scout. This is especially important when using a
computer that is accessed by other staff.
4. Click on NAPLAN Performance app tile to open the reports dashboard.

Scout for Teachers Resource June 2018 V1.2 Page 18 of 30
3.1 Exploring the Reports
The section below provides recommendations on reports to demonstrate and the important
facts to highlight within each report.
1 The reports dashboard displays all reports associated with the app. Each report is
represented by a tile that a user clicks to open the report. At the top of each
dashboard there is an overview of the reports in the app.
2 Some dashboards also contain quick videos explaining complex reports or
introducing new reports.
3 Click a report tile to open the report.
IMPORTANT – All reports have preset filters and will default to NAPLAN 5, Year 5 and Reading.

Scout for Teachers Resource June 2018 V1.2 Page 19 of 30
NAPLAN Performance App
1. Student Single View
FEATURE FOCUS – Demonstrate the following:
Search - search for a particular student by entering the name in the search field and checking
the box.
Hover – hover over a graph in the NAPLAN Student Score, School Average and State
Average chart to display the information within the dialogue box.
Slicers – in the Domain slicer field select another domain.
Reports explanation – click the link to open the reports explanation.
Eraser- use the eraser to uncheck the checkbox in the search field. Highlight that using the
eraser will not delete the text in the search field. Delete the text.
Breadcrumbs – use the bread crumbs to return to the reports dashboard to select the next
report.
Highlight the following information in the report –
On the top of this dashboard there is a link to the NAPLAN SMART to Scout Quick Reference Guide for teachers.
This report displays the progress of individual students in NAPLAN across their educational journey from Year 3 through to Year 9 NAPLAN.
The NAPLAN Student Score, School Average and State Average bullet chart shows a student’s scores for each NAPLAN assessment, compared to the school average and state average. Only the NAPLAN assessments where the student was marked as “Present” are shown.
The Individual Student Growth chart is a gap analysis chart that shows the growth in a student’s score between NAPLAN assessments. The dark circle represents the starting score, and the white circle represents the ending score. The starting point for an assessment is the student’s score in the prior assessment. Where a student has missed an assessment, there will be no growth data for that assessment.
Select a student that has shown negative growth to show the black and white dot in reverse.
Select a student of interest where you know their growth was affected for a particular reason.

Scout for Teachers Resource June 2018 V1.2 Page 20 of 30
2. Student Growth
FEATURE FOCUS – Demonstrate the following:
Graphs - highlight the bar graph that sits on the top of the report page. This highlights the
percentage of students within each growth area.
Sort -use the sort functionality to sort by student name. Select the original sort option (Sort by
Prior Assessment Scaled Score) to revert to the default sort option.
Breadcrumbs - use the breadcrumbs to return to the reports dashboard to select the next
report.
Highlight the following information in the report –
The Student Growth report shows the NAPLAN growth of students in the cohort for the selected assessment and domain
The Number of Students by Growth Type bar chart shows the number of students in each growth type. This shows the proportion of students achieving in each growth type at the cohort level.
The Student Growth bar chart shows the growth achieved by each student in the cohort between NAPLAN years.
Students are ordered by base year score from lowest to highest.
The red line represents the base year score. Each bar represents the growth between the base year and the growth year for one student.
Students whose growth is green have achieved expected growth, yellow growth represents students who grew but did not achieve the level of growth required for expected growth and red growth represents students who obtained a lower score in the growth year compared to the base year.
Students with a blue bar do not have a score in the base year. This could mean they were absent from the base NAPLAN assessment, were not living in Australia at the time, or there may be a data error in the source system where the student has multiple unlinked SRNs.
Select a student that did not perform as expected in a previous assessment and compare to their most recent assessment.

Scout for Teachers Resource June 2018 V1.2 Page 21 of 30
3. NAPLAN Reading and Numeracy over Time
FEATURE FOCUS – Demonstrate the following:
Slicers -use of slicers, view report by scholastic year and selected student/s.
Hover – hover over a dot within the chart to display the reading and numeracy scores for a
student.
Reports explanation – click the link to open the reports explanation. Highlight the description
for the coloured area with the chart i.e. the green section corresponds with the top two bands.
Reset to default – select this icon to clear all selected slicers.
Breadcrumbs – use the breadcrumbs to return to the reports dashboard to select the next
report.
Highlight the following information in the report –
This report shows the distribution of students' NAPLAN Reading and Numeracy results across multiple assessments.
Each scatterplot compares NAPLAN Reading scores (on the x-axis) with NAPLAN Numeracy scores (on the y-axis) for the same assessment
Each data point in a chart represents the Reading vs Numeracy scaled score for one student.
Students in the Top 2 bands for both reading and numeracy appear in the green area, students in the Middle 2 bands for both, or the Middle 2 for one and the Top 2 for the other, will appear in the yellow area. Students in the Bottom 2 bands for either Reading, Numeracy or both, will appear in the red area.
Please be aware this reports provides visibility of students NAPLAN results for all students who have been enrolled at your school regardless of where they sat the NAPLAN test/s.
Select a scholastic and cohort year that may show a particular positive or negative trend to discuss.

Scout for Teachers Resource June 2018 V1.2 Page 22 of 30
4. NAPLAN Results
FEATURE FOCUS – Demonstrate the following:
Slicers -use the domain slicers to select different domains. Use CTRL and click to multi
select all the domains
Tabs – this report has two tabs – Scores and Bands.
Show Data – hover over the Ellipsis to select Show Data. The graph and data table are
displayed.
Back to Report – select Back to Report to return to the original screen.
Breadcrumbs – use the breadcrumbs to return to the reports dashboard to select the next
report.
Highlight the following information in the report –
This report has 2 tabs - Scores and Bands
It provides school staff with access to the prior NAPLAN scores of their current students, or current NAPLAN scores of their past students. It compares students to the NSW DoE average scores for each NAPLAN domain and compares students to other students within the cohort.
The Student Scaled Score Table provides data of individual student scores for the selected assessment and domain. Only students who participated in at least one NAPLAN domain are present, with data displaying for attended domain and no data for non-present domains.
Student Scaled Score vs State Average bar chart compares each student’s scaled score for the selected assessment and domain with the NSW DoE average scaled score for the same assessment and domain.
Student NAPLAN Scaled Scores and Bands by Assessment and Domain displays the student’s band category, band sub category, band and score for the selected assessment and domain.
Select a particular cohort student group to display their results.

Scout for Teachers Resource June 2018 V1.2 Page 23 of 30
NAPLAN Item Analysis App
1. Student Item Analysis - Reading
This report has two tabs – Table and Chart. Highlight the features and facts for each tab.
PLEASE NOTE – All NAPLAN Item Analysis student reports have similar features and
information for different domains.
TABLE
FEATURE FOCUS – Demonstrate the following:
Slicers – the default slicers for all reports are NAPLAN 5, Year 5 and Reading. Select
different slicers in Domains and Assessment fields.
Search - search for a particular student by entering the name in the search field and
checking the box.
Eraser- use the eraser to uncheck the checkbox. Highlight that the eraser will not delete the
text in the search field. Delete the text.
Highlight the following information in the report–
A student must be selected first in this report for data to be displayed.
Slicers include both scholastic year and cohort student groups.
Select a question to reveal the response details.
Demonstrate the following links -
- question link – displays the question
- stimulus link – displays the test / passage
- teaching strategy link – opens the relevant link on the teaching and learning intranet page.
Scout for Teachers Resource June 2018 V1.2 Page 24 of 30
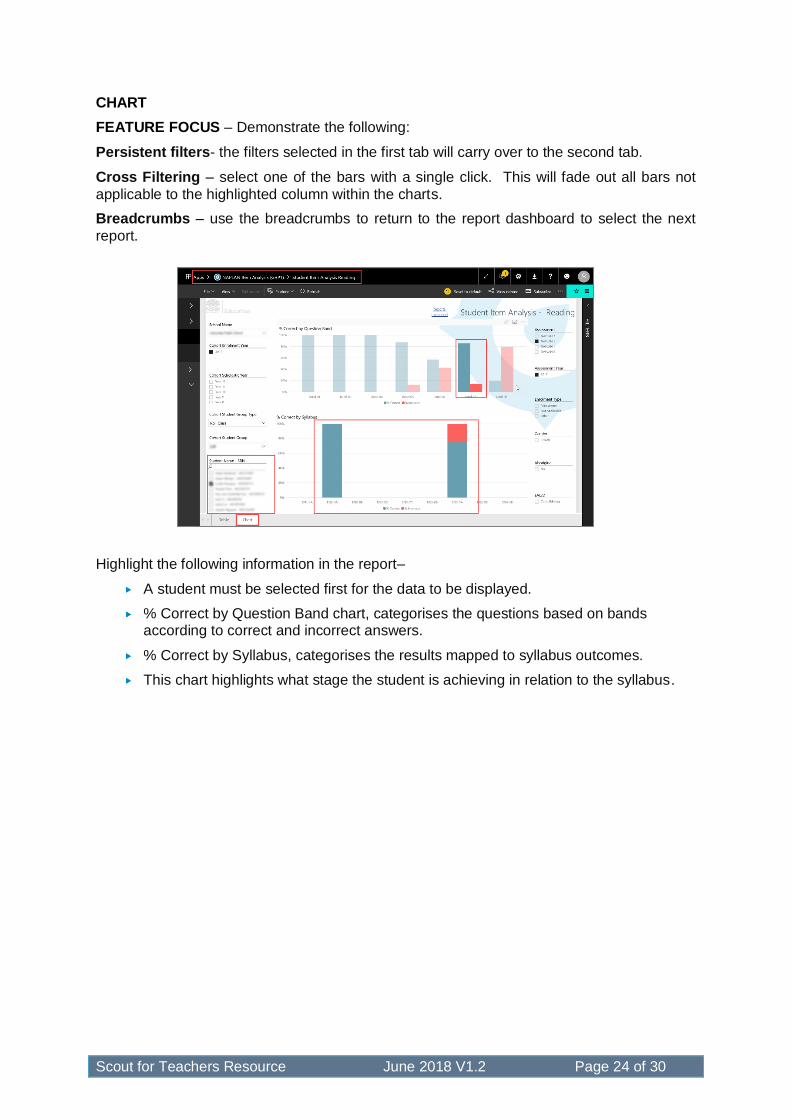
CHART
FEATURE FOCUS – Demonstrate the following:
Persistent filters- the filters selected in the first tab will carry over to the second tab.
Cross Filtering – select one of the bars with a single click. This will fade out all bars not
applicable to the highlighted column within the charts.
Breadcrumbs – use the breadcrumbs to return to the report dashboard to select the next
report.
Highlight the following information in the report–
A student must be selected first for the data to be displayed.
% Correct by Question Band chart, categorises the questions based on bands according to correct and incorrect answers.
% Correct by Syllabus, categorises the results mapped to syllabus outcomes.
This chart highlights what stage the student is achieving in relation to the syllabus.

Scout for Teachers Resource June 2018 V1.2 Page 25 of 30
2. School Item Analysis - Writing
FEATURE FOCUS – Demonstrate the following:
Slicers – select a student to display the results.
Cross highlighting – select a column in the Student Writing Scores by Criterion. Only the
selected criterion information will be displayed in the Possible Score Outcomes per Criterion table below
Breadcrumbs – use the breadcrumbs to return to the report dashboard to select the next
report.
Highlight the following information in the report–
Each criteria has a score associated to it.
The percentage of students who achieved each criterion score is displayed along with a comparison between the school, SSSG and State. This enables a teacher to ascertain areas of need based on the criteria and proportion of particular marks given.
Chart – displays the writing score distribution in a bar chart against school, SSSG and state.

Scout for Teachers Resource June 2018 V1.2 Page 26 of 30
3. School Item Analysis - Non-Writing
This report has two tabs – Table and Chart. Highlight the features and facts for each tab.
FEATURE FOCUS – Demonstrate the following:
Sort - sort by School Correct % column to show the smallest percentage on the top. Select
that row to discuss the Question Details description.
Slicers – select different slicers in the Question Band and Domain fields.
Breadcrumbs – use the breadcrumbs to return to the reports dashboard to select the next
report.
Highlight the following information in the report –
A question must be selected first for the bottom chart/s to populate.
The report displays the proportion of students achieving the correct answers and associated band for each question.
Sort by School Correct %, by clicking on the column name to sort in descending
order. This demonstrates how a teacher can quickly identify the questions students have struggled with the most. Selecting the description in the Question Details panel highlights the area of need for the students.

Scout for Teachers Resource June 2018 V1.2 Page 27 of 30
Community Profile App
1. Crime Statistics & Trends
FEATURE FOCUS – Demonstrate the following:
Drill down – activate the drill down functionality. Select a column to drill down to the next
level.
Drill up – use the drill up icon to drill up to the top level.
Breadcrumbs - use the breadcrumbs to return to the reports dashboard to select the next
report.
Highlight the following information in the report –
This report will default to Albury City Council. Ensure the correct LGA is selected.
Use this report to understand the prevalence of specific types of crime in your area and to determine if programs need to be implemented in the school to assist students/carers.
This report provides insight into the crime rate of the LGA the school is based in. This will allow for formulating policy related to improving student welfare and engaging the local community.
Scout for Teachers Resource June 2018 V1.2 Page 28 of 30
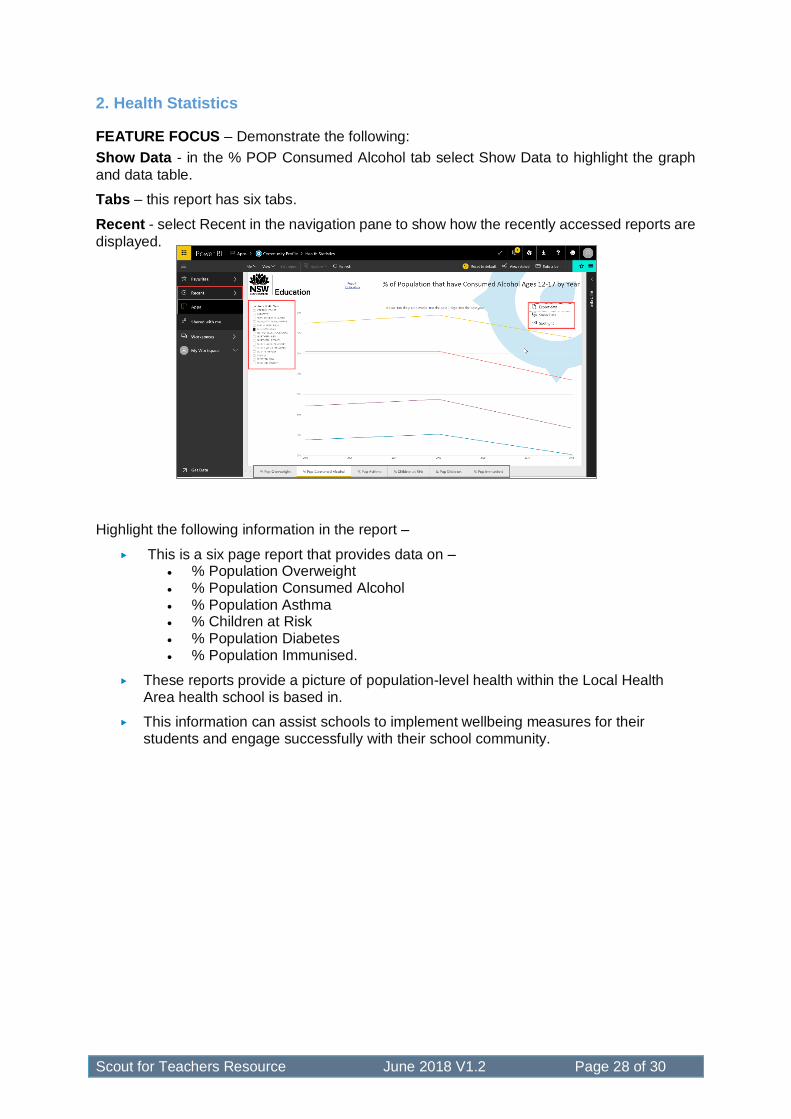
2. Health Statistics
FEATURE FOCUS – Demonstrate the following:
Show Data - in the % POP Consumed Alcohol tab select Show Data to highlight the graph
and data table.
Tabs – this report has six tabs.
Recent - select Recent in the navigation pane to show how the recently accessed reports are
displayed.
Highlight the following information in the report –
This is a six page report that provides data on – % Population Overweight % Population Consumed Alcohol % Population Asthma % Children at Risk % Population Diabetes % Population Immunised.
These reports provide a picture of population-level health within the Local Health Area health school is based in.
This information can assist schools to implement wellbeing measures for their students and engage successfully with their school community.
Scout for Teachers Resource June 2018 V1.2 Page 29 of 30
15 mins
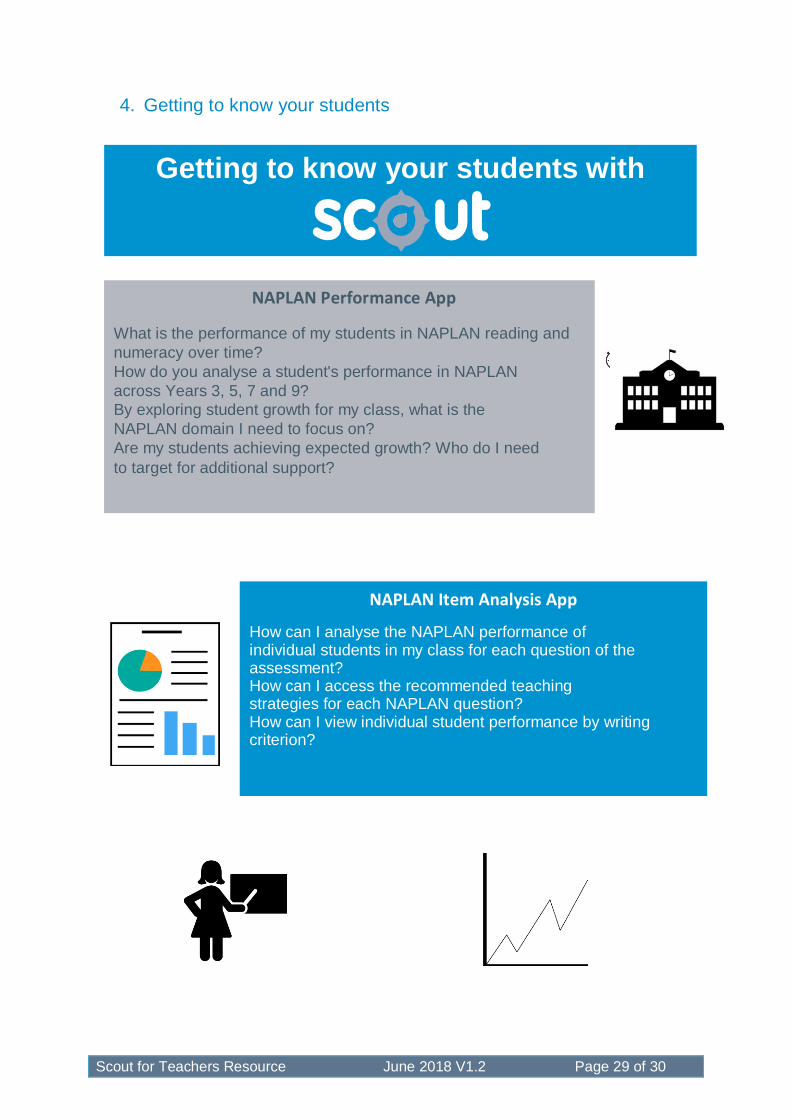
4. Getting to know your students
NAPLAN Performance App
What is the performance of my students in NAPLAN reading and
numeracy over time?
How do you analyse a student's performance in NAPLAN
across Years 3, 5, 7 and 9?
By exploring student growth for my class, what is the
NAPLAN domain I need to focus on?
Are my students achieving expected growth? Who do I need
to target for additional support?
NAPLAN Item Analysis App
How can I analyse the NAPLAN performance of individual students in my class for each question of the assessment? How can I access the recommended teaching strategies for each NAPLAN question? How can I view individual student performance by writing criterion?
Getting to know your students with

Scout for Teachers Resource June 2018 V1.2 Page 30 of 30
5. Evaluation and Close
In this final section participants will have an opportunity to review what they have achieved
today. Please hand out the evaluation sheets (located as an Appendix in the Preparation
Guide) and ask the participants to fill out the training evaluation.
6. Presenter Resources
Please find below links to useful Scout Training Resources:
Participant Resource - Training materials | Scout
Reports Explained - Resource library | Scout
Scout Quick Reference Guide - Training materials | Scout
Webinars - Webinars | Scout
SEF- Scout as a source of evidence | School excellence and accountability
Document Version Control
Date Document / Purpose Version Author Authorised
May 2018 Training Resource for Teachers - new version for roll out to teachers.
V1.0 Scout Training Team
Bryan Netto
Director IM
© State of New South Wales (Department of Education), 2018.The copyright material published in this resource is subject to the Copyright Act 1968 (Cth) and is owned by the NSW Department of Education or, where indicated, by a party other than the NSW Department of Education (third-party material).
Slide 17