scnaphase: using haplotype resolved read depth to genotype
TRANSCRIPT

1
sCNAphase: using haplotype resolved read depth to
genotype somatic copy number alterations from low
cellularity aneuploid tumors
Wenhan Chen1, Alan J. Robertson1, Devika Ganesamoorthy1 and
Lachlan J.M. Coin1
1 Institute for Molecular Biosciences, The University of Queensland.
Address correspondence to:
Wenhan Chen <[email protected]>
Lachlan J.M. Coin <[email protected]>
Keywords: chromosomal abnormalities, contamination, haplotype
phasing, normal, ploidy, sCNAphase, somatic copy number
alterations
not peer-reviewed) is the author/funder. All rights reserved. No reuse allowed without permission. The copyright holder for this preprint (which was. http://dx.doi.org/10.1101/038828doi: bioRxiv preprint first posted online Feb. 4, 2016;

2
Abstract
Accurate identification of copy number alterations is an essential step in understanding the events driving
tumor progression. While a variety of algorithms have been developed to use high-throughput
sequencing data to profile copy number changes, no tool is able to reliably characterize ploidy and
genotype absolute copy number from tumors which contains less than 40% tumor DNA. To increase our
power to resolve the copy number profile of these low cellularity tumor genomes, we developed a novel
approach which pre-phases heterozygote germline SNPs in order to replace the commonly used 'B-allele
frequency' with a more powerful 'parental-haplotype frequency'. We also describe a novel 'digital spectral
karyotyping’ approach for visualization of copy number alterations.
We apply our tool - sCNAphase - to characterize the copy number and loss-of-heterozygosity profiles of
four publicly available breast cancer cell-lines. Comparisons to previous spectral karyotyping and
microarray studies revealed that sCNAphase reliably identified overall ploidy and the individual copy
number changes from each cell-line. Analysis of tumor-normal cell-line mixtures demonstrated the
capacity of this method to determine the level of tumor purity as little as 5% tumor DNA and to
consistently identify sCNAs and characterize ploidy in samples at 10% tumor purity. This novel
methodology has the potential to bring sCNA profiling to low-cellularity tumors, a form of cancer unable
to be profiled by current methods.
not peer-reviewed) is the author/funder. All rights reserved. No reuse allowed without permission. The copyright holder for this preprint (which was. http://dx.doi.org/10.1101/038828doi: bioRxiv preprint first posted online Feb. 4, 2016;

3
Introduction
Somatic Copy Number Alterations (sCNAs) represent an important class of mutation in the cancer
genome, evident by the large number of short focal sCNAs and larger chromosomal scale changes seen
in the analysis of individual tumor genomes (Beroukhim et al. 2010). This class of mutation has been
linked to tumor progression, metastasis, multidrug resistance and poor clinical outcomes (Carter et al.
2006; Sheffer et al. 2009; Lee et al. 2011; Hieronymus et al. 2014; Bambury et al. 2015). Despite the
sporadic accumulation of sCNAs during tumor progression, a number of regions are subject to recurrent
sCNAs (Zack et al. 2013). Some of these recurrent sCNAs are found across different cancer types, while
others were specific to a particular type or subtype of the disease (Chin et al. 2006; Sheffer et al. 2009;
Cho et al. 2011; Curtis et al. 2012). As a result, determining the sCNAs in an individual tumor sample
has become standard practice in pathology labs for the treatment of some cancers. For example, this is
routinely used to assign the optimal chemotherapeutic treatments for patients with breast cancer who
contain additional copies of the HER2 gene (Bast et al. 2001; Slamon et al. 2001).
Despite the importance of this class of mutation, it can be difficult to characterize the copy number profile
of a tumor genome. Large numbers of invading cells with a normal, diploid genome, such as endothelial
or immune cells, can obscure the mutations in the tumor genome (Carter et al. 2012). These low
cellularity samples represent a significant challenge as the best current methods fail to produce the correct
results when tumor purity falls below 40% (Supplementary Table 1). The tumor purity for a number of
serious forms of cancer, such as Breast Invasive Carcinoma, Lung Adenocarcinoma and some forms of
Melanoma routinely fall below this threshold, moreover multiple cancers including renal clear cell
carcinoma and lower grade glioma show a decreased survival time with lower tumor purity (Aran et al.
2015). Thus there is an important unmet need to identify copy number mutations in low purity samples.
It is possible to survey the copy number profile of samples with a high tumor content, using a number of
different techniques, however it is difficult to characterize the full spectrum of sCNAs with a single
technology. Spectral Karyotyping (SKY) is one of the most accurate tools for characterizing and
visualizing genome wide changes in ploidy (Schröck et al. 1996; Sirivatanauksorn et al. 2001; Storlazzi
et al. 2010; Stephens et al. 2011), but suffers from a limited resolution and is low throughput. More
recent technologies, such as comparative genomic hybridization (CGH) and single-nucleotide
polymorphism (SNP) microarrays have all provided powerful approaches for interrogating the tumor
genome and identifying copy number mutations (Zhao et al. 2004; Conrad et al. 2010; Pinto et al. 2011;
Carter et al. 2012; Krijgsman et al. 2014). While these approaches have been used effectively to profile
sCNAs across a large number of tumor samples, the performance of these tools are restricted by the
resolution of different microarray platforms.
High throughput sequencing (HTS) is a powerful technology for identifying sCNAs, which may make it
possible to characterize the complete copy number profile of impure cancer samples. A number of
computational tools have been designed to identify copy number changes, characterize loss of
not peer-reviewed) is the author/funder. All rights reserved. No reuse allowed without permission. The copyright holder for this preprint (which was. http://dx.doi.org/10.1101/038828doi: bioRxiv preprint first posted online Feb. 4, 2016;

4
heterozygosity (LOH) and identify homozygous deletions, as well as address the challenges posed by
stromal cell contamination in tumor samples from HTS data (Supplementary Table 1). These tools use
a variety of different signals present in HTS data including read depth aberration, B-allele frequency at
somatic and germline SNPs. Many of these tools do not address ploidy, and most of them are not suitable
for samples with tumor purity less than 40% (Yau et al. 2010; Gusnanto et al. 2012; Li and Xie 2014;
Oesper et al. 2014). Only Absolute and CNANorm have an explicit parameterization of ploidy in their
model. Absolute has been shown to accurately estimate tumor ploidy and purity in tumor cell-line derived
tumor-normal mixture samples which contained as little as 40% tumor DNA (Carter et al. 2012).
CLImAT is a recently introduced tool, which uses read-depth and BAF to estimate the ploidy and purity
of impure tumor genomes and also characterizes copy number and LOH changes (Yu et al. 2014). At
20% tumor purity, CLImAT demonstrated more robust purity and ploidy estimates as well as greater
sCNA and LOH calling accuracy than Absolute (Carter et al. 2012), SNVMix (Goya et al. 2010),
Control-FREEC (Boeva et al. 2012) and Patchwork (Mayrhofer et al. 2013), however this was evaluated
using simulated tumor chromosomes rather than tumor-normal mixture samples.
Modelling BAF has strengths and limitations complementary to read-depth (RD) modelling. BAF -
which effectively uses an internal control of one allele versus the other - is less susceptible to position-
specific biases, such as GC and mappability biases. However, one striking disadvantage of BAF
modelling is that it is not possible to directly summate the allelic depth signal over multiple adjacent
SNPs, as the non-reference alleles at one adjacent positions may not be on the same parental haplotype.
Summating RD over windows of size from 10kb up to 1Mb leads to substantial increases in statistical
power to detect sCNAs. We hypothesized that application of state-of-the-art computational phasing
approaches, incorporating population haplotype from the 1000 genomes project (Altshuler et al. 2012)
as well as direct within-read phasing (Delaneau et al. 2013), would allow us to sum allelic depth along
phased haplotypes to obtain parental haplotype frequency (PHF) estimates. We further hypothesized that
modelling PHF instead of BAF could lead to improved power characterize tumor ploidy and sCNAs at
ultra-low levels of tumor purity.
In this manuscript we present sCNAphase (https://github.com/Yves-CHEN/sCNAphase) , a tool, which
has been developed to characterize the full copy number profile of a cancer sample across a range of
tumor purity. It achieves this by inferring tumor ploidy, sCNAs and regions of LOH across all levels
tumor purity by integrated modelling of PHF and RD. We show that sCNAphase has accuracy
comparable to SKY in determining genome-wide increases in ploidy and it is able to identify focal
sCNAs that are consistent with results from microarray analyzes. We also show that sCNAphase can
confidently determine regions that have undergone a loss of heterozygosity event and identify regions of
homozygous deletion. Moreover, sCNAphase consistently generates accurate sCNA segmentations at
low levels of tumor purity and can accurately define levels of tumor purity in mixtures containing 5%
tumor DNA.
not peer-reviewed) is the author/funder. All rights reserved. No reuse allowed without permission. The copyright holder for this preprint (which was. http://dx.doi.org/10.1101/038828doi: bioRxiv preprint first posted online Feb. 4, 2016;
5
Results
We downloaded high quality sequencing data from eight publicly available, well-characterized cancer
cell-lines. These cell-lines were generated from matched tissue samples and represent breast cancer and
normal tissue samples from four patients (Table 1).
Table 1. Samples included in analysis Cell-line Platform Library Coverage Tissue Annotation
HCC1143 HiSeq2000 Paired WGS 50x Breast Ductal
52 years female, Caucasian with STAGE IIA, grade 3 Breast ductal carcinoma
HCC1143BL HiSeq2000 Paired WGS 60x, 30x Blood Paired 60x normal for HCC1143 and independent 30x sample
HCC1954 HiSeq2000 Paired WGS 58x Breast
Ductal
61 years female, Indian with STAGE IIA, grade 3 Breast ductal carcinoma.
HCC1954BL HiSeq2000 Paired WGS 71x, 30x Blood Paired 60x normal for HCC1954 and independent 30x sample
HCC1187 HiSeq2000 Paired WGS 93x Breast
Ductal
41 years female, Caucasian with STAGE IIA, grade 3 Breast ductal carcinoma
HCC1187BL HiSeq2000 Paired WGS 49x Blood Paired normal for HCC1187
HCC2218 HiSeq2000 Paired WGS 83x Breast ductal
38 years female, Caucasian with STAGE IIIA, grade 3 Breast ductal carcinoma
HCC2218BL HiSeq2000 Paired WGS 37x Blood Paired normal for HCC2218
Haplotype phasing greatly improves the power to identify sCNA from allelic depth
The B-allele frequency (BAF) is commonly used to detect the presence of copy number variants (CNVs)
in normal, diploid genome(Coin et al. 2010). This signal can also be interrogated to find sCNAs by
looking for deviations from an expected equal ratio of two alleles at germ-line heterozygous SNPs. In
order to investigate the power in this signal, we calculated Allelic Depth (AD) at all germ-line
heterozygous SNPs in a tumor derived cell-line (HCC1143, see Table 1) at varying tumor purities, as
well as in the matched normal sample (note that an independent normal was used to generate artificial
mixed tumor/normal samples at varying purity, see Methods). The distribution of p-values under a null
model which assumes an equal ratio is inflated even for the normal sample, due to the presence of
germline CNVs (Supplementary Figure 1), thus we instead calculate p-values under the assumption
that tumor BAF is the same as germ-line BAF, which corrects this inflation (Figure 1A). BAF provides
substantial power to identify sCNA at 100% purity (Figure 1B.), but the signal is too weak at 5% purity
to identify any sCNAs (Figure 1C.).
not peer-reviewed) is the author/funder. All rights reserved. No reuse allowed without permission. The copyright holder for this preprint (which was. http://dx.doi.org/10.1101/038828doi: bioRxiv preprint first posted online Feb. 4, 2016;
6
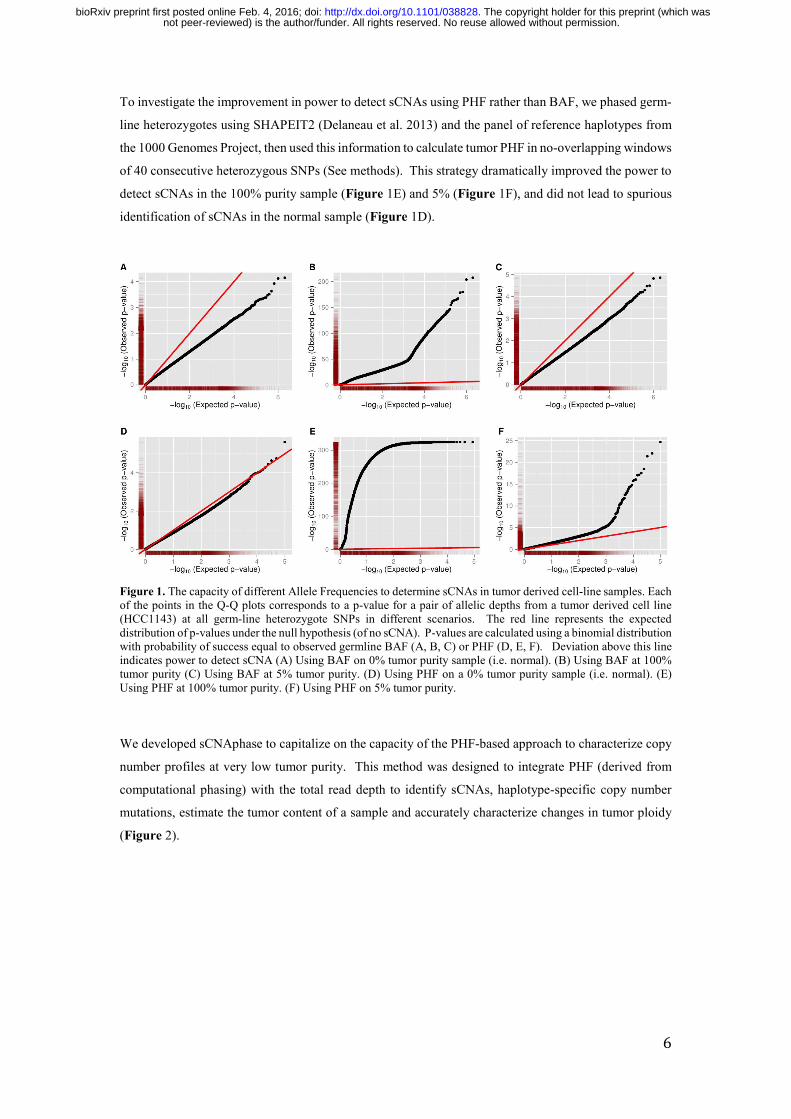
To investigate the improvement in power to detect sCNAs using PHF rather than BAF, we phased germ-
line heterozygotes using SHAPEIT2 (Delaneau et al. 2013) and the panel of reference haplotypes from
the 1000 Genomes Project, then used this information to calculate tumor PHF in no-overlapping windows
of 40 consecutive heterozygous SNPs (See methods). This strategy dramatically improved the power to
detect sCNAs in the 100% purity sample (Figure 1E) and 5% (Figure 1F), and did not lead to spurious
identification of sCNAs in the normal sample (Figure 1D).
Figure 1. The capacity of different Allele Frequencies to determine sCNAs in tumor derived cell-line samples. Each of the points in the Q-Q plots corresponds to a p-value for a pair of allelic depths from a tumor derived cell line (HCC1143) at all germ-line heterozygote SNPs in different scenarios. The red line represents the expected distribution of p-values under the null hypothesis (of no sCNA). P-values are calculated using a binomial distribution with probability of success equal to observed germline BAF (A, B, C) or PHF (D, E, F). Deviation above this line indicates power to detect sCNA (A) Using BAF on 0% tumor purity sample (i.e. normal). (B) Using BAF at 100% tumor purity (C) Using BAF at 5% tumor purity. (D) Using PHF on a 0% tumor purity sample (i.e. normal). (E) Using PHF at 100% tumor purity. (F) Using PHF on 5% tumor purity.
We developed sCNAphase to capitalize on the capacity of the PHF-based approach to characterize copy
number profiles at very low tumor purity. This method was designed to integrate PHF (derived from
computational phasing) with the total read depth to identify sCNAs, haplotype-specific copy number
mutations, estimate the tumor content of a sample and accurately characterize changes in tumor ploidy
(Figure 2).
not peer-reviewed) is the author/funder. All rights reserved. No reuse allowed without permission. The copyright holder for this preprint (which was. http://dx.doi.org/10.1101/038828doi: bioRxiv preprint first posted online Feb. 4, 2016;

7
Figure 2. The individual steps that make up the sCNAphase workflow. (A) Each panels shows an individual process used by sCNAphase to characterize the copy number profile from matched tumor and normal pairs. (B) The BAFs from a region of chromosome 8 from the HCC1143 breast cancer cell-line. (C) The application of phasing to the BAF data makes it possible to identify PHFs, regions composed of 40 adjacent germline, heterozygous SNPs. Each PHF increase the power of this analysis and makes it possible to better reflect the copy number profile of this region. (D) Application of the sCNAphase pipeline to the phased data, calls specific copy number changes.
In order to characterize the complete copy number profile of a tumor sample, sCNAphase is broken into
a number of distinct steps (Figure 2). Analysis of the matched normal sample is used to identify
heterozygous SNPs present in the germline, these results are passed through SHAPEIT2 (Delaneau et al.
2013), a method that uses information from the 1000 Genomes Project to determine the haplotype of
each these heterozygous alleles. The allelic depth from groups of 40 of these polymorphic sites are
merged to produce a PHF region (90% of PHF regions are < 100kb). This PHF information is first used
to estimate the maximum likelihood of a tumor belonging to a specific ploidy, our model examines a
larger range of ploidy than other tools, allowing us to characterize samples more complex than a triploid.
not peer-reviewed) is the author/funder. All rights reserved. No reuse allowed without permission. The copyright holder for this preprint (which was. http://dx.doi.org/10.1101/038828doi: bioRxiv preprint first posted online Feb. 4, 2016;

8
This ploidy information is used to determine tumor purity and estimate tumor cellularity in an iterative
manner. Together this information used to identify the individual copy number changes (Methods).
Analysis of each of the matched cell-line pairs using sCNAphase revealed that a significant fraction of
the genome had been altered by some form of copy number mutation. In some cell-lines, this analysis
classified a large amount of the genome as having undergone an LOH event (Table 2) such as HCC1143
and HCC1187, interestingly in HCC1143 the majority of these LOH events corresponded to regions that
contained two or more copies. These analyses also indicate that each of the cell-lines had seen a
significant increase in ploidy.
Table 2: Summary of results from sCNAphase on 4 cancer cell lines. The proportion of the genome that
has undergone sCNA is calculated as the proportion of the genome with copy number not equal to nearest
integer ploidy.
Cell-line
Estimated Ploidy Proportion of genome
Ploidy
determined by
sCNAphase
Ploidy determined
by COSMIC Undergon
e sCNA Undergone
LOH
Undergone
LOH with more
than 2 copies HCC1143*
Hypo-tetraploid 3.7 3.36 83% 46% 30%
HCC1954* Tetraploid
4.5 4.2 43% 8% 6%
HCC1187* Hypo-triploid
2.7 2.64 28% 58% 8%
HCC2218# Tetraploid
4.2 3.93 64% 14% 4%
* Cell-line with the ploidy determined from SKY (Grigorova et al. 2005). # Cell-line with the ploidy determined from flow cytometry (Kao et al. 2009).
Digital Spectral Karyotyping with sCNAphase is concordant with spectral karyotyping
We developed a visualization tool for the output from sCNAphase, which we call digital spectral
karyotyping (dSKY), as it generates an image, which is directly comparable to spectral karyotyping
(Figure 3). These dSKY plots make visual identification of aneuploidy, loss of heterozygosity and focal
changes straightforward. To build on SKY platform, red shading on the chromosome ideograms indicates
regions of LOH, and green shading indicates double deletions.
dSKY plots generated from the sCNAphase analysis of these cell-lines, were compared to images from
existing SKY analyses of the same cell lines (Figure 3, Supplementary Figure 2) (Grigorova et al.
2005). Results from sCNAphase were highly concordant with those from the SKY analysis, both at the
level of average ploidy (Table 2) and also in the identification of large-scale genomic alterations. For
example, both the sCNAphase and SKY analysis of HCC1187 classified this cell-line as hypo-triploid
and identified 4 complete copies of chromosome 7 (Figure 3). The higher resolution provided by
not peer-reviewed) is the author/funder. All rights reserved. No reuse allowed without permission. The copyright holder for this preprint (which was. http://dx.doi.org/10.1101/038828doi: bioRxiv preprint first posted online Feb. 4, 2016;
9
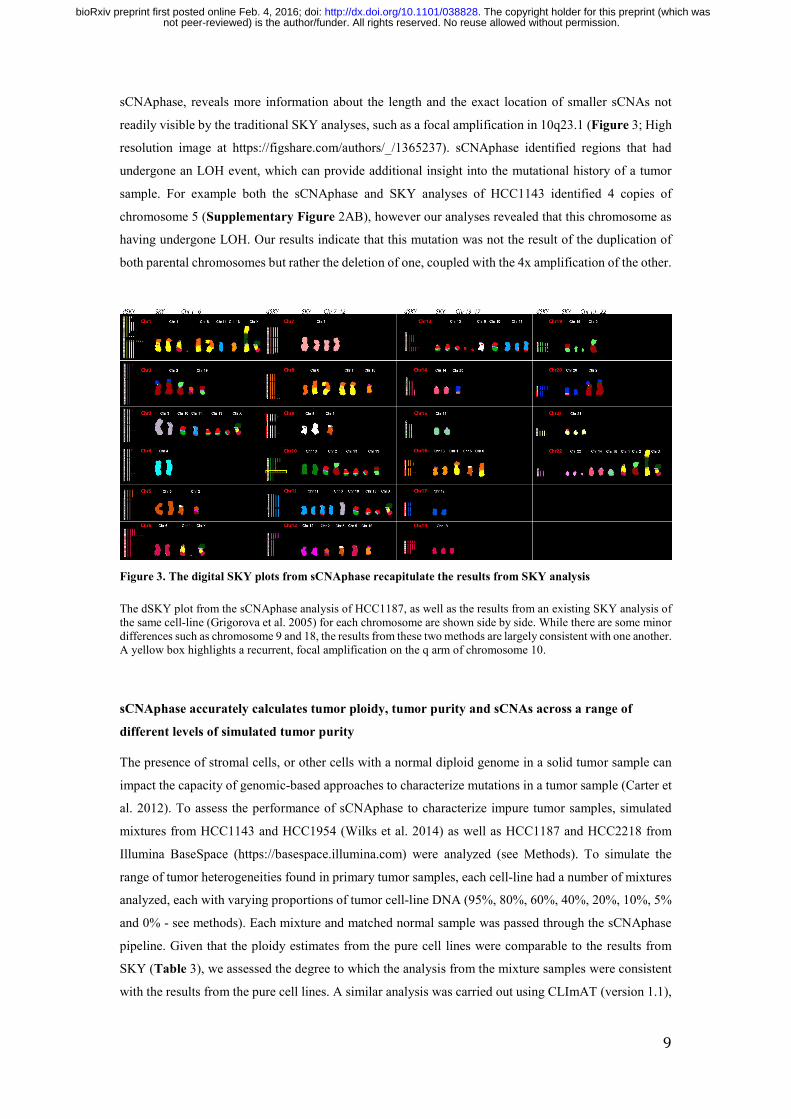
sCNAphase, reveals more information about the length and the exact location of smaller sCNAs not
readily visible by the traditional SKY analyses, such as a focal amplification in 10q23.1 (Figure 3; High
resolution image at https://figshare.com/authors/_/1365237). sCNAphase identified regions that had
undergone an LOH event, which can provide additional insight into the mutational history of a tumor
sample. For example both the sCNAphase and SKY analyses of HCC1143 identified 4 copies of
chromosome 5 (Supplementary Figure 2AB), however our analyses revealed that this chromosome as
having undergone LOH. Our results indicate that this mutation was not the result of the duplication of
both parental chromosomes but rather the deletion of one, coupled with the 4x amplification of the other.
Figure 3. The digital SKY plots from sCNAphase recapitulate the results from SKY analysis The dSKY plot from the sCNAphase analysis of HCC1187, as well as the results from an existing SKY analysis of the same cell-line (Grigorova et al. 2005) for each chromosome are shown side by side. While there are some minor differences such as chromosome 9 and 18, the results from these two methods are largely consistent with one another. A yellow box highlights a recurrent, focal amplification on the q arm of chromosome 10.
sCNAphase accurately calculates tumor ploidy, tumor purity and sCNAs across a range of
different levels of simulated tumor purity
The presence of stromal cells, or other cells with a normal diploid genome in a solid tumor sample can
impact the capacity of genomic-based approaches to characterize mutations in a tumor sample (Carter et
al. 2012). To assess the performance of sCNAphase to characterize impure tumor samples, simulated
mixtures from HCC1143 and HCC1954 (Wilks et al. 2014) as well as HCC1187 and HCC2218 from
Illumina BaseSpace (https://basespace.illumina.com) were analyzed (see Methods). To simulate the
range of tumor heterogeneities found in primary tumor samples, each cell-line had a number of mixtures
analyzed, each with varying proportions of tumor cell-line DNA (95%, 80%, 60%, 40%, 20%, 10%, 5%
and 0% - see methods). Each mixture and matched normal sample was passed through the sCNAphase
pipeline. Given that the ploidy estimates from the pure cell lines were comparable to the results from
SKY (Table 3), we assessed the degree to which the analysis from the mixture samples were consistent
with the results from the pure cell lines. A similar analysis was carried out using CLImAT (version 1.1),
not peer-reviewed) is the author/funder. All rights reserved. No reuse allowed without permission. The copyright holder for this preprint (which was. http://dx.doi.org/10.1101/038828doi: bioRxiv preprint first posted online Feb. 4, 2016;
10
the BAF-based approach most capable of characterizing low purity samples, which allowed us to
examine the increased power offered by the use of PHFs.
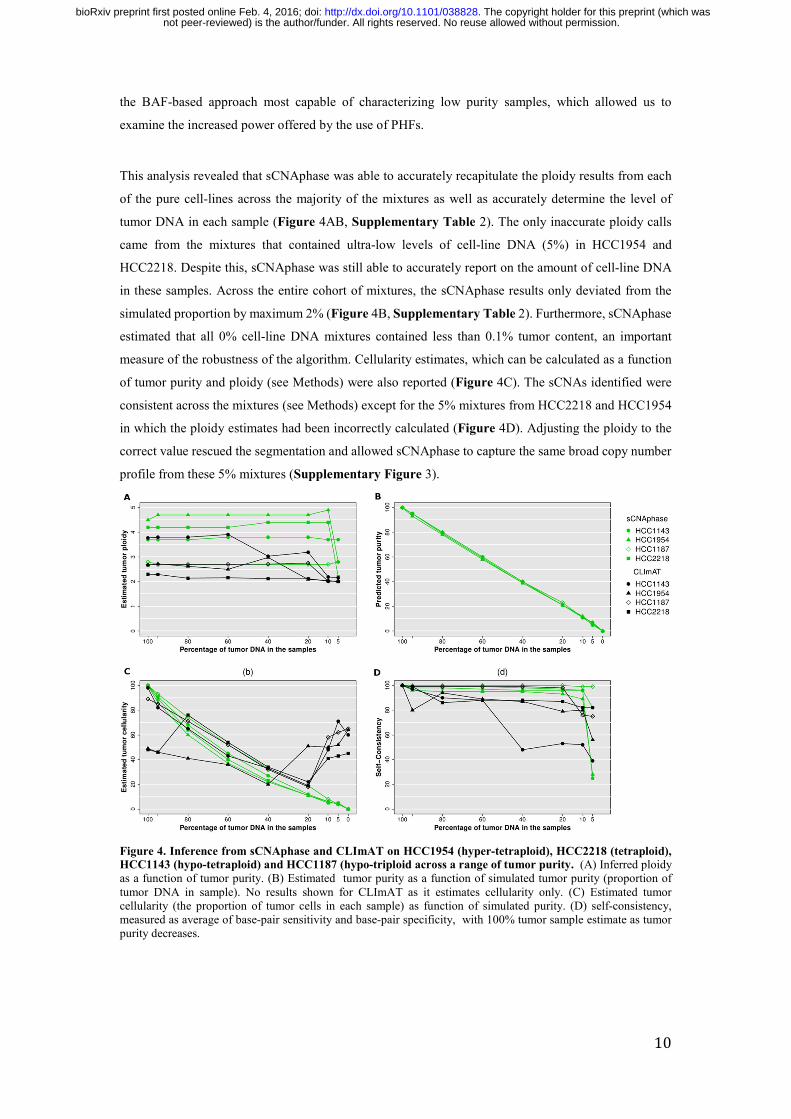
This analysis revealed that sCNAphase was able to accurately recapitulate the ploidy results from each
of the pure cell-lines across the majority of the mixtures as well as accurately determine the level of
tumor DNA in each sample (Figure 4AB, Supplementary Table 2). The only inaccurate ploidy calls
came from the mixtures that contained ultra-low levels of cell-line DNA (5%) in HCC1954 and
HCC2218. Despite this, sCNAphase was still able to accurately report on the amount of cell-line DNA
in these samples. Across the entire cohort of mixtures, the sCNAphase results only deviated from the
simulated proportion by maximum 2% (Figure 4B, Supplementary Table 2). Furthermore, sCNAphase
estimated that all 0% cell-line DNA mixtures contained less than 0.1% tumor content, an important
measure of the robustness of the algorithm. Cellularity estimates, which can be calculated as a function
of tumor purity and ploidy (see Methods) were also reported (Figure 4C). The sCNAs identified were
consistent across the mixtures (see Methods) except for the 5% mixtures from HCC2218 and HCC1954
in which the ploidy estimates had been incorrectly calculated (Figure 4D). Adjusting the ploidy to the
correct value rescued the segmentation and allowed sCNAphase to capture the same broad copy number
profile from these 5% mixtures (Supplementary Figure 3).
Figure 4. Inference from sCNAphase and CLImAT on HCC1954 (hyper-tetraploid), HCC2218 (tetraploid), HCC1143 (hypo-tetraploid) and HCC1187 (hypo-triploid across a range of tumor purity. (A) Inferred ploidy as a function of tumor purity. (B) Estimated tumor purity as a function of simulated tumor purity (proportion of tumor DNA in sample). No results shown for CLImAT as it estimates cellularity only. (C) Estimated tumor cellularity (the proportion of tumor cells in each sample) as function of simulated purity. (D) self-consistency, measured as average of base-pair sensitivity and base-pair specificity, with 100% tumor sample estimate as tumor purity decreases.
not peer-reviewed) is the author/funder. All rights reserved. No reuse allowed without permission. The copyright holder for this preprint (which was. http://dx.doi.org/10.1101/038828doi: bioRxiv preprint first posted online Feb. 4, 2016;

11
In comparison, CLImAT provided robust cellularity estimates for 3 of 4 samples down to 20% tumor
purity, but substantially over-estimated tumor cellularity for low purity samples, including the 0% (i.e.
normal) mixture sample (Figure 4C). The sCNA predictions of CLImAT were self-consistent down to
20% purity for 3 of 4 samples, although with lower self-consistency scores than sCNAphase (Figure 4D).
However, CLImAT, only determined the correct ploidy for two of these cell-lines and for one of these
cell-lines it was only in samples that contained high levels of cell-line DNA (HCC1143 at higher than
60%). CLImAT failed to recognize HCC2218 and HCC1954 as tetraploids across all levels of tumor
purity (Figure 4B). Furthermore, CLImAT reported inflated cellularity estimates in the low purity
mixtures (CLImAT does not report purity). As a result, CLImAT estimated every mixture containing 0%
tumor cell-line DNA, to contain a substantial proportion (i.e. greater than 40%) of tumor cells (Figure
4C). This comparison highlights the difficulties involved in correctly predicting ploidy and accurately
estimating tumor cellularity in low purity mixtures. These results showcase the utility of the increased
power offered by PHFs to resolve complex tumor genomes over the current state-of-the-art BAF based
approach.
Microarray analysis of cell-lines validates the sCNAphase results
The Cancer Cell Line Encyclopedia and the COSMIC Cell Line Project (Forbes et al. 2015) provide an
independent annotation of the mutations present in publically available cell-lines. The copy number
profiles of the cell-lines analyzed by sCNAphase had been characterized as part of this COSMIC project,
and were independently profiled using a PICNIC analysis of microarray data (Greenman et al. 2010).
This resource provides us with an independent annotation of the specific sCNAs in each of these cell-
lines and allows us to investigate the capacity of sCNAphase to report on individual sCNAs. To compare
the annotations of these cell-lines, the base ploidy for each cell-line needed to be determined. With the
exception of HCC1187, all cell-lines were treated as tetraploids, while HCC1187 was considered as
triploid. Any segment determined to have a value higher than this was defined as an amplification and
those with a lower value were defined as a deletion. Sensitivity and specificity were calculated by
counting the number of bases overlapping between two events which have the same direction (i.e. gain
or loss) relative to the base ploidy (see Methods). This comparison revealed that the majority of events
present in the COSMIC annotation of each cell line could be found across the range of mixtures for each
cell-line using sCNAphase, when ploidy was properly assigned (Figure 5A, B). In the samples in which
ploidy was incorrectly calculated (5% HCC2218 and HCC1954), the capacity of sCNAphase to reflect
the COSMIC results was greatly diminished. A similar comparison with the results from CLImAT
showed that this approach failed to correctly profile any of the HCC2218 or HCC1954 mixtures (Figure
5A, B). The comparison of the sCNAs identified by an array-based approach to those identified by
sCNAphase and CLImAT, illustrate the ability of sCNAphase to identify valid copy number changes
across a range of different simulated tumor cellularities.
LOH events are a common feature of the cancer genome and have been previously linked to the
inactivation of tumor suppressors (Side et al. 1997; Tuna et al. 2009). Given the capacity of our approach
to quantify and identify the haplotype of each chromosome, we assessed the ability of sCNAphase to
not peer-reviewed) is the author/funder. All rights reserved. No reuse allowed without permission. The copyright holder for this preprint (which was. http://dx.doi.org/10.1101/038828doi: bioRxiv preprint first posted online Feb. 4, 2016;

12
identify the LOH events present in the COSMIC annotation of these cell lines (Figure 5C, D). This
comparison showed sCNAphase identified approximately 90% of the regions of LOHs in COSMIC
annotations of these cell-lines while producing only few spurious results (except for HCC1954).
Furthermore, sCNAphase was still able to identify the same regions of LOH in the ultra-low purity
samples in which ploidy had been incorrectly assigned.
Despite the high level of similarity between the results from sCNAphase and COSMIC for the majority
of cell-lines, few regions of LOH in the COSMIC annotation of these cell-lines were not identified in the
corresponding sCNAphase analysis. For example, chr9p1-13 of HCC1187 was defined as a region of
LOH by both COSMIC and CLImAT (Figure 5E), however only small islands of LOH were identified
in the sCNAphase analysis of the same region (marked in pink). To identify any shortcomings in the
sCNAphase algorithm, we investigated the raw BAFs from this location. This analysis revealed that these
regions are unlikely to be homozygous, as the individuals BAFs are highly variable, unlike the remainder
of the chromosome (Figure 5F).
In the analysis of HCC1954 there was a low degree of overlap between the regions of LOH identified by
sCNAphase and CLImAT and those present in the COSMIC LOH annotation of the cell-line. Closer
inspection indicated that these differences were due to large chromosomal regions predicted to be LOH
in COSMIC, but which appear to be regions of high copy number and allelic imbalance, rather than
regions of LOH (Supplementary Figure 4). We also found substantial differences between the copy
number estimates from COSMIC and sCNAphase for multiple chromosomal arms for HCC1954 as well
as differences between the ploidy estimates in COSMIC and those from sCNAphase and the previous
SKY analyses (Supplementary Figure 2,4). Given the inconsistent results, the COSMIC annotation of
the HCC1954 may underestimate the ploidy of this cell-line (Table 2), and as a result, may have reported
some regions of LOHs and focal deletions for HCC1954 that do not reflect the true copy number profile
of this cell-line.
not peer-reviewed) is the author/funder. All rights reserved. No reuse allowed without permission. The copyright holder for this preprint (which was. http://dx.doi.org/10.1101/038828doi: bioRxiv preprint first posted online Feb. 4, 2016;

13
Figure 5. sCNAphase recapitulates the COSMIC annotation of these cell-lines across a range of purities. Consistency with COSMIC segmentation for copy number (A, B) and LOH (C,D) at varied tumor purity. For tumor samples at different tumor purity, the base-pair sensitivity in (A,C) and base-pair specificity in (B,D), was calculated by overlapping sCNAphase and CLImAT segmentations estimated at a particular tumor purity with COSMIC
not peer-reviewed) is the author/funder. All rights reserved. No reuse allowed without permission. The copyright holder for this preprint (which was. http://dx.doi.org/10.1101/038828doi: bioRxiv preprint first posted online Feb. 4, 2016;

14
segmentations based on 100% purity tumor samples. Each of the four cell-lines was represented a particular point shape as indicated in the legend. Results from sCNAphase and CLImAT are shown in green and black respectively. The copy number segmentations of chr9 p-arm HCC1187 from COSMIC, sCNAphase and CLImAT were shown in (E) in blue, green and black hash lines respectively. BAFs at this region in (F) support the loss of heterozygosity in p-arm except for the region highlighted in the pink box (39M-47M). For most of this 8M region, sCNAphase did not report copy number or LOH due to the highly variable BAFs which give merging errors (see Method).
Focal sCNAs identified by sCNAphase mirror those identified by microarray analysis
Given the clinical importance of recurrent focal amplifications in the cancer process, we assessed the
performance of sCNAphase and CLImAT to detect the focal amplifications (100kb to 4Mb) present in
the COSMIC annotation for these four cell-lines, using a 50% reciprocal overlap criterion (see Methods).
In the analysis of the pure cell-lines sCNAphase was able to detect majority of the focal amplifications
present in the COSMIC annotation of each of these cell-lines (see Methods), with a sensitivity
approximately twice that of CLImAT, as well as a specificity which was as good or better than CLImAT
(Table 3, Supplementary Table 3). As the tumor purity decreased to 10%, the performance of
sCNAphase remained unchanged. However the performance of CLImAT was unstable for all four cell-
lines. At 10% tumor purity, CLImAT failed to identify any of the focal amplifications present in the
COSMIC annotations from any of the cell-lines, while sCNAphase was able to identify over 60% of the
focal mutations.
The sCNAphase analysis of HCC1143 and HCC1187 was still able to identify the majority of focal
events at 5% tumor purity, the sensitivity of sCNAphase dropped significantly for HCC1954 and
HCC2218, however this was due to the underestimation of the tumor ploidy in these samples. Despite
this, sCNAphase was able to detect at least 12 copies of the pathologically relevant ERBB2 in HCC1954
and HCC2218 across the entire cohort of mixtures (Supplementary Table 4), highlighting the diagnostic
potential of sCNAphase (Neve et al. 2006; Kao et al. 2009) at even 5% tumor DNA. Likewise, another
focal peak of amplification, that was found to be recurrently altered in breast cancer (11q13) (Desnoyers
et al. 2007; Sawey et al. 2011), was detected in both the 100% HCC1143 and HCC1954 samples, as well
as their corresponding 5% mixtures. The identification of focal events, including those that are well
known to be clinically significant, across the full range of mixtures demonstrates the capacity of
sCNAphase to identify pathologically relevant sCNAs in ultra-low purity samples.
Homozygous deletions are another class of copy number mutation involved in the tumorigenic process
(Knudson et al. 1975; Cairns et al. 1995; Li et al. 1997). The COSMIC annotations show that there are 7
homozygous deletions larger than 100Kb in these four cell-lines (Supplementary Table 5). sCNAphase
was able to consistently detect the 3 longer homozygous deletions from HCC1143 and HCC1187. The
size of a focal deletion, more specifically, the number of germ-lines SNPs in the region limits sCNAphase
from identifying shorter events. Our analysis of HCC1954 did not detect the longer deletion from chr22
of HCC1954, however analysis of the raw sequencing data suggest that this deletion may be shorter than
the 332kb listed in the COSMIC annotation, as the read depth at the flanking region is significantly
higher than the deleted region (Supplementary Figure 5). Despite this, sCNAphase did not identify any
false positives and was able to consistently identify these deletions at minimal levels of tumor purity. In
not peer-reviewed) is the author/funder. All rights reserved. No reuse allowed without permission. The copyright holder for this preprint (which was. http://dx.doi.org/10.1101/038828doi: bioRxiv preprint first posted online Feb. 4, 2016;

15
contrast, CLImAT failed to identify any of homozygous deletions present in COSMIC, however it did
classify a number of other areas, as homozygous deletions that were not present in either the COSMIC
or sCNAphase results.
Table 3. The capacity of sCNAphase to detect the focal sCNAs in COSMIC
Tumor purity
HCC1143 15 focal amplification from COSMIC
HCC1954 94 focal amplification from COSMIC
HCC1187 2 focal amplification from COSMIC
HCC2218 18 focal amplification from COSMIC
Sen Spe Sen Spe Sen Spe Sen Spe
100% 80 23 66 52 100 26 61 31
80% 80 24 67 47 100 25 56 31
60% 80 24 63 47 100 27 44 38
40% 67 28 61 52 100 30 78 25
20% 80 22 65 57 100 30 61 44
10% 87 29 77 52 100 23 61 48
5% 80 23 37 93 100 29 22 100
Sen for sensitivity; Spe for specificity.
sCNAphase identifies biologically significant events in samples too complex for existing
methodologies
The comparison between the results from the COSMIC microarray and the sCNAphase analysis of the
same cell-lines, demonstrated the capacity of our approach to identify recurrent focal sCNAs that have
been previously associated with cancer. While the detection of focal amplifications is essential for any
tool designed to characterize the copy number profile of a tumor genome, we wanted to access the
capacity of sCNAphase to identify potentially biologically significant changes outside of these more
prominent regions and in samples thought to be too complex for other studies.
The use of microarrays to survey the tumor genome, made it possible to quantify the number of
chromosomes in tumor sample, while identifying instances of LOH. These studies identified regions
recurrently altered by LOH but contained a normal karyotype, something that trait that thought to be the
result of multiple mutational processes and too complex to be observed across the genome using prior
methodologies. A number of these regions of recurrent Copy Neutral- LOH (CN-LOH) have been
directly linked to cancer and include TP53 as well as CDNK2A (Murthy et al. 2002; Mullighan et al.
2007). However the identification of these complex regions with microarrays was not always possible,
as they are obscured in samples that contained small amounts of tumor content (<40%) (Carter et al.
2012). Examination of the results from the analysis of the pure cell-lines with sCNAphase, revealed a
number of regions that had undergone LOH and contained two or more copies. Furthermore, a number
of these regions were present in multiple cell-lines. To investigate the capacity of our tool to characterize
this complex event, in samples too complex for existing methods, we examined the results from
not peer-reviewed) is the author/funder. All rights reserved. No reuse allowed without permission. The copyright holder for this preprint (which was. http://dx.doi.org/10.1101/038828doi: bioRxiv preprint first posted online Feb. 4, 2016;

16
sCNAphase to identify instances of recurrent LOH in segments containing two or copies from samples
containing very low levels of tumor DNA.
Analysis of the mixtures that contained 10% tumor DNA, revealed that the majority of the regions of
CN-LOH, or regions of Acquired Uniparental Polysomy (AUPP - LOH in regions that contain three or
more copies), could be identified in the analysis of the corresponding pure cell-lines. Analysis of these
low tumor content mixtures, revealed a number of regions of AUPP or CN-LOH shared across multiple
cell-lines (Supplementary Table 6). These recurrent regions of LOH included chr5q and chr17p as well
as parts of chr17q, all of which had been previously found to undergo recurrent CN-LOH in cancer
(Murthy et al. 2002; Lips et al. 2007; Tuna et al. 2009; Pedersen et al. 2013).
One of these regions, the p arm of chromosome 17 was found to be altered in all of these cell-lines (this
region was not classed as LOH in the 10% mixture from HCC1143, but was correctly classified in the
5% mixture), a result echoed in the literature, which describe the tumor suppressor TP53, a gene located
in this region as the most common region of CN-LOH across a range of different types of cancer (Tuna
et al. 2009; Whibley et al. 2009). To investigate the biological impact of these recurrent regions of LOH
and the single nucleotide resolution offer by the HTS platform, we performed an in-depth examination
of the TP53 locus in each of these cell-lines. This analysis revealed homozygous somatic mutations in
TP53 for three of the cell-lines (Supplementary Figure 6). In the remaining cell-line HCC2218, two
heterozygous germline SNPs were identified (Supplementary Table 7), one of which, R283C has been
previously shown to increase a carrier’s risk of developing cancer (Murthy et al. 2002; Keller et al. 2004;
Manoukian et al. 2007). It is likely that the loss of the wild type allele and the amplification of the
deleterious SNP only increases this risk. These results demonstrate the power offered by HTS and
sCNAphase to characterize the biological impacts of a complex mutation in complex samples.
Discussion
Although somatic copy number alterations are a well-established driver of cancer, the capacity to identify
these mutations are impacted by a number of issues including varying levels of tumor purity and frequent
changes in tumor ploidy. As a result, the majority of methods designed to characterize the sCNAs in the
cancer genome are unable to accurately profile a significant fraction of primary tumor samples. In this
study, we have shown that by taking a haplotype-based approach, sCNAphase can overcome these issues
and reliably characterize both genome-wide copy number changes and the individual mutations present
in a tumor genome across a range of tumor purities.
The results shown here confirm the capacity of sCNAphase to accurately reflect the copy number profile
of a range of different primary tumor like samples. This was achieved by demonstrating that sCNAphase
could precisely determine a number of key factors that are essential to correctly characterizing the full
scope of copy number changes in a tumor sample. Comparison of the results from the sCNAphase to
those from SKY and flow cytometry, illustrated the ability of sCNAphase to correctly reflect the genome-
not peer-reviewed) is the author/funder. All rights reserved. No reuse allowed without permission. The copyright holder for this preprint (which was. http://dx.doi.org/10.1101/038828doi: bioRxiv preprint first posted online Feb. 4, 2016;

17
wide changes in ploidy (Figure 3 and Supplementary Figure 2). Using a range of mixtures, to simulate
the challenges posed by low-cellularity primary tumors, we were able to recapitulate the changes in
ploidy seen in the analysis of the pure cell-lines, across the spectrum of tumor purities (Figure 4). Equally
important was that the sCNAphase analyzes of the mixtures that did not contain any cell-line DNA, did
not produce false positive results (Figure 4). When the specific copy number changes identified by
sCNAphase were compared to those identified by microarray, it was apparent that our methodology was
able to accurately reflect the individual sCNAs present, across the majority of samples (Figure 5). In
depth examination of the results from sCNAphase revealed a number of changes that could be linked to
the tumorigenic process in these cell-lines, highlighting the potential of this tool to identify biologically
significant changes in primary tumor samples. Furthermore, when compared to CLImAT, a BAF-based
tool that was found to best handle the challenges posed by primary tumors (Table 1), sCNAphase was
found to consistently outperform this methodology, highlighting the potential offered by our PHF-based
approach. Together, these results demonstrate that using PHFs, sCNAphase is able to better reflect the
full range of copy number changes in samples representative of the complexity present in primary tumors.
The accurate characterization of the copy number profile in low cellularity samples as well as the
identification of mutations in cancer genes, is suggestive of the potential clinical utility of this tool. While
the additional testing with a larger cohort of primary tumor samples is needed to fully realize this, our
PHF based approach provides a method to identify the sCNAs in samples from which other tools cannot
identify any sCNAs. In addition to low purity tumors or cancer types that routinely suffer from
contaminating cells, a potential application of our PHF-based methodology would be in studies that aim
to profile the copy number changes in a tumor through the analysis of circulating tumor DNA. Circulating
tumor DNA, has been previously shown to contain mutations present in the tumor genome, but tumor
DNA in circulation is mixed with DNA from normal cells and the tumor purity is frequently low (10%
at most) (Newman et al. 2014). While sCNAphase can successfully profile low purity mixtures, it is
likely that in order to realize this an optimized version of the tool will need to be developed.
In conclusion, we have provided evidence to show that sCNAphase is a robust software package, capable
of characterizing the copy number profile of cancer samples, across a range of different of levels of tumor
purity. We have shown that sCNAphase is able to correct for the presence of contaminating normal cells
in tumor samples to confidently estimate the genome-wide sCNA changes as well as accurately identify
the presence of individual sCNAs. Comparison of the results from sCNAphase to those generated using
BAF, shows the dramatic increase in power to resolve these complex genomes offered by our PHF
focused approach. In addition, this tool provides an effective way of visualizing data and identifies
regions that have undergone a LOH event. Together, these results highlight the strength of sCNAphase
and showcase its potential to identify biologically significant changes in a clinical setting.
not peer-reviewed) is the author/funder. All rights reserved. No reuse allowed without permission. The copyright holder for this preprint (which was. http://dx.doi.org/10.1101/038828doi: bioRxiv preprint first posted online Feb. 4, 2016;

18
Methods
Datasets
The Illumina whole genome sequencing data of cell-lines, HCC1143, HCC1954, HCC1143BL,
HCC1954BL were collected from Variant Calling Benchmark 4 provided by The Cancer Genome Atlas
(TCGA) (Wilks et al. 2014), and HCC1187, HCC1187BL, HCC2218 and HCC2218BL were from
Illumina BaseSpace. The tumor cell-lines, HCC1143, HCC1954, HCC1187 and HCC2218 were cultured
from breast ductal tissue, sequenced at 50x, 58x, 93x and 83x. Patient-matched normal samples,
HCC1143BL, HCC1954BL, HCC1187BL and HCC2218BL were from peripheral blood, sequenced at
60x, 71x, 49x and 37x.
The Variant Calling Benchmark 4 simulated tumor-normal mixture samples of HCC1143/HCC1143BL,
HCC1954/HCC1954BL were at 30x coverage. They were created by mixing 5%, 20%, 40%, 60%, 80%
and 95% of normal DNA to tumor DNA. The normal cell-lines HCC1143BL.30x.compare,
HCC1954BL.30x.compare, were sequenced independently at 30x, different from the normal samples
used to create the mixture samples. Because BaseSpace provides no mixtures samples for
HCC1187/HCC1187BL, HCC2218/HCC2218BL, we created the mixture samples at 30x coverage with
5%, 20%, 40%, 60%, 80% and 95% of tumor DNA, by randomly sampling and mixing suitable amount
of reads from tumor and normal samples. To create the low coverage normal controls, we down-sampled
bam files of the HCC1187BL and HCC2218BL to 30x coverage. Therefore, for each tumor/normal pairs,
there are 6 mixture samples, and 1 independent normal control. In the same way, we created 10% tumor-
normal mixtures for all four cell-lines in order to assess the capacity of sCNAphase at very low level
tumor DNA samples.
All the tumor cell-lines are from high-grade breast ductal carcinoma. Based on the expression patterns,
HCC1143, HCC1954 and HCC1187 were classified as the Basal A subtype, and HCC2218 as the
Luminal subtype. HCC1954 and HCC2218 showed over-expression of ERBB2 (Neve et al. 2006; Kao et
al. 2009).
Workflow
The workflow is described in Figure 2. The workflow includes the determination of the BAF for each
heterozygous SNP (Figure 2a), generation of phased allelic depths (Figure 2b), estimation of sCNAs
as well as tumor purity and tumor ploidy (Figure 2c). In order to generate allelic phase information, the
pipe-line relies on external software for SNP calling, haplotype phasing in the pre-processing steps.
Specifically, in current analysis, we start by calling SNP variants from pre-mapped Illumina pair-end
sequencing data using BCFtools (Li et al. 2009) in VCF format. Then we used SHAPEIT2 (Delaneau et
al. 2013) to perform population-based haplotype phasing at the SNP variants. Notably, the variant calling
and in-silico haplotype phasing are only performed once on a normal sample rather than all tumor
samples. This is because population-based haplotype phasing is based on a set of common germ-line
SNPs and INDELs; however tumor genome is usually significantly altered, therefore not suitable for
not peer-reviewed) is the author/funder. All rights reserved. No reuse allowed without permission. The copyright holder for this preprint (which was. http://dx.doi.org/10.1101/038828doi: bioRxiv preprint first posted online Feb. 4, 2016;

19
calling and phasing SNP variants. For the tumor samples, rather than calling variants, we calculated the
allelic depths on the same set of SNP variants using BCFtools.
Due to somatic mutations in tumor, the alleles in tumor are occasionally different from those in normal.
The estimation process first checks the consistency of an alternative allele in normal and tumor samples,
and then filters loci with inconsistent alternative alleles. After that, sCNAphase merges phased ADs
every n loci. This step significantly reduces the variability of the allelic frequencies, and therefore
increase the power in calling sCNAs.
To determine the tumor ploidy, the next step is searching through all possible values from 2 to 5,
incrementing by 0.2. Given an assumed tumor ploidy, the pipe-line identifies the tumor cellularity and
copy number profile, which is most fitted to the merged read depths and phased allelic depths. As such,
the estimated copy number profile with the maximal likelihood is chosen with the corresponding tumor
ploidy, cellularity estimations. Based on this estimation, the pipe-line can generate varied outputs
including a) a copy number segmentation file indicating which regions are amplified; b) a vcf file
includes the genotypes, allelic copy numbers and phases for the SNPs; c) the dSKY plots which
resembles the Spectral KaryotYping (SKY) plots. sCNAphase is powered by multithread techniques.
This ploidy estimation step take approximately 4 hours on a machine with 12 CPUs at 1600MHz.
Calculating the parental allele frequency
Given the allelic phase calculated from SHAPEIT2, the two alleles at each SNP are arranged into
two haplotypes for the parental chromosomes. If one haplotype is randomly chosen as maternal, the
fraction of maternal allele depth mi over read depth di at each SNP reflects the amplification of the
amplification of one parental chromosome over the other. Defined for a regional n consecutive
SNPs, the parental haplotype frequency (PHF) is the sum of maternal allele depth mi to the sum of
read depth di as follows:
(1)
A PHF of 0 or 1 corresponds to a homozygote. For a maternally amplified region, the PHF is expected
to be above 0.5. B-allelic frequency (BAF) defined as the fraction of the alternative allelic depth in this
region, however, would vary a lot about 0.5, because the amplified allele can be either the reference or
alternative allele. In this paper, the number consecutive SNPs (n) in a region was set to be 40, but it
can be other values.
In ideal cases, when there are no allele-specific biases, such as allelic-specific enrichment during PCR,
the probability of seeing maternal allelic depth mi, given the genotypes gi(t), read depth di
(t), satisfy a
binomial distribution of from a tumor sample is dependent on the genotypes git, read depth di
(t), which
approximates a binomial distribution of:
ii
i
mPHF
d
not peer-reviewed) is the author/funder. All rights reserved. No reuse allowed without permission. The copyright holder for this preprint (which was. http://dx.doi.org/10.1101/038828doi: bioRxiv preprint first posted online Feb. 4, 2016;

20
(2)
(3)
in which the superscript, t differentiates a tumor sample from the matched normal. xi
(t) and yi(t) are copy
numbers of the maternal and paternal alleles for SNP i, which define the genotype gi(t). Therefore given
a genotype of {MMP, Pi is 2/3. Different from absolute copy numbers, xi(t) and yi
(t) are copy numbers
relative to the germ-line allelic copy number. Therefore if the copy number for the germ-line maternal
allele is xi(n), the absolute maternal allelic copy number in tumor would be xi
(n)·xi(t). xi
(t) of 1 means no
somatic copy number alterations. In most cases, xi(n) and yi
(n) are both 1 given the normal being the diploid
genome, so that xi(t) represents the absolute copy number.
When the genotype for a tumor sample is unknown at a site i, the parental allelic frequency, PHFi(t) is
the unbiased estimation of Pi(t). The variance of PHFi
(t) from Pi(t) is,
(4)
Therefore, as the read depth di(t) increases, the variance becomes smaller so that the allelic amplification
can be inferred from the average PHFi. For the genotype of {MMP} (Pi(t) = 2/3) and 30x sequencing
coverage, the PHFi(t) varies in the range of 2/3 ± 0.086, in 68% of cases (Wald method). This spans
possible allelic copy number ratios of 3/5, 2/3, 4/5. For this maternally amplified sCNAs, the merging
on the allelic depths at neighbor SNPs, would increase the depth, therefore reduce the variability. If
adding up the depths at every 40 SNPs, the variance reduces to 0.023 in 90% cases. In this case, genotypes
other than {MMP} become very unlikely.
Normal-tumor paired test
Due to germ-line copy number variations (CNVs), the genotypes of a normal sample cannot be assumed
as {MP} for all the SNPs, although for most of them the assumption is fitted. In order to call sCNAs
(copy number gain or loss from the germ-line copy numbers), both the tumor and paired normal samples
are required.
Assuming there are no somatic alterations, the pi in Equation 2 can be approximated by the PHFi
(n) from
the matched normal sample at a locus i,
, (5)
in which mi(n) and di
(n) correspond to the maternal allelic depth and read depth for a SNP from the paired
normal sample.
(t) (t) (t)i i i
(t)mi
(t)i
( ) (1 )m di i i
dP p p
m
( )
i ( ) ( )
ti
t ti i
xp
x y
( ) ( )( )
( )
(1 )var( )
t tt i i
i ti
p pPHF
d
( ) ( ) ( ) ( )/n n n ni i i ip PHF m d
not peer-reviewed) is the author/funder. All rights reserved. No reuse allowed without permission. The copyright holder for this preprint (which was. http://dx.doi.org/10.1101/038828doi: bioRxiv preprint first posted online Feb. 4, 2016;

21
The fitness of this assumption can be analyzed visually from Q-Q plot, which is commonly used to
compare if observations (an empirical distribution) fit into certain assumptions (an expected distribution).
For a fitted assumption, the Q-Q plot is expected to be approximately y=x. In our case, this includes 1)
calculate the probability at each SNP with Equation 2, 5; 2) rank and treat each probability as the ith
quantile. Since an PHFi(n) varies about the pi, this variation makes the expected distribution more variable
than the empirical distribution of the observations. The Q-Q plot will be slightly deflated from y=x, even
if there are no sCNAs in tumor sample. By merging the allelic depths in each haplotype, the increased
depths will reduce the variance of PHFi(n) about the pi, which restores the Q-Q plot to y=x as shown in
Figure 1d. The test on the merged phased ADs is sensitive enough to detect as low as 5% tumor DNA
providing a normal-tumor mixture.
Hidden Markov Model on Allelic Depth and Read Depth
For tumor-normal mixture samples with a tumor cellularity tc, the likelihood for observing the depths
{mi(t), di
(t), mi(n), di
(n)} still satisfy a binomial distribution in Equation 2. The Pi(t), in this case, is given as,
(6)
(7)
in which xi(t) and yi
(t) are the maternal and paternal allelic copy numbers for a genotype gi(t).
Given the sum of read depths across all sites R(n) and R(t) for normal and tumor samples, the likelihood
function of read depths dit and di
n is
, (8)
, (9)
in which γi is a factor for the position specific biases, such as the mappability and GC-bias. This is
expected to be comparable for tumor and normal samples, given the identical procedure of library
preparation and sequencing platform. cni(a) is the absolute copy number in tumor for SNP i. ∑ �����
(�)�
and ∑ �����(�)
� only vary with global setting of copy numbers at each locus cnj(a).
The difference of the values for the tumor and normal samples reflects the ploidy change C from diploid,
that is
(t) (t) (t)i i i
(t)m( ) ( ) ( ) ( ) (t) i
i i i i i (t)i
( | , , , , ) ( ) (1 )m dAD t t n ni i i
de P m d m d g tc p p
m
(n) (n) (t)i i i
(n) (n) (t) (n) (n) (t)i i i i i i
(1 )
(1 ) ( )i
tc m tc m xp
tc d tc m x tc d m y
(t) (t) (t)i i i
(t)(t) (t) (n) (n) (t)
i i i (t)i
( | , , , , ) ( ) (1 )d R dRDi i i
Re P d R d R g tc F F
d
( ) ( )
( ) ( )
(1 )
(1 )
a ni i i i
i a nj j j jj j
cn tc cn tcF
cn tc cn tc
not peer-reviewed) is the author/funder. All rights reserved. No reuse allowed without permission. The copyright holder for this preprint (which was. http://dx.doi.org/10.1101/038828doi: bioRxiv preprint first posted online Feb. 4, 2016;

22
(10)
Given the haploid coverage of normal and tumor samples at hc(n) and hc(t), the expected read depth di(t),
di(n) can be calculated as follows,
(11)
(12)
To find the somatic copy number alterations to the germ-line copy number, we define the relative copy number cni
(t) in tumor to the germ-line copy number cni(n) in normal as,
(13)
With Equation 9, 10, 11, 12, 13, Equation 10 can be solved as,
(14)
in which cni(t) is the sum of xi
(t) and yi(t) given the genotype gi
(t). Notably, the mappability factor is
cancelled out in this equation. In Equation 14, tumor cellularity tc and degree of ploidy alteration C are
model parameters.
With likelihood functions eiRD and ei
AD, the complete likelihood of the Hidden Markov Model defined
on read depth {RDi} and allelic depth {ADi} can be formulated as,
(15)
in which G stands for a set of n possible genotypes. The probability of genotype transition from a
genotype gi at SNP i to gi+1 at SNP j forms a fully connected transition matrix {tij}. Φ(g1) stands for the
initial probability vector for the genotypes in G. The transition matrix is estimated using Baum-Welch;
tumor cellularity tc is calculated from maximum likelihood estimation.
Determination of tumor purity and cellularity
The percentage of tumor cells, tc, in a mixture sample is different from the percentage of the tumor DNA
content in sequencing data tcd. For tumor with higher than 2 ploidy, tcd is bigger than tc. The relationship
of the two scales is shown in following equation,
(16)
in which base(n) and base(t) are the haploid read depth for normal and tumor samples respectively. The
relation between the expected read depths ��(�)�����
and ��(�)�����
at a SNP i and base level read depths base(n) and
base(t) is,
( )
(n)
aj jj
j jj
cnC
cn
( ) ( ) ( )t t ti i id hc cn
( ) ( ) ( )n n ni id hc cni
(a)( )
(n)2t i
i
i
cncn
cn
( ) ( ) ( )( )
( ) ( )
(1 )
(1 )
n t nt i i i
i n n
d cn tc d tcF
C tc R tc R
1
RD ADi i 1
RD Di i 1
2
log ({ },{ }) log( ( ))
log( ( , ))i
i ig G
Ai i
i g G
P AD RD e e g
e e t g g
(a) (t)
(n) (n)1 (1 )
i id i
d i ii
cn base tctc
tc cn base tc
not peer-reviewed) is the author/funder. All rights reserved. No reuse allowed without permission. The copyright holder for this preprint (which was. http://dx.doi.org/10.1101/038828doi: bioRxiv preprint first posted online Feb. 4, 2016;
23
(17)
(18)
Assume din and di
t is close enough to ��(�)�����
and ��(�)�����
, the tcd and tc can be calculated with equation 16, 17
and 18 as,
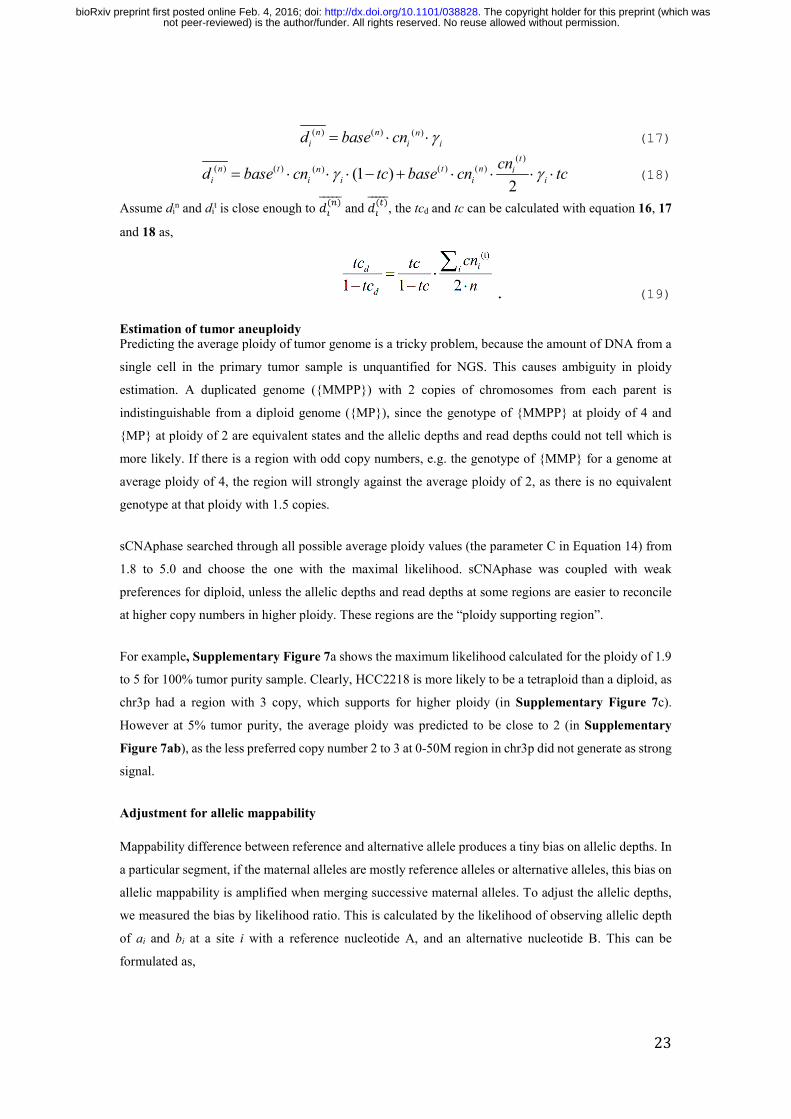
. (19) Estimation of tumor aneuploidy Predicting the average ploidy of tumor genome is a tricky problem, because the amount of DNA from a
single cell in the primary tumor sample is unquantified for NGS. This causes ambiguity in ploidy
estimation. A duplicated genome ({MMPP}) with 2 copies of chromosomes from each parent is
indistinguishable from a diploid genome ({MP}), since the genotype of {MMPP} at ploidy of 4 and
{MP} at ploidy of 2 are equivalent states and the allelic depths and read depths could not tell which is
more likely. If there is a region with odd copy numbers, e.g. the genotype of {MMP} for a genome at
average ploidy of 4, the region will strongly against the average ploidy of 2, as there is no equivalent
genotype at that ploidy with 1.5 copies.
sCNAphase searched through all possible average ploidy values (the parameter C in Equation 14) from
1.8 to 5.0 and choose the one with the maximal likelihood. sCNAphase was coupled with weak
preferences for diploid, unless the allelic depths and read depths at some regions are easier to reconcile
at higher copy numbers in higher ploidy. These regions are the “ploidy supporting region”.
For example, Supplementary Figure 7a shows the maximum likelihood calculated for the ploidy of 1.9
to 5 for 100% tumor purity sample. Clearly, HCC2218 is more likely to be a tetraploid than a diploid, as
chr3p had a region with 3 copy, which supports for higher ploidy (in Supplementary Figure 7c).
However at 5% tumor purity, the average ploidy was predicted to be close to 2 (in Supplementary
Figure 7ab), as the less preferred copy number 2 to 3 at 0-50M region in chr3p did not generate as strong
signal.
Adjustment for allelic mappability
Mappability difference between reference and alternative allele produces a tiny bias on allelic depths. In
a particular segment, if the maternal alleles are mostly reference alleles or alternative alleles, this bias on
allelic mappability is amplified when merging successive maternal alleles. To adjust the allelic depths,
we measured the bias by likelihood ratio. This is calculated by the likelihood of observing allelic depth
of ai and bi at a site i with a reference nucleotide A, and an alternative nucleotide B. This can be
formulated as,
( ) ( ) ( )n n ni i id base cn
( )( ) ( ) ( ) ( )( ) (1 )
2
tn t t nn i
i i i i i
cnd base cn tc base cn tc
not peer-reviewed) is the author/funder. All rights reserved. No reuse allowed without permission. The copyright holder for this preprint (which was. http://dx.doi.org/10.1101/038828doi: bioRxiv preprint first posted online Feb. 4, 2016;

24
(20)
(21)
in which A and B belongs to a set of {A,T,G,C}. A 2D matrix calculated from HCC1143 and HCC1954
is shown as follow in. Therefore allelic depths are recalibrated by increasing the count of an alternative
allele by a factor of the bias.
Removal of merging errors at the boundary of adjacent sCNAs.
The PHFs are created by merging the phased allelic depths for every n loci, assuming the n loci are in
the same copy number states. However, the merging errors occurs at a region which spans the boundary
of two adjacent sCNAs, e.g. one at 5 copies and the other one at 1 copy. The PHFs will instead imply
this region at 3 copies. To remove these merging error at the boundary of adjacent sCNAs, we performed
an likelihood ratio test, as follows:
(22)
The numerator assumes the n loci are in a single sCNAs, with a single genotype gi(t) from G which
maximizes the likelihood. The numerator assumes the loci are from different sCNAs; therefore they can
have an individual genotype, the gi(t) is chosen if it maximizes the likelihood. After the tc is estimated,
sCNAphase performs this likelihood test for each PHF, before removes 1% of the PHF that failed this
likelihood ratio test.
Overlapping analysis for copy number segmentations estimated from different tools
To evaluate the performance, the copy number segmentation estimated from sCNAphase was compared
with those from CLImAT and COSMIC by overlapping the estimated varied criteria. The overall
performance was calculated by comparing how many bases were consistently estimated as gain or loss
for any two segmentations. In the same way, the consistency in estimation of LOHs was also counted by
per base. For the analysis of the focal sCNAs, a consistent sCNAs is considered if there are at least 50%
overlap between two estimated segments. A segment is treated as focal if it is shorter than 4 Mb. We
applied this different criteria for focal sCNAs because this per base overlapping criteria is unfair for the
relatively shorter focal sCNAs than the longer ones. We choose 4 Mb as the threshold for focal sCNAs
because the breakpoints for a focal sCNAs is likely to be inaccurate, given that all the copy number
segmentations used in this paper are imputed based on the copy number at the SNPs. Therefore if an
( )ii
i ii
aT A,B
a b
( )( )
1 ( )
T A,Bbias A,B
T A,B
( )
( )
( ) ( ) ( ) ( ) ( )
( ) ( ) ( ) 11 1
( ) ( ) ( ) ( ) ( )
1
max ( ( | , , , , ))
( , ,..., )
max ( ( | , , , , ))
ti
ti
nt t n n t
i i i i ig Gt t t i
n nt t n n t
i i i i ig G
i
P m d m d g tc
g g g
P m d m d g tc
not peer-reviewed) is the author/funder. All rights reserved. No reuse allowed without permission. The copyright holder for this preprint (which was. http://dx.doi.org/10.1101/038828doi: bioRxiv preprint first posted online Feb. 4, 2016;

25
sCNAs is 2Mb in length, the estimation of 2.5Mb is still a reasonable estimation. Since the PHF in 90%
of the cases spans over a region at 100K (Supplementary Figure 8), we choose this value as the low
bound for the focal events.
Acknowledgments
The work was supported by Cancer Council Queensland grant APP1085786 awarded to Dr Lachlan J.M.
Coin and UQ-CSC scholarship awarded to Wenhan Chen. We appreciate the WGS data from TCGA
consortium, in particular, Dr Adam Ewing for creating the tumor-normal mixtures for HCC1143 and
HCC1954. We would also like to thank Illumina BaseSpace for providing the WGS data for HCC1187
and HCC2218, COSMIC server for providing the array-based copy number profiles, and Dr Paul
Edwards for the SKY plots. We thank Haojing Shao for analyzing the patterns of the somatic copy
number alterations, Dr Sarah Song for collecting the sequencing data and Dr Alison Anderson for
reviewing and commenting on the current study.
not peer-reviewed) is the author/funder. All rights reserved. No reuse allowed without permission. The copyright holder for this preprint (which was. http://dx.doi.org/10.1101/038828doi: bioRxiv preprint first posted online Feb. 4, 2016;

26
References
Altshuler D, Durbin R, Abecasis G, Bentley D, Chakravarti A, Clark A, Donnelly P, Eichler E, Flicek P, Gabriel S. 2012. An integrated map of genetic variation from 1,092 human genomes. NATURE 491(7422): 56-65.
Aran D, Sirota M, Butte AJ. 2015. Systematic pan-cancer analysis of tumour purity. Nat Commun 6.
Bambury RM, Bhatt AS, Riester M, Pedamallu CS, Duke F, Bellmunt J, Stack EC, Werner L, Park R, Iyer G et al. 2015. DNA copy number analysis of metastatic urothelial carcinoma with comparison to primary tumors. BMC Cancer 15(1): 242-242.
Bast RC, Ravdin P, Hayes DF, Bates S, Fritsche H, Jessup JM, Kemeny N, Locker GY, Mennel RG, Somerfield MR. 2001. 2000 Update of Recommendations for the Use of Tumor Markers in Breast and Colorectal Cancer: Clinical Practice Guidelines of the American Society of Clinical Oncology*. Journal of Clinical Oncology 19(6): 1865-1878.
Beroukhim R, Mermel CH, Porter D, Wei G, Raychaudhuri S, Donovan J, Barretina J, Boehm JS, Dobson J, Urashima M et al. 2010. The landscape of somatic copy-number alteration across human cancers. Nature 463(7283): 899-905.
Boeva V, Popova T, Bleakley K, Chiche P, Cappo J, Schleiermacher G, Janoueix-Lerosey I, Delattre O, Barillot E. 2012. Control-FREEC: a tool for assessing copy number and allelic content using next-generation sequencing data. Bioinformatics 28(3): 423-425.
Cairns P, Polascik TJ, Eby Y, Tokino K, Califano J, Merlo A, Mao L, Herath J, Jenkins R, Westra W et al. 1995. Frequency of homozygous deletion at p16/CDKN2 in primary human tumours. Nat Genet 11(2): 210-212.
Carter SL, Cibulskis K, Helman E, McKenna A, Shen H, Zack T, Laird PW, Onofrio RC, Winckler W, Weir Ba et al. 2012. Absolute quantification of somatic DNA alterations in human cancer. Nature biotechnology 30(5): 413-421.
Carter SL, Eklund AC, Kohane IS, Harris LN, Szallasi Z. 2006. A signature of chromosomal instability inferred from gene expression profiles predicts clinical outcome in multiple human cancers. Nature genetics 38(9): 1043-1048.
Chin K, DeVries S, Fridlyand J, Spellman PT, Roydasgupta R, Kuo W-L, Lapuk A, Neve RM, Qian Z, Ryder T et al. 2006. Genomic and transcriptional aberrations linked to breast cancer pathophysiologies. Cancer cell 10(6): 529-541.
Cho Y-J, Tsherniak A, Tamayo P, Santagata S, Ligon A, Greulich H, Berhoukim R, Amani V, Goumnerova L, Eberhart CG et al. 2011. Integrative genomic analysis of medulloblastoma identifies a molecular subgroup that drives poor clinical outcome. Journal of the American Society of Clinical Oncology 29(11): 1424-1430.
Coin LJ, Asher JE, Walters RG, Moustafa JSE-S, de Smith AJ, Sladek R, Balding DJ, Froguel P, Blakemore AI. 2010. cnvHap: an integrative population and haplotype–based multiplatform model of SNPs and CNVs. Nature methods 7(7): 541-546.
not peer-reviewed) is the author/funder. All rights reserved. No reuse allowed without permission. The copyright holder for this preprint (which was. http://dx.doi.org/10.1101/038828doi: bioRxiv preprint first posted online Feb. 4, 2016;

27
Conrad DF, Pinto D, Redon R, Feuk L, Gokcumen O, Zhang Y, Aerts J, Andrews TD, Barnes C, Campbell P et al. 2010. Origins and functional impact of copy number variation in the human genome. Nature 464(7289): 704-712.
Curtis C, Shah SP, Chin S-F, Turashvili G, Rueda OM, Dunning MJ, Speed D, Lynch AG, Samarajiwa S, Yuan Y et al. 2012. The genomic and transcriptomic architecture of 2,000 breast tumours reveals novel subgroups. Nature 486(7403): 346-352.
Delaneau O, Howie B, Cox AJ, Zagury J-F, Marchini J. 2013. Haplotype estimation using sequencing reads. American journal of human genetics 93(4): 687-696.
Desnoyers LR, Pai R, Ferrando RE, Hotzel K, Le T, Ross J, Carano R, D'Souza A, Qing J, Mohtashemi I et al. 2007. Targeting FGF19 inhibits tumor growth in colon cancer xenograft and FGF19 transgenic hepatocellular carcinoma models. Oncogene 27(1): 85-97.
Forbes SA, Beare D, Gunasekaran P, Leung K, Bindal N, Boutselakis H, Ding M, Bamford S, Cole C, Ward S et al. 2015. COSMIC: exploring the world's knowledge of somatic mutations in human cancer. Nucleic Acids Research 43(D1): D805-D811.
Goya R, Sun MG, Morin RD, Leung G, Ha G, Wiegand KC, Senz J, Crisan A, Marra MA, Hirst M. 2010. SNVMix: predicting single nucleotide variants from next-generation sequencing of tumors. Bioinformatics 26(6): 730-736.
Greenman CD, Bignell G, Butler A, Edkins S, Hinton J, Beare D, Swamy S, Santarius T, Chen L, Widaa S. 2010. PICNIC: an algorithm to predict absolute allelic copy number variation with microarray cancer data. Biostatistics 11(1): 164-175.
Grigorova M, Lyman RC, Caldas C, Edwards PAW. 2005. Chromosome abnormalities in 10 lung cancer cell lines of the NCI-H series analyzed with spectral karyotyping. Cancer Genetics and Cytogenetics 162(1): 1-9.
Gusnanto A, Wood HM, Pawitan Y, Rabbitts P, Berri S. 2012. Correcting for cancer genome size and tumour cell content enables better estimation of copy number alterations from next-generation sequence data. Bioinformatics 28(1): 40-47.
Hieronymus H, Schultz N, Gopalan A, Carver BS, Chang MT, Xiao Y, Heguy A, Huberman K, Bernstein M, Assel M et al. 2014. Copy number alteration burden predicts prostate cancer relapse. Proceedings of the National Academy of Sciences 111(30): 11139-11144.
Kao J, Salari K, Bocanegra M, Choi Y-L, Girard L, Gandhi J, Kwei KA, Hernandez-Boussard T, Wang P, Gazdar AF et al. 2009. Molecular Profiling of Breast Cancer Cell Lines Defines Relevant Tumor Models and Provides a Resource for Cancer Gene Discovery. PLoS ONE 4(7): e6146.
Keller G, Vogelsang H, Becker I, Plaschke S, Ott K, Suriano G, Mateus AR, Seruca R, Biedermann K, Huntsman D. 2004. Germline mutations of the E-cadherin (CDH1) and TP53 genes, rather than of RUNX3 and HPP1, contribute to genetic predisposition in German gastric cancer patients. Journal of medical genetics 41(6): e89-e89.
Knudson AG, Hethcote HW, Brown BW. 1975. Mutation and childhood cancer: a probabilistic model for the incidence of retinoblastoma. Proceedings of the National Academy of Sciences 72(12): 5116-5120.
not peer-reviewed) is the author/funder. All rights reserved. No reuse allowed without permission. The copyright holder for this preprint (which was. http://dx.doi.org/10.1101/038828doi: bioRxiv preprint first posted online Feb. 4, 2016;

28
Krijgsman O, Carvalho B, Meijer Ga, Steenbergen RDM, Ylstra B. 2014. Focal chromosomal copy number aberrations in cancer-Needles in a genome haystack. Biochimica et biophysica acta 1843(11): 2698-2704.
Lee AJX, Endesfelder D, Rowan AJ, Walther A, Birkbak NJ, Futreal PA, Downward J, Szallasi Z, Tomlinson IPM, Howell M et al. 2011. Chromosomal instability confers intrinsic multidrug resistance. Cancer research 71(5): 1858-1870.
Li J, Yen C, Liaw D, Podsypanina K, Bose S, Wang SI, Puc J, Miliaresis C, Rodgers L, McCombie R et al. 1997. PTEN, a Putative Protein Tyrosine Phosphatase Gene Mutated in Human Brain, Breast, and Prostate Cancer. Science 275(5308): 1943-1947.
Li Y, Xie X. 2014. Deconvolving tumor purity and ploidy by integrating copy number alterations and loss of heterozygosity. Bioinformatics 30(15): 2121-2129.
Lips EH, de Graaf EJ, Tollenaar R, van Eijk R, Oosting J, Szuhai K, Karsten T, Nanya Y, Ogawa S, van de Velde CJ et al. 2007. Single nucleotide polymorphism array analysis of chromosomal instability patterns discriminates rectal adenomas from carcinomas. The Journal of Pathology 212(3): 269-277.
Manoukian S, Peissel B, Pensotti V, Barile M, Cortesi L, Stacchiotti S, Terenziani M, Barbera F, Pasquini G, Frigerio S et al. 2007. Germline mutations of TP53 and BRCA2 genes in breast cancer/sarcoma families. European Journal of Cancer 43(3): 601-606.
Mayrhofer M, DiLorenzo S, Isaksson A. 2013. Patchwork: allele-specific copy number analysis of whole-genome sequenced tumor tissue. Genome Biol 14(3): R24.
Mullighan CG, Goorha S, Radtke I, Miller CB, Coustan-Smith E, Dalton JD, Girtman K, Mathew S, Ma J, Pounds SB et al. 2007. Genome-wide analysis of genetic alterations in acute lymphoblastic leukaemia. Nature 446(7137): 758-764.
Murthy SK, DiFrancesco LM, Ogilvie RT, Demetrick DJ. 2002. Loss of Heterozygosity Associated with Uniparental Disomy in Breast Carcinoma. Mod Pathol 15(12): 1241-1250.
Neve RM, Chin K, Fridlyand J, Yeh J, Baehner FL, Fevr T, Clark L, Bayani N, Coppe J-P, Tong F et al. 2006. A collection of breast cancer cell lines for the study of functionally distinct cancer subtypes. Cancer Cell 10(6): 515-527.
Newman AM, Bratman SV, To J, Wynne JF, Eclov NCW, Modlin LA, Liu CL, Neal JW, Wakelee HA, Merritt RE. 2014. An ultrasensitive method for quantitating circulating tumor DNA with broad patient coverage. Nature medicine.
Oesper L, Satas G, Raphael BJ. 2014. Quantifying tumor heterogeneity in whole-genome and whole-exome sequencing data. Bioinformatics 30(24): 3532-3540.
Pedersen BS, Konstantinopoulos PA, Spillman MA, De S. 2013. Copy neutral loss of heterozygosity is more frequent in older ovarian cancer patients. Genes, Chromosomes and Cancer 52(9): 794-801.
Pinto D, Darvishi K, Shi X, Rajan D, Rigler D, Fitzgerald T, Lionel AC, Thiruvahindrapuram B, MacDonald JR, Mills R. 2011. Comprehensive assessment of array-based platforms and calling algorithms for detection of copy number variants. Nature biotechnology 29(6): 512-520.
Sawey Eric T, Chanrion M, Cai C, Wu G, Zhang J, Zender L, Zhao A, Busuttil Ronald W, Yee H, Stein L et al. 2011. Identification of a Therapeutic Strategy
not peer-reviewed) is the author/funder. All rights reserved. No reuse allowed without permission. The copyright holder for this preprint (which was. http://dx.doi.org/10.1101/038828doi: bioRxiv preprint first posted online Feb. 4, 2016;
29
Targeting Amplified FGF19 in Liver Cancer by Oncogenomic Screening. Cancer Cell 19(3): 347-358.
Schröck E, Manoir Sd, Veldman T, Schoell B, Wienberg J, Ferguson-Smith MA, Ning Y, Ledbetter DH, Bar-Am I, Soenksen D et al. 1996. Multicolor Spectral Karyotyping of Human Chromosomes. Science 273(5274): 494-497.
Sheffer M, Bacolod MD, Zuk O, Giardina SF, Pincas H, Barany F, Paty PB, Gerald WL, Notterman Da, Domany E. 2009. Association of survival and disease progression with chromosomal instability: a genomic exploration of colorectal cancer. Proceedings of the National Academy of Sciences 106(17): 7131-7136.
Side L, Taylor B, Cayouette M, Conner E, Thompson P, Luce M, Shannon K. 1997. Homozygous Inactivation of the NF1 Gene in Bone Marrow Cells from Children with Neurofibromatosis Type 1 and Malignant Myeloid Disorders. New England Journal of Medicine 336(24): 1713-1720.
Sirivatanauksorn V, Sirivatanauksorn Y, Gorman PA, Davidson JM, Sheer D, Moore PS, Scarpa A, Edwards PAW, Lemoine NR. 2001. Non-random chromosomal rearrangements in pancreatic cancer cell lines identified by spectral karyotyping. International journal of cancer 91(3): 350-358.
Slamon DJ, Leyland-Jones B, Shak S, Fuchs H, Paton V, Bajamonde A, Fleming T, Eiermann W, Wolter J, Pegram M et al. 2001. Use of Chemotherapy plus a Monoclonal Antibody against HER2 for Metastatic Breast Cancer That Overexpresses HER2. New England Journal of Medicine 344(11): 783-792.
Stephens PJ, Greenman CD, Fu B, Yang F, Bignell GR, Mudie LJ, Pleasance ED, Lau KW, Beare D, Stebbings La et al. 2011. Massive genomic rearrangement acquired in a single catastrophic event during cancer development. Cell 144(1): 27-40.
Storlazzi CT, Lonoce A, Guastadisegni MC, Trombetta D, D'Addabbo P, Daniele G, L'Abbate A, Macchia G, Surace C, Kok K et al. 2010. Gene amplification as double minutes or homogeneously staining regions in solid tumors: origin and structure. Genome research 20(9): 1198-1206.
Tuna M, Knuutila S, Mills GB. 2009. Uniparental disomy in cancer. Trends in Molecular Medicine 15(3): 120-128.
Whibley C, Pharoah PDP, Hollstein M. 2009. p53 polymorphisms: cancer implications. Nat Rev Cancer 9(2): 95-107.
Wilks C, Cline MS, Weiler E, Diehkans M, Craft B, Martin C, Murphy D, Pierce H, Black J, Nelson D et al. 2014. The Cancer Genomics Hub (CGHub): overcoming cancer through the power of torrential data. Database : the journal of biological databases and curation 2014.
Yau C, Mouradov D, Jorissen RN, Colella S, Mirza G, Steers G, Harris A, Ragoussis J, Sieber O, Holmes CC. 2010. A statistical approach for detecting genomic aberrations in heterogeneous tumor samples from single nucleotide polymorphism genotyping data. Genome biology 11(9): R92-R92.
Yu Z, Liu Y, Shen Y, Wang M, Li A. 2014. CLImAT : accurate detection of copy number alteration and loss of heterozygosity in impure and aneuploid tumor samples using whole-genome sequencing data. Bioinformatics 30(5): 413-421.
Zack TI, Schumacher SE, Carter SL, Cherniack AD, Saksena G, Tabak B, Lawrence MS, Zhang C-Z, Wala J, Mermel CH et al. 2013. Pan-cancer patterns of somatic copy number alteration. Nat Genet 45(10): 1134-1140.
not peer-reviewed) is the author/funder. All rights reserved. No reuse allowed without permission. The copyright holder for this preprint (which was. http://dx.doi.org/10.1101/038828doi: bioRxiv preprint first posted online Feb. 4, 2016;

30
Zhao X, Li C, Paez JG, Chin K, Jänne PA, Chen T-H, Girard L, Minna J, Christiani D, Leo C. 2004. An integrated view of copy number and allelic alterations in the cancer genome using single nucleotide polymorphism arrays. Cancer research 64(9): 3060-3071.
not peer-reviewed) is the author/funder. All rights reserved. No reuse allowed without permission. The copyright holder for this preprint (which was. http://dx.doi.org/10.1101/038828doi: bioRxiv preprint first posted online Feb. 4, 2016;