scintillation and loss of signal lock from poleward moving ... and loss of signal lock from poleward...
TRANSCRIPT
Scintillation and loss of signal lock from polewardmoving auroral forms in the cusp ionosphereK. Oksavik1,2, C. van der Meeren1, D. A. Lorentzen1,2, L. J. Baddeley1,2, and J. Moen2,3
1Birkeland Centre for Space Science, Department of Physics and Technology, University of Bergen, Bergen, Norway,2University Centre in Svalbard, Longyearbyen, Norway, 3Department of Physics, University of Oslo, Oslo, Norway
Abstract We present two examples from the cusp ionosphere over Svalbard, where poleward moving auroralforms (PMAFs) are causing significant phase scintillation in signals from navigation satellites. The data wereobtained using a combination of ground-based optical instruments and a newly installed multiconstellationnavigation signal receiver at Longyearbyen. Both events affected signals from GPS and Global Navigation SatelliteSystem (GLONASS). When one intense PMAF appeared, the signal from one GPS spacecraft also experienced atemporary loss of signal lock. Although several polar cap patches were also observed in the area as enhancementsin total electron content, the most severe scintillation and loss of signal lock appear to be attributed to veryintense PMAF activity. This shows that PMAFs are locations of strong ionospheric irregularities, which at timesmay cause more severe disturbances in the cusp ionosphere for navigation signals than polar cap patches.
1. Introduction
A fundamental characteristic of the dayside aurora is transients and poleward moving auroral forms(PMAFs). Early studies [e.g., Feldstein and Starkov, 1967; Vorobjev et al., 1975] identified poleward movingevents that detached from the dayside auroral oval and drifted into the polar cap. The motion of PMAFsis controlled by the polarity of the interplanetary magnetic field (IMF) By component [Sandholt et al.,1986, 1993; Moen et al., 1999]. The PMAFs move northwest when By is positive, and northeast when By isnegative [Sandholt et al., 1998], and PMAFs aremost frequent when |By|> |Bz| [Sandholt et al., 2004], correspondingto IMF clock angles between 45° and 135°.
PMAFs have often been interpreted as ionospheric signatures of flux transfer events (FTEs) [Sandholt et al.,1990, 1993; Denig et al., 1993;Milan et al., 1999, 2000; Thorolfsson et al., 2000], where dayside transients oftenshow repetition rates [Milan et al., 1999] comparable to FTEs at the magnetopause [Russell and Elphic, 1978,1979; Haerendel et al., 1978]. Transient reconnection is believed to be the primary transfer mechanism of fluxfrom the solar wind to the magnetosphere [Cowley and Lockwood, 1992; Lockwood et al., 1995]. A burst ofreconnection propagates from the magnetopause to the ionosphere as an Alfvénic disturbance with anassociated system of field-aligned Birkeland currents [Glassmeier and Stellmacher, 1996]. In the cusp ionosphereit sets up a mesoscale twin-cell flow pattern [Southwood, 1985, 1987]. The same process may also create isolatedpolar cap patches of increased electron density in the F region ionosphere [Lockwood and Carlson, 1992; Carlsonet al., 2002, 2004, 2006; Lockwood et al., 2005a, 2005b; Lorentzen et al., 2010], which are often closely associatedwith PMAFs and an optical flash at the foot of the newly opened flux [Carlson et al., 2006].
A series of publications have used fast scan modes at the European Incoherent Scatter Svalbard Radar toinvestigate the time evolution of mesoscale flow channels in relation to PMAFs [Carlson et al., 2004;Oksavik et al., 2004, 2005, 2011; Rinne et al., 2007, 2010; Moen et al., 2008]. Oksavik et al. [2004, 2005] foundthat the clockwise vorticity on one side of a flow channel is consistent with an upward Birkeland current (i.e.,intense PMAF aurora), while the counterclockwise vorticity on the other side of the flow channel is consistentwith a downward Birkeland current (i.e., weak or no aurora). Rinne et al. [2007] identified a new type of flowchannel (reversed flow events) that gives enhanced flow in the reverse direction of the large-scale backgroundconvection. Moen et al. [2008] point out that this phenomenon is related to a Birkeland Current Arc and providetwo possible explanations: (1) coupling through a poorly conducting ionosphere of two MI current loops forcedby independent voltage generators or (2) that the flow channel is driven by an inverted V.
The Super Dual Auroral Radar Network (SuperDARN) community has shown that the dayside aurora is oftenco-located with coherent HF radar echoes [Rodger et al., 1995; Yeoman et al., 1997; Moen et al., 2001]. A wide
OKSAVIK ET AL. SCINTILLATION FROM PMAFS 9161
PUBLICATIONSJournal of Geophysical Research: Space Physics
RESEARCH ARTICLE10.1002/2015JA021528
Key Points:• Intense phase scintillation fromdayside poleward moving auroralforms (PMAFs)
• PMAFs can have stronger ionosphericirregularities than polar cap patches
• PMAFs can cause loss of signal lock
Correspondence to:K. Oksavik,[email protected]
Citation:Oksavik, K., C. van der Meeren,D. A. Lorentzen, L. J. Baddeley, andJ. Moen (2015), Scintillation and loss ofsignal lock from poleward movingauroral forms in the cusp ionosphere,J. Geophys. Res. Space Physics, 120,9161–9175, doi:10.1002/2015JA021528.
Received 2 JUN 2015Accepted 30 SEP 2015Accepted article online 2 OCT 2015 Published online 27 OCT 2015 Corrected 17 DEC 2015
This article was corrected on 17 DEC 2015. See the end of the full text for details.
©2015. The Authors.This is an open access article under theterms of the Creative CommonsAttribution-NonCommercial-NoDerivsLicense, which permits use and distri-bution in any medium, provided theoriginal work is properly cited, the use isnon-commercial and no modificationsor adaptations are made.

range of poleward moving transients are observed: flow channel events [Pinnock et al., 1993, 1995; Chishamet al., 2000; Neudegg et al., 1999, 2000], pulsed ionospheric flows (PIFs) [Provan et al., 1998, 2002; Provan andYeoman, 1999;McWilliams et al., 2000] and polewardmoving radar auroral forms [Milan et al., 2000, 2002;Wildet al., 2001; Davies et al., 2002; Rae et al., 2004]. SuperDARN obtains echoes from decametre-scale field-alignedplasma irregularities that track the background convection in the ionosphere [Greenwald et al., 1995;Chisham et al., 2007]. The close association between PMAFs and transient features in HF radar backscatter[Milan et al., 1999] therefore suggests that PMAFs are associated with plasma irregularities, which maycause severe scintillation and disturbance of ground-to-satellite links and communication and navigationsystems [Buchau et al., 1985; Basu et al., 1988, 1990, 1994, 1998].
Several studies have looked at scintillation of spacecraft signals in a statistical manner [Kersley et al., 1995; Spogliet al., 2009; Li et al., 2010; Alfonsi et al., 2011; Tiwari et al., 2012]. Both 250MHz satellite beacon scintillation mea-surements [Aarons et al., 1981] and GPS scintillation measurements have found the highest occurrence of scin-tillation during the local winter months [Li et al., 2010] or in the autumn-winter season [Prikryl et al., 2011, 2015].Kersley et al. [1995] pointed out that the occurrence of scintillation in winter often maximizes near magneticnoon and extends in a latitudinal belt into the afternoon/evening sector. Another study [Prikryl et al., 2011]found maximum scintillation in the prenoon hours of the perturbed cusp ionosphere, in addition to nightsideauroral arc brightening and substorms. Cusp region dynamics is proposed as a potentially strong source forphase scintillation and potential cycle slips [Prikryl et al., 2010]. They defined a cycle slip as a jump in differentialphase total electron content (TEC) of more than 1.5 TECU in 1 s (1 TECU corresponds to 1016 el/m2). Scintillationand cycle slips have been found to peak when high-speed streams or interplanetary coronal mass ejectionsimpact the Earth’s magnetosphere [Prikryl et al., 2014]. Intense auroral arcs have produced loss of signal lockduring strong substorms in the nightside ionosphere [Smith et al., 2008]; however, we have not yet foundany reports in literature on loss of lock in the traditionally weaker dayside cusp aurora.
In a pioneering piece of work Basu et al. [1998] studied plasma structuring and scintillation over Svalbard forthree active days in January 1997, but their work mostly focused on much larger spatial scales and the stablecusp aurora near magnetic noon. Later, Milan et al. [2005] found a close correspondence between the occur-rence of amplitude scintillations of 250MHz satellite beacon signals and SuperDARN backscatter power at10MHz. Prikryl et al. [2010, 2011] have also shown that GPS phase scintillation to coexist with SuperDARNbackscatter. However, Milan et al. [2005] and Prikryl et al. [2010, 2011] have not related it to PMAF activityand moving auroral forms. Other case studies [De Franceschi et al., 2008; Coker et al., 2004; Mitchell et al.,2005; van der Meeren et al., 2014; Jin et al., 2014; Hosokawa et al., 2014] have mostly focused on nightsideevents in the context of magnetic storms or auroral substorms.
Kinrade et al. [2012] investigated ionospheric scintillation over Antarctica during a large geomagnetic stormfollowing a coronal mass ejection. Significant phase scintillation was seen in the plasma depletion region bothin the dayside noon sector and in the dayside cusp. Near 13:00 magnetic local time they observed ~30 s burstsof phase scintillation. Within each burst there were ~5–6 s pseudo-periodic oscillations. They suspected that thiswas due to “cusp precipitation of some kind,” but no optical data or mentioning of PMAFs was presented.
Kinrade et al. [2013] compared auroral images with scintillationmeasurements from the South Pole Station bytracking up to 11 satellites simultaneously. At magnetic noon they found phase scintillation to be associatedwith 630.0 nm rather than 557.7 nm emissions. Summing over all local times (both day and night) they foundthat phase scintillations are generally more correlated with 557.7 nm than 630.0 nm emissions (correlationlevels of up to 74% versus up to 63%). Their explanation was that 557.7 nm emissions have shorter lifetimeand are generally more intense than 630.0 nm emission, which is usually not the case in the cusp regionwhere 630.0 nm is expected to dominate [e.g., Sandholt et al., 1986]. Kinrade et al. [2013] did not mentionPMAFs or relate their dayside scintillation events to pulsed reconnection events at the magnetopause.
In the current paper we will follow up on the hypothesis of Kinrade et al. [2012] that the significant phasescintillation near magnetic noon is due to cusp precipitation of some kind. We will present data from anew receiver which is tracking data at Svalbard from GPS, Global Navigation Satellite System (GLONASS)and Galileo. In 2013, our receiver was on average tracking 20–24 satellites simultaneously. Using data fromtwo intense PMAF events on 14 January 2013 we will document that PMAF activity is producing transientand highly localized areas of severe phase scintillation that move through the cusp region ionosphere andinto the polar cap.
Journal of Geophysical Research: Space Physics 10.1002/2015JA021528
OKSAVIK ET AL. SCINTILLATION FROM PMAFS 9162

2. Instrumentation
For this study we use a newly installed NovAtel GPStation-6 receiver at the Kjell Henriksen Observatory (KHO)in Longyearbyen (78.1°N, 16.0°E). It is a multiconstellation and multifrequency receiver, which is currentlytracking signals from GPS (L1/L2/L2C/L5), GLONASS (L1/L2), and Galileo (E1/E5a/E5b/Alt-BOC). The receiveroutputs the phase scintillation σϕ index [Fremouw et al., 1978; Rino, 1979]. A sixth-order Butterworth high-pass filter with a cutoff frequency of 0.1 Hz is used to find the detrended raw carrier phaseϕ, and the σϕ indexis computed over 60 s intervals [van Dierendonck et al., 1993, 1996]:
σ2ϕ ¼ ϕ2� �� ϕh i2
The phase scintillation index is generally influenced by the observation geometry, but Forte and Radicella[2004] have shown that geometrical factors are not important for scintillation indices at high latitudes forsatellites flying in GPS-like orbits. The receiver also outputs the 60 s amplitude scintillation S4 index, whichis the standard deviation of the received power I normalized by its mean value [Briggs and Parkin, 1963]:
S24 ¼I2� �� Ih i2
Ih i2
The receiver also provides the total electron content (TEC) and rate of TEC (ROT), both at 1 s and 60 s resolution.Raw data of the amplitude and phase are available at 50Hz resolution.
For optical monitoring of the PMAF activity we use a meridian scanning photometer (MSP) and an all-skyimager (ASI) both located at KHO. The geographic location of KHO relative to the magnetic pole allows fordetailed observations of the dayside aurora in the midst of winter. The MSP is operated by the UniversityCentre in Svalbard, and it was recording auroral emissions at 557.7 and 630.0 nm. The ASI is operated bythe University of Oslo, and it was recording auroral emissions at 630.0 nm. We will also use solar wind datafrom the NASA OMNIWeb service, which provides data that are already time-shifted to the bow shock.
3. Data Presentation
Around 07:00 UT on 14 January 2013 the solar wind speed was 520–560 km/s and the solar wind density was2–3 cm�3 (data not shown). The Earth’s geomagnetic field was weakly disturbed (Kp= 3). Figure 1 presentsinterplanetary magnetic field (IMF) data that have been extracted from the NASA/ Goddard Space FlightCenter’s OMNI data set. Figure 1 (top) shows the components Bx (black line), By (blue line), and Bz (red line).Although there is a brief data gap around 07:10 UT, the figure shows that Bx is negative and both By and Bz areweakly positive around 07:00 UT. Figure 1 (bottom) shows the IMF clock angle in the GSM y-z plane [see, e.g.,Oksavik et al., 2000]. It is defined as θ = tan� 1(|By/Bz|) for Bz> 0 and 180∘� tan� 1(|By/Bz|) for Bz< 0. In theinterval 06:45–07:10 UT the IMF clock angle is between 0° and 90°. The positive By is favorable for PMAFactivity over Svalbard with motion from southeast to northwest [Sandholt et al., 1998, 2004].
Figure 2 gives an overview of optical and scintillation data from the Kjell Henriksen Observatory (KHO) inLongyearbyen. Figures 2a and 2b show the intensity of the meridian scanning photometer (MSP) 630.0 nmand 557.7 nm channels, respectively. The MSP scans the sky from north (0° elevation) to south (180° elevation)with a time resolution of 16 s. The background has been subtracted, and the color scale gives the intensity inRayleigh (R). Up until 06:55 UT therewas a bright arc in the southern part of the sky (around 120–150° elevation),
Figure 1. (top) Components of the interplanetary magnetic field (IMF): Bx (black line), By (blue line), Bz (red line). (bottom)The IMF clock angle is also shown. Grey shading is used to indicate the time interval shown in Figure 2.
Journal of Geophysical Research: Space Physics 10.1002/2015JA021528
OKSAVIK ET AL. SCINTILLATION FROM PMAFS 9163

which is characteristic for the strongly southward IMF dayside cusp aurora [Sandholt et al., 1998, 2004]. At06:55–07:00 UT and 07:05–07:15 UT there were two PMAFs that formed and drifted into the polar cap. Theseevents are indicatedwith dashed lines and numbers 1 and 2 and occurred for positive IMF By, which is favorablefor PMAF activity [Sandholt et al., 1998, 2004].
Figures 2c and 2d show the corresponding scintillation data from our new multiconstellation navigation signalreceiver at KHO in Longyearbyen, and colors are used to separate the different spacecraft. Figure 2c shows the60 s phase scintillation σϕ index. Phase scintillations are caused by irregularities of scale size from hundreds ofmeters to several kilometers [Kintner et al., 2007]. In Figure 2c we notice that both PMAF events coincide in timewith two intervals of enhanced phase scintillation (σϕ =0.2 to 0.8 radians). The first event had enhanced phasescintillation lasting for 3min (06:57–06:59 UT). The second event had enhanced phase scintillation lasting for5min (07:05–07:09 UT) and an additional 3min (07:11–07:14 UT). Figure 2d shows the 60 s amplitude scintilla-tion S4 index. In the weak scattering regime [Rino, 1979] of these observations, amplitude scintillations at L bandare caused by irregularities of scale size from tens of meters to hundreds of meters, which is at and below theFresnel radius [Kintner et al., 2007]. In Figure 2d we notice that the amplitude scintillation S4 index is generallyless than 0.2, which is typical for high latitudes where amplitude scintillations are weak and phase scintillationsdominate [Kintner et al., 2007].
Figure 3 presents six images (06:55–07:00 UT) from the University of Oslo all-sky imager at KHO inLongyearbyen. In Figure 3a the image has been projected onto a magnetic grid, assuming auroral emissionsat 250 km altitude, which is a typical altitude for 630.0 nm emissions in the cusp ionosphere [Lockwood et al.,1993; Johnsen et al., 2012], while the other panels show unprojected all-sky images (north up, east right). Thecolor scale indicates the auroral intensity at 630.0 nm (lower color bar). Overlaid onto each panel we alsoshow scintillation data, where shapes indicate the type of constellation: GLONASS (diamonds) and GPS
Figure 2. Optical and scintillation data from the Kjell Henriksen Observatory (KHO) in Longyearbyen: (a) the 630.0 nmmeridian scanning photometer (MSP) intensity, (b) the 557.7 nm MSP intensity, (c) the 60 s phase scintillation σφ index,and (d) 60 s amplitude scintillation S4 index. Colors are used in Figures 2c and 2d to separate the different spacecraft. Thedashed lines in Figures 2a and 2b indicate the PMAF events 1 and 2. See text for more details.
Journal of Geophysical Research: Space Physics 10.1002/2015JA021528
OKSAVIK ET AL. SCINTILLATION FROM PMAFS 9164

(circles). The marker color is the phase scintillation index (upper color bar). Both the auroral and phase scin-tillation activity is low in the first two panels (06:55–06:56 UT). At 06:57 UT a bright PMAF appeared, and thephase scintillation immediately began to rise in its vicinity (GLONASS 21 and GPS 03). At 06:58 UT the PMAFhad intensified further and began drifting northwest. GPS 03 and GLONASS 21 showed strong phase scintil-lation right in the middle of the PMAF. At 07:00 UT the PMAF had left the area covered by GPS and GLONASS,and the phase scintillation returned back to low levels. It should also be pointed out that throughout theentire time interval 06:55–07:00 UT the phase scintillation only changed in the vicinity of the PMAF. The phasescintillation was weak in the rest of the field of view. Consequently, the area of strong phase scintillation andPMAF activity appears to be related.
Figure 4 presents another example in the same format. The first image frame (07:03 UT) shows a bright PMAFeast of Svalbard. At 07:04 UT the PMAF begins to intersect GLONASS 05, which shows elevated phase scintil-lation. The PMAFmoves northwest. At 07:06 UT GLONASS 05 continues to show enhanced phase scintillation,while GLONASS 21 starts to show strong phase scintillation. At 07:07 UT the PMAF has intensified and movedfurther northwest, and both GPS 03 and GLONASS 21 show strong phase scintillation. At 07:08 UT the PMAF islocated more to the northwest. GPS 03 is no longer affected, while GLONASS 21 continues to show strongphase scintillation. Consequently, the area of strong phase scintillation again overlaps with the PMAF.
Figures 5, 6, and 7 provide a closer look at the phase scintillation and TEC variations in relation to line-of-sightauroral emissions for the three spacecraft that were highlighted in Figures 3 and 4 (GLONASS 05, GLONASS21, and GPS 03). The grey shading indicates the intervals covered by Figures 3 and 4 for easier comparison.
Figures 5a, 6a, and 7a present the line-of-sight auroral intensity at 557.7 and 630.0 nm in an area that is 7 × 7pixels wide and centered at the elevation and azimuth of each spacecraft. The width of each line representsthe range of observed auroral intensities in the 7 × 7 pixel area (from minimum to maximum intensity). Forboth events the GLONASS 05 (Figure 5a) signal was experiencing significantly lower auroral intensities thanGLONASS 21 (Figure 6a) and GPS 03 (Figure 7a), which is consistent with GLONASS 05 being slightlyequatorward of the two PMAF events. For GLONASS 05 (Figure 5a) the intensity ratio 630.0 nm versus557.7 nm stayed around 2:1, which is typical for the dayside aurora, where 630.0 nm usually dominates[e.g., Sandholt et al., 1986]. For GLONASS 21 (Figure 6a) and GPS 03 (Figure 7a) the intensity ratio stayed
Figure 3. Six 630.0 nm all-sky images from the Kjell Henriksen Observatory (KHO) in Longyearbyen on 14 January 2013 withionospheric piercing points (IPPs) overlaid for all available GPS and GLONASS spacecraft. In the first panel (a) the image isprojected to a magnetic grid, while the other panels show unprojected all-sky images (magnetic north is up, east is right).Themarker color is the phase scintillation index (upper color bar). Intense phase scintillation occurred when the GPS 03 andGLONASS 21 signals intersected a bright PMAF between 06:57 and 06:58 UT.
Journal of Geophysical Research: Space Physics 10.1002/2015JA021528
OKSAVIK ET AL. SCINTILLATION FROM PMAFS 9165

around 2:1 before/after the two PMAF events. In the middle of each PMAF event the auroral intensityspiked for both 630.0 and 557.7 nm, and the intensity ratio approached 1:1. For GPS 03 (Figure 7a) the557.7 nm intensity also exceeded the 630.0 nm intensity for a few seconds around 06:57:30 UT.
Figures 5b and 5c, 6b and 6c, and 7b and 7c present the TEC and the absolute value of the rate of TEC (ROT),respectively. All spacecraft were at high elevations, so there is generally little difference between the slant TEC(solid lines) and the vertical TEC (dashed lines). All TEC data have been calibrated (corrected for bias). In the TECdata (Figures 5b, 6b, and 7b) there were several polar cap patches (indicated with the letter P), which can beidentified as transient TEC enhancements lasting just a few minutes. For GLONASS 05 (Figures 5a and 5b) thePMAFs at 06:56 and 07:06 UT were co-located with local TEC minima, that were followed by polar cap patches(i.e., the PMAFs were on the poleward side of the polar cap patch, given that the drift speed was in the polewarddirection in Figures 3 and 4). For GLONASS 21 (Figures 6a and 6b) the first PMAF at 06:57 UT was co-located with aTEC minimum, while the second PMAF at 07:07 UT was inside a polar cap patch.
For GPS 03 (Figures 7a and 7b) the PMAF at 07:07 UT was co-located with a TEC minimum, while the PMAF at06:57 UT coincided with a dramatic TEC enhancement. From 06:57:13 to 06:57:20 UT the TEC jumped from 2.8to 18.9 TECU, corresponding to a gradient of 2.3 TECU/s, which according to Prikryl et al. [2010] would be clas-sified as a cycle slip (change of more than 1.5 TECU/s). A careful examination of the raw data also reveals thatthe receiver lost lock for the L2Y signal (center frequency at 1227.60MHz) between 06:56:44 and 06:57:36 UT(indicated with cyan shading in Figure 7b). There was no loss of lock for L1CA, which corresponds to a highercenter frequency (1575.42MHz). Unfortunately, the receiver was only recording 50Hz data of L1CA at thetime, but 1 s resolution TEC data, which were recorded in real-time and were based on L1CA and L2Y signals,reveal two 5 and 3 s data gaps (06:57:13 to 06:57:18 UT and 06:57:33 to 06:57:36 UT). It suggests that the L2Yloss of lock occurred at those particular times. It should be noticed that 06:57:13 to 06:57:18 UT coincides bothwith the extremely bright 557.7 and 630.0 nm PMAF (Figure 7a) and the steep TEC gradient (Figure 7b) thatPrikryl et al. [2010] would classify as a cycle slip.
For GLONASS 05 the ROT (Figure 5c) was generally lower than for the other two spacecraft (see Figures 6c and 7c).GLONASS 05 observed the highest ROT of around 0.25 TECU/s in the vicinity of local TEC minima (e.g., 06:56,06:59, 07:06, and 07:11 UT), often in connection with a positive TEC gradient. Given the poleward drift seen inFigures 3 and 4, it suggests the highest ROT was for the most part detected at the poleward side (leadingedge) of polar cap patches. Only two of the ROT enhancements appear to be related to small enhancementsof auroral emissions (06:56 and 07:06 UT). Both GLONASS 21 and GPS 03 had their highest ROT in connection
Figure 4. Same as Figure 3 but for 07:03–07:08 UT on 14 January 2013. Intense phase scintillation occurred when the GPS03 and GLONASS 21 signals intersected a bright PMAF between 07:06 and 07:08 UT.
Journal of Geophysical Research: Space Physics 10.1002/2015JA021528
OKSAVIK ET AL. SCINTILLATION FROM PMAFS 9166

with the two PMAFs at 06:57 and 07:07 UT. For GLONASS 21 the ROT exceeded 0.5 TECU/s (Figure 6c), and forGPS 03 the ROT exceeded 0.2–0.3 TECU/s (Figure 7c).
Figures 5d, 6d, and 7d present a high-resolution σϕ scintillation index that we have calculated to provide amore detailed view of the phase scintillation during the events. The raw 50Hz phase data were detrendedusing a sixth-order Butterworth high-pass filter with a cutoff frequency of 0.1 Hz, and the σϕ index was com-puted over 1 s intervals. We have carefully examined that this high-resolution σϕ index matches the overallfeatures of the lower-resolution 60 s data, which is output by the receiver in real time. For GLONASS 05(Figure 5d) and GLONASS 21 (Figure 6d) the 1 s σϕ index was computed for both L1CA and L2P. For GPS03 (Figure 7d) we could only calculate it for L1CA, because L2Y was not recorded.
For GLONASS 05 (Figure 5d) the phase scintillation was relatively low, except for a brief enhancement ofσϕ> 0.5 rad around 07:06 UT in connection with the second PMAF event. The otherwise weak scintillation
Figure 5. GLONASS 05 data on 14 January 2013. (a) The 557.7 and 630.0 nm auroral intensity in the vicinity of the satelliteIPPs. (b): Slant and vertical total electron content (TEC) in units of TECU (1 TECU = 1016 el m�2). Three polar cap patchesare indicated using the letter P. (c) Rate of TEC (ROT). (d) The phase scintillation index computed from raw 50 Hz phasedata over periods of 1 s for the signals L1CA and L2P. (e): Wavelet power spectra of raw 50 Hz phase data versus thecorresponding period (right axis) and spatial scale (left axis). Grey shading indicates the duration of Figures 3 and 4.The fluctuations are generally lower than for the other two spacecraft (see Figures 6 and 7).
Journal of Geophysical Research: Space Physics 10.1002/2015JA021528
OKSAVIK ET AL. SCINTILLATION FROM PMAFS 9167
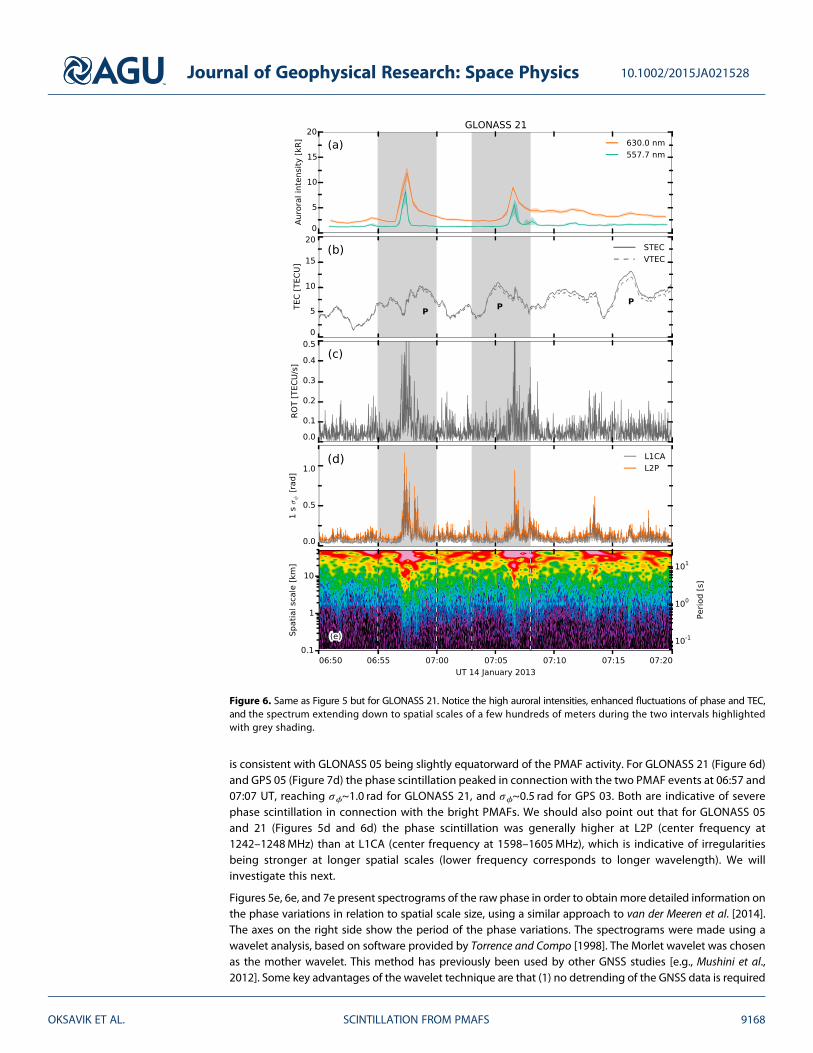
is consistent with GLONASS 05 being slightly equatorward of the PMAF activity. For GLONASS 21 (Figure 6d)and GPS 05 (Figure 7d) the phase scintillation peaked in connection with the two PMAF events at 06:57 and07:07 UT, reaching σϕ~1.0 rad for GLONASS 21, and σϕ~0.5 rad for GPS 03. Both are indicative of severephase scintillation in connection with the bright PMAFs. We should also point out that for GLONASS 05and 21 (Figures 5d and 6d) the phase scintillation was generally higher at L2P (center frequency at1242–1248MHz) than at L1CA (center frequency at 1598–1605MHz), which is indicative of irregularitiesbeing stronger at longer spatial scales (lower frequency corresponds to longer wavelength). We willinvestigate this next.
Figures 5e, 6e, and 7e present spectrograms of the raw phase in order to obtain more detailed information onthe phase variations in relation to spatial scale size, using a similar approach to van der Meeren et al. [2014].The axes on the right side show the period of the phase variations. The spectrograms were made using awavelet analysis, based on software provided by Torrence and Compo [1998]. The Morlet wavelet was chosenas the mother wavelet. This method has previously been used by other GNSS studies [e.g., Mushini et al.,2012]. Some key advantages of the wavelet technique are that (1) no detrending of the GNSS data is required
Figure 6. Same as Figure 5 but for GLONASS 21. Notice the high auroral intensities, enhanced fluctuations of phase and TEC,and the spectrum extending down to spatial scales of a few hundreds of meters during the two intervals highlightedwith grey shading.
Journal of Geophysical Research: Space Physics 10.1002/2015JA021528
OKSAVIK ET AL. SCINTILLATION FROM PMAFS 9168

to produce a wavelet spectrogram and (2) wavelet spectrograms provide better resolution at smaller scales.The spectrograms have been carefully examined and compared to Fourier spectrograms of detrended datato verify that the two techniques give similar results. For further details on the wavelet technique we refer toTorrence and Compo [1998] and Mushini et al. [2012].
The wavelet spectrograms were converted to spatial scale (see left axes), using information on the drift speedof the PMAFs. From an analysis of all-sky images we found that two PMAFs had drift speeds of around 1600and 2300m/s, respectively. At the same time the ionospheric piercing points of the satellites moved at40–50m/s, which is insignificant in this regard. An average value of 1800m/s was chosen for the conversionof temporal features to a spatial scale. Note that the spatial scale is only used in an order-of-magnitude sense(i.e., an adjustment to the assumed drift velocity by a factor 2 will only cause a corresponding linear adjustmentto the spatial scale in the spectrogram, which will not change the order of magnitude).
For GLONASS 05 (Figure 5e) the strongest spectral power enhancements (red and yellow colors) were seen atspatial scales greater than 10 km, and some spectral power enhancements (green and bright blue colors)
Figure 7. Same as Figure 5 but for GPS 03. The phase scintillation index in Figure 7d is computed using the L1CA signal.Notice the high auroral intensities, enhanced fluctuations of phase and TEC, and the spectrum extending down to spatialscales of a few hundreds of meters during the two intervals highlighted with grey shading. A loss of lock was observed forthe first PMAF event (cyan shading in Figure 7b).
Journal of Geophysical Research: Space Physics 10.1002/2015JA021528
OKSAVIK ET AL. SCINTILLATION FROM PMAFS 9169

extended all the way down to ~2 km spatial scale. This picture was quite uniform throughout the whole timeinterval, which is consistent with GLONASS 05 being less affected by PMAF activity. For the most intensePMAF activity around 06:57 and 07:07 UT, GLONASS 21 (Figure 6e) and GPS 03 (Figure 7e) showed strongspectral power enhancements (red and yellow colors) at spatial scales greater than 4–5 km, and some spec-tral power enhancements (green and bright blue colors) extended all the way down to just a few hundreds ofmeters. Consequently, the finest structuring appears to be highly localized and attributed to PMAFs. It sug-gests that PMAFs are locations of stronger irregularities than the surrounding cusp ionosphere, which alsoincluded several polar cap patches (Figures 5b, 6b, and 7b), in particular at spatial scales of a few hundredsof meters to a few kilometers.
4. Discussion
Our results show that both GPS and GLONASS signals were affected by PMAF activity. The enhanced scintilla-tion in the cusp ionosphere was observed to be highly localized and highly transient in nature. This is contraryto the results of Prikryl et al. [2011], who reported that scintillation often covers a large geographic area of thecusp/cleft region andwith duration of several hours. Whilemost of the field of viewwas unaffected, the phasescintillation was enhanced in the close vicinity of the two PMAF events. It therefore appears that the cuspprecipitation of some kind, which Kinrade et al. [2012] were referring to as the cause of significant phasescintillation near magnetic noon, must be the well-known phenomenon in the dayside aurora called PMAFs.The area of enhanced phase scintillation drifted poleward into the polar cap together with the PMAF. Themotion of the two PMAF events is consistent with reports on PMAFs in literature [e.g., Sandholt et al., 1998].
The introduction section pointed out that PMAFs are often closely associated with polar cap patches [Carlsonet al., 2006], which also are known to follow the antisunward convective flow across the polar cap. Polar cappatches are known to have densities 2–20 times higher than the surrounding background electron density[Buchau et al., 1983; Weber et al., 1984; Crowley et al., 2000]. They form near the dayside polar cap boundaryand drift across the polar cap to the nightside [Lorentzen et al., 2004; Oksavik et al., 2010; Moen et al., 2013;Nishimura et al., 2014; Zhang et al., 2015]. Polar cap patches are known to cause field-aligned plasma irregu-larities [e.g., Hosokawa et al., 2009], and several mechanisms have been proposed in literature.
One example is plasma density gradients that by themselves can grow unstable due to the gradient drift (GD)plasma instability [Ossakow and Chaturvedi, 1979; Keskinen and Ossakow, 1983; Tsunoda, 1988; Basu et al.,1988, 1990, 1994, 1998; Gondarenko and Guzdar, 2004], which is often regarded as the dominant mode forproduction of electron density irregularities in the F region cusp. The GD plasma instability mechanism occursfor plasma drift, of the correct sign, across a steep plasma density gradient perpendicular to the Earth’s mag-netic field at high latitudes [Keskinen and Ossakow, 1983]. Plasma drift in the opposite direction will set uppolarization fields that stabilize the plasma against formation of irregularities. Recent sounding rocket datahave shown that decametre-scale irregularities are located on kilometre-scale electron density gradients inthe cusp ionosphere produced by electron precipitation, with estimated growth times of 10–50 s for theGD process [Moen et al., 2012].
Another example is shears and vorticity in the plasma flow that are associated with PMAFs [Oksavik et al.,2004, 2005, 2011; Rinne et al., 2007, 2010; Moen et al., 2008]. Flow shears are known to trigger the Kelvin-Helmholtz (KH) plasma instability [Basu et al., 1988, 1990; Keskinen et al., 1988]. The KH theory has been furtherdeveloped by Keskinen et al. [1988], who also included a refinement of ionosphere-magnetosphere electricalcoupling. Using SuperDARN observations of flow shears, Oksavik et al. [2011] found KH irregularity growthtimes of 1–5min. Several of their events were associated with wide Doppler spectra and enhanced backscat-ter power, consistent with the growth of plasma irregularities.
There have also been attempts to merge the GD and KH plasma instability mechanisms in a two-step process.Carlson et al. [2007, 2008] proposed initial structuring driven by the KH instabilities, followed by additionalstructuring down to much finer scales driven by the GD instabilities. Oksavik et al. [2012] studied soundingrocket data from the cusp ionosphere, revealing plasma irregularities extending from hundreds of metersdown to a few tens of meters. However, the KH mechanism could not explain the finest-scale irregularities.Oksavik et al. [2012] noticed that the strongest plasma irregularities were observed 2min after a significantenhancement in the aurora and proposed an alternative two-step process: (1) structured particle precipitation
Journal of Geophysical Research: Space Physics 10.1002/2015JA021528
OKSAVIK ET AL. SCINTILLATION FROM PMAFS 9170

first generates weak “seed” irregularities and (2) the GD instability then breaks these seed irregularities down tosmaller scales.
The cases we presented have several polar cap patches (indicated with the character P in Figures 5b, 6b, and 7b).However, it is surprising to notice that most patches did not produce enhanced scintillation. One would normallyexpect the plasma inside a polar cap patch to become fully structured soon after initiation and with irregularitiesextending throughout the whole patch [Hosokawa et al., 2009]. Alternatively, one would at least expect irregula-rities at the steep gradients near the trailing edge of polar cap patches, which is unstable to irregularity growthvia the GD mechanism [e.g., Milan et al., 2002]. However, our observations do not support any of these twooptions. Both Figures 6 and 7 show the strongest phase scintillation to be co-located with extremely brightPMAFs, suggesting that structured particle precipitation is a very important source for plasma irregularities, atleast at kilometer to hundredmeter scale [Oksavik et al., 2012]. PMAFs are also associated with severe flow shears[Oksavik et al., 2004, 2005, 2011; Rinne et al., 2007, 2010;Moen et al., 2008], which may contribute to irregularitiesvia the KH mechanism [Oksavik et al., 2011].
The observed phase scintillations are believed to be due to irregularities of scale size from hundreds ofmeters to several kilometers [Kintner et al., 2007]. Our observations in Figures 6e and 7e show that irregula-rities at these spatial scales are present when PMAFs intersect the signal path. Sounding rocket data [Moenet al., 2012; Oksavik et al., 2012] also document that irregularities can exist all the way down to decameterscale, which is consistent with the frequent observation of transient features in HF radar backscatter in thecusp ionosphere [Milan et al., 1999]. Milan et al. [2005] also showed a close correspondence between ampli-tude scintillations of 250MHz satellite beacon signals and SuperDARN backscatter power at 10MHz. It shouldbe pointed out that 250MHz satellite beacon signals are more severely affected by scintillation than the1575.42MHz (GPS L1) band. We can also see this effect in Figures 5d and 6d, where scintillation is strongerat 1242–1248MHz (GLONASS L2P) than at 1598–1605MHz (GLONAS L1CA). It is due to the typical natureof irregularity spectra which show a rapid decay toward shorter wavelengths (higher frequencies), see, e.g.,Figures 5e, 6e, and 7e.
The production of irregularities requires energy. PMAFs are believed to be caused by transient reconnection atthe dayside magnetopause. Magnetic reconnection transfers flux from the solar wind to the magnetosphereand initiates plasma motion in the polar ionosphere [Cowley and Lockwood, 1992; Lockwood et al., 1995].PMAFs have often been interpreted as ionospheric signatures of FTEs [Sandholt et al., 1990, 1993; Deniget al., 1993;Milan et al., 1999, 2000; Thorolfsson et al., 2000]. At themagnetopause FTEs typically have a scale sizeof one Earth radius in the boundary normal direction [Saunders et al., 1984]. In the ionosphere the FTE flux tubemaps to around100–200 kmalong themeridian [Southwood, 1985, 1987]. TheFTE footprint sets upaPMAFandassociated flow shears [Oksavik et al., 2004, 2005], and plasma instabilities continue to structure the plasmadown to smaller and smaller spatial scales. The structuring can only continue if energy is input into the system.Aswe have shown in Figures 3 and 4, the scintillation is co-locatedwith the PMAF, indicating a close relation totheir anticipated energy source, transient reconnection at themagnetosphere. A statistical studybyPrikryl et al.[2015] also suggests that enhancedphase scintillation is highly collocatedwith regions that are known as iono-spheric signatures of the coupling between the solar wind and magnetosphere.
Once formed, the irregularities may cause problems for radio communication and navigation signals, like thesevere phase scintillation, loss of signal lock, and cycle slips. It is therefore interesting to note that a processinitially starting at the Earth’s magnetopause tens of thousands of kilometres away may have impact at muchsmaller scales in the ionosphere (down to a few hundreds of meters, possibly also smaller) and cause pro-blems of potential importance for society. A particular challenge with PMAF events and their associatedplasma irregularities is that they often move with high speeds exceeding 1 km/s. With newly installed multi-constellation receivers offering wide and dense coverage we can now track the scintillation from these dis-turbances, which would otherwise be smeared out in statistical data sets.
5. Concluding Remarks
In this paper we have presented two examples from the cusp ionosphere over Svalbard where bright pole-ward moving auroral forms (PMAFs) are observed to be associated with severe phase scintillation and strongplasma irregularities at spatial scales of a few hundred meters to a few kilometers. Using a combination ofground-based optical instruments and a newly installed multiconstellation navigation signal receiver we
Journal of Geophysical Research: Space Physics 10.1002/2015JA021528
OKSAVIK ET AL. SCINTILLATION FROM PMAFS 9171

tracked an area of enhanced phase scintillation that was co-located with two PMAFs and moved into thepolar cap. Both events affected signals from GPS and GLONASS. One bright PMAF, where the 557.7 nmexceeded the 630.0 nm intensity, also coincided with the steep TEC gradient on the leading edge (polewardside) of a polar cap patch causing a cycle slip; i.e., a change of more than 1.5 TECU per second [Prikryl et al.,2010]. At the same time the receiver also experienced a temporary loss of lock which compromised the GPSL2Y signal (1227.60MHz) of one spacecraft. The loss of lock appears to have occurred twice in less than oneminute, each loss of lock lasting 3–5 s. It shows that PMAF events can cause important space weather effectsin the polar ionosphere. Although several polar cap patches were also observed in the TEC data, the scintilla-tion wasmuch stronger from the PMAF events, which also appear to be associated with stronger irregularitiesthan the surrounding cusp ionosphere. It suggests that the structured particle precipitation of a bright PMAFevent is an important source for plasma irregularities in the cusp ionosphere, at least at kilometer to hect-ometer scale [Oksavik et al., 2012].
ReferencesAarons, J., J. P. Mullen, H. E. Whitney, A. L. Johnson, and E. J. Weber (1981), UHF scintillation activity over polar latitudes, Geophys. Res. Lett.,
8(3), 277–280, doi:10.1029/GL008i003p00277.Alfonsi, L., L. Spogli, G. De Franceschi, V. Romano, M. Aquino, A. Dodson, and C. N. Mitchell (2011), Bipolar climatology of GPS ionospheric
scintillation at solar minimum, Radio Sci., 46, RS0D05, doi:10.1029/2010RS004571.Basu, S., S. Basu, E. MacKenzie, P. F. Fougere, W. R. Coley, N. C. Maynard, J. D. Winningham, M. Sugiura, W. B. Hanson, and W. R. Hoegy (1988),
Simultaneous density and electric field fluctuation spectra associated with velocity shears in the auroral oval, J. Geophys. Res., 93(A1),115–136, doi:10.1029/JA093iA01p00115.
Basu, S., S. Basu, E. MacKenzie, W. R. Coley, J. R. Sharber, and W. R. Hoegy (1990), Plasma structuring by the gradient drift instabilityat high latitudes and comparison with velocity shear driven processes, J. Geophys. Res., 95(A6), 7799–7818, doi:10.1029/JA095iA06p07799.
Basu, S., S. Basu, P. K. Chaturvedi, and C. M. Bryant Jr. (1994), Irregularity structures in the cusp/cleft and polar cap regions, Radio Sci., 29(1),195–207, doi:10.1029/93RS01515.
Basu, S., E. J. Weber, T. W. Bullett, M. J. Keskinen, E. MacKenzie, P. Doherty, R. Sheehan, H. Kuenzler, P. Ning, and J. Bongiolatti (1998),Characteristics of plasma structuring in the cusp/cleft region at Svalbard, Radio Sci., 33(6), 1885–1899, doi:10.1029/98RS01597.
Briggs, B. H., and I. A. Parkin (1963), On the variation of radio star and satellite scintillations with zenith angle, J. Atmos. Sol. Terr. Phys., 25(6), 339–366.Buchau, J., B. W. Reinisch, E. J. Weber, and J. G. Moore (1983), Structure and dynamics of the winter polar cap F region, Radio Sci., 18(6),
995–1010, doi:10.1029/RS018i006p00995.Buchau, J., E. J. Weber, D. N. Anderson, H. C. Carlson Jr., J. G. Moore, B. W. Reinisch, and R. C. Livingston (1985), Ionospheric structures in the
polar cap: Their origin and relation to 250-MHz scintillation, Radio Sci., 20(3), 325–338, doi:10.1029/RS020i003p00325.Carlson, H. C., K. Oksavik, J. Moen, A. P. van Eyken, and P. Guio (2002), ESR mapping of polar-cap patches in the dark cusp, Geophys. Res. Lett.,
29(10), 1386, doi:10.1029/2001GL014087.Carlson, H. C., Jr., K. Oksavik, J. Moen, and T. Pedersen (2004), Ionospheric patch formation: Direct measurements of the origin of a polar cap
patch, Geophys. Res. Lett., 31, L08806, doi:10.1029/2003GL018166.Carlson, H. C., J. Moen, K. Oksavik, C. P. Nielsen, I. W. McCrea, T. R. Pedersen, and P. Gallop (2006), Direct observations of injection events of
subauroral plasma into the polar cap, Geophys. Res. Lett., 33, L05103, doi:10.1029/2005GL025230.Carlson, H. C., T. Pedersen, S. Basu, M. Keskinen, and J. Moen (2007), Case for a new process, not mechanism, for cusp irregularity production,
J. Geophys. Res., 112, A11304, doi:10.1029/2007JA012384.Carlson, H. C., K. Oksavik, and J. Moen (2008), On a new process for cusp irregularity production, Ann. Geophys., 26, 2871–2885.Chisham, G., M. Pinnock, and A. S. Rodger (2000), Poleward-moving HF radar flow bursts in the cusp: Transient changes in flow speed or
direction?, Geophys. Res. Lett., 27(7), 919–922, doi:10.1029/1999GL010760.Chisham, G., et al. (2007), A decade of the Super Dual Auroral Radar Network (SuperDARN): Scientific achievements, new techniques and
future directions, Surv. Geophys., 28(1), 33–109, doi:10.1007/s10712-007-9017-8.Coker, C., G. S. Bust, R. A. Doe, and T. L. Gaussiran II (2004), High-latitude plasma structure and scintillation, Radio Sci., 39, RS1S15, doi:10.1029/
2002RS002833.Cowley, S. W. H., and M. Lockwood (1992), Excitation and decay of solar wind-driven flows in the magnetosphere-ionosphere system, Ann.
Geophys., 10, 103–115.Crowley, G., A. J. Ridley, D. Deist, S. Wing, D. J. Knipp, B. A. Emery, J. Foster, R. Heelis, M. Hairston, and B. W. Reinisch (2000), Transformation
of high-latitude ionospheric F region patches into blobs during the March 21, 1990, storm, J. Geophys. Res., 105(A3), 5215–5230,doi:10.1029/1999JA900357.
Davies, J. A., T. K. Yeoman, I. J. Rae, S. E. Milan, M. Lester, M. Lockwood, and A. McWilliams (2002), Ground-based observations of the auroralzone and polar cap ionospheric responses to dayside transient reconnection, Ann. Geophys., 20, 781–794.
De Franceschi, G., L. Alfonsi, V. Romano, M. Aquino, A. Dodson, C. N. Mitchell, P. Spencer, and A. W. Wernik (2008), Dynamics of high-latitude patches and associated small-scale irregularities during the October and November 2003 storms, J. Atmos. Sol. Terr. Phys., 70,879–888.
Denig, W. F., W. J. Burke, N. C. Maynard, F. J. Rich, B. Jacobsen, P. E. Sandholt, A. Egeland, S. Leontjev, and V. G. Vorobjev (1993), Ionosphericsignatures of dayside magnetopause transients: A case study using satellite and ground measurements, J. Geophys. Res., 98(A4),5969–5980, doi:10.1029/92JA01541.
Feldstein, Y. I., and G. V. Starkov (1967), Dynamics of auroral belt and polar geomagnetic disturbances, Planet. Space Sci., 15, 209–229.Forte, B., and S. M. Radicella (2004), Geometrical control of scintillation indices: What happens for GPS satellites, Radio Sci., 39, RS5014,
doi:10.1029/2002RS002852.Fremouw, E. J., R. L. Leadabrand, R. C. Livingston, M. D. Cousins, C. L. Rino, B. C. Fair, and R. A. Long (1978), Early results from the DNA
wideband satellite experiment – Complex-signal scintillation, Radio Sci., 13(1), 167–187, doi:10.1029/RS013i001p00167.
AcknowledgmentsThe interplanetary magnetic field andsolar wind data were provided by theNASA OMNIWeb service (http://omni-web.gsfc.nasa.gov). The UiO ASI dataare available at http://tid.uio.no/plasma/aurora. The scintillation data may beobtained from Kjellmar Oksavik(e-mail: [email protected]). Thisproject has been supported by theResearch Council of Norway undercontracts 212014, 223252, and 230935.
Journal of Geophysical Research: Space Physics 10.1002/2015JA021528
OKSAVIK ET AL. SCINTILLATION FROM PMAFS 9172

Glassmeier, K.-H., and M. Stellmacher (1996), Mapping flux transfer events to the ionosphere, Adv. Space Res., 18(8), 151–160.Gondarenko, N. A., and P. N. Guzdar (2004), Plasma patch structuring by the nonlinear evolution of the gradient drift instability in the high-
latitude ionosphere, J. Geophys. Res., 109, A09301, doi:10.1029/2004JA010504.Greenwald, R. A., et al. (1995), DARN/SuperDARN: A global view of the dynamics of high-latitude convection, Space Sci. Rev., 71, 761–796.Haerendel, G., G. Paschmann, N. Sckopke, H. Rosenbauer, and P. C. Hedgecock (1978), The frontside boundary layer of the magnetosphere
and the problem of reconnection, J. Geophys. Res., 83(A7), 3195–3216, doi:10.1029/JA083iA07p03195.Hosokawa, K., K. Shiokawa, Y. Otsuka, T. Ogawa, J.-P. St-Maurice, G. J. Sofko, and D. A. Andre (2009), Relationship between polar cap patches
and field-aligned irregularities as observed with an all-sky airglow imager at Resolute Bay and the PolarDARN radar at Rankin Inlet,J. Geophys. Res., 114, A03306, doi:10.1029/2008JA013707.
Hosokawa, K., Y. Otsuka, Y. Ogawa, and T. Tsugawa (2014), Observations of GPS scintillation during an isolated auroral substorm, Prog. EarthPlanet. Sci., 1(1), 16, doi:10.1186/2197-4284-1-16.
Jin, Y., J. I. Moen, and W. J. Miloch (2014), GPS scintillation effects associated with polar cap patches and substorm auroral activity: Directcomparison, J. Space Weather Space Clim., 4, doi:10.1051/swsc/2014019.
Johnsen, M. G., D. A. Lorentzen, J. M. Holmes, and U. P. Løvhaug (2012), A model based method for obtaining the open/closed field lineboundary from the cusp auroral 6300 Å[OI] red line, J. Geophys. Res., 117, A03319, doi:10.1029/2011JA016980.
Kersley, L., C. D. Russell, and D. L. Rice (1995), Phase scintillation and irregularities in the northern polar ionosphere, Radio Sci., 30(3), 619–629,doi:10.1029/94RS03175.
Keskinen, M. J., and S. L. Ossakow (1983), Theories of high-latitude ionospheric irregularities: A review, Radio Sci., 18(6), 1077–1091,doi:10.1029/RS018i006p01077.
Keskinen, M. J., H. G. Mitchell, J. A. Fedder, P. Satyanarayana, S. T. Zalesak, and J. D. Huba (1988), Nonlinear evolution of the Kelvin-Helmholtzinstability in the high-latitude ionosphere, J. Geophys. Res., 93(A1), 137–152, doi:10.1029/JA093iA01p00137.
Kinrade, J., C. N. Mitchell, P. Yin, N. Smith, M. J. Jarvis, D. J. Maxfield, M. C. Rose, G. S. Bust, and A. T. Weatherwax (2012), Ionospheric scintil-lation over Antarctica during the storm of 5–6 April 2010, J. Geophys. Res., 117, A05304, doi:10.1029/2011JA017073.
Kinrade, J., C. N. Mitchell, N. D. Smith, Y. Ebihara, A. T. Weatherwax, and G. S. Bust (2013), GPS phase scintillation associated with optical auroralemissions: First statistical results from the geographic South Pole, J. Geophys. Res. Space Physics, 118, 2490–2502, doi:10.1002/jgra.50214.
Kintner, P. M., B. M. Ledvina, and E. R. de Paula (2007), GPS and ionospheric scintillations, Space Weather, 5, S09003, doi:10.1029/2006SW000260.
Li, G., B. Ning, Z. Ren, and L. Hu (2010), Statistics of GPS ionospheric scintillation and irregularities over polar regions at solar minimum, GPSSolutions, 14, 331–341, doi:10.1007/s10291-009-0156-x.
Lockwood, M., and H. C. Carlson Jr. (1992), Production of polar cap electron density patches by transient magnetopause reconnection,Geophys. Res. Lett., 19, 1731–1734, doi:10.1029/92GL01993.
Lockwood, M., H. C. Carlson Jr., and P. E. Sandholt (1993), Implications of the altitude of transient 630-nm dayside auroral emissions,J. Geophys. Res., 98(A9), 15,571–15,587, doi:10.1029/93JA00811.
Lockwood, M., S. W. H. Cowley, M. F. Smith, R. P. Rijnbeek, and R. C. Elphic (1995), The contribution of flux transfer events to convection,Geophys. Res. Lett., 22(10), 1185–1188, doi:10.1029/95GL01008.
Lockwood, M., J. Moen, A. P. van Eyken, J. A. Davies, K. Oksavik, and I. W. McCrea (2005a), Motion of the dayside polar cap boundary duringsubstorm cycles: I. Observations of pulses in the magnetopause reconnection rate, Ann. Geophys., 23, 3495–3511.
Lockwood, M., J. A. Davies, J. Moen, A. P. van Eyken, K. Oksavik, I. W. McCrea, andM. Lester (2005b), Motion of the dayside polar cap boundaryduring substorm cycles: II. Generation of poleward-moving events and polar cap patches by pulses in the magnetopause reconnectionrate, Ann. Geophys., 23, 3513–3532.
Lorentzen, D. A., N. Shumilov, and J. Moen (2004), Drifting airglow patches in relation to tail reconnection, Geophys. Res. Lett., 31, L02806,doi:10.1029/2003GL017785.
Lorentzen, D. A., J. Moen, K. Oksavik, F. Sigernes, Y. Saito, and M. G. Johnsen (2010), In situ measurement of a newly created polar cap patch,J. Geophys. Res., 115, A12323, doi:10.1029/2010JA015710.
McWilliams, K. A., T. K. Yeoman, and G. Provan (2000), A statistical survey of dayside pulsed ionospheric flows as seen by the CUTLASS FinlandHF radar, Ann. Geophys., 18, 445–453.
Milan, S. E., M. Lester, S. W. H. Cowley, J. Moen, P. E. Sandholt, and C. J. Owen (1999), Meridian-scanning photometer, coherent HF radar, andmagnetometer observations of the cusp: A case study, Ann. Geophys., 17, 159–172.
Milan, S. E., M. Lester, S. W. H. Cowley, and M. Brittnacher (2000), Convection and auroral response to a southward turning of the IMF: PolarUVI, CUTLASS, and IMAGE signatures of transient magnetic flux transfer at the magnetopause, J. Geophys. Res., 105(A7), 15,741–15,755,doi:10.1029/2000JA900022.
Milan, S. E., M. Lester, and T. K. Yeoman (2002), HF radar polar patch formation revisited: Summer and winter variations in dayside plasmastructuring, Ann. Geophys., 20, 487–499, doi:10.5194/angeo-20-487-2002.
Milan, S. E., S. Basu, T. K. Yeoman, and R. E. Sheehan (2005), A comparison of satellite scintillation measurements with HF radar backscattercharacteristics, Ann. Geophys., 23, 3451–3455, doi:10.5194/angeo-23-3451-2005.
Mitchell, C. N., L. Alfonsi, G. De Franceschi, M. Lester, V. Romano, and A. W. Wernik (2005), GPS TEC and scintillation measurements from thepolar ionosphere during the October 2003 storm, Geophys. Res. Lett., 32, L12S03, doi:10.1029/2004GL021644.
Moen, J., H. C. Carlson, and P. E. Sandholt (1999), Continuous observations of cusp auroral dynamics in response to an IMF BY polarity change,Geophys. Res. Lett., 26, 1243–1246, doi:10.1029/1999GL900224.
Moen, J., H. C. Carlson, S. E. Milan, N. Shumilov, B. Lybekk, P. E. Sandholt, and M. Lester (2001), On the collocation between dayside auroralactivity and coherent HF radar backscatter, Ann. Geophys., 18, 1531–1549.
Moen, J., Y. Rinne, H. C. Carlson, K. Oksavik, R. Fujii, and H. Opgenoorth (2008), On the relationship between thin Birkeland current arcs andreversed flow channels in the winter cusp/cleft ionosphere, J. Geophys. Res., 113, A09220, doi:10.1029/2008JA013061.
Moen, J., K. Oksavik, T. Abe, M. Lester, Y. Saito, T. A. Bekkeng, and K. S. Jacobsen (2012), First in-situ measurements of HF radar echoingtargets, Geophys. Res. Lett., 39, L07104, doi:10.1029/2012GL051407.
Moen, J., K. Oksavik, L. Alfonsi, Y. Daabakk, V. Romano, and L. Spogli (2013), Space weather challenges of the polar cap ionosphere, J. SpaceWeather Space Clim., 3, doi:10.1051/swsc/2013025.
Mushini, S. C., P. T. Jayachandran, R. B. Langley, J. W. MacDougall, and D. Pokhotelov (2012), Improved amplitude- and phase-scintillationindices derived from wavelet detrended high-latitude GPS data, GPS Solutions, 16(3), 363–373, doi:10.1007/s10291-011-0238-4.
Neudegg, D. A., T. K. Yeoman, S. W. H. Cowley, G. Provan, G. Haerendel, W. Baumjohann, U. Auster, K.-H. Fornacon, E. Georgescu, andC. J. Owen (1999), A flux transfer event observed at the magnetopause by the Equator-S spacecraft and in the ionosphere by the CUTLASSHF radar, Ann. Geophys., 17, 707–711.
Journal of Geophysical Research: Space Physics 10.1002/2015JA021528
OKSAVIK ET AL. SCINTILLATION FROM PMAFS 9173

Neudegg, D. A., et al. (2000), A survey of magnetopause FTEs and associated flow bursts in the polar ionosphere, Ann. Geophys., 18, 416–435.Nishimura, Y., et al. (2014), Day-night coupling by a localized flow channel visualized by polar cap patch propagation, Geophys. Res. Lett., 41,
3701–3709, doi:10.1002/2014GL060301.Oksavik, K., F. Søraas, J. Moen, and W. J. Burke (2000), Optical and particle signatures of magnetospheric boundary layers near magnetic
noon: Satellite and ground-based observations, J. Geophys. Res., 105(A12), 27,555–27,568, doi:10.1029/1999JA000237.Oksavik, K., J. Moen, and H. C. Carlson (2004), High-resolution observations of the small-scale flow pattern associated with a poleward
moving auroral form in the cusp, Geophys. Res. Lett., 31, L11807, doi:10.1029/2004GL019838.Oksavik, K., J. Moen, H. C. Carlson, R. A. Greenwald, S. E. Milan, M. Lester, W. F. Denig, and R. J. Barnes (2005), Multi-instrument mapping of the
small-scale flow dynamics related to a cusp auroral transient, Ann. Geophys., 23, 2657–2670.Oksavik, K., V. L. Barth, J. Moen, and M. Lester (2010), On the entry and transit of high-density plasma across the polar cap, J. Geophys. Res.,
115, A12308, doi:10.1029/2010JA015817.Oksavik, K., J. I. Moen, E. H. Rekaa, H. C. Carlson, and M. Lester (2011), Reversed flow events in the cusp ionosphere detected by SuperDARN
HF radars, J. Geophys. Res., 116, A12303, doi:10.1029/2011JA016788.Oksavik, K., J. Moen, M. Lester, T. A. Bekkeng, and J. K. Bekkeng (2012), In situ measurements of plasma irregularity growth in the cusp
ionosphere, J. Geophys. Res., 117, A11301, doi:10.1029/2012JA017835.Ossakow, S. L., and P. K. Chaturvedi (1979), Current convective instability in the diffuse aurora, Geophys. Res. Lett., 6(4), 332–334, doi:10.1029/
GL006i004p00332.Pinnock, M., A. S. Rodger, J. R. Dudeney, K. B. Baker, P. T. Newell, R. A. Greenwald, and M. E. Greenspan (1993), Observations of an enhanced
convection channel in the cusp ionosphere, J. Geophys. Res., 98(A3), 3767–3776, doi:10.1029/92JA01382.Pinnock, M., A. S. Rodger, J. R. Dudeney, F. Rich, and K. B. Baker (1995), High spatial and temporal resolution observations of the ionospheric
cusp, Ann. Geophys., 13, 919–925.Prikryl, P., P. T. Jayachandran, S. C.Mushini, D. Pokhotelov, J.W.MacDougall, E. Donovan, E. Spanswick, and J.-P. St.-Maurice (2010), GPS TEC,
scintillationandcycleslipsobservedathighlatitudesduringsolarminimum,Ann.Geophys.,28,1307–1316,doi:10.5194/angeo-28-1307-2010.Prikryl, P., P. T. Jayachandran, S. C. Mushini, and R. Chadwick (2011), Climatology of GPS phase scintillation and HF radar backscatter for the
high-latitude ionosphere under solar minimum conditions, Ann. Geophys., 29, 377–392, doi:10.5194/angeo-29-377-2011.Prikryl, P., P. T. Jayachandran, S. C. Mushini, and I. G. Richardson (2014), High-latitude GPS phase scintillation and cycle slips during high-
speed solar wind streams and interplanetary coronal mass ejections: A superposed epoch analysis, Earth Planets Space, 66, 62,doi:10.1186/1880-5981-66-62.
Prikryl, P., P. T. Jayachandran, R. Chadwick, and T. D. Kelly (2015), Climatology of GPS phase scintillation at northern high latitudes for theperiod from 2008 to 2013, Ann. Geophys., 33, 531–545, doi:10.5194/angeo-33-531-2015.
Provan, G., and T. K. Yeoman (1999), Statistical observations of the MLT, latitude and size of pulsed ionospheric flows with the CUTLASSFinland radar, Ann. Geophys., 17, 855–867.
Provan, G., T. K. Yeoman, and S. E. Milan (1998), CUTLASS Finland radar observations of the ionospheric signatures of flux transfer events andthe resulting plasma flows, Ann. Geophys., 16, 1411–1422.
Provan, G., S. E. Milan, M. Lester, T. K. Yeoman, and H. Khan (2002), Simultaneous observations of the ionospheric footprint of flux transferevents and dispersed ion signatures, Ann. Geophys., 20, 281–287.
Rae, I. J., F. R. Fenrich, M. Lester, K. A. McWilliams, and J. D. Scudder (2004), Solar wind modulation of cusp particle signatures and theirassociated ionospheric flows, J. Geophys. Res., 109, A03223, doi:10.1029/2003JA010188.
Rinne, Y., J. Moen, K. Oksavik, and H. C. Carlson (2007), Reversed flow events in the winter cusp ionosphere observed by the EuropeanIncoherent Scatter (EISCAT) Svalbard radar, J. Geophys. Res., 112, A10313, doi:10.1029/2007JA012366.
Rinne, Y., J. Moen, H. C. Carlson, and M. R. Hairston (2010), Stratification of east–west plasma flow channels observed in the ionospheric cuspin response to IMF BY polarity changes, Geophys. Res. Lett., 37, L13102, doi:10.1029/2010GL043307.
Rino, C. L. (1979), A power law phase screen model for ionospheric scintillation: 1. Weak scatter, Radio Sci., 14(6), 1135–1145, doi:10.1029/RS014i006p01135.
Rodger, A. S., S. B. Mende, T. J. Rosenberg, and K. B. Baker (1995), Simultaneous optical and HF radar observations of the ionospheric cusp,Geophys. Res. Lett., 22(15), 2045–2048, doi:10.1029/95GL01797.
Russell, C. T., and R. C. Elphic (1978), Initial ISEE magnetometer results: Magnetopause observations, Space Sci. Rev., 22, 681–715.Russell, C. T., and R. C. Elphic (1979), ISEE observations of flux transfer events at the dayside magnetopause, Geophys. Res. Lett., 6(1), 33–36,
doi:10.1029/GL006i001p00033.Sandholt, P. E., C. S. Deehr, A. Egeland, B. Lybekk, R. Viereck, and G. J. Romick (1986), Signatures in the dayside aurora of plasma transfer from
the magnetosheath, J. Geophys. Res., 91(A9), 10,063–10,079, doi:10.1029/JA091iA09p10063.Sandholt, P. E., M. Lockwood, T. Oguti, S. W. H. Cowley, K. S. C. Freeman, B. Lybekk, A. Egeland, and D. M. Willis (1990), Midday auroral breakup
events and related energy and momentum transfer from the magnetosheath, J. Geophys. Res., 95(A2), 1039–1060, doi:10.1029/JA095iA02p01039.
Sandholt, P. E., J. Moen, D. Opsvik, W. F. Denig, and W. J. Burke (1993), Auroral event sequence at the dayside polar cap boundary: Signatureof time-varying solar wind-magnetosphere-ionosphere coupling, Adv. Space Res., 13(4), 7–15.
Sandholt, P. E., C. J. Farrugia, J. Moen, Ø. Noraberg, B. Lybekk, T. Sten, and T. Hansen (1998), A classification of dayside auroral forms andactivities as a function of interplanetary magnetic field orientation, J. Geophys. Res., 103(A10), 23,325–23,345, doi:10.1029/98JA02156.
Sandholt, P. E., C. J. Farrugia, and W. F. Denig (2004), Dayside aurora and the role of IMF |By|/|Bz|: Detailed morphology and response tomagnetopause reconnection, Ann. Geophys., 22, 613–628.
Saunders, M. A., C. T. Russell, and N. Sckopke (1984), Flux transfer events: Scale size and interior structure, Geophys. Res. Lett., 11(2), 131–134,doi:10.1029/GL011i002p00131.
Smith, A. M., C. N. Mitchell, R. J. Watson, R. W. Meggs, P. M. Kintner, K. Kauristie, and F. Honary (2008), GPS scintillation in the high arcticassociated with an auroral arc, Space Weather, 6, S03D01, doi:10.1029/2007SW000349.
Southwood, D. J. (1985), Theoretical aspects of ionosphere-magnetosphere-solar wind coupling, Adv. Space Res., 5(4), 7–14.Southwood, D. J. (1987), The ionospheric signature of flux transfer events, J. Geophys. Res., 92(A4), 3207–3213, doi:10.1029/JA092iA04p03207.Spogli, L., L. Alfonsi, G. De Franceschi, V. Romano, M. H. O. Aquino, and A. Dodson (2009), Climatology of GPS ionospheric scintillations over
high and mid-latitude European regions, Ann. Geophys., 27, 3429–3437, doi:10.5194/angeo-27-3429-2009.Thorolfsson, A., J.-C. Cerisier, M. Lockwood, P. E. Sandholt, C. Senior, and M. Lester (2000), Simultaneous optical and radar signatures of
poleward-moving auroral forms, Ann. Geophys., 18, 1054–1066.Tiwari, S., A. Jain, S. Sarkar, S. Jain, and A. K. Gwal (2012), Ionospheric irregularities at Antarctic using GPS measurements, J. Earth Syst. Sci.,
121(2), 345–353, doi:10.1007/s12040-012-0168-8.
Journal of Geophysical Research: Space Physics 10.1002/2015JA021528
OKSAVIK ET AL. SCINTILLATION FROM PMAFS 9174

Torrence, C., and G. P. Compo (1998), A practical guide to wavelet analysis, Bull. Am. Meteorol. Soc., 79, 61–78, doi:10.1175/1520-0477(1998)079<0061:APGTWA>2.0.CO;2.
Tsunoda, R. T. (1988), High-latitude F region irregularities: A review and synthesis, Rev. Geophys., 26(4), 719–760, doi:10.1029/RG026i004p00719.
van der Meeren, C., K. Oksavik, D. Lorentzen, J. I. Moen, and V. Romano (2014), GPS scintillation and irregularities at the front of an ionizationtongue in the nightside polar ionosphere, J. Geophys. Res. Space Physics, 119, 8624–8636, doi:10.1002/2014JA020114.
van Dierendonck, A. J., J. Klobuchar, and Q. Hua (1993), Ionospheric scintillation monitoring using commercial single frequency C/A codereceivers Proceedings of the 6th International Technical Meeting of the Satellite Division of The Institute of Navigation (ION GPS 1993),Salt Lake City, Utah, September 1993, pp. 1333–1342.
van Dierendonck, A. J., Q. Hua, P. Fenton, and J. Klobuchar (1996), Commercial ionospheric scintillation monitoring receiver developmentand test results in 52nd Annual Meeting Proceedings: Navigational Technology for the Third Millennium, Inst. of Navig., Fairfax, Va.,pp. 573–582.
Vorobjev, V. G., G. Gustafsson, G. V. Starkov, Y. I. Feldstein, and N. F. Shevnina (1975), Dynamics of day and night aurora during substorms,Planet. Space Sci., 23, 269–278.
Weber, E. J., J. Buchau, J. G. Moore, J. R. Sharber, R. C. Livingston, J. D. Winningham, and B. W. Reinisch (1984), F layer ionization patches in thepolar cap, J. Geophys. Res., 89(A3), 1683–1694, doi:10.1029/JA089iA03p01683.
Wild, J. A., et al. (2001), First simultaneous observations of flux transfer events at the high-latitude magnetopause by the Cluster spacecraftand pulsed radar signatures in the conjugate ionosphere by the CUTLASS and EISCAT radars, Ann. Geophys., 19, 1491–1508.
Yeoman, T. K., M. Lester, S. W. H. Cowley, S. E. Milan, J. Moen, and P. E. Sandholt (1997), Simultaneous observations of the cusp in optical,DMSP and HF radar data, Geophys. Res. Lett., 24(17), 2251–2254, doi:10.1029/97GL02072.
Zhang, Q.-H., M. Lockwood, J. C. Foster, S.-R. Zhang, B.-C. Zhang, I. W. McCrea, J. Moen, M. Lester, and J. M. Ruohoniemi (2015), Directobservations of the full Dungey convection cycle in the polar ionosphere for southward interplanetary magnetic field conditions,J. Geophys. Res. Space Physics, 120, 4519–4530, doi:10.1002/2015JA021172.
Erratum
In the originally published version of this article, the first equation in section 2, “Instrumentation,” containedan error. The error has since been corrected, and this version may be considered the authoritative versionof record.
Journal of Geophysical Research: Space Physics 10.1002/2015JA021528
OKSAVIK ET AL. SCINTILLATION FROM PMAFS 9175