science on seneca - hws homepage · 5 seneca lake -our focus like all of the finger lakes, seneca...
TRANSCRIPT

SCIENCE ON SENECA
Instructor's Manual for Science Education on Seneca Lake

2
12th Ed., 2008, 2011, 2016 B. Halfman, J. Halfman, C. De Denus, T. Curtin, S. Myers
HOBART AND WILLIAM SMITH COLLEGES
GENEVA, NEW YORK 14456
Copyright 1986, Woodrow, Ahrnsbrak and Carle All rights reserved

3
CONTENTS
Preface 4 Seneca Lake – Our Focus 5 Map of Seneca Lake Watershed 7 Welcome Aboard 8 Positioning 9 Radar GPS Water Depth 10 Physics in Lakes 11 Turbidity / Transparency / Visibility Temperature Conductivity-Temperature-Depth Profiler 13 Lake Water Chemistry 14 pH Dissolved Oxygen Chloride Water Sample Collection Plankton 19 Plankton Inventory Lake Sediments 21 Sediment Sampling Particle Size Analysis References and Suggested Readings 27 Research in the Finger Lakes 29 List of Suppliers 32
4
PREFACE
This manual is meant to assist teachers as they work with their students onboard the William Scandling research vessel during a Science on Seneca educational field trip. Our goals are to provide students with an interesting experience in the collection, analysis and sharing of scientific data and to amass baseline data on Seneca Lake's major features. The Science on Seneca field trip experience provides students an opportunity to conduct field-based data collection using state-of-the art equipment. After the experience on-board, students tour the Geosciences Department to gain a greater appreciation for field research that scientists and college students conduct at Hobart and William Smith Colleges. This program is coordinated by the Geosciences Department in cooperation with the Finger Lakes Institute (FLI), located on the Hobart and William Smith Colleges’ campus. FLI’s mission is to provide educational resources about the Finger Lakes. Students that partake in the SOS field trips will be collecting samples from the lake environment and analyzing these samples using a number of techniques. Data that is collected is recorded on data collection sheets that are sent back to the staff at Hobart and William Smith Colleges to be entered into our database. We have collected over 20 years of data from the SOS field trips. These data are the basis of some of the lessons that are now on-line the SOS website at http://fli.hws.edu/sos/. Teachers may use these lessons along with the other background information found on the website as pre- or post visit instruction on how data that is collected during the field trip can be graphed and analyzed to understand and explain environmental phenomena. All lessons are correlated with the NYS Math, Science, and Technology standards. While conducting their investigations students will be collecting samples and analyzing them for some of the following parameters:
Physics Water Clarity
Water Temperature Profile
Chemistry pH
Chloride Ion Concentration Dissolved Oxygen
Biology
Biological Diversity
Geology Sediment Character

5
SENECA LAKE - OUR FOCUS Like all of the Finger Lakes, Seneca is in a valley carved by Pleistocene glaciers. The last geological activity that is responsible for the formation of the lakes had occurred by 12,500 years ago. Since then the region has remained about as we see it today. The Seneca Lake Basin, like the Cayuga Lake Basin east of it, is a major valley which penetrates far south into the Appalachian Plateau. It is developed in Devonian sandstones and shales which have been slightly folded and broken by faults in a few places. A few hundred meters below the Devonian rocks are Silurian carbonates, shales, and most important, evaporites. The evaporites are mainly halite (rock salt). Erosion by the glaciers cut into a significant portion of the Devonian strata and it may have penetrated as deep as the evaporites, especially in Seneca Lake. Products of this erosion are found in the Valley Heads Moraine south of the lake and in the thick valley-fill further south under Horseheads and Elmira. The rock surface under the lake is deeply buried. Geophysical studies on the lake and the results of drilling at Watkins Glen and Geneva show that a thick mass of glacial deposits sits on and fills the rock valley which forms Seneca Lake. Each basin contains as much as 150-200 meters (500-650 feet) of glacial-lake sediments. This entire mass was in place by 12,000 years ago. Since then, the lake basin has been tilted south slightly exposing lake sediments near Geneva. At the same time, deltas were built at several locations along the shore and a massive fill of stream deposits was poured in to form both the alluvial fans on which the villages of Watkins Glen and Montour Falls are built and the swamp between them. Since then, the open lake has received a "quiet rain" of clay and silt and an occasional pulse of coarser sediments from storm-related processes. Up to 10 meters (30 feet) of postglacial sediments have accumulated in Seneca Lake.
Physical Characteristics of Seneca Lake Metric Standard Length 56.6 km 34.5 miles Length of Shoreline 121.3 km 75.4 miles Greatest Width 5.2 km 3.7 miles Greatest Depth 192 m ~ 630 ft. Volume 15.539 km3 4,200 billion gallons Lake Surface Area 172.5 km2 66.6 sq. miles Drainage Basin 1850 km2 714 sq miles Retention Time of Water: 20 years – assuming source at Watkins Glen, NY (the amount of time it takes for the water to cycle through and out of the lake) The various characteristics of Seneca Lake have always attracted people's attention. Native Americans lived near the lakes, fished them, used them as transportation routes and had a great respect for them. European immigrants settled on or nearby the lakes and took advantage of the natural resources and agricultural lands. Today, the natural beauty of the Finger Lakes region attracts approximately 22 million tourists annually. The elevation and large volume of water held in Seneca Lake makes its shoreline a prime location for vineyards. The lake’s water is an important resource for the nearby towns and municipalities. It is the

6
primary drinking water supply for nearly 100,000 people (more in the summer) and there are six waste water treatment plants that output their effluents to the lake system. All of the Finger Lakes are subjected to a variety of environmental threats including non-point source agricultural pollutants, shoreline development, increasing recreational use, and the introduction of exotic species like the spiny water flea, zebra and quagga mussel and Eurasian watermilfoil. The following map shows the break-down of land-uses in the Seneca Lake watershed. Expanding agricultural activities such as vineyards and animal farming along with development pressures around the lakeshore can potentially impact the lake’s water quality. By continuing the monitoring of the physical, biological and chemical characteristics of the lake we are able to spot trends of change.

7
Landuse in the Seneca Lake Watershed
8
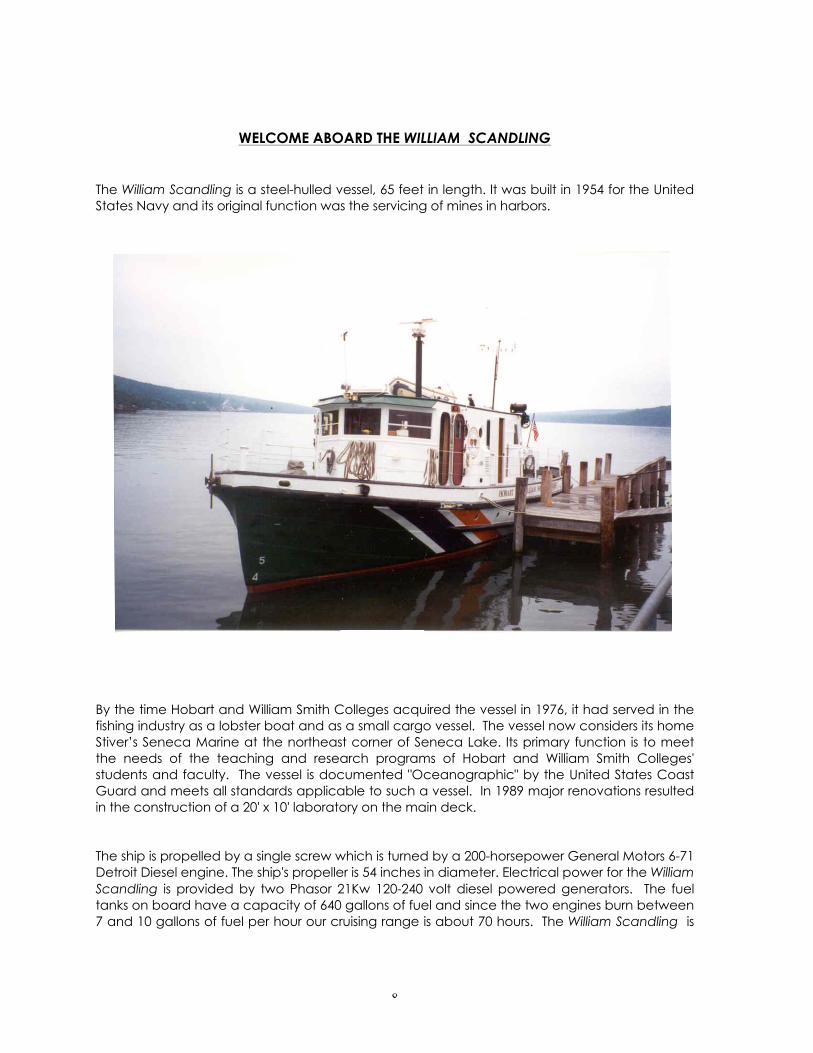
WELCOME ABOARD THE WILLIAM SCANDLING
The William Scandling is a steel-hulled vessel, 65 feet in length. It was built in 1954 for the United States Navy and its original function was the servicing of mines in harbors.
By the time Hobart and William Smith Colleges acquired the vessel in 1976, it had served in the fishing industry as a lobster boat and as a small cargo vessel. The vessel now considers its home Stiver’s Seneca Marine at the northeast corner of Seneca Lake. Its primary function is to meet the needs of the teaching and research programs of Hobart and William Smith Colleges' students and faculty. The vessel is documented "Oceanographic" by the United States Coast Guard and meets all standards applicable to such a vessel. In 1989 major renovations resulted in the construction of a 20' x 10' laboratory on the main deck. The ship is propelled by a single screw which is turned by a 200-horsepower General Motors 6-71 Detroit Diesel engine. The ship's propeller is 54 inches in diameter. Electrical power for the William Scandling is provided by two Phasor 21Kw 120-240 volt diesel powered generators. The fuel tanks on board have a capacity of 640 gallons of fuel and since the two engines burn between 7 and 10 gallons of fuel per hour our cruising range is about 70 hours. The William Scandling is

9
capable of cruising at about 10 knots (1 knot = 1 nautical mile per hour, 1 nautical mile = 1 degree of latitude = 1.15 statute miles). For navigation, the William Scandling is equipped with a radar and a Global Position Satellite Navigation System. For communications while underway, there is a marine radio-telephone for communication with the Coast Guard and other vessels when on the Great Lakes, and a cellular phone. The vessel is equipped with two 12-person rigid life rafts and a service dinghy. The captain of the William Scandling is Mr. Dave Brown and the crewman is Mr. Ross Abbett. They are at your service while aboard the vessel and will be happy to try to answer any questions you might have about Seneca Lake, the ship, or any of its operations. However, since their primary responsibility is the well-being of the ship and its passengers, should either of them ask you to do something, or to refrain from doing something, we expect you to comply with that request. When boarding the research vessel, come aboard onto the after deck. Proceed forward to the laboratory (attached to the pilothouse, which also doubles as the ship's office) and sign the ship's guest log. Additionally, all persons not formally affiliated with the Colleges must sign a waiver of liability form (in the case of high school students and younger this waiver must also be signed by a parent or guardian) before the ship can leave the dock. Groups should make copies of the form prior to arrival at the ship and bring the completed, signed forms with them. A blank waiver will be included in your training packet. Once aboard and "signed in", visitors should assemble on the aft deck of the ship where the Captain will welcome you aboard, discuss safety procedures, demonstrate putting on a life vest, give any other directions appropriate to the day's activities and answer any questions you may have. While aboard the William Scandling, visitors may, with a few exceptions, go wherever they like. No visitors are allowed in the engine room below deck. People who are interested in engines may, if time permits, be taken into the engine room at the end of the cruise, after all the engines have been shut down. No one is allowed on the "roof" of either the laboratory or the pilothouse. Although visitors and guests are welcome in the pilot house, we ask that there be no more than 2 visitors in the pilot house at any one time as the Captain must be able to see and move about. Visitors may not stand on the forward deck in front of the pilothouse when the vessel is entering or leaving port. Once out on the lake, feel free to use the forward deck.
POSITIONING
When collecting data in the field, even your most interesting information loses much of its value if you don't know exactly where the data is gathered. You will be shown the ship’s radar or GPS unit for determining position. Radar (RAdio Detecting And Ranging) is an electronic piloting and positioning device. The unit sends out pulses of radio waves that are reflected by objects at a distance. The time that it takes for the pulse to go out and the echo to return is proportional to the distance to the reflecting object. This information is displayed on the radar screen where reflections show up as points or patches of light, depending on the size of the echo-producing object. The Global Position Satellite Navigation System (GPS) computes the ship's position based on signals from an array of orbiting satellites. Three satellites must be "visible" to the GPS at any particular time. The GPS then computes the latitude and longitude to within about 100 feet

10
accuracy. Any adjustment or tuning of both the radar and the GPS unit aboard the William Scandling will only be done by the captain or mate. We ask that visitors not touch any of the controls.
WATER DEPTH
Finding the depth of water below a vessel is done with an acoustic depth sounder which can both determine and record continually the depth below its hull. The result is something like a profile view of the sea- or lake-bottom. An example of a depth record made in Seneca Lake by a modern acoustic depth sounder can be seen on the next page. Its profile-like nature is obvious. Depth-sounders work by sending a sound pulse at an inaudible frequency (typically 100 to 500 kHz) from a source mounted in the hull. The source serves both as a sender of energy and a receiver and thus its name: 'transducer'. When the pulse of energy is emitted, the time of emission is noted. The energy wave moves rapidly toward the lake bottom, reflects from it with some attenuation and returns toward the source in the ship's hull. Its arrival at the source triggers a notation of its time of arrival. The greater the water depth, the greater the travel time and the greater the time interval between energy emission and energy reception at the transducer. The electronic recorder integrated into the depth sounder on board crates a record of the water depth and sediment profile. Of course, the method is not without problems. The pulse from the acoustic source, and the electronic recorder all must be synchronized, so sophisticated circuitry and drive motors are required. The device must be calibrated for the speed of sound in the particular body of water being studied. The speed of sound in fresh water is about 1500 meters/second but it varies in fresh water lakes with changes in water density. Since water density is often a function of temperature, the speed of sound in water is mainly controlled by the water temperature. There are two depth finders on fixed mounts aboard the William Scandling. A Raytheon DS 600X is to the right of the ship's wheel and it serves as the pilot's guide to water depth. Another depth-finder, a Garmin FishFinder 400C is located on the stern deck so the crane operator can manage water depth when equipment is being put in and pulled out of the lake. The William Scandling also has a Ross Recording Depth Finder that is used mostly for determining the type of lake bottom when using the dredge sampler. Fish can also show up on the Ross record as isolated blips between the surface and bottom records. The record of the bottom on the Ross Recorder chart is unmistakable. It is the first continuous line below the top of the chart. Many of the records will have one line at the top of the chart marking the onset of the acoustic pulse and all will have a line somewhere down the chart marking the lake bottom. If you see the top line but you do not see one below it, then the recording scale is set at too shallow a range. You can see from the record on the following figure that the bottom lines differ in character. Some are broad and diffuse while others are narrow and quite dense. The character of the bottom record varies with the type of material on the bottom. Rock, gravel and sand give a narrow, dark record while muds give a broad, diffuse record. A crude guide to the character of the bottom material is provided by the record.

11
Multiples - Some records present not just one bottom line but one or more below it. These lower lines are referred to as multiples of the original and they usually develop when the vessel passes over a hard bottom (rock, for example) in shallow water. The multiples are formed when the acoustic wave leaves the transducer, reflects from the bottom with little attenuation, returns to the hull, is recorded, and reflects from the hull or water’s surface back to the bottom and so on for as long as there is energy left in the wave or there is room on the paper to note its passing. The first multiple below the bottom line is recorded at twice the depth of the bottom, the second multiple at three times the depth, etc.
PHYSICS IN LAKES (Physical Limnology)
TURBIDITY / TRANSPARENCY / VISIBILITY One of the physical properties of a body of water which is of interest in both physical and biological considerations is the degree to which sunlight can pass through the water, or how far one can see through the water. Nearly all of the energy which warms a lake comes from the sun and enters the lake at the top. The transparency of the lake governs the depth to which that sunlight will penetrate. If the transparency is low (i.e., the turbidity is high), most of the energy will be absorbed near the surface. On the other hand, if the transparency is high, the surface water will not be warmed as much and more of the energy will reach and warm the deeper water. From a biological point of view, the transparency governs the depth to which photosynthesis can take place. Simply put, no sunlight, no chlorophyll, no photosynthesis - - and no oxygen generation. The growth of photosynthetic green plants usually does not occur where less than about 1% of surface light penetrates. The portion of the lake beyond which insufficient light penetrates for photosynthetic process to occur is called the "aphotic zone".
Hard Bottom (sand�)
Soft Bottom (mud)�
Multiple �

12
The simplest device for measuring the turbidity of the water in a lake or ocean is the Secchi Disk. A limnological secchi disk is a disk with opposite black and white quadrants. The disk is lowered into the water until it can no longer be seen. The disk is then lowered a few more meters and then raised until it reappears. The average of the depth at which the disk disappeared and at which it reappeared is taken as the Secchi Disk visibility depth. The Secchi Disk visibility is useful as a means of comparing the visibility of different waters, but since the clearness of the day, position of the sun, roughness of the water, and the particular observer all influence the reading, these observations should be recorded along with the visibility depth data. It is important that a "standard" set of operating conditions for making the observation be established. For consistency's sake, observations should always be taken without sunglasses, on the lee (downwind) side of the boat with the sun to the observer's back, preferably sometime between 9:00 AM and 3:00 PM. WATER TEMPERATURE IN LAKES The temperature of the water in lakes is of interest to chemical, biological and physical limnologists. It is of interest to chemists because it governs the rate at which some reactions take place and also because it governs the solubility of some of the materials dissolved in the water. Of particular interest are the amounts of oxygen and carbon dioxide, both of which have a solubility which is inversely proportional to the temperature. Biologists are interested in the temperature of the water in lakes because it regulates, among other things, not only growth rates of many plants and animals, but what species may be found in any given body of water. In Seneca Lake, temperature also impacts the seasonal variations of plankton colonies found in the lake - spring plankton populations differ significantly in composition and density from summer and fall plankton populations. Physical limnologists are interested in the water temperature in lakes because temperature is both an indicator and a governor of circulation patterns in lakes. Water temperature is also of interest in understanding the exchange of energy between the lake and its immediate terrestrial and atmospheric environment. Vineyards flourish on the shores of the Finger Lakes in part because the lakes keep the surrounding air and land cool in spring and warm in autumn. Because of the fact that water has its maximum density at 4º C and water of any other temperature has a lower density, deep lakes in temperate latitudes, such as Seneca Lake, are stratified through much of the year, i.e. they can be considered to be a two or three layer system. If there is water in the lake which has a temperature of 4º C and also water of any other temperature, the 4º C water will lie beneath the

13
other water. A typical summer temperature profile for Seneca Lake (shown on previous page) was measured by the William Scandling at the northern end of the lake in August 2014. In this temperature profile, one can see that the topmost 10 or so meters are relatively constant in temperature, much warmer than the water beneath. This topmost, warm, uniform layer is known as the epilimnion and the water within it is usually well mixed by wind-driven waves and currents. Below the epilimnion, from about 10 meters to about 40 meters, the temperature drops dramatically. This whole zone of rapid temperature decrease, down to the depth at which the temperature is 6º to 8º C, is known as the metalimnion, and is an effective barrier to mixing between the water of the epilimnion and the waters below. Within the metalimnion, the depth at which the temperature decrease (in the vertical direction) is greatest is specifically called the thermocline. The cold, deep water of the lake below the metalimnion, having temperatures between 4º and 6º C, is known as the hypolimnion. During the period in which the lake is stratified, water of the hypolimnion is essentially sealed off from the atmosphere. Knowledge of the depth at which one finds the thermocline is fundamental to the understanding of water movement patterns in lakes. The thermocline is not a static feature in a body of water as large as Seneca Lake, rather it is an undulating surface, migrating upward and downward in response to wind, currents, and the action of what are known as internal waves, or seiches. In Seneca Lake, the thermocline migrates up and down, sometimes being found as near the surface as 20 meters, sometimes down as deep as 50 meters. The thermocline is often tilted, with the higher, shallower end at the northern end of the lake and the lower, deeper end at the southern end of the lake.
CONDUCTIVITY/TEMPERATURE/DEPTH PROFILER (CTD)
The "CTD" is a major limnological and oceanographic tool. It measures temperature and salinity (calculated from conductivity) from the surface to the bottom of the lake or ocean. Hobart and William Smith Colleges has two. These instruments will be handled only by the Captain and crew. Both of our CTD's are nearly identical except the larger one can also measure, pH, dissolved oxygen, and turbidity (estimated from light attenuation via transmissometer), can withstand larger pressures at greater depths (up to 700 m), but has less internal memory. The smaller instrument will be used to get a temperature and conductivity profile for the Science on Seneca groups. The ease with which water conducts electricity is directly related to the quantity of materials dissolved in the water. While pure water is a very poor conductor of electricity, as more salts are dissolved into it, the water becomes a better conductor. No exact relationship between total dissolved salts and conductivity exists, however, because the relative amounts of the various materials dissolved in the water vary. One can certainly say that the more dissolved solids, the higher the conductivity. However, conductivity cells are also influenced by temperature. The fundamental unit of electricity resistance is the ohm and the fundamental unit of conductance (the reciprocal of resistance) is the mho. Seneca Lake has a conductivity of about 2 millimhos per centimeter. We are interested in learning how much the conductivity of Seneca Lake varies, both from place to place and from time to time. Our CTD software automatically displays conductivity values as specific conductance. Specific conductance removes the temperature variability by normalizing the conductivity to an equivalent

14
conductance at 25º C and is proportional to salinity. These values in Seneca Lake are approximately 750 microseimens per centimeter.
LAKE WATER CHEMISTRY
Seneca Lake is the drinking source for over 100,000 people and for this reason alone it is important that the water's quality be within EPA specifications for drinking water as shown below. One of the reasons Seneca Lake is an interesting lake chemically is because it has relatively high concentrations of the chloride ion compared to the other Finger Lakes. This is a concern because the associated sodium ion may pose a long-term health threat to a segment of our local population. We also have interest in other anions which have a major influence on the water quality and growth of plant life in the lake. EPA Criteria for Public Drinkable Water Supplies Permissible level Desirable level Typical Seneca Lake Data pH 6.0-8.5 7.4-7.8 8-9 Dissolved O2 ≥ 3 ppm 8-10 ppm saturated at 10 ppm (warm) Concentration saturated at 14 ppm (cold) Chloride 250 mg/l (~ppm Cl-) < 25 mg/l (~ppm Cl-) 110-150 ppm (lake) Concentration 50 ppm (streams) Hardness nuisance problem if < 80 ppm (as Ca ) >200 ppm (streams with >200 ppm (as CaCO3) <200 ppm Ca + Mg limestone bedrock) (as CaCO3)
We monitor these four parameters for the following reasons: The pH (pH = -log[H+], or acid concentration) is important to monitor since it is an "index" of the amount of hydrogen ion present in the lake. Most natural waters have a pH value between 5.0 and 8.5 and aquatic life survives quite well when the pH is within this range. If the pH becomes less than 5, an acidic strain is placed on the fish and plant life. On the other hand, a pH of greater than 8.5 places a basic strain on the aquatic life. Acidic strain may be the result of "acid rain" or industrial discharge into the lake. A basic strain could come from alkaline industrial wastes. Since there is little industry discharging into Seneca Lake, we would expect only a lowering of the pH caused by "acid rain". However, the limestone bedrock topography in the region buffers the affect of acid rain and so Seneca Lake pH has historically remained fairly basic. Dissolved Oxygen in the water is necessary for respiration. Much of the oxygen comes from the atmosphere and is dissolved in the water through diffusion and wave action. The remainder comes from plants through photosynthesis. It is removed by bacterial decomposition and is taken up during plant and animal respiration. When the oxygen concentration falls below 3 ppm, fish cannot survive and decomposition is hindered. Eventually the lake goes from an
15
oligotrophic (low productivity) state to an eutrophic (highly productive) state. Thus, it is important to keep track of the dissolved oxygen. Chloride concentrations in drinking water can be a health hazard when the chloride ion concentration exceeds 250 ppm. Since Seneca Lake serves as a drinking water supply for over 100,000 people, it is important that a record of the chloride ion concentration be kept over time. Possible ways for chloride ions to enter the lake are by natural seepage from the salt beds which are found in the bedrock under the lake bottom sediments, runoff during the winter months when the roads are treated for ice with sodium chloride (NaCl) and calcium chloride (CaCl2), or discharge of chlorinated sewage. Chloride concentrations on average tend to be higher in Seneca Lake (~130 ppm) as compared to other Finger Lakes that have concentrations ~50 ppm. The exact reasons are not known but several researchers are actively working on the problem. One theory suggests the bottom of the lake basin is in contact with evaporates underlying the lake causing a seepage of chloride ions. Other theories suggest that the discharge of salt mining waste, either in the past or present, is contributing to the higher chloride concentrations.
WATER SAMPLE COLLECTION In order to make a measurement at a certain depth, thereby being able to measure variations of chemical properties vs. depth, a water sampling bottle such as a Van Dorn type bottle is used. The bottle is attached to the winch cable and the stopper ends are pulled back and attached to a closing mechanism. The cable is then lowered to the proper depth, a messenger is sent down the cable to trigger the closing mechanism and the enclosed sample is returned to the surface. On the William Scandling, this will be done by the boat crew. Be sure to record the depth from which the sample was taken (from the Captain or mate) and the position of the boat (latitude and longitude) as you sample. The crew can also give you latitude and longitude from the instruments in the cabin. Once a water sample has been obtained using the Van Dorn bottle, it is necessary to fill two smaller bottles in order to run the pH, dissolved oxygen, hardness and chloride ion tests. The first bottle to be filled is the small clear glass LaMotte sample bottle found in the dissolved oxygen (DO) kit. The second bottle is the one liter plastic bottle for Cl- , hardness and pH determinations found in the basket with the DO kit. When filling the dissolved oxygen bottle, allow about three times the volume of the bottle to overflow before retaining a sample and replacing the cap. It is also very important to be sure that there are no air bubbles in the bottle containing the sample to be analyzed for dissolved oxygen. If air bubbles do form in the LaMotte sample bottle, dump out the water and re-fill the bottle with a new sample. Note to Instructors: There are two (2) baskets on board that can be assigned to groups of students. Each basket contains a plastic LAKE SAMPLE water bottle (to collect for Cl-, hardness and pH) and one kit each for Cl- and DO tests. The kits are in black or blue plastic containers. The titrator is the syringe that is included in the kit which contains the materials for a particular test. To fill it, place the pink tip in the hole in the top of the reagent bottle, invert the reagent bottle and fill the titrator by pulling out the plunger. Make sure there are no air bubbles and fill the titrator until the flat bottom of the plunger is at the zero (0) mark. The pH meter is a green, hand-held Oakton Eco Testr model.

16
EXPERIMENTAL PROCEDURES A) DETERMINATION OF LAKE WATER pH This test is done using a pH meter. The pH meter will be calibrated regularly by us before the students come aboard. As soon as possible after collecting the water sample, turn the pH meter on, remove the cap to expose the glass bead, pour at least an inch of water into a beaker rinsed with lake water and place the pH meter in the beaker. Let the number on the readout stabilize for 5-10 sec, then read the pH number and record it. Rinse off the pH meter with the distilled water provided, replace the protective cover, and turn it off. B) DETERMINATION OF DISSOLVED OXYGEN The method used to measure dissolved oxygen is a modification of the Winkler Procedure. The lake water sample to be tested is initially treated with (a) a solution of manganese (II) sulfate (MnSO4) [aka: manganous sulfate], (b) a solution containing potassium hydroxide (KOH), sodium azide (NaNO3) and potassium iodide (KI) and (c) with sulfuric acid (HSO4). The purpose of the sodium azide is to react with any nitrate present in the lake water sample that would interfere with the reaction for the determination of dissolved oxygen. The purpose of the other reagents is to bind the oxygen and to form free iodine that can then be titrated with sodium thiosulfate (Na2S2O3) using a starch indicator. Procedure (Dissolved Oxygen): Note: When collecting your water sample, use the special small clear glass/plastic bottle provided with the dissolved oxygen kit (it is clearly labeled: LaMotte) for this procedure and let the water overflow so that there are no air bubbles. 1. To the LaMotte sample bottle from the DO kit which you have filled with your sample,
add 8 drops of the manganese(II) sulfate solution (bottle 4167), followed by 8 drops of the alkaline potassium iodide azide solution (bottle 7166). Some water may drip off the sides, this is expected! Carefully cap the bottle, mix by gently inverting (do not generate bubbles inside the glass sample bottle), then allow the orange-brown precipitate that has formed to settle below the shoulder of the bottle (about 3-4 minutes).
2. Uncap the bottle and add 8 drops of sulfuric acid 1:1 (6141WT) to the solution in your
LaMotte sample bottle. Cap the bottle and mix until the precipitate (brown crystals) has completely dissolved. The sample will be clear yellow to orange.
3. Pour this clear yellow-brown solution from the LaMotte bottle into the titration tube and
fill it up to the 20 ml line. Depress the plunger of titrator (0377) syringe. Insert the titrator into the sodium thiosulfate (4169) bottle, invert the bottle and fill the titrator to the 0 (zero) mark.
4. Insert the tip of the titrator into the titration tube filled with sample and depress plunger,
slowly, just until the solution is a pale yellow. Add 8 drops of starch indicator (4170WT). The solution should turn blue.
5. Re-Insert the titrator and continue to titrate sodium thiosulfate into the solution slowly,
drop by drop. Swirl the titration tube until the blue color of the solution disappears permanently with one drop of titrant (i.e., you are looking for a color progression from green-blue to blue to light blue to colorless). You may have to fill the titrator more than
17
once. Be sure to record how much titrant you used before refilling and add it to the total when you record your data. The direct reading titrator is calibrated in units of parts per million (ppm) dissolved oxygen.
Waste Handling and Clean-up Procedures: Dump the remaining contents of the LaMotte sample bottle and the titration tube into the waste container marked: DO WASTE. Do not dump it down the sink drain as the sink drains into the lake! Rinse the titration tube and LaMotte bottle with distilled water and place them back in the dissolved oxygen kit. Chemistry of the Dissolved Oxygen Determination: 1. In Step 1, a solution of manganese(II) sulfate is initially added to the lake water sample.
This puts the soluble manganese (Mn2+) and sulfate (SO42-) ions into solution. Next, you add a solution of potassium hydroxide (KOH), sodium azide (NaN3) and potassium iodide (KI) to the LaMotte bottle. At this point, manganese(II) hydroxide forms from the reaction of the manganese(II) sulfate and potassium hydroxide:
MnSO4 (aq) + 2 KOH (aq) ➔ Mn(OH)2 (aq) + K2SO4 (aq) The Mn(OH)2 formed immediately combines with any dissolved oxygen in the lake water
sample and causes the formation of the manganese(II)oxide precipitate: 2 Mn(OH)2 (aq) + O2 (aq) + H2O ➔ 2 MnO2 (s) + 3 H2O 2. In step 2, you add sulfuric acid 1:1 (H2SO4) to the solution with a yellow-brown
precipitate. The purpose of this is to acidify the solution and dissolve the manganese(II) oxide thereby liberating manganese and oxide ions into solution. These react with the other ions already in solution (K+, I-, H+, and SO3NH2-) to form free iodine (iodine is oxidized), potassium hydroxide and a manganese complex:
MnO2(s) + 2 KI (aq) + H2SO4 (aq) ➔ I2 (aq) + 2 KOH (aq) + Mn(SO3NH2)(aq) 3. At this point, the oxygen is bound. The amount of dissolved oxygen is determined by
titrating the iodine in solution with a starch indicator (the I2 is blue in starch.) The iodine released from the KI in step 2 is equivalent to the amount of dissolved oxygen in the sample. This is measured by titrating with sodium thiosulfate. When all of the I2 has been reduced (to I-), sodium iodide (NaI) and sodium tetrathionate (Na2S4O6) are formed. The blue color disappears and the solution becomes colorless. This is the end point of the titration. The concentration of I2 formed equals the concentration of dissolved oxygen.
I2 (aq) + 2Na2S2O3 (aq) ➔ Na2S4O6(aq) + 2 NaI (aq)
C) CHLORIDE ION DETERMINATION BY DIRECT READING TITRATION The method used to determine the chloride ion concentration is to treat the sample with silver nitrate to precipitate the chloride as AgCl. Since you use excess silver chloride, this excess is titrated with potassium chromate (K2CrO4) as the indicator. The reddish pink color indicates that

18
there is now excess silver nitrate. Since you know how much silver nitrate you added to precipitate the chloride in the water sample, you know the chloride ion concentration in the samples. This is done for you by measuring the amount of titrant. Chloride Ion Procedure: 1. Fill the titration tube to the 15 ml mark with the lake water sample from the large plastic
LAKE SAMPLE water bottle. 2. Add three drops of CHLORIDE REAGENT #1 (bottle 4504, contains potassium chromate)
to the sample in the titration tube. Cap the tube and shake to mix. A yellow color will result.
3. Fill the Direct Reading Titrator (0382) up to the 0 mark [looks like a syringe: marked 0-200
ppm] with CHLORIDE REAGENT #2 (bottle 4505, contains silver nitrate). Note: Silver Nitrate (AgNO3) can stain heavily if it gets on your hands or clothing and is exposed to daylight or direct sunlight. Be careful!!
4. Insert the titrator containing CHLORIDE REAGENT #2 into the small hole in the titration
tube cap and titrate the test sample drop by drop. Swirl the titration tube after each drop added until the yellow color changes faintly, yet permanently to pink. You will go from yellow to cloudy yellow and suddenly to pink. Record the titrator reading in units of ppm. If the plunger reaches the 200 ppm mark before the pink color appears, then refill the titrator and continue the titration. Be sure to record how much titrant you used before refilling and add it to the total when you record your data.
Waste Handling and Clean-up Procedures: Put the contents of the titration tube into the waste container marked: Cl- Waste. The waste container is meant to hold only the portion of the lake water that has been treated with chemicals for analysis. Rinse the titration tube with distilled water and place it back in the chloride ion kit. When you are sure you no longer need any more lake water sample, dump the remainder of the lake water from the LAKE SAMPLE water bottle into the sink. Chemistry of the Chloride Ion Determination: 1. In step 2, you add a potassium chromate solution (K2CrO4) to the lake water sample
which puts the potassium and chromate ions into the solution. K2CrO4 (aq) ➔ 2 K+(aq) + CrO42-(aq) 2. In step 4, you add a solution of silver nitrate (AgNO3) of known concentration dropwise
to the lake water sample containing the potassium and chromate ions. After each drop is added, the following occurs:
Initially, the silver and nitrate ions dissociate into solution: AgNO3(aq) ➔ Ag+(aq) + NO3-(aq)
19
Next, any chloride ion present in the lake water reacts with the silver ion added to precipitate silver chloride (AgCl), this turns the solution cloudy:
Ag+ (aq) + Cl-(aq) ➔ AgCl(s) 3. During the titration, enough silver nitrate is added to consume all of the chloride ion
present. At this point, the reaction solution turns an orange-pink color because the silver ion (which is in excess) now reacts with the chromate ions present (from step 2) to form silver chromate. This color change signifies the end point:
Ag+ (aq) + CrO42-(aq) ➔ Ag2CrO4 (aq)
3. The concentration of the chloride ion in the lake water sample is calculated as follows.
Since you know the exact concentration of the silver nitrate solution and how much was added dropwise to precipitate the silver chloride, you know the concentration of chloride ion in the sample (in parts per million). This is because the silver nitrate concentration equals the chloride concentration as they are present in a 1:1 ratio in solution.
PLANKTON
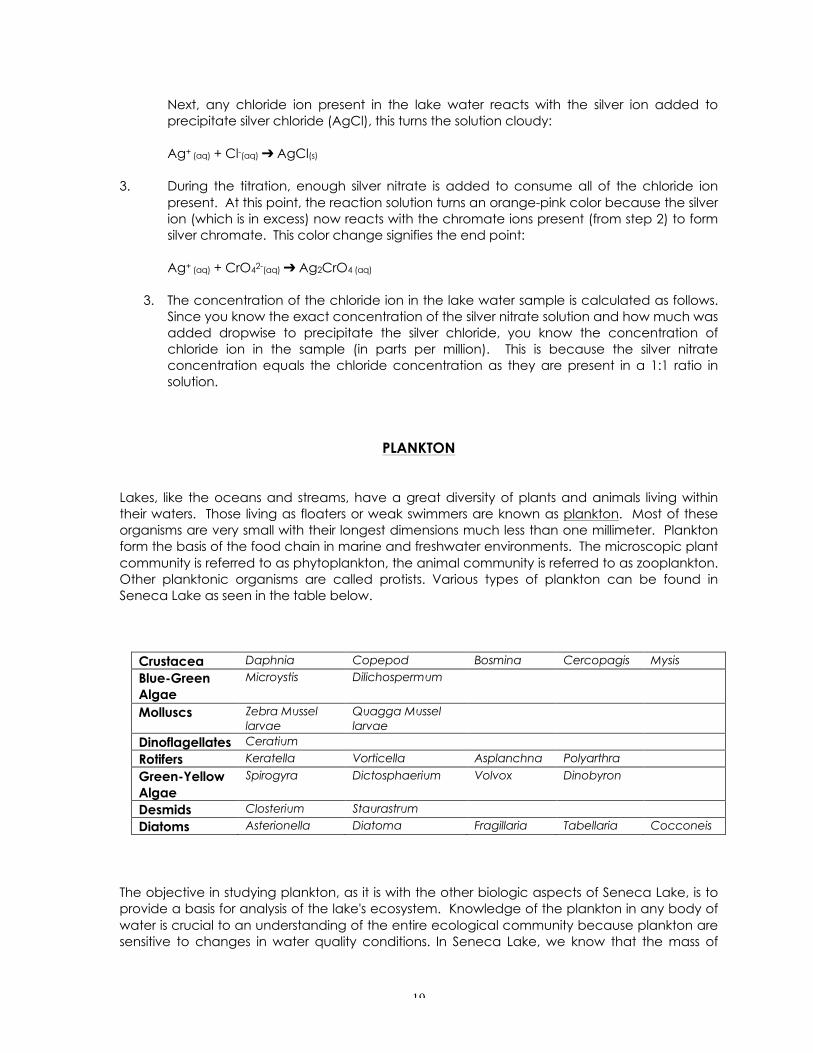
Lakes, like the oceans and streams, have a great diversity of plants and animals living within their waters. Those living as floaters or weak swimmers are known as plankton. Most of these organisms are very small with their longest dimensions much less than one millimeter. Plankton form the basis of the food chain in marine and freshwater environments. The microscopic plant community is referred to as phytoplankton, the animal community is referred to as zooplankton. Other planktonic organisms are called protists. Various types of plankton can be found in Seneca Lake as seen in the table below.
Crustacea Daphnia Copepod Bosmina Cercopagis Mysis
Blue-Green Algae
Microystis Dilichospermum
Molluscs Zebra Mussel larvae
Quagga Mussel larvae
Dinoflagellates Ceratium
Rotifers Keratella Vorticella Asplanchna Polyarthra
Green-Yellow Algae
Spirogyra Dictosphaerium Volvox Dinobyron
Desmids Closterium Staurastrum
Diatoms Asterionella Diatoma Fragillaria Tabellaria Cocconeis
The objective in studying plankton, as it is with the other biologic aspects of Seneca Lake, is to provide a basis for analysis of the lake's ecosystem. Knowledge of the plankton in any body of water is crucial to an understanding of the entire ecological community because plankton are sensitive to changes in water quality conditions. In Seneca Lake, we know that the mass of

20
plankton waxes and wanes during the year and that the character of the plankton at any time of year varies from place to place. Water temperature, water chemistry, and depth of light penetration all work to control their distribution both vertically and horizontally. Diurnal variation in light penetration causes some plankton to migrate up and down the water column on a 24-hour cycle. Procedure for Plankton Collection: Plankton will be collected in a plankton net (83 micron mesh size) which students can deploy and retrieve using the attached rope. The net is kept in a white wooden box along with a wash bottle and beaker. Note: Make sure to write down the latitude and longitude of the boat when the plankton sample is taken. 1. Twist the end of the rope around one hand 2-3 times and grasp with a fist. Don't let go!
This grip is to ensure the net isn't tossed overboard when it is cast. 2. Make sure the clasp at the bottom of the net is closed! If it isn't, the sample will not be
captured and the net will need to be recast. 3. Lower the net over the side of the boat until it floats freely in the water. Walk slowly from
the stern to the bow of the boat and then back again, gently dragging the net behind you. Try to walk at a steady pace so that the net stays at a fairly constant depth and does not scrape the side of the boat. Since water clarity is an indication of the presence of phytoplankton, use your secchi disk reading as an indicator of productivity. If the secchi disk reading is less than 7 meters, traverse the length of the boat twice. If it is greater than 7 meters, make 3-4 trips to make sure you collect enough plankton in your net.
4. Back at the stern of the boat, gather the line up until the net is vertical, hanging freely,
and level with the railing. Using the provided wash bottle (filled with tap or lake surface water, not distilled water), wash down any plankton clinging to the sides of the net into the small grey cup attached to the lower end of the net.
5. Raise the net slightly, keeping it vertical. Grasp the grey sample cup and swing it on
board, making sure not to spill the sample. 6. Hold the provided plastic beaker under the sample cup and attached rubber tubing
and release the tubing clamp, allowing the sample to flow into the beaker. If it appears that some sample has clung to the inside of the grey sample cup, carefully use a small amount of water from the wash bottle to rinse it into the beaker. You don't want to dilute the sample.
7. The beaker can now be taken to the lab for analysis. Remember to rinse the plankton
net out when the plankton sample is no longer needed (using either water from the sink on the back deck or distilled water), let it hang to dry and then replace it in the net box.

21
Procedure for Inventory and Counting: After gently stirring the sample in the beaker to minimize the effect of settling, obtain a subsample of the plankton using a plastic eyedropper. Put the sample on the Sedgewick-Rafter cell found near the microscope and cover carefully with a cover slip. Try to minimize any air bubbles. Once you have the sample in view under the microscope, you may find that some of the plankton is moving too fast for observation. If that's the case, follow the procedures for samples with slowing agent given below. The equipment that you will need for this procedure is kept on the boat's lab bench next to the video microscope. Instructions for use of the video microscope are provided onboard. For samples with slowing agent (DETAIN): - Put 9 – 10 drops of sample on Sedgewick-Rafter cell. - Put 5 – 6 drops of DETAIN from marked dropper bottle onto sample. It is a very viscous
liquid, avoid getting the Detain anywhere other than the sample cell. - Carefully mix with dissecting needle along entire length of the slide without scratching the
Sedgewick-Rafter cell. - Carefully cover Sedgewick-Rafter cell with cover slip. Try to minimize air bubbles. For samples without slowing agent (DETAIN): - Put approximately 14 drops of plankton sample on Sedgewick-Rafter cell. - Carefully cover Sedgewick-Rafter cell with cover slip. Try to minimize air bubbles. Count the plankton you find. A sample of at least 100 is best, if you can find that many. There are materials on board to help with plankton identification. Identify and/or draw each type of plankton as you find it. Tally each type until you reach 100 total. Estimate or count to get the percentages of each. If your sample does not have much to look at, make a second slide sample and add the numbers from both slides. CLEAN-UP: Carefully remove cover slip and wash it down with a steady stream of distilled water. Wash down the Sedgewick-Rafter cell with a stream of distilled water making sure all of the viscous DETAIN is removed. Wipe both the cover slip and the slide with the Kimwipes provided. Do not use paper towels as they leave too many fibers behind on the slide.
LAKE SEDIMENTS
This section deals with the sediments in lakes: What they are, why they are of interest, and how we study them. Seneca Lake, like any body of standing water, serves as the repository for materials carried into it by water, wind, ice, and the activities of living creatures. These materials include fine particles of minerals, rock fragments, and organics. We refer to these materials as sediments. Sunken boats, bottles, cans, tires, fishing lures, etc. are also found on the lake bottom but are not considered sediments! Most lake sediments are layered, the layers (strata) being defined by color variations. In the deeper parts of Seneca Lake, the layers are alternately black and gray and they are very thin. Below these are other, thicker strata which are alternately pink and gray. The black and gray strata are arranged as flat sheets while the pink and gray ones are often contorted.
22
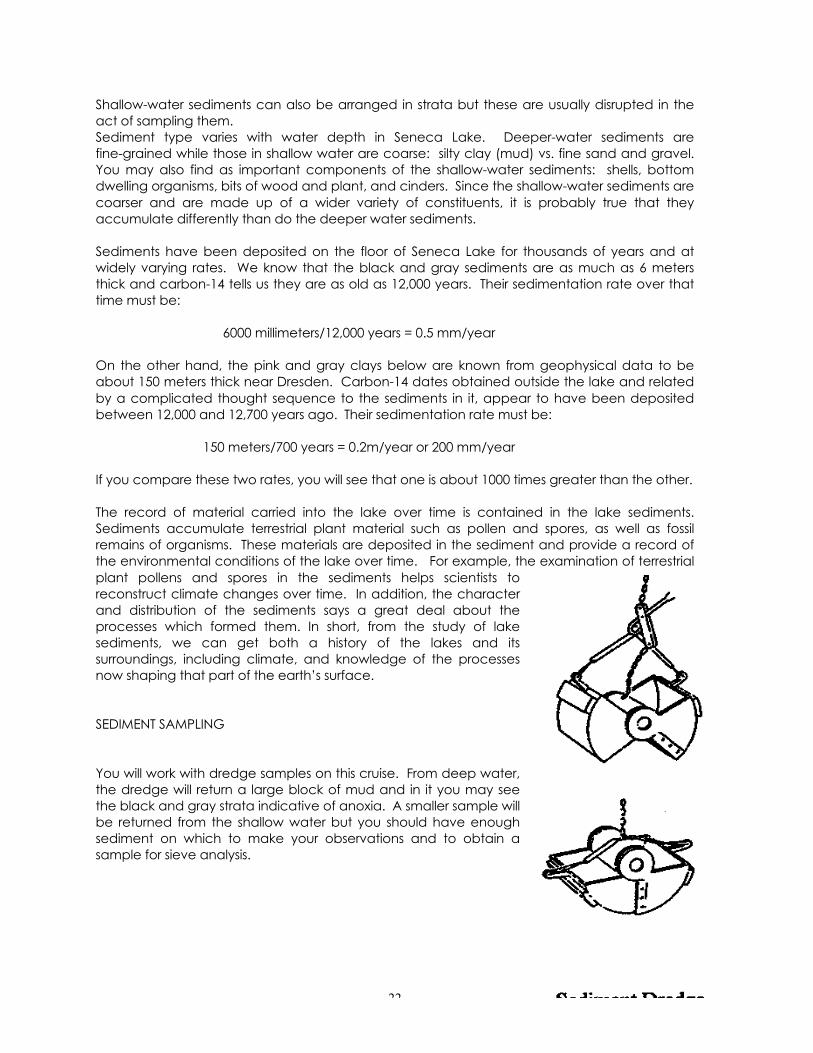
Shallow-water sediments can also be arranged in strata but these are usually disrupted in the act of sampling them. Sediment type varies with water depth in Seneca Lake. Deeper-water sediments are fine-grained while those in shallow water are coarse: silty clay (mud) vs. fine sand and gravel. You may also find as important components of the shallow-water sediments: shells, bottom dwelling organisms, bits of wood and plant, and cinders. Since the shallow-water sediments are coarser and are made up of a wider variety of constituents, it is probably true that they accumulate differently than do the deeper water sediments. Sediments have been deposited on the floor of Seneca Lake for thousands of years and at widely varying rates. We know that the black and gray sediments are as much as 6 meters thick and carbon-14 tells us they are as old as 12,000 years. Their sedimentation rate over that time must be: 6000 millimeters/12,000 years = 0.5 mm/year On the other hand, the pink and gray clays below are known from geophysical data to be about 150 meters thick near Dresden. Carbon-14 dates obtained outside the lake and related by a complicated thought sequence to the sediments in it, appear to have been deposited between 12,000 and 12,700 years ago. Their sedimentation rate must be: 150 meters/700 years = 0.2m/year or 200 mm/year If you compare these two rates, you will see that one is about 1000 times greater than the other. The record of material carried into the lake over time is contained in the lake sediments. Sediments accumulate terrestrial plant material such as pollen and spores, as well as fossil remains of organisms. These materials are deposited in the sediment and provide a record of the environmental conditions of the lake over time. For example, the examination of terrestrial plant pollens and spores in the sediments helps scientists to reconstruct climate changes over time. In addition, the character and distribution of the sediments says a great deal about the processes which formed them. In short, from the study of lake sediments, we can get both a history of the lakes and its surroundings, including climate, and knowledge of the processes now shaping that part of the earth’s surface. SEDIMENT SAMPLING You will work with dredge samples on this cruise. From deep water, the dredge will return a large block of mud and in it you may see the black and gray strata indicative of anoxia. A smaller sample will be returned from the shallow water but you should have enough sediment on which to make your observations and to obtain a sample for sieve analysis.

23
STUDYING DREDGE SAMPLES Study the materials brought up by the dredge by following these procedures: 1. The ship's crew will prepare the dredge, lower it, retrieve it, and present the sample for
study on a drain-pad on the deck. Stand clear of the operation until the sample is out on the deck and the dredge is out of the way. Presenting the sample is messy and poses some risk of injury to the inexperienced. Be sure to record the location of the boat with latitude and longitude readings as the dredge sample is taken. The sediments will be presented as a block of mud (it may split as it is dropped on the pad) or a small amount of materials recovered by the dredge.
2. For the deep water samples, look at the block surface, you may see plant debris, shells, cinders, or pebbles. Look for aquatic life; Quagga mussels, bacterial filaments, arthropods and plant remains are commonly found in deep dredges. Note what you see, including colors and other characteristics. The darker color sediment indicates anaerobic conditions. There is a soil color chart that provides a color key for comparison of the sediments.
3. To test the smell put a few drops of weak HCl on a split surface. Does it effervesce?
Does it smell (rotten eggs)? If it does effervesce with a smell, you have detected iron sulfide (FeSx) mineral. If it effervesces without a smell, you have detected a carbonate (CaCo3) mineral. Both are common in these sediments. During this phase, record the temperature by pushing the thermometer well into the mud and reading it after a minute or two.
4. In contrast to the block of mud from deep water, in shallow water the dredge will
retrieve a relatively small mass of sand with no strata visible. But even a little sand is useful because sandy sediments are usually more heterogeneous than muddy ones, so there will be a lot to record. You should examine the sand carefully and record what you find. For example, Zebra mussels may be seen in the very shallow water samples while Quagga mussels dominate the deeper sediments.
5. With a spatula, split the block in two and sketch the cut face. Take care to get the
major features of the block into your sketch. Take note of the few exotic organisms present in the sediment like Eurasian milfoil, and Zebra or Quagga mussels.
6. Once you are finished making observations, the crew will discard what is left of the
sample. The crew will clean up the deck and dredge. Help only if you are asked to; otherwise stand clear.
It is always tempting to collect some material in a ziplock bag for examination at a later time. However, it is usually true that collections made just for the sake of collecting are later discarded without further study. Never collect something that does not help you to answer a specific question about your project. But, should you need to collect, think about the following. You might wish to select representative shells from those that you have found in the dredge sample. Perhaps your project can be carried out only by further study of the sediment mass or the plant material carried in it. If so, plan to bring your own containers for collecting. Place some of the sediment into a carefully labeled jar or baggy and include just enough water to moisten the sediment. Do the same for the plant samples. For all of your samples, the labels should contain these facts: sample number, sample location, date of collection, and water depth. Be sure to record these things in your notes.

24
PARTICLE SIZE ANALYSIS [for shallow water sediment samples] Your group may want to perform a particle size analysis on the lake sediments. The size of the particles (grains) in a sediment sample is a tip-off about the processes which formed the mass. For example, we know that coarse-grained sediments are deposited by swift-flowing currents (streams, tide) or by the motion of fluids with a density greater than that of water (mudflows, glaciers). Fine-grained sediments are the result of deposition by very slow-moving currents or by deposition in standing bodies of water. To consider particle size, we need a particle-size scale and the one used in geology is the Wentworth Scale. Its subdivisions are: Gravel >2 mm (can be measured with a ruler) Pebbles 2-64 mm Cobbles 64-256 mm Boulders >256 mm Sand 2.0-0.62 mm (discernible by eye but measured with sieves) Fine 0.062-0.250 mm Medium 0.250-1.0 mm Coarse 1.0-2.0 mm Silt 0.062-0.004 mm (sensible to the touch; measured with special techniques)
Clay <0.004 mm (smooth, no grit; measured with special techniques)
In Seneca Lake, most of the shoreline is covered by cobbles, pebbles, and sand. From the shore to a depth of approximately 10 meters, the floor is covered by pebbles, sand, and some mud. In deeper water you will find only mud, most of which is medium to coarse silt. True clays, as defined above, are hard to find.
Of these sediments, the sand and gravel are emplaced and shaped by waves and wave-driven currents while the silts are carried into quiet water where they settle out of suspension onto the lake floor. That means the sediments of the shore and shallows are well-oxygenated while those of the deeper water may not be. In addition to particle size, the range of particle sizes (sorting) in a sediment mass is important for understanding how that mass came together. As an example, if you have been to a beach, you know that the sand or gravel found there is made up of particles of only a few sizes. Beach sands are said to be well sorted. In contrast, if you have seen concrete being poured, you know it is made up of particles of several sizes: gravel, sand, and cement. Concrete might be thought of as being poorly sorted. One measure of sorting is a histogram (or bar-chart) where the volume-percent of sand is plotted against particle diameter.

25
Here are examples of histograms and the types of sediments they might represent.
The procedure for measuring particle size and sorting is a simple one. Here, we will be using sediment volumes instead of the sediment weights we would use normally because we do not have the time to dry, prepare and weigh the sediment. For us, volumes will suffice. 1. Arrange the six stainless steel sieves into a stack, coarsest at the top. 2. From the dredge, obtain a representative sample of about 150 milliliters of sediment.
Use the plastic cylinder provided to measure your sample. 3. Wash your sample into the topmost of the sieves and proceed to wash it through into
the sieves below. Do this on the deck. 4. Remove all of the gravel retained from the sample. 5. When all of the sediment has been washed through the top-most sieve, remove it
from the stack, set it aside and wash down the next sieve. Continue with this procedure until all of the sieves have been treated in this way. Now you have several sieves on the deck near you and you still have the gravel to contend with.
6. To determine the volume displaced by the gravel, put some water into the
graduated cylinder, and measure its volume. Then add the gravel and measure the amount of water it displaced. This is the gravel's volume.
7. To determine the volume of the sample retained on each sieve, carefully wash the
sediment from a sieve into the graduated cylinder. Let the sediment settle and measure its volume in the cylinder. Repeat this for each sieve.
8. Sum up the volumes retained on the sieves and volume of the gravel. Subtract that
sum from the sample volume you had originally and you have the amount of the sample finer than the finest sieve.

26
9. Compute the volume-percent of the sample retained on each sieve, the
volume-percent of the gravel, and the volume-percent of the sample which passed the finest sieve.
10. Prepare a histogram comparing volume-percent and grain-size. A few questions about sorting: Do the sediments you have sieved exhibit good-, fair- or poor-sorting? Why is this level of sorting developed here? How might these sediments have arrived here? Most of what looks to be clay in this and other lakes is really silt. It is too fine to study with sieves but you can get an idea of what these finer materials are by taking about a teaspoonful of sample, putting it onto the 0.088 sieve and washing the sediment through with water. Using the hand lens, identify what you see on the sieve and estimate the % of the sample made up by each of the particle types you see.

27
REFERENCES AND SUGGESTED ADDITIONAL READINGS
GENERAL LIMNOLOGY Berg, C. O. (ed.), 1963. Limnology in North America, Univ. Wisconsin. Bloomfield, J. A. (ed.), 1978. Lakes of New York State. Vol.1: Ecology of the Finger Lakes.
Academic Press. Bloomfield, J. A. (ed.), 1978. Lakes of New York State. Vol.2: The Lakes of Western New
York. Academic Press. Bronmark, C. and L.A. Hansson, 2005. The Biology of Lakes and Ponds. Oxford University Press. Busch, W. and P. G. Sly (eds), 1992 The Development of an Aquatic Habitat Classification System for Lakes. CRC Press, Boca Raton. 225pp. Hutchinsin, G. D., 1957. A Treatise on Limnology (3 Vols.). John Wiley & Sons, New York. Lerman, A. (ed.), 1978. Lakes: Chemistry, Geology, Physics. Springer-Verlag, New York. 363 pp. Lind, O. T., 1985. Handbook of Common Methods in Limnology. 2nd Ed. Kendall- Hunt. 208 pp Reid, G. K., 1961. Ecology of Inland Waters and Estuaries. Van Nostrand, Reinhold, New York. 375 pp. Tilzer, M. M. et al., (eds), 1990. Large Lakes: Ecological Structure and Function. Springer-Verlag, New York. 691 pp. Wetzel, R. G., 2001. Limnology 3rd Ed. W. B. Saunders, Philadelphia. 767 pp. SEDIMENT ANALYSIS Friedman, G. M. and K. G. Johnson, 1982. Exercises in Sedimentology. John Wiley & Sons, New
York. 208 pp. Allen, J. R. L., 1985. Experiments in Physical Sedimentology: Allen & Urwin, Winchester, MA. 64 pp. CHEMISTRY Auria, D., J. M., Gelchrist, A. B., and J. J. Johnstone, 1973. Chemistry and the Environment. W. B. Saunders Company. Jolly, W. L., , 1985. Encounter in Experimental Chemistry. 2nd Edition. Harcourt Brace
Jovanovich Inc. Pages 59-65. Wetzel, R. G. and G. E. Likens, 2000. Limnological Analysis. 3rd Ed. Springer Verlag, New
York. 368 pp.

28
ZOOPLANKTON Balcer, M. D., N. L. Korda, and S. I. Dodson., 1984. Zooplankton of the Great Lakes: A
guide to the identification and ecology of the common crustacean species. University of Wisconsin Press, Madison, Wisconsin. 174 pp.
Brooks, J. L., 1957. The systematics of North American Daphnia. Memoirs of the Connecticut Acad. of Arts and Science. 13:1-800. Edmondson, W. T. (ed.), 1959. Freshwater biology, 2nd edition. John Wiley and Sons, New
York. 1248 pp. Pennak, R. W., 1978. Freshwater invertebrates of the United States, 2nd edition. John Wiley and Sons, New York. 803 pp. Torke, B. G., 1974. An illustrated guide to the identification of the planktonic crustacea of Lake
Michigan with notes on their ecology. Special Report No. 17. Center for Great Lakes Studies, Univ. of Wisconsin, Milwaukee. 42 pp.
ALGAE Edmondson, W. T. (ed.), 1963. Freshwater Biology. 2nd ed. Wiley, New York. 1248 pp. Prescott, G. W., 1962. Algae of the Western Great Lakes Area. W. C. Brown Co., Dubuque, Iowa. 348 pp. Prescott, G. W., 1970. How to Know the Freshwater Algae. W. C. Brown Co., Dubuque,
Iowa. 348 pp. Wehr, J.D. and R.G. Sheath (eds), 2003. Freshwater Algae of North America. Elsevier Science, USA. 918 pp. BIOLOGICAL DIVERSITY Magurran, A. E., 1988. Ecological diversity and its measurement. Princeton University Press,
Princeton, New Jersey. 179 pp.

29
Research in the Finger Lakes
Some of the people whose research and website links may be of interest to those with questions about the scientific aspects of New York's Finger Lakes.
Seneca Lake
Dr. John Halfman Environmental Studies Program and Department of Geoscience Hobart and William Smith Colleges Geneva, NY 14456 [email protected] Dr. Tara Curtin Department of Geoscience Hobart and William Smith Colleges Geneva, NY 14456 [email protected] Dr. Dave Finkelstein Department of Geoscience Hobart and William Smith Colleges Geneva, NY 14456 [email protected] Dr. Megan Brown Department of Biology Hobart and William Smith Colleges Geneva, NY 14456 [email protected] Dr. Chris Sholz Department of Earth Sciences, Syracuse University 204 Heroy Geology Laboratory Syracuse, NY 13244-1070
Canadice & Hemlock Lakes City of Rochester Bureau of Water 10 Felix St. Rochester, NY 14608 Canandaigua Lake
Dr. John Halfman (see above)

30
Dr. Bruce Gilman Professor of Environmental Conservation/Outdoor Recreation Finger Lakes Community College [email protected] Kevin Olvany Watershed Program Manager [email protected]
Cayuga Lake
Dr. John Halfman (see above) James McKenna Research Ecologist Tunison Aquatic Lab, USGS [email protected] Community Science Institute Water Quality Testing Laboratory Room 284 Langmuir Lab/Box 1044 95 Brown Road Ithaca, NY 14850 [email protected] http://www.communityscience.org/
Conesus Lake
Dr. Joseph C. Makarewicz, Distinguished Professor 125 Lennon Hall SUNY Brockport Brockport, NY 14420 [email protected]
Isidro M Bosch Professor of Biology Integrated Science Center #260 SUNY Geneseo Geneseo, NY 14454 [email protected]
Honeoye Lake
Dr. John Halfman (see above) Dr. Bruce Gilman Professor of Environmental Conservation/Outdoor Recreation Finger Lakes Community College [email protected]

31
Keuka Lake
Dr. John Halfman (see above) Dr. Tim Sellers Associate Professor of Biology and Environmental Science Keuka College Keuka Park, NY 14478 [email protected]
Otisco Lake Dr. Bernd Blossey, Invasive Species Department of Natural Resources Cornell University Ithaca, NY 14853 [email protected] Onondaga County Water Authority Otisco Lake Water Quality Reports http://www.ocwa.org/index.html
Owasco Lake
Dr. John Halfman (see above) Dr. Bruce Gilman (see above) Eileen O'Connor Director of Cayuga County Environmental Health Bruce Natale Cayuga County Solid Waste Management Program Administrator
Skaneateles Lake
City of Syracuse Water Department http://www.syracuse.ny.us/deptwater.asp http://counties.cce.cornell.edu/onondaga/watersheds/skanhome.htm Dr. John Halfman (see above) Dr. Robert Werner , Professor Emeritus SUNY College of Environmental Science and Forestry 1 Forestry Drive Syracuse, NY 13210 Steve Effler Upstate Freshwater Institute Syracuse, NY 13206

32
LIST OF SUPPLIERS
The following is a list of various vendors from whom we have acquired the equipment referenced in the manual, if you are interested in similar acquisitions. Inclusion in this list or exclusion from it does not constitute any sort of positive or negative endorsement of any products by us.
LaMotte Chemical Products Company
Box 329 Chestertown, MD 21620
(Water Analysis Kits)
Ward's Natural Science+, Inc. P.O. Box 92912
Rochester, NY 14692-9012 (Sediment Sieves, Secchi Disks)
Wildco
95 Botsford Place Buffalo, NY 14216
(Plankton Nets, Dredges, Water Sampling Equipment)