science item sampler grade 8 · grade 8 science item sampler 1 science item sampler overview...
TRANSCRIPT

ScienceItem Sampler
Grade 8

Grade 8 Science Item Sampler ii
Developed and published under contract with the Wisconsin Department of Public Instruction by Data Recognition Corporation, 13490 Bass Lake Road, Maple Grove, MN 55311. Copyright © 2017 by the Wisconsin Department of Public Instruction. All rights reserved. Only State of Wisconsin educators and citizens may copy, download, and/or print the document, located online at https://dpi.wi.gov/assessment/forward/sample-items. Any other use or reproduction of this document, in whole or in part, requires written permission of the Wisconsin Department of Public Instruction.
The Wisconsin Department of Public Instruction does not discriminate on the basis of sex, race, color, religion, creed, age, national origin, ancestry, pregnancy, marital status or parental status, sexual orientation, or disability.

iiiGrade 8 Science Item Sampler
SCIENCE ITEM SAMPLER OVERVIEW . . . . . . . . . . . . . . . . . . . . . . . . . . . . . . . . . . . . . . . . . . . . . . . 1Overview . . . . . . . . . . . . . . . . . . . . . . . . . . . . . . . . . . . . . . . . . . . . . . . . . . . . . . . . . . . . . . . . . . . . 1Connection to the Standards . . . . . . . . . . . . . . . . . . . . . . . . . . . . . . . . . . . . . . . . . . . . . . . . . . . . 1How Do I Use This Book? . . . . . . . . . . . . . . . . . . . . . . . . . . . . . . . . . . . . . . . . . . . . . . . . . . . . . . 1
Professional Development . . . . . . . . . . . . . . . . . . . . . . . . . . . . . . . . . . . . . . . . . . . . . . . . . . 1Improving Instruction . . . . . . . . . . . . . . . . . . . . . . . . . . . . . . . . . . . . . . . . . . . . . . . . . . . . . . 1Student Practice . . . . . . . . . . . . . . . . . . . . . . . . . . . . . . . . . . . . . . . . . . . . . . . . . . . . . . . . . . 1Test Preparation . . . . . . . . . . . . . . . . . . . . . . . . . . . . . . . . . . . . . . . . . . . . . . . . . . . . . . . . . . 2
Depth of Knowledge . . . . . . . . . . . . . . . . . . . . . . . . . . . . . . . . . . . . . . . . . . . . . . . . . . . . . . . . . . . 3Item Types . . . . . . . . . . . . . . . . . . . . . . . . . . . . . . . . . . . . . . . . . . . . . . . . . . . . . . . . . . . . . . . . . . 4
Selected-Response (SR) Items . . . . . . . . . . . . . . . . . . . . . . . . . . . . . . . . . . . . . . . . . . . . . . . 4Technology-Enhanced (TE) Items . . . . . . . . . . . . . . . . . . . . . . . . . . . . . . . . . . . . . . . . . . . . . 5Text-Dependent Analysis (TDA) Items . . . . . . . . . . . . . . . . . . . . . . . . . . . . . . . . . . . . . . . . . . 6
SCIENCE ITEMS—SESSION 1 . . . . . . . . . . . . . . . . . . . . . . . . . . . . . . . . . . . . . . . . . . . . . . . . . . . . . . 8Scenario 1 . . . . . . . . . . . . . . . . . . . . . . . . . . . . . . . . . . . . . . . . . . . . . . . . . . . . . . . . . . . . . . . . . . 8Scenario 2 . . . . . . . . . . . . . . . . . . . . . . . . . . . . . . . . . . . . . . . . . . . . . . . . . . . . . . . . . . . . . . . . . 15
SCIENCE ITEMS—SESSION 2 . . . . . . . . . . . . . . . . . . . . . . . . . . . . . . . . . . . . . . . . . . . . . . . . . . . . . 22Scenario 1 . . . . . . . . . . . . . . . . . . . . . . . . . . . . . . . . . . . . . . . . . . . . . . . . . . . . . . . . . . . . . . . . . 22Standalone Items . . . . . . . . . . . . . . . . . . . . . . . . . . . . . . . . . . . . . . . . . . . . . . . . . . . . . . . . . . . . 27
SCIENCE—APPENDIX . . . . . . . . . . . . . . . . . . . . . . . . . . . . . . . . . . . . . . . . . . . . . . . . . . . . . . . . . . . 30Summary Data . . . . . . . . . . . . . . . . . . . . . . . . . . . . . . . . . . . . . . . . . . . . . . . . . . . . . . . . . . . . . . 30
TABLE OF CONTENTS

Grade 8 Science Item Sampler iv
THIS PAGE IS INTENTIONALLY BLANK.

1Grade 8 Science Item Sampler
SCIENCE ITEM SAMPLER OVERVIEW
OVERVIEW
This document contains samples of scenarios and test items similar to those on the Wisconsin Forward Science Exam. Each sample test item has been through a rigorous review process by DRC, Wisconsin Educators, and a third party, to ensure alignment with the Wisconsin Academic Standards. These items will not be used on the state assessment and may, therefore, be used in Wisconsin for professional development and student practice. The items in this document illustrate a sample of the content and types of items that students will encounter on the Forward Exam. A Summary Data table in the Appendix section identifies the alignment (standard measured), answer key, depth of knowledge, and annotations for each item.
CONNECTION TO THE STANDARDS
Wisconsin Academic Standards for Science are available on the DPI webpage. Test items require students to prove their knowledge and abilities as stated in the standards.
HOW DO I USE THIS BOOK?
Professional Development
Sample items are useful as educators engage in conversations about what students are expected to know and be able to do to demonstrate proficiency on the state assessments relative to the Wisconsin Academic Standards. Sample items can inform discussions about state and local standards, curriculum, instruction, and assessment.
Improving Instruction
Teachers may use sample items in classroom activities that help students understand how to
• review key vocabulary;
• solve problems;
• determine which answer choices are correct, which are incorrect, and why;
• approach long and/or multistep tasks;
• use good test-taking strategies.
Student Practice
Students may perform better and with less anxiety if they are familiar with the format of the test and with the types of items they will be required to answer. The Forward Exam is an online assessment; students will benefit from the use of the Online Tools Training in order to work within the system interface to answer items as they will appear on the assessment, as well as utilize the tools available to them in the online system.
Note: A student’s score on the practice test cannot be converted to a scale score, used to predict performance on the Forward Exam, or used to make inferences about the student’s learning.

Grade 8 Science Item Sampler 2
SCIENCE ITEM SAMPLER OVERVIEW
Test Preparation
While using the Item Sampler for test preparation, care should be taken that this is done in a balanced manner and one that helps to enhance student knowledge of subject matter as well as test performance. Please note that test preparation is only useful to the extent that it is also teaching content area knowledge and skills. Therefore, the use of this resource for test preparation is of limited value to students due to the narrow opportunity for content learning. It is very important to ensure that teachers are teaching to the curriculum and not to the test, as teaching to the test narrows the focus of instruction to only that content covered by the test.

3Grade 8 Science Item Sampler
SCIENCE ITEM SAMPLER OVERVIEW
DEPTH OF KNOWLEDGEHess’ Cog
nitiv
e Rigo
r Matrix
& Curric
ular Examples: A
pplying Web
b’s D
epth‐of‐K
nowledge Levels to
Bloom
’s Cognitiv
e Process D
imen
sions – M
‐Sci
Rev
ised
Blo
om’s
Ta
xono
my
Web
b’s
DO
K L
evel
1
Rec
all &
Rep
rodu
ctio
n W
ebb’
s D
OK
Lev
el 2
Sk
ills
& C
once
pts
Web
b’s
DO
K L
evel
3
Stra
tegi
c Th
inki
ng/ R
easo
ning
Web
b’s
DO
K L
evel
4
Exte
nded
Thi
nkin
g R
emem
ber
Ret
rieve
kno
wle
dge
from
lo
ng-te
rm m
emor
y, re
cogn
ize,
re
call,
loca
te, i
dent
ify
oR
ecal
l, ob
serv
e, &
reco
gniz
efa
cts,
prin
cipl
es, p
rope
rties
oR
ecal
l/ id
entif
y co
nver
sion
sam
ong
repr
esen
tatio
ns o
rnu
mbe
rs (e
.g.,
cust
omar
y an
dm
etric
mea
sure
s)U
nder
stan
d C
onst
ruct
mea
ning
, cla
rify,
pa
raph
rase
, rep
rese
nt,
trans
late
, illu
stra
te, g
ive
exam
ples
, cla
ssify
, cat
egor
ize,
su
mm
ariz
e, g
ener
aliz
e, in
fer a
lo
gica
l con
clus
ion
(suc
h as
fro
m e
xam
ples
giv
en),
pred
ict,
com
pare
/con
trast
, mat
ch li
ke
idea
s, e
xpla
in, c
onst
ruct
m
odel
s
oE
valu
ate
an e
xpre
ssio
no
Loca
te p
oint
s on
a g
rid o
rnu
mbe
r lin
eo
Sol
ve a
one
-ste
p pr
oble
mo
Rep
rese
nt m
ath
rela
tions
hips
inw
ords
, pic
ture
s or
sym
bols
oR
ead,
writ
e, c
ompa
re d
ecim
als
in s
cien
tific
not
atio
n
oS
peci
fy a
nd e
xpla
in re
latio
nshi
ps(e
.g.,
non-
exam
ples
/exa
mpl
es;
caus
e-ef
fect
)o
Mak
e an
d re
cord
obs
erva
tions
oE
xpla
in s
teps
follo
wed
oS
umm
ariz
e re
sults
or c
once
pts
oM
ake
basi
c in
fere
nces
or l
ogic
alpr
edic
tions
from
dat
a/ob
serv
atio
nso
Use
mod
els
/dia
gram
s to
repr
esen
tor
exp
lain
mat
hem
atic
al c
once
pts
oM
ake
and
expl
ain
estim
ates
oU
se c
once
pts
to s
olve
non
-rou
tine
prob
lem
so
Exp
lain
, gen
eral
ize,
or c
onne
ct id
eas
usin
g su
ppor
ting
evid
ence
oM
ake
and
just
ify c
onje
ctur
eso
Exp
lain
thin
king
whe
n m
ore
than
one
resp
onse
is p
ossi
ble
oE
xpla
in p
heno
men
a in
term
s of
conc
epts
oR
elat
e m
athe
mat
ical
or
scie
ntifi
c co
ncep
ts to
oth
erco
nten
t are
as, o
ther
dom
ains
,or
oth
er c
once
pts
oD
evel
op g
ener
aliz
atio
ns o
f the
resu
lts o
btai
ned
and
the
stra
tegi
es u
sed
(from
inve
stig
atio
n or
read
ings
) and
appl
y th
em to
new
pro
blem
situ
atio
ns
App
ly
Car
ry o
ut o
r use
a p
roce
dure
in
a g
iven
situ
atio
n; c
arry
out
(a
pply
to a
fam
iliar
task
), or
us
e (a
pply
) to
an u
nfam
iliar
ta
sk
oFo
llow
sim
ple
proc
edur
es(r
ecip
e-ty
pe d
irect
ions
)o
Cal
cula
te, m
easu
re, a
pply
a ru
le(e
.g.,
roun
ding
) o
App
ly a
lgor
ithm
or f
orm
ula
(e.g
.,ar
ea, p
erim
eter
) o
Sol
ve li
near
equ
atio
nso
Mak
e co
nver
sion
s am
ong
repr
esen
tatio
ns o
r num
bers
, or
with
in a
nd b
etw
een
cust
omar
yan
d m
etric
mea
sure
s
o o o
Sel
ect a
pro
cedu
re a
ccor
ding
to
crite
ria a
nd p
erfo
rm it
Sol
ve ro
utin
e pr
oble
m a
pply
ing
mul
tiple
con
cept
s or
dec
isio
n po
ints
R
etrie
ve in
form
atio
n fro
m a
tabl
e,
grap
h, o
r fig
ure
and
use
it to
sol
ve a
pr
oble
m re
quiri
ng m
ultip
le s
teps
oTr
ansl
ate
betw
een
tabl
es, g
raph
s,w
ords
, and
sym
bolic
not
atio
ns (e
.g.,
grap
h da
ta fr
om a
tabl
e)o
Con
stru
ct m
odel
s gi
ven
crite
ria
oD
esig
n in
vest
igat
ion
for a
spe
cific
purp
ose
or re
sear
ch q
uest
ion
oC
ondu
ct a
des
igne
d in
vest
igat
ion
oU
se c
once
pts
to s
olve
non
-rou
tine
prob
lem
so
Use
& s
how
reas
onin
g, p
lann
ing,
and
evid
ence
oTr
ansl
ate
betw
een
prob
lem
&sy
mbo
lic n
otat
ion
whe
n no
t a d
irect
trans
latio
n
oS
elec
t or d
evis
e ap
proa
cham
ong
man
y al
tern
ativ
es to
solv
e a
prob
lem
oC
ondu
ct a
pro
ject
that
spec
ifies
a p
robl
em, i
dent
ifies
solu
tion
path
s, s
olve
s th
epr
oble
m, a
nd re
ports
resu
lts
Ana
lyze
B
reak
into
con
stitu
ent p
arts
, de
term
ine
how
par
ts re
late
, di
ffere
ntia
te b
etw
een
rele
vant
-irre
leva
nt,
dist
ingu
ish,
focu
s, s
elec
t, or
gani
ze, o
utlin
e, fi
nd
cohe
renc
e, d
econ
stru
ct
oR
etrie
ve in
form
atio
n fro
m a
tabl
eor
gra
ph to
ans
wer
a q
uest
ion
oId
entif
y w
heth
er s
peci
ficin
form
atio
n is
con
tain
ed in
grap
hic
repr
esen
tatio
ns (e
.g.,
tabl
e, g
raph
, T-c
hart,
dia
gram
)o
Iden
tify
a pa
ttern
/tren
d
oC
ateg
oriz
e, c
lass
ify m
ater
ials
, dat
a,fig
ures
bas
ed o
n ch
arac
teris
tics
oO
rgan
ize
or o
rder
dat
ao
Com
pare
/ con
trast
figu
res
or d
ata
oS
elec
t app
ropr
iate
gra
ph a
ndor
gani
ze &
dis
play
dat
ao
Inte
rpre
t dat
a fro
m a
sim
ple
grap
ho
Ext
end
a pa
ttern
oC
ompa
re in
form
atio
n w
ithin
or
acro
ss d
ata
sets
or t
exts
oA
naly
ze a
nd d
raw
con
clus
ions
from
data
, citi
ng e
vide
nce
oG
ener
aliz
e a
patte
rno
Inte
rpre
t dat
a fro
m c
ompl
ex g
raph
oA
naly
ze s
imila
ritie
s/di
ffere
nces
betw
een
proc
edur
es o
r sol
utio
ns
oA
naly
ze m
ultip
le s
ourc
es o
fev
iden
ceo
Ana
lyze
com
plex
/abs
tract
them
eso
Gat
her,
anal
yze,
and
eva
luat
ein
form
atio
n
Eval
uate
M
ake
judg
men
ts b
ased
on
crite
ria, c
heck
, det
ect
inco
nsis
tenc
ies
or fa
llaci
es,
judg
e, c
ritiq
ue
oC
ite e
vide
nce
and
deve
lop
a lo
gica
lar
gum
ent f
or c
once
pts
or s
olut
ions
oD
escr
ibe,
com
pare
, and
con
trast
solu
tion
met
hods
oV
erify
reas
onab
lene
ss o
f res
ults
oG
athe
r, an
alyz
e, &
eva
luat
ein
form
atio
n to
dra
wco
nclu
sion
so
App
ly u
nder
stan
ding
in a
nov
elw
ay, p
rovi
de a
rgum
ent o
rju
stifi
catio
n fo
r the
app
licat
ion
Cre
ate
Reo
rgan
ize
elem
ents
into
ne
w p
atte
rns/
stru
ctur
es,
gene
rate
, hyp
othe
size
, de
sign
, pla
n, c
onst
ruct
, pr
oduc
e
oB
rain
stor
m id
eas,
con
cept
s, o
rpe
rspe
ctiv
es re
late
d to
a to
pic
oG
ener
ate
conj
ectu
res
or h
ypot
hese
sba
sed
on o
bser
vatio
ns o
r prio
rkn
owle
dge
and
expe
rienc
e
oS
ynth
esiz
e in
form
atio
n w
ithin
one
data
set
, sou
rce,
or t
ext
oFo
rmul
ate
an o
rigin
al p
robl
em g
iven
asi
tuat
ion
oD
evel
op a
sci
entif
ic/m
athe
mat
ical
mod
el fo
r a c
ompl
ex s
ituat
ion
oS
ynth
esiz
e in
form
atio
n ac
ross
mul
tiple
sou
rces
or t
exts
oD
esig
n a
mat
hem
atic
al m
odel
to in
form
and
sol
ve a
pra
ctic
alor
abs
tract
situ
atio
n
© 2
009
Kar
in K
. Hes
s per
mis
sion
to re
prod
uce
is g
iven
whe
n au
thor
ship
is fu
lly c
ited
khe
ss@
ncie
a.or
g

Grade 8 Science Item Sampler 4
SCIENCE ITEM SAMPLER OVERVIEW
ITEM TYPES
The Wisconsin Forward Exam has multiple types of test items. However, because this item sampler is in a format that can be printed, the majority of its items are multiple-choice. In the Forward Exam, there will be a more diverse array of item types, including the ones described below.
Selected-Response (SR) Items
Selected-Response (SR) items are an efficient method for measuring a broad range of content, and can be used to assess a variety of skills. Three types of SR items are used on the online assessments: Multiple-Choice (MC), Enhanced Selected-Response (ESR), and Evidence-Based Selected-Response (EBSR). In all cases, SR items require that a student determines the correct answer(s) to the item posed from a provided list. While it is still possible for a student to perform some work directly related to determining the correct answer, the student is not required to generate the content of the answer when responding to a Selected-Response item. An exception to this requirement is Mathematics Short-Response/Gridded-Response items where students will be required to enter a short alphanumeric response.
Multiple-Choice (MC) Items
Multiple-Choice (MC) items on Wisconsin’s assessments have four answer choices, including three distractors and one correct answer. Distractors for Mathematics represent common misconceptions, incorrect logic, incorrect application of an algorithm, computational errors, etc. Distractors for English Language Arts (ELA) are written to represent a common misinterpretation, predisposition, unsound reasoning, casual reading, etc. A correct response to an MC item is worth one raw point. The process skills, directives, and action statements within an MC item also specifically align with the Wisconsin Academic Standards. Multiple-Choice items are present in all grades and are used with all content areas.
Multiple-Choice items can be further defined by being linked to, or independent from, a stimulus source. Items that operate independent of a stimulus are also known as “stand-alone MC.” Stand-alone items may still have tables, graphs, or other information used in support of the stem. English Language Arts uses a mixture of MC items linked to a stimulus passage and some that are stand-alone. For Mathematics, all MC items are considered stand-alone.
Enhanced Selected-Response (ESR) Items
The Enhanced Selected-Response (ESR) items are multi-part autoscored items that may consist of varying combinations of Multiple-Choice, Multiple-Response, Gridded-Response, Completion or Short-Answer, and Technology-Enhanced items that explore in greater depth and cognitive complexity the knowledge, skills, and abilities specified by the standards of each content area. Typically, this item type has a common focus and explores authentic problem-solving skills. An example of a Statistics and Probability Mathematics ESR item would utilize a data-table stimulus with Part A using a Technology-Enhanced (TE) graphing tool to create a bar graph of the data presented and Part B asking students to calculate the mean of the data using a Short-Response item.
Two-Part Evidence-Based Selected-Response (EBSR) Items
The Evidence-Based Selected-Response (EBSR) items have two parts and are designed to elicit a response based on what a student has read from a stimulus passage. EBSR items may be linked to a stimulus passage or to a stimulus passage set. There are several variations of two-part EBSR items, but all two-part EBSR items have an Accuracy piece and an Evidence piece.
5Grade 8 Science Item Sampler
SCIENCE ITEM SAMPLER OVERVIEW
The Accuracy piece of the item is Part A. Part A of a typical EBSR item will be similar to a standard MC test item. A student analyzes a passage and chooses a single, best (correct) answer from four answer choices. Part B of a typical EBSR item will elicit evidence from the stimulus passage and will require that the student selects one or more correct answers based on the response the student provided to Part A. Part B is also different from Part A in that it may have five or six answer options rather than just four answer options typical of an MC item and more than one option may be correct.
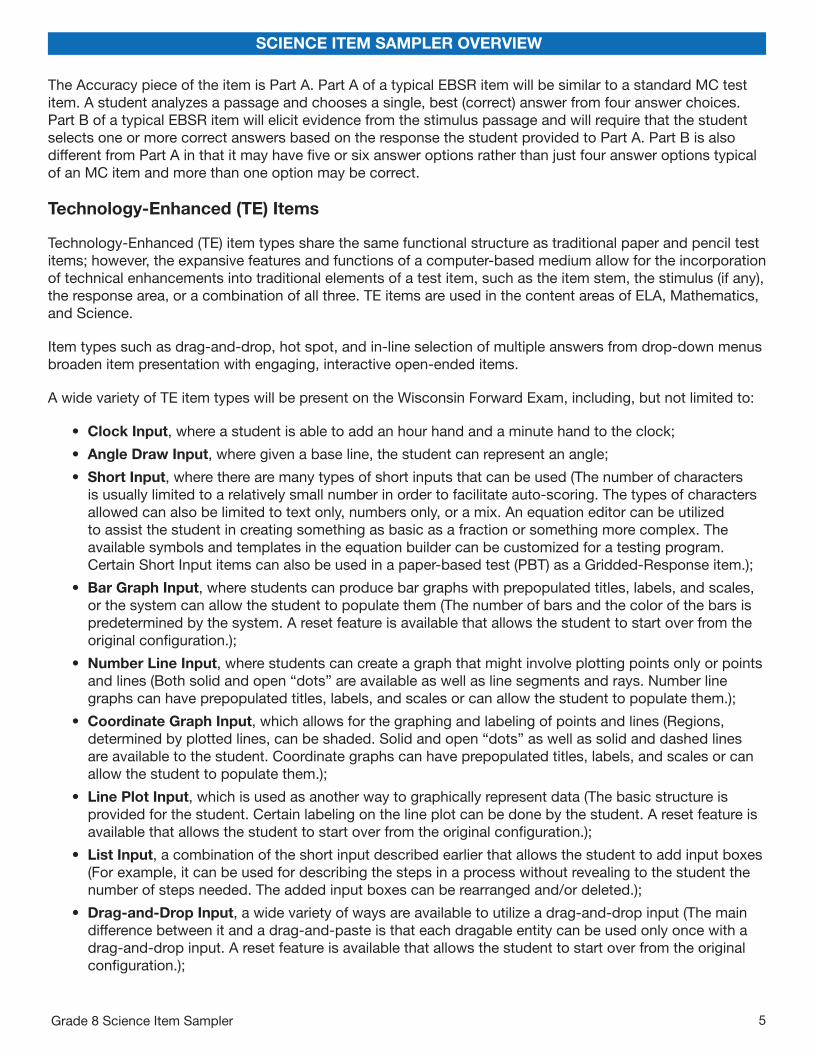
Technology-Enhanced (TE) Items
Technology-Enhanced (TE) item types share the same functional structure as traditional paper and pencil test items; however, the expansive features and functions of a computer-based medium allow for the incorporation of technical enhancements into traditional elements of a test item, such as the item stem, the stimulus (if any), the response area, or a combination of all three. TE items are used in the content areas of ELA, Mathematics, and Science.
Item types such as drag-and-drop, hot spot, and in-line selection of multiple answers from drop-down menus broaden item presentation with engaging, interactive open-ended items.
A wide variety of TE item types will be present on the Wisconsin Forward Exam, including, but not limited to:
• Clock Input, where a student is able to add an hour hand and a minute hand to the clock;
• Angle Draw Input, where given a base line, the student can represent an angle;
• Short Input, where there are many types of short inputs that can be used (The number of characters is usually limited to a relatively small number in order to facilitate auto-scoring. The types of characters allowed can also be limited to text only, numbers only, or a mix. An equation editor can be utilized to assist the student in creating something as basic as a fraction or something more complex. The available symbols and templates in the equation builder can be customized for a testing program. Certain Short Input items can also be used in a paper-based test (PBT) as a Gridded-Response item.);
• Bar Graph Input, where students can produce bar graphs with prepopulated titles, labels, and scales, or the system can allow the student to populate them (The number of bars and the color of the bars is predetermined by the system. A reset feature is available that allows the student to start over from the original configuration.);
• Number Line Input, where students can create a graph that might involve plotting points only or points and lines (Both solid and open “dots” are available as well as line segments and rays. Number line graphs can have prepopulated titles, labels, and scales or can allow the student to populate them.);
• Coordinate Graph Input, which allows for the graphing and labeling of points and lines (Regions, determined by plotted lines, can be shaded. Solid and open “dots” as well as solid and dashed lines are available to the student. Coordinate graphs can have prepopulated titles, labels, and scales or can allow the student to populate them.);
• Line Plot Input, which is used as another way to graphically represent data (The basic structure is provided for the student. Certain labeling on the line plot can be done by the student. A reset feature is available that allows the student to start over from the original configuration.);
• List Input, a combination of the short input described earlier that allows the student to add input boxes (For example, it can be used for describing the steps in a process without revealing to the student the number of steps needed. The added input boxes can be rearranged and/or deleted.);
• Drag-and-Drop Input, a wide variety of ways are available to utilize a drag-and-drop input (The main difference between it and a drag-and-paste is that each dragable entity can be used only once with a drag-and-drop input. A reset feature is available that allows the student to start over from the original configuration.);

Grade 8 Science Item Sampler 6
SCIENCE ITEM SAMPLER OVERVIEW
• Drag-and-Paste Input, a wide variety of ways are available to utilize drag-and-paste input (The main difference between it and a drag-and-drop is that each dragable entity can be used more than once with a drag-and-paste input. A reset feature is available that allows the student to start over from the original configuration.);
• Drop-Down List Input, allows for the creation of a situation where a great deal of information about a student’s grasp of a concept can be determined with a single item (Students can be asked to choose from three function types, four number of real zero responses, and two inverse function responses. For one function alone, this provides 24 possible answer combinations. With the three functions, a considerable amount of information can be gained, making this almost an open-ended item type.);
• Pictograph using Drag-and-Paste, actually another example of drag-and-paste, but is worth mentioning on its own as it is a type of graphing often used at lower grade levels;
• Circle Graph, a graph that allows the student to create and label the “wedges” that represent the data (Circle graphs can have a prepopulated title or can allow the student to populate it. The color of the “wedges” is predetermined by the system.);
• Matching, allows for the use of text or graphics as the matching objects (The student clicks on one object and then clicks on a second object to connect them.);
• Highlighting Text, allows for designated text to be highlighted in a word, phrase, sentence, or paragraph; and the
• Graphic Modification Hot Spot, allows for one image to replace another image when a hot spot is clicked.
Text-Dependent Analysis (TDA) Items
The English Language Arts (ELA) section of the Forward Exam presents students with a Text-Dependent Analysis (TDA) item. A TDA is a text-based analysis based on a single passage or a multiple passage set that each student has read during the assessment. The passage or passage set will consist of either literary or informational text. In order to successfully answer a TDA, students must analyze and use information from the passage(s) to plan a comprehensive, holistic response. Students will then write their response including supporting evidence from the passage(s). Students will have up to 5,000 characters to formulate their response. Students’ responses are scored using a rubric that takes into account both the composition and the conventions of the student’s writing.
The TDA portion of the Forward Exam requires students to read the text and then respond in writing in one of two ways:
• identifying and explaining a theme or central idea, using textual evidence to support the claim about what that theme or central idea is, or
• analyzing the development of an event, character, central ideas, or theme, using textual evidence to support the explanation and analysis.
TDA Item Samplers are available at https://dpi.wi.gov/assessment/forward/sample-items.

7Grade 8 Science Item Sampler
THIS PAGE IS INTENTIONALLY BLANK.

Grade 8 Science Item Sampler 8
Go on to the next page.
SCIENCE ITEMS—SESSION 1
SCENARIO 1
Read the following scenario. Then answer items 1 through 5. You may look back at the scenario to help you answer the items.
Safeguarding Wisconsin’s Streams
After the quiet of a Wisconsin winter, being streamside in spring sounds like a festival. The chorus of frogs, calls of songbirds and waterbirds, and buzzing of insects are evidence of the life teeming along these waterways. The wildlife depends upon these streams and their bankside vegetation for food, cover, and shelter. At dusk, certain mammals like raccoons and foxes emerge from their forested shelter to find food in shallow pools of water or in nearby fields.
Wisconsin has a wealth of freshwater streams. Beyond their rich ecological value, they provide recreational opportunities for humans who enjoy fishing, canoeing, or kayaking. Farmers value streams for irrigating fields. Residential developers recognize the appeal of streams for property owners. Land along streams is in high demand.
However, these demands can put Wisconsin streams at risk. Ecologists use the following landscape characteristics to help evaluate stream health:
• percentage of wetlands remaining • percentage of natural land cover remaining • number of hubs (patches of unbroken natural areas) and corridors (undisturbed areas between hubs
used for migration or local movement of organisms)
Areas with high percentages of these characteristics support healthy streams—and, consequently, entire ecosystems. Preserving streamside vegetation areas (called buffer zones) helps prevent erosion and provides wildlife habitat. Maintaining streamside forests and wetlands also provides habitat for mammals, birds, and insects. Preventing livestock access to streams limits erosion and reduces bacterial pollution. Each of these land-use actions can have a meaningful impact on stream health and help safeguard Wisconsin’s streams.

9Grade 8 Science Item Sampler
SCIENCE ITEMS—SESSION 1
Go on to the next page.
1 . The food web below shows some of the ecosystem interactions in a Wisconsin stream. Some of the organisms compete for the same food sources.
Stream Food Webriver otter great blue
heron
brown trout frog
mayfly
phytoplankton
zooplankton
minnow
How many other organisms from the stream food web does the great blue heron compete with for brown trout?
A. one
B. two
C. three
D. five
Grade 8 Science Item Sampler 10
SCIENCE ITEMS—SESSION 1
Go on to the next page.
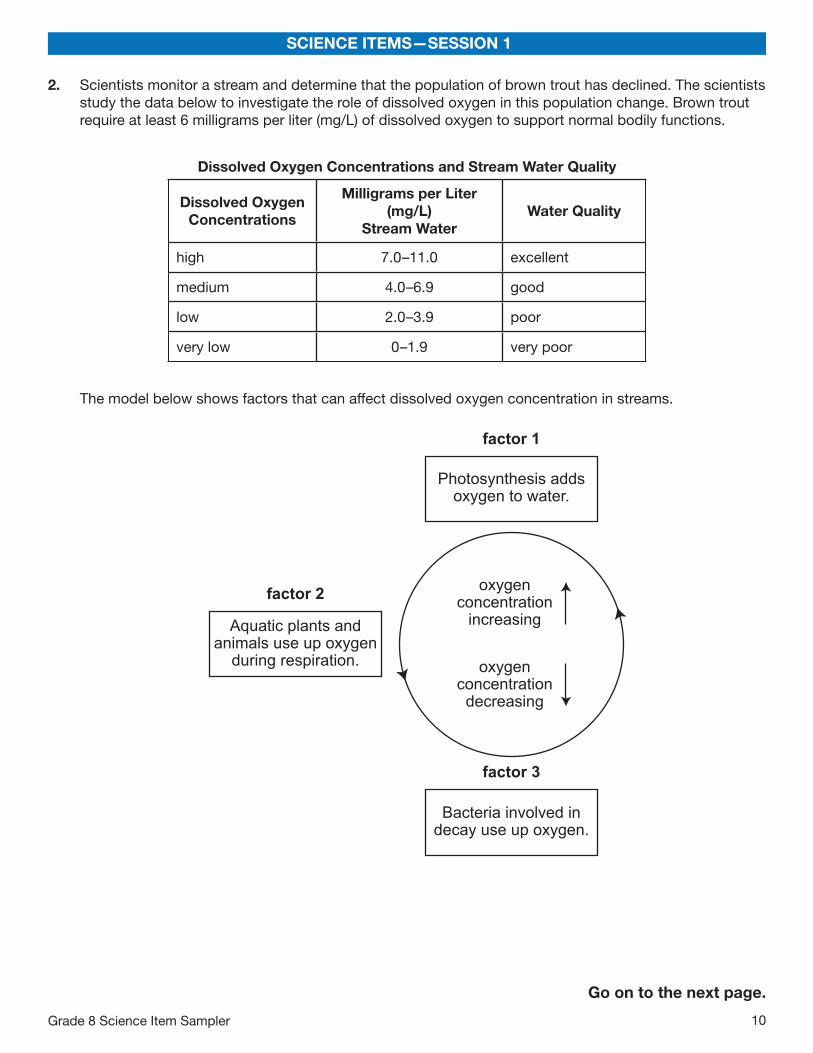
2 . Scientists monitor a stream and determine that the population of brown trout has declined. The scientists study the data below to investigate the role of dissolved oxygen in this population change. Brown trout require at least 6 milligrams per liter (mg/L) of dissolved oxygen to support normal bodily functions.
Dissolved Oxygen Concentrations and Stream Water Quality
Dissolved Oxygen Concentrations
Milligrams per Liter (mg/L)
Stream WaterWater Quality
high 7.0 –11.0 excellent
medium 4.0 –6.9 good
low 2.0 –3.9 poor
very low 0 –1.9 very poor
The model below shows factors that can affect dissolved oxygen concentration in streams.
Aquatic plants andanimals use up oxygen
during respiration.
Photosynthesis addsoxygen to water.
Bacteria involved indecay use up oxygen.
oxygenconcentration
increasing
oxygenconcentrationdecreasing
factor 2
factor 1
factor 3

11Grade 8 Science Item Sampler
SCIENCE ITEMS—SESSION 1
Go on to the next page.
How has the dissolved oxygen concentration in the stream most likely changed, and which factors in the model are most likely contributing to the decline in the brown trout population?
A. change in dissolved oxygen concentration in stream: increased factors contributing to population decline: 1 and 2
B. change in dissolved oxygen concentration in stream: increased factors contributing to population decline: 2 and 3
C. change in dissolved oxygen concentration in stream: decreased factors contributing to population decline: 1 and 2
D. change in dissolved oxygen concentration in stream: decreased factors contributing to population decline: 2 and 3

Grade 8 Science Item Sampler 12
SCIENCE ITEMS—SESSION 1
Go on to the next page.
3 . The map below shows results of landscape research in Wisconsin, which is used to help evaluate stream health. The map shows an index of landscape condition, which is based on the percentage of wetlands and natural land cover remaining and the number of hubs and corridors. “High” indicates the best landscape condition.
Wisconsin Landscape Condition Index
Keyhigh
medium
low
NW E
S
Which argument about stream health in Wisconsin is best supported by evidence?
A. Stream health in northern Wisconsin is most likely better than that in southern Wisconsin because the landscape in northern Wisconsin has more buffer-zone areas around streams and more acres of fragmented landscape.
B. Stream health in northern Wisconsin is most likely better than that in southern Wisconsin because the landscape in northern Wisconsin has more buffer-zone areas around streams and more acres of undisturbed landscape.
C. Stream health in northern Wisconsin is most likely worse than that in southern Wisconsin because the landscape in northern Wisconsin has fewer buffer-zone areas around streams and more acres of fragmented landscape.
D. Stream health in northern Wisconsin is most likely worse than that in southern Wisconsin because the landscape in northern Wisconsin has fewer buffer-zone areas around streams and more acres of undisturbed landscape.

13Grade 8 Science Item Sampler
SCIENCE ITEMS—SESSION 1
Go on to the next page.
4 . Livestock can harm streams when their hooves erode soil, which ends up in the stream. The soil reduces water clarity, harming plants and animals that live in the water. Several farmers are designing a process to minimize the impact of their livestock on a local stream.
Which table shows checked boxes next to two actions the farmers can take to reduce streambank erosion?
A.
B.
C.
D.
layer rocks along path to the streamselect a steep area for cattle to access the streamprovide access along the entire length of the streaminstall a livestock watering system away from the stream
layer rocks along path to the streamselect a steep area for cattle to access the streamprovide access along the entire length of the streaminstall a livestock watering system away from the stream
layer rocks along path to the streamselect a steep area for cattle to access the streamprovide access along the entire length of the streaminstall a livestock watering system away from the stream
layer rocks along path to the streamselect a steep area for cattle to access the streamprovide access along the entire length of the streaminstall a livestock watering system away from the stream

Grade 8 Science Item Sampler 14
SCIENCE ITEMS—SESSION 1
Go on to the next page.
5 . A residential developer is planning to build some houses on a property next to a wetland with a pond and a stream. The criteria for the project are listed below:
• six lots for houses • intact forested areas • forested area between wetland and lots for houses
The diagrams below show two designs for the project.
house lot line
Design 1
pond
wetland
forest
house lot line
Design 2
pond
wetland
forest
Which statement best explains why one of the designs is more appropriate for the project?
A. Design 1 is more appropriate because it provides each house with access to the wetland.
B. Design 1 is more appropriate because it provides larger lot sizes with more forest areas.
C. Design 2 is more appropriate because it provides each house with privacy on all sides.
D. Design 2 is more appropriate because it provides wetland protection with uninterrupted forest areas.

15Grade 8 Science Item Sampler
SCIENCE ITEMS—SESSION 1
Go on to the next page.
SCENARIO 2
Read the following scenario. Then answer items 6 through 8. You may look back at the scenario to help you answer the items.
It’s Electric!
Have you ever shuffled your feet along a carpeted floor and then touched another person—giving him or her a small electric shock? The shock is caused by static electricity. The production of static electricity can be magnified in a classroom or laboratory with a machine called a Van de Graaff generator.
A Van de Graaff generator has moving parts that transfer electrons (electrically charged particles) and other parts that remove and store those charges. The diagram below shows parts and charges in a Van de Graaff generator.
Van de Graaff Generator
spark
dischargewand
ground electrodewith brush
metalroller
acrylicroller
electrodewith brush
hollow metalsphere
+
+ +++ ++
+++
---------
----------
+
+++
+++
+ ++
+
+
+ +
rubber belt
Each side of the rubber belt is charged differently. Positive charges are picked off the belt by the brush along the acrylic roller. These charges are transferred along the electrode and stored in the hollow metal sphere until discharge. The negative charges on the belt return to the metal roller at the bottom of the generator where they are picked off by the brush attached to the ground electrode. Discharge occurs when the negatively charged wand is brought close to the sphere and a spark is produced.

Grade 8 Science Item Sampler 16
SCIENCE ITEMS—SESSION 1
Go on to the next page.
Similarly, a person can discharge the generator. But safety is critical—the person must stand on an electrical insulator when discharging the metal sphere to avoid receiving an electric shock. The picture below shows a teacher demonstrating how discharging the Van de Graaff generator can make hair stand on end. That is hair-raising fun!
Teacher DemonstratingVan de Graaff Generator

17Grade 8 Science Item Sampler
SCIENCE ITEMS—SESSION 1
Go on to the next page.
6 . A student observes that getting shocked after shuffling across carpet occurs more often in winter than in summer. The student researches some factors that can affect static electricity, and the findings are shown below.
Fact: Humidity (measure of moisture in the air) affects electron flow between objects.
Fact: Moisture in the air creates a path for electron flow between objects.
Winter Summer
lower humidity higher humidity
The student wants to investigate the relationship between humidity and static electricity using a Van de Graaff generator and a discharge wand. Which question can the student investigate using a Van de Graaff generator and a discharge wand?
A. Does humidity affect the distance from one end of a spark produced by the Van de Graaff generator to the other end of the spark?
B. Does humidity affect the number of electrons produced by a Van de Graaff generator?
C. Does the humidity change based on the distance of the wand from the Van de Graaff generator?
D. Does the humidity change based on the size of the Van de Graaff generator?

Grade 8 Science Item Sampler 18
SCIENCE ITEMS—SESSION 1
Go on to the next page.
7 . A student conducts an investigation to understand a particular type of force. The student moves a discharge wand toward the metal sphere of a Van de Graaff generator while it is operating.
Part A
Which type of force is the student investigating?
A. electric
B. frictional
C. gravitational
D. magnetic
Part B
Which piece of evidence best supports the idea that the discharge wand and metal sphere can exert forces on each other without being in contact?
A. The discharge wand is connected to the generator by a wire.
B. The distance is reduced from the discharge wand to the metal sphere.
C. A spark is released when the discharge wand moves toward the metal sphere.
D. A sound is produced when the generator is turned on and the rubber belt moves.

19Grade 8 Science Item Sampler
SCIENCE ITEMS—SESSION 1
STOP.
8 . A student develops an experiment to demonstrate the interaction of forces by using a Van de Graaff generator.
Which observation from this experiment best shows evidence of forces interacting?
A. The insulating base is made of rubber.
B. The metal sphere on the Van de Graaff generator feels cold.
C. The discharge wand is connected to the Van de Graaff generator.
D. The student’s hair rises and stands on end.

Grade 8 Science Item Sampler 20
SCIENCE ITEMS—SESSION 1
STOP.

21Grade 8 Science Item Sampler
SCIENCE ITEMS—SESSION 1
STOP.

Grade 8 Science Item Sampler 22
Go on to the next page.
SCIENCE ITEMS—SESSION 2
SCENARIO 1
Read the following scenario. Then answer items 1 through 3. You may look back at the scenario to help you answer the items.
Iceland
Iceland provides an amazing geologic laboratory for scientists. It is one of the few places on Earth where scientists can study seafloor spreading—above sea level. This is because Iceland is a product of volcanic activity along the Mid-Atlantic Ridge. The map below shows the path of the Mid-Atlantic Ridge through Iceland and the location of the country’s major volcanoes.
Major Volcanoes in Iceland
Atlantic Ocean
North AmericanPlate
EurasianPlate
Mid-Atlantic RidgeKey
NW E
S
Iceland is positioned along a divergent boundary where the North American and Eurasian Plates are moving away from one another. This divergence occurs as a result of convection in Earth’s mantle. New, hot magma rises through Earth’s mantle and escapes through cracks in Earth’s crust. When the magma cools, it forms new crust.

23Grade 8 Science Item Sampler
SCIENCE ITEMS—SESSION 2
Go on to the next page.
1 . Compare the two locations on the map of Iceland below with the Major Volcanoes in Iceland map in the scenario.
2
1
NW E
S
Which statement best compares the locations on the map?
A. Location 1 is more likely than location 2 to experience a volcanic eruption because it is surrounded by water.
B. Location 1 is more likely than location 2 to experience an earthquake because it is on a plate moving to the west.
C. Location 2 is more likely than location 1 to experience a volcanic eruption because it is closer to the Mid-Atlantic Ridge.
D. Location 2 is more likely than location 1 to experience an earthquake because it has a larger surrounding landmass.

Grade 8 Science Item Sampler 24
SCIENCE ITEMS—SESSION 2
Go on to the next page.
2 . The model below shows a cross section of Earth layers beneath Iceland.
Atlantic Oceanmovement of crust
Iceland
mantle
Part A
Which cross section with arrows best shows the cycling of matter within the mantle beneath Iceland?
A.
B.
C.
D.
25Grade 8 Science Item Sampler
SCIENCE ITEMS—SESSION 2
Go on to the next page.
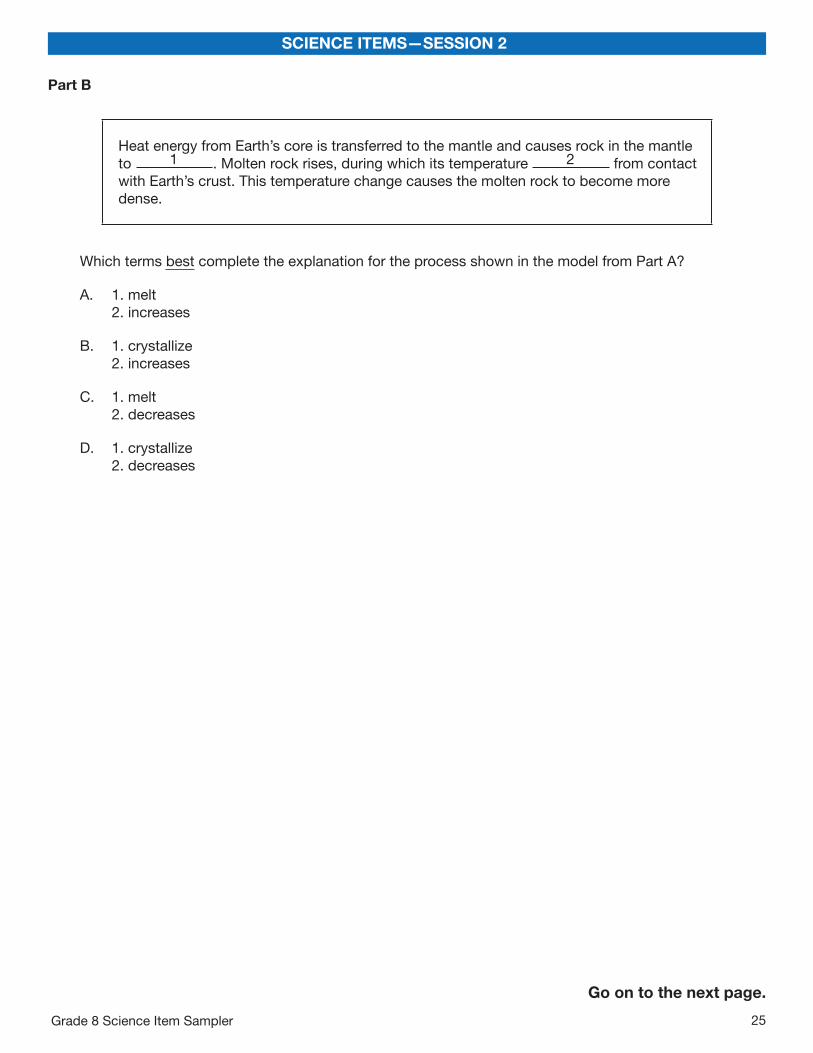
Part B
Heat energy from Earth’s core is transferred to the mantle and causes rock in the mantle to 1 . Molten rock rises, during which its temperature 2 from contact with Earth’s crust. This temperature change causes the molten rock to become more dense.
Which terms best complete the explanation for the process shown in the model from Part A?
A. 1. melt 2. increases
B. 1. crystallize 2. increases
C. 1. melt 2. decreases
D. 1. crystallize 2. decreases

Grade 8 Science Item Sampler 26
SCIENCE ITEMS—SESSION 2
Go on to the next page.
3 . A student observes the model of the Mid-Atlantic Ridge below.
Age of Oceanic Crust (million years)
1.65 1.6500.7 0.70.9 0.9
Mid-AtlanticRidge
magma
Which statement provides evidence for the process shown in the model?
A. As the plates move apart, the oceanic crust gets older as the distance from the Mid-Atlantic Ridge increases.
B. As the plates move apart, the oceanic crust gets younger as the distance from the Mid-Atlantic Ridge increases.
C. As the plates move apart, the oceanic crust melts as the distance from the Mid-Atlantic Ridge increases.
D. As the plates move apart, the oceanic crust erodes as the distance from the Mid-Atlantic Ridge increases.

27Grade 8 Science Item Sampler
SCIENCE ITEMS—SESSION 2
Go on to the next page.
STANDALONE ITEMS
4 . In a population of plants, a mutation allows one plant to grow taller than usual. As a result, the plant receives more sunlight than other plants in the area.
Which list correctly shows the terms that should be added to the model to show the energy transfer process in which this plant’s height gives it an advantage?
3
1
4
2
E. 1. electromagnetic waves 2. carbon dioxide 3. sugars 4. oxygen
F. 1. oxygen 2. sugars 3. carbon dioxide 4. electromagnetic waves
G. 1. electromagnetic waves 2. sugars 3. carbon dioxide 4. oxygen
H. 1. oxygen 2. carbon dioxide 3. sugars 4. electromagnetic waves

Grade 8 Science Item Sampler 28
SCIENCE ITEMS—SESSION 2
STOP.
5 . A student examines the data table shown.
PlanetDistance from the Sun
(x 1,000,000 km)
Jupiter 778.6
Saturn 1,433.5
Uranus 2,872.5
These data allow the student to produce which type of diagram?
A. a diagram comparing the compositions of planets
B. a diagram comparing the surface features and temperatures of planets
C. a diagram comparing the locations of planets in the solar system
D. a diagram comparing the sizes of planets

29Grade 8 Science Item Sampler
SCIENCE ITEMS—SESSION 2
STOP.

Grade 8 Science Item Sampler 30
SCIENCE—APPENDIX
SUMMARY DATA
Grade 8
Sample Number
AlignmentAnswer
KeyDepth of
KnowledgeAnnotations
Session 1
1 PE: MS-LS2-2;
SEP: Constructing Explanations and Designing Solutions;
DCI: LS2.A;
CCC: Patterns
A 2 A. Correct. The great blue heron competes with the river otter for brown trout.
B. The brown trout has two predators shown in the food web.
C. The brown trout consumes three organisms shown in the food web.
D. The brown trout has interactions with five other organisms shown in the food web.
2 PE: MS-LS2-1;
SEP: Analyzing and Interpreting Data;
DCI: LS2.A;
CCC: Cause and Effect
D 2 A. The dissolved oxygen concentration most likely decreased, not increased, in the stream; and photosynthesis adds oxygen to water, which would not cause the brown trout population to decline.
B. The dissolved oxygen concentration most likely decreased, not increased, in the stream.
C. Photosynthesis adds oxygen to water, which would not cause the brown trout population to decline.
D. Correct. The dissolved oxygen concentration most likely decreased in the stream; and the factors that use up oxygen in streams most likely contributed to the decline in the brown trout population.

31Grade 8 Science Item Sampler
SCIENCE—APPENDIX
Grade 8
Sample Number
AlignmentAnswer
KeyDepth of
KnowledgeAnnotations
3 PE: MS-LS2-4;
SEP: Engaging in Argument from Evidence;
DCI: LS2.C;
CCC: Stability and Change
B 3 A. Northern Wisconsin has a high landscape condition as shown on the map, which means more acres of undisturbed landscape, not fragmented landscape.
B. Correct. Northern Wisconsin has a high landscape condition as shown on the map, which means more buffer-zone areas around streams and more acres of undisturbed landscape.
C. Northern Wisconsin has a high landscape condition as shown on the map, which means it most likely has better stream health and more buffer-zone areas, not fewer buffer-zone areas, and more acres of undisturbed landscape, not fragmented landscape.
D. Northern Wisconsin has a high landscape condition as shown on the map, which means it most likely has better stream health and more buffer-zone areas, not fewer buffer-zone areas.
4 PE: MS-ESS3-3;
SEP: Constructing Explanations and Designing Solutions;
DCI: ESS3.C;
CCC: Cause and Effect
C 2 A. Selecting a steep area for cattle to access the stream may increase streambank erosion when hooves erode soil on the hill, which ends up in the stream.
B. Providing livestock with access along the entire length of the stream may increase erosion when hooves erode soil along the streambank, which ends up in the stream.
C. Correct. Layering rocks along the path to the stream and installing a livestock watering system away from the stream are actions that can reduce streambank erosion by minimizing the impact of livestock.
D. Selecting a steep area for cattle to access the stream may increase streambank erosion when hooves erode soil on the hill, which ends up in the stream.

Grade 8 Science Item Sampler 32
SCIENCE—APPENDIX
Grade 8
Sample Number
AlignmentAnswer
KeyDepth of
KnowledgeAnnotations
5 PE: MS-ETS1-2;
SEP: Engaging in Argument from Evidence;
DCI: ETS1.B
D 2 A. Design 2 is more appropriate; providing each house with access to the wetland is not a criterion for the project.
B. Design 2 is more appropriate; providing larger lot sizes with more forested areas is not a criterion for the project.
C. Providing each house with privacy on all sides is not a criterion for the project.
D. Correct. Design 2 keeps more forested areas intact and provides forested area between the wetland and the house lots.
6 PE: MS-PS2-3;
SEP: Asking Questions and Defining Problems;
DCI: PS2.B;
CCC: Cause and Effect
A 2 A. Correct. The student can measure the distance between the Van de Graaff generator and the end of a spark at different humidity levels.
B. Humidity affects the flow of electrons, which is related to discharge, not the number of electrons produced by the generator.
C. This question suggests a misconception about the relationship.
D. This question suggests a misconception about the relationship.

33Grade 8 Science Item Sampler
SCIENCE—APPENDIX
Grade 8
Sample Number
AlignmentAnswer
KeyDepth of
KnowledgeAnnotations
7 PE: MS-PS2-5;
SEP: Planning and Carrying Out Investigations;
DCI: PS2.B;
CCC: Cause and Effect
Part A: A
Part B: C
2 Part A
A. Correct. The student is investigating electric force using a Van de Graaff generator.
B. The student is not investigating frictional force using a Van de Graaff generator.
C. The student is not investigating gravitational force using a Van de Graaff generator.
D. The student is not investigating magnetic force using a Van de Graaff generator.
Part B
A. The discharge wand wire is connected to the ground electrode.
B. Reducing the distance between the wand and the sphere does not provide evidence that the wand and sphere can exert force on each other without touching.
C. Correct. The release of a spark indicates that the wand and the sphere can exert force on each other without touching.
D. The sound produced when the Van de Graaff generator is operating does not provide evidence that the wand and sphere can exert force on each other without touching.
Grade 8 Science Item Sampler 34
SCIENCE—APPENDIX
Grade 8
Sample Number
AlignmentAnswer
KeyDepth of
KnowledgeAnnotations
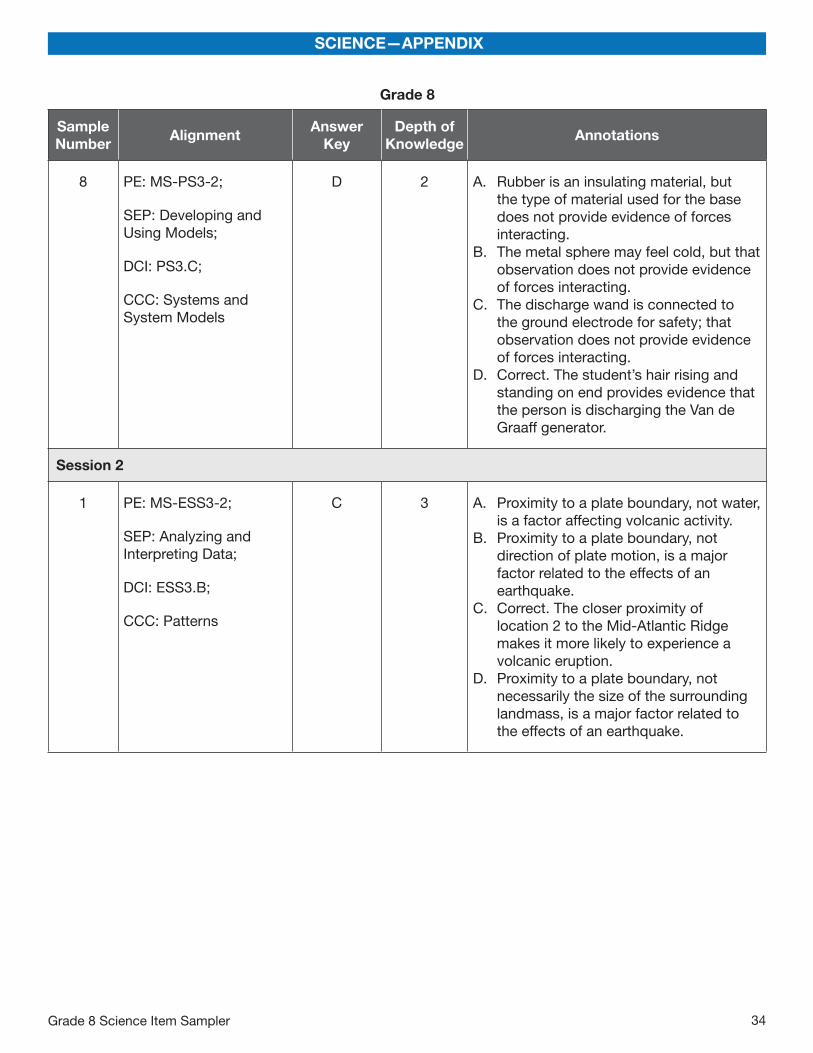
8 PE: MS-PS3-2;
SEP: Developing and Using Models;
DCI: PS3.C;
CCC: Systems and System Models
D 2 A. Rubber is an insulating material, but the type of material used for the base does not provide evidence of forces interacting.
B. The metal sphere may feel cold, but that observation does not provide evidence of forces interacting.
C. The discharge wand is connected to the ground electrode for safety; that observation does not provide evidence of forces interacting.
D. Correct. The student’s hair rising and standing on end provides evidence that the person is discharging the Van de Graaff generator.
Session 2
1 PE: MS-ESS3-2;
SEP: Analyzing and Interpreting Data;
DCI: ESS3.B;
CCC: Patterns
C 3 A. Proximity to a plate boundary, not water, is a factor affecting volcanic activity.
B. Proximity to a plate boundary, not direction of plate motion, is a major factor related to the effects of an earthquake.
C. Correct. The closer proximity of location 2 to the Mid-Atlantic Ridge makes it more likely to experience a volcanic eruption.
D. Proximity to a plate boundary, not necessarily the size of the surrounding landmass, is a major factor related to the effects of an earthquake.

35Grade 8 Science Item Sampler
SCIENCE—APPENDIX
Grade 8
Sample Number
AlignmentAnswer
KeyDepth of
KnowledgeAnnotations
2 PE: MS-ESS2-1;
SEP: Developing and Using Models;
DCI: ESS2.A
Part A: B
Part B: C
2 Part A
A. This model of convection within the mantle indicates a convergent plate boundary.
B. Correct. This model of convection within the mantle indicates a divergent plate boundary.
C. This model incorrectly represents the cycling of matter within the mantle beneath Iceland; matter does cycle up and down in relation to the crust, but it moves in a rising convection current.
D. This model incorrectly represents the cycling of matter within the mantle beneath Iceland; matter moves in a rising convection current, not laterally beneath the crust.
Part B
A. When rising molten rock contacts Earth’s crust, its temperature decreases, not increases.
B. Heat energy from Earth’s core causes rock in the mantle to melt, not crystallize; when rising molten rock contacts Earth’s crust, its temperature decreases, not increases.
C. Correct. Heat energy from Earth’s core causes rock in the mantle to melt and flow; when rising molten rock contacts Earth’s crust, its temperature decreases.
D. Heat energy from Earth’s core causes rock in the mantle to melt, not crystallize.

Grade 8 Science Item Sampler 36
SCIENCE—APPENDIX
Grade 8
Sample Number
AlignmentAnswer
KeyDepth of
KnowledgeAnnotations
3 PE: MS-ESS2-3;
SEP: Analyzing and Interpreting Data;
DCI: ESS2.B
A 2 A. Correct. According to the theory of sea floor spreading, oceanic crust that is formed at the Mid-Atlantic Ridge spreads away from the ridge in both directions over time.
B. The youngest crust is located closest to the Mid-Atlantic Ridge, not farthest from it.
C. Magma that rises through the crust at the Mid-Atlantic Ridge cools and solidifies when it reaches the sea floor.
D. This statement does not provide evidence for the age of oceanic crust in relation to distance from the Mid-Atlantic Ridge as shown in the model.
4 PE: MS-LS2-3;
SEP: Developing and Using Models;
DCI: LS2.B;
CCC: Energy and Matter
A 2 A. Correct. The model is correctly labeled to show electromagnetic waves from the sun to the plant, carbon dioxide entering the leaves, sugars produced during photosynthesis, and oxygen released from the plant to the surrounding environment.
B. None of the labels correctly indicate the energy transfer process for the plant shown in the model.
C. Only electromagnetic waves and oxygen are correctly labeled to indicate the energy transfer process for the plant shown in the model.
D. Only carbon dioxide and sugars are correctly labeled to indicate the energy transfer process for the plant shown in the model.

37Grade 8 Science Item Sampler
SCIENCE—APPENDIX
Grade 8
Sample Number
AlignmentAnswer
KeyDepth of
KnowledgeAnnotations
5 PE: MS-ESS1-3;
SEP: Analyzing and Interpreting Data;
DCI: ESS1.B;
CCC: Scale, Proportion, and Quantity
C 2 A. The data table does not provide data about the compositions of the planets.
B. The data table does not provide data about the surface features or temperatures of the planets.
C. Correct. The data table provides data about distance from the sun, which could be used to produce a diagram showing relative locations of planets in the solar system.
D. The data table does not provide data about the sizes of the planets.

Copyright © 2017 by the Wisconsin Department of Public Instruction. The materials contained in this publication may be duplicated by Wisconsin educators for local classroom use. This permission does not extend to the duplication of materials for commercial use.
ScienceItem Sampler
Grade 8