high school science mca-iii item sampler teacher guide
TRANSCRIPT

High School Science MCA Item Sampler Teacher Guide
Overview of Item Samplers
Item samplers are one type of student resource provided to help students and educators prepare for test administration. While standardized tests are familiar to almost all students, each assessment has its own layout and ways students interact with it. The item samplers should be used to familiarize students and educators with how the content is assessed by providing examples of the format and item types students could encounter on the MCA.
Other Resources
While this Teacher Guide provides detailed information about the item samplers, the student tutorial is the resource that should be used to familiarize students and educators with the general functionality of the online test, including navigation, tools, and examples of all item types.
For further information about the student tutorial and using student resources, refer to the Purposes of Student Resources on the Item Samplers page of PearsonAccess Next (PearsonAccess Next > Preparing for Testing > Item Samplers). Please contact [email protected] for any questions about the MCA or resources for testing.
Contents of this Teacher Guide
The Teacher Guides provide supplementary information for the items in the online item samplers, including:
• An answer key* • Item images • Rationales for correct and incorrect answer options • Benchmarks the sample items align to from the test specifications • Cognitive complexity (indicated as Depth of Knowledge or DOK) from the test specifications • Data on the percentage of student response for each answer option, for science items that were previously
administered on the MCA
For detailed information on benchmarks and cognitive complexity levels, see the test specifications on the MDE website (Districts, Schools and Educators > Statewide Testing > Test Specifications).
*All items in the paper item samplers (12-point, 18-point, 24-point, and braille test books) are also represented in this Teacher Guide. However, the simulation is not included in the paper accommodated samplers so item numbers in the key must be adjusted when used with these materials.
Student Responses Upon completion of the online item samplers, a report is displayed, which provides student responses for some item types. This report can be printed for use in conjunction with the information in this Teacher’s Guide on how the student responded to those items. The overall score on the report is not a predictor of performance on the MCA; it is simply a total of correct responses. Note: student responses for multiple-choice and multiple-response items will display the student’s response followed by an underscore and additional text (e.g., A_A). Please ignore the information after the underscore.

Section 1
Scenario: Cyanobacteria
Question 1
Benchmark: 9.4.1.2.3
Describe how viruses, prokaryotic cells and eukaryotic cells differ in relative size, complexity and general structure.
DOK: 1
4
Answer option Rationale Percent of student responses
Correct: Bacterial cell: 1 circular chromosome; Plant cell: Chromosomes inside a nucleus; Animal cell: Chromosomes inside a nucleus.
The student understands that bacterial cells have a circular chromosome while animal and plant cells have a chromosome inside a nucleus.
73%
Incorrect: All other answer combinations
The student does not understand how prokaryotic and eukaryotic cells differ in terms of their chromosome structure.
27%

Question 2
Benchmark: 9.4.1.2.5
Compare and contrast passive transport (including osmosis and facilitated transport) with active transport, such as endocytosis and exocytosis.
DOK: 1
5
Answer option Rationale Percent of student responses
Correct: Material moves against the concentration gradient: active transport; Material moves with the concentration gradient: facilitated transport
The student understands the differences in concentration gradients and requirements between active and facilitated transport and that neither diagram describes osmosis.
51%
Incorrect: All other responses
The student does not understand one or more modes of transport.
49%
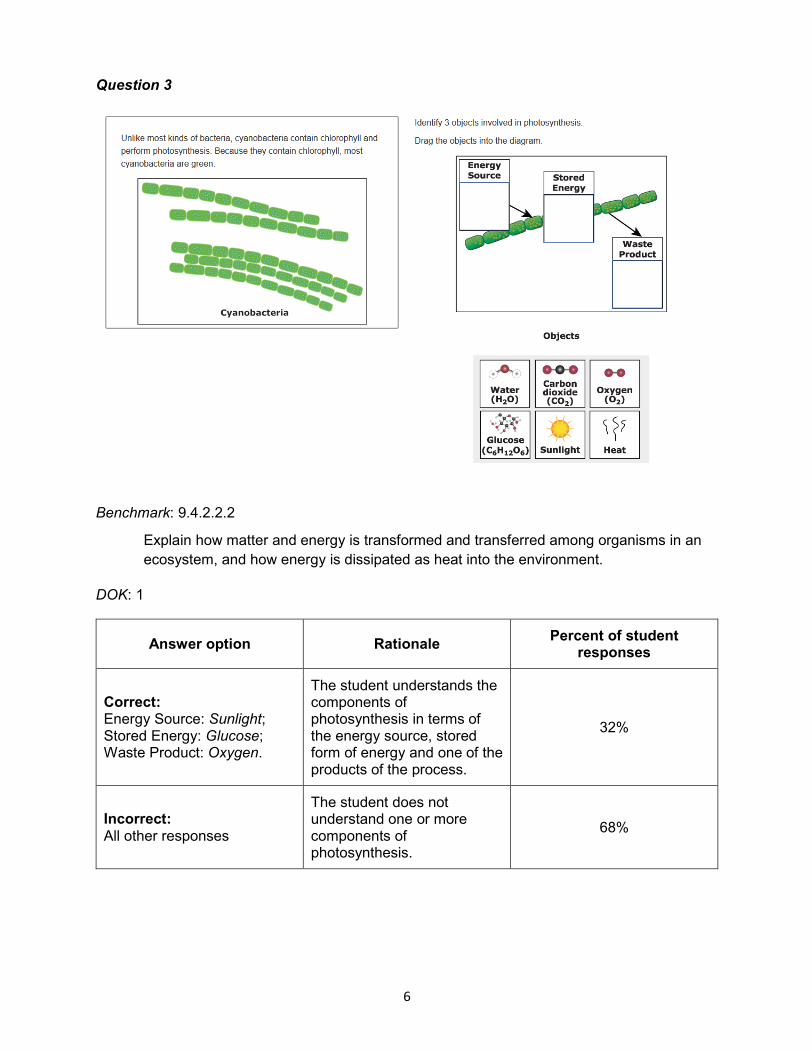
Question 3
Benchmark: 9.4.2.2.2
Explain how matter and energy is transformed and transferred among organisms in an ecosystem, and how energy is dissipated as heat into the environment.
DOK: 1
6
Answer option Rationale Percent of student responses
Correct: Energy Source: Sunlight; Stored Energy: Glucose; Waste Product: Oxygen.
The student understands the components of photosynthesis in terms of the energy source, stored form of energy and one of the products of the process.
32%
Incorrect: All other responses
The student does not understand one or more components of photosynthesis.
68%

Question 4
Benchmark: 9.4.2.2.2
Explain how matter and energy is transformed and transferred among organisms in an ecosystem, and how energy is dissipated as heat into the environment.
DOK: 2
7
Answer option Rationale Percent of student responses
A Aquatic plants make their own food. 10%
B Aquatic plants do not absorb cyanobacteria. The nitrogen is converted into usable forms for plants.
14%
Correct: C Without atmospheric nitrogen fixation, no nitrogen would be available to plants. 52%
D Aquatic plants need a form of nitrogen produced by other intermediates. 24%

Scenario: Fruit Fly Genetics
Question 5
Benchmark: 9.4.1.2.1
Recognize that cells are composed primarily of a few elements (carbon, hydrogen, oxygen, nitrogen, phosphorus, and sulfur), and describe the basic molecular structures and the primary functions of carbohydrates, lipids, proteins and nucleic acids.
DOK: 1
8
Answer option Rationale Percent of student responses
A ATP is an energy source for cellular processes, but it does not determine genetic differences.
30%
B Glucose is a form of stored energy for the cell, but it does not determine genetic differences.
8%
C Fatty acids are structures that make up different types of cells, but they do not determine genetic differences.
4%
Correct: D Nucleic acids determine genetic differences in organisms. 58%

Question 6
Benchmark: 9.4.3.1.1
Explain the relationships among DNA, genes and chromosomes.
DOK: 1
9
Answer option Rationale Percent of student responses
Correct: A Both genes and chromosomes are composed of DNA. 55%
B The student thinks that genes and chromosomes are composed of RNA instead of DNA.
4%
C The student thinks there is a difference in the composition of genes and chromosomes.
33%
D The student thinks there is a difference in the composition of genes and chromosomes.
8%
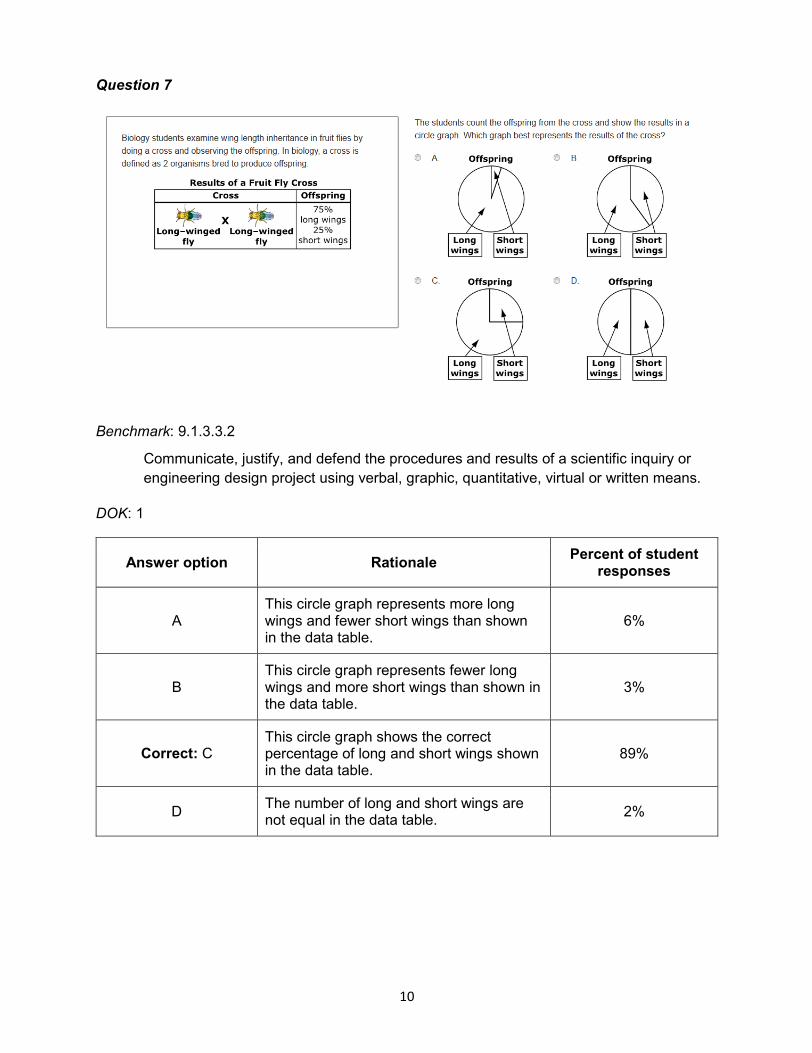
Question 7
Benchmark: 9.1.3.3.2
Communicate, justify, and defend the procedures and results of a scientific inquiry or engineering design project using verbal, graphic, quantitative, virtual or written means.
DOK: 1
10
Answer option Rationale Percent of student responses
A This circle graph represents more long wings and fewer short wings than shown in the data table.
6%
B This circle graph represents fewer long wings and more short wings than shown in the data table.
3%
Correct: C This circle graph shows the correct percentage of long and short wings shown in the data table.
89%
D The number of long and short wings are not equal in the data table. 2%

Question 8
11
Benchmark: 9.1.3.4.3
Select and use appropriate numeric, symbolic, pictorial, or graphical representation to communicate scientific ideas, procedures and experimental results.
DOK: 2
Answer option Rationale Percent of student responses
Correct: First trial: 6; Second trial: 12; Third trial: 18.
The student is able to calculate 75% of the offspring for each trial in order to know what the expected number of long-winged organisms will be and graphs the appropriate data.
44%
Incorrect: All other responses
The student does not calculate the percent of long-winged offspring and/or does not graph the data correctly.
56%
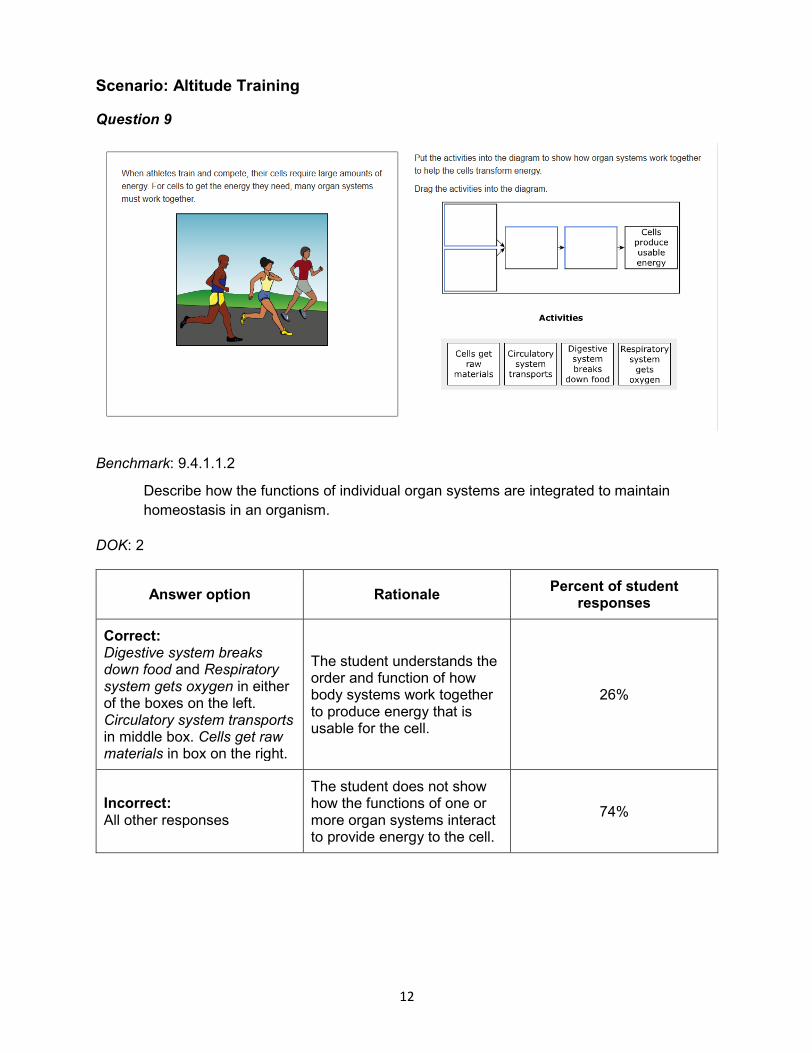
Scenario: Altitude Training
Question 9
Benchmark: 9.4.1.1.2
Describe how the functions of individual organ systems are integrated to maintain homeostasis in an organism.
DOK: 2
12
Answer option Rationale Percent of student responses
Correct: Digestive system breaks down food and Respiratory system gets oxygen in either of the boxes on the left. Circulatory system transports in middle box. Cells get raw materials in box on the right.
The student understands the order and function of how body systems work together to produce energy that is usable for the cell.
26%
Incorrect: All other responses
The student does not show how the functions of one or more organ systems interact to provide energy to the cell.
74%

Question 10
Benchmark: 9.4.2.2.1
Use words and equations to differentiate between the processes of photosynthesis and respiration in terms of energy flow, beginning reactants and end products.
DOK: 2
13
Answer option Rationale Percent of
student responses
A Athletes’ muscle cells will require more food as cellular respiration increases. 4%
B Athletes’ muscle cells will produce more waste as cellular respiration increases. 6%
C Athletes’ muscle cells do not use carbon dioxide, they produce it as waste. 13%
Correct: D Athletes’ muscle cells will be able to convert more glucose to energy due to increased oxygen.
77%

Question 11
Benchmark: 9.1.1.2.1
Formulate a testable hypothesis, design and conduct an experiment to test the hypothesis, analyze the data, consider alternative explanations and draw conclusions supported by evidence from the investigation.
DOK: 2
14
Answer option Rationale Percent of student responses
Correct: Athlete 1: Week 3–4; Athlete 2: Week 1–2; Athlete 3: Week 3–4.
The student analyzes the graph and identifies the weeks that each athlete has an increase in their VO2 max.
74%
Incorrect: All other responses
The student analyzes the data incorrectly. 26%

Question 12
Benchmark: 9.1.3.4.3
Select and use appropriate numeric, symbolic, pictorial, or graphical representation to communicate scientific ideas, procedures and experimental results.
DOK: 2
15
Answer option Rationale Percent of student responses
Correct: From left to right on the x-axis: Athlete 3, Athlete 1, Athlete 2.
The student calculates the improvement in race times for each athlete and correctly places the athlete labels on the x-axis of the graph.
71%
Incorrect: All other responses
The student does not calculate the improvement for each athlete from the data table and does not label the graph correctly.
29%

Section 2
Scenario: Plant Growth
Question 13
Benchmark: 9.4.3.1.3
Describe the process of DNA replication and the role of DNA and RNA in assembling protein molecules.
DOK: 1
16
Answer option Rationale Percent of student responses
Correct: DNA
DNA is replicated at the beginning of mitosis. No data available
Incorrect: All other responses
The student shows a misunderstanding that RNA, fatty acids and amino acids are replicated instead of transcribed, modified or manufactured.
No data available

Question 14
Benchmark: 9.4.1.1.2
Describe how the functions of individual organ systems are integrated to maintain homeostasis in an organism.
DOK: 2
17
Answer option Rationale Percent of student responses
Correct: Increased xylem conduction, Increased gas exchange
The student understands that in order to maintain homeostasis during plant growth there is an increase in gas exchange and an increase in fluid transportation upward from the root through the xylem.
No data available
Incorrect: All other responses
The student does not understand the function and roles of vascular tissue and plant structures in maintaining homeostasis during plant growth.
No data available

Question 15
Benchmark: 9.4.1.2.4
Explain the function and importance of cell organelles for prokaryotic and/or eukaryotic cells as related to the basic cell processes of respiration, photosynthesis, protein synthesis and cell reproduction.
DOK: 1
18
Answer option Rationale Percent of student responses
Correct: From left to right: mitochondrion, chloroplast, ribosome.
The student understands that cellular respiration occurs in the mitochondrion, photosynthesis occurs in chloroplasts, and protein synthesis occurs in the ribosomes.
No data available
Incorrect: All other responses
The student does not understand where cellular processes occur inside a plant cell.
No data available

Question 16
Benchmark: 9.4.2.2.1
Use words and equations to differentiate between the processes of photosynthesis and respiration in terms of energy flow, beginning reactants and end products.
DOK: 1
19
Answer option Rationale Percent of student responses
Correct: Glucose, Oxygen
The student understands that both glucose and oxygen are the reactants needed for cellular respiration to occur. Water, carbon dioxide and ATP are products.
No data available
Incorrect: All other responses
The student does not correctly identify the reactants of cellular respiration.
No data available

Question 17
Benchmark: 9.4.2.2.2
Explain how matter and energy is transformed and transferred among organisms in an ecosystem, and how energy is dissipated as heat into the environment.
DOK: 1
20
Answer option Rationale Percent of student responses
Correct: A Bean plants are producers because they undergo photosynthesis. No data available
B Decomposers are organisms like bacteria and fungi that recycle nutrients back into the ecosystem.
No data available
C Primary consumers are organisms that use plants as a food source. No data available
D Secondary consumers are organisms that use primary consumers as a food source. No data available
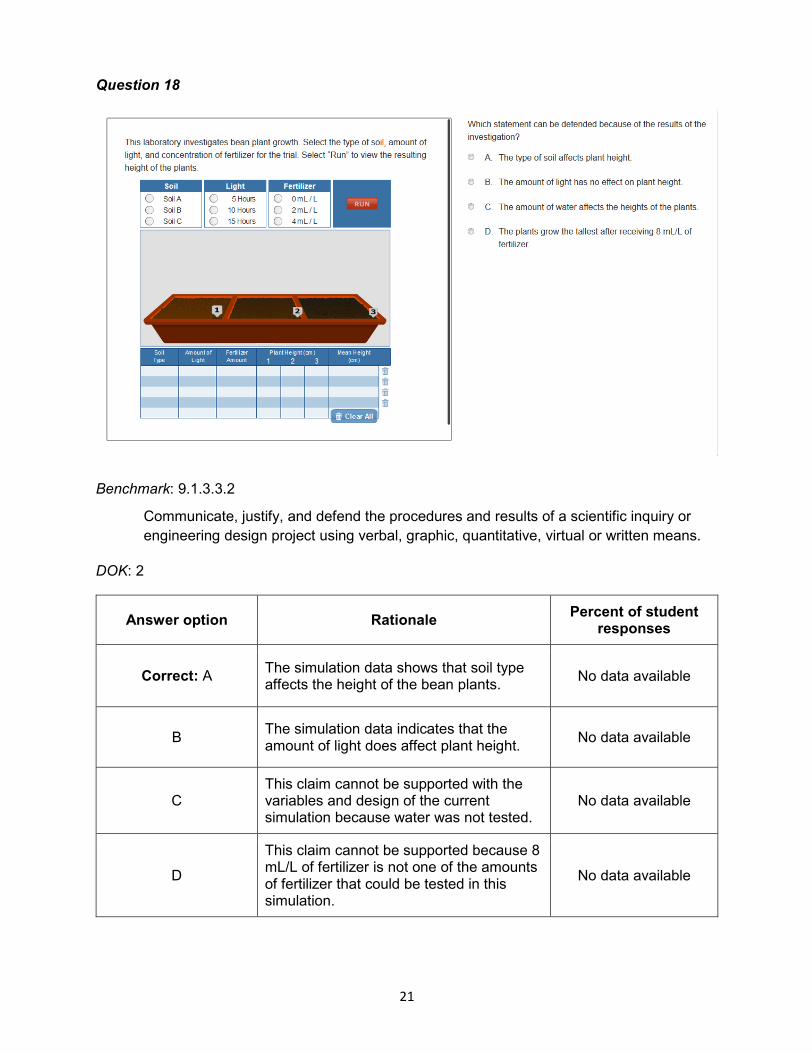
Question 18
21
Benchmark: 9.1.3.3.2
Communicate, justify, and defend the procedures and results of a scientific inquiry or engineering design project using verbal, graphic, quantitative, virtual or written means.
DOK: 2
Answer option Rationale Percent of student responses
Correct: A The simulation data shows that soil type affects the height of the bean plants. No data available
B The simulation data indicates that the amount of light does affect plant height. No data available
C This claim cannot be supported with the variables and design of the current simulation because water was not tested.
No data available
D
This claim cannot be supported because 8 mL/L of fertilizer is not one of the amounts of fertilizer that could be tested in this simulation.
No data available

Question 19
Benchmark: 9.1.3.4.2
Determine and use appropriate safety procedures, tools, computers and measurement instruments in science and engineering contexts. For example: Consideration of chemical and biological hazards in the lab.
DOK: 1
22
Answer option Rationale Percent of student responses
Correct: Use protective eyewear when handling chemical fertilizer and Use gloves when applying fertilizer to the plants.
The student understands that in order to protect both eyes and skin from chemical fertilizer exposure, protective eyewear and gloves should be worn.
No data available
Incorrect: All other responses
Calculating mean plant heights and mixing soil types does not require safety protocol.
No data available

Question 20
Benchmark: 9.1.3.4.4
Relate the reliability of data to consistency of results, identify sources of error, and suggest ways to improve the data collection and analysis. For example: Use statistical analysis or error analysis to make judgments about the validity of results.
DOK: 2
23
Answer option Rationale Percent of
student responses
Correct: A Growing all plants in different types of soil would be a source of error because it adds to the design another changed variable in addition to the amount of light.
No data available
B Growing all plants in the same amount of water would not be a source of error because it ensures another changed variable is not added to the design.
No data available
C This variable is appropriate and would not be a source of error because to test the length of light, the length of light should be varied for each trial.
No data available
D Using the same amount of fertilizer would not be a source of error because it ensures another changed variable is not added to the design.
No data available
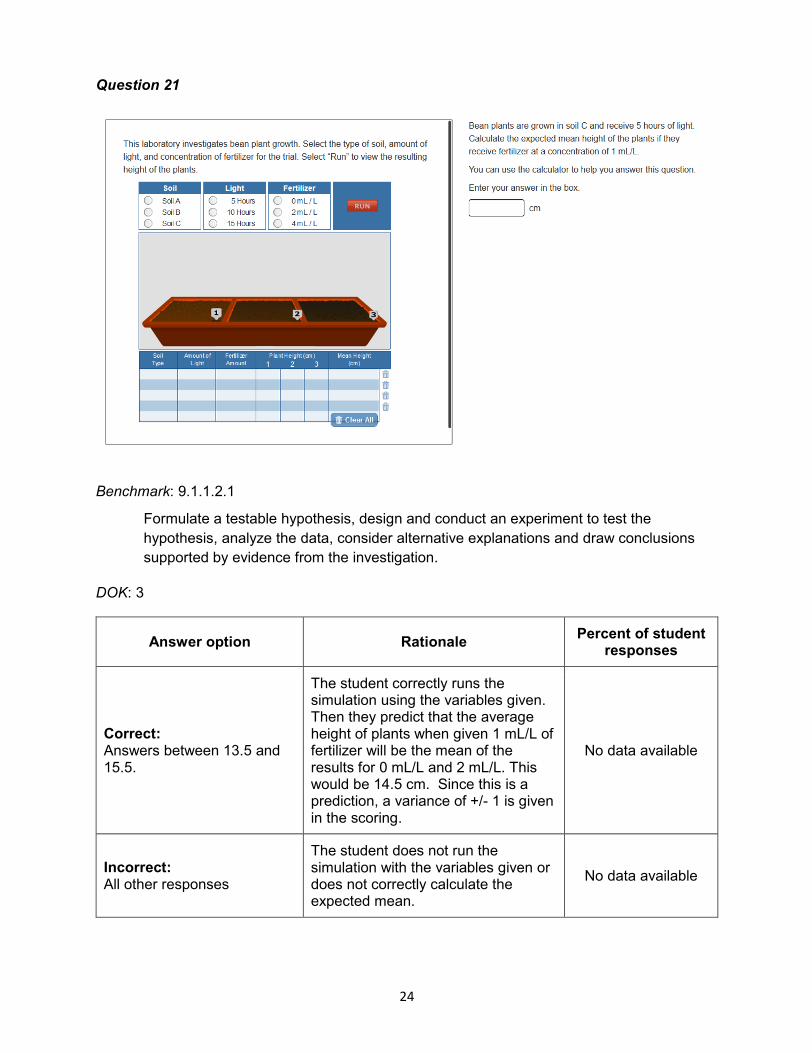
Question 21
Benchmark: 9.1.1.2.1
Formulate a testable hypothesis, design and conduct an experiment to test the hypothesis, analyze the data, consider alternative explanations and draw conclusions supported by evidence from the investigation.
DOK: 3
24
Answer option Rationale Percent of student responses
Correct: Answers between 13.5 and 15.5.
The student correctly runs the simulation using the variables given. Then they predict that the average height of plants when given 1 mL/L of fertilizer will be the mean of the results for 0 mL/L and 2 mL/L. This would be 14.5 cm. Since this is a prediction, a variance of +/- 1 is given in the scoring.
No data available
Incorrect: All other responses
The student does not run the simulation with the variables given or does not correctly calculate the expected mean.
No data available

Question 22
Benchmark: 9.1.3.3.2
Communicate, justify, and defend the procedures and results of a scientific inquiry or engineering design project using verbal, graphic, quantitative, virtual or written means.
DOK: 3
25
Answer option Rationale Percent of student responses
Correct: The student plots the points 5,7; 10,17; 15,19; 20,(19, 20, or 21).
The student correctly runs the simulation with the variables given and plots the results for 5, 10 and 15 hours of light. Then, based on the relationship between the amount of light and mean plant height, the student calculates the plants’ average growth if given 20 hours of light.
No data available
Incorrect: All other responses
The student does not plot the data correctly and/or understand the relationship between the amount of light and plant growth in the simulation.
No data available

Question 23
Benchmark: 9.1.1.2.1
Formulate a testable hypothesis, design and conduct an experiment to test the hypothesis, analyze the data, consider alternative explanations, and draw conclusions supported by evidence from the investigation.
DOK: 3
26
Answer option Rationale Percent of
student responses
Correct: Student performs at least 3 trials varying only the amount of light. Soil type and amount of fertilizer remain the same.
The student understands that in a controlled experiment, only 1 variable should be changed. In this simulation, the student can select any amount of fertilizer and soil type as long as only the amount of light for each trial is varied.
No data available
Incorrect: All other responses
The student does not set up a controlled experiment correctly, changing only the amount of light or running 3 trials.
No data available