science education manual - stemfinity€¦ · 7.3 analog and digital electronics 7.4 ohm’s law...
TRANSCRIPT
Renewable EnergyScience Education Manual
Chapter 1: The Environment and Climate Change 1.1 Introduction 1.2 World Energy Demand 1.3 Global Warming 1.3.1 The Greenhouse Effect 1.3.2 Sea Levels 1.3.3 Effects of Global Warming 1.3.4 Can We Stop Global Warming? 1.4 Disadvantages of Current Energy Technologies 1.5 Innovative Green Technologies 1.5.1 Solar Cells 1.5.2 Wind Power 1.5.3 Electrolysis 1.5.4 Fuel Cells 1.6 Vision of a Hydrogen Clean Energy Economy Based on Renewables in Combination 1.7 Conclusions
Chapter 2: Solar Energy 2.1 Introduction 2.2 History 2.3 Types of PV Systems 2.4 Principals and Characteristics 2.5 Solar Technology 2.5.1 Silicon Electron Transport 2.5.2 Photogeneration of Charge Carriers 2.5.3 The Electromagnetic Spectrum and Energy Loss 2.5.4 Silicon and the P-N Junction 2.5.5 Advanced Topic: Materials Engineering 2.5.5.1 Voltage Loss due to the Transport of Charges 2.6 Other Materials for PV Cells 2.6.1 Crystalline Silicon 2.6.2 Cadmium Telluride Solar Cell 2.6.3 Copper-Indium Selenide Solar Cell 2.6.4 Gallium Arsenide (GaAs) Multijunction Solar Cell 2.6.5 Light-Absorbing Dyes (DSSC) 2.6.6 Organic/polymer Solar Cells 2.6.7 Silicon Thin Films 2.7 Solar Power Applications 2.7.1 Powering a House Using Solar Power 2.7.2 Solving Solar-Power Lssues 2.7.3 Solar Powered Cars 2.8 Conclusions
Chapter 3: Wind Energy 3.1 Introduction 3.2 History of Wind Power 3.3 Principles and Characteristics 3.3.1 The Earth’s Wind Systems 3.3.2 Aerodynamics of Wind Turbines 3.4 Types of Wind Turbines
01-20
21-37
38-52
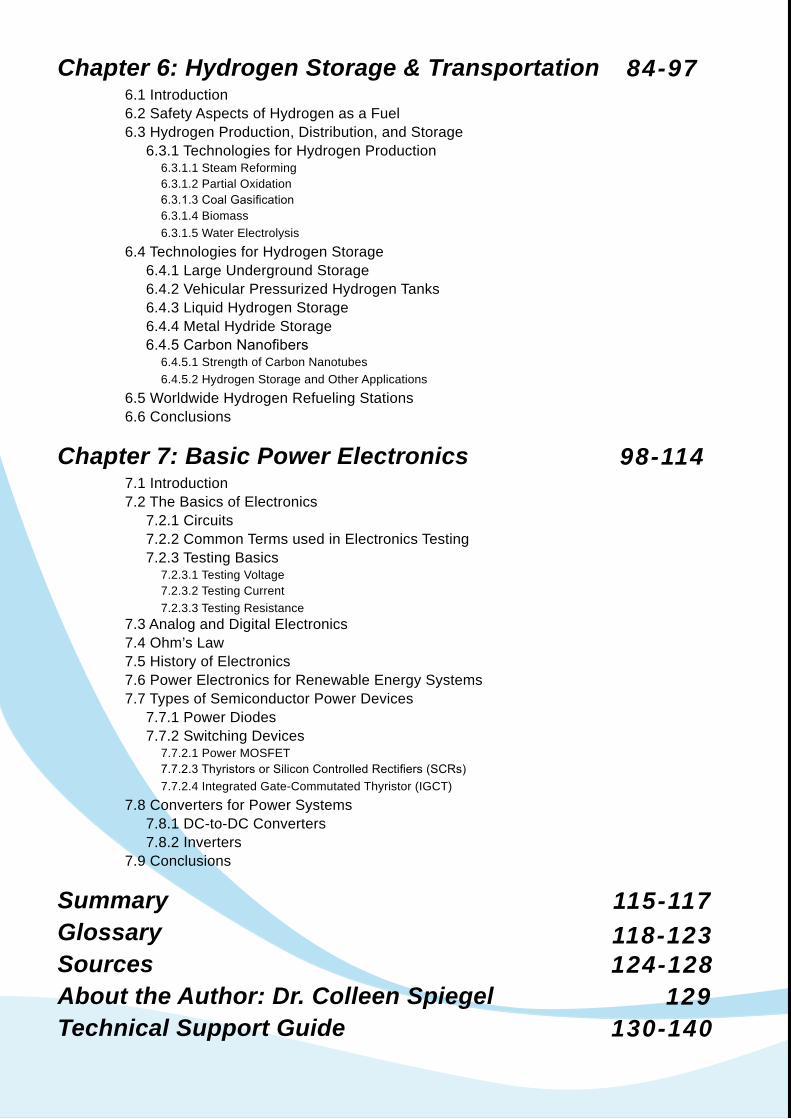
Contents
3.4.1 Horizontal Axis Wind Turbines 3.4.2 Vertical Axis Wind Turbines 3.5 Parts of a Wind Turbine 3.6 Energy and Power in the Wind 3.7 Impact of Tower Height 3.8 Theoretical Potential of Wind Power 3.8.1 Distribution of Wind Speed 3.9 Simple Estimate of Wind Turbine Energy 3.10 Capacity Factor 3.11 Wind Farms 3.12 Conclusions
Chapter 4: Electrolyzers 4.1 Introduction 4.2 History of Electrolyzers 4.3 Types of Electrolyzers 4.3.1 Unipolar Design 4.3.2 Bipolar Design 4.4 Types of Electrolyzers 4.4.1 Alkaline Electrolyzer 4.4.2 Polymer Electrolyte Membrane (PEM) Based Electrolyzer 4.4.2.1 Electrolyte 4.4.2.2 Catalysts 4.5 Electrolyzer Efficiency 4.6 Advanced Topic: The Basics of Thermodynamics of Electrolyzer Design 4.7 Current Hydrogen Production and Market 4.8 Opportunities for Electrolysis 4.9 Conclusions
Chapter 5: Fuel Cells 5.1 Introduction 5.2 History of Fuel Cells 5.3 Fuel Cell Applications 5.3.1 Stationary Sector 5.3.2 Transportation Market 5.3.3 Portable Sector 5.4 Types of Fuel Cells 5.4.1 Polymer Exchange Membrane Fuel Cell (PEMFC) 5.4.2 Alkaline Fuel Cells (AFCs) 5.4.3 Phosphoric Acid Fuel Cell (PAFC) 5.4.4 Solid Oxide Fuel Cells (SOFCs) 5.4.5 Molten-Carbonate Fuel Cells (MCFCs) 5.4.6 Direct Methanol Fuel Cells (DMFCs) 5.5 How Do Fuel Cells Work? 5.5.1 Electrolyte Layer 5.5.2 Gas Diffusion Layer 5.5.3 Catalyst Layer 5.5.4 Bipolar Plates 5.6 Stack Design and Configuration 5.7 Operating Conditions 5.7.1 Polarization Curves 5.8 Conclusions
53-66
67-83
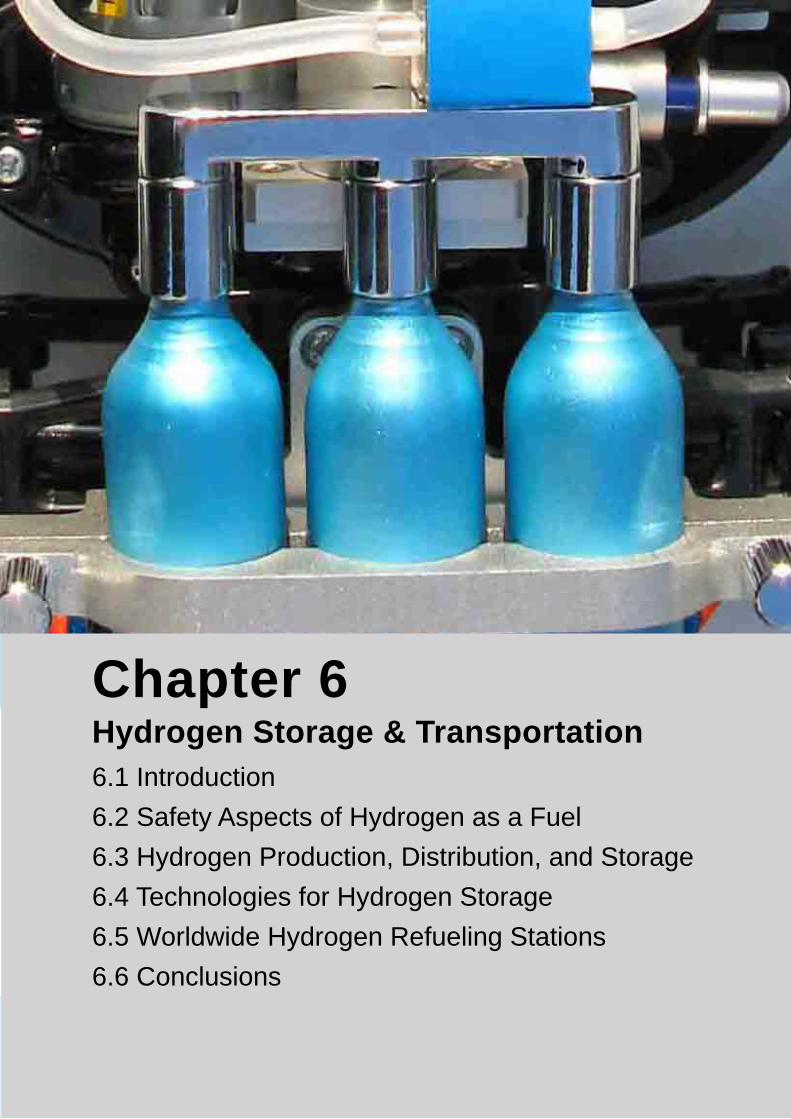
Chapter 6: Hydrogen Storage & Transportation 6.1 Introduction 6.2 Safety Aspects of Hydrogen as a Fuel 6.3 Hydrogen Production, Distribution, and Storage 6.3.1 Technologies for Hydrogen Production 6.3.1.1 Steam Reforming 6.3.1.2 Partial Oxidation 6.3.1.3 Coal Gasification 6.3.1.4 Biomass 6.3.1.5 Water Electrolysis 6.4 Technologies for Hydrogen Storage 6.4.1 Large Underground Storage 6.4.2 Vehicular Pressurized Hydrogen Tanks 6.4.3 Liquid Hydrogen Storage 6.4.4 Metal Hydride Storage 6.4.5 Carbon Nanofibers 6.4.5.1 Strength of Carbon Nanotubes 6.4.5.2 Hydrogen Storage and Other Applications 6.5 Worldwide Hydrogen Refueling Stations 6.6 Conclusions
Chapter 7: Basic Power Electronics 7.1 Introduction 7.2 The Basics of Electronics 7.2.1 Circuits 7.2.2 Common Terms used in Electronics Testing 7.2.3 Testing Basics 7.2.3.1 Testing Voltage 7.2.3.2 Testing Current 7.2.3.3 Testing Resistance 7.3 Analog and Digital Electronics 7.4 Ohm’s Law 7.5 History of Electronics 7.6 Power Electronics for Renewable Energy Systems 7.7 Types of Semiconductor Power Devices 7.7.1 Power Diodes 7.7.2 Switching Devices 7.7.2.1 Power MOSFET 7.7.2.3 Thyristors or Silicon Controlled Rectifiers (SCRs) 7.7.2.4 Integrated Gate-Commutated Thyristor (IGCT) 7.8 Converters for Power Systems 7.8.1 DC-to-DC Converters 7.8.2 Inverters 7.9 Conclusions
SummaryGlossarySourcesAbout the Author: Dr. Colleen SpiegelTechnical Support Guide
84-97
98-114
115-117118-123124-128 129130-140

Chapter 1 The Environment and Climate Change1.1 Introduction1.2 World Energy Demand1.3 Global Warming1.4 Disadvantages of Current Energy Technologies1.5 Innovative Green Technologies1.6 Vision of a Hydrogen Clean Energy Economy
Based on Renewables in Combination1.7 Conclusions
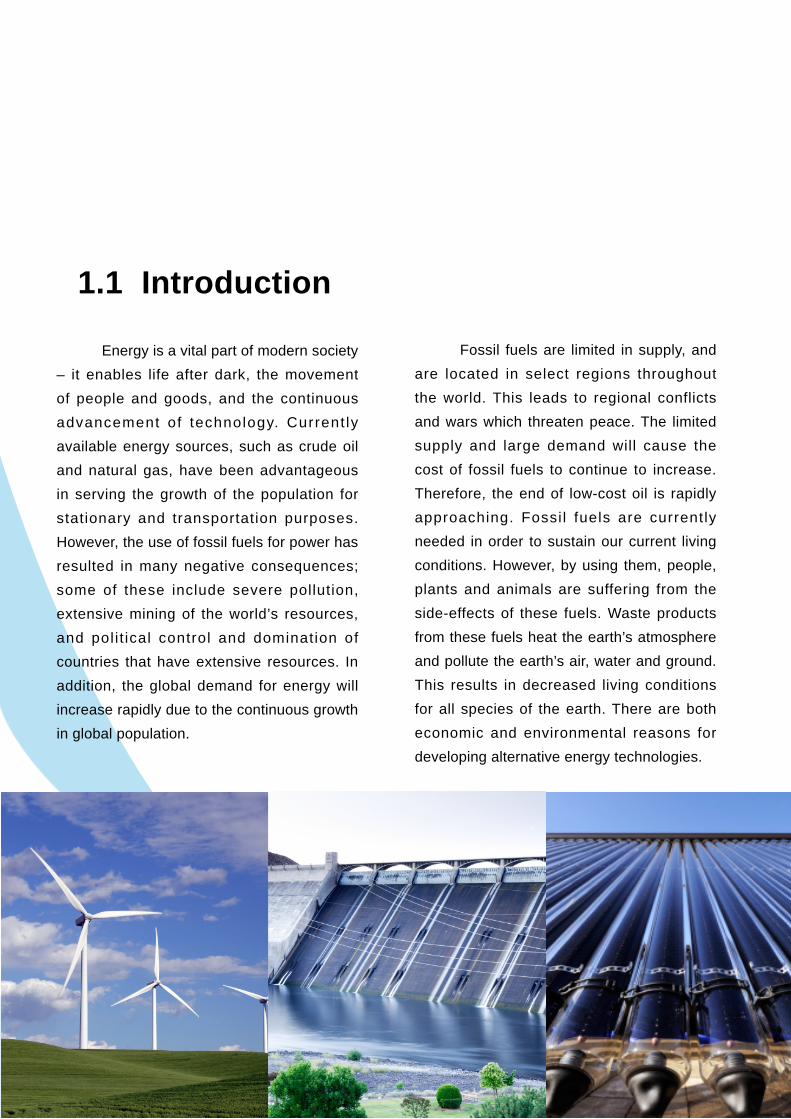
Energy is a vital part of modern society – it enables life after dark, the movement of people and goods, and the continuous advancement of technology. Current ly available energy sources, such as crude oil and natural gas, have been advantageous in serving the growth of the population for stationary and transportation purposes. However, the use of fossil fuels for power has resulted in many negative consequences; some of these include severe pollution, extensive mining of the world’s resources, and pol i t ical control and domination of countries that have extensive resources. In addition, the global demand for energy will increase rapidly due to the continuous growth in global population.
Fossil fuels are limited in supply, and are located in select regions throughout the world. This leads to regional conflicts and wars which threaten peace. The limited supply and large demand will cause the cost of fossil fuels to continue to increase. Therefore, the end of low-cost oil is rapidly approaching. Fossi l fuels are currently needed in order to sustain our current living conditions. However, by using them, people, plants and animals are suffering from the side-effects of these fuels. Waste products from these fuels heat the earth’s atmosphere and pollute the earth’s air, water and ground. This results in decreased living conditions for all species of the earth. There are both economic and environmental reasons for developing alternative energy technologies.
1.1 Introduction
07
Absorbed by atomosphere
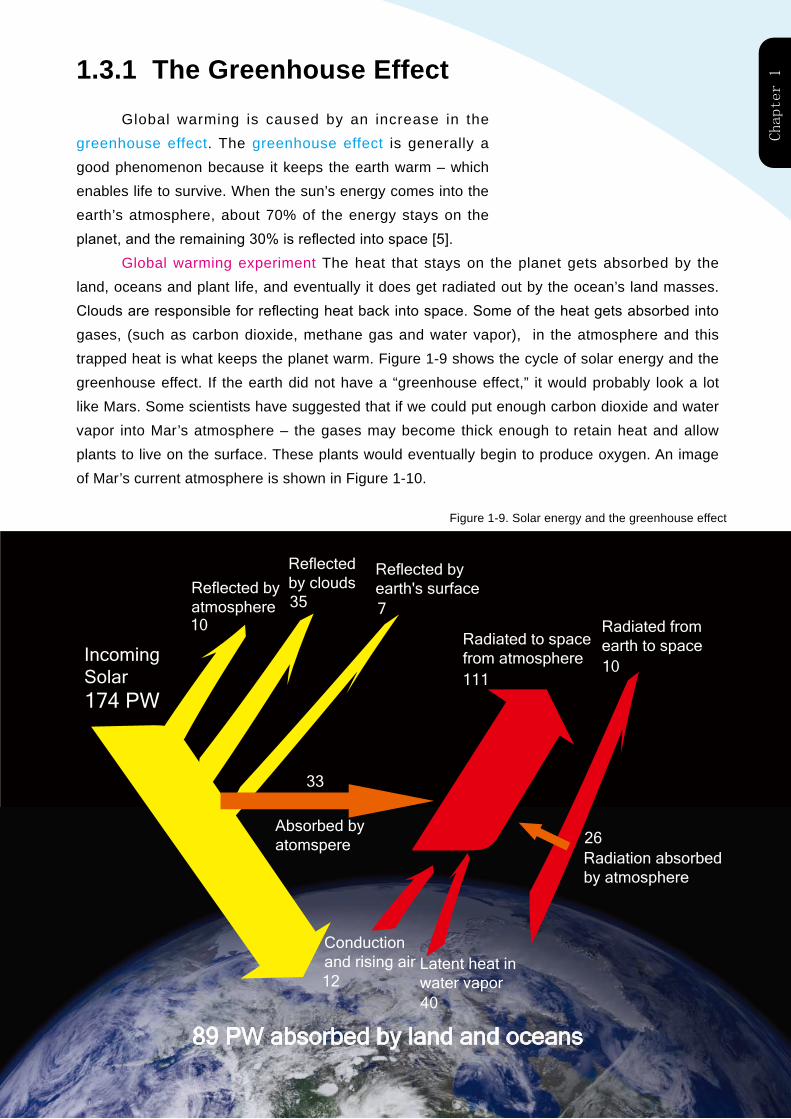
1.3.1 The Greenhouse EffectGlobal warming is caused by an increase in the
greenhouse effect. The greenhouse effect is generally a good phenomenon because it keeps the earth warm – which enables life to survive. When the sun’s energy comes into the earth’s atmosphere, about 70% of the energy stays on the planet, and the remaining 30% is reflected into space [5].
Global warming experiment The heat that stays on the planet gets absorbed by the land, oceans and plant life, and eventually it does get radiated out by the ocean’s land masses. Clouds are responsible for reflecting heat back into space. Some of the heat gets absorbed into gases, (such as carbon dioxide, methane gas and water vapor), in the atmosphere and this trapped heat is what keeps the planet warm. Figure 1-9 shows the cycle of solar energy and the greenhouse effect. If the earth did not have a “greenhouse effect,” it would probably look a lot like Mars. Some scientists have suggested that if we could put enough carbon dioxide and water vapor into Mar’s atmosphere – the gases may become thick enough to retain heat and allow plants to live on the surface. These plants would eventually begin to produce oxygen. An image of Mar’s current atmosphere is shown in Figure 1-10.
Figure 1-9. Solar energy and the greenhouse effect
Reflected byatmosphere
IncomingSolar174 PW
Reflectedby clouds
Reflected byearth's surface
Radiated to spacefrom atmosphere
Radiated fromearth to space
Radiation absorbedby atmosphere
Absorbed byatomspere
33
10
10
26
4012
111
35 7
Latent heat inwater vapor
89 PW absorbed by land and oceans
Conductionand rising air
Chapter 1
13
(a)
(b)
(c)
Chapter 1
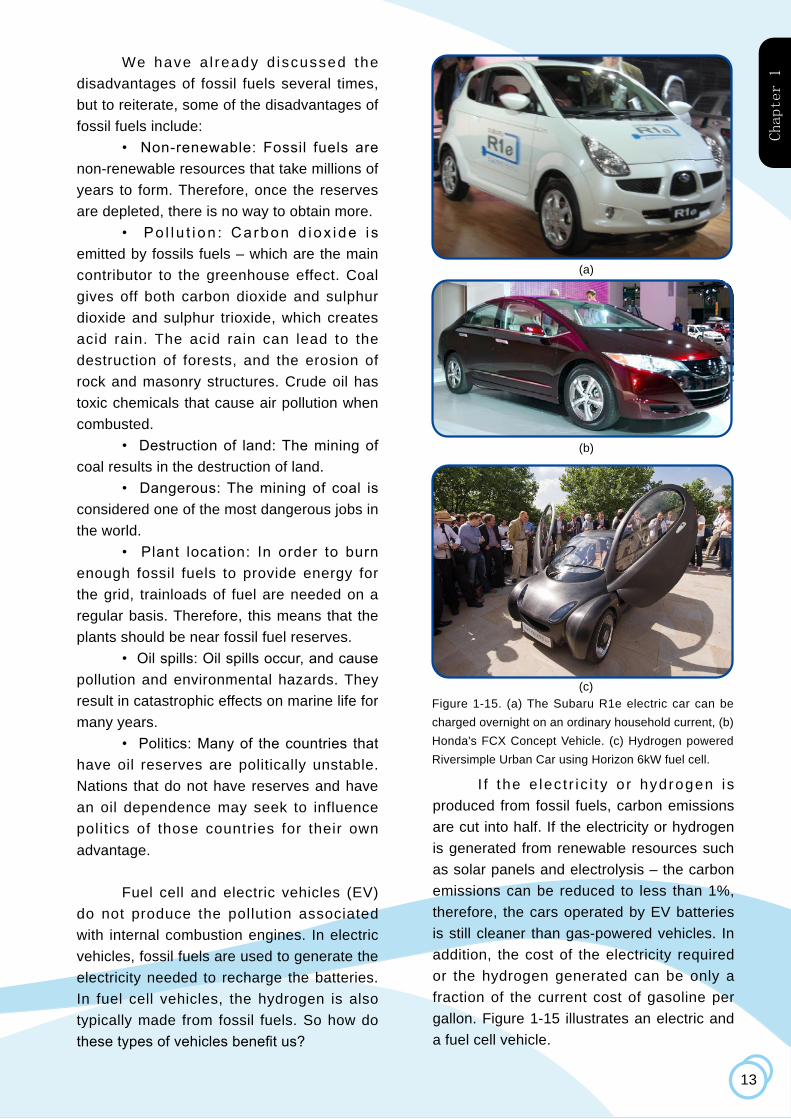
I f the e lec t r ic i ty o r hydrogen is produced from fossil fuels, carbon emissions are cut into half. If the electricity or hydrogen is generated from renewable resources such as solar panels and electrolysis – the carbon emissions can be reduced to less than 1%, therefore, the cars operated by EV batteries is still cleaner than gas-powered vehicles. In addition, the cost of the electricity required or the hydrogen generated can be only a fraction of the current cost of gasoline per gallon. Figure 1-15 illustrates an electric and a fuel cell vehicle.
We have a l ready d iscussed the disadvantages of fossil fuels several times, but to reiterate, some of the disadvantages of fossil fuels include:
• Non-renewable: Fossil fuels are non-renewable resources that take millions of years to form. Therefore, once the reserves are depleted, there is no way to obtain more.
• Po l l u t i on : Ca rbon d iox ide i s emitted by fossils fuels – which are the main contributor to the greenhouse effect. Coal gives off both carbon dioxide and sulphur dioxide and sulphur trioxide, which creates acid rain. The acid rain can lead to the destruction of forests, and the erosion of rock and masonry structures. Crude oil has toxic chemicals that cause air pollution when combusted.
• Destruction of land: The mining of coal results in the destruction of land.
• Dangerous: The mining of coal is considered one of the most dangerous jobs in the world.
• Plant location: In order to burn enough fossil fuels to provide energy for the grid, trainloads of fuel are needed on a regular basis. Therefore, this means that the plants should be near fossil fuel reserves.
• Oil spills: Oil spills occur, and cause pollution and environmental hazards. They result in catastrophic effects on marine life for many years.
• Politics: Many of the countries that have oil reserves are politically unstable. Nations that do not have reserves and have an oil dependence may seek to influence politics of those countries for their own advantage.
Fuel cell and electric vehicles (EV) do not produce the pollution associated with internal combustion engines. In electric vehicles, fossil fuels are used to generate the electricity needed to recharge the batteries. In fuel cell vehicles, the hydrogen is also typically made from fossil fuels. So how do these types of vehicles benefit us?
Figure 1-15. (a) The Subaru R1e electric car can be charged overnight on an ordinary household current, (b) Honda's FCX Concept Vehicle. (c) Hydrogen powered Riversimple Urban Car using Horizon 6kW fuel cell.

18
1.6 Vision of a Hydrogen Clean Energy Economy Based on Renewables in Combination
Most of the current energy needs in the world are being met by fossil fuels. These fuels are easily obtained, stored, and transported because of the large amount of money that has been used to create, build, and maintain the system. Due to the current fuel distribution system, technology has advanced at a faster pace during the last two centuries than in all of recorded history. Despite all the advantages fossil fuels have provided for our society, it has also had negative effects on the environment, some of which likely has yet to be seen. Some of these harmful effects include air pollution due to acid rain emissions, water and soil pollution due to spills and leaks, and carbon dioxide accumulation in the atmosphere. These pollutants have the potential to warm the global atmosphere and kill many species.
For most countries around the world, if the supply of fossil fuels were cut off - -the entire economy would come to a stop. There would not be any way for people to drive to work or use the electricity in their homes or workplaces. However, cars burn gasoline and cause air pollution. In the process of burning the gasoline, carbon monoxide, nitrogen oxides and unburned hydrocarbons are released into the atmosphere. The catalytic converters reduce a large portion of the pollution, but they are not perfect. Many cities currently have dangerous levels of ozone in the air.
In addition to the negative environmental consequences of using these fuels, there is a finite supply of fossil fuels that will inevitably force the use of another form of energy. The demand for energy will also continuously increase due to the constant increase of the global population.
The future energy economy will consist of many renewable energy technologies used in combination. As far as fuels are concerned, hydrogen is one of the most powerful fuels. This is the most evident with NASA space ships – the primary fuel that is used is hydrogen. Hydrogen is the most abundant element in the universe; however, it does not exist in its pure form on earth. Therefore, it has to be extracted from common fuel types or water. The process that is used most frequently for extracting hydrogen is by steam reforming natural gas. It can also be extracted from coal, nuclear power, biofuels or even waste products.
Figure 1-18. Hydrogen Linkages with the Energy System
Other Renewables;Solar, Geothermal,Hydro, Biomass
Wind
Electrolyzer
Short-termEnergy Storage
Electric Line Hydrogen Piping
Electric Grid
Fuel Cellsand Engines
Fueling StationElectrolyzer
HydrogenFueledVehicles
HydrogenFueling
Hydrogen Storage
Delivery to local fueling station
21
Chapter 1
2.1 Introduction2.2 History2.3 Types of PV Systems2.4 Principals and Characteristics2.5 Solar Technology2.6 Other Materials for PV Cells2.7 Solar Power Applications2.8 Conclusions
Chapter 2Solar Energy

22
2.1 IntroductionMost of us are already familiar with
solar cel ls because we use or encounter them everyday – in calculators, street lamps, and many traffic road signs. As long as these devices have enough light – they seem to work forever. Solar (or photovoltaic) cells are made up of many individuals cell stacked together, and these are made of mater ia ls ca l led semiconductors. Semiconducting materials are special materials that conduct electrons when light is absorbed. We will explain more about the science behind solar cells in Section 2.2, but first we will begin our study on solar cells with the history behind them.
Figure 2-1. The Helios Prototype developed by AeroVironment and tested by NASA. A solar and fuel cell system-powered unmanned aerial vehicle
Figure 2-2. History of Solar Cells
French Physicist Edmund Bacquerel, first made voltage appear when he illuminated a metal electrode in a weak electorlyte solution.
Adams and Day were the first to study photovoltaic effect in solids. They made selenium cells that were 1-2% efficient.
Albert Einstein published a theoretical explanation of the photovoltaic affect.
Jan Czochralski began to develop a method to grow perfect crystals of silicon.
First generation of single crystal silicon photovoltaics.
First attempts to commercialize solar panels.
First commercial solar panel used with NASA's Vanguard I satellite.
Solar panels are used for normal consumer applications.
Cost for PV panels continue to decrease, and used in more normal consumer applications.
1839
1876
1904
1916
1940s
1950s
1958
1980s
1900's-Present
2.2 HistorySolar cells were first discovered in 1839
when a 19 year old French physicist, Edmund Becquerel, was able to make voltage appear when he illuminated a metal electrode in a weak electrolyte solution [12, 13]. In 1876, Adams and Day were the first to study the photovoltaic effect in solids. They made solar cells of selenium that were 1 – 2% efficient [12, 13]. Charles Fritts furthered the photovoltaic (PV) technology by coating the selenium with an extremely thin layer of gold to form p-n junctions in 1883. Albert Einstein published a theoretical explanation of the photovoltaic effect worked in 1904, which won him the Nobel Prize in 1923 [12]. Around this time, a Polish scientist by the name of Jan Czochralski began to develop a method to grow perfect crystals of silicon. By the 1940s and 1950s, this process was used to grow silicon to make the first generation of single crystal silicon photovoltaics, and this technique is still currently used in the industry today [13, 14]. Russell Ohl patented the modern junction semiconductor solar cell in 1946 (U.S. Patent 2,402,662, "Light sensitive device"), which was discovered while working on the series of advances that would lead to the transistor [14]. A summary of the history of solar cells is illustrated in Figure 2-2.
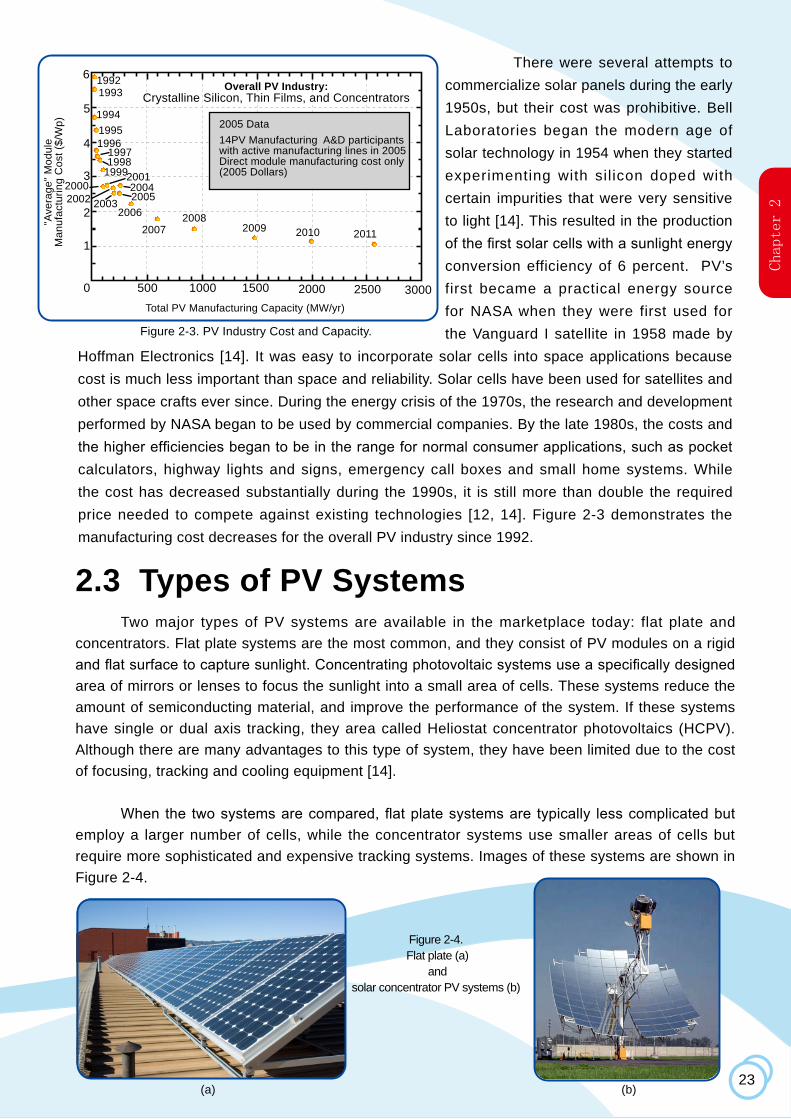
Figure 2-3. PV Industry Cost and Capacity.
19921993
199419951996
19971998
199920002002 2003
200120042005
2006
Total PV Manufacturing Capacity (MW/yr)
Overall PV Industry:Crystalline Silicon, Thin Films, and Concentrators
"Ave
rage
" Mod
ule
Man
ufac
turin
g C
ost (
$/W
p)
2007
0
1
2
3
4
5
6
500 1000 1500 2000 2500 3000
20082009 2010 2011
2005 Data14PV Manufacturing A&D participantswith active manufacturing lines in 2005Direct module manufacturing cost only(2005 Dollars)
Chapter 2
23
There were several attempts to commercialize solar panels during the early 1950s, but their cost was prohibitive. Bell Laboratories began the modern age of solar technology in 1954 when they started experimenting with sil icon doped with certain impurities that were very sensitive to light [14]. This resulted in the production of the first solar cells with a sunlight energy conversion efficiency of 6 percent. PV’s first became a practical energy source for NASA when they were first used for the Vanguard I satellite in 1958 made by
Hoffman Electronics [14]. It was easy to incorporate solar cells into space applications because cost is much less important than space and reliability. Solar cells have been used for satellites and other space crafts ever since. During the energy crisis of the 1970s, the research and development performed by NASA began to be used by commercial companies. By the late 1980s, the costs and the higher efficiencies began to be in the range for normal consumer applications, such as pocket calculators, highway lights and signs, emergency call boxes and small home systems. While the cost has decreased substantially during the 1990s, it is still more than double the required price needed to compete against existing technologies [12, 14]. Figure 2-3 demonstrates the manufacturing cost decreases for the overall PV industry since 1992.
2.3 Types of PV SystemsTwo major types of PV systems are available in the marketplace today: flat plate and
concentrators. Flat plate systems are the most common, and they consist of PV modules on a rigid and flat surface to capture sunlight. Concentrating photovoltaic systems use a specifically designed area of mirrors or lenses to focus the sunlight into a small area of cells. These systems reduce the amount of semiconducting material, and improve the performance of the system. If these systems have single or dual axis tracking, they area called Heliostat concentrator photovoltaics (HCPV). Although there are many advantages to this type of system, they have been limited due to the cost of focusing, tracking and cooling equipment [14].
When the two systems are compared, flat plate systems are typically less complicated but employ a larger number of cells, while the concentrator systems use smaller areas of cells but require more sophisticated and expensive tracking systems. Images of these systems are shown in Figure 2-4.
Figure 2-4. Flat plate (a)
and solar concentrator PV systems (b)
(a) (b)
Chapter 3 Wind Energy3.1 Introduction3.2 History of Wind Power3.3 Principles and Characteristics3.5 Parts of a Wind Turbine3.6 Energy and Power in the Wind3.7 Impact of Tower Height 3.8 Theoretical Potential of Wind Power3.9 Simple Estimate of Wind Turbine Energy3.10 Capacity Factor3.11 Wind Farms3.12 Conclusions

cool air warms
warm air cools
coolair
sinks
warmair
rises
Chapter 3
39
Chapter 3 Wind Energy
3.1 IntroductionIt is sometimes difficult to imagine that something that you cannot see can have enough
movement to harness energy. Air is like any other fluid -- if it can be moved forcefully, the motion provides kinetic energy. In a wind-electric turbine, the turbine blades capture the kinetic energy of the wind. After the wind blade captures the wind energy, and starts moving, it spins a shaft which leads to a generator. In this way, rotational energy is turned into electrical energy. Wind power generates electricity by transferring energy from one medium to another. The typical wind power turbines are shown in Figure 3-1.
When air heats up, the hotter air quickly rises since a volume of hot air is lighter than an equal volume of cooler air. Hotter air particles exhibit a greater pressure than cooler particles; therefore, it takes fewer particles to maintain the same air pressure. When hot air rises, the cooler air flows into the spaces that the hot air leaves behind, and the air that rushes to fill the gap is called wind. Wind pushes on any object that is in its path, and in the process, transfers some of its own energy to the object. This is how a wind turbine captures energy from the wind. Figure 3-2 illustrates the air circulation due to temperature. Figure 3-2. Air circulation due to temperature
Figure 3-1. Wind power
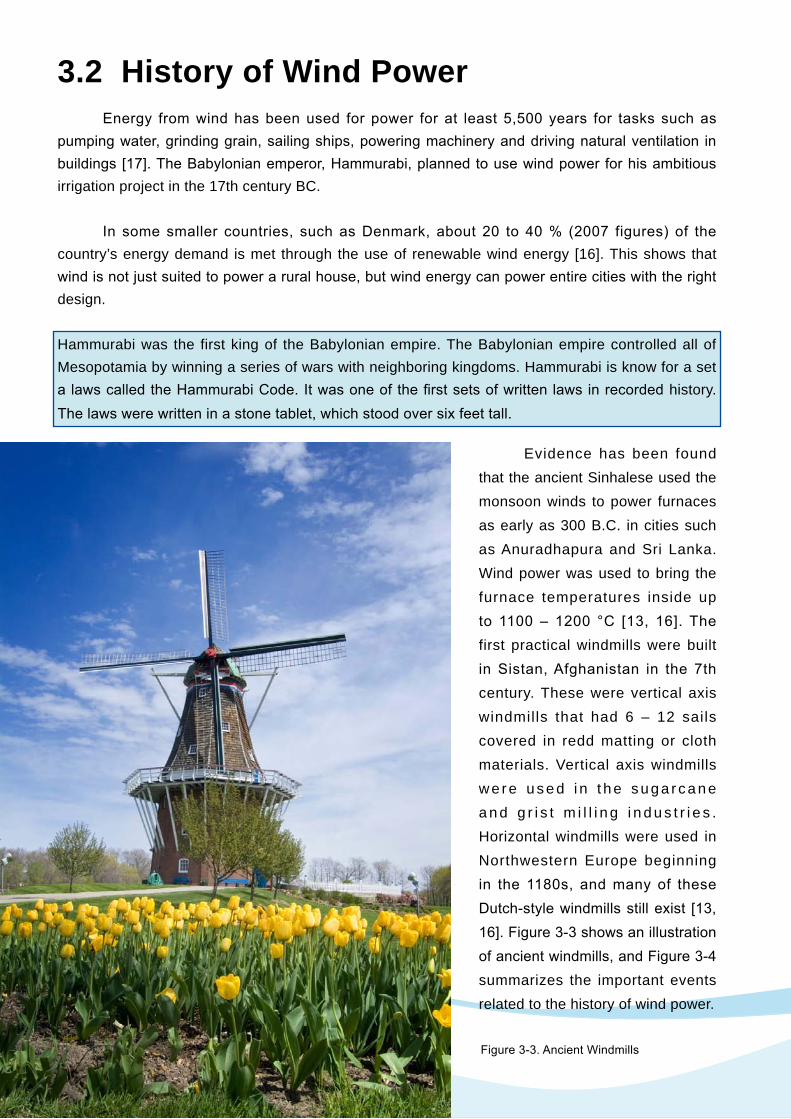
3.2 History of Wind PowerEnergy from wind has been used for power for at least 5,500 years for tasks such as
pumping water, grinding grain, sailing ships, powering machinery and driving natural ventilation in buildings [17]. The Babylonian emperor, Hammurabi, planned to use wind power for his ambitious irrigation project in the 17th century BC.
In some smaller countries, such as Denmark, about 20 to 40 % (2007 figures) of the
country’s energy demand is met through the use of renewable wind energy [16]. This shows that wind is not just suited to power a rural house, but wind energy can power entire cities with the right design.
Hammurabi was the first king of the Babylonian empire. The Babylonian empire controlled all of Mesopotamia by winning a series of wars with neighboring kingdoms. Hammurabi is know for a set a laws called the Hammurabi Code. It was one of the first sets of written laws in recorded history. The laws were written in a stone tablet, which stood over six feet tall.
Evidence has been found that the ancient Sinhalese used the monsoon winds to power furnaces as early as 300 B.C. in cities such as Anuradhapura and Sri Lanka. Wind power was used to bring the furnace temperatures inside up to 1100 – 1200 °C [13, 16]. The first practical windmills were built in Sistan, Afghanistan in the 7th century. These were vertical axis windmills that had 6 – 12 sails covered in redd matting or cloth materials. Vertical axis windmills w e r e u s e d i n t h e s u g a r c a n e a n d g r i s t m i l l i n g i n d u s t r i e s . Horizontal windmills were used in Northwestern Europe beginning in the 1180s, and many of these Dutch-style windmills still exist [13, 16]. Figure 3-3 shows an illustration of ancient windmills, and Figure 3-4 summarizes the important events related to the history of wind power.
Figure 3-3. Ancient Windmills
Chapter 3
53
Chapter 4 Electrolyzers4.1 Introduction4.2 History of Electrolyzers4.3 Types of Electrolyzer Designs4.4 Types of Electrolyzers4.5 Electrolyzer Efficiency4.6 Advanced Topic: The Basics of Thermodynamics ------Electrolyzer Design4.7 Current Hydrogen Production4.8 Opportunities for Electrolysis 4.9 Conclusions
56
There are more than enough solar and wind natural resources globally to produce all the hydrogen needed for stationary, transportation and portable applications. Electrolysis has the potential to meet the cost requirements specified by many governments around the world. There are market opportunities today for utilities to start gaining experience in hydrogen production to position themselves as transportation fuel providers of the future. Several utilities are currently conducting research into the integration and optimization of these technologies with the electric power grid.
The Renewable Energy Education Set offers a model of solar/hydrogen and wind/hydrogen systems.
4.2 History of ElectrolyzersThe history of electrolyzers and fuel cells are very similar because the basic principals
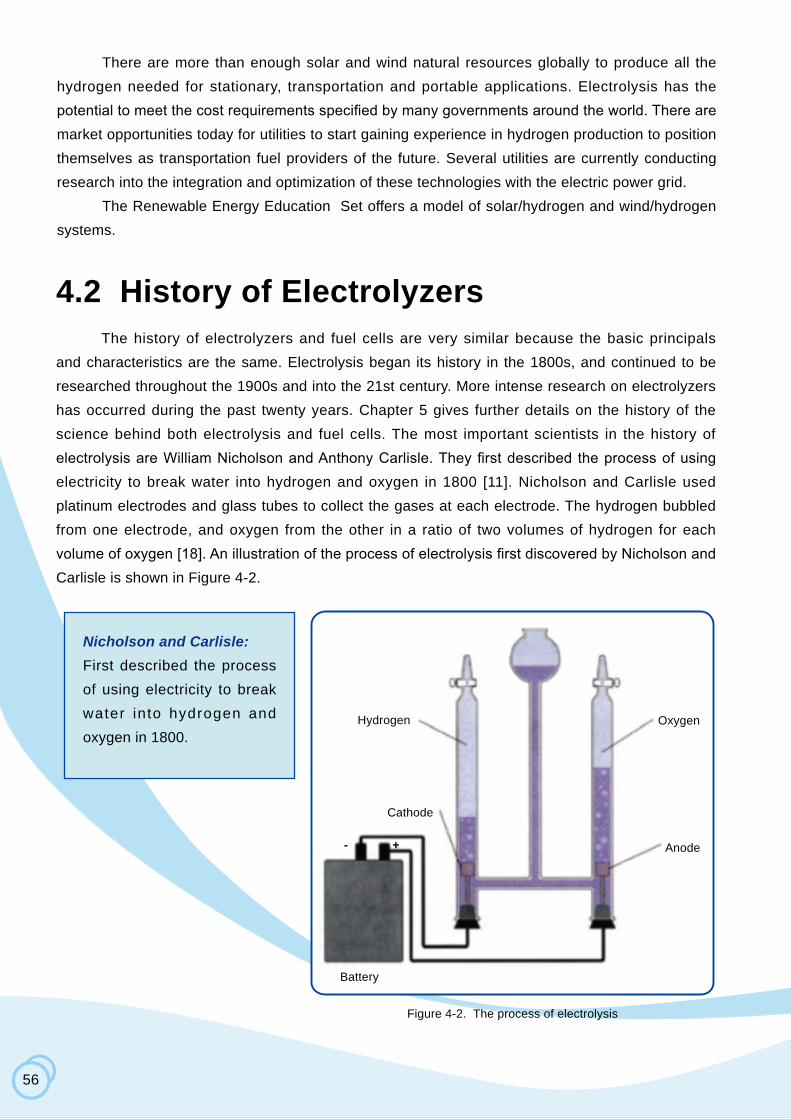
and characteristics are the same. Electrolysis began its history in the 1800s, and continued to be researched throughout the 1900s and into the 21st century. More intense research on electrolyzers has occurred during the past twenty years. Chapter 5 gives further details on the history of the science behind both electrolysis and fuel cells. The most important scientists in the history of electrolysis are William Nicholson and Anthony Carlisle. They first described the process of using electricity to break water into hydrogen and oxygen in 1800 [11]. Nicholson and Carlisle used platinum electrodes and glass tubes to collect the gases at each electrode. The hydrogen bubbled from one electrode, and oxygen from the other in a ratio of two volumes of hydrogen for each volume of oxygen [18]. An illustration of the process of electrolysis first discovered by Nicholson and Carlisle is shown in Figure 4-2.
Figure 4-2. The process of electrolysis
Nicholson and Carlisle: First described the process of using electricity to break water into hydrogen and oxygen in 1800.
Hydrogen
Cathode
- +
Battery
Anode
Oxygen
57
Chapter 4
William Nicholson
William Nicholson was an English chemist who was the first individual to produce a chemical react ion by electr ici ty. Nicholson had many professions, including inventor, engineer, translator and scientific publicist. After he heard about an invention called the electric battery by Italian physicist, Alessandro Volta, he tried to replicate the experiment by placing battery leads in water. Bubbles began accumulating on the submerged ends of the wires, which ultimately lead to the discovery of electrolysis.
4.3 Types of Electrolyzer DesignsElectrolyzers can be divided into two main designs: unipolar and bipolar. The unipolar design
typically uses liquid electrolyte, and the bipolar design uses a solid polymer electrolyte. More details about these electrolyzer designs are given in Sections 4.3.1 and 4.3.2.
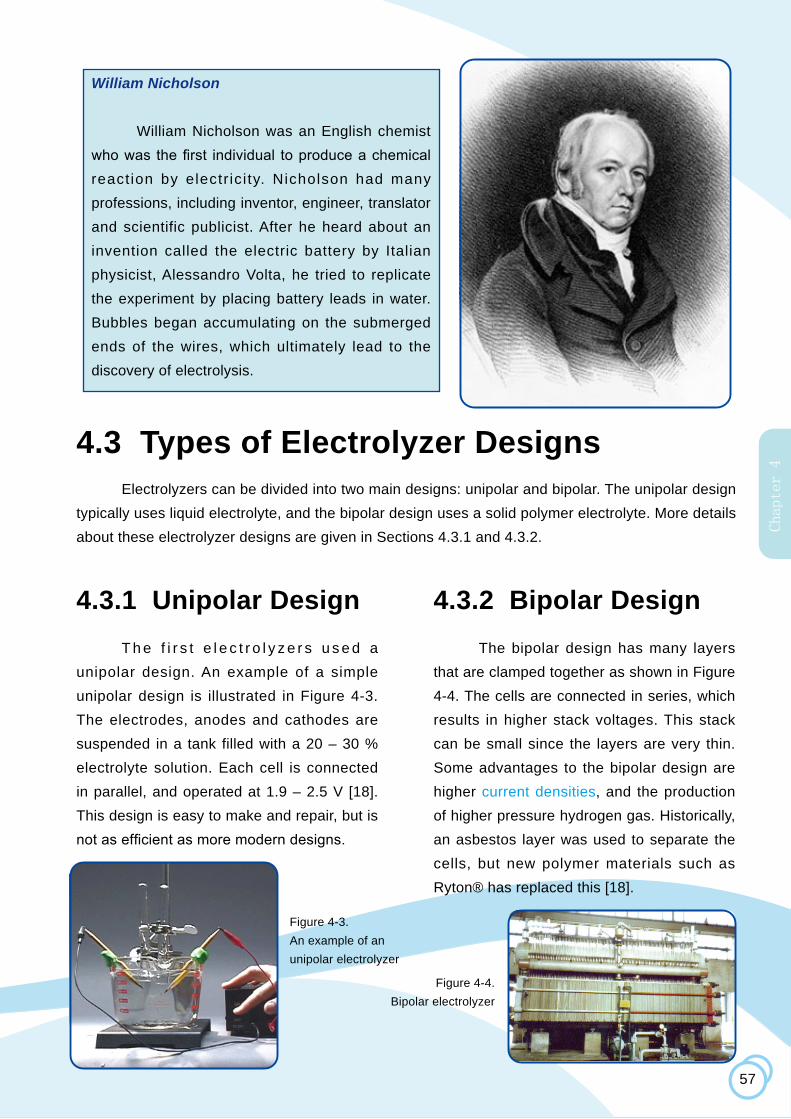
4.3.1 Unipolar DesignT h e f i r s t e l e c t r o l y z e r s u s e d a
unipolar design. An example of a simple unipolar design is illustrated in Figure 4-3. The electrodes, anodes and cathodes are suspended in a tank filled with a 20 – 30 % electrolyte solution. Each cell is connected in parallel, and operated at 1.9 – 2.5 V [18]. This design is easy to make and repair, but is not as efficient as more modern designs.
Figure 4-3. An example of an unipolar electrolyzer
Figure 4-4. Bipolar electrolyzer
4.3.2 Bipolar DesignThe bipolar design has many layers
that are clamped together as shown in Figure 4-4. The cells are connected in series, which results in higher stack voltages. This stack can be small since the layers are very thin. Some advantages to the bipolar design are higher current densities, and the production of higher pressure hydrogen gas. Historically, an asbestos layer was used to separate the cells, but new polymer materials such as Ryton® has replaced this [18].
65
Chapter 4
The future market for hydrogen is much larger. Electrolysis will become a viable option for competition in the hydrogen market as the price of natural gas increases. If hydrogen is going to be used as the preferred transportation fuel, the environmental gains by transitioning to a hydrogen economy can only be realized when renewable energy sources are used to produce an increasing amount of hydrogen gas. Electrolyte hydrogen production offers a more stable and secure energy future over oil.
4.8 Opportunities for Electrolysis Integrating electrolyzers with a renewable energy system creates unique opportunities for
providing power in the future. Renewable energy systems can connect to the utility grid through power electronics. The power electronics convert the alternating current (AC) from the grid to direct current (DC) power required by the electrolysis cell stack. Both PV and wind energy systems can be used as an electricity source. In many of the wind/electrolyzer systems used today for producing hydrogen, the electrolyzer uses the AC from the wind turbine directly.
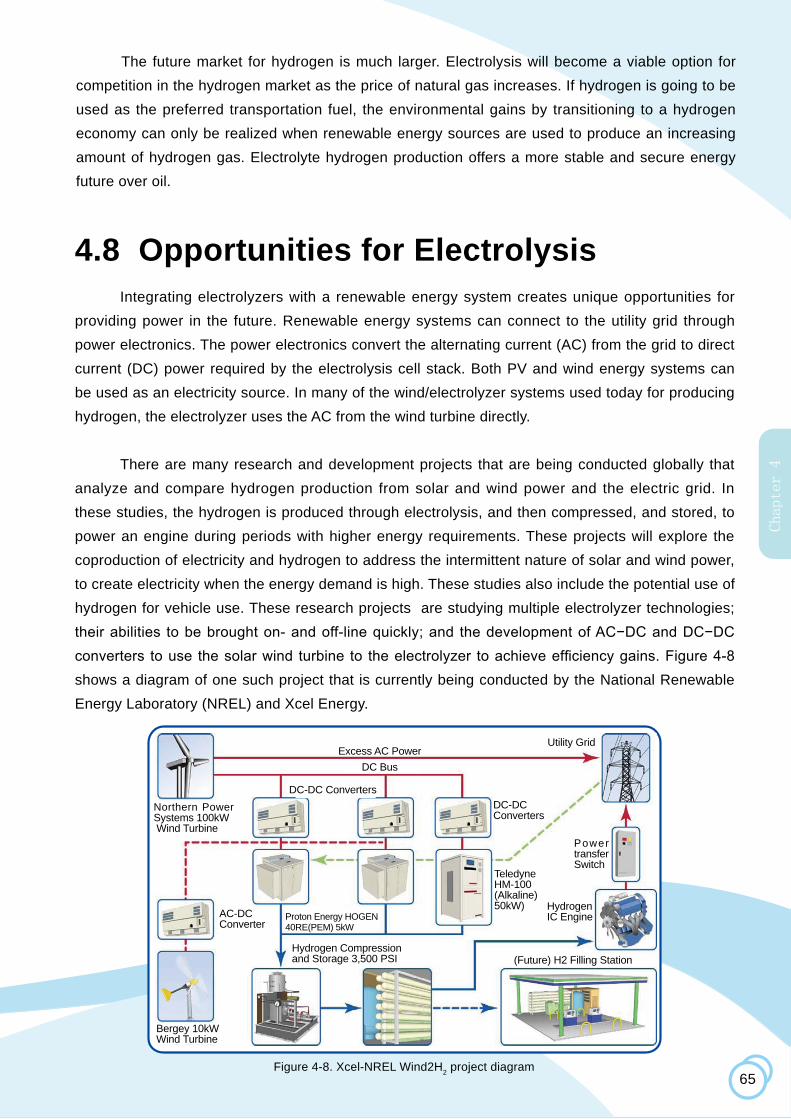
There are many research and development projects that are being conducted globally that analyze and compare hydrogen production from solar and wind power and the electric grid. In these studies, the hydrogen is produced through electrolysis, and then compressed, and stored, to power an engine during periods with higher energy requirements. These projects will explore the coproduction of electricity and hydrogen to address the intermittent nature of solar and wind power, to create electricity when the energy demand is high. These studies also include the potential use of hydrogen for vehicle use. These research projects are studying multiple electrolyzer technologies; their abilities to be brought on- and off-line quickly; and the development of AC−DC and DC−DC converters to use the solar wind turbine to the electrolyzer to achieve efficiency gains. Figure 4-8 shows a diagram of one such project that is currently being conducted by the National Renewable Energy Laboratory (NREL) and Xcel Energy.
Figure 4-8. Xcel-NREL Wind2H2 project diagram
Northern Power Systems 100kW Wind Turbine
DC-DC Converters
AC-DC Converter
Bergey 10kWWind Turbine
Proton Energy HOGEN40RE(PEM) 5kW
Hydrogen Compressionand Storage 3,500 PSI (Future) H2 Filling Station
DC-DC Converters
Power transfer Switch
TeledyneHM-100(Alkaline)50kW) Hydrogen
IC Engine
Excess AC PowerDC Bus
Utility Grid

67
Chapter 4
Chapter 5Fuel Cells 5.1 Introduction5.2 History of Fuel Cells5.3 Fuel Cell Applications5.4 Types of Fuel Cells5.5 How Do Fuel Cells Work?5.6 Stack Design and Configuration5.7 Operating Conditions5.8 Conclusions
Proton Exchange Membrane
Fuel H2 (Hydrogen)
Used Fuel Recirculates
Flow Field Plate
Catalyst Catalyst
Flow Field Plate
Air + Water Vapor
O (Oxygen)
Heate
e ee e
e
e
e
Electric Circuit
Gas Diffusion Electrode (Cathode)
Gas Diffusion Electrode (Anode)
Chapter 5
79
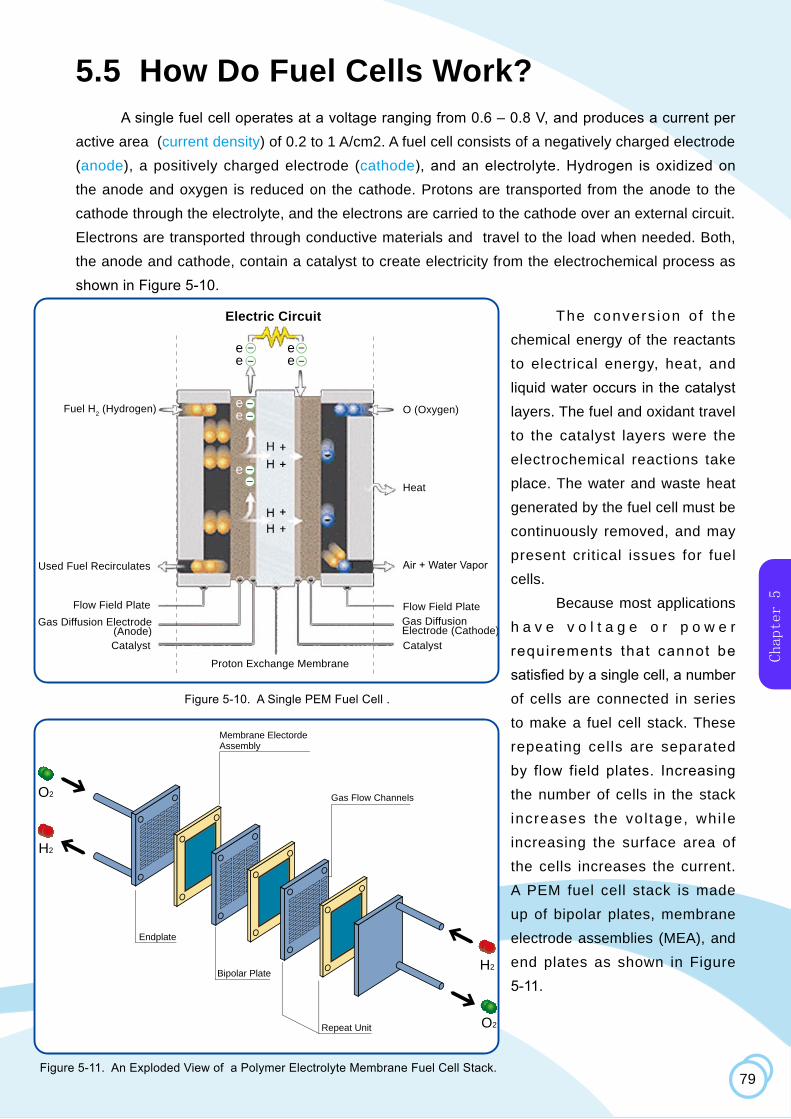
5.5 How Do Fuel Cells Work?A single fuel cell operates at a voltage ranging from 0.6 – 0.8 V, and produces a current per
active area (current density) of 0.2 to 1 A/cm2. A fuel cell consists of a negatively charged electrode (anode), a positively charged electrode (cathode), and an electrolyte. Hydrogen is oxidized on the anode and oxygen is reduced on the cathode. Protons are transported from the anode to the cathode through the electrolyte, and the electrons are carried to the cathode over an external circuit. Electrons are transported through conductive materials and travel to the load when needed. Both, the anode and cathode, contain a catalyst to create electricity from the electrochemical process as shown in Figure 5-10.
The convers ion o f the chemical energy of the reactants to electrical energy, heat, and liquid water occurs in the catalyst layers. The fuel and oxidant travel to the catalyst layers were the electrochemical reactions take place. The water and waste heat generated by the fuel cell must be continuously removed, and may present critical issues for fuel cells.
Because most applications h a v e v o l t a g e o r p o w e r requirements that cannot be satisfied by a single cell, a number of cells are connected in series to make a fuel cell stack. These repeating cells are separated by flow field plates. Increasing the number of cells in the stack increases the vol tage, whi le increasing the surface area of the cells increases the current. A PEM fuel cell stack is made up of bipolar plates, membrane electrode assemblies (MEA), and end plates as shown in Figure 5-11.
Figure 5-10. A Single PEM Fuel Cell .
Figure 5-11. An Exploded View of a Polymer Electrolyte Membrane Fuel Cell Stack.
Repeat Unit
Bipolar Plate
Endplate
Membrane ElectordeAssembly
O2
O2
H2
H2
Gas Flow Channels
Chapter 6 Hydrogen Storage & Transportation6.1 Introduction6.2 Safety Aspects of Hydrogen as a Fuel6.3 Hydrogen Production, Distribution, and Storage6.4 Technologies for Hydrogen Storage6.5 Worldwide Hydrogen Refueling Stations6.6 Conclusions
Property Hydrogen Methane Methanol Ethanol Propane Gasoline
Molecular Weight (g/mol)
2.016 16.043 32.04 46.0634 44.10 ~107.0
Density (kg/m3) 20 °C and 1 atm
0.08375 0.6682 791 789 1.865 751
N o r m a l B o i l i n g point (oC)
-252.8 -161.5 64.5 78.5 -42.1 27-225
Flash Point (oC) <-253 -188 11 13 -104 -43
Flammability Limits in Air (Volume %)
4.0-75.0 5.0-153.0 6.7-36.0 3.3-19 2.1-10.1 1.0-7.6
CO2 Production per Energy Unit
0 1.00 1.50 1.60 1.70 1.80
Auto ign i t ionTemperature in Air (oC)
585 540 385 423 490 230-480
H i g h e r H e a t i n g Value (MJ/kg)
142.0 55.5 22.9 29.8 50.2 47.3
L o w e r H e a t i n g Value (MJ/kg)
120.0 50.0 20.1 27.0 46.3 44.0 Chapter 6
85
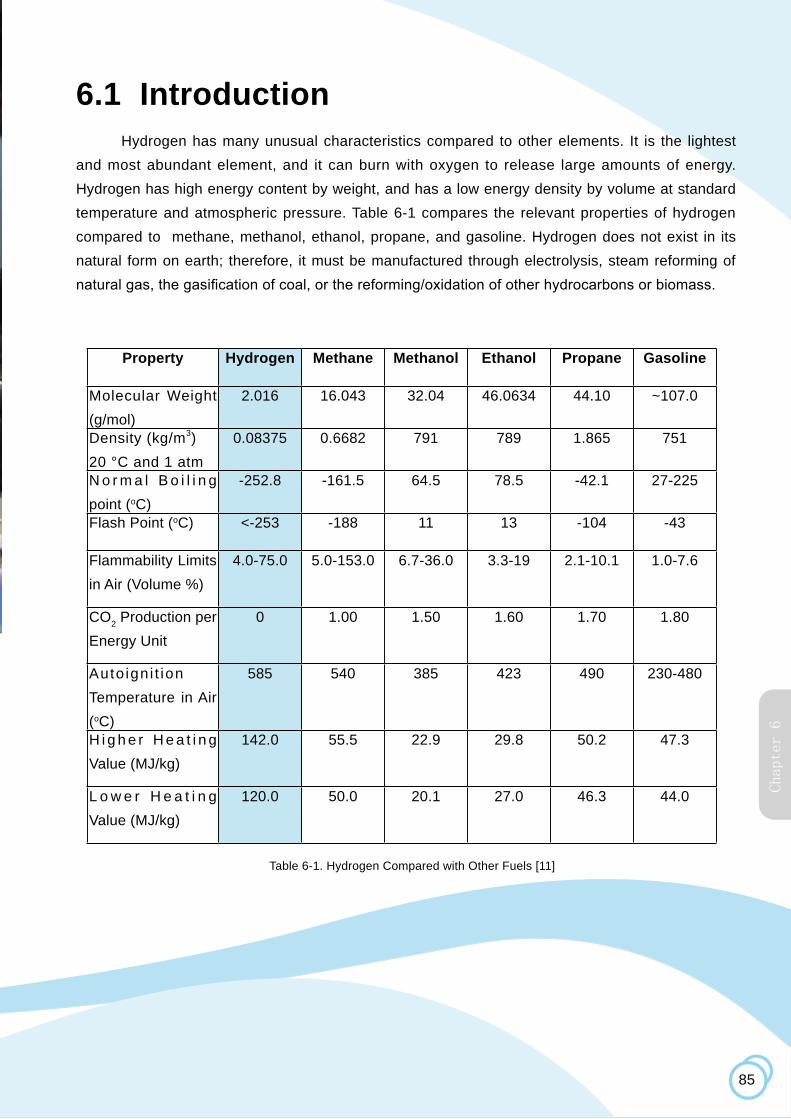
6.1 IntroductionHydrogen has many unusual characteristics compared to other elements. It is the lightest
and most abundant element, and it can burn with oxygen to release large amounts of energy. Hydrogen has high energy content by weight, and has a low energy density by volume at standard temperature and atmospheric pressure. Table 6-1 compares the relevant properties of hydrogen compared to methane, methanol, ethanol, propane, and gasoline. Hydrogen does not exist in its natural form on earth; therefore, it must be manufactured through electrolysis, steam reforming of natural gas, the gasification of coal, or the reforming/oxidation of other hydrocarbons or biomass.
Table 6-1. Hydrogen Compared with Other Fuels [11]
Chapter 6
91
6.4 Technologies for Hydrogen StorageMany commercially available technologies exist for storing hydrogen. The most common
storage method used today is the pressurized storage tank, which is available in many sizes and pressure ranges. Other storage methods that may be considered for various applications in the future are described in this section.
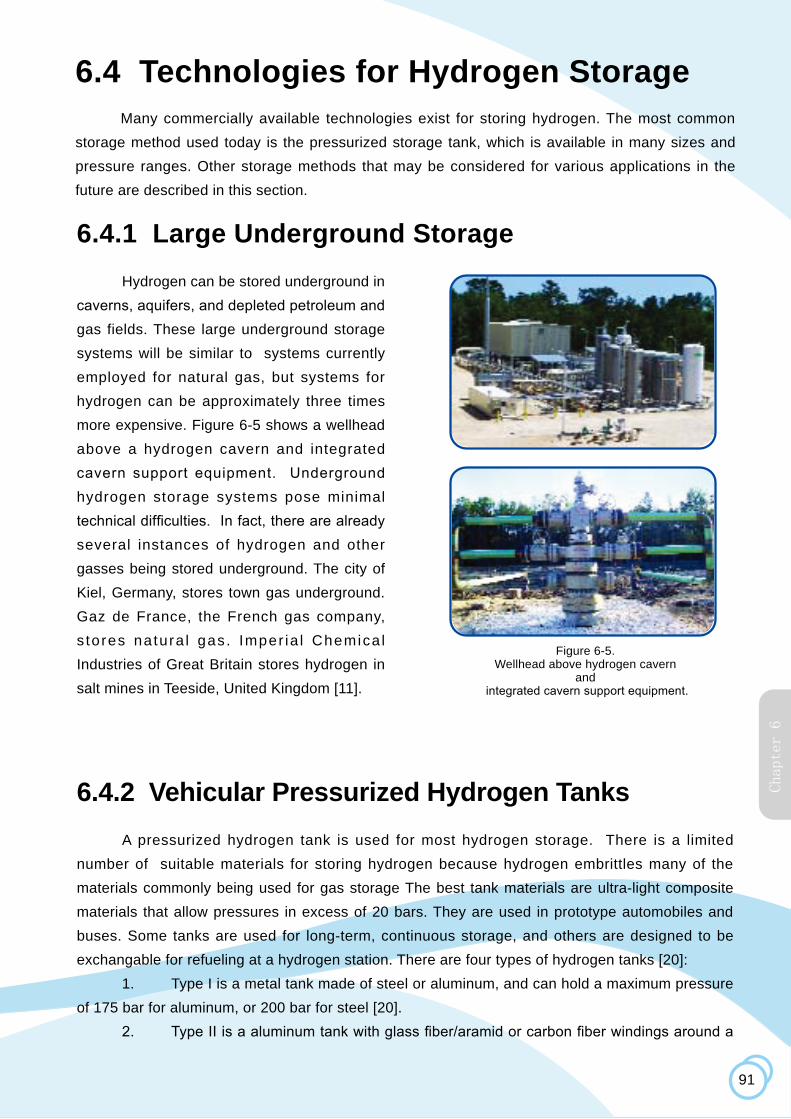
6.4.1 Large Underground StorageHydrogen can be stored underground in
caverns, aquifers, and depleted petroleum and gas fields. These large underground storage systems will be similar to systems currently employed for natural gas, but systems for hydrogen can be approximately three times more expensive. Figure 6-5 shows a wellhead above a hydrogen cavern and integrated cavern support equipment. Underground hydrogen storage systems pose minimal technical difficulties. In fact, there are already several instances of hydrogen and other gasses being stored underground. The city of Kiel, Germany, stores town gas underground. Gaz de France, the French gas company, s tores natura l gas. Imper ia l Chemica l Industries of Great Britain stores hydrogen in salt mines in Teeside, United Kingdom [11].
6.4.2 Vehicular Pressurized Hydrogen TanksA pressurized hydrogen tank is used for most hydrogen storage. There is a limited
number of suitable materials for storing hydrogen because hydrogen embrittles many of the materials commonly being used for gas storage The best tank materials are ultra-light composite materials that allow pressures in excess of 20 bars. They are used in prototype automobiles and buses. Some tanks are used for long-term, continuous storage, and others are designed to be exchangable for refueling at a hydrogen station. There are four types of hydrogen tanks [20]:
1. Type I is a metal tank made of steel or aluminum, and can hold a maximum pressure of 175 bar for aluminum, or 200 bar for steel [20].
2. Type II is a aluminum tank with glass fiber/aramid or carbon fiber windings around a
Figure 6-5. Wellhead above hydrogen cavern
and integrated cavern support equipment.
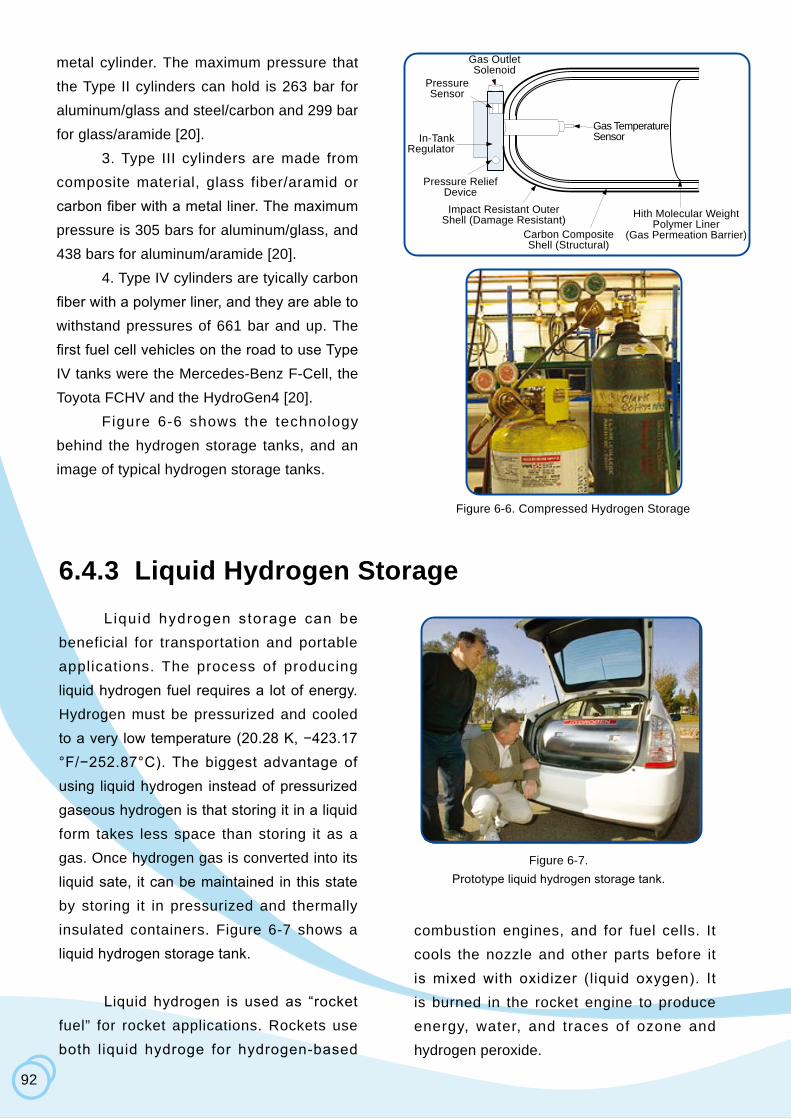
Figure 6-6. Compressed Hydrogen Storage
Gas Outlet Solenoid
Pressure Sensor
Pressure ReliefDevice
In-TankRegulator
Gas TemperatureSensor
Hith Molecular WeightPolymer Liner
(Gas Permeation Barrier)
Impact Resistant OuterShell (Damage Resistant)
Carbon Composite Shell (Structural)
92
metal cylinder. The maximum pressure that the Type II cylinders can hold is 263 bar for aluminum/glass and steel/carbon and 299 bar for glass/aramide [20].
3. Type III cylinders are made from composite material, glass fiber/aramid or carbon fiber with a metal liner. The maximum pressure is 305 bars for aluminum/glass, and 438 bars for aluminum/aramide [20].
4. Type IV cylinders are tyically carbon fiber with a polymer liner, and they are able to withstand pressures of 661 bar and up. The first fuel cell vehicles on the road to use Type IV tanks were the Mercedes-Benz F-Cell, the Toyota FCHV and the HydroGen4 [20].
Figure 6-6 shows the technology behind the hydrogen storage tanks, and an image of typical hydrogen storage tanks.
6.4.3 Liquid Hydrogen StorageLiquid hydrogen storage can be
beneficial for transportation and portable applications. The process of producing liquid hydrogen fuel requires a lot of energy. Hydrogen must be pressurized and cooled to a very low temperature (20.28 K, −423.17 °F/−252.87°C). The biggest advantage of using liquid hydrogen instead of pressurized gaseous hydrogen is that storing it in a liquid form takes less space than storing it as a gas. Once hydrogen gas is converted into its liquid sate, it can be maintained in this state by storing it in pressurized and thermally insulated containers. Figure 6-7 shows a liquid hydrogen storage tank.
Liquid hydrogen is used as “rocket fuel” for rocket applications. Rockets use both liquid hydroge for hydrogen-based
combustion engines, and for fuel cells. It cools the nozzle and other parts before it is mixed with oxidizer (liquid oxygen). It is burned in the rocket engine to produce energy, water, and traces of ozone and hydrogen peroxide.
Figure 6-7. Prototype liquid hydrogen storage tank.
Chapter 6
93
6.4.4 Metal Hydride StorageMetal hydride hydrogen storage has
been the focus of intense research during the last 25 years. Many types of metal hydrides have been developed that readily absorb and deabsorb hydrogen at room temperature and atmospheric pressure (20 °C and 1 atm). The group of lighter metals in the periodic table, such as Li, Be, Na, Mg, B and Al form a large variety of metal hydride compounds. These compounds are very interesting because they are lightweight and have a high ratio of hydrogen atoms per metal atom, which is usually around a ratio of H/M = 2.
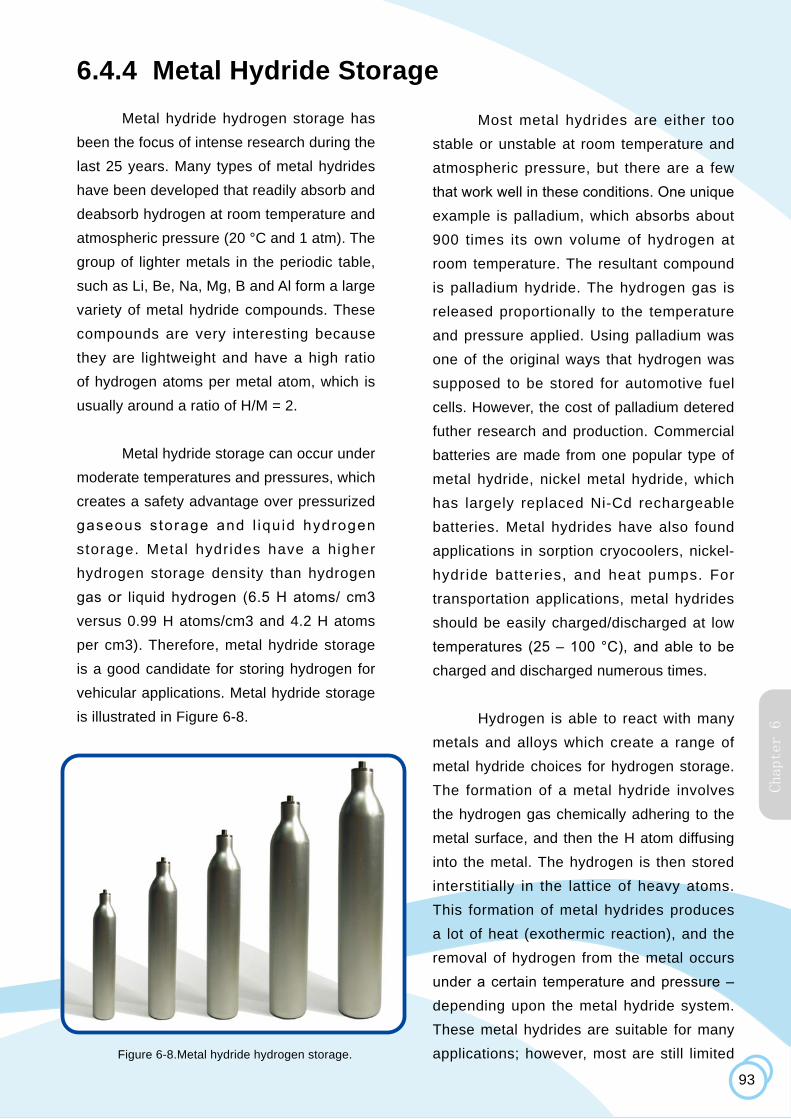
Metal hydride storage can occur under moderate temperatures and pressures, which creates a safety advantage over pressurized gaseous storage and l iqu id hydrogen storage. Metal hydrides have a higher hydrogen storage density than hydrogen gas or liquid hydrogen (6.5 H atoms/ cm3 versus 0.99 H atoms/cm3 and 4.2 H atoms per cm3). Therefore, metal hydride storage is a good candidate for storing hydrogen for vehicular applications. Metal hydride storage is illustrated in Figure 6-8.
Most metal hydrides are either too stable or unstable at room temperature and atmospheric pressure, but there are a few that work well in these conditions. One unique example is palladium, which absorbs about 900 times its own volume of hydrogen at room temperature. The resultant compound is palladium hydride. The hydrogen gas is released proportionally to the temperature and pressure applied. Using palladium was one of the original ways that hydrogen was supposed to be stored for automotive fuel cells. However, the cost of palladium detered futher research and production. Commercial batteries are made from one popular type of metal hydride, nickel metal hydride, which has largely replaced Ni-Cd rechargeable batteries. Metal hydrides have also found applications in sorption cryocoolers, nickel-hydride batteries, and heat pumps. For transportation applications, metal hydrides should be easily charged/discharged at low temperatures (25 – 100 °C), and able to be charged and discharged numerous times.
Hydrogen is able to react with many metals and alloys which create a range of metal hydride choices for hydrogen storage. The formation of a metal hydride involves the hydrogen gas chemically adhering to the metal surface, and then the H atom diffusing into the metal. The hydrogen is then stored interstitially in the lattice of heavy atoms. This formation of metal hydrides produces a lot of heat (exothermic reaction), and the removal of hydrogen from the metal occurs under a certain temperature and pressure – depending upon the metal hydride system. These metal hydrides are suitable for many applications; however, most are still limited Figure 6-8.Metal hydride hydrogen storage.

Chapter 7 Basic Power Electronics7.1 Introduction7.2 The Basics of Electronics7.3 Analog and Digital Electronics7.4 Ohm’s Law7.5 History of Electronics7.6 Power Electronics for Renewable Energy systems7.7 Types of Semiconductor 7.8 Converters for Power Systems7.9 Conclusions
100
There are 118 types of atoms, as can be seen in a periodic table (insert image of periodic table). Combinations of atoms make up every single element. The difference between the types of atoms in the periodic table are due to the arrangement of electrons, protons and neutrons in each atom. No matter how many particles an atom has -- the number of protons and electrons are the same for each element. This explains why the periodic table is numbered from 1 to 118; each elementisspecifiedbyitsthenumberofprotonsandelectrons.Aslongasthenumberofprotonsand electrons are the same, the atom is balanced and stable.
If an atom loses an electron, it has more protons than electrons, and this atom would be called “positively-charged”. An atom that gains electrons is more “negatively charged”. Depending upon the type of material, electrons can be made to move between the atoms – and this creates a current of electricity. When one electron is attached to an atom, another electron is lost, which then moves to the next atom.
In order to create electricity, scientists have found ways to create large numbers of positively and negatively charged atoms. These groups have strong attractions to each other. The movement of electrons creates a current of electricity. When an electron is removed from an atom, it becomes positively-charged. Atoms in nature do not like to be positively or negatively-charged because they are unstable in this state. They need to obtain a stable or neutrally-charged state. In order to return to the balanced state, the atom wants to obtain a “free” electron. The positively charged atom wants a negatively-charged electron to return to a neutral state.
Electricity conducts better in certain materials. If the atoms in a material hold the electrons in their orbit very tightly, that particular piece of material will not conduct electrons well. The materials that do not conduct electrons well are called insulators. Some types of insulators include plastics, cloth, and glass. Materials that allow electrons to be easily moved from their orbits are called conductors. Some examples of conductors are called copper, aluminum, and steel. The measurement of how well something conducts electricity is called resistance. Resistance depends not only on the material, but how long the materials are. This determines the distance that the electrons need to travel.
101
+-
- +. .
. .. .
Load
Chapter 3
Chapter 7
7.2.1 CircuitsIn electronics, electrons are “collected”
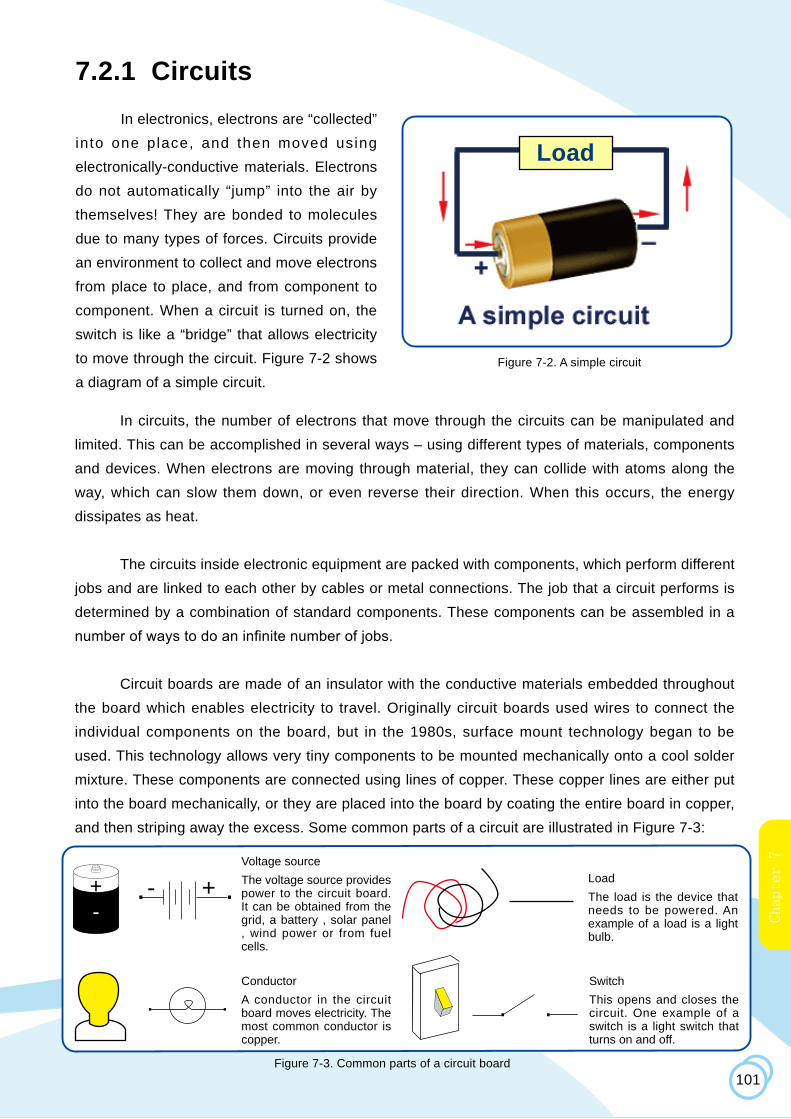
into one place, and then moved using electronically-conductive materials. Electrons do not automatically “jump” into the air by themselves! They are bonded to molecules due to many types of forces. Circuits provide an environment to collect and move electrons from place to place, and from component to component. When a circuit is turned on, the switch is like a “bridge” that allows electricity to move through the circuit. Figure 7-2 shows a diagram of a simple circuit.
In circuits, the number of electrons that move through the circuits can be manipulated and limited. This can be accomplished in several ways – using different types of materials, components and devices. When electrons are moving through material, they can collide with atoms along the way, which can slow them down, or even reverse their direction. When this occurs, the energy dissipates as heat.
The circuits inside electronic equipment are packed with components, which perform different jobs and are linked to each other by cables or metal connections. The job that a circuit performs is determined by a combination of standard components. These components can be assembled in a numberofwaystodoaninfinitenumberofjobs.
Circuit boards are made of an insulator with the conductive materials embedded throughout the board which enables electricity to travel. Originally circuit boards used wires to connect the individual components on the board, but in the 1980s, surface mount technology began to be used. This technology allows very tiny components to be mounted mechanically onto a cool solder mixture. These components are connected using lines of copper. These copper lines are either put into the board mechanically, or they are placed into the board by coating the entire board in copper, and then striping away the excess. Some common parts of a circuit are illustrated in Figure 7-3:
Figure 7-2. A simple circuit
Figure 7-3. Common parts of a circuit board
Voltage sourceThe voltage source provides power to the circuit board.It can be obtained from the grid, a battery , solar panel , wind power or from fuel cells.
LoadThe load is the device that needs to be powered. An example of a load is a light bulb.
SwitchThis opens and closes the circuit. One example of a switch is a light switch that turns on and off.
ConductorA conductor in the circuit board moves electricity. The most common conductor is copper.
Horizon Renewable Energy Education Experiment Manual
ContentsExperiment Guide Introduction• Introduction• Adding More Depth to the Experiments • Supporting Information• Grade Level and Subject Appropriateness• Getting Familiar with the Kit• Renewable Energy Monitor• Electrical Components, Circuits, and Terminology• Learning to Correctly Use a Multimeter• Measuring Voltage, Current, Power and Resistance• Ohm’s Law • The WindPitch Educational Wind Turbine• Adapting Other Horizon Products to the Experiments
Solar Energy Experiments1. The Effect of Heat on Solar Panels2. The Effect of Shade on Solar Panels3. The Effect of Tilt Angle on Solar Panels4. Finding the Solar Panel’s Maximum Power Point
Wind Energy Experiments5. Wind Power - How Many Blades Are Best - 1, 2, 3 ... More?6. Wind Power - Using Three Different Curved Blade Shapes7. Wind Power - Using Blades You Make Yourself8. Wind Power - Turbine Efficiencies9. Wind Power - Measuring RPM10. Wind Power -Tuning For Maximum Power11. Wind Power- To Generate Hydrogen
Energy from Hydrogen (Fuel Cell) Experiments12. Electrolysis Mode Generating Hydrogen and Oxygen from Water13. Fuel Cell Mode Generating Electricity from Hydrogen and Oxygen14. Determining the Minimum Voltage for Water Decomposition15. Polarization States for Hydrogen Fuel Cells
Ultra Cool Experiments16. Build a Solar Farm17. Build a Wind Farm 18. Build a Fuel Cells Stack19. Running Your School With Hydrogen20. Running Your School With Solar Power21. Running Your School With Wind Power
About the Author
1-16
18-38
39-77
78-100
101-140
141

Introduction
The Horizon Renewable Energy Science Education Set provides for interest ing experiments with fuel cells, solar panels and wind turbines. In addition, other electrical components such as resistors, LEDs motors and propellers are used as “loads” for these devices. If you are unsure about the term “load” or what a resistor or LED really is and does, refer to the “Electrical Components and Circuits” section of this manual where you will find a host of useful information on basic electricity concepts and the components used in the experiments.
The exper iments are sub-d iv ided in to functional sections that cover solar panels, stationary fuel cells, a wind turbine and fuel cell car experiments. You don’t have to perform the experiments in any particular order, so feel free to skip around from one to the other as you and your students see fit.
In addition to the standard experiments there are some Ultra Cool ones that provide even more excitement and desire to learn on the part of students. Learning math and science using renewable energy will inspire your students to greater goals and achievements.
Adding More Depth to the Experiments Each experiment follows a similar outline that not only provides a mechanism for easy performance and an understanding of what to do, it also gives your students the opportunity to expand on the experiment by posing “What If” questions on the experiment just performed. For example:
What if - you changed the tilt angle of the solar panel? Will it make any difference in the voltage, current and power outputs?What i f - a wind turbine had longer blades? Will it generate more or less power compared to a wind turbine with shorter blades? What if - a fuel cell used pure oxygen instead of plain air? Will it generate more power when it mixed with pure hydrogen?
These and other practical and hypothetical questions are posed for each experiment. There are also related research questions that give students the opportunity to go beyond the experimental procedures to discover more about the renewable energy technologies they are studying.
Supporting InformationThe experiments are supported by additional information found in the accompanying publication “Renewable Energy Science Educa t i on Manua l ” t h a t p r o v i d e s a n exceptionally rich amount of data, photos and illustrations on the following topics:
Chapter 1: The Environment and Climate ChangeChapter 2: Solar EnergyChapter 3: Wind EnergyChapter 4: ElectrolyzersChapter 5: Fuel CellsChapter 6: Hydrogen Storage & TransportationChapter 7: Basic Power Electronics
Renewable EnergyScience Education Set
1
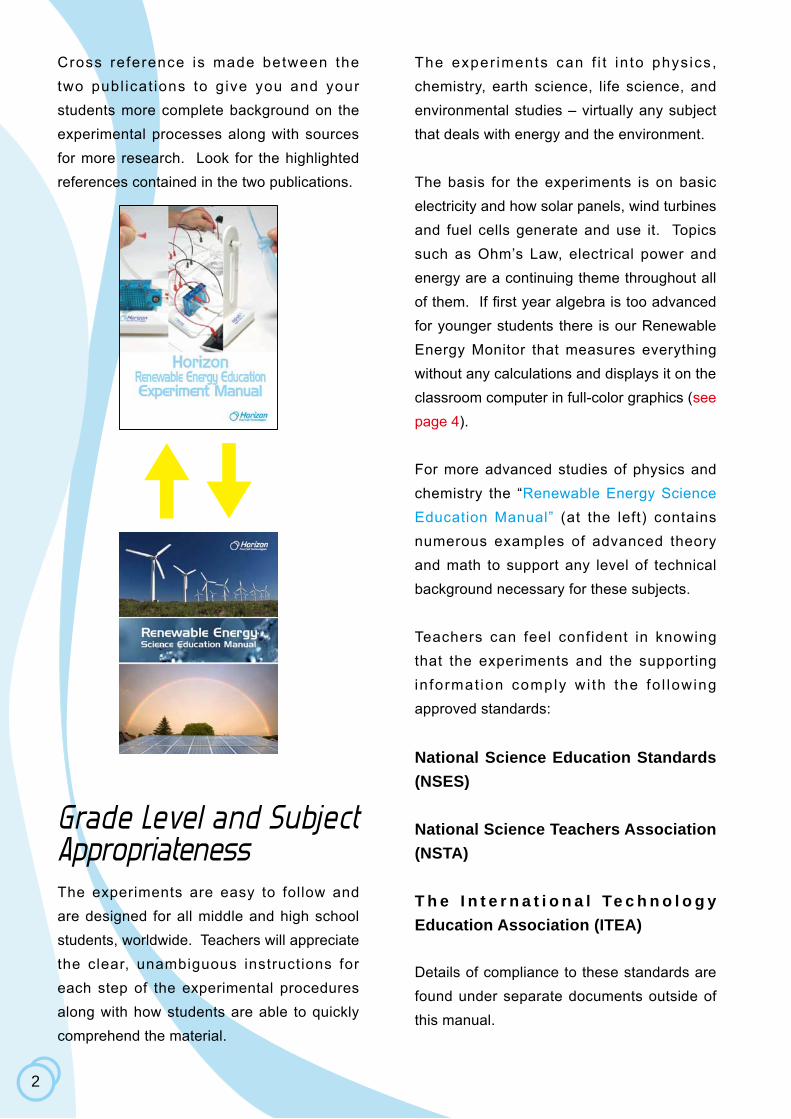
2
Cross reference is made between the two publ icat ions to give you and your students more complete background on the experimental processes along with sources for more research. Look for the highlighted references contained in the two publications.
Grade Level and Subject AppropriatenessThe experiments are easy to follow and are designed for all middle and high school students, worldwide. Teachers will appreciate the clear, unambiguous instructions for each step of the experimental procedures along with how students are able to quickly comprehend the material.
The exper iments can f i t in to phys ics, chemistry, earth science, life science, and environmental studies – virtually any subject that deals with energy and the environment.
The basis for the experiments is on basic electricity and how solar panels, wind turbines and fuel cells generate and use it. Topics such as Ohm’s Law, electrical power and energy are a continuing theme throughout all of them. If first year algebra is too advanced for younger students there is our Renewable Energy Monitor that measures everything without any calculations and displays it on the classroom computer in full-color graphics (see page 4). For more advanced studies of physics and chemistry the “Renewable Energy Science Education Manual” (at the left) contains numerous examples of advanced theory and math to support any level of technical background necessary for these subjects.
Teachers can feel confident in knowing that the experiments and the supporting in format ion comply wi th the fo l lowing approved standards:
National Science Education Standards (NSES)
National Science Teachers Association (NSTA)
T h e I n t e r n a t i o n a l Te c h n o l o g y Education Association (ITEA)
Details of compliance to these standards are found under separate documents outside of this manual.
4
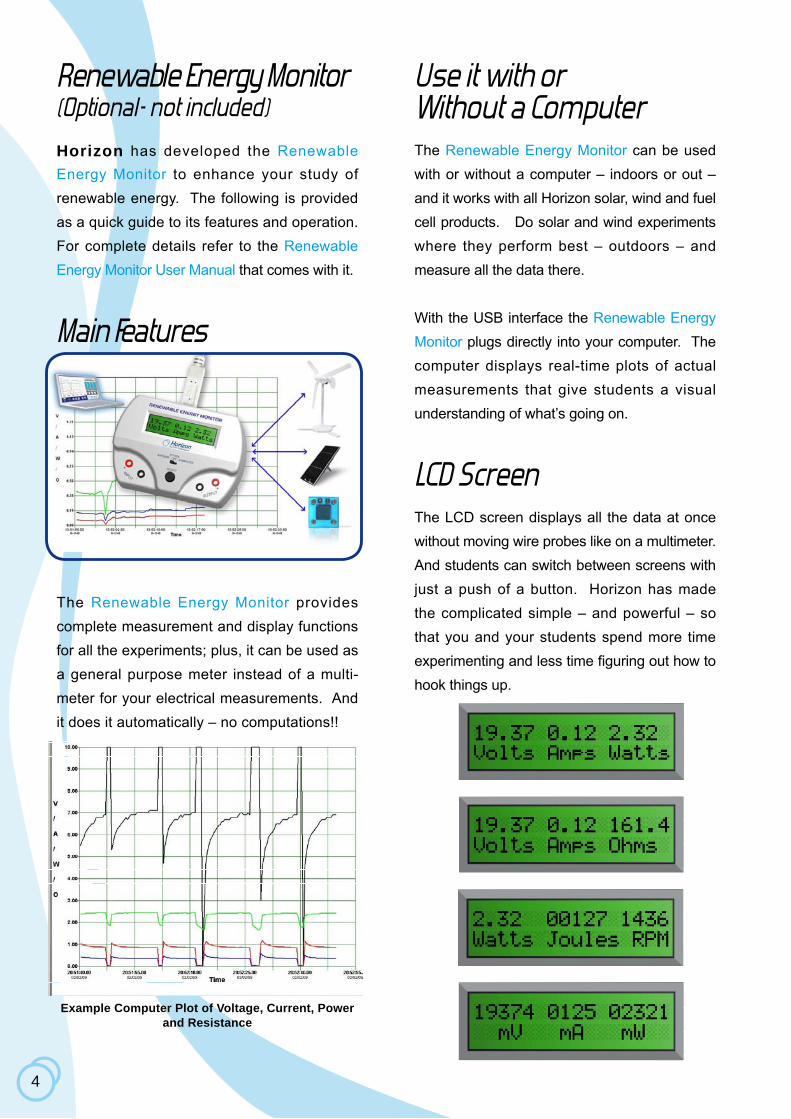
Renewable Energy Monitor(Optional- not included)
Horizon has developed the Renewable Energy Monitor to enhance your study of renewable energy. The following is provided as a quick guide to its features and operation. For complete details refer to the Renewable Energy Monitor User Manual that comes with it.
Main Features
The Renewable Energy Monitor provides complete measurement and display functions for all the experiments; plus, it can be used as a general purpose meter instead of a multi-meter for your electrical measurements. And it does it automatically – no computations!!
Example Computer Plot of Voltage, Current, Power and Resistance
Use it with or Without a ComputerThe Renewable Energy Monitor can be used with or without a computer – indoors or out – and it works with all Horizon solar, wind and fuel cell products. Do solar and wind experiments where they perform best – outdoors – and measure all the data there.
With the USB interface the Renewable Energy Monitor plugs directly into your computer. The computer displays real-time plots of actual measurements that give students a visual understanding of what’s going on.
LCD ScreenThe LCD screen displays all the data at once without moving wire probes like on a multimeter. And students can switch between screens with just a push of a button. Horizon has made the complicated simple – and powerful – so that you and your students spend more time experimenting and less time figuring out how to hook things up.
8
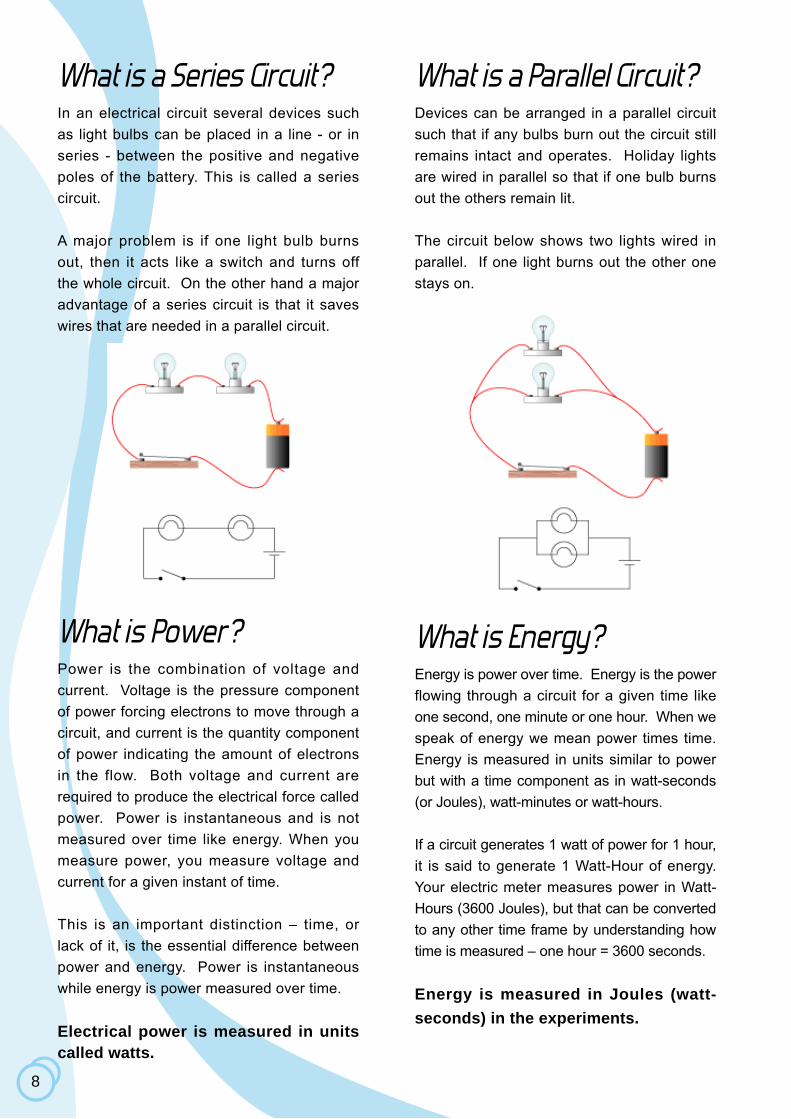
What is a Series Circuit ?In an electrical circuit several devices such as light bulbs can be placed in a line - or in series - between the positive and negative poles of the battery. This is called a series circuit.
A major problem is if one light bulb burns out, then it acts like a switch and turns off the whole circuit. On the other hand a major advantage of a series circuit is that it saves wires that are needed in a parallel circuit.
What is Power ?Power is the combination of voltage and current. Voltage is the pressure component of power forcing electrons to move through a circuit, and current is the quantity component of power indicating the amount of electrons in the flow. Both voltage and current are required to produce the electrical force called power. Power is instantaneous and is not measured over time like energy. When you measure power, you measure voltage and current for a given instant of time.
This is an important distinction – time, or lack of it, is the essential difference between power and energy. Power is instantaneous while energy is power measured over time.
Electrical power is measured in units called watts.
What is a Parallel Circuit ?Devices can be arranged in a parallel circuit such that if any bulbs burn out the circuit still remains intact and operates. Holiday lights are wired in parallel so that if one bulb burns out the others remain lit.
The circuit below shows two lights wired in parallel. If one light burns out the other one stays on.
What is Energy ? Energy is power over time. Energy is the power flowing through a circuit for a given time like one second, one minute or one hour. When we speak of energy we mean power times time. Energy is measured in units similar to power but with a time component as in watt-seconds (or Joules), watt-minutes or watt-hours.
If a circuit generates 1 watt of power for 1 hour, it is said to generate 1 Watt-Hour of energy. Your electric meter measures power in Watt-Hours (3600 Joules), but that can be converted to any other time frame by understanding how time is measured – one hour = 3600 seconds.
Energy is measured in Joules (watt-seconds) in the experiments.
9
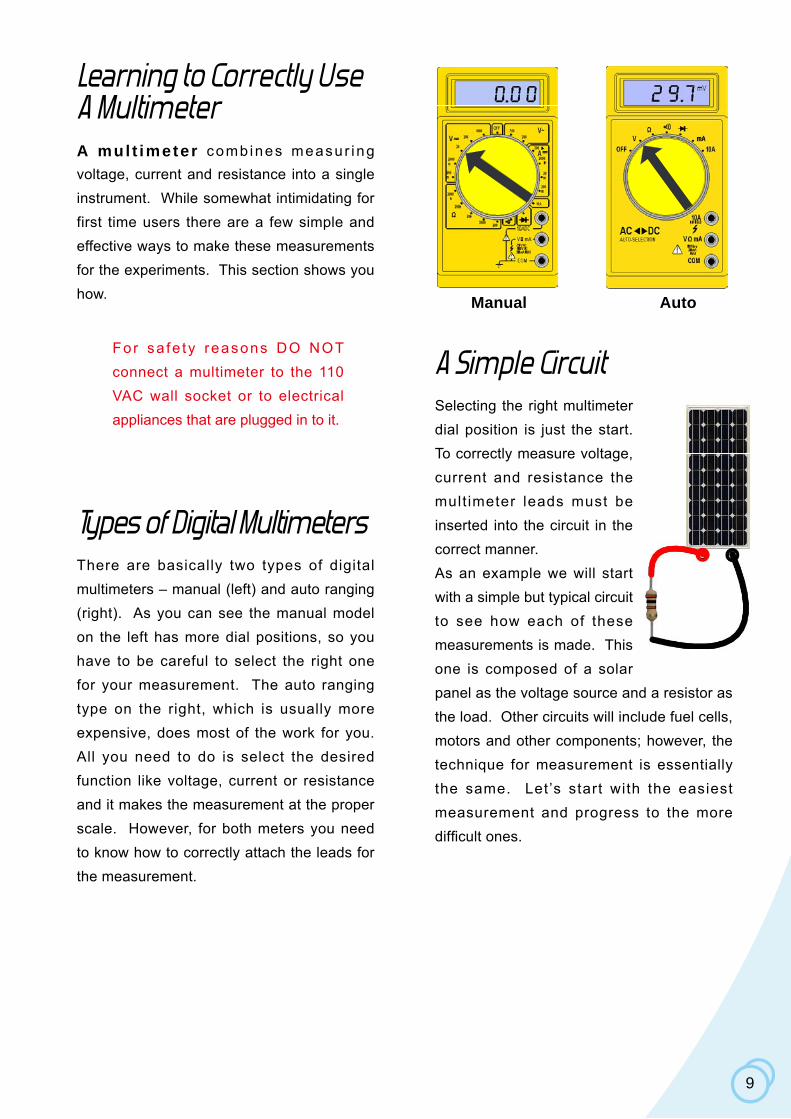
Manual Auto
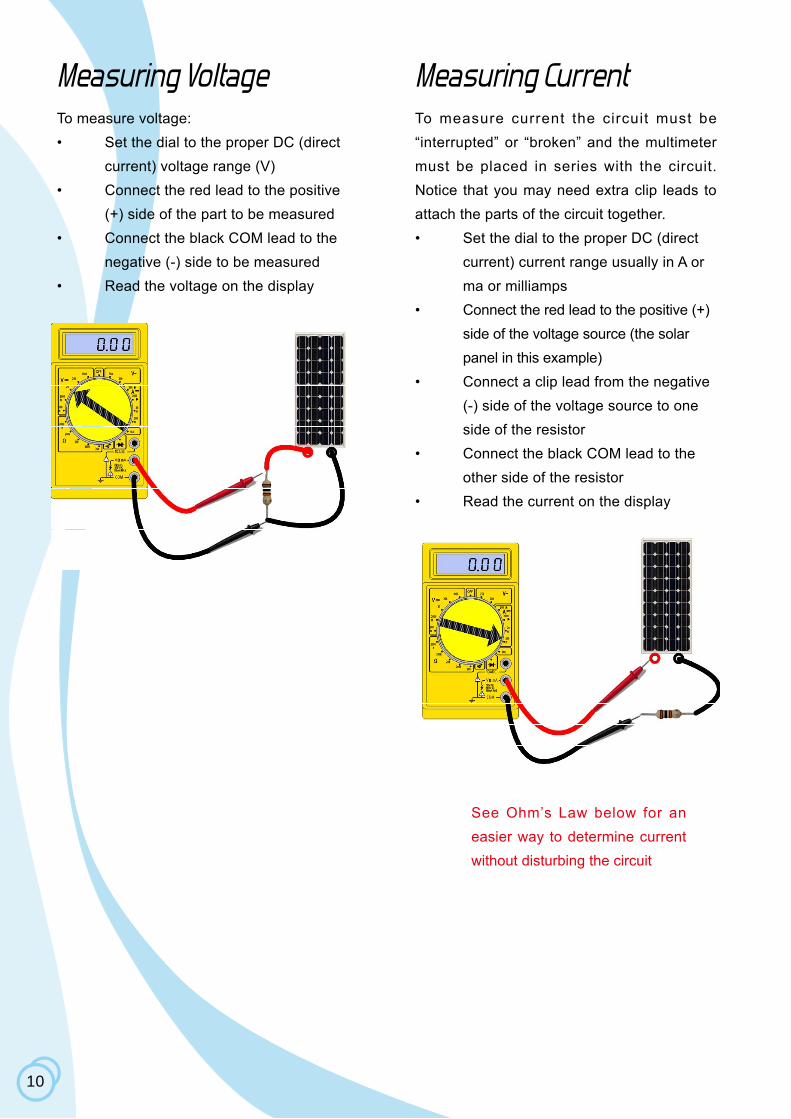
A Simple CircuitSelecting the right multimeter dial position is just the start. To correctly measure voltage, current and resistance the mult imeter leads must be inserted into the circuit in the correct manner. As an example we will start with a simple but typical circuit to see how each of these measurements is made. This one is composed of a solar panel as the voltage source and a resistor as the load. Other circuits will include fuel cells, motors and other components; however, the technique for measurement is essentially the same. Let’s start with the easiest measurement and progress to the more difficult ones.
Learning to Correctly Use A MultimeterA mul t imeter comb ines measur ing voltage, current and resistance into a single instrument. While somewhat intimidating for first time users there are a few simple and effective ways to make these measurements for the experiments. This section shows you how.
Types of Digital MultimetersThere are basically two types of digital multimeters – manual (left) and auto ranging (right). As you can see the manual model on the left has more dial positions, so you have to be careful to select the right one for your measurement. The auto ranging type on the right, which is usually more expensive, does most of the work for you. All you need to do is select the desired function like voltage, current or resistance and it makes the measurement at the proper scale. However, for both meters you need to know how to correctly attach the leads for the measurement.
For sa fe ty reasons DO NOT connect a multimeter to the 110 VAC wall socket or to electrical appliances that are plugged in to it.
10
Measuring VoltageTo measure voltage:• Set the dial to the proper DC (direct current) voltage range (V)• Connect the red lead to the positive (+) side of the part to be measured• Connect the black COM lead to the negative (-) side to be measured• Read the voltage on the display
Measuring CurrentTo measure current the circuit must be “interrupted” or “broken” and the multimeter must be placed in series with the circuit. Notice that you may need extra clip leads to attach the parts of the circuit together.• Set the dial to the proper DC (direct current) current range usually in A or ma or milliamps• Connect the red lead to the positive (+) side of the voltage source (the solar panel in this example)• Connect a clip lead from the negative (-) side of the voltage source to one side of the resistor• Connect the black COM lead to the other side of the resistor• Read the current on the display
See Ohm’s Law below for an easier way to determine current without disturbing the circuit
11
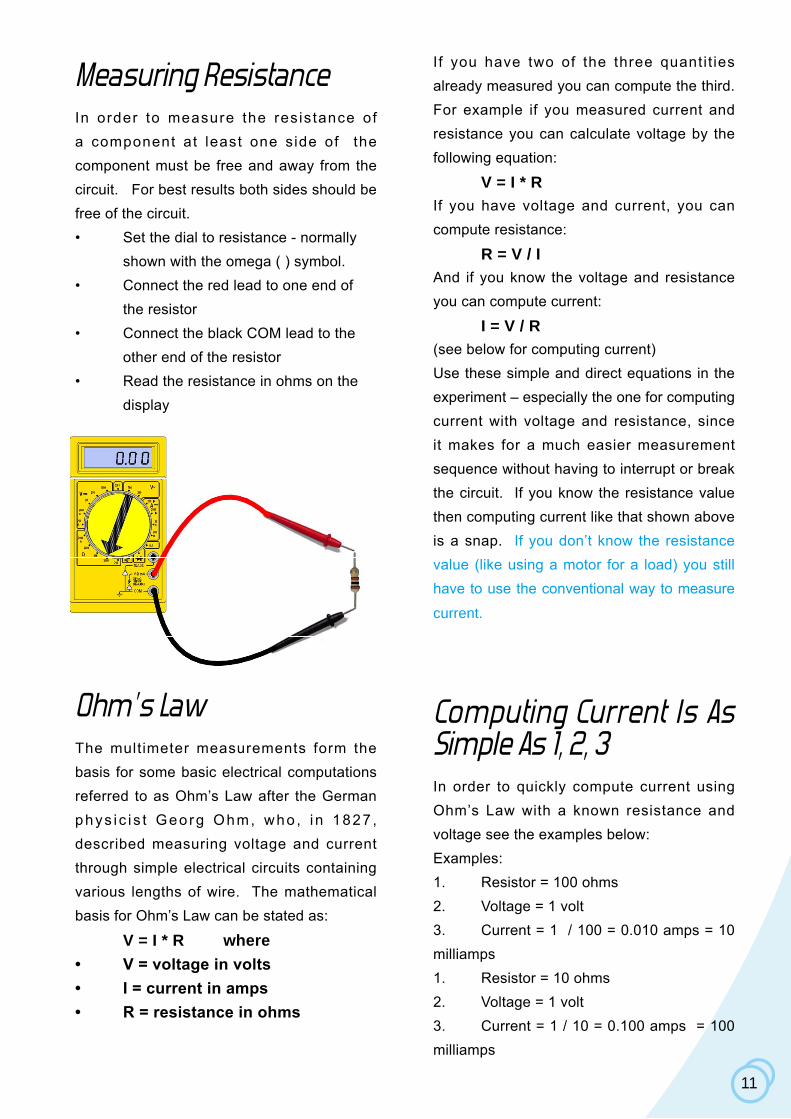
Measuring ResistanceIn order to measure the resistance of a component at least one side of the component must be free and away from the circuit. For best results both sides should be free of the circuit.• Set the dial to resistance - normally shown with the omega ( ) symbol.• Connect the red lead to one end of the resistor• Connect the black COM lead to the other end of the resistor• Read the resistance in ohms on the display
Ohm’s LawThe multimeter measurements form the basis for some basic electrical computations referred to as Ohm’s Law after the German phys i c i s t Georg Ohm, who , i n 1827 , described measuring voltage and current through simple electrical circuits containing various lengths of wire. The mathematical basis for Ohm’s Law can be stated as:
V = I * R where • V = voltage in volts• I = current in amps • R = resistance in ohms
I f you have two of the three quantit ies already measured you can compute the third. For example if you measured current and resistance you can calculate voltage by the following equation:
V = I * RIf you have voltage and current, you can compute resistance:
R = V / IAnd if you know the voltage and resistance you can compute current:
I = V / R (see below for computing current)Use these simple and direct equations in the experiment – especially the one for computing current with voltage and resistance, since it makes for a much easier measurement sequence without having to interrupt or break the circuit. If you know the resistance value then computing current like that shown above is a snap. If you don’t know the resistance value (like using a motor for a load) you still have to use the conventional way to measure
current.
Computing Current Is As Simple As 1, 2, 3In order to quickly compute current using Ohm’s Law with a known resistance and voltage see the examples below:Examples:1. Resistor = 100 ohms2. Voltage = 1 volt3. Current = 1 / 100 = 0.010 amps = 10 milliamps1. Resistor = 10 ohms2. Voltage = 1 volt3. Current = 1 / 10 = 0.100 amps = 100 milliamps
28
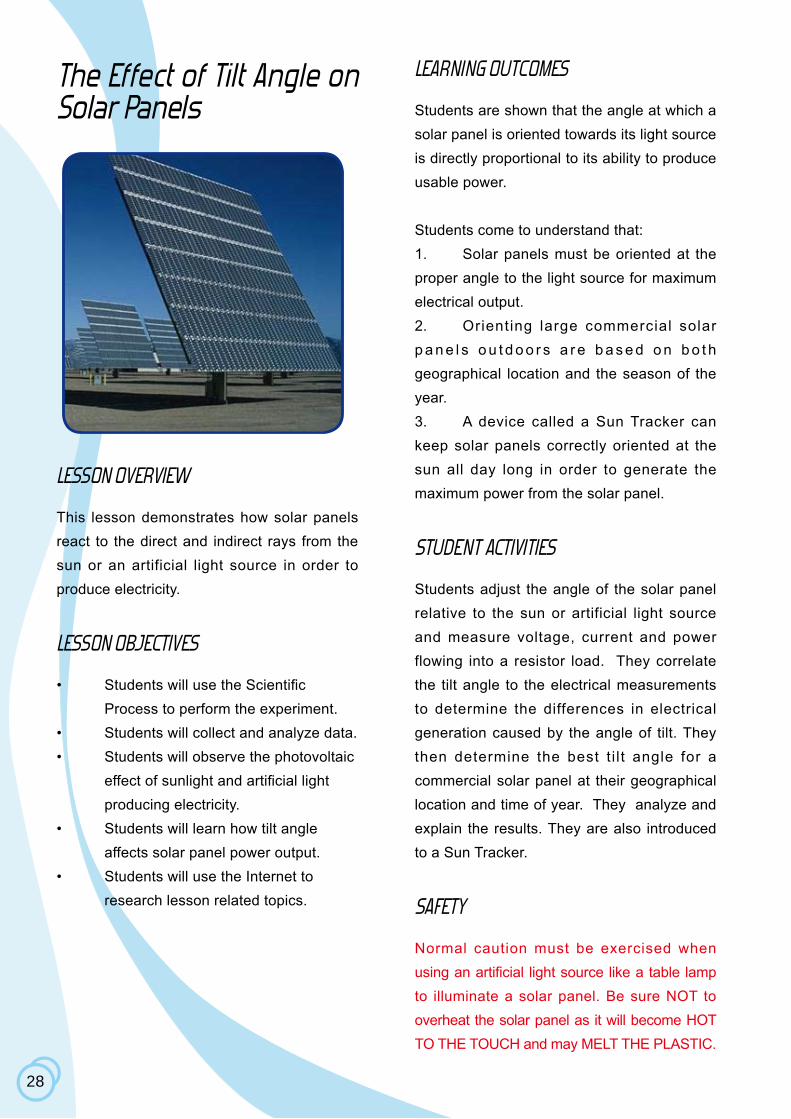
The Effect of Tilt Angle on Solar Panels
LESSON OVERVIEW
This lesson demonstrates how solar panels react to the direct and indirect rays from the sun or an artificial light source in order to produce electricity.
LESSON OBJECTIVES
• Students will use the Scientific Process to perform the experiment.• Students will collect and analyze data.• Students will observe the photovoltaic effect of sunlight and artificial light producing electricity.• Students will learn how tilt angle affects solar panel power output.• Students will use the Internet to research lesson related topics.
LEARNING OUTCOMES
Students are shown that the angle at which a solar panel is oriented towards its light source is directly proportional to its ability to produce usable power.
Students come to understand that:1. Solar panels must be oriented at the proper angle to the light source for maximum electrical output.2. Orienting large commercial solar p a n e l s o u t d o o r s a r e b a s e d o n b o t h geographical location and the season of the year.3. A device called a Sun Tracker can keep solar panels correctly oriented at the sun all day long in order to generate the maximum power from the solar panel.
STUDENT ACTIVITIES
Students adjust the angle of the solar panel relative to the sun or artificial light source and measure voltage, current and power flowing into a resistor load. They correlate the tilt angle to the electrical measurements to determine the differences in electrical generation caused by the angle of tilt. They then determine the best t i l t angle for a commercial solar panel at their geographical location and time of year. They analyze and explain the results. They are also introduced to a Sun Tracker.
SAFETY
Normal caution must be exercised when using an artificial light source like a table lamp to illuminate a solar panel. Be sure NOT to overheat the solar panel as it will become HOT TO THE TOUCH and may MELT THE PLASTIC.
29
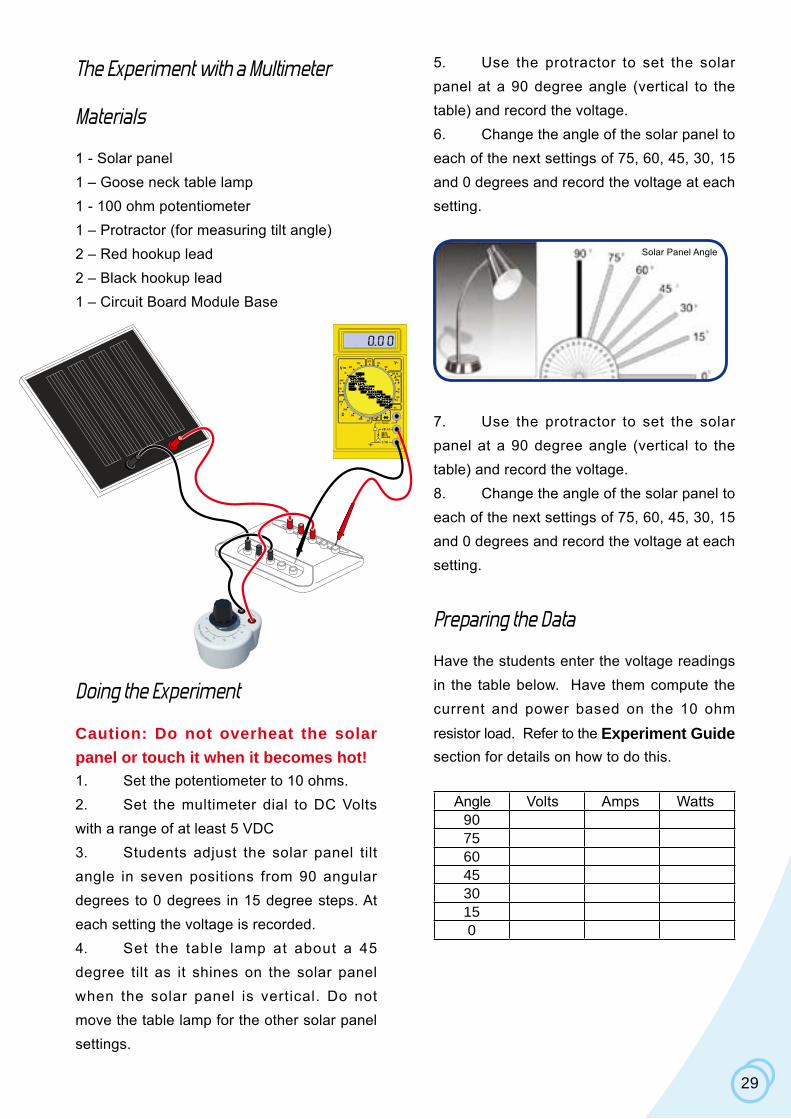
The Experiment with a Multimeter
Materials
1 - Solar panel1 – Goose neck table lamp1 - 100 ohm potentiometer1 – Protractor (for measuring tilt angle)2 – Red hookup lead2 – Black hookup lead1 – Circuit Board Module Base
Doing the Experiment
Caution: Do not overheat the solar panel or touch it when it becomes hot!1. Set the potentiometer to 10 ohms.2. Set the multimeter dial to DC Volts with a range of at least 5 VDC3. Students adjust the solar panel tilt angle in seven positions from 90 angular degrees to 0 degrees in 15 degree steps. At each setting the voltage is recorded.4. Set the table lamp at about a 45 degree tilt as it shines on the solar panel when the solar panel is vertical. Do not move the table lamp for the other solar panel settings.
5. Use the protractor to set the solar panel at a 90 degree angle (vertical to the table) and record the voltage.6. Change the angle of the solar panel to each of the next settings of 75, 60, 45, 30, 15 and 0 degrees and record the voltage at each setting.
7. Use the protractor to set the solar panel at a 90 degree angle (vertical to the table) and record the voltage.8. Change the angle of the solar panel to each of the next settings of 75, 60, 45, 30, 15 and 0 degrees and record the voltage at each setting.
Preparing the Data
Have the students enter the voltage readings in the table below. Have them compute the current and power based on the 10 ohm
resistor load. Refer to the Experiment Guide section for details on how to do this.
Angle Volts Amps Watts9075604530150
Solar Panel Angle
30
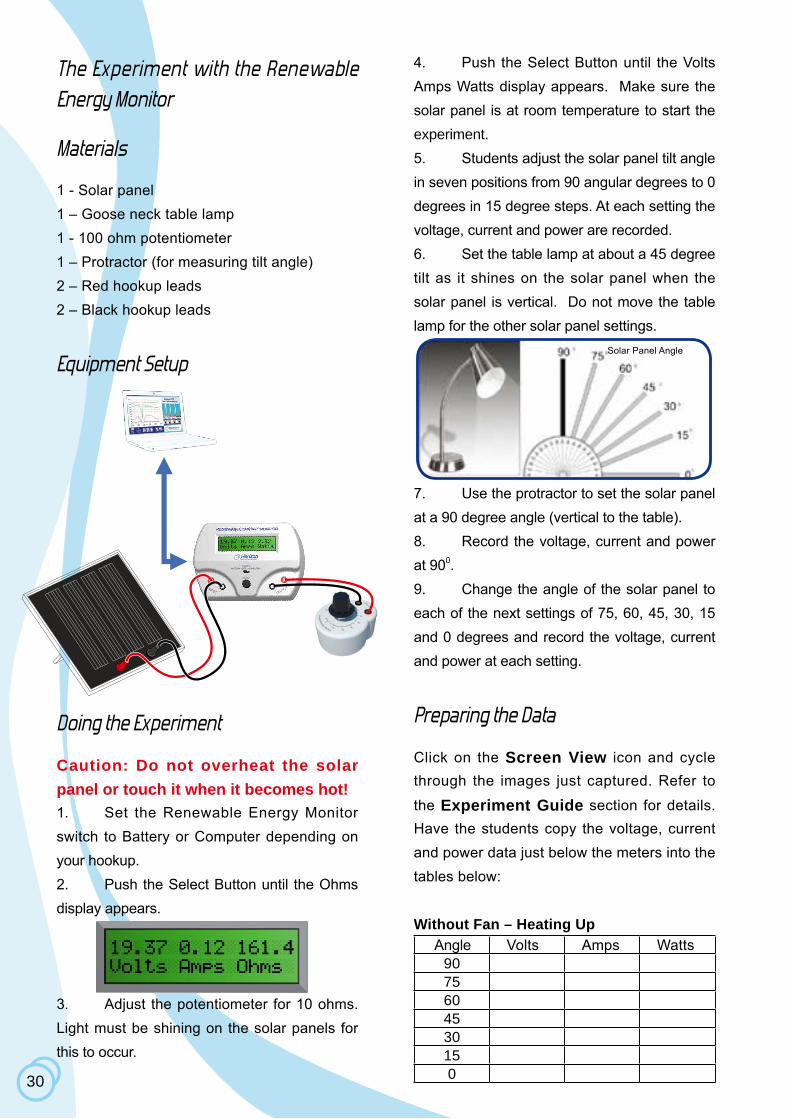
The Experiment with the Renewable Energy Monitor
Materials
1 - Solar panel1 – Goose neck table lamp1 - 100 ohm potentiometer1 – Protractor (for measuring tilt angle)2 – Red hookup leads2 – Black hookup leads
Equipment Setup
Doing the Experiment
Caution: Do not overheat the solar panel or touch it when it becomes hot!1. Set the Renewable Energy Monitor switch to Battery or Computer depending on your hookup.2. Push the Select Button until the Ohms display appears.
3. Adjust the potentiometer for 10 ohms. Light must be shining on the solar panels for this to occur.
4. Push the Select Button until the Volts Amps Watts display appears. Make sure the solar panel is at room temperature to start the experiment. 5. Students adjust the solar panel tilt angle in seven positions from 90 angular degrees to 0 degrees in 15 degree steps. At each setting the voltage, current and power are recorded.6. Set the table lamp at about a 45 degree tilt as it shines on the solar panel when the solar panel is vertical. Do not move the table lamp for the other solar panel settings.
7. Use the protractor to set the solar panel at a 90 degree angle (vertical to the table).8. Record the voltage, current and power at 900.9. Change the angle of the solar panel to each of the next settings of 75, 60, 45, 30, 15 and 0 degrees and record the voltage, current and power at each setting.
Preparing the Data
Click on the Screen View icon and cycle through the images just captured. Refer to
the Experiment Guide section for details. Have the students copy the voltage, current and power data just below the meters into the tables below:
Without Fan – Heating Up Angle Volts Amps Watts
9075604530150
Solar Panel Angle
31
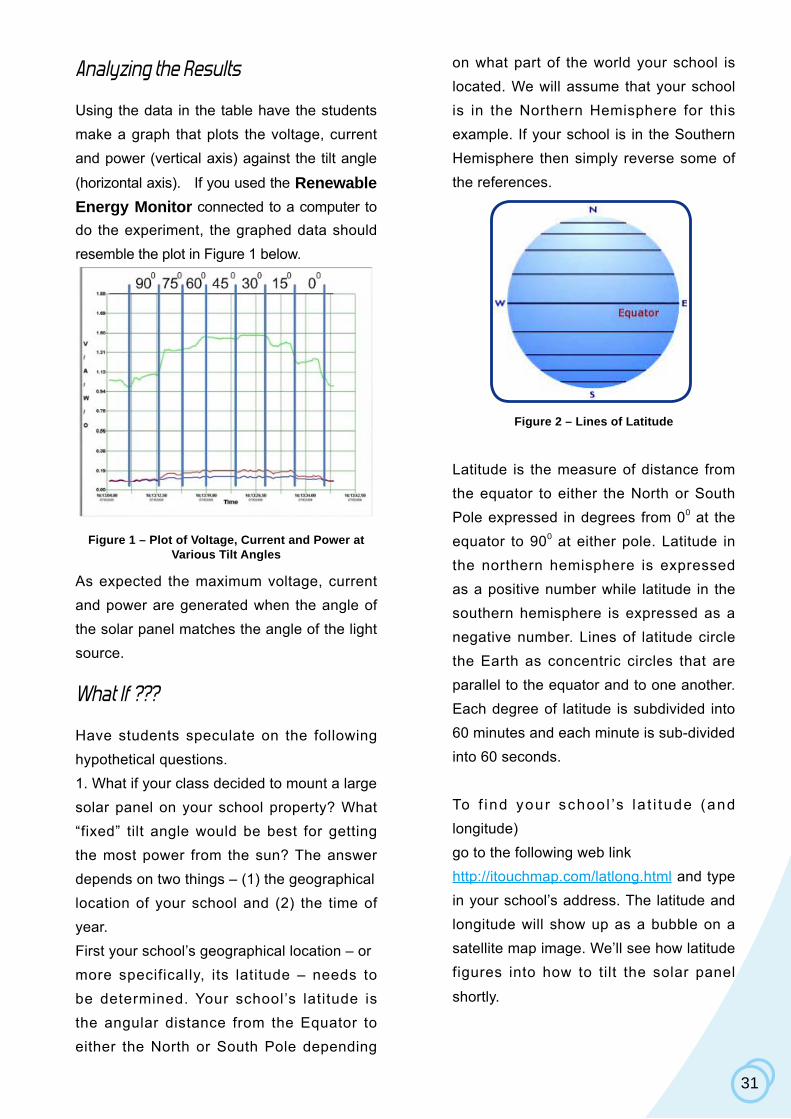
Analyzing the Results
Using the data in the table have the students make a graph that plots the voltage, current and power (vertical axis) against the tilt angle
(horizontal axis). If you used the Renewable Energy Monitor connected to a computer to do the experiment, the graphed data should resemble the plot in Figure 1 below.
Figure 1 – Plot of Voltage, Current and Power at Various Tilt Angles
As expected the maximum voltage, current and power are generated when the angle of the solar panel matches the angle of the light source.
What If ???
Have students speculate on the following hypothetical questions.1. What if your class decided to mount a large solar panel on your school property? What “fixed” tilt angle would be best for getting the most power from the sun? The answer depends on two things – (1) the geographicallocation of your school and (2) the time of year.First your school’s geographical location – ormore specifically, its latitude – needs to be determined. Your school’s latitude is the angular distance from the Equator to either the North or South Pole depending
on what part of the world your school is located. We will assume that your school is in the Northern Hemisphere for this example. If your school is in the Southern Hemisphere then simply reverse some of the references.
Figure 2 – Lines of Latitude
Latitude is the measure of distance from the equator to either the North or South Pole expressed in degrees from 00 at the equator to 900 at either pole. Latitude in the northern hemisphere is expressed as a positive number while latitude in the southern hemisphere is expressed as a negative number. Lines of latitude circle the Earth as concentric circles that are parallel to the equator and to one another. Each degree of latitude is subdivided into 60 minutes and each minute is sub-divided into 60 seconds.
To f ind your schoo l ’s la t i tude (and longitude)go to the following web linkhttp://itouchmap.com/latlong.html and type in your school’s address. The latitude and longitude will show up as a bubble on a satellite map image. We’ll see how latitude figures into how to tilt the solar panel
shortly.

32
Now that you have your school’s latitude you need to consider the time of year for best results from the solar panel. We know that the sun is higher in the sky in summer and lower in winter as shown in Figure 3.
Figure 3 – Sun’s Position in Summer and Winter
So it seems like the best angle to position thesolar panel would be between the highest and lowest points of the sun’s apparent angle in the sky. You can use Figure 4 as a way to determine the best latitude for the season of the year. Just add or subtract about 15 degrees to to adjust for the season.
Figure 4 – Computing the Best Tilt Angle for Seasonal Solar Panel Operation
2. Now, what if you could have the solar panel move with the sun as it appears to travel across the sky during the day? You could certainly capture more of the sun’s energy and produce more power. There are devices that allow you to do this – they are called Sun Trackers.
A Sun Tracker is really a mechanical devicethat keeps the solar panel pointed directly atthe sun during the day and, with somemodels, during the seasons. The basic type is called a single-axis Sun Tracker because it only moves the solar panel back and forth as the sun moves across the sky during the day. A more powerful model called a dual-axis suntracker moves the solar panel up and downdepending on the elevation of the sun duringthe year. Figure 5 shows such a model.
Figure 5 – Dual-Axis Sun Tracker
So what if you could add a Sun Tracker to your solar panel? How much more energy could you capture from the sun as compared with no tracking device? You can find the answers on the web. Just go to a search engine like Yahoo or Google or Bing to find out.
33
Links to the Renewable Energy Science Education Manual
Have students examine the information on the following pages in order to prepare to do more research on the experiment.Page 24 – Types of PV SystemsPage 28 –The Electromagnetic Spectrum
Web Links
To learn more about solar cells start with this link from the “How Stuff Works” website.http://science.howstuffworks.com/solar-cell.htm
To find out more about solar radiation in yourgeographical area try this link.http://rredc.nrel.gov/solar/old_data/nsrdb/redbook/atlas/
To determine the best tilt angle for your particular location at anytime of the year go here..http://ocw.mit.edu/ans7870/SP/SP.769/f04/java/pvapplet/PVPanel.html
Figure 6 – Photovoltaic Panel SimulationSoftware
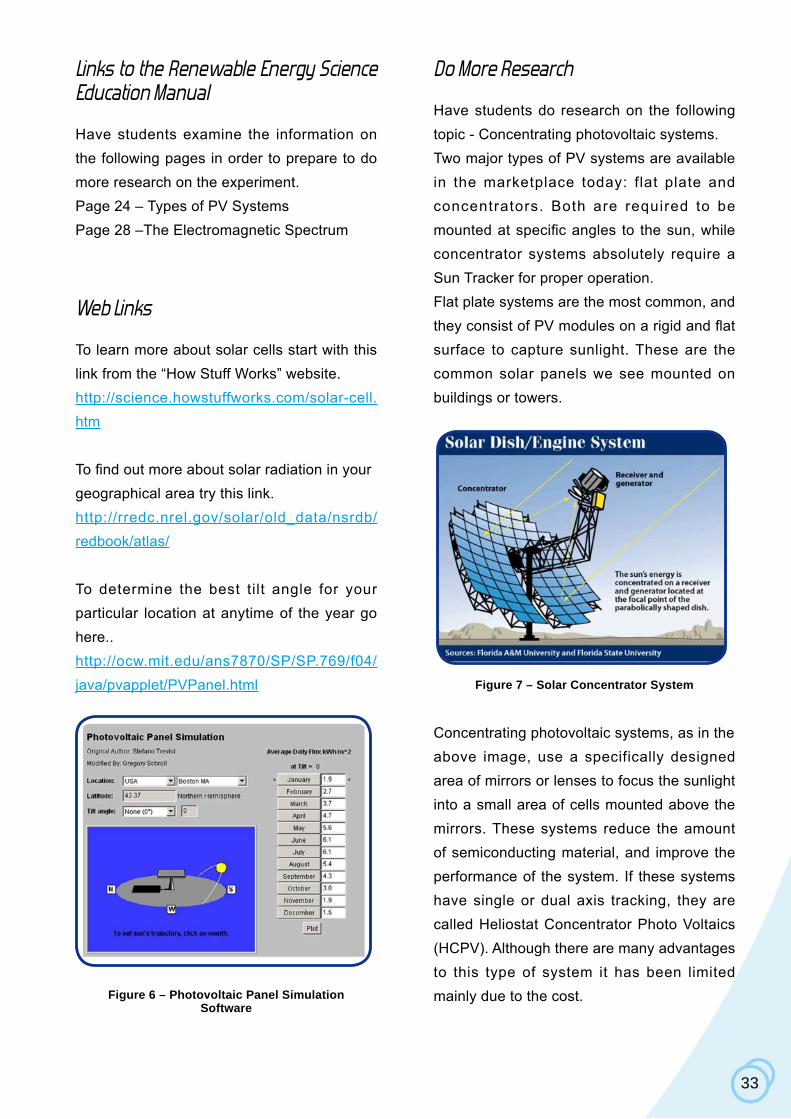
Do More Research
Have students do research on the following topic - Concentrating photovoltaic systems.Two major types of PV systems are available in the marketplace today: flat plate and concentrators. Both are required to be mounted at specific angles to the sun, while concentrator systems absolutely require a Sun Tracker for proper operation.Flat plate systems are the most common, and they consist of PV modules on a rigid and flat surface to capture sunlight. These are the common solar panels we see mounted on buildings or towers.
Figure 7 – Solar Concentrator System
Concentrating photovoltaic systems, as in theabove image, use a specifically designed area of mirrors or lenses to focus the sunlight into a small area of cells mounted above the mirrors. These systems reduce the amount of semiconducting material, and improve the performance of the system. If these systems have single or dual axis tracking, they are called Heliostat Concentrator Photo Voltaics (HCPV). Although there are many advantages to this type of system it has been limited mainly due to the cost.
50
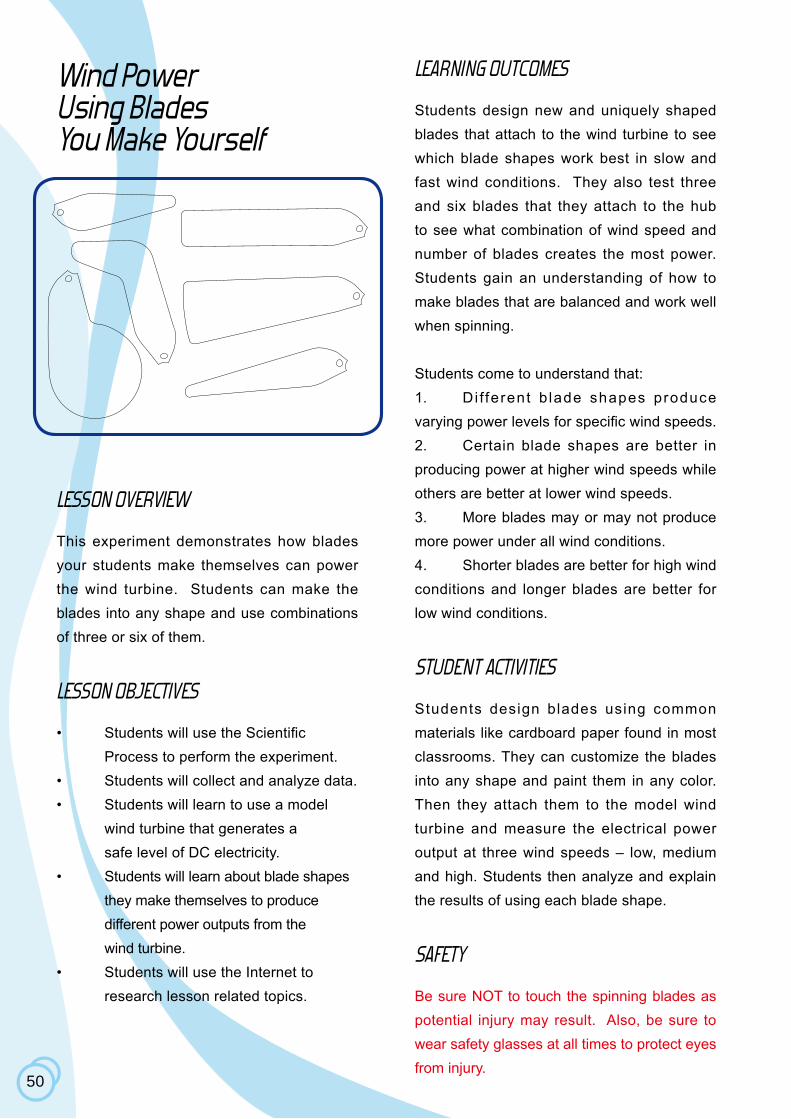
Wind PowerUsing Blades You Make Yourself
LESSON OVERVIEW
This experiment demonstrates how blades your students make themselves can power the wind turbine. Students can make the blades into any shape and use combinations of three or six of them.
LESSON OBJECTIVES
• Students will use the Scientific Process to perform the experiment.• Students will collect and analyze data.• Students will learn to use a model wind turbine that generates a safe level of DC electricity.• Students will learn about blade shapes they make themselves to produce different power outputs from the wind turbine.• Students will use the Internet to research lesson related topics.
LEARNING OUTCOMES
Students design new and uniquely shaped blades that attach to the wind turbine to see which blade shapes work best in slow and fast wind conditions. They also test three and six blades that they attach to the hub to see what combination of wind speed and number of blades creates the most power. Students gain an understanding of how to make blades that are balanced and work well when spinning.
Students come to understand that:1. Di f ferent b lade shapes produce varying power levels for specific wind speeds.2. Certain blade shapes are better in producing power at higher wind speeds while others are better at lower wind speeds. 3. More blades may or may not produce more power under all wind conditions. 4. Shorter blades are better for high wind conditions and longer blades are better for low wind conditions.
STUDENT ACTIVITIES
Students design blades using common materials like cardboard paper found in most classrooms. They can customize the blades into any shape and paint them in any color. Then they attach them to the model wind turbine and measure the electrical power output at three wind speeds – low, medium and high. Students then analyze and explain the results of using each blade shape.
SAFETY
Be sure NOT to touch the spinning blades as potential injury may result. Also, be sure to wear safety glasses at all times to protect eyes from injury.
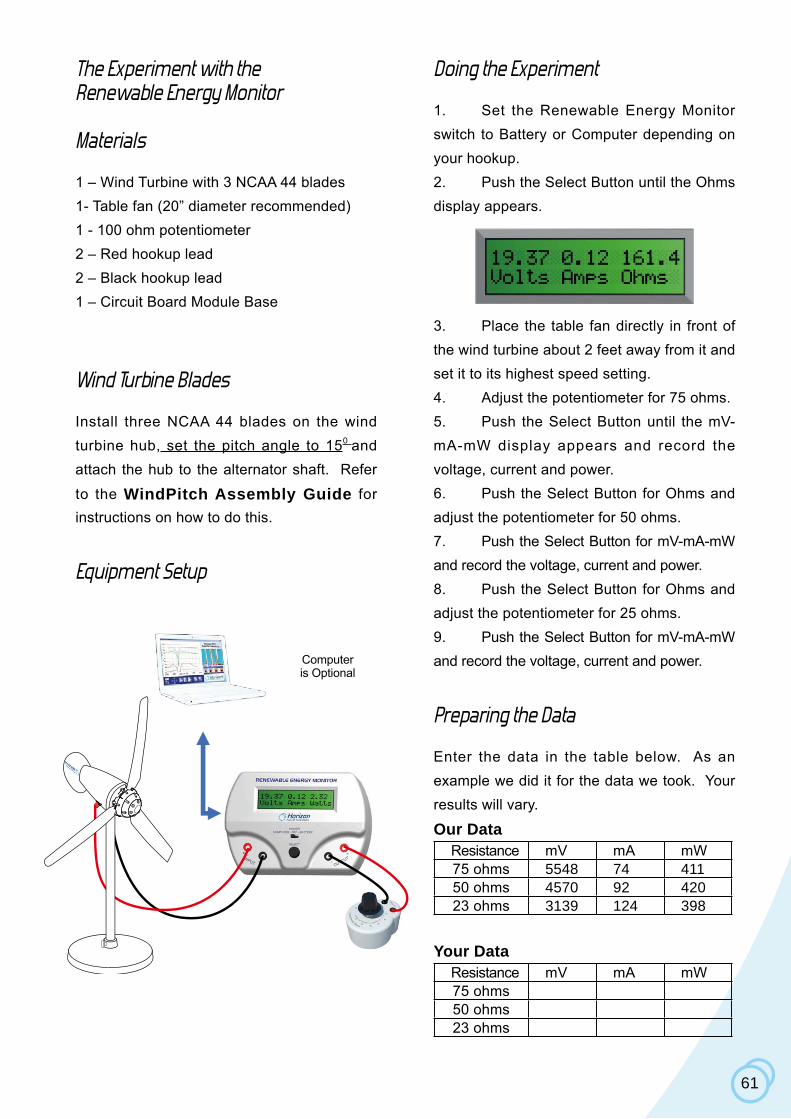
61
The Experiment with theRenewable Energy Monitor
Materials
1 – Wind Turbine with 3 NCAA 44 blades1- Table fan (20” diameter recommended)1 - 100 ohm potentiometer2 – Red hookup lead2 – Black hookup lead1 – Circuit Board Module Base
Wind Turbine Blades
Install three NCAA 44 blades on the wind turbine hub, set the pitch angle to 150 and attach the hub to the alternator shaft. Refer
to the WindPitch Assembly Guide for instructions on how to do this.
Equipment Setup
Doing the Experiment
1. Set the Renewable Energy Monitor switch to Battery or Computer depending on your hookup.2. Push the Select Button until the Ohms display appears.
3. Place the table fan directly in front of the wind turbine about 2 feet away from it and set it to its highest speed setting. 4. Adjust the potentiometer for 75 ohms. 5. Push the Select Button until the mV-mA-mW display appears and record the voltage, current and power.6. Push the Select Button for Ohms and adjust the potentiometer for 50 ohms.7. Push the Select Button for mV-mA-mW and record the voltage, current and power.8. Push the Select Button for Ohms and adjust the potentiometer for 25 ohms. 9. Push the Select Button for mV-mA-mW and record the voltage, current and power.
Preparing the Data
Enter the data in the table below. As an example we did it for the data we took. Your results will vary.
Our Data Resistance mV mA mW75 ohms 5548 74 41150 ohms 4570 92 42023 ohms 3139 124 398
Your Data Resistance mV mA mW75 ohms50 ohms23 ohms
Computer is Optional
62
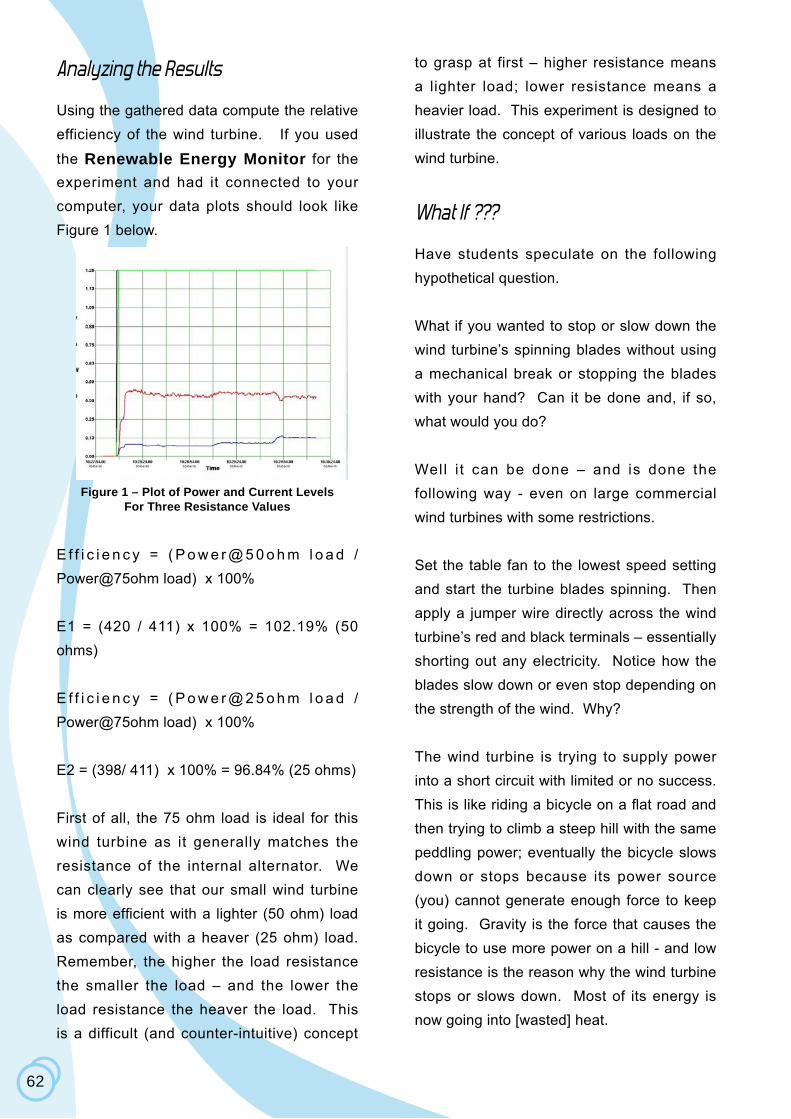
Analyzing the Results
Using the gathered data compute the relative efficiency of the wind turbine. If you used
the Renewable Energy Monitor for the experiment and had it connected to your computer, your data plots should look like Figure 1 below.
Figure 1 – Plot of Power and Current Levels For Three Resistance Values
E f f i c i e n c y = ( P o w e r @ 5 0 o h m l o a d / Power@75ohm load) x 100%
E1 = (420 / 411) x 100% = 102.19% (50 ohms)
E f f i c i e n c y = ( P o w e r @ 2 5 o h m l o a d / Power@75ohm load) x 100%
E2 = (398/ 411) x 100% = 96.84% (25 ohms)
First of all, the 75 ohm load is ideal for this wind turbine as it generally matches the resistance of the internal alternator. We can clearly see that our small wind turbine is more efficient with a lighter (50 ohm) load as compared with a heaver (25 ohm) load. Remember, the higher the load resistance the smaller the load – and the lower the load resistance the heaver the load. This is a difficult (and counter-intuitive) concept
to grasp at first – higher resistance means a lighter load; lower resistance means a heavier load. This experiment is designed to illustrate the concept of various loads on the wind turbine.
What If ???
Have students speculate on the following hypothetical question.
What if you wanted to stop or slow down the wind turbine’s spinning blades without using a mechanical break or stopping the blades with your hand? Can it be done and, if so, what would you do?
Well i t can be done – and is done the following way - even on large commercial wind turbines with some restrictions.
Set the table fan to the lowest speed setting and start the turbine blades spinning. Then apply a jumper wire directly across the wind turbine’s red and black terminals – essentially shorting out any electricity. Notice how the blades slow down or even stop depending on the strength of the wind. Why?
The wind turbine is trying to supply power into a short circuit with limited or no success. This is like riding a bicycle on a flat road and then trying to climb a steep hill with the same peddling power; eventually the bicycle slows down or stops because its power source (you) cannot generate enough force to keep it going. Gravity is the force that causes the bicycle to use more power on a hill - and low resistance is the reason why the wind turbine stops or slows down. Most of its energy is now going into [wasted] heat.
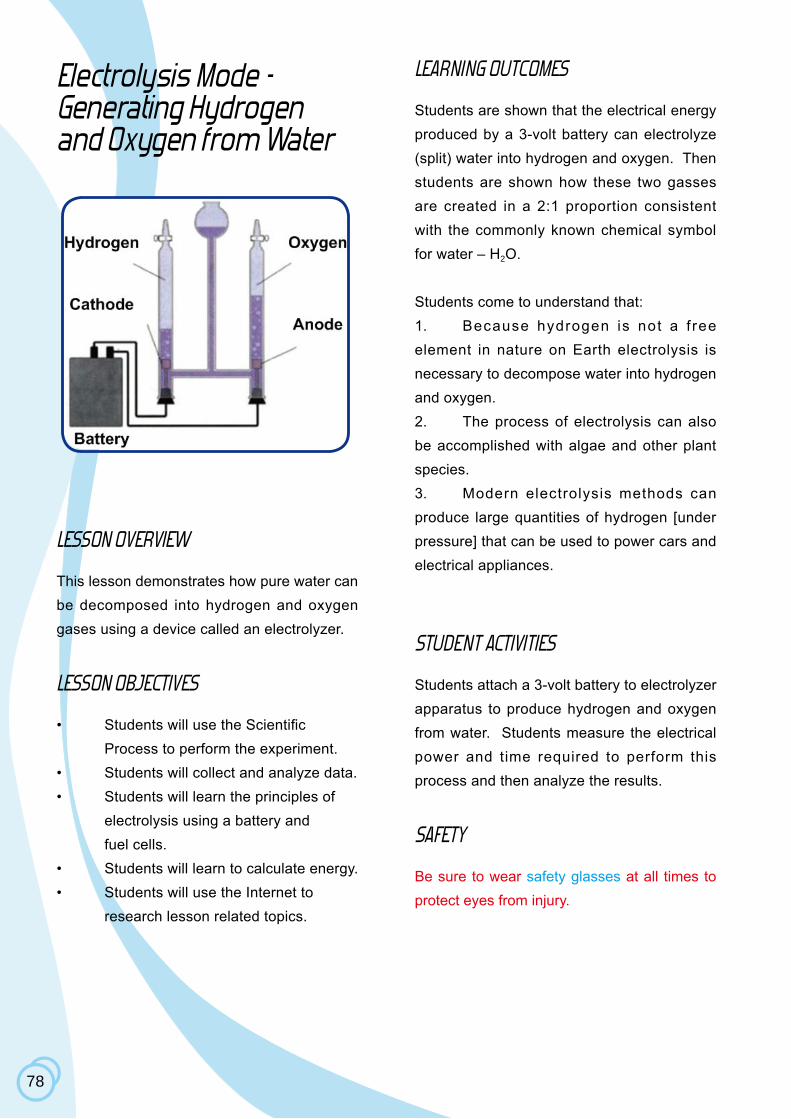
78
Electrolysis Mode -Generating Hydrogenand Oxygen from Water
LESSON OVERVIEW
This lesson demonstrates how pure water can be decomposed into hydrogen and oxygen gases using a device called an electrolyzer.
LESSON OBJECTIVES
• Students will use the Scientific Process to perform the experiment.• Students will collect and analyze data.• Students will learn the principles of electrolysis using a battery and fuel cells.• Students will learn to calculate energy. • Students will use the Internet to research lesson related topics.
LEARNING OUTCOMES
Students are shown that the electrical energy produced by a 3-volt battery can electrolyze (split) water into hydrogen and oxygen. Then students are shown how these two gasses are created in a 2:1 proportion consistent with the commonly known chemical symbol for water – H2O.
Students come to understand that:1. Because hydrogen is not a f ree element in nature on Earth electrolysis is necessary to decompose water into hydrogen and oxygen.2. The process of electrolysis can also be accomplished with algae and other plant species.3. Modern electrolysis methods can produce large quantities of hydrogen [under pressure] that can be used to power cars and electrical appliances.
STUDENT ACTIVITIES
Students attach a 3-volt battery to electrolyzer apparatus to produce hydrogen and oxygen from water. Students measure the electrical power and time required to perform this process and then analyze the results.
SAFETY
Be sure to wear safety glasses at all times to protect eyes from injury.
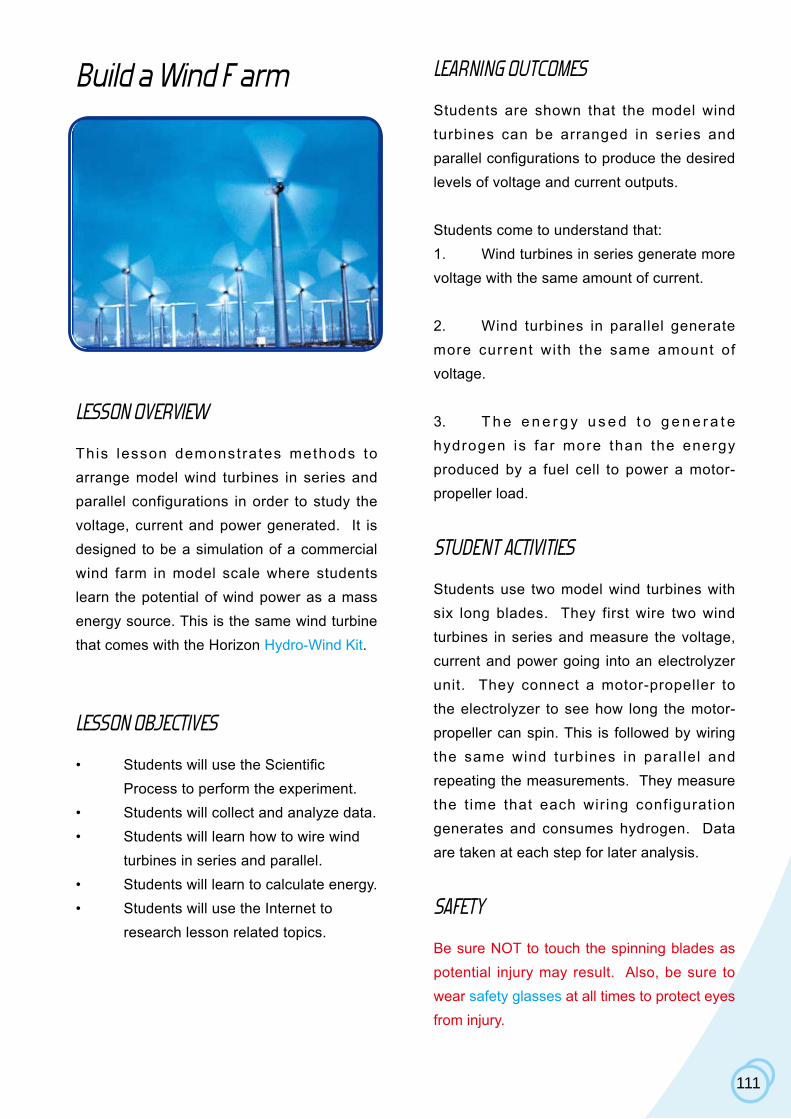
111
Build a Wind F arm
LESSON OVERVIEW
This lesson demonstrates methods to arrange model wind turbines in series and parallel configurations in order to study the voltage, current and power generated. It is designed to be a simulation of a commercial wind farm in model scale where students learn the potential of wind power as a mass energy source. This is the same wind turbine that comes with the Horizon Hydro-Wind Kit.
LESSON OBJECTIVES
• Students will use the Scientific Process to perform the experiment.• Students will collect and analyze data.• Students will learn how to wire wind turbines in series and parallel.• Students will learn to calculate energy.• Students will use the Internet to research lesson related topics.
LEARNING OUTCOMES
Students are shown that the model wind turbines can be arranged in series and parallel configurations to produce the desired levels of voltage and current outputs.
Students come to understand that:1. Wind turbines in series generate more voltage with the same amount of current.
2. Wind turbines in parallel generate more current with the same amount of voltage.
3. T h e e n e r g y u s e d t o g e n e r a t e hydrogen is far more than the energy produced by a fuel cell to power a motor-propeller load.
STUDENT ACTIVITIES
Students use two model wind turbines with six long blades. They first wire two wind turbines in series and measure the voltage, current and power going into an electrolyzer unit. They connect a motor-propeller to the electrolyzer to see how long the motor-propeller can spin. This is followed by wiring the same wind turbines in paral lel and repeating the measurements. They measure the t ime that each wiring configuration generates and consumes hydrogen. Data are taken at each step for later analysis.
SAFETY
Be sure NOT to touch the spinning blades as potential injury may result. Also, be sure to wear safety glasses at all times to protect eyes from injury.