school improvement plan (sip) form sip-1
TRANSCRIPT

2012-2013 School Improvement Plan (SIP)-Form SIP-1
August 2012
Rule 6A-1.099811
Revised April 29, 2011 1
FLORIDA DEPARTMENT OF EDUCATION
School Improvement Plan (SIP)
Form SIP-1
Proposed for 2012-2013

2012-2013 School Improvement Plan (SIP)-Form SIP-1
August 2012
Rule 6A-1.099811
Revised April 29, 2011 2
2012-2013 SCHOOL IMPROVEMENT PLAN
PART I: CURRENT SCHOOL STATUS
School Information
School Name: St. Augustine High District Name: St. Johns County
Principal: Cathy Mittelstadt Superintendent: Dr. Joseph Joyner
SAC Chair: Colby Wright and Lauren Spatola Date of School Board Approval:
Student Achievement Data and Reference Materials:
The following links will open in a separate browser window.
School Grades Trend Data (Use this data to complete Sections 1-4 of the reading and mathematics goals and Sections 1 and 2 of the writing and science goals.)
Florida Comprehensive Assessment Test (FCAT)/Statewide Assessment Trend Data (Use this data to inform the problem-solving process when writing goals.)
High School Feedback Report
K-12 Comprehensive Research Based Reading Plan
Administrators
List your school’s administrators and briefly describe their certification(s), number of years at the current school, number of years as an administrator, and their prior performance
record with increasing student achievement at each school. Include history of School Grades, FCAT/statewide assessment performance (percentage data for achievement levels,
learning gains, Lowest 25%), and ambitious but achievable annual measurable objective (AMO) progress.
Position Name Degree(s)/
Certification(s)
Number of
Years at
Current School
Number of
Years as an
Administrator
Prior Performance Record (include prior School Grades,
FCAT/statewide assessment Achievement Levels, learning gains,
lowest 25%), and AMO progress, along with the associated school
year) Principal
Cathy Mittelstadt BA – Education, UNC Chapel Hill MEd – University of Central Florida Ed.S – Nova University
3 14 St. Augustine High School 2010-2011 Grade: B Reading Mastery: 59%, Math Mastery 80%, Science Mastery: 46% Learning Gains: Reading - 55%, Math - 74% Lowest 25% LG: Reading - 47%, Math- 63% AYP: 79% St. Augustine High School 2009-2010 Grade: B Reading Mastery: 55%, Math Mastery 80%, Science Mastery: 46% Learning Gains: Reading - 53%, Math -

2012-2013 School Improvement Plan (SIP)-Form SIP-1
August 2012
Rule 6A-1.099811
Revised April 29, 2011 3
79% Lowest 25% LG: Reading - 40%, Math- 67% AYP: 79% St. Augustine High School 2008-2009 Grade: A Reading Mastery: 51%, Math Master: 78%, Science Mastery: 51% Learning Gains Reading:54% Math 82% Lowest 25% LG Reading: 47% Math 74% AYP: 79%
Murray Middle School 2007-2008 Grade: A Reading Mastery: 71%, Math Mastery: 65%, Science Mastery: 51% AYP: 32%
Assistant Principal
George Mastoridis BA - Education, Flagler College MEdL - University of North Florida
5 11 St. Augustine High School 2010-2011 Grade: B Reading Mastery: 59%, Math Mastery 80%, Science Mastery: 46% Learning Gains: Reading - 55%, Math - 74% Lowest 25% LG: Reading - 47%, Math- 63% AYP: 79% St. Augustine High School 2009-2010 Grade: B Reading Mastery: 55%, Math Mastery 80%, Science Mastery: 46% Learning Gains: Reading - 53%, Math -79% Lowest 25% LG: Reading - 40%, Math-67% AYP: 79%
Assistant
Principal
Kristin Bozeman BA - English, University of FL Masters- English, University of North Florida
1 3 St. Augustine High School 2010-2011 Grade: B Reading Mastery: 59%, Math Mastery 80%, Science Mastery: 46% Learning Gains: Reading - 55%, Math - 74% Lowest 25% LG: Reading - 47%, Math- 63% AYP: 79%

2012-2013 School Improvement Plan (SIP)-Form SIP-1
August 2012
Rule 6A-1.099811
Revised April 29, 2011 4
Instructional Coaches
List your school’s instructional coaches and briefly describe their certification(s), number of years at the current school, number of years as an instructional coach, and their prior
performance record with increasing student achievement at each school. Include history of School Grades, FCAT/statewide assessment performance (percentage data for
achievement levels, learning gains, Lowest 25%), and ambitious but achievable annual measurable objective (AMO) progress. Instructional coaches described in this section are only
those who are fully released or part-time teachers in reading, mathematics, or science and work only at the school site.
Subject
Area Name
Degree(s)/
Certification(s)
Number of
Years at
Current School
Number of Years as
an Instructional
Coach
Prior Performance Record (include prior School Grades,
FCAT/Statewide Assessment Achievement Levels, Learning
Gains, Lowest 25%), and AMO progress along with the
associated school year)
Instructional
Literacy
Coach
Donna McCarthy-Jensen MeD – University of
Florida
Certifications: ESOL (K-
12), Reading
Endorsement, Specific
Learning Disabilities (K-
12), Mentally
Handicapped (K-12)
6 0
Effective and Highly Effective Teachers
Describe the school-based strategies that will be used to recruit and retain high quality, effective teachers to the school.
Description of Strategy Person Responsible Projected Completion Date
1. Utilization of district PATS program Principal Upon Posting
2. Mentoring Program Select Faculty/Staff End of 1st year
3. Focus on providing rigorous and relevant program Administration Ongoing
4. Provide quality staff development through personal learning
communities
Administration, Instructional
Literacy Coach, Department
Chairs
Ongoing
2012-2013 School Improvement Plan (SIP)-Form SIP-1
August 2012
Rule 6A-1.099811
Revised April 29, 2011 5
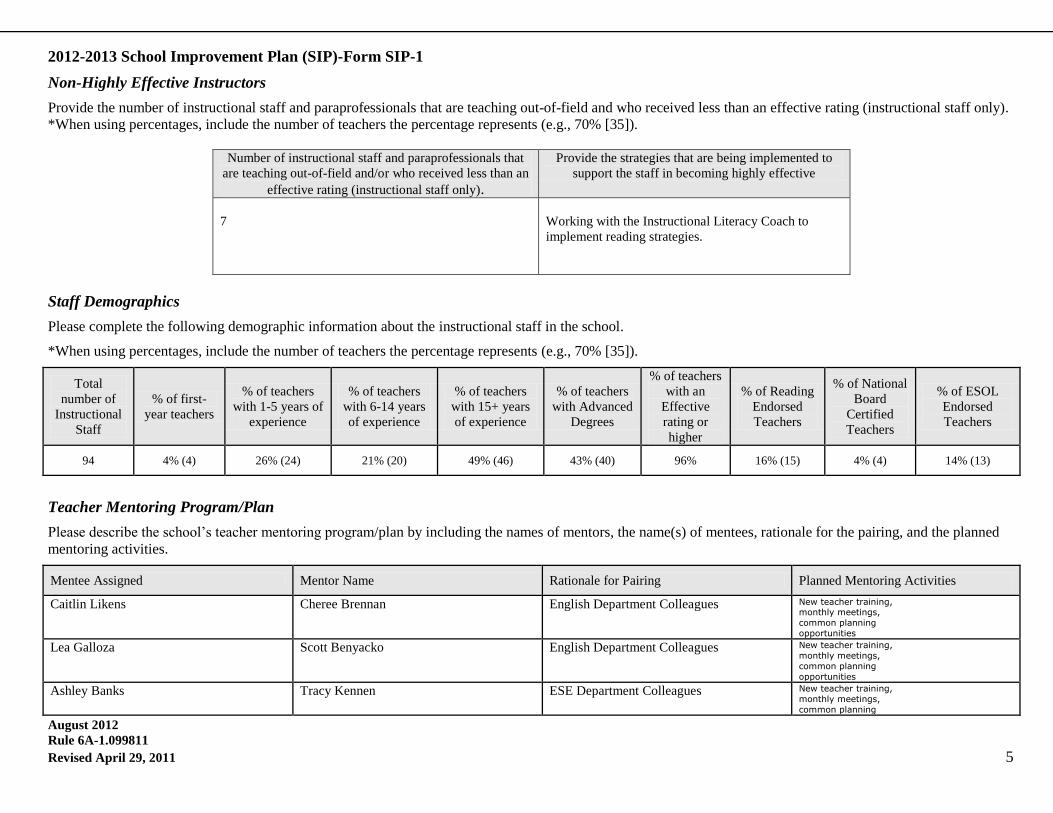
Non-Highly Effective Instructors
Provide the number of instructional staff and paraprofessionals that are teaching out-of-field and who received less than an effective rating (instructional staff only).
*When using percentages, include the number of teachers the percentage represents (e.g., 70% [35]).
Number of instructional staff and paraprofessionals that
are teaching out-of-field and/or who received less than an
effective rating (instructional staff only).
Provide the strategies that are being implemented to
support the staff in becoming highly effective
7
Working with the Instructional Literacy Coach to
implement reading strategies.
Staff Demographics
Please complete the following demographic information about the instructional staff in the school.
*When using percentages, include the number of teachers the percentage represents (e.g., 70% [35]).
Total
number of
Instructional
Staff
% of first-
year teachers
% of teachers
with 1-5 years of
experience
% of teachers
with 6-14 years
of experience
% of teachers
with 15+ years
of experience
% of teachers
with Advanced
Degrees
% of teachers
with an
Effective
rating or
higher
% of Reading
Endorsed
Teachers
% of National
Board
Certified
Teachers
% of ESOL
Endorsed
Teachers
94 4% (4) 26% (24) 21% (20) 49% (46) 43% (40) 96% 16% (15) 4% (4) 14% (13)
Teacher Mentoring Program/Plan
Please describe the school’s teacher mentoring program/plan by including the names of mentors, the name(s) of mentees, rationale for the pairing, and the planned
mentoring activities.
Mentee Assigned Mentor Name Rationale for Pairing Planned Mentoring Activities
Caitlin Likens Cheree Brennan English Department Colleagues New teacher training, monthly meetings,
common planning
opportunities
Lea Galloza Scott Benyacko English Department Colleagues New teacher training,
monthly meetings,
common planning
opportunities
Ashley Banks Tracy Kennen ESE Department Colleagues New teacher training,
monthly meetings,
common planning

2012-2013 School Improvement Plan (SIP)-Form SIP-1
August 2012
Rule 6A-1.099811
Revised April 29, 2011 6
opportunities
Parker Eckoff Hazel McCall ESE Department Colleagues New teacher training, monthly meetings,
common planning
opportunities
Gary Wilson Kate Keating Math Department Colleagues New teacher training,
monthly meetings,
common planning
opportunities
MaryKatherine Boss Michelle Wamser Math Department Colleagues New teacher training,
monthly meetings,
common planning opportunities
Heather Taylor Linda Herrera English Department Colleagues New teacher training, monthly meetings,
common planning
opportunities
Heather Naughton Judy Ashley English Department Colleagues New teacher training,
monthly meetings,
common planning
opportunities
Rebecca Booher Adam Ringwood ESE Department Colleagues New teacher training,
monthly meetings,
common planning opportunities
Jennifer Whalen Kendra Eaton ESE Department Colleagues New teacher training, monthly meetings,
common planning
opportunities
Betsy Fishburne Debbie O’ Steen ESE Department Colleagues New teacher training,
monthly meetings,
common planning
opportunities
Warren McCray Gail Cullum Department Colleagues New teacher training,
monthly meetings, common planning
opportunities
Brian Schoonover Billy Richardson Department Colleagues New teacher training,
monthly meetings,
common planning
opportunities

2012-2013 School Improvement Plan (SIP)-Form SIP-1
August 2012
Rule 6A-1.099811
Revised April 29, 2011 7
Additional Requirements
Coordination and Integration-Title I Schools Only Please describe how federal, state, and local services and programs will be coordinated and integrated in the school. Include other Title programs, Migrant and
Homeless, Supplemental Academic Instruction funds, as well as violence prevention programs, nutrition programs, housing programs, Head Start, adult education,
career and technical education, and/or job training, as applicable.
Title I, Part A
Title I, Part C- Migrant
Title I, Part D
Title II
Title III
Title X- Homeless
Supplemental Academic Instruction (SAI)
Violence Prevention Programs
Nutrition Programs
Housing Programs
Head Start
Adult Education
Career and Technical Education
Job Training
Other

2012-2013 School Improvement Plan (SIP)-Form SIP-1
August 2012
Rule 6A-1.099811
Revised April 29, 2011 8
Multi-Tiered System of Supports (MTSS) /Response to Instruction/Intervention (RtI)
2012-2013 School Improvement Plan (SIP)-Form SIP-1
August 2012
Rule 6A-1.099811
Revised April 29, 2011 9
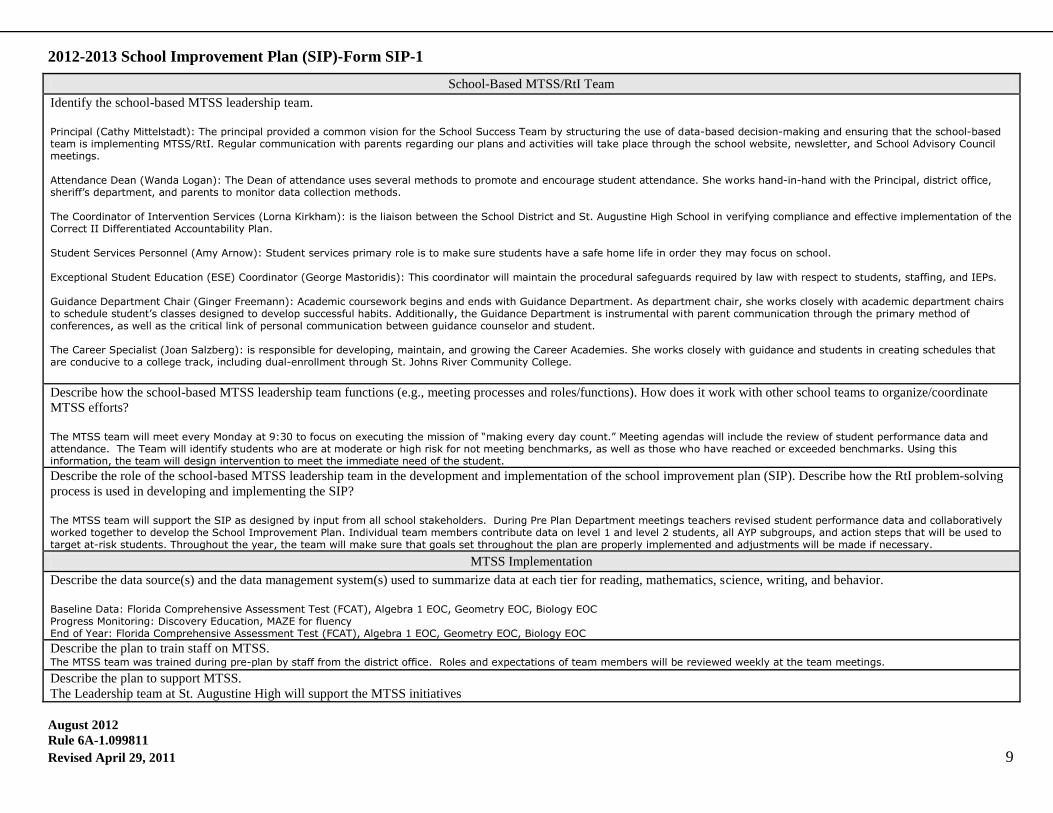
School-Based MTSS/RtI Team
Identify the school-based MTSS leadership team.
Principal (Cathy Mittelstadt): The principal provided a common vision for the School Success Team by structuring the use of data-based decision-making and ensuring that the school-based team is implementing MTSS/RtI. Regular communication with parents regarding our plans and activities will take place through the school website, newsletter, and School Advisory Council meetings. Attendance Dean (Wanda Logan): The Dean of attendance uses several methods to promote and encourage student attendance. She works hand-in-hand with the Principal, district office, sheriff’s department, and parents to monitor data collection methods. The Coordinator of Intervention Services (Lorna Kirkham): is the liaison between the School District and St. Augustine High School in verifying compliance and effective implementation of the Correct II Differentiated Accountability Plan. Student Services Personnel (Amy Arnow): Student services primary role is to make sure students have a safe home life in order they may focus on school. Exceptional Student Education (ESE) Coordinator (George Mastoridis): This coordinator will maintain the procedural safeguards required by law with respect to students, staffing, and IEPs. Guidance Department Chair (Ginger Freemann): Academic coursework begins and ends with Guidance Department. As department chair, she works closely with academic department chairs to schedule student’s classes designed to develop successful habits. Additionally, the Guidance Department is instrumental with parent communication through the primary method of conferences, as well as the critical link of personal communication between guidance counselor and student. The Career Specialist (Joan Salzberg): is responsible for developing, maintain, and growing the Career Academies. She works closely with guidance and students in creating schedules that are conducive to a college track, including dual-enrollment through St. Johns River Community College.
Describe how the school-based MTSS leadership team functions (e.g., meeting processes and roles/functions). How does it work with other school teams to organize/coordinate
MTSS efforts?
The MTSS team will meet every Monday at 9:30 to focus on executing the mission of “making every day count.” Meeting agendas will include the review of student performance data and attendance. The Team will identify students who are at moderate or high risk for not meeting benchmarks, as well as those who have reached or exceeded benchmarks. Using this information, the team will design intervention to meet the immediate need of the student.
Describe the role of the school-based MTSS leadership team in the development and implementation of the school improvement plan (SIP). Describe how the RtI problem-solving
process is used in developing and implementing the SIP?
The MTSS team will support the SIP as designed by input from all school stakeholders. During Pre Plan Department meetings teachers revised student performance data and collaboratively worked together to develop the School Improvement Plan. Individual team members contribute data on level 1 and level 2 students, all AYP subgroups, and action steps that will be used to target at-risk students. Throughout the year, the team will make sure that goals set throughout the plan are properly implemented and adjustments will be made if necessary.
MTSS Implementation
Describe the data source(s) and the data management system(s) used to summarize data at each tier for reading, mathematics, science, writing, and behavior.
Baseline Data: Florida Comprehensive Assessment Test (FCAT), Algebra 1 EOC, Geometry EOC, Biology EOC Progress Monitoring: Discovery Education, MAZE for fluency End of Year: Florida Comprehensive Assessment Test (FCAT), Algebra 1 EOC, Geometry EOC, Biology EOC
Describe the plan to train staff on MTSS. The MTSS team was trained during pre-plan by staff from the district office. Roles and expectations of team members will be reviewed weekly at the team meetings.
Describe the plan to support MTSS.
The Leadership team at St. Augustine High will support the MTSS initiatives

2012-2013 School Improvement Plan (SIP)-Form SIP-1
August 2012
Rule 6A-1.099811
Revised April 29, 2011
10
Literacy Leadership Team (LLT)
School-Based Literacy Leadership Team
Identify the school-based Literacy Leadership Team (LLT).
The school Literacy Leadership Team will be led by the Instructional Literacy Coach, Donna McCarthy-Jensen. All Intensive reading teachers, as well as representative from each department will be active members and attend all meetings. The literacy strategies will focus on helping students interact with new knowledge, helping students practice and deepen new knowledge, and helping students generate and test hypotheses.
Describe how the school-based LLT functions (e.g., meeting processes and roles/functions).
The LLT will meet once a month on Wednesday mornings during the school-wide designated PLCs. Information, data, and strategies discussed at the meetings will then be taken back to departments via the representatives during scheduled department meetings.
What will be the major initiatives of the LLT this year?
The LLT will focus on implementing WICOR (Writing, Inquiry Based Instruction, Collaboration, Organization and Reading) school-wide. Specifically, they will design and implement staff training so all teachers, despite the content area, can implement literacy strategies through the curriculum.
Public School Choice
Supplemental Educational Services (SES) Notification
Upload a copy of the SES Notification to Parents in the designated upload link on the “Upload” page.

2012-2013 School Improvement Plan (SIP)-Form SIP-1
August 2012
Rule 6A-1.099811
Revised April 29, 2011
11
*Elementary Title I Schools Only: Pre-School Transition Describe plans for assisting preschool children in transition from early childhood programs to local elementary school programs as applicable.
*Grades 6-12 Only Sec. 1003.413 (2) (b) F.S For schools with grades 6-12, how does the school ensure that every teacher contributes to the reading improvement of every student?
All teachers are responsible for following their content area pacing guide/calendars. Each week, lessons must include instruction based on the designated skill. Every course, despite the content area, requires the reading of course texts. For this reason, all teachers must provide opportunities for students to learn the language and comprehend required materials.
*High Schools Only
Note: Required for High School-Sec. 1003.413(2)(g), (2)(j) F.S.
How does the school incorporate applied and integrated courses to help students see the relationships between subjects and relevance to their future?
In conjunction with the five Career Academies at our school, learning cohorts have been established to create relevance to students’ future goals and to allow collaborative units to highlight the many relationships between content areas. Multiple electives will be offered to students not in an academy, including an executive externship option, allowing students to receive credit while out in the workforce. In addition, professional learning communities will focus on the creation of engaging learning experiences to provide learning opportunities in a real-world context. Lesson plans with be shared among faculty through a network folder, allowing shared access and the ability to align content goals. Many students will receive reading remediation through the content area. We currently have English teachers and a World History teacher offering this integrated course.
How does the school incorporate students’ academic and career planning, as well as promote student course selections, so that students’ course of study is personally
meaningful? Students play an active role in creating a schedule that aligns to individual academic and career goals. Each student is required to meet with his/her designated counselor to ensure these decisions are the most conducive to reaching personal goals. Joan Salzberg, the Career Specialist, also plays an active role in creating schedules for students involved in the career academies, including dual-enrollment options.
Postsecondary Transition
Note: Required for High School- Sec. 1008.37(4), F.S.
Describe strategies for improving student readiness for the public postsecondary level based on annual analysis of the High School Feedback Report.
According to the 2007 High School Feedback Report, 70.1% of students completed a college prep curriculum as compared to the 57.5% district and 59.6% state percentages. More recent data is not available. The school dropout rate as of October 2009 is 2.02%. Students who typically exceed standards will be encouraged to participate in the AICE program or take advantage of Dual Enrollment and Advance Placement opportunities. The Students Services department will continuously share information regarding Bright Futures and other available

2012-2013 School Improvement Plan (SIP)-Form SIP-1
August 2012
Rule 6A-1.099811
Revised April 29, 2011
12
scholarships.

2012-2013 School Improvement Plan (SIP)-Form SIP-1
August 2012
Rule 6A-1.099811
Revised April 29, 2011
13
PART II: EXPECTED IMPROVEMENTS
Reading Goals
* When using percentages, include the number of students the percentage represents (e.g., 70% [35]).
Reading Goals Problem-Solving Process to Increase Student Achievement
Based on the analysis of student achievement data and reference to “Guiding Questions,” identify and define
areas in need of improvement for the following group:
Anticipated Barrier Strategy Person or Position Responsible for Monitoring
Process Used to Determine Effectiveness of Strategy
Evaluation Tool
1A. FCAT 2.0: Students scoring at
Achievement Level 3 in reading.
1A.1. Large percentage of low
achieving students. All subgroups
are not making AYP.
1A.1. School-wide implementation
of district content area calendars
(pacing guides)
1A.1. Instructional Literacy
Coach
1A.1. Progress monitoring tools,
class assessments, End of
Quarter Exams
1A.1.FCAT, Performance Plus
Reading Goal #1A:
St. Augustine High
will increase the
percentage of
students achieving
proficiency in
Reading by 2%
2012 Current Level of
Performance:*
2013 Expected Level of
Performance:*
25 %(205) 27 %
1A.2. Large percentage of low
achieving students. All subgroups are not making AYP.
1A.2. Jacket Read of the Week
(extended 4th period articles)
1A.2. Instructional Literacy
Coach, all departments
1A.2. Progress monitoring tools 1A.2. FCAT
1A.3. Large percentage of low
achieving students. All subgroups
are not making AYP.
1A.3. After-school FCAT
prep/tutoring program
1A.3.Instructional Literacy
Coach
1A.3.Progress monitoring tools 1A.3.FCAT, Performance Plus
1A.4. Large percentage of low achieving students. All subgroups
are not making AYP.
1A.4. 90-minute Intensive Reading classes using Read 180.
1A.4. Classroom teachers and Instructional Literacy Coach
1A.4. Discovery Education, MAZE (fluency)
1A.4. FCAT, Performance Plus
1A.5. Large percentage of low
achieving students. All subgroups are not making AYP.
1A.5. 45-minute Intensive Reading
classes using Book Jam and high interest novels
1A.5. Classroom teachers and
Instructional Literacy Coach
1A.5. Discovery Education,
MAZE (fluency)
1A.5. FCAT, Performance Plus
1A.6. Large percentage of low
achieving students. All subgroups
are not making AYP.
1A.6. Focus on content area
vocabulary instruction
1A.6. Content Area teachers 1A.6. Classroom assessments 1A.6. FCAT, Performance Plus
1A.7. SWD subgroup not making learning gains.
1A.7. SRA, Scripted Reading 1A.7. ESE Teachers 1A.7. Discovery Education, MAZE (fluency)
1A.7. FCAT, Performance Plus
1A.8. Large percentage of low
achieving students. All subgroups are not making AYP.
1A.8. Use of technology and visual
aids in instruction (SMART Slate, ELMO, PS Clickers)
1A.8. Content area teachers 1A.8. Classroom assessments
and progress monitoring tools
1A.8. FCAT, Performance Plus
1A.9. Large percentage of low
achieving students. All subgroups
are not making AYP.
1A.9. Enrollment in AVID Program 1A.9. AVID Instructor, AVID
content teachers
1A.9. Classroom assessment,
and progress monitoring tools
1A.9. FCAT, Performance Plus

2012-2013 School Improvement Plan (SIP)-Form SIP-1
August 2012
Rule 6A-1.099811
Revised April 29, 2011
14
1A.10. Students lack interest in
reading
1A.10. Teacher-driven literacy
initiatives and high interest
novels/text
1A.10. Instructional Literacy
Coach, Reading and English
teachers
1A.10. Discovery Education,
MAZE (fluency)
1A.10. FCAT, Performance Plus
1B. Florida Alternate Assessment: Students
scoring at Levels 4, 5, and 6 in reading.
1B.1 Lack of student interest/
motivation during actual testing period
1B.1 Practice for alternative
assessment using curriculum with similar presentation
1B.1 I.D. / Self - contained team
1B.1 Classroom Assessments,
Interest Driven materials, real world application
1B.1 Florida Alternate
Assessment
Reading Goal #1B:
St. Augustine high
will increase the
percentage of
students scoring at
levels 4, 5, and 6 in
reading by 2%
2012 Current
Level of Performance:*
2013 Expected
Level of Performance:*
75 % (6) 77 %
1B.2. 1B.2. 1B.2. 1B.2. 1B.2.
1B.3. 1B.3. 1B.3. 1B.3. 1B.3.

2012-2013 School Improvement Plan (SIP)-Form SIP-1
August 2012
Rule 6A-1.099811
Revised April 29, 2011
15
Based on the analysis of student achievement data and
reference to “Guiding Questions,” identify and define
areas in need of improvement for the following group:
Anticipated Barrier Strategy Person or Position
Responsible for Monitoring
Process Used to Determine
Effectiveness of Strategy
Evaluation Tool
2A. FCAT 2.0: Students scoring at or above
Achievement Levels 4 in reading.
2A.1. Low performance on research-based questions
2A.1. Content area focus on WICOR strategies
2A.1. Content area teachers 2A.1. Classroom assessments 2A.1. FCAT, Performance Plus
Reading Goal #2A:
St. Augustine High
will increase the
percentage of
students scoring
above proficiency by
2 %.
2012 Current
Level of Performance:*
2013 Expected
Level of Performance:*
37% (306) 39%
2A.2. Difficult content area vocabulary
2A.2. Focus on explicit content-area vocabulary instruction
2A.2. Content area teachers 2A.2. Classroom assessments 2A.2. FCAT, Performance Plus
2A.3. Diverse learning needs 2A.3. Use of technology and visual
aids (SMART Slates, ELMOS, CPS Clickers)
2A.3. Content area teachers 2A.3.Classroom assessments and
progress monitoring tools
2A.3. FCAT, Performance Plus
2B. Florida Alternate Assessment: Students
scoring at or above Level 7 in reading.
2B.1 Lack of student interest/
motivation during actual testing period
2B.1 Practice for alternative
assessment using curriculum with similar presentation
2B.1 I.D. / Self - contained team
2B.1 Classroom Assessments,
Interest Driven materials, real world application
2B.1 Florida Alternate
Assessment
Reading Goal #2B:
St. Augustine High
will increase the
percentage of
students scoring at or
above level 7 in
reading by 2%.
2012 Current
Level of Performance:*
2013 Expected
Level of Performance:*
0% (0) 2%
2B.2. 2B.2. 2B.2. 2B.2. 2B.2.
2B.3. 2B.3. 2B.3. 2B.3. 2B.3.

2012-2013 School Improvement Plan (SIP)-Form SIP-1
August 2012
Rule 6A-1.099811
Revised April 29, 2011
16
Based on the analysis of student achievement data and
reference to “Guiding Questions,” identify and define
areas in need of improvement for the following group:
Anticipated Barrier Strategy Person or Position
Responsible for Monitoring
Process Used to Determine
Effectiveness of Strategy
Evaluation Tool
3A. FCAT 2.0: Percentage of students making
learning gains in reading.
3A.1. All subgroups not making AYP
3A.1. During-school FCAT prep/tutoring program
3A.1. Instructional Literacy Coach
3A.1. Progress monitoring tools 3A.1. FCAT, Performance Plus
Reading Goal #3A:
St. Augustine High
will increase the
percentage of
students making
learning gains in
reading by 2%.
2012 Current
Level of Performance:*
2013 Expected
Level of Performance:*
64% 66%
3A.2. All subgroups not making AYP
3A.2. Use of technology and visual aids (SMART Slates, ELMOS, CPS
Clickers)
3A.2. Content area teachers 3A.2.Classroom assessment and progress monitoring tools
3A.2. FCAT, Performance Plus
3A.3. All subgroups not making
AYP
3A.3. Focus on explicit content area
vocabulary instruction
3A.3. Content area teachers 3A.3. Classroom assessment 3A.3. FCAT, Performance Plus
3A. All subgroups not making AYP
4.
3A.4. ACT/SAT tutoring 3A.4. Instructional Literacy
Coach
3A.4. Test scores 3A.4. ACT, SAT
3B. Florida Alternate Assessment: Percentage
of students making learning gains in reading.
3B.1 Lack of student interest/
motivation during actual testing
period
3B.1 Practice for alternative
assessment using curriculum with
similar presentation
3B.1 I.D. / Self - contained team
3B.1 Classroom Assessments,
Interest Driven materials, real
world application
3B.1 Florida Alternate
Assessment
Reading Goal #3B:
St. Augustine High
will increase the
percentage of
students making
learning gains in
reading by 2%.
2012 Current
Level of Performance:*
2013 Expected
Level of Performance:*
59% (7) 61%
3B.2. 3B.2. 3B.2. 3B.2. 3B.2.
3B.3. 3B.3. 3B.3. 3B.3. 3B.3.

2012-2013 School Improvement Plan (SIP)-Form SIP-1
August 2012
Rule 6A-1.099811
Revised April 29, 2011
17
Based on the analysis of student achievement data and
reference to “Guiding Questions,” identify and define
areas in need of improvement for the following group:
Anticipated Barrier Strategy Person or Position
Responsible for Monitoring
Process Used to Determine
Effectiveness of Strategy
Evaluation Tool
4. FCAT 2.0: Percentage of students in lowest
25% making learning gains in reading.
4A.1. Low motivation and self confidence
4A.1. Jacket read of the Week (extended 4th period reading)
4A.1. Instructional Literacy Coach, all departments
4A.1. Progress monitoring tools 4A.1. FCAT, Performance Plus
Reading Goal #4:
St. Augustine High
will increase the
percentage of
students in the lowest
25% making learning
gains in reading by
2%.
2012 Current
Level of Performance:*
2013 Expected
Level of Performance:*
56% 58%
4A.2. Low motivation 4A.2. during-school FCAT prep/tutoring
4A.2. Instructional Literacy Coach
4A.2. Progress monitoring tools 4A.2. FCAT, Performance Plus
4A.3. Large percentage of low
achieving students need intensive reading instruction
4A.3. 90-minute Intensive reading
classes for Level 1 students using Read 180
4A.3. Intensive Reading teachers 4A.3. program material, progress
monitoring tools
4A.3. FCAT, Performance Plus
4A.4. Large percentage of SWD in
lowest 25%
4A.4. Scripted reading, SRA 4A.4. Intensive Reading/ESE
teachers
4A.4. Program materials,
progress monitoring tools
4A.4. FCAT, Performance Plus
4A.5. Large range of diverse needs 4A.5. Use of technology and visual aids (SMART Slates, ELMOS, CPS
Clickers)
4A.5. Intensive Reading/ESE teachers
4A5. Program materials, progress monitoring tools
4A.5. FCAT, Performance Plus
2012-2013 School Improvement Plan (SIP)-Form SIP-1
August 2012
Rule 6A-1.099811
Revised April 29, 2011
18
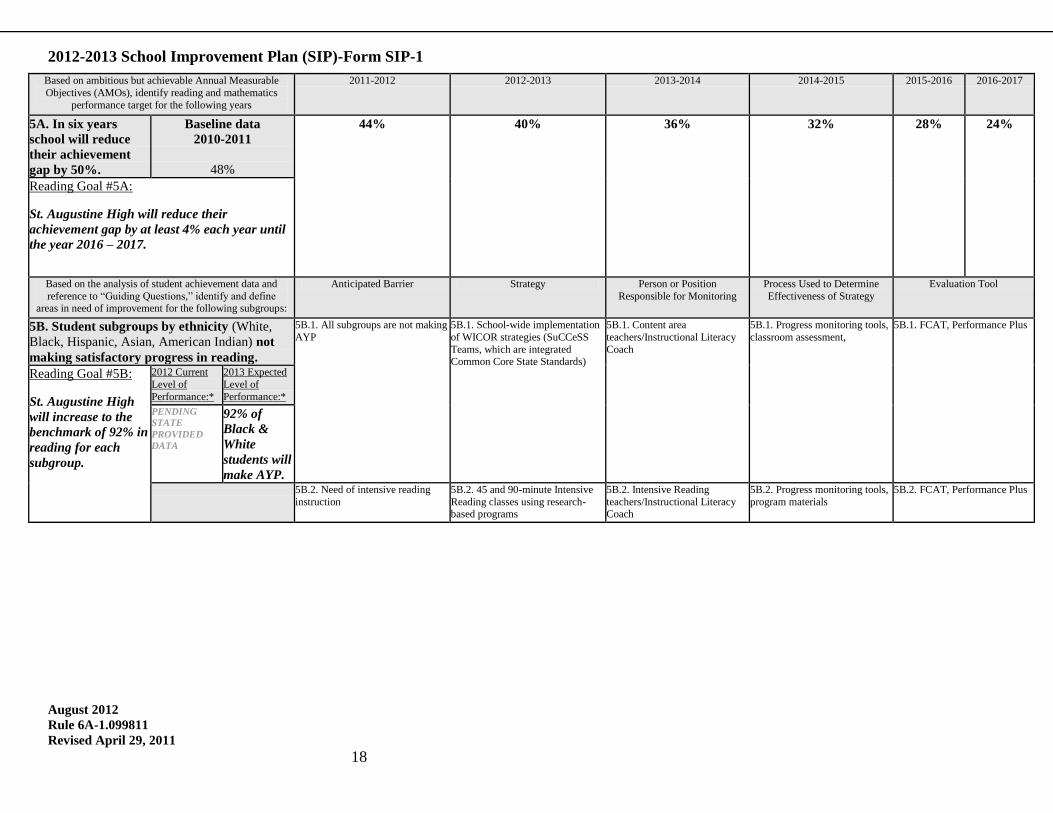
Based on ambitious but achievable Annual Measurable
Objectives (AMOs), identify reading and mathematics
performance target for the following years
2011-2012 2012-2013 2013-2014 2014-2015 2015-2016 2016-2017
5A. In six years
school will reduce
their achievement
gap by 50%.
Baseline data
2010-2011
48%
44% 40% 36% 32% 28% 24%
Reading Goal #5A:
St. Augustine High will reduce their
achievement gap by at least 4% each year until
the year 2016 – 2017.
Based on the analysis of student achievement data and
reference to “Guiding Questions,” identify and define areas in need of improvement for the following subgroups:
Anticipated Barrier Strategy Person or Position
Responsible for Monitoring
Process Used to Determine
Effectiveness of Strategy
Evaluation Tool
5B. Student subgroups by ethnicity (White,
Black, Hispanic, Asian, American Indian) not
making satisfactory progress in reading.
5B.1. All subgroups are not making
AYP
5B.1. School-wide implementation
of WICOR strategies (SuCCeSS
Teams, which are integrated Common Core State Standards)
5B.1. Content area
teachers/Instructional Literacy
Coach
5B.1. Progress monitoring tools,
classroom assessment,
5B.1. FCAT, Performance Plus
Reading Goal #5B:
St. Augustine High
will increase to the
benchmark of 92% in
reading for each
subgroup.
2012 Current
Level of
Performance:*
2013 Expected
Level of
Performance:*
PENDING
STATE
PROVIDED
DATA
92% of
Black &
White
students will
make AYP. 5B.2. Need of intensive reading
instruction
5B.2. 45 and 90-minute Intensive
Reading classes using research-based programs
5B.2. Intensive Reading
teachers/Instructional Literacy Coach
5B.2. Progress monitoring tools,
program materials
5B.2. FCAT, Performance Plus

2012-2013 School Improvement Plan (SIP)-Form SIP-1
August 2012
Rule 6A-1.099811
Revised April 29, 2011
19
Based on the analysis of student achievement data and
reference to “Guiding Questions,” identify and define
areas in need of improvement for the following subgroup:
Anticipated Barrier Strategy Person or Position
Responsible for Monitoring
Process Used to Determine
Effectiveness of Strategy
Evaluation Tool
5C. English Language Learners (ELL) not
making satisfactory progress in reading.
5C.1. Language barriers 5C.1. Rosetta Stone pull-outs/Language!
5C.1. Intensive reading teachers/Instructional Literacy
Coach
5C.1. Program materials/MAZE, FAIR
5C.1. FCAT/Performance Plus
Reading Goal #5C:
St. Augustine High
will increase to the
benchmark of 92% in
reading for ELL.
2012 Current
Level of Performance:*
2013 Expected
Level of Performance:*
PENDING
STATE
PROVIDED
DATA
92% of ELL
will make
AYP
Based on the analysis of student achievement data and reference to “Guiding Questions,” identify and define
areas in need of improvement for the following subgroup:
Anticipated Barrier Strategy Person or Position Responsible for Monitoring
Process Used to Determine Effectiveness of Strategy
Evaluation Tool
5D. Students with Disabilities (SWD) not
making satisfactory progress in reading.
5D.1. Large subgroup population 5D.1. Scripted Reading 5D.1. ESE teachers 5D.1. Program materials and
resources
5D.1. FCAT, Performance Plus
Reading Goal #5D:
St. Augustine High
will increase to the
benchmark of 92% in
reading for SWD.
2012 Current Level of
Performance:*
2013 Expected Level of
Performance:*
PENDING
STATE
PROVIDED
DATA
92% of
SWD will
make AYP.

2012-2013 School Improvement Plan (SIP)-Form SIP-1
August 2012
Rule 6A-1.099811
Revised April 29, 2011
20
Based on the analysis of student achievement data and
reference to “Guiding Questions,” identify and define
areas in need of improvement for the following subgroup:
Anticipated Barrier Strategy Person or Position
Responsible for Monitoring
Process Used to Determine
Effectiveness of Strategy
Evaluation Tool
5E. Economically Disadvantaged students not
making satisfactory progress in reading.
5E.1. Low motivation and support 5E.1. Most Valuable Jacket/Punctuality Pays
5E.1. Instructional Literacy Coach 5E.1. Progress monitoring, conferencing
5E.1. FCAT, Performance Plus
Reading Goal #5E:
St. Augustine High
will increase to the
benchmark of 92% in
reading for ED
students.
2012 Current
Level of Performance:*
2013 Expected
Level of Performance:*
PENDING
STATE
PROVIDED
DATA
92% of ED
students will
make AYP 5E.2. Low motivation and support 5E.2. Jacket Writing Project
(weekly reading and writing group
using high-interest literature)
5E.2. Instructional Literacy Coach 5E.2. Conferencing, progress
monitoring tools
5E.2. FCAT, Performance Plus
5E.3. Low motivation and support 5E.3. After-school FCAT prep/tutoring program
5E.3. Instructional Literacy Coach 5E.3. Progress monitoring tools
5E.3. FCAT, Performance Plus
5E.4. Low motivation and support 5E.4. Enrollment in AVID Program 5E.4. AVID Instructor and Site
team
5E.4. Classroom assessment
and progress monitoring tools
5E.4 FCAT, Performance Plus
Reading Professional Development
Professional Development (PD) aligned with Strategies through Professional Learning Community (PLC) or PD Activities Please note that each strategy does not require a professional development or PLC activity.
PD Content/Topic
and/or PLC Focus
Grade Level/
Subject
PD Facilitator
and/or PLC Leader
PD Participants
(e.g., PLC, subject, grade level, or school-wide)
Target Dates (e.g., early release)
and Schedules (e.g., frequency of meetings)
Strategy for Follow-up/Monitoring Person or Position Responsible
for Monitoring
Advancement via Individual Determination (AVID)
Grades 9 - 11 Lauren Spatola Avid Teachers Monthly Progress Monitoring/ data analysis Lauren Spatola
WICOR ALL Donna McCarthy-
Jensen School-Wide Monthly Progress Monitoring/ data analysis Donna McCarthy-Jensen

2012-2013 School Improvement Plan (SIP)-Form SIP-1
August 2012
Rule 6A-1.099811
Revised April 29, 2011
21
Reading Budget (Insert rows as needed) Include only school funded activities/materials and exclude district funded activities/materials.
Evidence-based Program(s)/Materials(s)
Strategy Description of Resources Funding Source Amount
Program to target middle to low
achieving students
AVID: Research-based program District/ Administrative budget $13,400.00
Before/After School FCAT prep and
tutoring program
Teacher stipend and materials Administrative/ SAC $6,000.00
Various PLC’s anchored to SIP Research based Administrative/ SAC $1,000.00
Subtotal: $20,400.00
Technology
Strategy Description of Resources Funding Source Amount
Interactive Learning SMART slates hand-held devices Administrative $7,000.00
Visual Aids Mounted LCDs Administrative $22,000.00
Visual Aids ELMOs Administrative $4,000.00
Subtotal: $33,000.00
Professional Development
Strategy Description of Resources Funding Source Amount
AVID teacher training Teacher workshops School Based Budget $1,500.00
Wednesday Morning PLCs Materials Administrative $500.00
Subtotal: $2,000.00
Other
Strategy Description of Resources Funding Source Amount
Identify and provide additional assistance
for Black, Economically Disadvantaged,
and SWD subgroups to ensure AYP.
Before/After school FCAT/EOC prep and
tutoring program
Pending Grant Approval $2,500.00
Incentive Programs Refreshments and Supplies Administrative $400.00
Reading Teacher Additional Instructors SAI $65,000.00
Jacket Writing Project Books and Supplies SAC $150.00
Subtotal: $68,050.00
Total: $123,450.00
End of Reading Goals

2012-2013 School Improvement Plan (SIP)-Form SIP-1
August 2012
Rule 6A-1.099811
Revised April 29, 2011
22
Comprehensive English Language Learning Assessment (CELLA) Goals
* When using percentages, include the number of students the percentage represents (e.g., 70% [35]).
CELLA Goals Problem-Solving Process to Increase Language Acquisition
Students speak in English and understand spoken English
at grade level in a manner similar to non-ELL students.
Anticipated Barrier Strategy Person or Position
Responsible for Monitoring
Process Used to Determine
Effectiveness of Strategy
Evaluation Tool
1. Students scoring proficient in
listening/speaking.
1.1. Language 1.1. Language! 1.1.Intensive Reading Teachers, Instructional Literacy Coach
1.1. Language! Program materials, FAIR
1.1. FCAT, Performance Plus
CELLA Goal #1:
56% of students will
score proficient in
listening/Speaking.
2012 Current Percent of Students
Proficient in Listening/Speaking:
54% (7)
1.2. 1.2. 1.2. 1.2. 1.2.
1.3. 1.3. 1.3. 1.3. 1.3.
Students read grade-level text in English in a manner
similar to non-ELL students.
Anticipated Barrier Strategy Person or Position
Responsible for Monitoring
Process Used to Determine
Effectiveness of Strategy
Evaluation Tool
2. Students scoring proficient in reading. 2.1. Language 2.1. Language! 2.1.Intensive Reading Teachers,
Instructional Literacy Coach
2.1. Language! Program
materials, FAIR
2.1. FCAT, Performance Plus
CELLA Goal #2:
17% of students will
score proficient in
reading.
2012 Current Percent of Students
Proficient in Reading:
15% (2)
2.2. 2.2. 2.2. 2.2. 2.2.
2.3. 2.3. 2.3. 2.3. 2.3.

2012-2013 School Improvement Plan (SIP)-Form SIP-1
August 2012
Rule 6A-1.099811
Revised April 29, 2011
23
Students write in English at grade level in a manner
similar to non-ELL students.
Anticipated Barrier Strategy Person or Position
Responsible for Monitoring
Process Used to Determine
Effectiveness of Strategy
Evaluation Tool
3. Students scoring proficient in writing. 3.1. Language 3.1. Language! 3.1.Intensive Reading Teachers, Instructional Literacy Coach
3.1. Language! Program materials, FAIR
3.1. FCAT, Performance Plus
CELLA Goal #3:
35% of students will
score proficient in
writing.
2012 Current Percent of Students
Proficient in Writing :
33% (4)
3.2. 3.2. 3.2. 3.2. 3.2.
3.3. 3.3. 3.3. 3.3. 3.3.

2012-2013 School Improvement Plan (SIP)-Form SIP-1
August 2012
Rule 6A-1.099811
Revised April 29, 2011
24
CELLA Budget (Insert rows as needed) Include only school-based funded activities/materials and exclude district funded activities/materials.
Evidence-based Program(s)/Materials(s)
Strategy Description of Resources Funding Source Amount
Subtotal:
Technology
Strategy Description of Resources Funding Source Amount
Subtotal:
Professional Development
Strategy Description of Resources Funding Source Amount
Subtotal:
Other
Strategy Description of Resources Funding Source Amount
Subtotal:
Total:
End of CELLA Goals

2012-2013 School Improvement Plan (SIP)-Form SIP-1
August 2012
Rule 6A-1.099811
Revised April 29, 2011
25
Florida Alternate Assessment High School Mathematics Goals
* When using percentages, include the number of students the percentage represents (e.g., 70% [35]).
High School Mathematics Goals Problem-Solving Process to Increase Student Achievement
Based on the analysis of student achievement data and
reference to “Guiding Questions,” identify and define areas
in need of improvement for the following group:
Anticipated Barrier Strategy Person or Position
Responsible for Monitoring
Process Used to Determine
Effectiveness of Strategy
Evaluation Tool
1. Florida Alternate Assessment: Students
scoring at Levels 4, 5, and 6 in mathematics.
1.1 Lack of student interest/
motivation during actual testing period
1.1 Practice for alternative
assessment using curriculum with similar presentation
1.1 I.D. / Self - contained team
1.1 Classroom Assessments,
Interest Driven materials, real world application
1.1 Florida Alternate
Assessment
Mathematics Goal #1:
St. Augustine High
will increase the
percentage of
students scoring at
levels 4, 5, and 6 by
2%.
2012 Current
Level of
Performance:*
2013 Expected
Level of
Performance:*
57% (4) 59%
1.2. 1.2. 1.2. 1.2. 1.2.
1.3. 1.3. 1.3. 1.3. 1.3.
Based on the analysis of student achievement data and reference to “Guiding Questions,” identify and define areas
in need of improvement for the following group:
Anticipated Barrier Strategy Person or Position Responsible for Monitoring
Process Used to Determine Effectiveness of Strategy
Evaluation Tool
2. Florida Alternate Assessment: Students
scoring at or above Level 7 in mathematics.
2.1 Lack of student interest/ motivation
during actual testing period
2.1 Practice for alternative assessment using
curriculum with similar presentation
2.1 I.D. / Self -
contained team
2.1 Classroom Assessments, Interest
Driven materials, real world application
2.1 Florida Alternate
Assessment
Mathematics Goal #2:
St. Augustine High
will increase the
percentage of
students scoring at or
above level 7 by 2%.
2012 Current Level of
Performance:*
2013 Expected Level of
Performance:*
0% (0) 2%
2.2. 2.2. 2.2. 2.2. 2.2.
2.3. 2.3. 2.3. 2.3. 2.3.

2012-2013 School Improvement Plan (SIP)-Form SIP-1
August 2012
Rule 6A-1.099811
Revised April 29, 2011
26
Based on the analysis of student achievement data and
reference to “Guiding Questions,” identify and define areas
in need of improvement for the following group:
Anticipated Barrier Strategy Person or Position
Responsible for Monitoring
Process Used to Determine
Effectiveness of Strategy
Evaluation Tool
3. Florida Alternate Assessment: Percentage of
students making learning gains in
mathematics.
3.1 Lack of student interest/ motivation during actual testing
period
3.1 Practice for alternative assessment using curriculum with
similar presentation
3.1 I.D. / Self - contained team 3.1 Classroom Assessments, Interest Driven materials, real
world application
3.1 Florida Alternate
Assessment
Mathematics Goal #3:
St. Augustine High
will increase the
percentage of
students making
learning gains in
mathematics by 2%.
2012 Current Level of
Performance:*
2013 Expected Level of
Performance:*
60% (7) 62%
3.2. 3.2. 3.2. 3.2. 3.2.
3.3. 3.3. 3.3. 3.3. 3.3.
End of Florida Alternate Assessment High School Mathematics Goals

2012-2013 School Improvement Plan (SIP)-Form SIP-1
August 2012
Rule 6A-1.099811
Revised April 29, 2011
27
Algebra 1 End-of-Course (EOC) Goals (this section needs to be completed by all schools that have students taking the Algebra I EOC)
* When using percentages, include the number of students the percentage represents (e.g., 70% [35]).
Algebra 1 EOC Goals Problem-Solving Process to Increase Student Achievement
Based on the analysis of student achievement data and
reference to “Guiding Questions,” identify and define
areas in need of improvement for the following group:
Anticipated Barrier Strategy Person or Position
Responsible for Monitoring
Process Used to Determine
Effectiveness of
Strategy
Evaluation Tool
1. Students scoring at Achievement Level 3 in
Algebra 1.
1.1. Large percentage of low achieving subgroups. Not all
subgroups are making AYP.
1.1. Discovery Education progress monitoring practice tests
1.1. Department Chair 1.1.Progress Monitoring Tools, Class Assessment
1.1. Algebra 1 EOC, Performance Plus
Algebra 1 Goal #1:
St. Augustine High
will increase the
percentage of
students scoring at
achievement level by
2%.
2012 Current
Level of
Performance:*
2013 Expected
Level of
Performance:*
52% (184) 54%
1.2. Large percentage of low achieving subgroups. Not all
subgroups are making AYP.
1.2. Intensive Math classes for low achieving students to focus on
mastery of basic skills
1.2. Department Chair 1.2. Progress Monitoring Tools, Class Assessment
1.2. Algebra 1 EOC, Performance Plus
1.3. Large percentage of low
achieving subgroups. Not all subgroups are making AYP.
1.3. Before/After school tutoring
and test prep program
1.3. Department Chair 1.3. Progress Monitoring Tools,
Class Assessment
1.3. Algebra 1 EOC,
Performance Plus
1.4. Large percentage of low
achieving subgroups. Not all
subgroups are making AYP.
1.4. Use of technology and visual
aids in instruction (smart slate,
elmo).
1.4. content area teachers 1.4. Progress Monitoring Tools,
Class Assessment
1.4. Algebra 1 EOC,
Performance Plus
1.5. Large percentage of low achieving subgroups. Not all
subgroups are making AYP.
1.5. Use of district wide pacing guide and common assessment
1.5. Department Chair 1.5. Progress Monitoring Tools, Class Assessment
1.5. Algebra 1 EOC, Performance Plus
1.6. Large percentage of low
achieving subgroups. Not all subgroups are making AYP.
1.6. Focus on content area
vocabulary instruction
1.6. content area teachers 1.6. Progress Monitoring Tools,
Class Assessment
1.6. Algebra 1 EOC,
Performance Plus
Based on the analysis of student achievement data and
reference to “Guiding Questions,” identify and define
areas in need of improvement for the following group:
Anticipated Barrier Strategy Person or Position
Responsible for Monitoring
Process Used to Determine
Effectiveness of Strategy
Evaluation Tool
2. Students scoring at or above Achievement
Levels 4 and 5 in Algebra 1.
2.1. Student readiness for increased
level of expectations
2.1. Enrollment of the midlevel
students into avid honors program to push students from midlevel to
high levels of achievement
2.1. Avid Instructor 2.1. Progress Monitoring Tools,
Class Assessment
2.1. Algebra 1 EOC,
Performance Plus
Algebra Goal #2:
St. Augustine High
will increase the
percentage of
2012 Current
Level of
Performance:*
2013 Expected
Level of
Performance:*
12% (42) 14%

2012-2013 School Improvement Plan (SIP)-Form SIP-1
August 2012
Rule 6A-1.099811
Revised April 29, 2011
28
students scoring
above achievement
level by 2%.
2.2. Diverse learning needs and
styles
2.2. Use of technology and visual
aids in instruction (smart slate,
elmo).
2.2. content area teacher 2.2. Progress Monitoring Tools,
Class Assessment
2.2. Algebra 1 EOC,
Performance Plus
2.3. Diverse needs and areas of individual weakness
2.3. Discovery Education progress monitoring program to detect and
monitor student weaknesses
2.3. Department Chair 2.3. Progress Monitoring Tools, Class Assessment
2.3. Algebra 1 EOC, Performance Plus

2012-2013 School Improvement Plan (SIP)-Form SIP-1
August 2012
Rule 6A-1.099811
Revised April 29, 2011
29
Based on ambitious but achievable Annual Measurable
Objectives (AMOs), identify reading and mathematics
performance target for the following years
2011-2012 2012-2013 2013-2014 2014-2015 2015-2016 2016-2017
3A. In six years,
school will reduce
their achievement
gap by 50%.
Baseline data 2010-2011
27%
25% 23% 21% 19% 17% 14%
Algebra 1 Goal #3A:
St. Augustine High will reduce their
achievement gap by at least 2% each year until
the year 2016 – 2017.
Based on the analysis of student achievement data and
reference to “Guiding Questions,” identify and define areas in need of improvement for the following subgroups:
Anticipated Barrier Strategy Person or Position
Responsible for Monitoring
Process Used to Determine
Effectiveness of Strategy
Evaluation Tool
3B. Student subgroups by ethnicity (White,
Black, Hispanic, Asian, American Indian) not
making satisfactory progress in Algebra 1.
3B.1. Large percentage of low achieving
subgroups. Not all subgroups are
making AYP.
Lack of confidence and motivation
3B.1. Yellow Jacket Sting Mentoring Program
3B.1. Administration/ Deans 3B.1. Classroom Assessment, mentor meetings, Progress
Monitoring Tools
3B.1. Algebra 1 EOC, Performance Plus
Algebra 1 Goal #3B:
St. Augustine High
will increase to the
benchmark of 92% in
math for each
subgroup.
2012 Current
Level of
Performance:*
2013 Expected
Level of
Performance:*
PENDING
STATE
PROVIDED
DATA
92% of
White &
Black
students will
make AYP. 3B.2. Large percentage of low
achieving subgroups. Not all
subgroups are making AYP.
Lack of confidence and motivation
3B.2. Intensive Math classes for
low achieving students to focus on
mastery of basic skills
3B.2. Department Chair 3B.2. Progress Monitoring
Tools, Class Assessment
3B.2. Algebra 1 EOC,
Performance Plus
3B.3. Large percentage of low
achieving subgroups. Not all subgroups are making AYP.
Lack of confidence and motivation
3B.3. Before/After school tutoring
and test prep program
3B.3. Department Chair 3B.3. Progress Monitoring
Tools, Class Assessment
3B.3. Algebra 1 EOC,
Performance Plus

2012-2013 School Improvement Plan (SIP)-Form SIP-1
August 2012
Rule 6A-1.099811
Revised April 29, 2011
30
Based on the analysis of student achievement data and
reference to “Guiding Questions,” identify and define
areas in need of improvement for the following subgroup:
Anticipated Barrier Strategy Person or Position
Responsible for Monitoring
Process Used to Determine
Effectiveness of Strategy
Evaluation Tool
3C. English Language Learners (ELL) not
making satisfactory progress in Algebra 1.
3C.1. Language 3C.1.Use of technology and visual aids in instruction (smart slate,
elmo).
3C.1. Department Chair 3C.1. Progress Monitoring Tools, Class Assessment
3C.1. Algebra 1 EOC, Performance Plus
Algebra 1 Goal #3C:
St. Augustine High
will increase to the
benchmark of 92% in
math for ELL.
2012 Current
Level of Performance:*
2013 Expected
Level of Performance:*
PENDING
STATE
PROVIDED
DATA
92% of ELL
will make
AYP. 3C.2. Language 3C.2. Focus on content area
vocabulary
3C.2. Department Chair, content
area teachers
3C.2. Progress Monitoring
Tools, Class Assessment
3C.2. Algebra 1 EOC,
Performance Plus
3C.3. Language 3C.3. Use of multilingual textbook resources
3C.3. Content Area Teachers 3C.3. Progress Monitoring Tools, Class Assessment
3C.3. Algebra 1 EOC, Performance Plus
Based on the analysis of student achievement data and
reference to “Guiding Questions,” identify and define areas in need of improvement for the following subgroup:
Anticipated Barrier Strategy Person or Position
Responsible for Monitoring
Process Used to Determine
Effectiveness of Strategy
Evaluation Tool
3D. Students with Disabilities (SWD) not
making satisfactory progress in Algebra 1.
3D.1. Diverse needs and learning
styles.
3D.1. Use of technology and visual
aids in instruction (smart slate,
elmo).
3D.1. Department Chair, Content
Area Teachers
3D.1. Progress Monitoring
Tools, Class Assessment
3D.1. Algebra 1 EOC,
Performance Plus
Algebra 1 Goal #3D:
St. Augustine High
will increase to the
benchmark of 92% in
math for SWD.
2012 Current Level of
Performance:*
2013 Expected Level of
Performance:*
PENDING
STATE
PROVIDED
DATA
92% of
SWD will
make AYP. 3D.2. Lack of confidence and
motivation
3D.2. Discovery Education
progress monitoring practice test
3D.2. Department Chair, Content
Area Teachers
3D.2. Progress Monitoring
Tools, Class Assessment
3D.2. Algebra 1 EOC,
Performance Plus
3D.3. Inability to master skills at
rate equal to peers
3D.3. Increased record tracking and
progress monitoring kept in a
portfolio
3D.3. Department Chair, Content
Area Teacher, ESE teachers
3D.3. Progress Monitoring
Tools, Class Assessment
3D.3. Algebra 1 EOC,
Performance Plus

2012-2013 School Improvement Plan (SIP)-Form SIP-1
August 2012
Rule 6A-1.099811
Revised April 29, 2011
31
Based on the analysis of student achievement data and
reference to “Guiding Questions,” identify and define
areas in need of improvement for the following subgroup:
Anticipated Barrier Strategy Person or Position
Responsible for Monitoring
Process Used to Determine
Effectiveness of Strategy
Evaluation Tool
3E. Economically Disadvantaged students not
making satisfactory progress in Algebra 1.
3E.1. Low motivation and support 3E.1. Most Valuable Jacket/Punctuality Pays
3E.1. Content Area Teachers, Deans
3E.1. Progress monitoring, conferencing
3E.1. Algebra 1 EOC, Performance Plus
Algebra 1 Goal #3E:
St. Augustine High
will increase to the
benchmark of 92% in
math for ED
students.
2012 Current
Level of Performance:*
2013 Expected
Level of Performance:*
PENDING
STATE
PROVIDED
DATA
92% of ED
students will
make AYP. 3E.2. Low motivation and support 3E.2. Enrollment in AVID Program 3E.2. AVID Instructor and Site
team
3E.2. Classroom assessment and
progress monitoring tools
3E.2 Algebra 1 EOC,
Performance Plus
3E.3. Low motivation and support 3E.3. After-school EOC prep/tutoring program
5E.3. Department Chair, Content Area Teachers
3E.3. Progress monitoring tools 3E.3. Algebra 1 EOC, Performance Plus
End of Algebra 1 EOC Goals
2012-2013 School Improvement Plan (SIP)-Form SIP-1
August 2012
Rule 6A-1.099811
Revised April 29, 2011
32
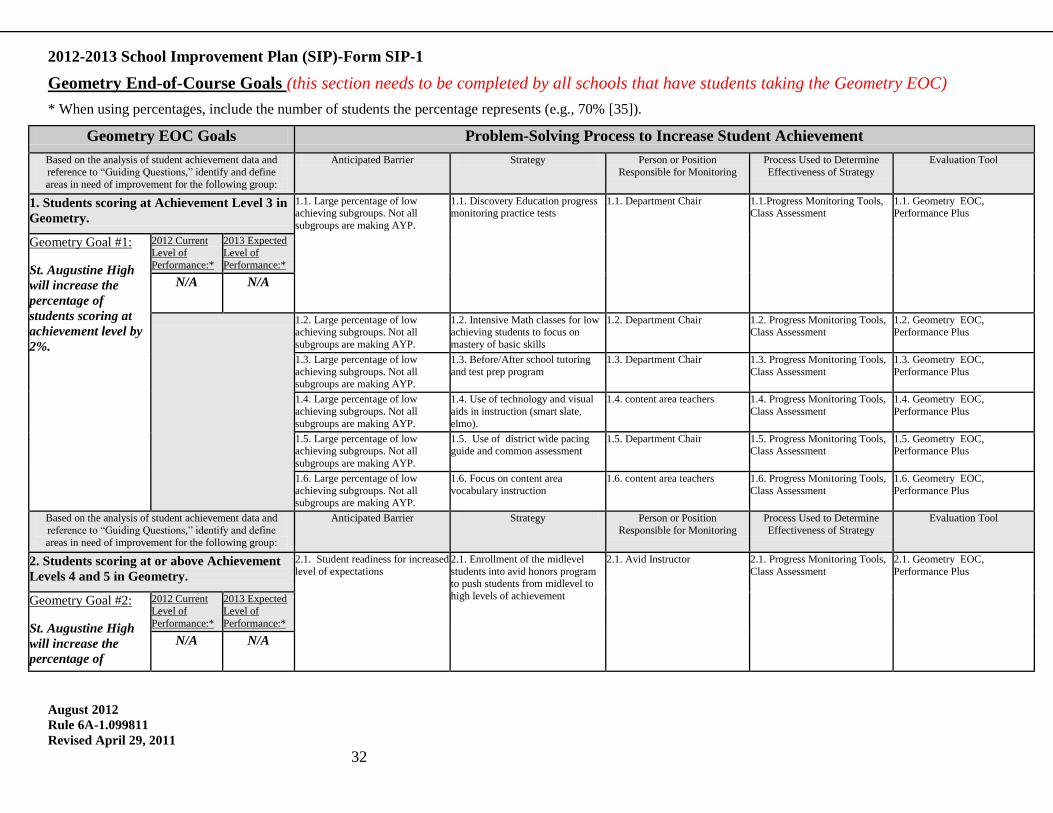
Geometry End-of-Course Goals (this section needs to be completed by all schools that have students taking the Geometry EOC)
* When using percentages, include the number of students the percentage represents (e.g., 70% [35]).
Geometry EOC Goals Problem-Solving Process to Increase Student Achievement
Based on the analysis of student achievement data and
reference to “Guiding Questions,” identify and define
areas in need of improvement for the following group:
Anticipated Barrier Strategy Person or Position
Responsible for Monitoring
Process Used to Determine
Effectiveness of Strategy
Evaluation Tool
1. Students scoring at Achievement Level 3 in
Geometry.
1.1. Large percentage of low achieving subgroups. Not all
subgroups are making AYP.
1.1. Discovery Education progress monitoring practice tests
1.1. Department Chair 1.1.Progress Monitoring Tools, Class Assessment
1.1. Geometry EOC, Performance Plus
Geometry Goal #1:
St. Augustine High
will increase the
percentage of
students scoring at
achievement level by
2%.
2012 Current
Level of
Performance:*
2013 Expected
Level of
Performance:*
N/A N/A
1.2. Large percentage of low achieving subgroups. Not all
subgroups are making AYP.
1.2. Intensive Math classes for low achieving students to focus on
mastery of basic skills
1.2. Department Chair 1.2. Progress Monitoring Tools, Class Assessment
1.2. Geometry EOC, Performance Plus
1.3. Large percentage of low
achieving subgroups. Not all subgroups are making AYP.
1.3. Before/After school tutoring
and test prep program
1.3. Department Chair 1.3. Progress Monitoring Tools,
Class Assessment
1.3. Geometry EOC,
Performance Plus
1.4. Large percentage of low
achieving subgroups. Not all
subgroups are making AYP.
1.4. Use of technology and visual
aids in instruction (smart slate,
elmo).
1.4. content area teachers 1.4. Progress Monitoring Tools,
Class Assessment
1.4. Geometry EOC,
Performance Plus
1.5. Large percentage of low achieving subgroups. Not all
subgroups are making AYP.
1.5. Use of district wide pacing guide and common assessment
1.5. Department Chair 1.5. Progress Monitoring Tools, Class Assessment
1.5. Geometry EOC, Performance Plus
1.6. Large percentage of low
achieving subgroups. Not all subgroups are making AYP.
1.6. Focus on content area
vocabulary instruction
1.6. content area teachers 1.6. Progress Monitoring Tools,
Class Assessment
1.6. Geometry EOC,
Performance Plus
Based on the analysis of student achievement data and
reference to “Guiding Questions,” identify and define
areas in need of improvement for the following group:
Anticipated Barrier Strategy Person or Position
Responsible for Monitoring
Process Used to Determine
Effectiveness of Strategy
Evaluation Tool
2. Students scoring at or above Achievement
Levels 4 and 5 in Geometry.
2.1. Student readiness for increased
level of expectations
2.1. Enrollment of the midlevel
students into avid honors program to push students from midlevel to
high levels of achievement
2.1. Avid Instructor 2.1. Progress Monitoring Tools,
Class Assessment
2.1. Geometry EOC,
Performance Plus
Geometry Goal #2:
St. Augustine High
will increase the
percentage of
2012 Current
Level of
Performance:*
2013 Expected
Level of
Performance:*
N/A N/A

2012-2013 School Improvement Plan (SIP)-Form SIP-1
August 2012
Rule 6A-1.099811
Revised April 29, 2011
33
students scoring
above achievement
level by 2%.
2.2. Diverse learning needs and
styles
2.2. Use of technology and visual
aids in instruction (smart slate,
elmo).
2.2. content area teacher 2.2. Progress Monitoring Tools,
Class Assessment
2.2. Geometry EOC,
Performance Plus
2.3. Diverse needs and areas of individual weakness
2.3. Discovery Education progress monitoring program to detect and
monitor student weaknesses
2.3. Department Chair 2.3. Progress Monitoring Tools, Class Assessment
2.3. Geometry EOC, Performance Plus

2012-2013 School Improvement Plan (SIP)-Form SIP-1
August 2012
Rule 6A-1.099811
Revised April 29, 2011
34
Based on ambitious but achievable Annual Measurable
Objectives (AMOs), identify reading and mathematics
performance target for the following years
2012-2013 2013-2014 2014-2015 2015-2016 2016-2017
3A. In six years,
school will reduce
their achievement
gap by 50%.
Baseline data 2011-2012
N/A
Geometry Goal #3A:
N/A
Based on the analysis of student achievement data and
reference to “Guiding Questions,” identify and define areas in need of improvement for the following subgroups:
Anticipated Barrier Strategy Person or Position
Responsible for Monitoring
Process Used to Determine
Effectiveness of Strategy
Evaluation Tool
3B. Student subgroups by ethnicity (White,
Black, Hispanic, Asian, American Indian) not
making satisfactory progress in Geometry.
3B.1. Large percentage of low achieving
subgroups. Not all subgroups are
making AYP.
3B.1. Yellow Jacket Sting Mentoring Program
3B.1. Administration/ Deans 3B.1. Classroom Assessment, mentor meetings, Progress
Monitoring Tools
3B.1. Geometry EOC, Performance Plus
Geometry Goal #3B:
St. Augustine High
will increase to the
benchmark of 92% in
math for each
subgroup.
2012 Current
Level of
Performance:*
2013 Expected
Level of
Performance:*
N/A 92% of
White &
Black
students will
make AYP
3B.2. Large percentage of low
achieving subgroups. Not all
subgroups are making AYP.
3B.2. Intensive Math classes for
low achieving students to focus on
mastery of basic skills
3B.2. Department Chair 3B.2. Progress Monitoring
Tools, Class Assessment
3B.2. Geometry EOC,
Performance Plus
3B.3. Large percentage of low achieving subgroups. Not all
subgroups are making AYP.
3B.3. Before/After school tutoring and test prep program
3B.3. Department Chair 3B.3. Progress Monitoring Tools, Class Assessment
3B.3. Geometry EOC, Performance Plus

2012-2013 School Improvement Plan (SIP)-Form SIP-1
August 2012
Rule 6A-1.099811
Revised April 29, 2011
35
Based on the analysis of student achievement data and
reference to “Guiding Questions,” identify and define
areas in need of improvement for the following subgroup:
Anticipated Barrier Strategy Person or Position
Responsible for Monitoring
Process Used to Determine
Effectiveness of Strategy
Evaluation Tool
3C. English Language Learners (ELL) not
making satisfactory progress in Geometry.
3C.1. Language 3C.1.Use of technology and visual aids in instruction (smart slate,
elmo).
3C.1. Department Chair 3C.1. Progress Monitoring Tools, Class Assessment
3C.1. Geometry EOC, Performance Plus
Geometry Goal #3C:
St. Augustine High
will increase to the
benchmark of 92% in
math for ELL.
2012 Current
Level of Performance:*
2013 Expected
Level of Performance:*
N/A 92% of ELL
will make
AYP. 3C.2. Language 3C.2. Focus on content area
vocabulary
3C.2. Department Chair, content
area teachers
3C.2. Progress Monitoring
Tools, Class Assessment
3C.2. Geometry EOC,
Performance Plus
3C.3. Language 3C.3. Use of multilingual textbook resources
3C.3. Content Area Teachers 3C.3. Progress Monitoring Tools, Class Assessment
3C.3. Geometry EOC, Performance Plus
Based on the analysis of student achievement data and
reference to “Guiding Questions,” identify and define areas in need of improvement for the following subgroup:
Anticipated Barrier Strategy Person or Position
Responsible for Monitoring
Process Used to Determine
Effectiveness of Strategy
Evaluation Tool
3D. Students with Disabilities (SWD) not
making satisfactory progress in Geometry.
3D.1. Diverse needs and learning
styles.
3D.1. Use of technology and visual
aids in instruction (smart slate,
elmo).
3D.1. Department Chair, Content
Area Teachers
3D.1. Progress Monitoring
Tools, Class Assessment
3D.1. Geometry EOC,
Performance Plus
Geometry Goal #3D:
St. Augustine High
will increase to the
benchmark of 92% in
math for SWD.
2012 Current Level of
Performance:*
2013 Expected Level of
Performance:*
N/A 92% of
SWD will
make AYP
3D.2. Lack of confidence and
motivation
3D.2. Discovery Education
progress monitoring practice test
3D.2. Department Chair, Content
Area Teachers
3D.2. Progress Monitoring
Tools, Class Assessment
3D.2. Geometry EOC,
Performance Plus
3D.3. Inability to master skills at
rate equal to peers
3D.3. Increased record tracking and
progress monitoring kept in a
portfolio
3D.3. Department Chair, Content
Area Teacher, ESE teachers
3D.3. Progress Monitoring
Tools, Class Assessment
3D.3. Geometry EOC,
Performance Plus

2012-2013 School Improvement Plan (SIP)-Form SIP-1
August 2012
Rule 6A-1.099811
Revised April 29, 2011
36
Based on the analysis of student achievement data and
reference to “Guiding Questions,” identify and define
areas in need of improvement for the following subgroup:
Anticipated Barrier Strategy Person or Position
Responsible for Monitoring
Process Used to Determine
Effectiveness of Strategy
Evaluation Tool
3E. Economically Disadvantaged students not
making satisfactory progress in Geometry.
3E.1. Low motivation and support 3E.1. Most Valuable Jacket/Punctuality Pays
3E.1. Content Area Teachers, Deans
3E.1. Progress monitoring, conferencing
3E.1. Geometry EOC, Performance Plus
Geometry Goal #3E:
St. Augustine High
will increase to the
benchmark of 92% in
math for ED
students.
2012 Current
Level of Performance:*
2013 Expected
Level of Performance:*
N/A 92% of ED
students will
make AY. 3E.2. Low motivation and support 3E.2. Enrollment in AVID Program 3E.2. AVID Instructor and Site
team
3E.2. Classroom assessment and
progress monitoring tools
3E.2 Geometry EOC,
Performance Plus
3E.3. Low motivation and support 3E.3. After-school EOC prep/tutoring program
3E.3. Department Chair, Content Area Teachers
3E.3. Progress monitoring tools 3E.3. Geometry EOC, Performance Plus
End of Geometry EOC Goals
Mathematics Professional Development
Professional Development (PD) aligned with Strategies through Professional Learning Community (PLC) or PD Activities Please note that each strategy does not require a professional development or PLC activity.
PD Content/Topic
and/or PLC Focus
Grade Level/
Subject
PD Facilitator
and/or
PLC Leader
PD Participants
(e.g., PLC, subject, grade level,
or school-wide)
Target Dates (e.g., early release)
and Schedules (e.g., frequency of
meetings)
Strategy for Follow-up/Monitoring Person or Position Responsible
for Monitoring
FCTM Conference ALL grade levels
(math)
Conference
Speakers Math Department Chair Fall 2012 Department PLC Administration, Department Chair

2012-2013 School Improvement Plan (SIP)-Form SIP-1
August 2012
Rule 6A-1.099811
Revised April 29, 2011
37
Mathematics Budget (Insert rows as needed)
Include only school-based funded activities/materials and exclude district funded activities /materials.
Evidence-based Program(s)/Materials(s)
Strategy Description of Resources Funding Source Amount
Subtotal: $0.00
Technology
Strategy Description of Resources Funding Source Amount
Tools for math students working
advanced problems Calculators School Based Budget $2,500.00
Subtotal: $2,500.00
Professional Development
Strategy Description of Resources Funding Source Amount
Math Literacy FCTM Conference School Based Budget $1,000.00
AVID teacher training Teacher workshops School Based Budget $1,500.00
Subtotal: $2,500.00
Other
Strategy Description of Resources Funding Source Amount
Identify and provide additional assistance
for Black, Economically Disadvantaged,
and SWD subgroups to ensure AYP.
Before/After school FCAT/EOC prep and
tutoring program
Pending Grant Approval $2,500.00
Subtotal: $2,500.00
Total: $7,500.00
End of Mathematics Goals

2012-2013 School Improvement Plan (SIP)-Form SIP-1
August 2012
Rule 6A-1.099811
Revised April 29, 2011
38
Florida Alternate Assessment High School Science Goals
* When using percentages, include the number of students the percentage represents (e.g., 70% [35]).
High School Science Goals Problem-Solving Process to Increase Student Achievement
Based on the analysis of student achievement data and
reference to “Guiding Questions,” identify and define
areas in need of improvement for the following group:
Anticipated Barrier Strategy Person or Position
Responsible for Monitoring
Process Used to Determine
Effectiveness of Strategy
Evaluation Tool
1. Florida Alternate Assessment: Students
scoring at Levels 4, 5, and 6 in science.
1.1 Lack of student interest/ motivation during actual testing
period
1.1 Practice for alternative assessment using curriculum with
similar presentation
1.1 I.D. / Self - contained team 1.1 Classroom Assessments, Interest Driven materials, real
world application
1.1 Florida Alternate
Assessment
Science Goal #1:
St. Augustine High
will increase the
percentage of
students scoring at
levels 4, 5, and 6 in
science by 2%
2012 Current
Level of Performance:*
2013 Expected
Level of Performance:*
Enter numerical
data for current
level of
performance in
this box.
Enter numerical
data for expected
level of
performance in
this box.
1.2. 1.2. 1.2. 1.2. 1.2.
1.3. 1.3. 1.3. 1.3. 1.3.
Based on the analysis of student achievement data, and reference to “Guiding Questions”, identify and define
areas in need of improvement for the following group:
Anticipated Barrier Strategy Person or Position Responsible for Monitoring
Process Used to Determine Effectiveness of Strategy
Evaluation Tool
2. Florida Alternate Assessment: Students
scoring at or above Level 7 in science.
2.1 Lack of student interest/
motivation during actual testing
period
2.1 Practice for alternative
assessment using curriculum with
similar presentation
2.1 I.D. / Self - contained team
2.1 Classroom Assessments,
Interest Driven materials, real
world application
2.1 Florida Alternate Assessment
Science Goal #2:
St. Augustine High
will increase the
percentage of
students scoring at
level 7 in science by
2%
2012 Current Level of
Performance:*
2013Expected Level of
Performance:*
Enter numerical
data for current
level of
performance in
this box.
Enter numerical
data for expected
level of
performance in
this box.
2.2. 2.2. 2.2. 2.2. 2.2.
2.3. 2.3. 2.3. 2.3. 2.3.

2012-2013 School Improvement Plan (SIP)-Form SIP-1
August 2012
Rule 6A-1.099811
Revised April 29, 2011
39
End of Florida Alternate Assessment High School Science Goals
Biology 1 End-of-Course (EOC) Goals (this section needs to be completed by all schools that have students taking the Biology I EOC)
* When using percentages, include the number of students the percentage represents (e.g., 70% [35]).
Biology 1 EOC Goals Problem-Solving Process to Increase Student Achievement
Based on the analysis of student achievement data and
reference to “Guiding Questions,” identify and define
areas in need of improvement for the following group:
Anticipated Barrier Strategy Person or Position
Responsible for Monitoring
Process Used to Determine
Effectiveness of Strategy
Evaluation Tool
1. Students scoring at Achievement Level 3 in
Biology 1.
1.1. Large percentage of low achieving subgroups. Not all
subgroups are making AYP.
1.1. Discovery Education progress monitoring practice
tests.
1.1. Department Chair 1.1. Progress Monitoring tools, Class assessment
1.1. Biology EOC, Performance Plus
Biology 1 Goal #1:
St. Augustine High will increase the percentage of
students scoring at
achievement level by 2%
2012 Current
Level of Performance:*
2013 Expected
Level of Performance:*
N/A N/A
1.2. Large percentage of low achieving subgroups. Not all
subgroups are making AYP.
1.2. Science Fair Project for scientific method
mastery and experimentation.
1.2. Department Chair 1.2. Progress Monitoring tools, Class assessment
1.2. Biology EOC, Performance Plus
1.3. Large percentage of low
achieving subgroups with high percentage of missing assignments
and absences
1.3. Work with learning strategies
teachers to provide lesson enhancement activities and make-
up assignments.
1.3. PLC Leaders , Content Area
Teachers
1.3. Formative and summative
assessments, lack of missing assignments
1.3. Biology EOC, Performance
Plus
1.4. Large percentage of low
achieving subgroups that are struggling readers
1.4. Differentiated instruction with
scaffolding using multi-leveled text
1.4. Department Chair, PLC
Leaders
1.4. Progress monitoring 1.4. Biology EOC, Performance
Plus
Based on the analysis of student achievement data and
reference to “Guiding Questions,” identify and define
areas in need of improvement for the following group:
Anticipated Barrier Strategy Person or Position
Responsible for Monitoring
Process Used to Determine
Effectiveness of Strategy
Evaluation Tool
2. Students scoring at or above Achievement
Levels 4 and 5 in Biology 1.
2.1. Student readiness for increased
level of expectations
2.1. Enrollment of the midlevel
students into avid honors program to push students from midlevel to
high levels of achievement.
2.1. Avid Instructor 2.1. Progress Monitoring Tools,
Class Assessment
2.1. Biology EOC, Performance
Plus
Biology 1 Goal #2:
St. Augustine High will increase the percentage of
students scoring above
achievement level by 2%
2012 Current
Level of
Performance:*
2013 Expected
Level of
Performance:*
N/A N/A
2.2. Diverse learning needs and
styles
2.2. Use of technology and visual
aids in instruction (smart slate, elmo).
2.2. content area teacher 2.2. Progress Monitoring Tools,
Class Assessment
2.2. Biology EOC, Performance
Plus
2.3. Time to incorporate higher-
level thinking and inquiry activities.
2.3. Re-design labs to be more
inquiry-based.
2.3. PLC Leader 2.3. Class assessment 2.3. Biology EOC, Performance
Plus

2012-2013 School Improvement Plan (SIP)-Form SIP-1
August 2012
Rule 6A-1.099811
Revised April 29, 2011
40
2.4. Access to technology in the
classroom to promote
inquiry/collaboration-based activities to increase rigor of
research
2.4. Provide dedicated computer
cart to Science Hall, share among
teachers for inquiry/collaboration-based activities.
2.4. Department Chair 2.4. Scores of research paper
graded by Science Department
research rubric
2.4. Biology EOC, Performance
Plus
2.5. Time to incorporate higher-
level thinking and inquiry activities.
2.5. Flip the classroom, requiring
students to complete initial reading of content as homework.
2.5. PLC Leader, Content Area
Teachers
2.5. Lab, essay, activity rubrics,
formative and summative assessments
2.5. Biology EOC,
Performance Plus
End of Biology 1 EOC Goals

2012-2013 School Improvement Plan (SIP)-Form SIP-1
August 2012
Rule 6A-1.099811
Revised April 29, 2011
41
Science Professional Development
Professional Development (PD) aligned with Strategies through Professional Learning Community (PLC) or PD Activity Please note that each Strategy does not require a professional development or PLC activity.
PD Content /Topic and/or PLC Focus
Grade
Level/Subject
PD Facilitator and/or
PLC Leader
PD Participants (e.g. , PLC, subject, grade level, or
school-wide)
Target Dates (e.g. , Early Release) and Schedules (e.g.,
frequency of meetings)
Strategy for Follow-up/Monitoring Person or Position Responsible for
Monitoring
Science Conference Biology teachers
Conference Speakers
Science Department Chair Fall 2012 Department PLC Administration/ Department
Chair
Science Budget (Insert rows as needed) Include only school-based funded activities/materials and exclude district funded activities/materials.
Evidence-based Program(s)/Materials(s)
Strategy Description of Resources Funding Source Amount
Subtotal:
Technology
Strategy Description of Resources Funding Source Amount
Subtotal:
Professional Development
Strategy Description of Resources Funding Source Amount
AVID teacher training Teacher workshops School Based Budget $1,500.00
Subtotal: $1,500.00
Other
Strategy Description of Resources Funding Source Amount
Identify and provide additional assistance
for Black, Economically Disadvantaged,
and SWD subgroups to ensure AYP.
Before/After school FCAT/EOC prep and
tutoring program
Pending Grant Approval $2,500.00
Subtotal: $2,500.00

2012-2013 School Improvement Plan (SIP)-Form SIP-1
August 2012
Rule 6A-1.099811
Revised April 29, 2011
42
Total: $4,000.00
End of Science Goals

2012-2013 School Improvement Plan (SIP)-Form SIP-1
August 2012
Rule 6A-1.099811
Revised April 29, 2011
43
Writing Goals
* When using percentages, include the number of students the percentage represents (e.g., 70% [35]).
Writing Goals Problem-Solving Process to Increase Student Achievement
Based on the analysis of student achievement data and
reference to “Guiding Questions,” identify and define areas in
need of improvement for the following group:
Anticipated Barrier Strategy Person or Position
Responsible for Monitoring
Process Used to Determine
Effectiveness of Strategy
Evaluation Tool
1A. FCAT: Students scoring at Achievement
Level 3.0 and higher in writing.
1A.1. Encouraging writing across the curriculum and the use of ethics
in writing
1A.1. Collaborative SuCCeSS teams
1A.1. All teachers 1A.1. School-wide prompts/classes
1A.1. Teacher graded essays/Lesson Plans
Writing Goal #1A:
St. Augustine High
will increase the
percentage of students
scoring level and
higher in writing by
2%.
2012 Current
Level of
Performance:*
2013 Expected
Level of
Performance:*
84% (340) 86%
1A.2. Encouraging writing across the curriculum and the use of ethics
in writing .
1A.2. Implementation of 6 Traits of Writing (English), Collaborative
SuCCeSS Teams.
1A.2. Literacy Coach/English teachers/Content Area teachers.
1A.2. Writing Prompts 1A.2. Teacher formative assessments
1A.3. Encouraging writing across
the curriculum and the use of ethics in writing.
1A.3. Holistic essay grading(with
collaborative workshop)
1A.3. Literacy Coach and
English teachers
1A.3. Classroom assessment 1A.3. Teacher graded essays
1A.4. Encouraging all students to
engage in writing. 1A.4. Implement writing/reflection
journals in all standard classes
using higher level questioning
1A.4. Dept. Chair 1A.4. Journal checks at least
once a quarter. (Science)
1A.4. Quality of journals
1A.5. Encouraging higher level thinking in content areas to give
students confidence in their ability
to respond to essays in content areas.
1A.5. Enhance assessments with short answer and essay style
questions.
1A.5. PLC Leaders, classroom teachers
1A.5 Progress monitoring and assessment scores
1A.5 Teacher and district summative assessments
1A.6. Encouraging struggling
readers (and writers) to use re-read
and other deep-reading strategies.
1A.6. Give students access to
different leveled texts to scaffold
understanding of difficult concepts.
1A.6. PLC Leaders, Classroom
teachers
1A.6. Formative assessments 1A.6. Teacher and district
summative assessments
1A.7. Using content area vocabulary in writing.
1A.7. Weekly journals requiring the use of content area vocabulary in
entry
1A.7. Content area teachers 1A.7. Regular journal checks 1A.7. Chapter/unit assessments; Florida Writes!
1A.8. Lack of critical thinking
ability.
1A.8. Collaborative writing
assignments using student strengths to support weaknesses
1A.8. Content area teachers 1A.8. Teacher evaluation of
writing assignments
1A.8. Chapter/Unit assessment;
Florida Writes!
Organizing thoughts Utilize graphic organizers to model concept connections
Content area teachers . Teacher evaluation of assignments
Chapter/unit assessments; Florida Writes!

2012-2013 School Improvement Plan (SIP)-Form SIP-1
August 2012
Rule 6A-1.099811
Revised April 29, 2011
44
1B. Florida Alternate Assessment: Students
scoring at 4 or higher in writing.
1B.1 Lack of student interest/ motivation during actual testing
period
1B.1 Practice for alternative assessment using curriculum with
similar presentation
1B.1 I.D. / Self - contained team 1B.1 Classroom Assessments, Interest Driven materials, real
world application
1B.1 Florida Alternate
Assessment
Writing Goal #1B:
St. Augustine High will
increase the percentage of students scoring at 4 or
higher by 2%.
2012 Current Level of
Performance:*
2013 Expected Level of
Performance:*
60% (3) 62%
1B.2. 1B.2. 1B.2. 1B.2. 1B.2.
1B.3. 1B.3. 1B.3. 1B.3. 1B.3.

2012-2013 School Improvement Plan (SIP)-Form SIP-1
August 2012
Rule 6A-1.099811
Revised April 29, 2011
45
Writing Professional Development
Professional Development (PD) aligned with Strategies through Professional Learning Community (PLC) or PD Activity Please note that each Strategy does not require a professional development or PLC activity.
PD Content /Topic and/or PLC Focus
Grade
Level/Subject
PD Facilitator and/or
PLC Leader
PD Participants (e.g. , PLC, subject, grade level, or
school-wide)
Target Dates (e.g. , Early Release) and Schedules (e.g.,
frequency of meetings)
Strategy for Follow-up/Monitoring Person or Position Responsible for
Monitoring
Writing Budget (Insert rows as needed)
Include only school-based funded activities/materials and exclude district funded activities/materials.
Evidence-based Program(s)/Materials(s)
Strategy Description of Resources Funding Source Amount
Subtotal:
Technology
Strategy Description of Resources Funding Source Amount
Subtotal:
Professional Development
Strategy Description of Resources Funding Source Amount
The Writers workshop Substitute SAC $115.00
Holistic Grading Train teachers for grading Florida Writes
papers
CRP $1,500.00
Subtotal: $1,615.00
Other
Strategy Description of Resources Funding Source Amount
Subtotal:
Total: $1,615.00

2012-2013 School Improvement Plan (SIP)-Form SIP-1
August 2012
Rule 6A-1.099811
Revised April 29, 2011
46
End of Writing Goals

2012-2013 School Improvement Plan (SIP)-Form SIP-1
August 2012
Rule 6A-1.099811
Revised April 29, 2011
47
U.S. History End-of-Course (EOC) Goals (required in year 2013-2014)
* When using percentages, include the number of students the percentage represents (e.g., 70% [35]).
U.S. History EOC Goals Problem-Solving Process to Increase Student Achievement
Based on the analysis of student achievement data and
reference to “Guiding Questions,” identify and define
areas in need of improvement for the following group:
Anticipated Barrier Strategy Person or Position
Responsible for Monitoring
Process Used to Determine
Effectiveness of Strategy
Evaluation Tool
1. Students scoring at Achievement Level 3 in
U.S. History.
1.1. Comprehending complex text 1.1. Identified WICOR strategies 1.1. content area teacher 1.1. Teacher evaluation of assignments utilizing WICOR
strategies
1.1. American History EOC
U.S. History Goal #1:
Enter narrative for the
goal in this box.
2012 Current
Level of Performance:*
2013 Expected
Level of Performance:*
N/A N/A
1.2. Analyzing primary source documents
1.2. APPARTS: Author, Place & Time, Prior knowledge, Audience,
Reason, The Main Idea,
Significance
1.2. content area teacher 1.2. Teacher evaluation of assignments utilizing APPARTS
strategy
1.2. American History EOC
1.3. Defining content area vocabulary
1.3. Word walls, direct instruction of content area vocabulary
1.3. content area teacher 1.3. Vocabulary quiz or review 1.3. American History EOC
Based on the analysis of student achievement data and
reference to “Guiding Questions,” identify and define areas in need of improvement for the following group:
Anticipated Barrier Strategy Person or Position
Responsible for Monitoring
Process Used to Determine
Effectiveness of Strategy
Evaluation Tool
2. Students scoring at or above Achievement
Levels 4 and 5 in U.S. History.
2.1. Student readiness for increased
level of expectations
2.1. Enrollment of the midlevel
students into avid honors program
to push students from midlevel to high levels of achievement
2.1. Avid Instructor 2.1. Progress Monitoring Tools,
Class Assessment
2.1. American History EOC,
Performance Plus
U.S. History Goal #2:
Enter narrative for the
goal in this box.
2012 Current Level of
Performance:*
2013 Expected Level of
Performance:*
N/A N/A
2.2. Diverse learning needs and
styles
2.2. Use of technology and visual
aids in instruction (smart slate,
elmo).
2.2. content area teacher 2.2. Progress Monitoring Tools,
Class Assessment
2.2. American History EOC,
Performance Plus
2.3. 2.3. 2.3. 2.3. 2.3.

2012-2013 School Improvement Plan (SIP)-Form SIP-1
August 2012
Rule 6A-1.099811
Revised April 29, 2011
48
U.S. History Professional Development
Professional Development (PD) aligned with Strategies through Professional Learning Community (PLC) or PD Activity Please note that each Strategy does not require a professional development or PLC activity.
PD Content /Topic
and/or PLC Focus
Grade
Level/Subject
PD Facilitator
and/or PLC Leader
PD Participants
(e.g. , PLC, subject, grade level, or school-wide)
Target Dates (e.g. , Early
Release) and Schedules (e.g., frequency of meetings)
Strategy for Follow-up/Monitoring Person or Position Responsible for
Monitoring
U.S. History Budget (Insert rows as needed)
Include only school-based funded activities/materials and exclude district funded activities /materials.
Evidence-based Program(s)/Materials(s)
Strategy Description of Resources Funding Source Amount
Subtotal:
Technology
Strategy Description of Resources Funding Source Amount
Subtotal:
Professional Development
Strategy Description of Resources Funding Source Amount
AVID teacher training Teacher workshops School Based Budget $1,500.00
Subtotal: $1,500.00
Other
Strategy Description of Resources Funding Source Amount
Identify and provide additional assistance
for Black, Economically Disadvantaged,
and SWD subgroups to ensure AYP.
Before/After school FCAT/EOC prep and
tutoring program
Pending Grant Approval $2,500.00
Subtotal: $4,000.00

2012-2013 School Improvement Plan (SIP)-Form SIP-1
August 2012
Rule 6A-1.099811
Revised April 29, 2011
49
Total: $3,500.00
End of U.S. History Goals
Attendance Goal(s)
* When using percentages, include the number of students the percentage represents (e.g., 70% [35]).
Attendance Goal(s) Problem-solving Process to Increase Attendance
Based on the analysis of attendance data and reference to “Guiding Questions,” identify and define areas in need of
improvement:
Anticipated Barrier Strategy Person or Position Responsible for Monitoring
Process Used to Determine Effectiveness of Strategy
Evaluation Tool
1. Attendance 1.1. Large population of at risk
students
1.1. Yellow Jacket Sting Operation
to mentor at risk students
1.1. Administration, Deans 1.1. Attendance data 1.1. Attendance data comparison
between 11-12 and 12-13
Attendance Goal #1:
St. Augustine High
will increase the
attendance rate by
2% and decrease the
amount of excessive
absences/tardies by
5%.
2012 Current
Attendance
Rate:*
2013 Expected
Attendance
Rate:*
91% 93% 2012 Current
Number of Students with
Excessive
Absences (10 or more)
2013 Expected
Number of Students with
Excessive
Absences (10 or more)
1152 1092
2012 Current
Number of Students with
Excessive
Tardies (10 or more)
2013 Expected
Number of Students with
Excessive
Tardies (10 or more)
89 84
1.2. Large population of at risk
students
1.2. Monthly Most Valuable Jacket
Award
1.2. Deans 1.2. Attendance Data 1.2. Quarterly Attendance
reports
1.3. Large population of at risk
students
1.3. Punctuality Pays 1.3. Teachers 1.3. Attendance Data 1.3. Attendance Data

2012-2013 School Improvement Plan (SIP)-Form SIP-1
August 2012
Rule 6A-1.099811
Revised April 29, 2011
50
Attendance Professional Development
Professional Development (PD) aligned with Strategies through Professional Learning Community (PLC) or PD Activity Please note that each Strategy does not require a professional development or PLC activity.
PD Content /Topic and/or PLC Focus
Grade
Level/Subject
PD Facilitator and/or
PLC Leader
PD Participants (e.g. , PLC, subject, grade level, or
school-wide)
Target Dates (e.g. , Early Release) and Schedules (e.g.,
frequency of meetings)
Strategy for Follow-up/Monitoring Person or Position Responsible for
Monitoring
Attendance Budget (Insert rows as needed)
Include only school-based funded activities/materials and exclude district funded activities /materials.
Evidence-based Program(s)/Materials(s)
Strategy Description of Resources Funding Source Amount
Subtotal:
Technology
Strategy Description of Resources Funding Source Amount
Subtotal:
Professional Development
Strategy Description of Resources Funding Source Amount
Subtotal:
Other
Strategy Description of Resources Funding Source Amount
Punctuality Pays Teacher Mentoring Administrative $1,000.00
Subtotal: $1,000.00
Total: $1,000.00
End of Attendance Goals

2012-2013 School Improvement Plan (SIP)-Form SIP-1
August 2012
Rule 6A-1.099811
Revised April 29, 2011
51
Suspension Goal(s)
* When using percentages, include the number of students the percentage represents next to the percentage (e.g. 70% (35)).
Suspension Goal(s) Problem-solving Process to Decrease Suspension
Based on the analysis of suspension data, and reference to “Guiding Questions,” identify and define areas in need of improvement:
Anticipated Barrier Strategy Person or Position Responsible for
Monitoring
Process Used to Determine Effectiveness of
Strategy
Evaluation Tool
1. Suspension
1.1. Student and teacher
participation
1.1. Character Counts Initiative,
Sting Mentor Program
1.1. Administration,
Deans, Teachers
1.1. Suspension Data 1.1. 11-12/12-13 comparison
Suspension Goal #1:
St. Augustine High
School will decrease the
number of suspensions by
5%.
2012 Total Number of In –School
Suspensions
2013 Expected Number of
In- School
Suspensions
156
140
2012 Total Number of Students
Suspended
In-School
2013 Expected Number of Students
Suspended
In -School
129 122 2012 Total
Number of Out-of-School Suspensions
2013 Expected
Number of Out-of-School
Suspensions
571 542 2012 Total Number
of Students Suspended
Out- of- School
2013 Expected
Number of Students Suspended
Out- of-School
322 306 1.2. Student and teacher
participation
1.2. Capturing Kids’ Hearts 1.2 Administration,
Deans, Teachers.
1.2. Suspension Data 1.2. 11-12/12-13 comparison
1.3 Student classroom
attendance 1.3 Saturday School, Wednesday Detention
1.3 Administration, Deans
1.3 Suspension Data 1.3 11-12/12-13 comparison
1.4 Student and teacher
participation
1.4 Character Counts Initiative,
Sting Mentor Program
1.4 Administration,
Deans, Teachers
1.4 Suspension Data 1.4 11-12/12-13 comparison
1.5 Student and teacher
participation 1.5 Capturing Kids’ Hearts 1.5 Administration,
Deans, Teachers 1.5 Suspension Data 1.5 11-12/12-13 comparison
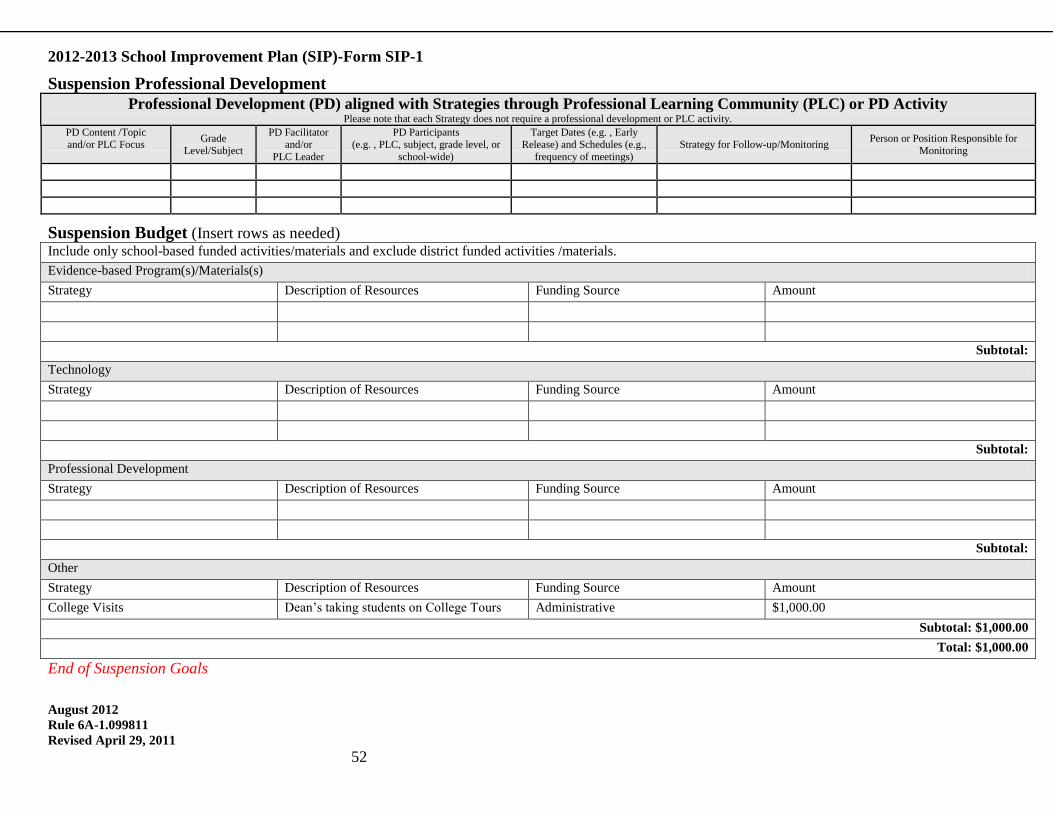
2012-2013 School Improvement Plan (SIP)-Form SIP-1
August 2012
Rule 6A-1.099811
Revised April 29, 2011
52
Suspension Professional Development
Professional Development (PD) aligned with Strategies through Professional Learning Community (PLC) or PD Activity Please note that each Strategy does not require a professional development or PLC activity.
PD Content /Topic and/or PLC Focus
Grade
Level/Subject
PD Facilitator and/or
PLC Leader
PD Participants (e.g. , PLC, subject, grade level, or
school-wide)
Target Dates (e.g. , Early Release) and Schedules (e.g.,
frequency of meetings)
Strategy for Follow-up/Monitoring Person or Position Responsible for
Monitoring
Suspension Budget (Insert rows as needed) Include only school-based funded activities/materials and exclude district funded activities /materials.
Evidence-based Program(s)/Materials(s)
Strategy Description of Resources Funding Source Amount
Subtotal:
Technology
Strategy Description of Resources Funding Source Amount
Subtotal:
Professional Development
Strategy Description of Resources Funding Source Amount
Subtotal:
Other
Strategy Description of Resources Funding Source Amount
College Visits Dean’s taking students on College Tours Administrative $1,000.00
Subtotal: $1,000.00
Total: $1,000.00
End of Suspension Goals

2012-2013 School Improvement Plan (SIP)-Form SIP-1
August 2012
Rule 6A-1.099811
Revised April 29, 2011
53
Dropout Prevention Goal(s) Note: Required for High School- F.S., Sec. 1003.53
* When using percentages, include the number of students the percentage represents next to the percentage (e.g. 70% (35)).
Dropout Prevention Professional Development
Professional Development (PD) aligned with Strategies through Professional Learning Community (PLC) or PD Activity Please note that each Strategy does not require a professional development or PLC activity.
PD Content /Topic
and/or PLC Focus
Grade Level/Subject
PD Facilitator
and/or
PLC Leader
PD Participants
(e.g. , PLC, subject, grade level, or
school-wide)
Target Dates (e.g. , Early
Release) and Schedules (e.g.,
frequency of meetings)
Strategy for Follow-up/Monitoring Person or Position Responsible for
Monitoring
Dropout Prevention Goal(s) Problem-solving Process to Dropout Prevention
Based on the analysis of parent involvement data, and reference to
“Guiding Questions,” identify and define areas in need of
improvement:
Anticipated Barrier Strategy Person or Position
Responsible for
Monitoring
Process Used to Determine
Effectiveness of
Strategy
Evaluation Tool
1. Dropout Prevention 1.1. Large population of at risk students
1.1. Sting Operation to mentor at risk students, Leadership
Workshops
1.1. Administration, Deans
1.1. Attendance Data 1.1. 11-12/12-13 comparison
Dropout Prevention
Goal #1:
St. Augustine High
School will decrease
the percentage of drop
out students.
2012 Current
Dropout Rate:*
2013 Expected
Dropout Rate:*
1.3% 1% 2012 Current
Graduation Rate:*
2013 Expected
Graduation Rate:*
90% 92% 1.2. Large population of
students needing credit recovery
1.2. Credit recovery to offer
students the ability to get back to grade level
1.2. Credit recovery
teacher
1.2. Class passing rates 1.2. PLATO lab
1.3 Locating truant students 1.3 Home visits 1.3 Administration,
Deans
1.3 Attendance Data 1.3 11-12/12-13 comparison
1.4 Students are unfamiliar with higher education
opportunities
1.4 College campus visits and Dress for Success Days
1.4 Administration, Academy teachers,
Career Coordinator
1.4 College application numbers 1.4 Student Services Data
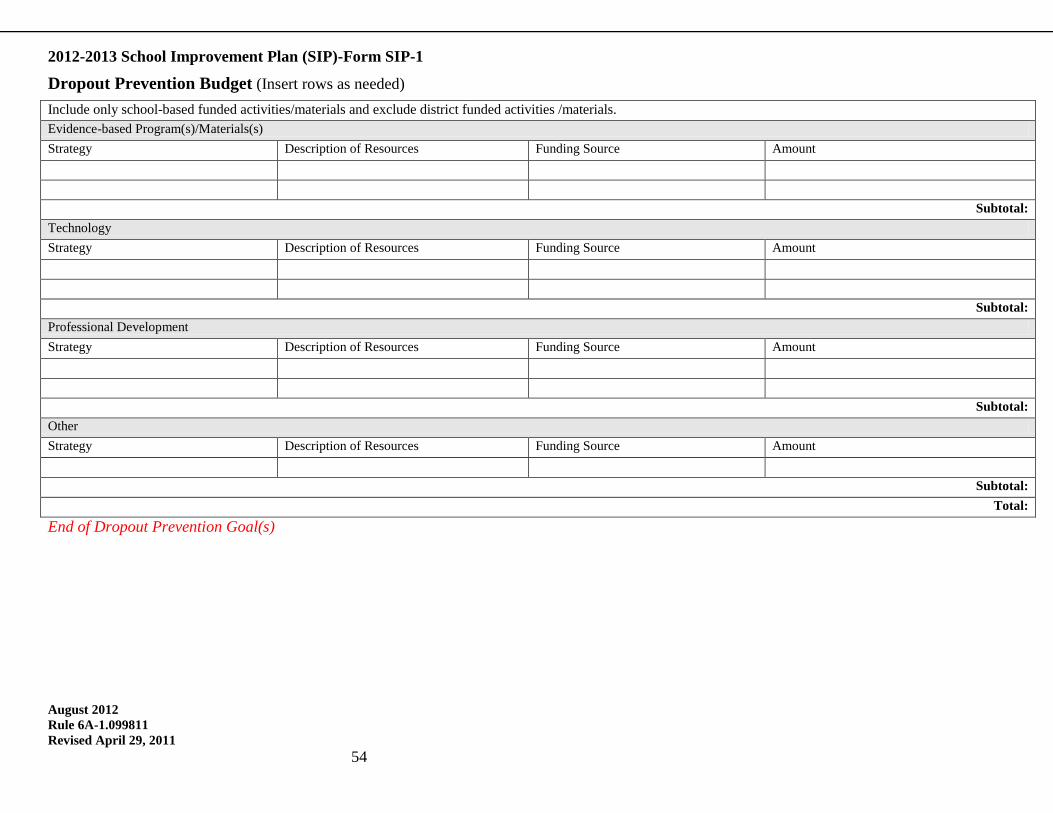
2012-2013 School Improvement Plan (SIP)-Form SIP-1
August 2012
Rule 6A-1.099811
Revised April 29, 2011
54
Dropout Prevention Budget (Insert rows as needed)
Include only school-based funded activities/materials and exclude district funded activities /materials.
Evidence-based Program(s)/Materials(s)
Strategy Description of Resources Funding Source Amount
Subtotal:
Technology
Strategy Description of Resources Funding Source Amount
Subtotal:
Professional Development
Strategy Description of Resources Funding Source Amount
Subtotal:
Other
Strategy Description of Resources Funding Source Amount
Subtotal:
Total:
End of Dropout Prevention Goal(s)

2012-2013 School Improvement Plan (SIP)-Form SIP-1
August 2012
Rule 6A-1.099811
Revised April 29, 2011
55
Parent Involvement Goal(s) Upload Option-For schools completing the Parental Involvement Policy/Plan (PIP) please include a copy for this section.
Online Template- For schools completing the PIP a link will be provided that will direct you to this plan.
* When using percentages, include the number of students the percentage represents next to the percentage (e.g. 70% (35)).
Parent Involvement Professional Development
Professional Development (PD) aligned with Strategies through Professional Learning Community (PLC) or PD Activity Please note that each Strategy does not require a professional development or PLC activity.
PD Content /Topic
and/or PLC Focus
Grade
Level/Subject
PD Facilitator
and/or
PLC Leader
PD Participants
(e.g. , PLC, subject, grade level, or
school-wide)
Target Dates (e.g. , Early
Release) and Schedules (e.g.,
frequency of meetings)
Strategy for Follow-up/Monitoring Person or Position Responsible for
Monitoring
Parent Involvement Goal(s) Problem-solving Process to Parent Involvement
Based on the analysis of parent involvement data, and reference to “Guiding Questions,” identify and define areas in need of
improvement:
Anticipated Barrier Strategy Person or Position Responsible for
Monitoring
Process Used to Determine Effectiveness of
Strategy
Evaluation Tool
1. Parent Involvement
1.1. Parents without Internet
access or unaware of
program
1.1. Parent Assistant Program
enrollment through
advertisements
1.1. Volunteer
Coordinator, Registrar 1.1. Quarterly progress monitoring 1.1. eSchoolPlus
Parent Involvement Goal
#1:
St. Augustine will increase
parent involvement through
the implementation of and
increase use of identified
Programs and
communication methods.
St. Augustine High will
increase their volunteer
hours by 5%
2012 Current
Level of Parent
Involvement:*
2013 Expected
Level of Parent
Involvement:*
10,000 hours 10,500 hours
1.2. Parents receiving items
brought home by
students.
1.2. Newsletters/school website 1.2. Administration 1.2. Parent contacts 1.2. Parent Needs Assessment
Surveys
1.3 Students receiving calls 1.3. Alert Now 1.3. Administration 1.3. Parent contacts 1.3. Parent Needs Assessment
Surveys
1.4. Parent schedule
conflicts
1.4 SAC meetings/Advisory
boards/ Booster clubs
1.4 Administration 1.4. Parent contacts 1.4. Parent Needs Assessment
Surveys
1.5. Schedule conflicts 1.5. Orientation/Open House 1.5. Administration 1.5. Parent contacts 1.5 Parent Needs Assessment Survey
1.6. Parents are unaware of
school happenings and events
1.6. Maintain updated website 1.6.Administration,
teachers
1.6. Parent involvement data 1.6. Keep N Track
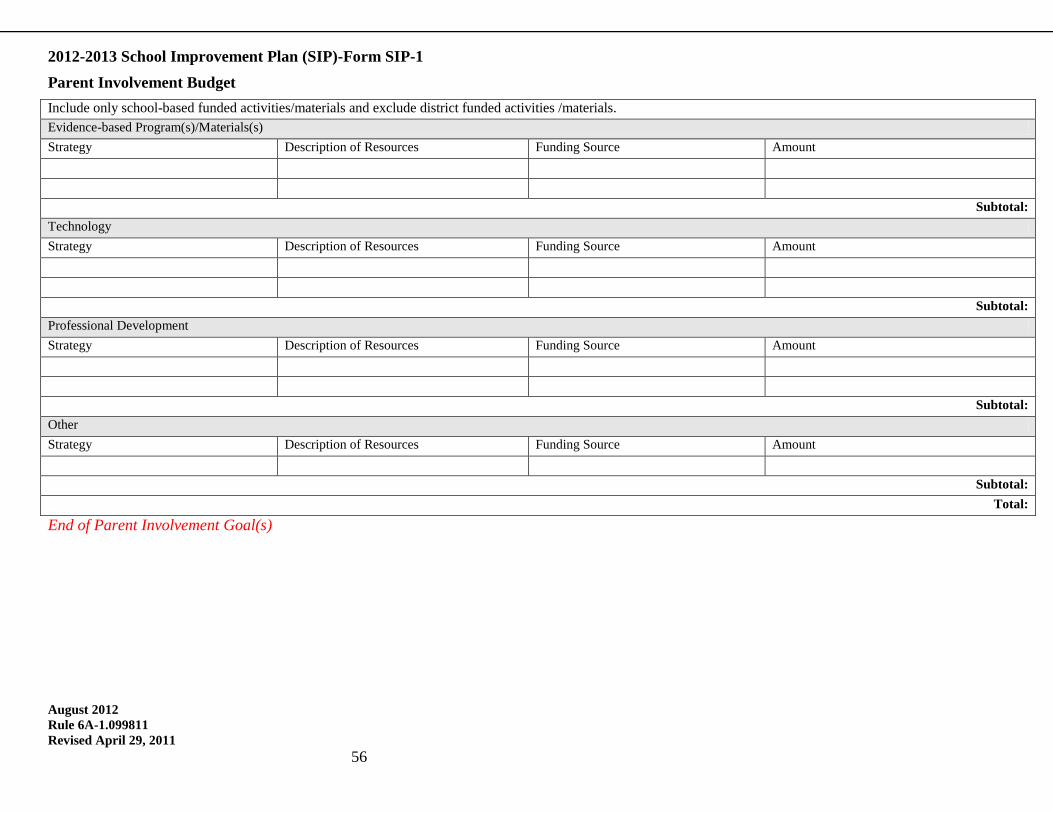
2012-2013 School Improvement Plan (SIP)-Form SIP-1
August 2012
Rule 6A-1.099811
Revised April 29, 2011
56
Parent Involvement Budget
Include only school-based funded activities/materials and exclude district funded activities /materials.
Evidence-based Program(s)/Materials(s)
Strategy Description of Resources Funding Source Amount
Subtotal:
Technology
Strategy Description of Resources Funding Source Amount
Subtotal:
Professional Development
Strategy Description of Resources Funding Source Amount
Subtotal:
Other
Strategy Description of Resources Funding Source Amount
Subtotal:
Total:
End of Parent Involvement Goal(s)

2012-2013 School Improvement Plan (SIP)-Form SIP-1
August 2012
Rule 6A-1.099811
Revised April 29, 2011
57
Science, Technology, Engineering, and Mathematics (STEM) Goal(s)
STEM Goal(s) Problem-Solving Process to Increase Student Achievement
Based on the analysis of school data, identify and define
areas in need of improvement:
Anticipated Barrier Strategy Person or Position
Responsible for
Monitoring
Process Used to Determine
Effectiveness of
Strategy
Evaluation Tool
STEM Goal #1:
St. Augustine High School will increase female and
minority recruitment for Aerospace Academy
1.1. Access to middle school classes for recruitment
1.1. Increase enrollment through High School Showcase,
Academy Nights, etc.
1.1. Career Specialist, Academy and Cohort
Teachers, District
Personnel
1.1. Enrollments (Comparisons to previous school year)
1.1. List of enrollments
1.2. Funding for summer
camp
1.2.Provide STEM Summer
Camps for middle school
students
1.2. Career specialist,
Academy and Cohort
Teachers, District Personnel
1.2. Enrollment 1.2. Enrollment in summer STEM
camp.
1.3. Student access to off -
campus functions during the
school day (release time)
1.3. Utilize students to assist in
recruitment
1.3. Career Specialist,
Academy, and Cohort
Teachers
1.3. Logs 1.3. Log of students who assisted
and accomplishments
1.4. Student access to off -campus functions during the
school day (release time)
1.4. Provide role models (High School Students) as guest
speakers in middle school
classes
1.4. Career Specialist, Academy, and Cohort
Teachers
1.4. Logs 1.4. Log of role models in middle school classrooms.
Stem Goal #2:
St. Augustine High School will increase recruitment for
minorities in the Teaching Academy
2.1. Access to middle school
classes
2.1. Increase enrollment through
High School Showcase, Academy Nights, etc.
2.1. Career Specialist,
Academy and Cohort Teachers, District
Personnel
2.1. Enrollments (Comparisons to
previous school year)
2.1. List of enrollments
2.2. Funding for summer
camp
2.2.Provide STEM Summer
Camps for middle school students
2.2. Career specialist,
Academy and Cohort Teachers, District
Personnel
2.2. Enrollment 2.2. Enrollment in summer STEM
camp.
2.3. Student access to off -
campus functions during the school day (release time)
2.3. Utilize students to assist in
recruitment
2.3. Career Specialist,
Academy, and Cohort Teachers
2.3. Logs 2.3. Log of students who assisted
and accomplishments
2.4. Student access to off -
campus functions during the
school day (release time)
2.4. Provide role models (High
School Students) as guest
speakers in middle school classes
2.4. Career Specialist,
Academy, and Cohort
Teachers
2.4. Logs 2.4. Log of role models in middle
school classrooms.
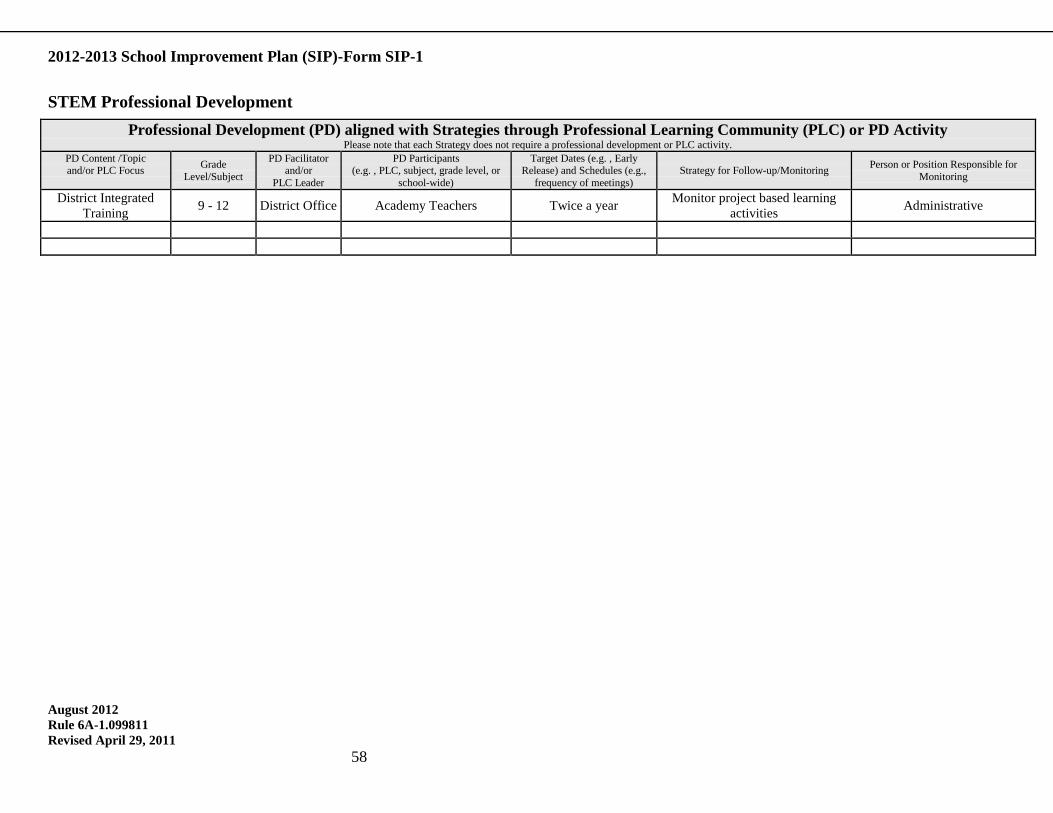
2012-2013 School Improvement Plan (SIP)-Form SIP-1
August 2012
Rule 6A-1.099811
Revised April 29, 2011
58
STEM Professional Development
Professional Development (PD) aligned with Strategies through Professional Learning Community (PLC) or PD Activity Please note that each Strategy does not require a professional development or PLC activity.
PD Content /Topic and/or PLC Focus
Grade
Level/Subject
PD Facilitator and/or
PLC Leader
PD Participants (e.g. , PLC, subject, grade level, or
school-wide)
Target Dates (e.g. , Early Release) and Schedules (e.g.,
frequency of meetings)
Strategy for Follow-up/Monitoring Person or Position Responsible for
Monitoring
District Integrated
Training 9 - 12 District Office Academy Teachers Twice a year
Monitor project based learning
activities Administrative
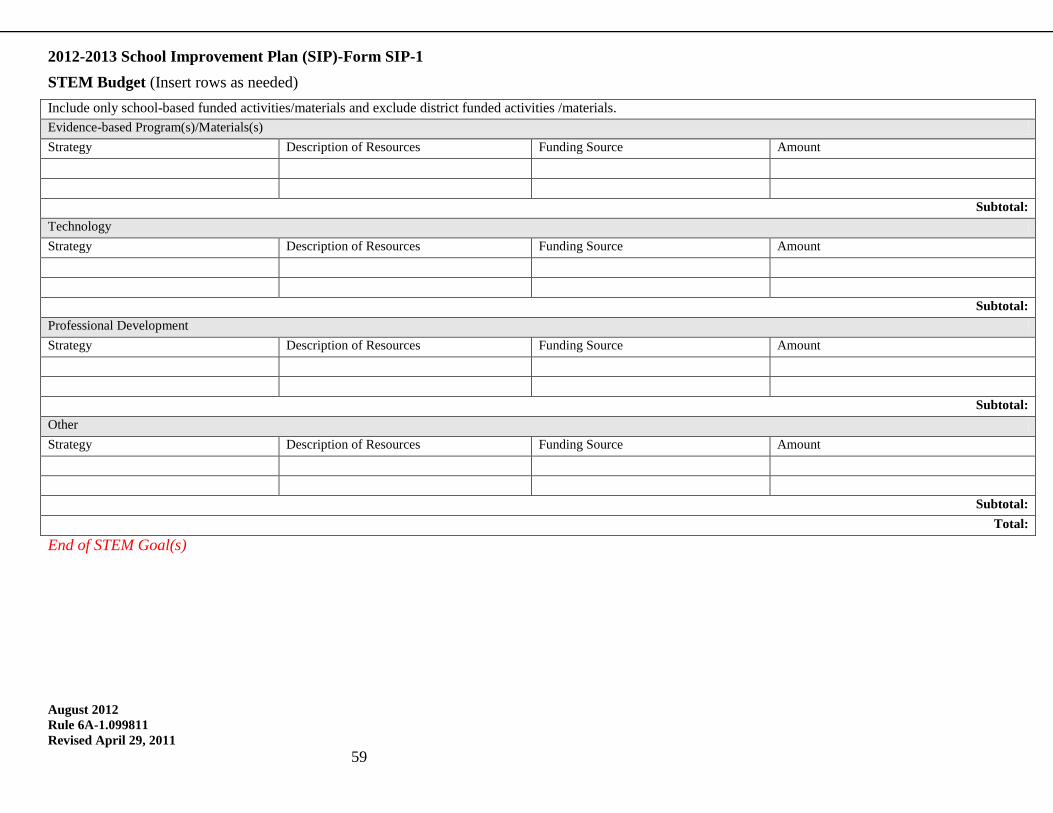
2012-2013 School Improvement Plan (SIP)-Form SIP-1
August 2012
Rule 6A-1.099811
Revised April 29, 2011
59
STEM Budget (Insert rows as needed)
Include only school-based funded activities/materials and exclude district funded activities /materials.
Evidence-based Program(s)/Materials(s)
Strategy Description of Resources Funding Source Amount
Subtotal:
Technology
Strategy Description of Resources Funding Source Amount
Subtotal:
Professional Development
Strategy Description of Resources Funding Source Amount
Subtotal:
Other
Strategy Description of Resources Funding Source Amount
Subtotal:
Total:
End of STEM Goal(s)

2012-2013 School Improvement Plan (SIP)-Form SIP-1
August 2012
Rule 6A-1.099811
Revised April 29, 2011
60
Career and Technical Education (CTE) Goal(s)
CTE Professional Development
Professional Development (PD) aligned with Strategies through Professional Learning Community (PLC) or PD Activity Please note that each Strategy does not require a professional development or PLC activity.
PD Content /Topic
and/or PLC Focus
Grade
Level/Subject
PD Facilitator
and/or
PLC Leader
PD Participants
(e.g. , PLC, subject, grade level, or
school-wide)
Target Dates (e.g. , Early
Release) and Schedules (e.g.,
frequency of meetings)
Strategy for Follow-up/Monitoring Person or Position Responsible for
Monitoring
NCAC (National
Career Academy
Coalition)
ALL Schultz Center Academy Teachers Annually Review of NCAC standards Career Specialist
CTE Goal(s) Problem-Solving Process to Increase Student Achievement
Based on the analysis of school data, identify and define
areas in need of improvement:
Anticipated Barrier Strategy Person or Position
Responsible for
Monitoring
Process Used to Determine
Effectiveness of
Strategy
Evaluation Tool
CTE Goal #1:
St Augustine High School will implement project-based
learning activities in all academy cohort courses based
on Common Core standards.
1.1. Release time for students to visit middle schools.
1.1. Utilize everyone in the recruitment process and get into
the middle schools as much as
possible.
1.1. Academy students, Academy and Cohort
Teachers, Career
Specialist, District Personnel
1.1. Recruitment Process 1.1. List of enrollments
1.2. Limit funding resources
1.2. Explore outside funding
sources
1.2. Academy and Cohort
Teachers, Career
Specialist, District Personnel, Business
Partners
1.2. Grant application processes 1.2. Increase in budget
1.3.Release time for the
students and teachers
1.3. Conduct trainings for
academy and cohort
1.3.Academy and Cohort
Teachers, Career Specialist, District
Personnel
1.3. Planning and implementing
trainings.
1.3. List of trained participants
1.4 Time away from classes
to plan with business partners.
1.4. Allow Academy and Cohort
Teachers to plan
1.4. Academy and Cohort
Teachers, Career Specialist, District and
School Personnel
1.4. Planning process collaborating
with business partners
1.4. Project-Based Learning
implemented in the classroom.

2012-2013 School Improvement Plan (SIP)-Form SIP-1
August 2012
Rule 6A-1.099811
Revised April 29, 2011
61

2012-2013 School Improvement Plan (SIP)-Form SIP-1
August 2012
Rule 6A-1.099811
Revised April 29, 2011
62
CTE Budget (Insert rows as needed) Include only school-based funded activities/materials and exclude district funded activities /materials.
Evidence-based Program(s)/Materials(s)
Strategy Description of Resources Funding Source Amount
Subtotal:
Technology
Strategy Description of Resources Funding Source Amount
Subtotal:
Professional Development
Strategy Description of Resources Funding Source Amount
Subtotal:
Other
Strategy Description of Resources Funding Source Amount
Subtotal:
Total:
End of CTE Goal(s)

2012-2013 School Improvement Plan (SIP)-Form SIP-1
August 2012
Rule 6A-1.099811
Revised April 29, 2011
63
Additional Goal(s)
* When using percentages, include the number of students the percentage represents next to the percentage (e.g. 70% (35)).
Additional Goals Professional Development
Professional Development (PD) aligned with Strategies through Professional Learning Community (PLC) or PD Activity Please note that each Strategy does not require a professional development or PLC activity.
PD Content /Topic
and/or PLC Focus
Grade
Level/Subject
PD Facilitator
and/or PLC Leader
PD Participants
(e.g. , PLC, subject, grade level, or school-wide)
Target Dates (e.g. , Early
Release) and Schedules (e.g., frequency of meetings)
Strategy for Follow-up/Monitoring Person or Position Responsible for
Monitoring
Capturing Kid’s Hearts
(CKH) ALL
CKH certified
trainers School-wide Monthly Classroom Observations Administration
Additional Goal(s) Problem-Solving Process to Increase Student Achievement
Based on the analysis of school data, identify and define areas in need of improvement:
Anticipated Barrier Strategy Person or Position Responsible for
Monitoring
Process Used to Determine Effectiveness of
Strategy
Evaluation Tool
1. Character Counts Goal
1.1. Student involvement
1.1. Teen Leadership Class-CKH 1.1. Teachers, Admin 1.1. Track discipline referrals for
ISS/OSS disrespect 1.1. eSchoolPlus data
Additional Goal #1:
St. Augustine High School
faculty and staff will
continue to build and
support character in all
students. SAHS will
decrease the number of
referrals for
disrespect/defiance by 5%.
2012 Current Level :*
2013 Expected Level :*
Enter numerical
data for current
goal in this box.
Enter numerical
data for expected
goal in this box.
1.2. Student involvement
1.2. College Day/Dress for
Success
1.2. ALL 1.2. Administration observation 1.2. Administration observation
1.3.Student absences and
getting behind in classwork
1.3. Be sure to greet, welcome,
and let students know that they were missed.
Develop a plan of action for identified students so that they
feel they have achievable goals.
Reassure students and work with them to encourage attendance
1.3. Teacher/school
counselor/ parent
1.3. Conferencing 1.3. Attendance for major
exams/passing grades

2012-2013 School Improvement Plan (SIP)-Form SIP-1
August 2012
Rule 6A-1.099811
Revised April 29, 2011
64
Additional Goal(s) Budget (Insert rows as needed)
Include only school-based funded activities/materials and exclude district funded activities /materials.
Evidence-based Program(s)/Materials(s)
Strategy Description of Resources Funding Source Amount
Subtotal:
Technology
Strategy Description of Resources Funding Source Amount
Subtotal:
Professional Development
Strategy Description of Resources Funding Source Amount
Subtotal:
Other
Strategy Description of Resources Funding Source Amount
“STING” Program Incentives, materials Administrative $500.00
Most Valuable Jacket Student Awards Incentives, materials Administrative $1,000.00
Both faculty and staff will increase
character counts efforts and programs
Character Counts Awards Banquet School-based Budget $2,000.00
Subtotal: $3,500.00
Total: $3,500.00
End of Additional Goal(s)

2012-2013 School Improvement Plan (SIP)-Form SIP-1
August 2012
Rule 6A-1.099811
Revised April 29, 2011
65
Final Budget (Insert rows as needed) Please provide the total budget from each section.
Reading Budget
Total: $123, 450.00
CELLA Budget
Total: $0.00
Mathematics Budget
Total: $7,500.00
Science Budget
Total: $4,000.00
Writing Budget
Total: $1,615.00
U.S. History Budget
Total: $4,000.00
Attendance Budget
Total: $1,000.00
Suspension Budget
Total: $1,000.00
Dropout Prevention Budget
Total: $0.00
Parent Involvement Budget
Total: $0.00
STEM Budget
Total: $0.00
CTE Budget
Total: $0.00
Additional Goals
Total: $3,500.00
Grand Total: $145, 565.00

2012-2013 School Improvement Plan (SIP)-Form SIP-1
August 2012
Rule 6A-1.099811
Revised April 29, 2011
66
Differentiated Accountability
School-level Differentiated Accountability (DA) Compliance
Please choose the school’s DA Status. (To activate the checkbox: 1. Double click the desired box; 2.When the menu pops up, select Checked under “Default value”
header; 3. Select OK, this will place an “x” in the box.)
School Differentiated Accountability Status
Priority Focus Prevent
Are you reward school? Yes No
(A reward school is any school that has improved their letter grade from the previous year or any A graded school.)
Upload a copy of the Differentiated Accountability Checklist in the designated upload link on the Upload page
School Advisory Council (SAC) SAC Membership Compliance
The majority of the SAC members are not employed by the school district. The SAC is composed of the principal and an appropriately balanced number of teachers,
education support employees, students (for middle and high school only), parents, and other business and community members who are representative of the ethnic,
racial, and economic community served by the school. Please verify the statement above by selecting Yes or No below.
Yes No
If No, describe the measures being taken to comply with SAC requirements.
Describe the activities of the SAC for the upcoming school year.
Monthly meetings
2nd
Monday of every month
Describe the projected use of SAC funds. Amount Professional Development $2,500.00