web view · 2013-02-072012-2013 school improvement plan (sip)-form sip-1. june ... crt,...
TRANSCRIPT

2012-2013 School Improvement Plan (SIP)-Form SIP-1
FLORIDA DEPARTMENT OF EDUCATION
DRAFT School Improvement Plan (SIP)Form SIP-1
Proposed for 2012-2013
June 2012Rule 6A-1.099811Revised April 29, 2011 1

2012-2013 School Improvement Plan (SIP)-Form SIP-1
2012-2013 SCHOOL IMPROVEMENT PLAN
PART I: CURRENT SCHOOL STATUS
School Information School Name: The Villages Elementary of Lady Lake District Name: Lake
Principal: David Bordenkircher Superintendent: Dr. Susan Moxley
SAC Chair: Jo Ann Applewhite Date of School Board Approval:
Student Achievement Data and Reference Materials: The following links will open in a separate browser window. School Grades Trend Data (Use this data to complete Sections 1-4 of the reading and mathematics goals and Sections 1 and 2 of the writing and science goals.)Florida Comprehensive Assessment Test (FCAT)/Statewide Assessment Trend Data (Use this data to inform the problem-solving process when writing goals.)High School Feedback Report K-12 Comprehensive Research Based Reading Plan
AdministratorsList your school’s administrators and briefly describe their certification(s), number of years at the current school, number of years as an administrator, and their prior performance record with increasing student achievement at each school. Include history of School Grades, FCAT/statewide assessment performance (percentage data for achievement levels, learning gains, Lowest 25%), and ambitious but achievable annual measurable objective (AMO) progress.
June 2012Rule 6A-1.099811Revised April 29, 2011 2

2012-2013 School Improvement Plan (SIP)-Form SIP-1
Position Name Degree(s)/Certification(s)
Number of Years at
Current School
Number ofYears as an
Administrator
Prior Performance Record (include prior School Grades, FCAT/statewide assessment Achievement Levels, learning gains, lowest 25%), and AMO progress, along with the associated school year)
Principal David Bordenkircher
Master’s Degree: University of South –
Educational Leadership. Bachelor of Science:
William Paterson College of New Jersey – Music
Education. Florida Professional Certificate: School Principal, Music
Education K-12.
0 17
Carver Middle School 2011-2012: School Grade-C. Meeting highstandards: Reading- 49%, Math-47%, Writing-77%, Science-49%.Carver Middle School 2010-2011: School Grade-B. Meeting high standards: Reading -63%, Math-63%, Writing-89%, Science-46%.Making learning gains: Readin-55%, Math-61%, LQ Reading-61%, LQ Math-65%. AYP- Met 77% of criteria.South Lake High School 2009-2010: School Grade-C. Meeting high standards: Reading-48%, Math-76%, Writing-80%, Science-33%.Making learning gains: Reading 49%, Math-72%, LQ Reading-41%, LQ Math-60%. AYP- met 82% of criteria.South Lake High School 2008-2009: School Grade-D. Meeting high standards: Reading-43%, Math-71%, Writing-67%, Science-32%Making learning gains: Reading-47%, Math-69%, LQ Reading-45%, LQ Math-58%. AYP- met 67% of criteria.
Assistant Principal
Charlotte Burkholder BA in Elementary Education, University of Central Florida; Master of Science in Special Education, Nova University; Ed. Leadership, University of Central Florida; Principal Certification, State of Florida
0 8 Assistant Principal of Villages Elementary of Lady Lake in 2011-2012; School Grade: A; Reading Mastery: 67%; Math Mastery: 72%; Science Mastery: 62%; Writing Mastery: 80%.Assistant Principal of Umatilla Elementary in 2009-2010, School Grade A; did not make AYP.
June 2012Rule 6A-1.099811Revised April 29, 2011 3

2012-2013 School Improvement Plan (SIP)-Form SIP-1
Instructional CoachesList your school’s instructional coaches and briefly describe their certification(s), number of years at the current school, number of years as an instructional coach, and their prior performance record with increasing student achievement at each school. Include history of School Grades, FCAT/statewide assessment performance (percentage data for achievement levels, learning gains, Lowest 25%), and ambitious but achievable annual measurable objective (AMO) progress. Instructional coaches described in this section are only those who are fully released or part-time teachers in reading, mathematics, or science and work only at the school site.
SubjectArea Name Degree(s)/
Certification(s)
Number of Years at
Current School
Number of Years as an Instructional
Coach
Prior Performance Record (include prior School Grades, FCAT/Statewide Assessment Achievement Levels, Learning Gains, Lowest 25%), and AMO progress along with the associated school year)
Reading Lee Ann Whipple
B.A.: Stetson University; Florida Professional
Educator’s Certificate: Elem. Ed., Primary Ed., Reading Endorsement,
ESOL Endorsement
.5Literacy Coach at Villages Elementary of Lady Lake in 2011-2012. School Grade: A; Reading Mastery: 67%; Math Mastery: 72%; Science Mastery: 62%; Writing Mastery: 80%.
Highly Effective TeachersDescribe the school-based strategies that will be used to recruit and retain high quality, highly effective teachers to the school.
Description of Strategy Person Responsible Projected Completion Date
1. Regular meetings of new teachers with Principal Principal On going
2. Partnering new teachers with veteran staff Principal On going
3. College campus job fairs and recruiting at Universities Principal On going
4. Weekly grade level team meetings
5. Soliciting referral from current employees
Principal
Principal
On going
On going
June 2012Rule 6A-1.099811Revised April 29, 2011 4

2012-2013 School Improvement Plan (SIP)-Form SIP-1Non-Highly Effective InstructorsProvide the number of instructional staff and paraprofessionals that are teaching out-of-field and/or who are NOT highly effective. *When using percentages, include the number of teachers the percentage represents (e.g., 70% [35]).
Number of staff and paraprofessional that are teaching out-of-field/ and who are not highly effective.
Provide the strategies that are being implemented to support the staff in becoming highly effective
100% of our teachers are infield.Data is not available on highly effective status.
Professional Development is provided in research based best practices.
Staff DemographicsPlease complete the following demographic information about the instructional staff in the school.
*When using percentages, include the number of teachers the percentage represents (e.g., 70% [35]).
TotalNumber of
Instructional Staff
% of First-Year
Teachers
% of Teachers with 1-5 Years of Experience
% of Teachers with 6-14 Years of Experience
% of Teachers with 15+ Years of Experience
% of Teachers with Advanced
Degrees
% Highly Effective Teachers
% Reading Endorsed Teachers
% National Board
Certified Teachers
% ESOL EndorsedTeachers
62 2% (1) 15% (9) 44% (27) 40% (25) 24% (15) 0% 3% (2) 13% (8) 74% (46)
Teacher Mentoring Program/PlanPlease describe the school’s teacher mentoring program/plan by including the names of mentors, the name(s) of mentees, rationale for the pairing, and the planned mentoring activities.
Mentor Name Mentee Assigned Rationale for Pairing Planned Mentoring Activities
Paige Simmons Kathryn Backman Common Planning and P.L.C. Meet weekly and individual meetings
Paige Simmons Melissa Spell Common Planning and P.L.C. Meet weekly and individual meetings
Crystal Watkins Lisa Deffenbaugh Common Planning and P.L.C. Meet weekly and individual meetings
June 2012Rule 6A-1.099811Revised April 29, 2011 5

2012-2013 School Improvement Plan (SIP)-Form SIP-1
Additional Requirements
Coordination and Integration-Title I Schools Only Please describe how federal, state, and local services and programs will be coordinated and integrated in the school. Include other Title programs, Migrant and Homeless, Supplemental Academic Instruction funds, as well as violence prevention programs, nutrition programs, housing programs, Head Start, adult education, career and technical education, and/or job training, as applicable.
Title I, Part A Funds are provided for opportunities and remediation to students to assist them to achieve the standards in the local curriculum, Common Core Standards, and the Next Generation Sunshine State Standards. The district coordinates all parts of Title services for educational services and staff development. The opportunities include: before and after school programs and resource assistance during the school day. Title 1 provides two reading teachers, a writing teacher, a math teacher and one full and one half time teacher assistants. In addition, SES (Supplemental Educational Services) tutoring is available after school for fourth and fifth grade students who scored a Level 1 or 2 on the FCAT and require additional assistance in reading and math. Title 1 funds our Parent Resource Center which is available at varied hours for parents to check out materials to help their students. Our Family/School Liaison takes an active part in all parent workshops, keeps parents apprised of attendance issues, coordinates the Parent Resource Center, and facilitates communication between teachers and parents.
Title I, Part C- Migrant Migrant Liaisons provide services and support to students and parents on an as-needed basis. The liaison (district based) coordinates with all Title services to ensure student needs are met.
Title I, Part D District receives funds for Neglected and Delinquent services for students in need. Services are coordinated with drop-out prevention programs.
Title II District receives funds for technology to increase instructional strategies. Also, funding is provided for professional development and is coordinated with the curriculum department.
Title III Services are provided through the district’s curriculum department for educational materials and support for E.L.L. students.
Title X- Homeless School Counselors and Social Worker assist to provide resources for students identified as homeless under the McKinney-Vento Act to eliminate barriers for a free and appropriate education. The Homeless Liaison at the district and the homeless contact at the school level collaborate to ensure that students receive the necessary services and resources.
Supplemental Academic Instruction (SAI) Academic tutoring for struggling students. Enhance technology software and hardware.
Violence Prevention Programs The school offers a non-violence and anti-drug program to students through “Too Good for Drugs” and “Too Good for Violence” curriculum.
Nutrition Programs
Housing Programs
Head Start
June 2012Rule 6A-1.099811Revised April 29, 2011 6

2012-2013 School Improvement Plan (SIP)-Form SIP-1Adult Education
Career and Technical Education
Job Training
Other
June 2012Rule 6A-1.099811Revised April 29, 2011 7

2012-2013 School Improvement Plan (SIP)-Form SIP-1Multi-Tiered System of Supports (MTSS) /Response to Instruction/Intervention (RtI)
School-Based MTSS/RtI TeamIdentify the school-based MTSS leadership team. The leadership team will include the principal, assistant principal, grade level chairs, teachers, curriculum specialist, literacy coach, ESE specialist, school psychologist, guidance counselors, speech/language pathologist and student services personnel.
Describe how the school-based MTSS leadership team functions (e.g., meeting processes and roles/functions). How does it work with other school teams to organize/coordinate MTSS efforts? The MTSS Team meets monthly to review student data and identify students in need of academic or behavioral intervention. Working cooperatively, the team will plan instructional strategies, determine the effectiveness of interventions and create a system for continued monitoring of student progress.
Describe the role of the school-based MTSS leadership team in the development and implementation of the school improvement plan (SIP). Describe how the RtI problem-solving process is used in developing and implementing the SIP? The team meets during the summer to disaggregate test scores, student achievement, and school goals. The leadership team met with the principal to help develop the SIP, which will be presented to the SAC for discussion and approval. The team will provide data and information regarding academic areas that need to be addressed and help set clear expectations for relevant instruction. Grade levels will present weekly reports to the principal on meetings regarding aligned process and procedures that include tiered intervention.
MTSS ImplementationDescribe the data source(s) and the data management system(s) used to summarize data at each tier for reading, mathematics, science, writing, and behavior. After analysis, the team will assist in developing the new school improvement goals and problem solving methods to bring out the best in our school, our teachers, and our students. The team will collaborate regularly through the MTSS and RSN (Reading Success Network) process to disseminate best practices for review of progress monitoring, data collection, and tiered interventions. (MTSS meetings will be held two times a month; RSN will meet once a month, and PLC’s by grade level will meet weekly.)
Describe the plan to train staff on MTSS.Professional development will be provided during pre planning, teachers’ common plan time, small sessions will occur throughout the year, and monthly Reading Success Network meetings will address the MTSS process. Professional development will occur during pre-planning to update MTSS information and charting.
Describe the plan to support MTSS. The MTSS Leadership team will support teachers through data collection and review. Title 1 teachers will help facilitate the MTSS process.
Literacy Leadership Team (LLT)
June 2012Rule 6A-1.099811Revised April 29, 2011 8

2012-2013 School Improvement Plan (SIP)-Form SIP-1School-Based Literacy Leadership Team
Identify the school-based Literacy Leadership Team (LLT).The team consists of the principal, assistant principal, CRT, Literacy Coach, media specialist, Title 1 reading and writing instructors and model classroom teachers.
Describe how the school-based LLT functions (e.g., meeting processes and roles/functions).LLT functions with monthly meetings to review test data, teacher requests, and RSN reports in order to plan student activities and staff development to improve student achievement in Literacy.
What will be the major initiatives of the LLT this year?Our Literacy Initiative for 2012 – 2013 is to increase informational reading and the level of text complexity.
Public School Choice Supplemental Educational Services (SES) Notification
Upload a copy of the SES Notification to Parents in the designated upload link on the “Upload” page.
June 2012Rule 6A-1.099811Revised April 29, 2011 9
2012-2013 School Improvement Plan (SIP)-Form SIP-1*Elementary Title I Schools Only: Pre-School TransitionDescribe plans for assisting preschool children in transition from early childhood programs to local elementary school programs as applicable.The Villages Elementary is a Title 1 school and has one Pre-K unit with 20 students to help prepare students for Kindergarten. This VPK unit is ½ funded by Title 1 and ½ State funded.
Parents and preschool students are invited to tour our school, especially the kindergarten classrooms, during the spring proceeding each school year. In addition, a two night program is conducted each spring for the parents of incoming Kindergarten students to better prepare them for the transition into Kindergarten.
At The Villages Elementary of Lady Lake, all incoming kindergarten students are assessed prior to, or upon entering, kindergarten with a form of the Brigance K & 1 screening instrument. In addition, the Florida Kindergarten Readiness Screener will be administered within the first 30 school days. Parents complete a "Tell Us About Your Child" questionnaire upon registering a kindergarten student. Information from these sources will be used to plan for the academic and social/emotional instruction for all students.
*Grades 6-12 Only Sec. 1003.413 (2)(b) F.SFor schools with grades 6-12, how does the school ensure that every teacher contributes to the reading improvement of every student?
*High Schools OnlyNote: Required for High School-Sec. 1003.413(2)(g), (2)(j) F.S.
How does the school incorporate applied and integrated courses to help students see the relationships between subjects and relevance to their future?
How does the school incorporate students’ academic and career planning, as well as promote student course selections, so that students’ course of study is personally meaningful?
Postsecondary TransitionNote: Required for High School- Sec. 1008.37(4), F.S. Describe strategies for improving student readiness for the public postsecondary level based on annual analysis of the High School Feedback Report.
June 2012Rule 6A-1.099811Revised April 29, 2011
10

2012-2013 School Improvement Plan (SIP)-Form SIP-1
June 2012Rule 6A-1.099811Revised April 29, 2011
11

2012-2013 School Improvement Plan (SIP)-Form SIP-1
PART II: EXPECTED IMPROVEMENTSReading Goals* When using percentages, include the number of students the percentage represents (e.g., 70% [35]).
Reading Goals Problem-Solving Process to Increase Student AchievementBased on the analysis of student achievement data and reference to “Guiding Questions,” identify and define areas in need of improvement for the following group:
Anticipated Barrier Strategy Person or Position Responsible for Monitoring
Process Used to Determine Effectiveness of Strategy
Evaluation Tool
1A. FCAT 2.0: Students scoring at Achievement Level 3 in reading. 67%
1A.1.
An increase in the level of text complexity and percentages of informational text.
1A.1.
Continue current instructional strategies and practices using Reading Success Network school wide.
1A.1.
Administration and Curriculum SpecialistLiteracy Coach
1A.1.
FAIR testingEdusoft Testing
1A.1.
FCAT test results.Reading Goal #1A:
Maintain or improve current student proficiency of 67% (Continue to maintain proficiency levels above district and state levels)
2012 Current Level of Performance:*
2013 Expected Level of Performance:*
67% (264)
≥ 67% (261)
1A.2. 1A.2. 1A.2. 1A.2. 1A.2.
1A.3. 1A.3. 1A.3. 1A.3. 1A.3.
1B. Florida Alternate Assessment: Students scoring at Levels 4, 5, and 6 in reading.
1B.1. 1B.1. 1B.1. 1B.1. 1B.1.
Reading Goal #1B:
Providing this data violates student confidentiality.
2012 Current Level of Performance:*
2013 Expected Level of Performance:*
Enter numerical data for current level of performance in this box.
Enter numerical data for expected level of performance in this box.
1B.2. 1B.2. 1B.2. 1B.2. 1B.2.
1B.3. 1B.3. 1B.3. 1B.3. 1B.3.
June 2012Rule 6A-1.099811Revised April 29, 2011
12

2012-2013 School Improvement Plan (SIP)-Form SIP-1Based on the analysis of student achievement data and reference to “Guiding Questions,” identify and define areas in need of improvement for the following group:
Anticipated Barrier Strategy Person or Position Responsible for Monitoring
Process Used to Determine Effectiveness of Strategy
Evaluation Tool
2A. FCAT 2.0: Students scoring at or above Achievement Levels 4 in reading. 36%
2A.1.
An increase in the level of text complexity and percentage of informational text.
2A.1.
Use reading instructional materials including level readers and supplemental reading materials.
2A.1.
AdministrationCurriculum SpecialistLiteracy Coach
2A.1.
FAIR TestingEdusoft Testing
2A.1.
FCAT Test ResultsReading Goal #2A:
Improve the percentage of students scoring at or above level 4 in reading by one percentage point.
2012 Current Level of Performance:*
2013 Expected Level of Performance:*
36% (142)
≥ 37% (145)
2A.2. 2A.2. 2A.2. 2A.2. 2A.2.
2A.3. 2A.3. 2A.3. 2A.3. 2A.3.
2B. Florida Alternate Assessment: Students scoring at or above Level 7 in reading.
2B.1. 2B.1. 2B.1. 2B.1. 2B.1.
Reading Goal #2B:
Providing this data violates student confidentiality.
2012 Current Level of Performance:*
2013 Expected Level of Performance:*
Enter numerical data for current level of performance in this box.
Enter numerical data for expected level of performance in this box.
2B.2. 2B.2. 2B.2. 2B.2. 2B.2.
2B.3. 2B.3. 2B.3. 2B.3. 2B.3.
June 2012Rule 6A-1.099811Revised April 29, 2011
13

2012-2013 School Improvement Plan (SIP)-Form SIP-1Based on the analysis of student achievement data and reference to “Guiding Questions,” identify and define areas in need of improvement for the following group:
Anticipated Barrier Strategy Person or Position Responsible for Monitoring
Process Used to Determine Effectiveness of Strategy
Evaluation Tool
3A. FCAT 2.0: Percentage of students making learning gains in reading. 61%
3A.1.
The State’s continued increase of text complexity and percentage of informational text.
3A.1.
Full implementation of the resources available in the reading series, including strategic interventions and “Ticket to Read”.
3A.1.
Administration Curriculum SpecialistLiteracy Coach
3A.1.
FAIR TestingEdusoft Testing
3A.1.
FCAT ResultsReading Goal #3A:
Increase percentage of students making learning gains by 2% to 63%.
2012 Current Level of Performance:*
2013 Expected Level of Performance:*
61% (240)
≥63% (246)
3A.2. 3A.2. 3A.2. 3A.2. 3A.2.
3A.3. 3A.3. 3A.3. 3A.3. 3A.3.
3B. Florida Alternate Assessment: Percentage of students making learning gains in reading.
3B.1. 3B.1. 3B.1. 3B.1. 3B.1.
Reading Goal #3B:
Providing this data violates student confidentiality.
2012 Current Level of Performance:*
2013 Expected Level of Performance:*
Enter numerical data for current level of performance in this box.
Enter numerical data for expected level of performance in this box.
3B.2. 3B.2. 3B.2. 3B.2. 3B.2.
3B.3. 3B.3. 3B.3. 3B.3. 3B.3.
June 2012Rule 6A-1.099811Revised April 29, 2011
14

2012-2013 School Improvement Plan (SIP)-Form SIP-1Based on the analysis of student achievement data and reference to “Guiding Questions,” identify and define areas in need of improvement for the following group:
Anticipated Barrier Strategy Person or Position Responsible for Monitoring
Process Used to Determine Effectiveness of Strategy
Evaluation Tool
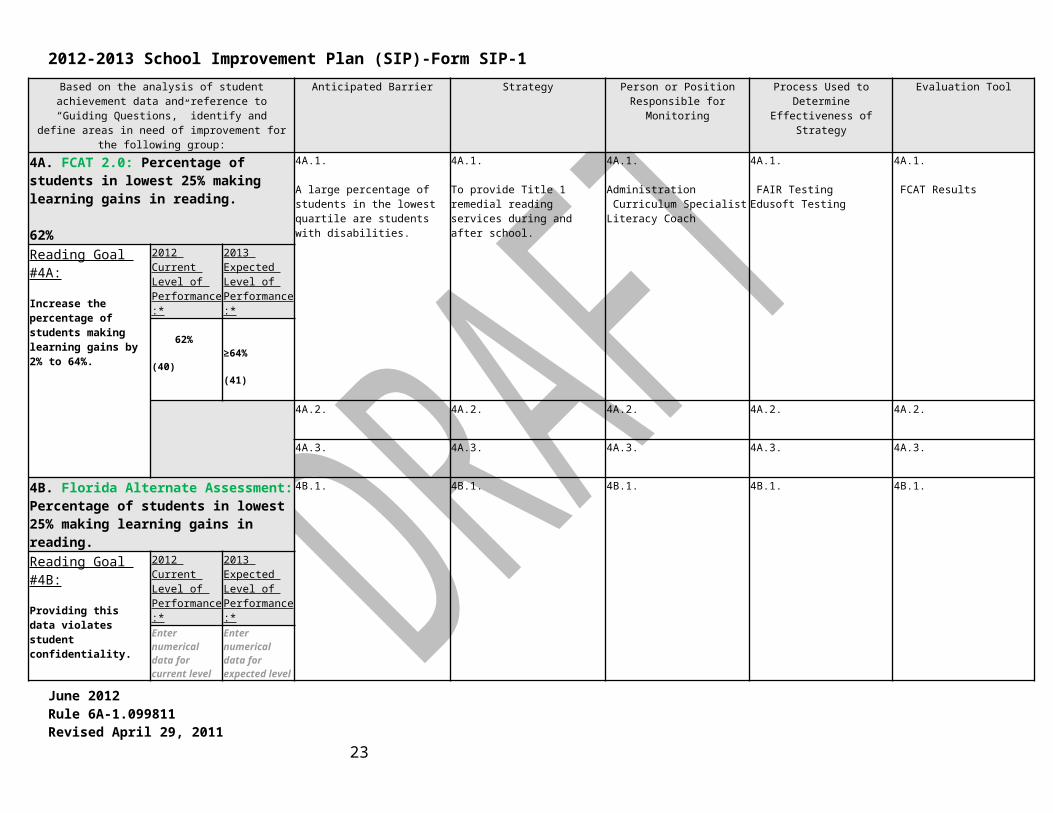
4A. FCAT 2.0: Percentage of students in lowest 25% making learning gains in reading. 62%
4A.1.
A large percentage of students in the lowest quartile are students with disabilities.
4A.1.
To provide Title 1 remedial reading services during and after school.
4A.1.
Administration Curriculum SpecialistLiteracy Coach
4A.1.
FAIR TestingEdusoft Testing
4A.1.
FCAT Results
Reading Goal #4A:
Increase the percentage of students making learning gains by 2% to 64%.
2012 Current Level of Performance:*
2013 Expected Level of Performance:*
62% (40)
≥64% (41)
4A.2. 4A.2. 4A.2. 4A.2. 4A.2.
4A.3. 4A.3. 4A.3. 4A.3. 4A.3.
4B. Florida Alternate Assessment: Percentage of students in lowest 25% making learning gains in reading.
4B.1. 4B.1. 4B.1. 4B.1. 4B.1.
Reading Goal #4B:
Providing this data violates student confidentiality.
2012 Current Level of Performance:*
2013 Expected Level of Performance:*
Enter numerical data for current level of performance in this box.
Enter numerical data for expected level of performance in this box.
4B.2. 4B.2. 4B.2. 4B.2. 4B.2.
4B.3. 4B.3. 4B.3. 4B.3. 4B.3.
June 2012Rule 6A-1.099811Revised April 29, 2011
15

2012-2013 School Improvement Plan (SIP)-Form SIP-1Based on ambitious but achievable Annual Measurable Objectives (AMOs), identify reading and mathematics
performance target for the following years
2011-2012 2012-2013 2013-2014 2014-2015 2015-2016 2016-2017
5A. In six years school will reduce their achievement gap by 50%.
Baseline data2010-2011
70% (270) 67% (264) 75% (293) 78% 80% 83% 85%
Reading Goal #5A:
Meet or exceed annual AMO increases in students demonstrating proficiency in reading each year.
Based on the analysis of student achievement data and reference to “Guiding Questions,” identify and define
areas in need of improvement for the following subgroups:
Anticipated Barrier Strategy Person or Position Responsible for Monitoring
Process Used to Determine Effectiveness of Strategy
Evaluation Tool
5B. Student subgroups by ethnicity (White, Black, Hispanic, Asian, American Indian) not making satisfactory progress in reading.
5B.1.White:Black:Hispanic:Asian:American Indian:
An increase in the level of text complexity and percentages of informational text.
5B.1
Continue current instructional strategies and practices using Reading Success Network school wide.
5B.1
Administration and Curriculum SpecialistLiteracy Coach
5B.1
FAIR testingEdusoft Testing
5B.1
FCAT test results.
Reading Goal #5B:
Maintain or improve student proficiency levels in sub-groups by levels indicated by subgroups.
2012 Current Level of Performance:*
2013 Expected Level of Performance:*
Enter numerical data for current level of performance in this box.White: 68%Black: 61%Hispanic: 51%Asian: -American Indian: -
Enter numerical data for expected level of performance in this box.White: 78%Black: 61%Hispanic: 62%Asian:American Indian:
5B.2. 5B.2. 5B.2. 5B.2. 5B.2.
5B.3. 5B.3. 5B.3. 5B.3. 5B.3.
June 2012Rule 6A-1.099811Revised April 29, 2011
16

2012-2013 School Improvement Plan (SIP)-Form SIP-1Based on the analysis of student achievement data and reference to “Guiding Questions,” identify and define
areas in need of improvement for the following subgroup:
Anticipated Barrier Strategy Person or Position Responsible for Monitoring
Process Used to Determine Effectiveness of Strategy
Evaluation Tool
5C. English Language Learners (ELL) not making satisfactory progress in reading.
5C.1.
An increase in the level of text complexity and percentages of informational text.
5C.1.
Continue current instructional strategies and practices using Reading Success Network school wide.
5C.1.
Administration and Curriculum SpecialistLiteracy Coach
5C.1.
FAIR testingEdusoft Testing
5C.1.
FCAT test results.Reading Goal #5C:
Improve the percent of ELL students demonstrating proficiency as indicated.
2012 Current Level of Performance:*
2013 Expected Level of Performance:*
41% 52%
5C.2. 5C.2. Instructional support provided by ESOL assistant.
5C.2. ESOL AssistantSchool Administration
5C.2. Lake Benchmark Assessments
5C.2. FCAT
5C.3. 5C.3. 5C.3. 5C.3. 5C.3.
Based on the analysis of student achievement data and reference to “Guiding Questions,” identify and define
areas in need of improvement for the following subgroup:
Anticipated Barrier Strategy Person or Position Responsible for Monitoring
Process Used to Determine Effectiveness of Strategy
Evaluation Tool
5D. Students with Disabilities (SWD) not making satisfactory progress in reading.
5D.1.
An increase in the level of text complexity and percentages of informational text.
5D.1.
Continue current instructional strategies and practices using Reading Success Network school wide.
5D.1.
Administration and Curriculum SpecialistLiteracy Coach
5D.1.
FAIR testingEdusoft Testing
5D.1.
FCAT test results.Reading Goal #5D:
Improve the percent of Students With Disabilities demonstrating proficiency as indicated.
2012 Current Level of Performance:*
2013 Expected Level of Performance:*
31% 53%
5D.2. 5D.2. Instructional support provided by ESE teachers
5D.2. ESE TeachersSchool Administration
5D.2. Lake Benchmark Assessments
5D.2. FCAT
5D.3. 5D.3. 5D.3. 5D.3. 5D.3.
June 2012Rule 6A-1.099811Revised April 29, 2011
17

2012-2013 School Improvement Plan (SIP)-Form SIP-1Based on the analysis of student achievement data and reference to “Guiding Questions,” identify and define
areas in need of improvement for the following subgroup:
Anticipated Barrier Strategy Person or Position Responsible for Monitoring
Process Used to Determine Effectiveness of Strategy
Evaluation Tool
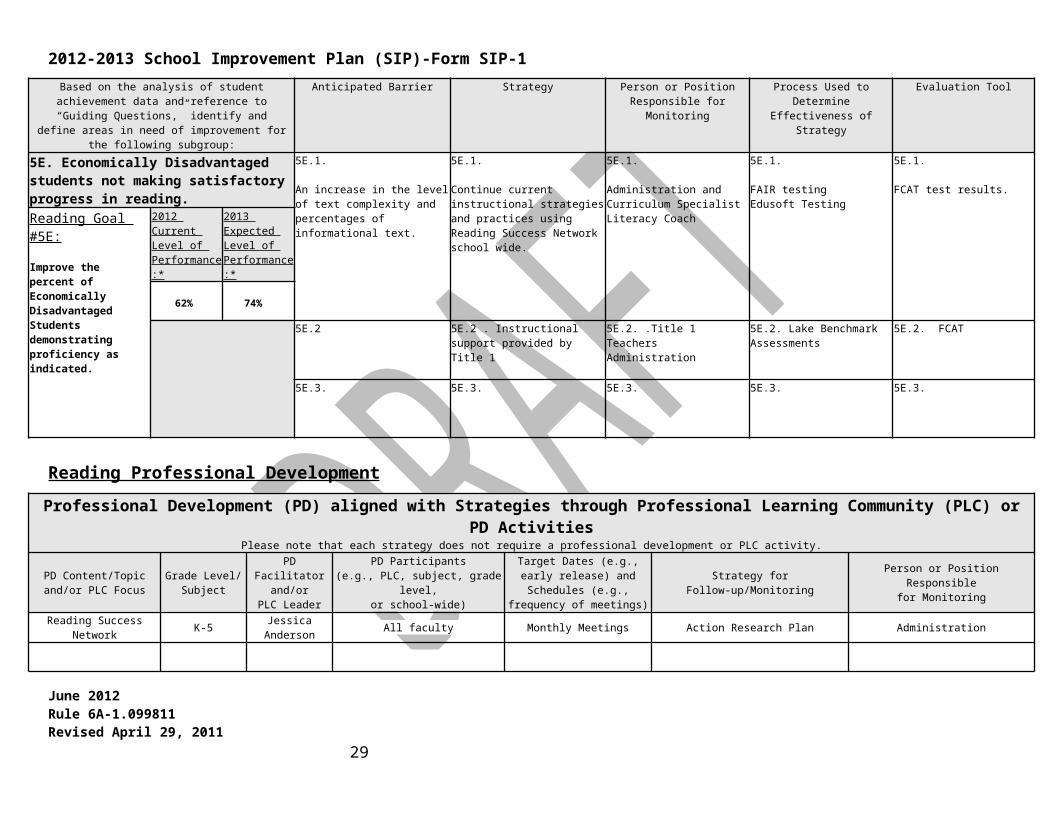
5E. Economically Disadvantaged students not making satisfactory progress in reading.
5E.1.
An increase in the level of text complexity and percentages of informational text.
5E.1.
Continue current instructional strategies and practices using Reading Success Network school wide.
5E.1.
Administration and Curriculum SpecialistLiteracy Coach
5E.1.
FAIR testingEdusoft Testing
5E.1.
FCAT test results.Reading Goal #5E:
Improve the percent of Economically Disadvantaged Students demonstrating proficiency as indicated.
2012 Current Level of Performance:*
2013 Expected Level of Performance:*
62% 74%
5E.2 5E.2 . Instructional support provided by Title 1
5E.2. .Title 1 TeachersAdministration
5E.2. Lake Benchmark Assessments
5E.2. FCAT
5E.3. 5E.3. 5E.3. 5E.3. 5E.3.
Reading Professional DevelopmentProfessional Development (PD) aligned with Strategies through Professional Learning Community (PLC) or PD Activities
Please note that each strategy does not require a professional development or PLC activity.
PD Content/Topicand/or PLC Focus
Grade Level/ Subject
PD Facilitatorand/or
PLC Leader
PD Participants(e.g., PLC, subject, grade level,
or school-wide)
Target Dates (e.g., early release) and Schedules (e.g., frequency of
meetings)Strategy for Follow-up/Monitoring Person or Position Responsible
for Monitoring
Reading Success Network K-5 Jessica Anderson All faculty Monthly Meetings Action Research Plan Administration
June 2012Rule 6A-1.099811Revised April 29, 2011
18

2012-2013 School Improvement Plan (SIP)-Form SIP-1
Reading Budget (Insert rows as needed)Include only school funded activities/materials and exclude district funded activities/materials.Evidence-based Program(s)/Materials(s)Strategy Description of Resources Funding Source AmountReading Success Network Stipends for in-service Title 1 $9,000.00
Subtotal: $9,000.00TechnologyStrategy Description of Resources Funding Source AmountIncrease Independent Reading Ticket to Read S.A.I. $3500.00
Subtotal: $3,500.00Professional DevelopmentStrategy Description of Resources Funding Source Amount
Subtotal:OtherStrategy Description of Resources Funding Source Amount
Subtotal: Total: $12,500.00
End of Reading Goals
June 2012Rule 6A-1.099811Revised April 29, 2011
19

2012-2013 School Improvement Plan (SIP)-Form SIP-1
Comprehensive English Language Learning Assessment (CELLA) Goals* When using percentages, include the number of students the percentage represents (e.g., 70% [35]).
CELLA Goals Problem-Solving Process to Increase Language AcquisitionStudents speak in English and understand spoken English at grade level in a manner similar to non-ELL students.
Anticipated Barrier Strategy Person or Position Responsible for Monitoring
Process Used to Determine Effectiveness of Strategy
Evaluation Tool
1. Students scoring proficient in listening/speaking. 43%
1.1.
The mobility rate of ELL students and the limited use of English in the homes.
1.1.
ELL strategies implemented in class and documented in lesson plans.Continued use of ESOL assistant to support students and families.
1.1.
Administration
1.1.
FAIR TestingEdusoft TestingClassroom Observations
1.1.
CELLA TestCELLA Goal #1:
All ELL students entering in kindergarten will be proficient in listening/speaking by the time they exit the 5th grade.
2012 Current Percent of Students Proficient in Listening/Speaking:
43%
1.2. 1.2. 1.2. 1.2. 1.2.
1.3. 1.3. 1.3. 1.3. 1.3.
Students read grade-level text in English in a manner similar to non-ELL students.
Anticipated Barrier Strategy Person or Position Responsible for Monitoring
Process Used to Determine Effectiveness of Strategy
Evaluation Tool
2. Students scoring proficient in reading. 32%
2.1.
The mobility rate of ELL students and the limited use of English in the homes.
2.1.
ELL strategies implemented in class and documented in lesson plans.Continued use of ESOL assistant to support students and families.Title 1 Reading Resources
2.1.
Administration
2.1.
FAIR TestingEdusoft TestingClassroom Observations
2.1.
CELLA TestCELLA Goal #2:
All ELL students entering in kindergarten will be proficient in reading by the time they exit the 5th grade.
2012 Current Percent of Students Proficient in Reading:
32%.
2.2. 2.2. 2.2. 2.2. 2.2.
2.3. 2.3. 2.3. 2.3. 2.3.
June 2012Rule 6A-1.099811Revised April 29, 2011
20

2012-2013 School Improvement Plan (SIP)-Form SIP-1Students write in English at grade level in a manner
similar to non-ELL students.Anticipated Barrier Strategy Person or Position
Responsible for MonitoringProcess Used to Determine Effectiveness of Strategy
Evaluation Tool
3. Students scoring proficient in writing. 30%
2.1.
The mobility rate of ELL students and the limited use of English in the homes.
2.1.
ELL strategies implemented in class and documented in lesson plans.Continued use of ESOL assistant to support students and families.
2.1.
Administration
2.1.
FAIR TestingEdusoft TestingClassroom Observations
2.1.
CELLA TestCELLA Goal #3:
All ELL students entering in kindergarten will increase by one proficiency level by the time they exit the fifth grade.
2012 Current Percent of Students Proficient in Writing :
30%
2.2. 2.2. 2.2. 2.2. 2.2.
2.3. 2.3. 2.3. 2.3. 2.3.
June 2012Rule 6A-1.099811Revised April 29, 2011
21
2012-2013 School Improvement Plan (SIP)-Form SIP-1
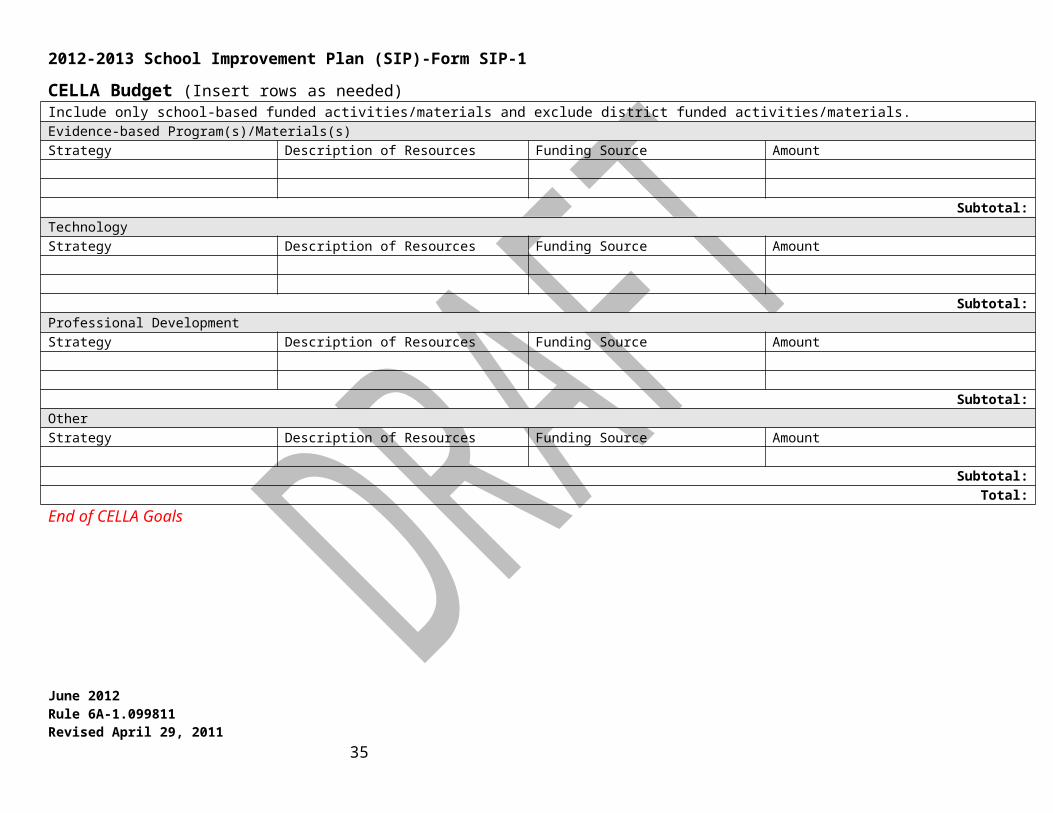
CELLA Budget (Insert rows as needed)Include only school-based funded activities/materials and exclude district funded activities/materials.Evidence-based Program(s)/Materials(s)Strategy Description of Resources Funding Source Amount
Subtotal:TechnologyStrategy Description of Resources Funding Source Amount
Subtotal:Professional DevelopmentStrategy Description of Resources Funding Source Amount
Subtotal:OtherStrategy Description of Resources Funding Source Amount
Subtotal: Total:
End of CELLA Goals
June 2012Rule 6A-1.099811Revised April 29, 2011
22
2012-2013 School Improvement Plan (SIP)-Form SIP-1
Elementary School Mathematics Goals* When using percentages, include the number of students the percentage represents (e.g., 70% [35]).
Elementary Mathematics Goals Problem-Solving Process to Increase Student AchievementBased on the analysis of student achievement data and
reference to “Guiding Questions,” identify and define areas in need of improvement for the following group:
Anticipated Barrier Strategy Person or Position Responsible for Monitoring
Process Used to Determine Effectiveness of Strategy
Evaluation Tool
1A. FCAT 2.0: Students scoring at Achievement Level 3 in mathematics. 72%
1A.1.
Computerized test at the 5th grade level.
Insufficient current school technology.
1A.1.
Continue full implementation the resources available in the new math series.Implement more computerized testing.
1A.1.
AdministrationCurriculum Specialist
1A.1.
Edusoft Testing
1A.1.
FCAT results.Mathematics Goal #1A:
To maintain or increase student proficiency of 72%.(Continue to maintain proficiency level above district and state average.)
2012 Current Level of Performance:*
2013 Expected Level of Performance:*
72% (284)
≥ 72% (281)
1A.2. 1A.2. 1A.2. 1A.2. 1A.2.
1A.3. 1A.3. 1A.3. 1A.3. 1A.3.
1B. Florida Alternate Assessment: Students scoring at Levels 4, 5, and 6 in mathematics. 40%
1B.1. 1B.1. 1B.1. 1B.1. 1B.1.
Mathematics Goal #1B:
Providing this data violates student confidentiality.
2012 Current Level of Performance:*
2013 Expected Level of Performance:*
1B.2. 1B.2. 1B.2. 1B.2. 1B.2.
1B.3. 1B.3. 1B.3. 1B.3. 1B.3.
June 2012Rule 6A-1.099811Revised April 29, 2011
23

2012-2013 School Improvement Plan (SIP)-Form SIP-1
Elementary School Mathematics Goals* When using percentages, include the number of students the percentage represents (e.g., 70% [35]).
Elementary Mathematics Goals Problem-Solving Process to Increase Student AchievementBased on the analysis of student achievement data and
reference to “Guiding Questions,” identify and define areas in need of improvement for the following group:
Anticipated Barrier Strategy Person or Position Responsible for Monitoring
Process Used to Determine Effectiveness of Strategy
Evaluation Tool
1A. FCAT 2.0: Students scoring at Achievement Level 3 in mathematics.
1A.1. 1A.1. 1A.1. 1A.1. 1A.1.
Mathematics Goal #1A:
Enter narrative for the goal in this box.
2012 Current Level of Performance:*
2013 Expected Level of Performance:*
Enter numerical data for current level of performance in this box.
Enter numerical data for expected level of performance in this box.
1A.2. 1A.2. 1A.2. 1A.2. 1A.2.
1A.3. 1A.3. 1A.3. 1A.3. 1A.3.
1B. Florida Alternate Assessment: Students scoring at Levels 4, 5, and 6 in mathematics.
1B.1. 1B.1. 1B.1. 1B.1. 1B.1.
Mathematics Goal #1B:
Enter narrative for the goal in this box.
2012 Current Level of Performance:*
2013 Expected Level of Performance:*
Enter numerical data for current level of performance in this box.
Enter numerical data for expected level of performance in this box.
1B.2. 1B.2. 1B.2. 1B.2. 1B.2.
1B.3. 1B.3. 1B.3. 1B.3. 1B.3.
June 2012Rule 6A-1.099811Revised April 29, 2011
24

2012-2013 School Improvement Plan (SIP)-Form SIP-1Based on the analysis of student achievement data and
reference to “Guiding Questions,” identify and define areas in need of improvement for the following group:
Anticipated Barrier Strategy Person or Position Responsible for Monitoring
Process Used to Determine Effectiveness of Strategy
Evaluation Tool
2A. FCAT 2.0: Students scoring at or above Achievement Levels 4 and 5 in mathematics. 40%
2A.1.
Computerized test at the 5th grade level.
Insufficient current school technology.
2A.1.
Continue full implementation of the resources available in the new math series.
Implement more computerized testing.
Enrichment instructional strategies provided by teachers.
2A.1.
AdministrationCurriculum Specialist
2A.1.
Edusoft Testing
2A.1.
FCAT results
Mathematics Goal #2A:
Increase the percentage of students scoring at or above level 4 in mathematics by one percent.
2012 Current Level of Performance:*
2013 Expected Level of Performance:*
41% (162)
≥42% (164)
2A.2. 2A.2. 2A.2. 2A.2. 2A.2.
2A.3. 2A.3. 2A.3. 2A.3. 2A.3.
2B. Florida Alternate Assessment: Students scoring at or above Level 7 in mathematics.
2B.1. 2B.1. 2B.1. 2B.1. 2B.1.
Mathematics Goal #2B:
Providing this data violates student confidentiality.
2012 Current Level of Performance:*
2013 Expected Level of Performance:*
Enter numerical data for current level of performance in this box.
Enter numerical data for expected level of performance in this box.
2B.2. 2B.2. 2B.2. 2B.2. 2B.2.
2B.3. 2B.3. 2B.3. 2B.3. 2B.3.
June 2012Rule 6A-1.099811Revised April 29, 2011
25

2012-2013 School Improvement Plan (SIP)-Form SIP-1Based on the analysis of student achievement data and
reference to “Guiding Questions,” identify and define areas in need of improvement for the following group:
Anticipated Barrier Strategy Person or Position Responsible for Monitoring
Process Used to Determine Effectiveness of Strategy
Evaluation Tool
3A. FCAT 2.0: Percentage of students making learning gains in mathematics. 75%
3A.1.
Computerized test at 5th grade level.
Insufficient current school technology.
3A.1.
Continue full implementation the resources available in the new math series.
Implement more computerized testing.
Enrichment instructional strategies provided by teachers.
3A.1.
Administration Curriculum Specialist
3A.1.
Edusoft Testing
3A.1.
FCAT ResultsMathematics Goal #3A:
Maintain or increase student proficiency of 75%.
Continue to maintain proficiency level above district and state averages.
2012 Current Level of Performance:*
2013 Expected Level of Performance:*
75% (296)
≥ 75% (293)
3A.2. 3A.2. 3A.2. 3A.2. 3A.2.
3A.3. 3A.3. 3A.3. 3A.3. 3A.3.
3B. Florida Alternate Assessment: Percentage of students making learning gains in mathematics.
3B.1. 3B.1. 3B.1. 3B.1. 3B.1.
Mathematics Goal #3B:
Providing this data violates student confidentiality.
2012 Current Level of Performance:*
2013 Expected Level of Performance:*
Enter numerical data for current level of performance in this box.
Enter numerical data for expected level of performance in this box.
3B.2. 3B.2. 3B.2. 3B.2. 3B.2.
3B.3. 3B.3. 3B.3. 3B.3. 3B.3.
June 2012Rule 6A-1.099811Revised April 29, 2011
26

2012-2013 School Improvement Plan (SIP)-Form SIP-1Based on the analysis of student achievement data and
reference to “Guiding Questions,” identify and define areas in need of improvement for the following group:
Anticipated Barrier Strategy Person or Position Responsible for Monitoring
Process Used to Determine Effectiveness of Strategy
Evaluation Tool
4A. FCAT 2.0: Percentage of students in lowest 25% making learning gains in mathematics. 69%
4A.1.
Computerized test at 5th grade level.
Insufficient current school technology.
4A.1.
Continue full implementation of the resources available in the new math series. For example: Go Math
Implement Instructional support through technology.
Morning Math – Intensive Instruction
4A.1.
AdministrationCurriculum Specialist
4A.1.
Edusoft Testing
4A.1.
FCAT Results
Mathematics Goal #4A:
Maintain or increase student proficiency of 69%.
Continue to maintain proficiency level above district and state averages.
2012 Current Level of Performance:*
2013 Expected Level of Performance:*
69% (93)
≥69% (93)
4A.2. 4A.2. 4A.2. 4A.2. 4A.2.
4A.3. 4A.3. 4A.3. 4A.3. 4A.3.
4B. Florida Alternate Assessment: Percentage of students in lowest 25% making learning gains in mathematics.
4B.1. 4B.1. 4B.1. 4B.1. 4B.1.
Mathematics Goal #4B:
Providing this data violates student confidentiality.
2012 Current Level of Performance:*
2013 Expected Level of Performance:*
Enter numerical data for current level of performance in this box.
Enter numerical data for expected level of performance in this box.
4B.2. 4B.2. 4B.2. 4B.2. 4B.2.
4B.3. 4B.3. 4B.3. 4B.3. 4B.3.
June 2012Rule 6A-1.099811Revised April 29, 2011
27
2012-2013 School Improvement Plan (SIP)-Form SIP-1Based on ambitious but achievable Annual Measurable Objectives (AMOs), identify reading and mathematics
performance target for the following years
2011-2012 2012-2013 2013-2014 2014-2015 2015-2016 2016-2017
5A. In six years school will reduce their achievement gap by 50%.
Baseline data 2010-2011
74%(285) 72%
(284) 78% (304)
81% 83% 85% 87%
Mathematics Goal #5A:
Meet or exceed the annual AMO increases in students demonstrating proficiency in Math each year.
Based on the analysis of student achievement data and reference to “Guiding Questions,” identify and define areas
in need of improvement for the following subgroups:
Anticipated Barrier Strategy Person or Position Responsible for Monitoring
Process Used to Determine Effectiveness of Strategy
Evaluation Tool
5B. Student subgroups by ethnicity (White, Black, Hispanic, Asian, American Indian) not making satisfactory progress in mathematics.
5B.1.White:Black:Hispanic:Asian:American Indian:
Computerized test at the 5th grade level
Insufficient current school technology
5B.1.
Continue full implementation of the resources available in the new math series.
Implement more computerized testing
Morning Math – Intensive Instruction
5B.1.
AdministrationCurriculum Specialist
5B.1.
Edusoft Testing
5B.1.
FCAT results
Mathematics Goal #5B:
Maintain or improve student proficiency levels in subgroups by levels indicated by subgroups.
2012 Current Level of Performance:*
2013 Expected Level of Performance:*
Enter numerical data for current level of performance in this box.White: 73%Black: 61%Hispanic: 70%Asian:American Indian:
Enter numerical data for expected level of performance in this box.White: 80%Black: 63%Hispanic: 77%Asian:American Indian:
5B.2. 5B.2. 5B.2. 5B.2. 5B.2.
5B.3. 5B.3. 5B.3. 5B.3. 5B.3.
June 2012Rule 6A-1.099811Revised April 29, 2011
28
2012-2013 School Improvement Plan (SIP)-Form SIP-1Based on the analysis of student achievement data and
reference to “Guiding Questions,” identify and define areas in need of improvement for the following subgroup:
Anticipated Barrier Strategy Person or Position Responsible for Monitoring
Process Used to Determine Effectiveness of Strategy
Evaluation Tool
5C. English Language Learners (ELL) not making satisfactory progress in mathematics.
5C.1.
Computerized test at the 5th grade level.
Insufficient current school technology.
5C.1.
Continue full implementation the resources available in the new math series.Implement more computerized testing.Morning Math – Intensive Instruction
5C.1.
AdministrationCurriculum Specialist
5C.1.
Edusoft Testing
5C.1.
FCAT results.Mathematics Goal #5C:
Improve the percent of ELL students demonstrating proficiency as indicated
2012 Current Level of Performance:*
2013 Expected Level of Performance:*
64% ≥64%
5C.2.
Computerized test at the 5th grade level.
Insufficient current school technology.
5C.2. Instructional support provided by ESOL Assistant
5C.2. ESOL AssistantSchool Administration
5C.2. Lake Benchmark Assessments
5C.2. FCAT
5C.3. 5C.3. 5C.3. 5C.3. 5C.3.
Based on the analysis of student achievement data and reference to “Guiding Questions,” identify and define areas
in need of improvement for the following subgroup:
Anticipated Barrier Strategy Person or Position Responsible for Monitoring
Process Used to Determine Effectiveness of Strategy
Evaluation Tool
5D. Students with Disabilities (SWD) not making satisfactory progress in mathematics.
5D.1.
Computerized test at the 5th grade level.
Insufficient current school technology.
5D.1.
Continue full implementation the resources available in the new math series.Implement more computerized testing.Morning Math – Intensive Instruction
5D.1.
AdministrationCurriculum Specialist
5D.1.
Edusoft Testing
5D.1.
FCAT results.Mathematics Goal #5D:
Improve the percent of Students With Disabilities demonstrating proficiency as indicated.
2012 Current Level of Performance:*
2013 Expected Level of Performance:*
37% 55%
5D.2.
Computerized test at the 5th grade level.
Insufficient current school technology.
5D.2. Instructional support provided by ESE teachers.
5D.2. ESE TeachersSchool Administration
5D.2. Lake Benchmark Assessments
5D.2. FCAT
5D.3. 5D.3. 5D.3. 5D.3. 5D.3.
June 2012Rule 6A-1.099811Revised April 29, 2011
29

2012-2013 School Improvement Plan (SIP)-Form SIP-1Based on the analysis of student achievement data and
reference to “Guiding Questions,” identify and define areas in need of improvement for the following subgroup:
Anticipated Barrier Strategy Person or Position Responsible for Monitoring
Process Used to Determine Effectiveness of Strategy
Evaluation Tool
5E. Economically Disadvantaged students not making satisfactory progress in mathematics.
5E.1.
Computerized test at the 5th grade level.
Insufficient current school technology.
5E.1.
Continue full implementation the resources available in the new math series.Implement more computerized testing.
5E.1.
AdministrationCurriculum Specialist
5E.1.
Edusoft Testing
5E.1.
FCAT results.Mathematics Goal #5E:
Improve the percent of Economically Disadvantaged Students demonstrating proficiency as indicated.
2012 Current Level of Performance:*
2013 Expected Level of Performance:*
67% 77%
5E.2.Computerized test at the 5th grade level.
Insufficient current school technology.
5E.2. Morning Math Tutoring – Intensive Instruction
5E.2 Curriculum Resource TeacherSchool Administration
5E.2. . Lake Benchmark Assessments
5E.2. FCAT
5E.3. 5E.3. 5E.3. 5E.3. 5E.3.
End of Elementary School Mathematics Goals
June 2012Rule 6A-1.099811Revised April 29, 2011
30

2012-2013 School Improvement Plan (SIP)-Form SIP-1
Middle School Mathematics Goals* When using percentages, include the number of students the percentage represents (e.g., 70% [35]).
Middle School Mathematics Goals Problem-Solving Process to Increase Student AchievementBased on the analysis of student achievement data and
reference to “Guiding Questions,” identify and define areas in need of improvement for the following group:
Anticipated Barrier Strategy Person or Position Responsible for Monitoring
Process Used to Determine Effectiveness of Strategy
Evaluation Tool
1A. FCAT 2.0: Students scoring at Achievement Level 3 in mathematics.
1A.1. 1A.1. 1A.1. 1A.1. 1A.1.
Mathematics Goal #1A:
Enter narrative for the goal in this box.
2012 Current Level of Performance:*
2013 Expected Level of Performance:*
Enter numerical data for current level of performance in this box.
Enter numerical data for expected level of performance in this box.
1A.2. 1A.2. 1A.2. 1A.2. 1A.2.
1A.3. 1A.3. 1A.3. 1A.3. 1A.3.
1B. Florida Alternate Assessment: Students scoring at Levels 4, 5, and 6 in mathematics.
1B.1. 1B.1. 1B.1. 1B.1. 1B.1.
Mathematics Goal #1B:
Enter narrative for the goal in this box.
2012 Current Level of Performance:*
2013 Expected Level of Performance:*
Enter numerical data for current level of performance in this box.
Enter numerical data for expected level of performance in this box.
1B.2. 1B.2. 1B.2. 1B.2. 1B.2.
1B.3. 1B.3. 1B.3. 1B.3. 1B.3.
June 2012Rule 6A-1.099811Revised April 29, 2011
31

2012-2013 School Improvement Plan (SIP)-Form SIP-1Based on the analysis of student achievement data and
reference to “Guiding Questions,” identify and define areas in need of improvement for the following group:
Anticipated Barrier Strategy Person or Position Responsible for Monitoring
Process Used to Determine Effectiveness of Strategy
Evaluation Tool
2A. FCAT 2.0: Students scoring at or above Achievement Levels 4 and 5 in mathematics.
2A.1. 2A.1. 2A.1. 2A.1. 2A.1.
Mathematics Goal #2A:
Enter narrative for the goal in this box.
2012 Current Level of Performance:*
2013 Expected Level of Performance:*
Enter numerical data for current level of performance in this box.
Enter numerical data for expected level of performance in this box.
2A.2. 2A.2. 2A.2. 2A.2. 2A.2.
2A.3. 2A.3. 2A.3. 2A.3. 2A.3.
2B. Florida Alternate Assessment: Students scoring at or above Level 7 in mathematics.
2B.1. 2B.1. 2B.1. 2B.1. 2B.1.
Mathematics Goal #2B:
Enter narrative for the goal in this box.
2012 Current Level of Performance:*
2013 Expected Level of Performance:*
Enter numerical data for current level of performance in this box.
Enter numerical data for expected level of performance in this box.
2B.2. 2B.2. 2B.2. 2B.2. 2B.2.
2B.3. 2B.3. 2B.3. 2B.3. 2B.3.
June 2012Rule 6A-1.099811Revised April 29, 2011
32

2012-2013 School Improvement Plan (SIP)-Form SIP-1Based on the analysis of student achievement data and
reference to “Guiding Questions,” identify and define areas in need of improvement for the following group:
Anticipated Barrier Strategy Person or Position Responsible for Monitoring
Process Used to Determine Effectiveness of Strategy
Evaluation Tool
3A. FCAT 2.0: Percentage of students making learning gains in mathematics.
3A.1. 3A.1. 3A.1. 3A.1. 3A.1.
Mathematics Goal #3A:
Enter narrative for the goal in this box.
2012 Current Level of Performance:*
2013 Expected Level of Performance:*
Enter numerical data for current level of performance in this box.
Enter numerical data for expected level of performance in this box.
3A.2. 3A.2. 3A.2. 3A.2. 3A.2.
3A.3. 3A.3. 3A.3. 3A.3. 3A.3.
3B. Florida Alternate Assessment: Percentage of students making learning gains in mathematics.
3B.1. 3B.1. 3B.1. 3B.1. 3B.1.
Mathematics Goal #3B:
Enter narrative for the goal in this box.
2012 Current Level of Performance:*
2013 Expected Level of Performance:*
Enter numerical data for current level of performance in this box.
Enter numerical data for expected level of performance in this box.
3B.2. 3B.2. 3B.2. 3B.2. 3B.2.
3B.3. 3B.3. 3B.3. 3B.3. 3B.3.
June 2012Rule 6A-1.099811Revised April 29, 2011
33

2012-2013 School Improvement Plan (SIP)-Form SIP-1Based on the analysis of student achievement data and
reference to “Guiding Questions,” identify and define areas in need of improvement for the following group:
Anticipated Barrier Strategy Person or Position Responsible for Monitoring
Process Used to Determine Effectiveness of Strategy
Evaluation Tool
4A. FCAT 2.0: Percentage of students in lowest 25% making learning gains in mathematics.
4A.1. 4A.1. 4A.1. 4A.1. 4A.1.
Mathematics Goal #4A:
Enter narrative for the goal in this box.
2012 Current Level of Performance:*
2013 Expected Level of Performance:*
Enter numerical data for current level of performance in this box.
Enter numerical data for expected level of performance in this box.
4A.2. 4A.2. 4A.2. 4A.2. 4A.2.
4A.3. 4A.3. 4A.3. 4A.3. 4A.3.
4B. Florida Alternate Assessment: Percentage of students in lowest 25% making learning gains in mathematics.
4B.1. 4B.1. 4B.1. 4B.1. 4B.1.
Mathematics Goal #4B:
Enter narrative for the goal in this box.
2012 Current Level of Performance:*
2013 Expected Level of Performance:*
Enter numerical data for current level of performance in this box.
Enter numerical data for expected level of performance in this box.
4B.2. 4B.2. 4B.2. 4B.2. 4B.2.
4B.3. 4B.3. 4B.3. 4B.3. 4B.3.
June 2012Rule 6A-1.099811Revised April 29, 2011
34
2012-2013 School Improvement Plan (SIP)-Form SIP-1Based on ambitious but achievable Annual Measurable Objectives (AMOs), identify reading and mathematics
performance target for the following years
2011-2012 2012-2013 2013-2014 2014-2015 2015-2016 2016-2017
5A. In six years, school will reduce their achievement gap by 50%.
Baseline data 2010-2011
Mathematics Goal #5A:
Enter narrative for the goal in this box.
Based on the analysis of student achievement data and reference to “Guiding Questions,” identify and define areas
in need of improvement for the following subgroups:
Anticipated Barrier Strategy Person or Position Responsible for Monitoring
Process Used to Determine Effectiveness of Strategy
Evaluation Tool
5B. Student subgroups by ethnicity (White, Black, Hispanic, Asian, American Indian) not making satisfactory progress in mathematics.
5B.1.White:Black:Hispanic:Asian:American Indian:
5B.1. 5B.1. 5B.1. 5B.1.
Mathematics Goal #5B:
Enter narrative for the goal in this box.
2012 Current Level of Performance:*
2013 Expected Level of Performance:*
Enter numerical data for current level of performance in this box.White:Black:Hispanic:Asian:American Indian:
Enter numerical data for expected level of performance in this box.White:Black:Hispanic:Asian:American Indian:
5B.2. 5B.2. 5B.2. 5B.2. 5B.2.
5B.3. 5B.3. 5B.3. 5B.3. 5B.3.
June 2012Rule 6A-1.099811Revised April 29, 2011
35

2012-2013 School Improvement Plan (SIP)-Form SIP-1Based on the analysis of student achievement data and
reference to “Guiding Questions,” identify and define areas in need of improvement for the following subgroup:
Anticipated Barrier Strategy Person or Position Responsible for Monitoring
Process Used to Determine Effectiveness of Strategy
Evaluation Tool
5C. English Language Learners (ELL) not making satisfactory progress in mathematics.
5C.1. 5C.1. 5C.1. 5C.1. 5C.1.
Mathematics Goal #5C:
Enter narrative for the goal in this box.
2012 Current Level of Performance:*
2013 Expected Level of Performance:*
Enter numerical data for current level of performance in this box.
Enter numerical data for expected level of performance in this box.
5C.2. 5C.2. 5C.2. 5C.2. 5C.2.
5C.3. 5C.3. 5C.3. 5C.3. 5C.3.
Based on the analysis of student achievement data and reference to “Guiding Questions,” identify and define areas
in need of improvement for the following subgroup:
Anticipated Barrier Strategy Person or Position Responsible for Monitoring
Process Used to Determine Effectiveness of Strategy
Evaluation Tool
5D. Students with Disabilities (SWD) not making satisfactory progress in mathematics.
5D.1. 5D.1. 5D.1. 5D.1. 5D.1.
Mathematics Goal #5D:
Enter narrative for the goal in this box.
2012 Current Level of Performance:*
2013 Expected Level of Performance:*
Enter numerical data for current level of performance in this box.
Enter numerical data for expected level of performance in this box.
5D.2. 5D.2. 5D.2. 5D.2. 5D.2.
5D.3. 5D.3. 5D.3. 5D.3. 5D.3.
June 2012Rule 6A-1.099811Revised April 29, 2011
36

2012-2013 School Improvement Plan (SIP)-Form SIP-1Based on the analysis of student achievement data and
reference to “Guiding Questions,” identify and define areas in need of improvement for the following subgroup:
Anticipated Barrier Strategy Person or Position Responsible for Monitoring
Process Used to Determine Effectiveness of Strategy
Evaluation Tool
5E. Economically Disadvantaged students not making satisfactory progress in mathematics.
5E.1. 5E.1. 5E.1. 5E.1. 5E.1.
Mathematics Goal #5E:
Enter narrative for the goal in this box.
2012 Current Level of Performance:*
2013 Expected Level of Performance:*
Enter numerical data for current level of performance in this box.
Enter numerical data for expected level of performance in this box.
5E.2. 5E.2. 5E.2. 5E.2. 5E.2.
5E.3. 5E.3. 5E.3. 5E.3. 5E.3.
End of Middle School Mathematics Goals
June 2012Rule 6A-1.099811Revised April 29, 2011
37

2012-2013 School Improvement Plan (SIP)-Form SIP-1
Florida Alternate Assessment High School Mathematics Goals* When using percentages, include the number of students the percentage represents (e.g., 70% [35]).
High School Mathematics Goals Problem-Solving Process to Increase Student AchievementBased on the analysis of student achievement data and
reference to “Guiding Questions,” identify and define areas in need of improvement for the following group:
Anticipated Barrier Strategy Person or Position Responsible for Monitoring
Process Used to Determine Effectiveness of Strategy
Evaluation Tool
1. Florida Alternate Assessment: Students scoring at Levels 4, 5, and 6 in mathematics.
1.1. 1.1. 1.1. 1.1. 1.1.
Mathematics Goal #1:
Enter narrative for the goal in this box.
2012 Current Level of Performance:*
2013 Expected Level of Performance:*
Enter numerical data for current level of performance in this box.
Enter numerical data for expected level of performance in this box.
1.2. 1.2. 1.2. 1.2. 1.2.
1.3. 1.3. 1.3. 1.3. 1.3.
Based on the analysis of student achievement data and reference to “Guiding Questions,” identify and define areas
in need of improvement for the following group:
Anticipated Barrier Strategy Person or Position Responsible for Monitoring
Process Used to Determine Effectiveness of Strategy
Evaluation Tool
2. Florida Alternate Assessment: Students scoring at or above Level 7 in mathematics.
2.1. 2.1. 2.1. 2.1. 2.1.
Mathematics Goal #2:
Enter narrative for the goal in this box.
2012 Current Level of Performance:*
2013 Expected Level of Performance:*
Enter numerical data for current level of performance in this box.
Enter numerical data for expected level of performance in this box.
2.2. 2.2. 2.2. 2.2. 2.2.
2.3. 2.3. 2.3. 2.3. 2.3.
June 2012Rule 6A-1.099811Revised April 29, 2011
38

2012-2013 School Improvement Plan (SIP)-Form SIP-1Based on the analysis of student achievement data and
reference to “Guiding Questions,” identify and define areas in need of improvement for the following group:
Anticipated Barrier Strategy Person or Position Responsible for Monitoring
Process Used to Determine Effectiveness of Strategy
Evaluation Tool
3. Florida Alternate Assessment: Percentage of students making learning gains in mathematics.
3.1. 3.1. 3.1. 3.1. 3.1.
Mathematics Goal #3:
Enter narrative for the goal in this box.
2012 Current Level of Performance:*
2013 Expected Level of Performance:*
Enter numerical data for current level of performance in this box.
Enter numerical data for expected level of performance in this box.
3.2. 3.2. 3.2. 3.2. 3.2.
3.3. 3.3. 3.3. 3.3. 3.3.
Based on the analysis of student achievement data and reference to “Guiding Questions,” identify and define areas
in need of improvement for the following group:
Anticipated Barrier Strategy Person or Position Responsible for Monitoring
Process Used to Determine Effectiveness of Strategy
Evaluation Tool
4. Florida Alternate Assessment: Percentage of students in lowest 25% making learning gains in mathematics.
4.1. 4.1. 4.1. 4.1. 4.1.
Mathematics Goal #4:
Enter narrative for the goal in this box.
2012 Current Level of Performance:*
2013 Expected Level of Performance:*
Enter numerical data for current level of performance in this box.
Enter numerical data for expected level of performance in this box.
4.2. 4.2. 4.2. 4.2. 4.2.
4.3. 4.3. 4.3. 4.3. 4.3.
End of Florida Alternate Assessment High School Mathematics Goals
June 2012Rule 6A-1.099811Revised April 29, 2011
39

2012-2013 School Improvement Plan (SIP)-Form SIP-1
Algebra 1 End-of-Course (EOC) Goals (this section needs to be completed by all schools that have students taking the Algebra I EOC)* When using percentages, include the number of students the percentage represents (e.g., 70% [35]).
Algebra 1 EOC Goals Problem-Solving Process to Increase Student AchievementBased on the analysis of student achievement data and reference to “Guiding Questions,” identify and define areas in need of improvement for the following group:
Anticipated Barrier Strategy Person or Position Responsible for Monitoring
Process Used to Determine Effectiveness of
Strategy
Evaluation Tool
1. Students scoring at Achievement Level 3 in Algebra 1.
1.1. 1.1. 1.1. 1.1. 1.1.
Algebra 1 Goal #1:
Enter narrative for the goal in this box.
2012 Current Level of Performance:*
2013 Expected Level of Performance:*
Enter numerical data for current level of performance in this box.
Enter numerical data for expected level of performance in this box.
1.2. 1.2. 1.2. 1.2. 1.2.
1.3. 1.3. 1.3. 1.3. 1.3.
Based on the analysis of student achievement data and reference to “Guiding Questions,” identify and define areas in need of improvement for the following group:
Anticipated Barrier Strategy Person or Position Responsible for Monitoring
Process Used to Determine Effectiveness of Strategy
Evaluation Tool
2. Students scoring at or above Achievement Levels 4 and 5 in Algebra 1.
2.1. 2.1. 2.1. 2.1. 2.1.
Algebra Goal #2:
Enter narrative for the goal in this box.
2012 Current Level of Performance:*
2013 Expected Level of Performance:*
Enter numerical data for current level of performance in this box.
Enter numerical data for expected level of performance in this box.
2.2. 2.2. 2.2. 2.2. 2.2.
2.3. 2.3. 2.3. 2.3. 2.3.
June 2012Rule 6A-1.099811Revised April 29, 2011
40

2012-2013 School Improvement Plan (SIP)-Form SIP-1Based on ambitious but achievable Annual Measurable Objectives (AMOs), identify reading and mathematics
performance target for the following years
2011-2012 2012-2013 2013-2014 2014-2015 2015-2016 2016-2017
3A. In six years, school will reduce their achievement gap by 50%.
Baseline data 2010-2011
Algebra 1 Goal #3A:
Enter narrative for the goal in this box.
Based on the analysis of student achievement data and reference to “Guiding Questions,” identify and define
areas in need of improvement for the following subgroups:
Anticipated Barrier Strategy Person or Position Responsible for Monitoring
Process Used to Determine Effectiveness of Strategy
Evaluation Tool
3B. Student subgroups by ethnicity (White, Black, Hispanic, Asian, American Indian) not making satisfactory progress in Algebra 1.
3B.1.White:Black:Hispanic:Asian:American Indian:
3B.1. 3B.1. 3B.1. 3B.1.
Algebra 1 Goal #3B:
Enter narrative for the goal in this box.
2012 Current Level of Performance:*
2013 Expected Level of Performance:*
Enter numerical data for current level of performance in this box.White:Black:Hispanic:Asian:American Indian:
Enter numerical data for expected level of performance in this box.White:Black:Hispanic:Asian:American Indian:
3B.2. 3B.2. 3B.2. 3B.2. 3B.2.
3B.3. 3B.3. 3B.3. 3B.3. 3B.3.
June 2012Rule 6A-1.099811Revised April 29, 2011
41

2012-2013 School Improvement Plan (SIP)-Form SIP-1Based on the analysis of student achievement data and reference to “Guiding Questions,” identify and define
areas in need of improvement for the following subgroup:
Anticipated Barrier Strategy Person or Position Responsible for Monitoring
Process Used to Determine Effectiveness of Strategy
Evaluation Tool
3C. English Language Learners (ELL) not making satisfactory progress in Algebra 1.
3C.1. 3C.1. 3C.1. 3C.1. 3C.1.
Algebra 1 Goal #3C:
Enter narrative for the goal in this box.
2012 Current Level of Performance:*
2013 Expected Level of Performance:*
Enter numerical data for current level of performance in this box.
Enter numerical data for expected level of performance in this box.
3C.2. 3C.2. 3C.2. 3C.2. 3C.2.
3C.3. 3C.3. 3C.3. 3C.3. 3C.3.
Based on the analysis of student achievement data and reference to “Guiding Questions,” identify and define
areas in need of improvement for the following subgroup:
Anticipated Barrier Strategy Person or Position Responsible for Monitoring
Process Used to Determine Effectiveness of Strategy
Evaluation Tool
3D. Students with Disabilities (SWD) not making satisfactory progress in Algebra 1.
3D.1. 3D.1. 3D.1. 3D.1. 3D.1.
Algebra 1 Goal #3D:
Enter narrative for the goal in this box.
2012 Current Level of Performance:*
2013 Expected Level of Performance:*
Enter numerical data for current level of performance in this box.
Enter numerical data for expected level of performance in this box.
3D.2. 3D.2. 3D.2. 3D.2. 3D.2.
3D.3. 3D.3. 3D.3. 3D.3. 3D.3.
June 2012Rule 6A-1.099811Revised April 29, 2011
42
2012-2013 School Improvement Plan (SIP)-Form SIP-1Based on the analysis of student achievement data and reference to “Guiding Questions,” identify and define
areas in need of improvement for the following subgroup:
Anticipated Barrier Strategy Person or Position Responsible for Monitoring
Process Used to Determine Effectiveness of Strategy
Evaluation Tool
3E. Economically Disadvantaged students not making satisfactory progress in Algebra 1.
3E.1. 3E.1. 3E.1. 3E.1. 3E.1.
Algebra 1 Goal #3E:
Enter narrative for the goal in this box.
2012 Current Level of Performance:*
2013 Expected Level of Performance:*
Enter numerical data for current level of performance in this box.
Enter numerical data for expected level of performance in this box.
3E.2. 3E.2. 3E.2. 3E.2. 3E.2.
3E.3. 3E.3. 3E.3. 3E.3. 3E.3.
End of Algebra 1 EOC Goals
June 2012Rule 6A-1.099811Revised April 29, 2011
43

2012-2013 School Improvement Plan (SIP)-Form SIP-1
Geometry End-of-Course Goals (this section needs to be completed by all schools that have students taking the Geometry EOC)* When using percentages, include the number of students the percentage represents (e.g., 70% [35]).
Geometry EOC Goals Problem-Solving Process to Increase Student AchievementBased on the analysis of student achievement data and reference to “Guiding Questions,” identify and define areas in need of improvement for the following group:
Anticipated Barrier Strategy Person or Position Responsible for Monitoring
Process Used to Determine Effectiveness of Strategy
Evaluation Tool
1. Students scoring at Achievement Level 3 in Geometry.
1.1. 1.1. 1.1. 1.1. 1.1.
Geometry Goal #1:
Enter narrative for the goal in this box.
2012 Current Level of Performance:*
2013 Expected Level of Performance:*
Enter numerical data for current level of performance in this box.
Enter numerical data for expected level of performance in this box.
1.2. 1.2. 1.2. 1.2. 1.2.
1.3. 1.3. 1.3. 1.3. 1.3.
Based on the analysis of student achievement data and reference to “Guiding Questions,” identify and define areas in need of improvement for the following group:
Anticipated Barrier Strategy Person or Position Responsible for Monitoring
Process Used to Determine Effectiveness of Strategy
Evaluation Tool
2. Students scoring at or above Achievement Levels 4 and 5 in Geometry.
2.1. 2.1. 2.1. 2.1. 2.1.
Geometry Goal #2:
Enter narrative for the goal in this box.
2012 Current Level of Performance:*
2013 Expected Level of Performance:*
Enter numerical data for current level of performance in this box.
Enter numerical data for expected level of performance in this box.
2.2. 2.2. 2.2. 2.2. 2.2.
2.3. 2.3. 2.3. 2.3. 2.3.
June 2012Rule 6A-1.099811Revised April 29, 2011
44

2012-2013 School Improvement Plan (SIP)-Form SIP-1Based on ambitious but achievable Annual Measurable Objectives (AMOs), identify reading and mathematics
performance target for the following years
2012-2013 2013-2014 2014-2015 2015-2016 2016-2017
3A. In six years, school will reduce their achievement gap by 50%.
Baseline data 2011-2012
Geometry Goal #3A:
Enter narrative for the goal in this box.
Based on the analysis of student achievement data and reference to “Guiding Questions,” identify and define
areas in need of improvement for the following subgroups:
Anticipated Barrier Strategy Person or Position Responsible for Monitoring
Process Used to Determine Effectiveness of Strategy
Evaluation Tool
3B. Student subgroups by ethnicity (White, Black, Hispanic, Asian, American Indian) not making satisfactory progress in Geometry.
3B.1.White:Black:Hispanic:Asian:American Indian:
3B.1. 3B.1. 3B.1. 3B.1.
Geometry Goal #3B:
Enter narrative for the goal in this box.
2012 Current Level of Performance:*
2013 Expected Level of Performance:*
Enter numerical data for current level of performance in this box. White:Black:Hispanic:Asian:American Indian:
Enter numerical data for expected level of performance in this box.White:Black:Hispanic:Asian:American Indian:
3B.2. 3B.2. 3B.2. 3B.2. 3B.2.
3B.3. 3B.3. 3B.3. 3B.3. 3B.3.
June 2012Rule 6A-1.099811Revised April 29, 2011
45

2012-2013 School Improvement Plan (SIP)-Form SIP-1Based on the analysis of student achievement data and reference to “Guiding Questions,” identify and define
areas in need of improvement for the following subgroup:
Anticipated Barrier Strategy Person or Position Responsible for Monitoring
Process Used to Determine Effectiveness of Strategy
Evaluation Tool
3C. English Language Learners (ELL) not making satisfactory progress in Geometry.
3C.1. 3C.1. 3C.1. 3C.1. 3C.1.
Geometry Goal #3C:
Enter narrative for the goal in this box.
2012 Current Level of Performance:*
2013 Expected Level of Performance:*
Enter numerical data for current level of performance in this box.
Enter numerical data for expected level of performance in this box.
3C.2. 3C.2. 3C.2. 3C.2. 3C.2.
3C.3. 3C.3. 3C.3. 3C.3. 3C.3.
Based on the analysis of student achievement data and reference to “Guiding Questions,” identify and define
areas in need of improvement for the following subgroup:
Anticipated Barrier Strategy Person or Position Responsible for Monitoring
Process Used to Determine Effectiveness of Strategy
Evaluation Tool
3D. Students with Disabilities (SWD) not making satisfactory progress in Geometry.
3D.1. 3D.1. 3D.1. 3D.1. 3D.1.
Geometry Goal #3D:
Enter narrative for the goal in this box.
2012 Current Level of Performance:*
2013 Expected Level of Performance:*
Enter numerical data for current level of performance in this box.
Enter numerical data for expected level of performance in this box.
3D.2. 3D.2. 3D.2. 3D.2. 3D.2.
3D.3. 3D.3. 3D.3. 3D.3. 3D.3.
June 2012Rule 6A-1.099811Revised April 29, 2011
46

2012-2013 School Improvement Plan (SIP)-Form SIP-1Based on the analysis of student achievement data and reference to “Guiding Questions,” identify and define
areas in need of improvement for the following subgroup:
Anticipated Barrier Strategy Person or Position Responsible for Monitoring
Process Used to Determine Effectiveness of Strategy
Evaluation Tool
3E. Economically Disadvantaged students not making satisfactory progress in Geometry.
3E.1. 3E.1. 3E.1. 3E.1. 3E.1.
Geometry Goal #3E:
Enter narrative for the goal in this box.
2012 Current Level of Performance:*
2013 Expected Level of Performance:*
Enter numerical data for current level of performance in this box.
Enter numerical data for expected level of performance in this box.
3E.2. 3E.2. 3E.2. 3E.2. 3E.2.
3E.3. 3E.3. 3E.3. 3E.3. 3E.3.
End of Geometry EOC Goals
Mathematics Professional DevelopmentProfessional Development (PD) aligned with Strategies through Professional Learning Community (PLC) or PD Activities
Please note that each strategy does not require a professional development or PLC activity.
PD Content/Topicand/or PLC Focus
Grade Level/ Subject
PD Facilitatorand/or
PLC Leader
PD Participants(e.g., PLC, subject, grade level,
or school-wide)
Target Dates (e.g., early release) and Schedules (e.g., frequency of
meetings)Strategy for Follow-up/Monitoring Person or Position Responsible
for Monitoring
Grade level meetings focus on Math Strategies and
Interventions.K – 5 Grade Chairs K – 5 Weekly meetings during planning
periodsWeekly strategies implemented, reviewed
and discussed. Administration
Common Core Awareness K – 5 Julie Stanton K – 5 First Semester Classroom observations and teacher lesson plans
AdministrationCurriculum Resource Teacher
Grade Level Chair
June 2012Rule 6A-1.099811Revised April 29, 2011
47

2012-2013 School Improvement Plan (SIP)-Form SIP-1
Mathematics Budget (Insert rows as needed)
Include only school-based funded activities/materials and exclude district funded activities /materials.Evidence-based Program(s)/Materials(s)Strategy Description of Resources Funding Source AmountUtilize Harcourt Math series and intervention kit Harcourt Materials District Budget
Subtotal:TechnologyStrategy Description of Resources Funding Source AmountUtilize computer materials and programs provided with the Harcourt Math Harcourt Materials District Budget
1XL Math On-line Resources S.A.I. $3,500.00 Subtotal: $3,500.00
Professional DevelopmentStrategy Description of Resources Funding Source Amount
Subtotal:OtherStrategy Description of Resources Funding Source AmountMorning Math Tutoring Tutoring in Math S.A.I. $3,200.00 Subtotal: $3,200.00 Total: $6,700.00End of Mathematics Goals
June 2012Rule 6A-1.099811Revised April 29, 2011
48

2012-2013 School Improvement Plan (SIP)-Form SIP-1
Elementary and Middle School Science Goals* When using percentages, include the number of students the percentage represents (e.g., 70% [35]).
Elementary and Middle Science Goals
Problem-Solving Process to Increase Student Achievement
Based on the analysis of student achievement data and reference to “Guiding Questions,” identify and define areas in need of improvement for the following group:
Anticipated Barrier Strategy Person or Position Responsible for Monitoring
Process Used to Determine Effectiveness of Strategy
Evaluation Tool
1A. FCAT 2.0: Students scoring at Achievement Level 3 in science. 62%
1A.1.
Limited time allotted for science.
1A.1.
Continue implementation of allotted time for science.
Continue implementation of Pearson science curriculum
Experiments using hands-on equipment
Integrate science non-fiction in reading block
1A.1.
AdministrationCurriculum Resource Teacher
1A.1.
Edusoft TestingClassroom Walk Throughs
1A.1.
FCAT ResultsScience Goal #1A:
Continue to maintain proficiency level above district and state average.
2012 Current Level of Performance:*
2013 Expected Level of Performance:*
62% (81)
≥ 62% (78)
1A.2. 1A.2. 1A.2. 1A.2. 1A.2.
1A.3. 1A.3. 1A.3. 1A.3. 1A.3.
1B. Florida Alternate Assessment: Students scoring at Levels 4, 5, and 6 in science.
1B.1. 1B.1. 1B.1. 1B.1. 1B.1.
Science Goal #1B:
Providing this data violates student confidentiality.
2012 Current Level of Performance:*
2013 Expected Level of Performance:*
Enter numerical data for current level of performance in this box.
Enter numerical data for expected level of performance in this box.
1B.2. 1B.2. 1B.2. 1B.2. 1B.2.
1B.3. 1B.3. 1B.3. 1B.3. 1B.3.
June 2012Rule 6A-1.099811Revised April 29, 2011
49

2012-2013 School Improvement Plan (SIP)-Form SIP-1Based on the analysis of student achievement data and reference to “Guiding Questions,” identify and define areas in need of improvement for the following group:
Anticipated Barrier Strategy Person or Position Responsible for Monitoring
Process Used to Determine Effectiveness of Strategy
Evaluation Tool
2A. FCAT 2.0: Students scoring at or above Achievement Levels 4 and 5 in science. 17%
2A.1.
Limited time allotted for science
2A.1.
Continue implementation of allotted time for science
Continue implementation of adopted Pearson science curriculum
Experiments using hands-on equipment
Integrate science non-fiction in reading block
2A.1.
AdministrationCurriculum Resource Teacher
2A.1.
Edusoft TestingClassroom walk throughs
2A.1.
FCAT ResultsScience Goal #2A:
To increase proficiency by 1% or more
2012 Current Level of Performance:*
2013Expected Level of Performance:*
17% (22)
≥18% (23)
2A.2. 2A.2.
Utilize Weekly Reader’s “Science Spin” magazine.
2A.2. 2A.2. 2A.2.
2A.3. 2A.3. 2A.3. 2A.3. 2A.3.
2B. Florida Alternate Assessment: Students scoring at or above Level 7 in science.
2B.1. 2B.1. 2B.1. 2B.1. 2B.1.
Science Goal #2B:
Providing this data violates student confidentiality.
2012 Current Level of Performance:*
2013Expected Level of Performance:*
Enter numerical data for current level of performance in this box.
Enter numerical data for expected level of performance in this box.
2B.2. 2B.2. 2B.2. 2B.2. 2B.2.
2B.3. 2B.3. 2B.3. 2B.3. 2B.3.
End of Elementary and Middle School Science Goals
June 2012Rule 6A-1.099811Revised April 29, 2011
50

2012-2013 School Improvement Plan (SIP)-Form SIP-1
Florida Alternate Assessment High School Science Goals* When using percentages, include the number of students the percentage represents (e.g., 70% [35]).
High School Science Goals Problem-Solving Process to Increase Student AchievementBased on the analysis of student achievement data and reference to “Guiding Questions,” identify and define areas in need of improvement for the following group:
Anticipated Barrier Strategy Person or Position Responsible for Monitoring
Process Used to Determine Effectiveness of Strategy
Evaluation Tool
1. Florida Alternate Assessment: Students scoring at Levels 4, 5, and 6 in science.
1.1. 1.1. 1.1. 1.1. 1.1.
Science Goal #1:
Enter narrative for the goal in this box.
2012 Current Level of Performance:*
2013 Expected Level of Performance:*
Enter numerical data for current level of performance in this box.
Enter numerical data for expected level of performance in this box.
1.2. 1.2. 1.2. 1.2. 1.2.
1.3. 1.3. 1.3. 1.3. 1.3.
Based on the analysis of student achievement data, and reference to “Guiding Questions”, identify and define areas in need of improvement for the following group:
Anticipated Barrier Strategy Person or Position Responsible for Monitoring
Process Used to Determine Effectiveness of Strategy
Evaluation Tool
2. Florida Alternate Assessment: Students scoring at or above Level 7 in science.
2.1. 2.1. 2.1. 2.1. 2.1.
Science Goal #2:
Enter narrative for the goal in this box.
2012 Current Level of Performance:*
2013Expected Level of Performance:*
Enter numerical data for current level of performance in this box.
Enter numerical data for expected level of performance in this box.
2.2. 2.2. 2.2. 2.2. 2.2.
2.3. 2.3. 2.3. 2.3. 2.3.
End of Florida Alternate Assessment High School Science GoalsBiology 1 End-of-Course (EOC) Goals (this section needs to be completed by all schools that have students taking the Biology I EOC)June 2012Rule 6A-1.099811Revised April 29, 2011
51
2012-2013 School Improvement Plan (SIP)-Form SIP-1
* When using percentages, include the number of students the percentage represents (e.g., 70% [35]).
Biology 1 EOC Goals Problem-Solving Process to Increase Student AchievementBased on the analysis of student achievement data and reference to “Guiding Questions,” identify and define areas in need of improvement for the following group:
Anticipated Barrier Strategy Person or Position Responsible for Monitoring
Process Used to Determine Effectiveness of Strategy
Evaluation Tool
1. Students scoring at Achievement Level 3 in Biology 1.
1.1. 1.1. 1.1. 1.1. 1.1.
Biology 1 Goal #1:
Enter narrative for the goal in this box.
2012 Current Level of Performance:*
2013 Expected Level of Performance:*
Enter numerical data for current level of performance in this box.
Enter numerical data for expected level of performance in this box.
1.2. 1.2. 1.2. 1.2. 1.2.
1.3. 1.3. 1.3. 1.3. 1.3.
Based on the analysis of student achievement data and reference to “Guiding Questions,” identify and define areas in need of improvement for the following group:
Anticipated Barrier Strategy Person or Position Responsible for Monitoring
Process Used to Determine Effectiveness of Strategy
Evaluation Tool
2. Students scoring at or above Achievement Levels 4 and 5 in Biology 1.
2.1. 2.1. 2.1. 2.1. 2.1.
Biology 1 Goal #2:
Enter narrative for the goal in this box.
2012 Current Level of Performance:*
2013 Expected Level of Performance:*
Enter numerical data for current level of performance in this box.
Enter numerical data for expected level of performance in this box.
2.2. 2.2. 2.2. 2.2. 2.2.
2.3. 2.3. 2.3. 2.3. 2.3.
End of Biology 1 EOC Goals
June 2012Rule 6A-1.099811Revised April 29, 2011
52
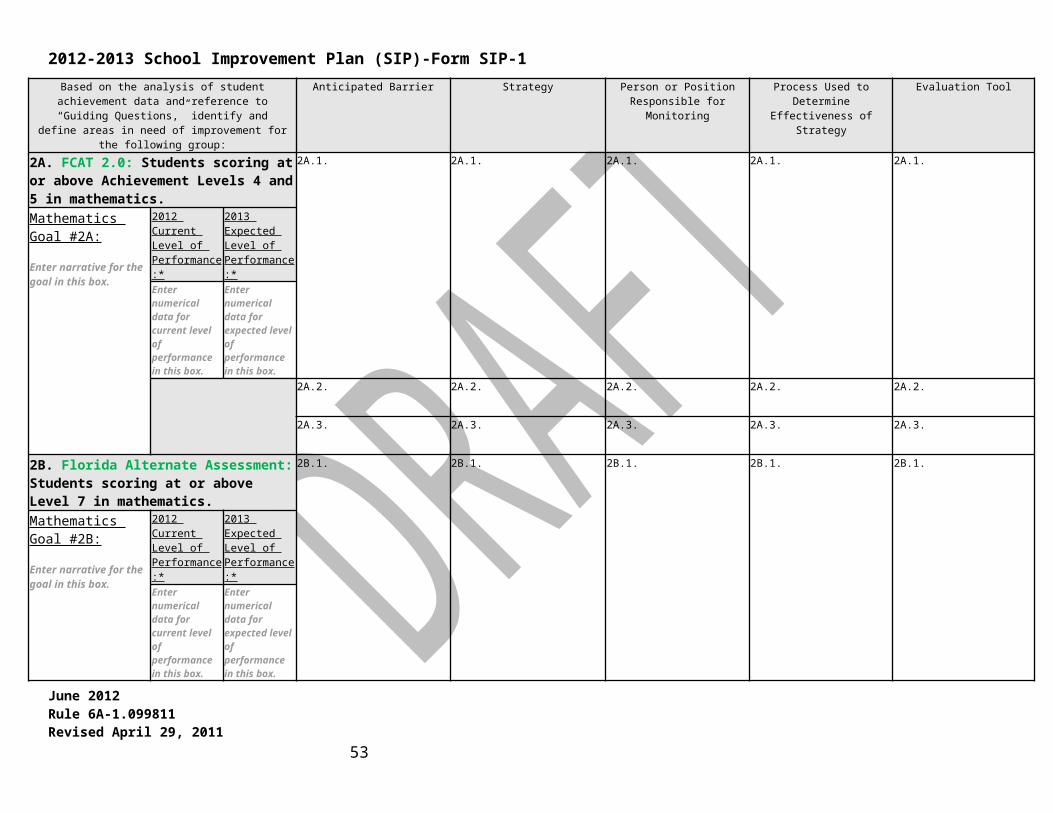
2012-2013 School Improvement Plan (SIP)-Form SIP-1
Science Professional DevelopmentProfessional Development (PD) aligned with Strategies through Professional Learning Community (PLC) or PD Activity
Please note that each Strategy does not require a professional development or PLC activity.PD Content /Topicand/or PLC Focus Grade
Level/Subject
PD Facilitatorand/or
PLC Leader
PD Participants (e.g. , PLC, subject, grade level, or
school-wide)
Target Dates (e.g. , Early Release) and Schedules (e.g.,
frequency of meetings)Strategy for Follow-up/Monitoring Person or Position Responsible for
Monitoring
Grade level meetings to review and implement science strategies
Grades 4 – 5 Grade Chairs Grades 4 - 5 Weekly meetings Review students’ science test
scores Administration
Science Budget (Insert rows as needed)Include only school-based funded activities/materials and exclude district funded activities/materials.Evidence-based Program(s)/Materials(s)Strategy Description of Resources Funding Source Amount
Subtotal:TechnologyStrategy Description of Resources Funding Source Amount
Subtotal:Professional DevelopmentStrategy Description of Resources Funding Source Amount
Subtotal:OtherStrategy Description of Resources Funding Source Amount
Subtotal: Total:
June 2012Rule 6A-1.099811Revised April 29, 2011
53

2012-2013 School Improvement Plan (SIP)-Form SIP-1End of Science Goals
June 2012Rule 6A-1.099811Revised April 29, 2011
54

2012-2013 School Improvement Plan (SIP)-Form SIP-1
Writing Goals* When using percentages, include the number of students the percentage represents (e.g., 70% [35]).
Writing Goals Problem-Solving Process to Increase Student AchievementBased on the analysis of student achievement data and
reference to “Guiding Questions,” identify and define areas in need of improvement for the following group:
Anticipated Barrier Strategy Person or Position Responsible for Monitoring
Process Used to Determine Effectiveness of Strategy
Evaluation Tool
1A. FCAT: Students scoring at Achievement Level 3.0 and higher in writing. 80%
1A.1.
Scoring of writing has changed to include conventions.
A greater emphasis is placed on the quality of the supporting details
1A.1.
Writing in-service for parents of 4th and 5th grade students.
DBQ’s (Document Based Questions) will continue in Social Studies classes.
Writing Coach offers 2 hours per week of direct instruction to each 4th grade class.
1A.1.
AdministrationCurriculum Resource TeacherWriting Coach
1A.1.
Pre / Post and Mid-year baseline tests.
1A.1.
FCAT ResultsEdusoft Bench Mark testing in writing
Writing Goal #1A:
Increase student proficiency (Percent scoring 3.0 and above) by 2%
2012 Current Level of Performance:*
2013 Expected Level of Performance:*
80% (104)
≥82%(103)
1A.2. 1A.2. Writing Coach provides teachers with periodic writing prompts so that student progress can be periodically monitored.
1A.2. 1A.2. 1A.2.
1A.3. 1A.3. 1A.3. 1A.3. 1A.3.
1B. Florida Alternate Assessment: Students scoring at 4 or higher in writing.
1B.1. 1B.1. 1B.1. 1B.1. 1B.1.
Writing Goal #1B:
Providing this data violates student confidentiality.
2012 Current Level of Performance:*
2013 Expected Level of Performance:*
Enter numerical data for current level of performance in this box.
Enter numerical data for expected level of performance in this box.
1B.2. 1B.2. 1B.2. 1B.2. 1B.2.
1B.3. 1B.3. 1B.3. 1B.3. 1B.3.
June 2012Rule 6A-1.099811Revised April 29, 2011
55

2012-2013 School Improvement Plan (SIP)-Form SIP-1
Writing Professional DevelopmentProfessional Development (PD) aligned with Strategies through Professional Learning Community (PLC) or PD Activity
Please note that each Strategy does not require a professional development or PLC activity.PD Content /Topicand/or PLC Focus Grade
Level/Subject
PD Facilitatorand/or
PLC Leader
PD Participants (e.g. , PLC, subject, grade level, or
school-wide)
Target Dates (e.g. , Early Release) and Schedules (e.g.,
frequency of meetings)Strategy for Follow-up/Monitoring Person or Position Responsible for
Monitoring
Writing Budget (Insert rows as needed)Include only school-based funded activities/materials and exclude district funded activities/materials.Evidence-based Program(s)/Materials(s)Strategy Description of Resources Funding Source AmountImprove language, grammar and mechanics
“Quick-Word Handbook for Everyday Writers”
Title 1 $238.50
Subtotal: $238.50TechnologyStrategy Description of Resources Funding Source Amount
Subtotal:Professional DevelopmentStrategy Description of Resources Funding Source Amount
Subtotal:OtherStrategy Description of Resources Funding Source Amount
Subtotal: Total: $238.50
End of Writing Goals
June 2012Rule 6A-1.099811Revised April 29, 2011
56

2012-2013 School Improvement Plan (SIP)-Form SIP-1
Civics End-of-Course (EOC) Goals (required in year 2014-2015) * When using percentages, include the number of students the percentage represents (e.g., 70% [35]).
Civics EOC Goals Problem-Solving Process to Increase Student AchievementBased on the analysis of student achievement data and reference to “Guiding Questions,” identify and define areas in need of improvement for the following group:
Anticipated Barrier Strategy Person or Position Responsible for Monitoring
Process Used to Determine Effectiveness of Strategy
Evaluation Tool
1. Students scoring at Achievement Level 3 in Civics.
1.1. 1.1. 1.1. 1.1. 1.1.
Civics Goal #1:
Enter narrative for the goal in this box.
2012 Current Level of Performance:*
2013 Expected Level of Performance:*
Enter numerical data for current level of performance in this box.
Enter numerical data for expected level of performance in this box.
1.2. 1.2. 1.2. 1.2. 1.2.
1.3. 1.3. 1.3. 1.3. 1.3.
Based on the analysis of student achievement data and reference to “Guiding Questions,” identify and define areas in need of improvement for the following group:
Anticipated Barrier Strategy Person or Position Responsible for Monitoring
Process Used to Determine Effectiveness of Strategy
Evaluation Tool
2. Students scoring at or above Achievement Levels 4 and 5 in Civics.
2.1. 2.1. 2.1. 2.1. 2.1.
Civics Goal #2:
Enter narrative for the goal in this box.
2012 Current Level of Performance:*
2013 Expected Level of Performance:*
Enter numerical data for current level of performance in this box.
Enter numerical data for expected level of performance in this box.
2.2. 2.2. 2.2. 2.2. 2.2.
2.3. 2.3. 2.3. 2.3. 2.3.
June 2012Rule 6A-1.099811Revised April 29, 2011
57

2012-2013 School Improvement Plan (SIP)-Form SIP-1
Civics Professional Development
Professional Development (PD) aligned with Strategies through Professional Learning Community (PLC) or PD ActivityPlease note that each Strategy does not require a professional development or PLC activity.
PD Content /Topicand/or PLC Focus Grade
Level/Subject
PD Facilitatorand/or
PLC Leader
PD Participants (e.g. , PLC, subject, grade level, or
school-wide)
Target Dates (e.g. , Early Release) and Schedules (e.g.,
frequency of meetings)Strategy for Follow-up/Monitoring Person or Position Responsible for
Monitoring
Civics Budget (Insert rows as needed)Include only school-based funded activities/materials and exclude district funded activities /materials.Evidence-based Program(s)/Materials(s)Strategy Description of Resources Funding Source Amount
Subtotal:TechnologyStrategy Description of Resources Funding Source Amount
Subtotal:Professional DevelopmentStrategy Description of Resources Funding Source Amount
Subtotal:OtherStrategy Description of Resources Funding Source Amount
Subtotal: Total:
End of Civics Goals
June 2012Rule 6A-1.099811Revised April 29, 2011
58
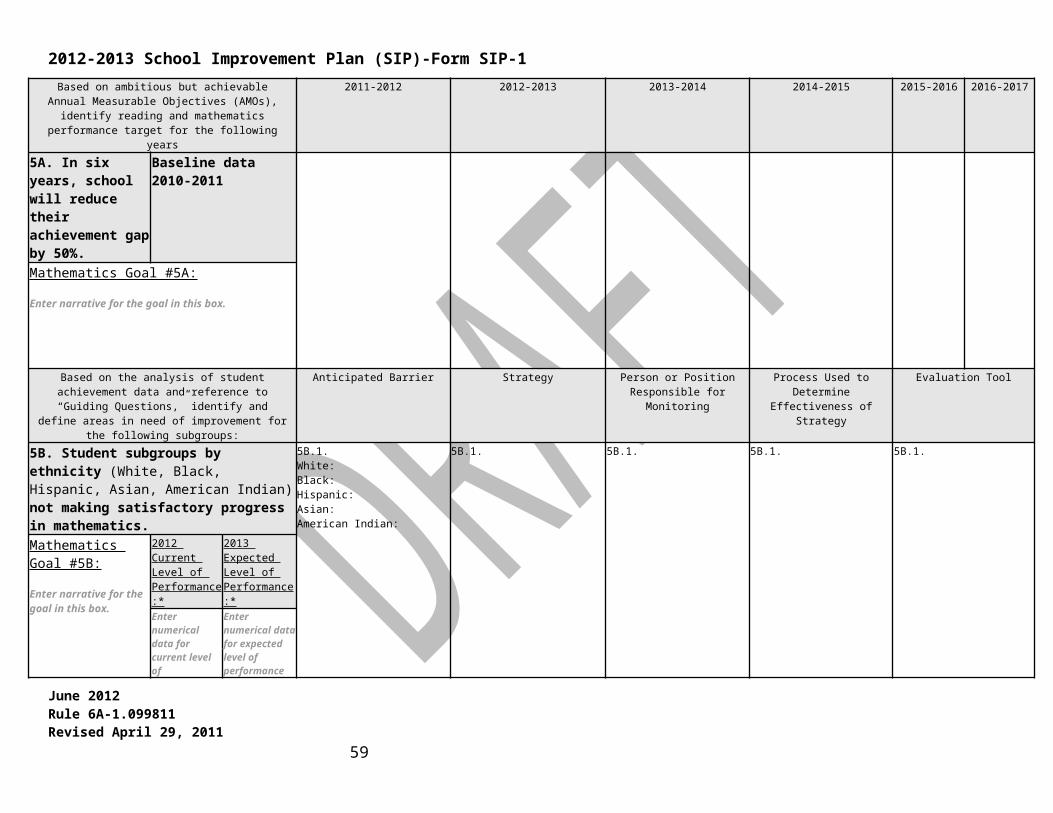
2012-2013 School Improvement Plan (SIP)-Form SIP-1
U.S. History End-of-Course (EOC) Goals (required in year 2013-2014) * When using percentages, include the number of students the percentage represents (e.g., 70% [35]).
U.S. History EOC Goals Problem-Solving Process to Increase Student AchievementBased on the analysis of student achievement data and reference to “Guiding Questions,” identify and define areas in need of improvement for the following group:
Anticipated Barrier Strategy Person or Position Responsible for Monitoring
Process Used to Determine Effectiveness of Strategy
Evaluation Tool
1. Students scoring at Achievement Level 3 in U.S. History.
1.1. 1.1. 1.1. 1.1. 1.1.
U.S. History Goal #1:
Enter narrative for the goal in this box.
2012 Current Level of Performance:*
2013 Expected Level of Performance:*
Enter numerical data for current level of performance in this box.
Enter numerical data for expected level of performance in this box.
1.2. 1.2. 1.2. 1.2. 1.2.
1.3. 1.3. 1.3. 1.3. 1.3.
Based on the analysis of student achievement data and reference to “Guiding Questions,” identify and define areas in need of improvement for the following group:
Anticipated Barrier Strategy Person or Position Responsible for Monitoring
Process Used to Determine Effectiveness of Strategy
Evaluation Tool
2. Students scoring at or above Achievement Levels 4 and 5 in U.S. History.
2.1. 2.1. 2.1. 2.1. 2.1.
U.S. History Goal #2:
Enter narrative for the goal in this box.
2012 Current Level of Performance:*
2013 Expected Level of Performance:*
Enter numerical data for current level of performance in this box.
Enter numerical data for expected level of performance in this box.
2.2. 2.2. 2.2. 2.2. 2.2.
2.3. 2.3. 2.3. 2.3. 2.3.
June 2012Rule 6A-1.099811Revised April 29, 2011
59
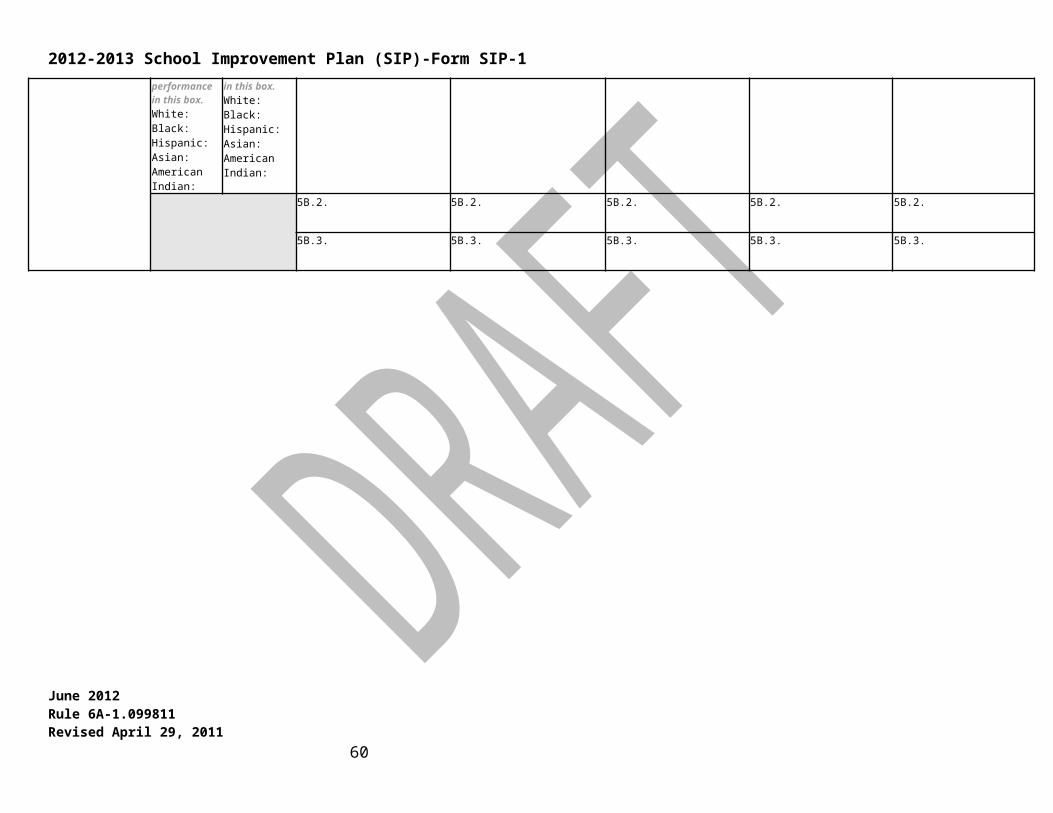
2012-2013 School Improvement Plan (SIP)-Form SIP-1
U.S. History Professional DevelopmentProfessional Development (PD) aligned with Strategies through Professional Learning Community (PLC) or PD Activity
Please note that each Strategy does not require a professional development or PLC activity.PD Content /Topicand/or PLC Focus Grade
Level/Subject
PD Facilitatorand/or
PLC Leader
PD Participants (e.g. , PLC, subject, grade level, or
school-wide)
Target Dates (e.g. , Early Release) and Schedules (e.g.,
frequency of meetings)Strategy for Follow-up/Monitoring Person or Position Responsible for
Monitoring
U.S. History Budget (Insert rows as needed)Include only school-based funded activities/materials and exclude district funded activities /materials.Evidence-based Program(s)/Materials(s)Strategy Description of Resources Funding Source Amount
Subtotal:TechnologyStrategy Description of Resources Funding Source Amount
Subtotal:Professional DevelopmentStrategy Description of Resources Funding Source Amount
Subtotal:OtherStrategy Description of Resources Funding Source Amount
Subtotal: Total:
End of U.S. History Goals
June 2012Rule 6A-1.099811Revised April 29, 2011
60

2012-2013 School Improvement Plan (SIP)-Form SIP-1
Attendance Goal(s)* When using percentages, include the number of students the percentage represents (e.g., 70% [35]).
Attendance Goal(s) Problem-solving Process to Increase AttendanceBased on the analysis of attendance data and reference to “Guiding Questions,” identify and define areas in need of
improvement:
Anticipated Barrier Strategy Person or Position Responsible for Monitoring
Process Used to Determine Effectiveness of Strategy
Evaluation Tool
1. Attendance 1.1.
Childhood illnesses
1.1.
Involve Parent Liaison to monitor attendance and coordinate with parents and school personnel
1.1.
AdministrationSchool LiaisonCounselorsSocial Worker
1.1.
Average Daily Attendance will be monitored bi-monthly to determine if program is successful.
1.1.
District Attendance Report
Attendance Goal #1:
To maintain 95% or higher on average daily attendance data report.
2012 Current Attendance Rate:*
2013 Expected Attendance Rate:*
95.24% ≥95%
2012 Current Number of Students with Excessive Absences (10 or more)
2013 Expected Number of Students with Excessive Absences (10 or more)
31.33%(250 students)
≤30%(250 students)
2012 Current Number of Students with Excessive Tardies (10 or more)
2013 Expected Number of Students with Excessive Tardies (10 or more)
15%(108 students)
≤12%(100 students)
1.2. 1.2. 1.2. 1.2. 1.2.
1.3. 1.3. 1.3. 1.3. 1.3.
June 2012Rule 6A-1.099811Revised April 29, 2011
61

2012-2013 School Improvement Plan (SIP)-Form SIP-1
Attendance Professional DevelopmentProfessional Development (PD) aligned with Strategies through Professional Learning Community (PLC) or PD Activity
Please note that each Strategy does not require a professional development or PLC activity.PD Content /Topicand/or PLC Focus Grade
Level/Subject
PD Facilitatorand/or
PLC Leader
PD Participants (e.g. , PLC, subject, grade level, or
school-wide)
Target Dates (e.g. , Early Release) and Schedules (e.g.,
frequency of meetings)Strategy for Follow-up/Monitoring Person or Position Responsible for
Monitoring
AS400 and FIDO Training for attendance and reports
K - 5 MIS School Counselors and CRT 1st semester of 2012-2013 school year
Check attendance reports bi-monthly Administration
Attendance Budget (Insert rows as needed)Include only school-based funded activities/materials and exclude district funded activities /materials.Evidence-based Program(s)/Materials(s)Strategy Description of Resources Funding Source AmountPostage for home/school communication School personnel School budget $200.00
Subtotal: $200.00TechnologyStrategy Description of Resources Funding Source Amount
Subtotal:Professional DevelopmentStrategy Description of Resources Funding Source AmountAS400 and FIDO training MIS $0.00
Subtotal:OtherStrategy Description of Resources Funding Source Amount
Subtotal:
June 2012Rule 6A-1.099811Revised April 29, 2011
62

2012-2013 School Improvement Plan (SIP)-Form SIP-1 Total: $200.00
End of Attendance Goals
June 2012Rule 6A-1.099811Revised April 29, 2011
63

2012-2013 School Improvement Plan (SIP)-Form SIP-1
Suspension Goal(s)* When using percentages, include the number of students the percentage represents next to the percentage (e.g. 70% (35)).
Suspension Goal(s) Problem-solving Process to Decrease SuspensionBased on the analysis of suspension data, and reference to “Guiding
Questions,” identify and define areas in need of improvement:Anticipated Barrier Strategy Person or Position
Responsible for Monitoring
Process Used to Determine Effectiveness of
Strategy
Evaluation Tool
1. Suspension 1.1.
Misconduct occurs during unstructured time.
1.1.
Leadership team will discuss and disseminate ways to increase supervision during unstructured time (i.e. Dismissal time)
Utilize the Safety Patrol
Continue implementation of School Plus (Saturday School)
Continue implementation of Core Essentials Character Education Program through the Guidance Department.
1.1.
AdministrationLeadership Team
1.1.
Data review of suspension rate. Monitor problem areas and review written referrals
1.1.
FIDO and AS400 Discipline ReportsSuspension Goal #1:
Reduce suspensions by 10%
2012 Total Number of In –School Suspensions
2013 Expected Number of In- School Suspensions
33 ≤302012 Total Number of Students Suspended In-School
2013 Expected Number of Students Suspended In -School
18 ≤162012 Total Number of Out-of-School Suspensions
2013 Expected Number of Out-of-School Suspensions
45 ≤402012 Total Number of Students Suspended Out- of- School
2013 Expected Number of Students Suspended Out- of-School
38 ≤341.2. Limited disciplinary options
1.2. Breakfast in the classroom 1.2. Administration 1.2. Review of discipline referals 1.2. AS400 and FIDO Discipline reports
1.3. 1.3. 1.3. 1.3. 1.3.
June 2012Rule 6A-1.099811Revised April 29, 2011
64

2012-2013 School Improvement Plan (SIP)-Form SIP-1
Suspension Professional DevelopmentProfessional Development (PD) aligned with Strategies through Professional Learning Community (PLC) or PD Activity
Please note that each Strategy does not require a professional development or PLC activity.PD Content /Topicand/or PLC Focus Grade
Level/Subject
PD Facilitatorand/or
PLC Leader
PD Participants (e.g. , PLC, subject, grade level, or
school-wide)
Target Dates (e.g. , Early Release) and Schedules (e.g.,
frequency of meetings)Strategy for Follow-up/Monitoring Person or Position Responsible for
Monitoring
Safety Patrol Training K – 5 Administration Safety Patrol and Grade Level
leaders Beginning of 2012 – 2013 Monitor hallways Administration
Faculty In-Service K - 5 Administration Faculty and Staff Beginning of 2012 - 2013 In-Service / monthly grade level meetings Administration
Suspension Budget (Insert rows as needed)Include only school-based funded activities/materials and exclude district funded activities /materials.Evidence-based Program(s)/Materials(s)Strategy Description of Resources Funding Source Amount
Subtotal:TechnologyStrategy Description of Resources Funding Source Amount
Subtotal:Professional DevelopmentStrategy Description of Resources Funding Source Amount
Subtotal:OtherStrategy Description of Resources Funding Source Amount
Subtotal: Total:
End of Suspension GoalsJune 2012Rule 6A-1.099811Revised April 29, 2011
65

2012-2013 School Improvement Plan (SIP)-Form SIP-1
June 2012Rule 6A-1.099811Revised April 29, 2011
66

2012-2013 School Improvement Plan (SIP)-Form SIP-1
Dropout Prevention Goal(s) Note: Required for High School- F.S., Sec. 1003.53
* When using percentages, include the number of students the percentage represents next to the percentage (e.g. 70% (35)). Dropout Prevention Goal(s) Problem-solving Process to Dropout Prevention
Based on the analysis of parent involvement data, and reference to “Guiding Questions,” identify and define areas in need of
improvement:
Anticipated Barrier Strategy Person or Position Responsible for
Monitoring
Process Used to Determine Effectiveness of
Strategy
Evaluation Tool
1. Dropout Prevention 1.1. 1.1. 1.1. 1.1. 1.1.
Dropout Prevention Goal #1:
Enter narrative for the goal in this box.
*Please refer to the percentage of students who dropped out during the 2011-2012 school year.
2012 Current Dropout Rate:*
2013 Expected Dropout Rate:*
Enter numerical data for dropout rate in this box.
Enter numerical data for expected dropout rate in this box.
2012 Current Graduation Rate:*
2013 Expected Graduation Rate:*
Enter numerical data for graduation rate in this box.
Enter numerical data for expected graduation rate in this box.
1.2. 1.2. 1.2. 1.2. 1.2.
1.3. 1.3. 1.3. 1.3. 1.3.
Dropout Prevention Professional DevelopmentProfessional Development (PD) aligned with Strategies through Professional Learning Community (PLC) or PD Activity
Please note that each Strategy does not require a professional development or PLC activity.PD Content /Topicand/or PLC Focus Grade
Level/Subject
PD Facilitatorand/or
PLC Leader
PD Participants (e.g. , PLC, subject, grade level, or
school-wide)
Target Dates (e.g. , Early Release) and Schedules (e.g.,
frequency of meetings)Strategy for Follow-up/Monitoring Person or Position Responsible for
Monitoring
June 2012Rule 6A-1.099811Revised April 29, 2011
67
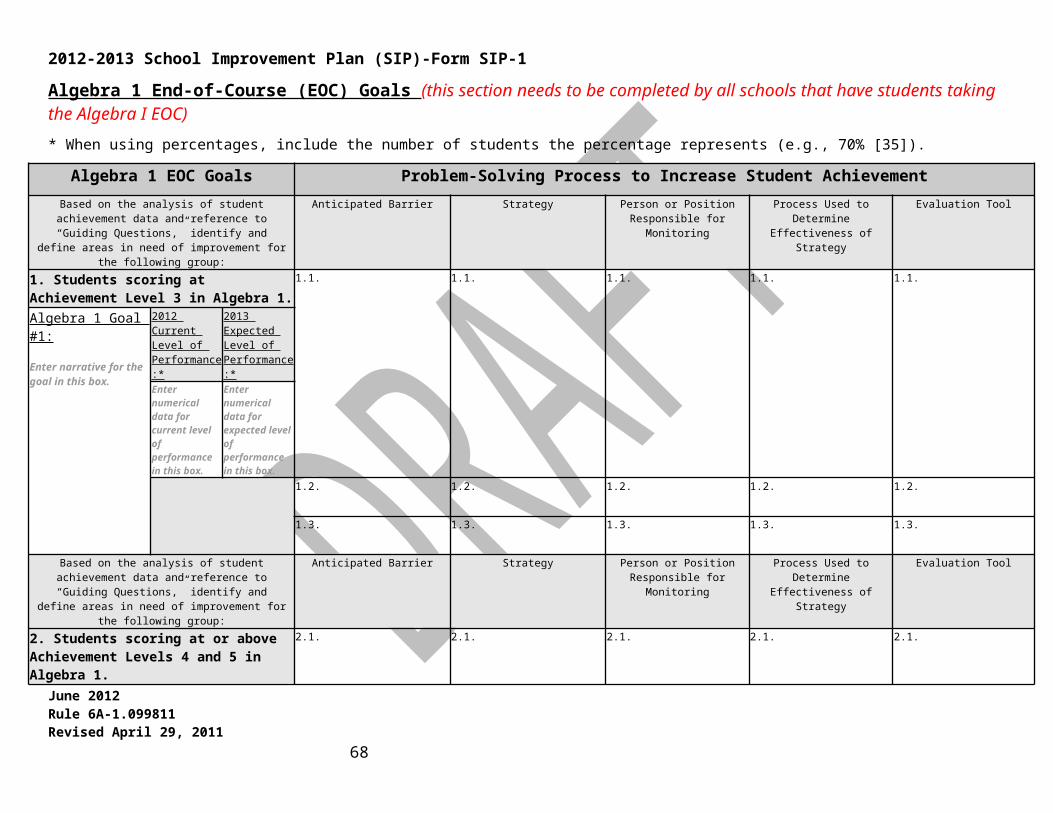
2012-2013 School Improvement Plan (SIP)-Form SIP-1
Dropout Prevention Budget (Insert rows as needed)Include only school-based funded activities/materials and exclude district funded activities /materials.Evidence-based Program(s)/Materials(s)Strategy Description of Resources Funding Source Amount
Subtotal:TechnologyStrategy Description of Resources Funding Source Amount
Subtotal:Professional DevelopmentStrategy Description of Resources Funding Source Amount
Subtotal:OtherStrategy Description of Resources Funding Source Amount
Subtotal:Total:
End of Dropout Prevention Goal(s)
June 2012Rule 6A-1.099811Revised April 29, 2011
68

2012-2013 School Improvement Plan (SIP)-Form SIP-1
Parent Involvement Goal(s)Upload Option-For schools completing the Parental Involvement Policy/Plan (PIP) please include a copy for this section. Online Template- For schools completing the PIP a link will be provided that will direct you to this plan.* When using percentages, include the number of students the percentage represents next to the percentage (e.g. 70% (35)).
Parent Involvement Goal(s) Problem-solving Process to Parent InvolvementBased on the analysis of parent involvement data, and reference to
“Guiding Questions,” identify and define areas in need of improvement:
Anticipated Barrier Strategy Person or Position Responsible for
Monitoring
Process Used to Determine Effectiveness of
Strategy
Evaluation Tool
1. Parent Involvement 1.1.
Parents having financial difficulties and working more.
1.1.
Continue Reading, Math and Writing Parent workshops and continue use of Parent Resource CenterFood and clothing pantry available for students
1.1.
Family / School Liaison
1.1.
Collect participation data and survey parents
1.1.
Attendance sign-in sheets and surveysParent Involvement Goal
#1:
Increase the percentage of parents participating in school activities by 5% or more.
2012 Current Level of Parent Involvement:*
2013 Expected Level of Parent Involvement:*
80% ≥85%
1.2. 1.2.Offer flexible meeting dates and times.
1.2. 1.2. 1.2.
1.3. 1.3. 1.3. 1.3. 1.3.
Parent Involvement Professional DevelopmentProfessional Development (PD) aligned with Strategies through Professional Learning Community (PLC) or PD Activity
Please note that each Strategy does not require a professional development or PLC activity.PD Content /Topicand/or PLC Focus Grade
Level/Subject
PD Facilitatorand/or
PLC Leader
PD Participants (e.g. , PLC, subject, grade level, or
school-wide)
Target Dates (e.g. , Early Release) and Schedules (e.g.,
frequency of meetings)Strategy for Follow-up/Monitoring Person or Position Responsible for
Monitoring
Staff awareness on communication strategies with parents.
All Grades
Title 1AdministrationC.R.T.Family/School Liaison
All Staff Throughout the yearReport Card NightTeacher Communication LogsOpen House
Administration
June 2012Rule 6A-1.099811Revised April 29, 2011
69

2012-2013 School Improvement Plan (SIP)-Form SIP-1Parent Involvement BudgetInclude only school-based funded activities/materials and exclude district funded activities /materials.Evidence-based Program(s)/Materials(s)Strategy Description of Resources Funding Source AmountFollow Title 1 Parent Involvement Plan Title 1 $2,916.00
Subtotal: $2,916.00TechnologyStrategy Description of Resources Funding Source Amount
Subtotal:Professional DevelopmentStrategy Description of Resources Funding Source Amount
Subtotal:OtherStrategy Description of Resources Funding Source AmountParent Workshops Title 1 $3,800.00 Subtotal: $3,800.00 Total: $6,716.00End of Parent Involvement Goal(s)
June 2012Rule 6A-1.099811Revised April 29, 2011
70

2012-2013 School Improvement Plan (SIP)-Form SIP-1
Science, Technology, Engineering, and Mathematics (STEM) Goal(s)
STEM Goal(s) Problem-Solving Process to Increase Student AchievementBased on the analysis of school data, identify and define
areas in need of improvement:Anticipated Barrier Strategy Person or Position
Responsible for Monitoring
Process Used to Determine Effectiveness of
Strategy
Evaluation Tool
STEM Goal #1:
Enter narrative for the goal in this box.
1.1. 1.1. 1.1. 1.1. 1.1.
1.2. 1.2. 1.2. 1.2. 1.2.
1.3. 1.3. 1.3. 1.3. 1.3.
STEM Professional Development Professional Development (PD) aligned with Strategies through Professional Learning Community (PLC) or PD Activity
Please note that each Strategy does not require a professional development or PLC activity.PD Content /Topicand/or PLC Focus Grade
Level/Subject
PD Facilitatorand/or
PLC Leader
PD Participants (e.g. , PLC, subject, grade level, or
school-wide)
Target Dates (e.g. , Early Release) and Schedules (e.g.,
frequency of meetings)Strategy for Follow-up/Monitoring Person or Position Responsible for
Monitoring
June 2012Rule 6A-1.099811Revised April 29, 2011
71

2012-2013 School Improvement Plan (SIP)-Form SIP-1STEM Budget (Insert rows as needed)Include only school-based funded activities/materials and exclude district funded activities /materials.Evidence-based Program(s)/Materials(s)Strategy Description of Resources Funding Source Amount
Subtotal:TechnologyStrategy Description of Resources Funding Source Amount
Subtotal:Professional DevelopmentStrategy Description of Resources Funding Source Amount
Subtotal:OtherStrategy Description of Resources Funding Source Amount
Subtotal: Total:
End of STEM Goal(s)
June 2012Rule 6A-1.099811Revised April 29, 2011
72

2012-2013 School Improvement Plan (SIP)-Form SIP-1
Career and Technical Education (CTE) Goal(s)
CTE Goal(s) Problem-Solving Process to Increase Student AchievementBased on the analysis of school data, identify and define
areas in need of improvement:Anticipated Barrier Strategy Person or Position
Responsible for Monitoring
Process Used to Determine Effectiveness of
Strategy
Evaluation Tool
CTE Goal #1:
Enter narrative for the goal in this box.
1.1. 1.1. 1.1. 1.1. 1.1.
1.2. 1.2. 1.2. 1.2. 1.2.
1.3. 1.3. 1.3. 1.3. 1.3.
CTE Professional Development Professional Development (PD) aligned with Strategies through Professional Learning Community (PLC) or PD Activity
Please note that each Strategy does not require a professional development or PLC activity.PD Content /Topicand/or PLC Focus Grade
Level/Subject
PD Facilitatorand/or
PLC Leader
PD Participants (e.g. , PLC, subject, grade level, or
school-wide)
Target Dates (e.g. , Early Release) and Schedules (e.g.,
frequency of meetings)Strategy for Follow-up/Monitoring Person or Position Responsible for
Monitoring
June 2012Rule 6A-1.099811Revised April 29, 2011
73

2012-2013 School Improvement Plan (SIP)-Form SIP-1
CTE Budget (Insert rows as needed)Include only school-based funded activities/materials and exclude district funded activities /materials.Evidence-based Program(s)/Materials(s)Strategy Description of Resources Funding Source Amount
Subtotal:TechnologyStrategy Description of Resources Funding Source Amount
Subtotal:Professional DevelopmentStrategy Description of Resources Funding Source Amount
Subtotal:OtherStrategy Description of Resources Funding Source Amount
Subtotal: Total:
End of CTE Goal(s)
June 2012Rule 6A-1.099811Revised April 29, 2011
74
2012-2013 School Improvement Plan (SIP)-Form SIP-1
Additional Goal(s)* When using percentages, include the number of students the percentage represents next to the percentage (e.g. 70% (35)).
Additional Goal(s) Problem-Solving Process to Increase Student AchievementBased on the analysis of school data, identify and define
areas in need of improvement:Anticipated Barrier Strategy Person or Position
Responsible for Monitoring
Process Used to Determine Effectiveness of
Strategy
Evaluation Tool
1. Additional Goal: Bullying 1.1.
We have Choice Students and Opportunity Scholarship Students who are on the bus for one hour.
1.1.
Counselors will incorporate Anti-bullying strategies in the Counselor’s Corner on KVN morning news.
1.1
AdministrationGuidance Counselors.
1.1.
Monitor FIDO to review the number of referrals for bullying.
1.1.
Monitor FIDO for the number of referrals.Additional Goal #1:
100% of students will be aware of our anti-bullying / zero tolerance policy.
2012 Current Level :*
2013 Expected Level :*
0% 0%
1.2. 1.2.Utilize Materials: Too Good for Violence
1.2.C.R.T.
1.2.Pre and Post tests for Too Good for Violence
1.2.Pre and Post tests for Too Good for Violence
1.3. 1.3. 1.3. 1.3. 1.3.
Additional Goals Professional DevelopmentProfessional Development (PD) aligned with Strategies through Professional Learning Community (PLC) or PD Activity
Please note that each Strategy does not require a professional development or PLC activity.PD Content /Topicand/or PLC Focus Grade
Level/Subject
PD Facilitatorand/or
PLC Leader
PD Participants (e.g. , PLC, subject, grade level, or
school-wide)
Target Dates (e.g. , Early Release) and Schedules (e.g.,
frequency of meetings)Strategy for Follow-up/Monitoring Person or Position Responsible for
Monitoring
PLC Meetings K-5 Grade Chairs School Wide Monthly Meetings Review discipline plans for grade levels and classrooms. Administration
June 2012Rule 6A-1.099811Revised April 29, 2011
75

2012-2013 School Improvement Plan (SIP)-Form SIP-1
Additional Goal(s) Budget (Insert rows as needed)Include only school-based funded activities/materials and exclude district funded activities /materials.Evidence-based Program(s)/Materials(s)Strategy Description of Resources Funding Source Amount
Subtotal:TechnologyStrategy Description of Resources Funding Source Amount
Subtotal:Professional DevelopmentStrategy Description of Resources Funding Source Amount
Subtotal:OtherStrategy Description of Resources Funding Source Amount
Subtotal: Total:
End of Additional Goal(s)
June 2012Rule 6A-1.099811Revised April 29, 2011
76

2012-2013 School Improvement Plan (SIP)-Form SIP-1
Final Budget (Insert rows as needed)Please provide the total budget from each section. Reading Budget Total: $12,500.00
CELLA BudgetTotal:
Mathematics Budget Total: $3,500.00
Science BudgetTotal:
Writing Budget Total: $238.50
Civics BudgetTotal:
U.S. History BudgetTotal:
Attendance Budget Total: $200.00
Suspension BudgetTotal:
Dropout Prevention BudgetTotal:
Parent Involvement Budget Total: $6,716.00
STEM BudgetTotal:
CTE BudgetTotal:
Additional GoalsTotal:
Grand Total: $23,154.50
June 2012Rule 6A-1.099811Revised April 29, 2011
77

2012-2013 School Improvement Plan (SIP)-Form SIP-1
Differentiated Accountability
School-level Differentiated Accountability (DA) CompliancePlease choose the school’s DA Status. (To activate the checkbox: 1. Double click the desired box; 2.When the menu pops up, select Checked under “Default value” header; 3. Select OK, this will place an “x” in the box.)
School Differentiated Accountability StatusPriority Focus Prevent
Upload a copy of the Differentiated Accountability Checklist in the designated upload link on the Upload page
School Advisory Council (SAC)SAC Membership ComplianceThe majority of the SAC members are not employed by the school district. The SAC is composed of the principal and an appropriately balanced number of teachers, education support employees, students (for middle and high school only), parents, and other business and community members who are representative of the ethnic, racial, and economic community served by the school. Please verify the statement above by selecting Yes or No below.
Yes NoIf No, describe the measures being taken to comply with SAC requirements.
Describe the activities of the SAC for the upcoming school year.Review and input regarding School BudgetReview and input regarding School Improvement PlanPeriodic review and discussion of Student Achievement DataOngoing support of school events and initiatives
Describe the projected use of SAC funds. AmountSupport Instructional Activities and Interventions $2,534.56
June 2012Rule 6A-1.099811Revised April 29, 2011
78

2012-2013 School Improvement Plan (SIP)-Form SIP-1
June 2012Rule 6A-1.099811Revised April 29, 2011
79