school district of township of lower township school district introductory section letter of...
TRANSCRIPT

SCHOOL DISTRICTOF
TOWNSHIPOF
LOWER
Township of Lower Board of EducationLower Township, New Jersey
Comprehensive Annual Financial ReportFor the Fiscal Year Ended June 30,2012

Comprehensive AnnualFinancial Report
of the
Township of Lower Board of EducationLower Township, New Jersey
For the Fiscal Year Ended June 30, 2012
Prepared by
Township of Lower Board of EducationFinance Department

LOWER TOWNSHIP SCHOOL DISTRICT
INTRODUCTORY SECTION
Letter of TransmittalOrganizational ChartRoster of OfficialsConsultants and Advisors
FINANCIAL SECTION
Independent Auditor's Report
K-l Report on Compliance and on Internal Control Over Financial Reporting Basedon an Audit of Financial Statements Performed in Accordance withGovernment Auditing Standards
Required Supplementary Information - Part IManagement's Discussion and Analysis
Basic Financial Statements
A. District-wide Financial Statements:
A-IA-2
Statement of Net AssetsStatement of Activities
B. Fund Financial Statements:
Governmental Funds:B-1 Balance SheetB-2 Statement of Revenues, Expenditures, and Changes in Fund BalancesB-3 Reconciliation of the Statement of Revenues, Expenditures, and Changes in
Fund Balances of Governmental Funds to the Statement of Activities
Proprietary Funds:B-4 Statement of Net AssetsB-5B-6
Statement of Revenues, Expenses, and Changes in Fund Net AssetsStatement of Cash Flows
Fiduciary Funds:B-7 Statement of Fiduciary Net AssetsB-S Statement of Changes in Fiduciary Net Assets
Notes to the Financial Statements
Page2S910
12
14
17
2728
3031
32
333435
3637
38

Required Supplementary Information - Part II
C. Budgetary Comparison Schedules
C-I Budgetary Comparison Schedule - General FundC-la Combining Schedule of Revenues, Expenditures and Changes
in Fund Balance - Budget and Actual (if applicable)C-l b Budgetary Comparison Schedule - Education Jobs FundC-2 Budgetary Comparison Schedule - Special Revenue Fund
58
N/A6465
Notes to the Required Supplementary InformationC-3 Budget-to-GAAP Reconciliation 66
Other Supplementary Information
D. School Level Schedules: N/A
E. Special Revenue Fund:
E-l Combining Schedule of Revenues and ExpendituresSpecial Revenue Fund - Budgetary Basis
Preschool Education Program Aid Schedule of Expenditures -Budgetary Basis
69E-2
71
F. Capital Projects FundF-l Summary Schedule of Revenues, Expenditures, and Changes in Fund
Balance - Budgetary BasisF-2 Summary Schedule of Project Expenditures
7374
G. Proprietary Fund:
Enterprise Fund:G-l Combining Statement of Net Assets 76G-2 Combining Statement of Revenues, Expenses and Changes in
Fund Net AssetsCombining Statement of Cash Flows
7778G-3
Internal Service Fund: N/A
H. Fiduciary Funds:H-I Combining Statement of Fiduciary Net AssetsH-2 Combining Statement of Changes in Fiduciary Net AssetsH-3 Student Activity Agency Fund Schedule of Receipts and DisbursementsH-4 Payroll Agency Fund Schedule of Receipts and Disbursements
80818283

I. Long-Term Debt:
I-I1-21-3
Schedule of Serial BondsSchedule of Obligations Under Capital LeasesBudgetary Comparison Schedule
N/AN/AN/A
STATISTICAL SECTION (Unaudited)Financial TrendsJ-l Net Assets by Component, Last Ten Fiscal YearsJ-2 Changes in Net Assets, Last Ten Fiscal YearsJ-3 Fund Balances, Governmental Funds, Last Ten Fiscal Years
Revenue CapacityJ-6 Assessed Value and Actual Value of Taxable Property, Last Ten Fiscal YearsJ-7 Direct and Overlapping Property Tax Rates, Last Ten Fiscal YearsJ-8 Principal Property Tax Payers, Current Year and Nine Years AgoJ-9 Property Tax Levies and Collections, Last Ten Fiscal YearsDebt CapacityJ-10 Ratios of Outstanding Debt by Type, Last Ten Fiscal YearsJ-11 Ratios of Net General Bonded Debt Outstanding, Last Ten Fiscal YearsJ-12 Ratios of Overlapping Governmental Activities Debt, As of December 31, 2011J-13 Legal Debt Margin Information, Last Ten Fiscal YearsDemographic and Economic InformationJ-14 Demographic and Economic Statistics
J-4J-5
J-15
Changes in Fund Balances, Governmental Funds, Last Ten Fiscal YearsGeneral Fund - Other Local Revenue by Source, Last Ten Fiscal Years
8586888990
91929394
95969798
Principal Employers, Current Year & Nine Years Ago (information not available)99
N/AOperating InformationJ-16 Full-time Equivalent District Employees by Function/Program, Last Ten Fiscal Years 100
K-2 Report on Compliance with Requirements Applicable to Each MajorProgram and on Internal Control Over Compliance in Accordance withOMB Circular A-133 and New Jersey OMB Circular Letter 04-04
Schedule of Expenditures of Federal Awards, Schedule ASchedule of Expenditures of State Financial Assistance, Schedule BNotes to the Schedules of Awards and Financial AssistanceSchedule of Findings and Questioned CostsSummary Schedule of Prior Audit Findings
J-17J-18J-19J-20
K-3K-4K-5K-6K-7
Operating Statistics, Last Ten Fiscal YearsSchool Building Information, Last Ten Fiscal YearsSchedule of Required Maintenance, Last Ten Fiscal YearsInsurance Schedule
101102103104
SINGLE AUDIT SECTION
106108109110112116

Introductory Section

Maud Abrams School714 Town Bank RoadCape May. NJ 08204Telephone: (609) 884-9-120Fax: (609) 884-9421
LOWER TOWNSHIP ELEMENTARY SCHOOL DISTRICT834 SEASHORE ROAD
CAPE MAY, NEW JERSEY 08204
TELEPHONE: (609) 884-9400FAX: (609) 884-1821www.lowcrtwpschools.com
Memorial School2600 Bayshore RoadVillas. NJ OR251Telephone: (609) 884-9430Fax: (609) 886-0515
Sandman Consolidated School838 Seashore RoadCape May. NJ 08204Telephone: (609) 884-9410Fax: (609) 884-9-112
Carl T_ Mitnick School905 Seashore RoadCape May, NJ 08204Telephone: (609) 884-9470Fax: (609) 898-9481
October 16, 2012
Iionorable President andMembers of the Board of EducationLower Township School DistrictCounty of Cape MayCape May, New Jersey
Dear Board Members:
The comprehensive annual financial report of the Township of Lower School District forthe fiscal year ended June 30, 2012 is hereby submitted. Responsibility for the accuracy of thedata and completeness and fairness of the presentation, including all disclosures, rests with themanagement of the Board of Education. To the best of our knowledge and belief, the datapresented in this report is accurate in all material respects and is presented in a manner designedto present fairly the financial position and results of operations of the various funds and accountgroups of the District. All disclosures necessary to enable the reader to gain an understanding ofthe District's financial activities have been included.
The comprehensive annual financial report is presented in four sections: introductory.financial, statistical and single audit. The organizational chart and a list of principal officials.The financial schedules, as well as the auditor's report thereon. The statistical section includesselected financial and demographic information, generally presented on a multi-year basis. TheDistrict is required to undergo an annual single audit in conformity with the provisions of theSingle Audit Act of 1984 and the U.S. Office of Management and Budget Circular A-I33,"Audits oj State. Local Governments and Non-Profit Organizations ", and the State TreasuryCircular letter 04-04 OMB, "Single Audit Policy jar Recipients oj Federal Grants. State Grantsand State Aid". Information related to this single audit, including the auditor's report oncompliance and internal control with applicable laws and regulations and findings andrecommendations are included in the single audit section of this report.
2

1. REPORTING ENTITY AND ITS SERVICES:
The Township of Lower School District is an independent reporting entity within the criteriaadopted by the GASB as established by GASB Statement No. 14. All funds and accountgroups of the District are included in this report. The Township of Lower Board of Educationand all its schools constitute the District's reporting entity.
The District provides a full range of educational services appropriate to grade levelsPreschool through 6. These include regular education, academic enrichment programs andSpecial Education instruction and Child Study Team services. The District completed the2011-2012 fiscal year with an enrollment of 1,828 students (June 2012). The followingdetails the changes in the student enrollment of the District over the last ten years.
AVERAGE STUDENT ENROLLMENTAS REPORTED TO THE STATE
Fiscal Year2011-122010-112009-102008-092007-082006-072005-062004-052003-042002-03
Average Daily Enrollment1,8281,8481,8851,8571,8271,8921,9191,9001,9081,977
Percent Change-1.08%-1.96%1.51%1.65%
-3.44%-1.40%1.00%
-0.42%-3.49%-3.94%
2. ECONOMIC CONDITION AND OUTLOOK:
The Township of Lower encompasses 30.5 square miles in the southern part of Cape MayCounty. Its boundaries include the Delaware Bay, the Atlantic Ocean, Cape May City, CapeMay Point, Wildwood Crest, and the Township of Middle. The area was purchase from theoriginal settlers, the Kechemeche Indians, in the early 1600's. It was a natural site andbecame a center for whaling, fishing and fur trading.
The township was formed as a precinct in 1723 and was incorporated on February 21, 1798.From its incorporation until July I, 1984, three members formed a township committee thatgoverned the Township. Since July 1984, the governing body consists of a mayor, elected bythe people, and four council members (three elected from wards and one at-large.) Inaddition, a township manager, since 1984 supervises all departments and is responsible forthe preparation and administration of the annual budget.
3

3. MAJOR INITIATIVES:
During the 2011-2012 school year, numerous programs were strengthened to further promotestudent achievement in the New Jersey Department of Education's newly adopted CommonCore State Standards for English Language Arts. Common Core State Standards are the firststep in providing our young people a high-quality 2151 Century Education and have beenadopted by 46 states. Although the English Language Standards are divided into Reading,Writing, Speaking and Listening, the Language strands for conceptual clarity and theprocesses of communication are closely connected. Through continued emphasis on the 6+ ITraits of Writing in curriculum structure, the individual grade proficiencies & assessments inreading, writing and speaking will ensure that our next generation will be college and/orcareer ready in literacy by high school graduation. BookFlix© subscriptions continue to beweb-posted for preschool thru grade 4 students and families benefit from this readingintervention program for English and Bilingual students. BookFlix© is a program of popularchildren's reading titles, web-posted in Spanish and English, possessing visual text, optionalauditory support and possessing individual student progress monitoring capabilities. Otherdistrict provided online student resources for elementary grade levels include: World BookKids (K-3), World Book Students (4-6), World Book Discover (Focus: science),Encyclopedia Estudiantil Hallazgos (Spanish encyclopedia) and the Early World of Learning(Focus: visual learning modality).
Continuing with the Common Core Standards Initiative, considerable emphasis was placedon aligning the third grade through sixth grade mathematics curriculum to incorporate thenew content standards into our existing ENVISION© MATH program. Kindergarten throughsecond grade implemented the Common Core Curriculum during the 20 I0-11 SY. Wholegroup math lessons continue to incorporate Mimio technology, enhancing studentcomprehension of math concepts via the visually-rich manipulatives. Continuous teacher-training with the comprehensive digital capabilities and visual animations reinforce studentcomprehension of the mathematics standards.
Preschool and kindergarten instructional staff having completed training in High/Scope'sCOR (Child Observation Record) method of assessment This meaningful assessment forpreschool students has replaced the previously-used DIBELS assessment (DynamicIndicators of Basic Early Learning Skills).
Kindergarten literacy achievement is assessed via Fountas & Pinnell Benchmark AssessmentSystems and the Journeys© Unit & Benchmark Assessments. In addition, the KindergartenLiteracy Survey is administered three (3) times per year.
HANDWRITINGWITHOUT TEARS© (HWT) curriculum was adopted by preschool andkindergarten during 2008-09 SY and expanded to district-wide implementation in 20 I0-11.
According to the district's five-year evaluation cycle, other programs that were revisitedincluded Basic Skills, Child Study Team and Speech. Regarding the district's SCIENCEprogram, all curriculum guides were realigned to the recently released 2009 NJCCCS toincorporate technology integration, student modifications and differentiated methods ofinstruction in order to greater meet the needs of all learners.
Staff development activities are implemented on an ongoing basis in accordance with thedistrict's Professional Development Plan, which is closely aligned with the district's five-yearplan for the evaluation and development of curriculum. Staff development priorities are
4

identified as a result of the comprehensive review and analysis of numerous data sources.including: state assessments, standardized tests, district benchmark/annual assessments,anecdotal records, literacy portfolios, attendance records, discipline records, staff/parentsurveys, teacher/administrative input, parent-teacher conferences, school-based planningteam meetings, guidance office referrals, intervention and referral services committees,student mobility data and program evaluation reports.
The district is committed to addressing the identified priority needs and, as a result, enablingstudents to meet both the New Jersey Core Curriculum Content Standards as well as the newCommon Core State Standards. To accommodate staff schedules and learning styles, manydifferent approaches for providing professional development have been created. Theyinclude professional development days, half-day/full-day release time, before/after schoolmeetings/workshops, faculty meetings, demonstration lessons during class periods, structuredindependent study groups, inter-classroom visitations, out-of-district classroom/programvisitations, focus groups, on-line training, coaching, mentoring, training of trainers,teleconferences, distance learning, out-of-district workshops/conferences, college courses(tuition reimbursement) and the NJEA Convention.
Major staff development during the 2011-12 school year focused on integrating additionalteaching strategies and modalities into all instructional areas to increase student progressthrough varying teaching methods to reach all learners.
• Staff members participated in numerous workshops/seminars/courses. Professionaldevelopment is provided by consultants and district staff members. These inserviceopportunities were related to staff members' individual needs as identified on theirProfessional Development Plans (PDPs). All professional development activities areevaluated in writing and discussed informally at faculty/curriculum meetings. Theresults are compiled and utilized for future inservice opportunities. Teachers turnkeyappropriate information acquired at out-of-district workshops.
The district implemented training on all levels in compliance with the New JerseyHarassment, Intimidation and Bullying Law. All board of education members, administrators,staff, volunteers and students participated in mandatory training in the new law guidelinesincluding behavior expectations, staff and pupil responsibilities, rights and reporting. Thedistrict appointed a district anti-bullying coordinator, four (4) school anti-bullying specialistsand four (4) school safety teams all of which participated in intensive training promoting pro-social behaviors. Each school focused on strengthening practices and creating programs todevelop, foster and maintain a positive school climate. In accordance with the regulatorycomponents of the New Jersey Department of Education, the district was one of the fewdistricts in Cape May County that did not have a single HIB incident occur during the 2011-12 SY.
Entitlement funds from Title I, Title IIA, Title III and the Individuals with DisabilitiesEducation Act, Part B Aid assisted in providing additional specialized educationalopportunities for at-risk students. The American Recovery & Reinvestment Act (ARRA) of20 I0 funds for equipment and training continues to incorporate SMART© Technology as thepreferred method to introduce new material in the whole classroom instructional setting. 1-Respond carts provide opportunities for students to respond individually to a visual prompt,or interact with whiteboard or SMART© screen activities.
The entire district has wireless internet which maximizes each teachable moment. Whileclassroom teachers provide small group instruction, remaining students engage in individual
5

independent practice via the technology resources including Leapster, Book Flix©(preschool-a"), web-developed classroom websites via Site@School, Study Island (readinginterventionlNJASK skills: grades 3-6), and SkillsTutor© (NJPASS skills: grades 1-2).WEB-DRVs (web-digital video recordings) of grade-appropriate educational videos, accessto online graphic novels and utilization of additional educational software, such as Journeys,EnVision and World Book resources complimented the 2151 Century and Technology Toolsavailable to all students. All instructional staff participated in technology sessions focusing onthe ever-growing menu of technology enhancements available.
Lower Township School District's Technology Initiative requires every teacher to developand complete at least one integrated technology project per academic year. With the plethoraof technology initiatives, teachers can now create and present interactive lessons geared forthe multiple intelligences of the visual, auditory and special intelligence modalities. Theseadvancements in instructional techniques and processes provide students greater opportunitiesto reach their potential.
4. INTERNAL ACCOUNTING CONTROLS:
Management of the District is responsible for establishing and maintaining an internal controlstructure designed to ensure that the assets of the District are protected from loss, theft ormisuse and to ensure that adequate accounting data are complied to allow for the preparationof financial statements in conformity with generally accepted accounting principles (GAAP).The internal control structure is designed to provide reasonable, but not absolute, assurancethat these objectives are met. The concept of reasonable assurance recognized that: ( I) thecost of a control should not exceed the benefits likely to be derived; and (2) the valuation ofcosts and benefits requires estimates and judgments by management.
As a recipient of federal and state financial assistance, the District also is responsible forensuring that an adequate internal control structure is in place to ensure compliance withapplicable laws and regulations related to those programs. This internal control structure isalso subject to periodic evaluation by the District management.
As part of the District's single audit described earlier, tests are made to determine theadequacy of the internal control structure, including that portion related to federal and statefinancial assistance programs, as well as to determine that the District has complied withapplicable laws and regulations.
5. BUDGETARY CONTROLS:
In addition to internal accounting controls, the district maintains budgetary controls. Theobjective of these budgetary controls is to ensure compliance with legal provisions embodiedin the annual appropriated budget approved by the voters of the municipality. Annualappropriated budgets are adopted for the general fund, the special revenue fund, and the debtservice fund. Project-length budgets are approved for the capital improvements accounted forin the capital project fund. The final budget amount as amended for the fiscal year isreflected in the financial section.
An encumbrance accounting system is used to record outstanding purchase commitments ona line item basis. Open encumbrances at year-end are canceled or are included asreappropriations of fund balance in the subsequent year. Amounts to be reappropriated arereported as reservations of fund balance at June 30, 2012.
6

6. ACCOUNTING SYSTEM AND REPORTS:
The District's accounting records reflect generally accepted accounting principles, aspromulgated by the Governmental Accounting Standards Board (GASB). The accountingsystem of the District is organized on the basis of funds and account groups. These funds andaccount groups are explained in "Notes to the Financial Statements", Note I.
7. CASH MANAGEMENT:
The investment policy of the District is guided in large part by state statute as detailed in"Notes to the Financial Statements," Note 2. The District has adopted a cash managementplan which requires it to deposit public funds ill the New Jersey Cash Management Fund or inpublic depositories protected from loss under the provisions of the Government Unit DepositProtection Act ("GUDPA"). GUDPA was enacted in 1970 to protect Governmental Unitsfrom a loss of funds on deposit with a failed banking institution in New Jersey. The lawrequires governmental units to deposit public funds only in public depositories located inNew Jersey, where the funds are secured in accordance with the Act.
8. RISK MANAGEMENT:
The Board carries various forms of insurance, including but not limited to general liability,automobile liability and comprehensive/collision, hazard and theft insurance 011 property andcontents, and fidelity bonds.
9. OTHER INFORMATION:
<I. Independent Audit - State statutes require an annual audit by independentcertified public accountants or registered municipal accountants. The accountingfirm of Inverso & Stewart, LLC, was selected by the Board's audit committee.In addition to meeting the requirements set forth in state statues, the audit alsowas designed to meet the requirements of the Single Audit Act of 1984 and therelated OMB Circular A-133 and State Treasury Circular Letter 04-04 OMB.This auditor's report on the general purpose financial statements and combiningand individual fund statements and schedules is included in the financial sectionof this report. The auditor's reports related specifically to the single audit areincluded in the single audit sections of this report.
10. ACKNOWLEDGEMENTS:
We would like to express our appreciation to the members of the Township of Lower SchoolBoard for their concern in providing fiscal accountabil ity to the citizens and taxpayers of theschool district and thereby contributing their full support to the development and maintenanceof our financial operation. The preparation of this report could not have been accomplishedwithout the efficient ancl dedicated services of our financial ancl accounting staff.
Respectfully subm itted,
7

Lower Township School DistrictCape May, New Jersey
ORGANIZATIONAL CHART
LOWER TOWNSHIP BOARD OF EDUCATION(Elected by the Voters of Lower Township)
File Code: 1110ADOPTED: MAY 10, 2011
INTERIM SUPERINTENDENT(All Sta~
SUPERVISOR OFSPECIAL SERVICES
SCHOOL BUSINESS ADMINISTRATOR/BOARD SECRETARY(All Business Office S Iaf/)
ALLSPEClALEDUCATION STAFFFOOD SERVICE
BUlI.DINGS ANDTRANSPORT AnON
GROUNDSSUPERVISOR SUPERVISOR
SUPERVISOR
Au. TRANSPORTATION ALL FOOD SERVICE Al.L MAINTENANCE
STAFF STAFF & CUSTODIAL STAFF
PRINCIPALS
ALL BUILDING-LEVEL STAFF
C:VlsiolOrpnl1~llon.J Chan 2011
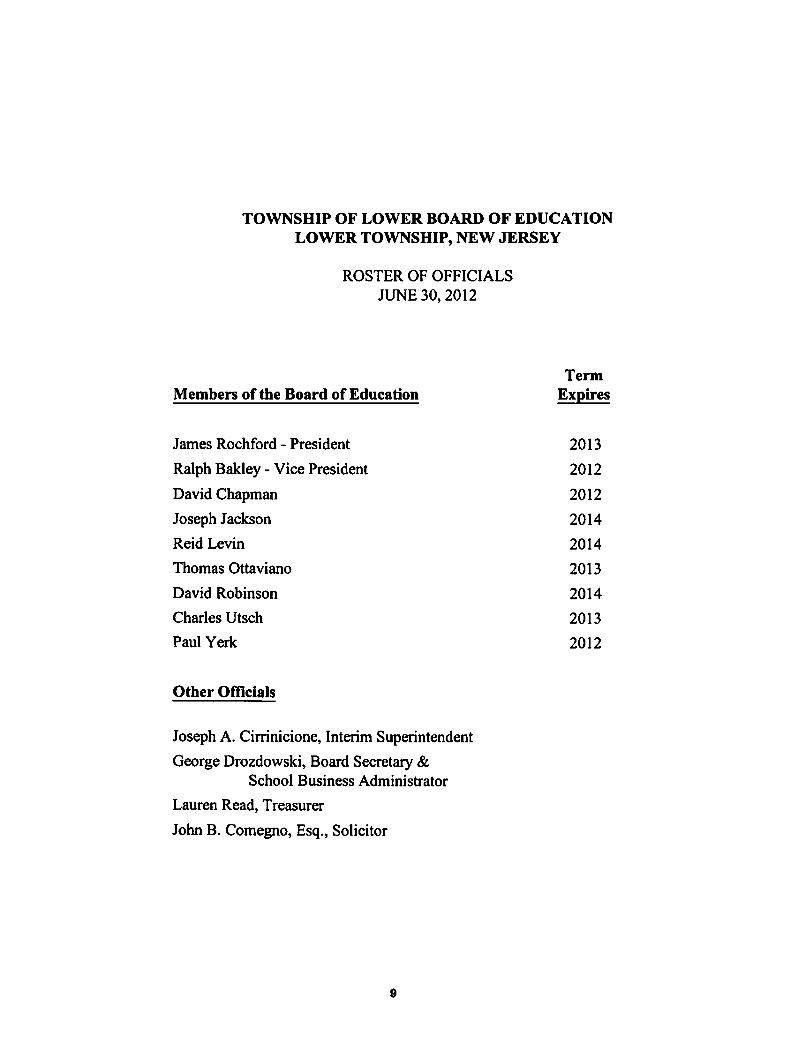
TOWNSHIP OF LOWER BOARD OF EDUCATIONLOWER TOWNSHIP, NEW JERSEY
ROSTER OF OFFICIALSJUNE 30, 2012
Members of the Board of EducationTerm
Expires
James Rochford - President
Ralph Bakley - Vice President
David Chapman
Joseph Jackson
Reid Levin
Thomas Ottaviano
David Robinson
Charles Utsch
Paul Yerk
2013
2012
2012
2014
2014
2013
2014
2013
2012
Other Officials
Joseph A. Cirrinicione, Interim Superintendent
George Drozdowski, Board Secretary &School Business Administrator
Lauren Read, Treasurer
John B. Comegno, Esq., Solicitor
9

Attorney
TOWNSHIP OF LOWER SCHOOL DISTRICTCONSULTANTS AND ADVISORS
Audit Firm
Inverso & Stewart, LLC12000 Lincoln Drive West
Suite 402Marlton, NJ 08053
John B. ComegnoComegno Law Group
521 Pleasant Valley AvenueMoorestown, NJ 08057
Official Depository
Sturdy Savings Bank3851 Bayshore Road
North Cape May, NJ 08204
lU

Financial Section

INVERSO & STEWART, LLC
Certified Public AccountantsRegistered Municipal Accountants
12000 Lincoln Drive West, Suite 402Marlton, New Jeney 08053(856) 983-2244Fax (856) 983-6674E-Mail: Iscnas(cilcllncentrir.net
-Member of-American Institute of CPAsNew Jenty Society orCPAs
INDEPENDENT AUDITOR'S REPORT
The Honorable President and Membersof the Board of Education
Township of Lower School DistrictCounty of Cape MayCape May, New Jersey
We have audited the accompanying financial statements of the governmental activities, the business-type activities, eachmajor fund and the aggregate remaining fund information of the Lower Township School District, in the County of CapeMay, State of New Jersey (School District), as of and for the fiscal year ended June 30, 2012, which collectively comprisethe School District's basic financial statements as listed in the table of contents. These financial statements are theresponsibility of the School District's management. Our responsibility is to express opinions on these financial statementsbased on our audit.
We conducted our audit in accordance with auditing standards generally accepted in the United States of America; thestandards applicable to financial audits contained in Government Auditing Standards. issued by the Comptroller Generalof the United States; and in compliance with audit requirements as prescribed by the Division of Finance, Department ofEducation, State of New Jersey. Those standards require that we plan and perform the audit to obtain reasonableassurance about whether the financial statements are free of material misstatement. An audit includes consideration ofinternal control over financial reporting as a basis for designing audit procedures that are appropriate in thecircumstances, but not for the purpose of expressing an opinion on the effectiveness of the School District's internalcontrol over financial reporting. Accordingly, we express no such opinion. An audit includes examining, on a test basis,evidence supporting the amounts and disclosures in the financial statements. An audit also includes assessing theaccounting principles used and significant estimates made by management, as well as evaluating the overall financialstatement presentation. We believe that our audit provides a reasonable basis for our opinions.
In our opinion, the financial statements referred to above present fairly, in all material respects, the respective financialposition of the governmental activities, business-type activities, each major fund and the aggregate remaining fundinformation of the Lower Township School District, in the County of Cape May, State of New Jersey, as of June 30,2012, and the respective changes in financial position and. where applicable, cash flows thereof for the fiscal year thenended in conformity with accounting principles generally accepted in the United States of America.
In accordance with Government Auditing Standards, we have also issued our report dated October 16, 2012 on ourconsideration of the Lower Township School District, in the County of Cape May, State of New Jersey's internal controlover financial reporting and on our tests of its compliance with certain provisions of laws, regulations, contracts and grantagreements and other matters. The purpose of that report is to describe the scope of our testing of internal control overfinancial reporting and compliance and the results of that testing, and not to provide an opinion on the internal controlover financial reporting or on compliance. That report is an integral part of an audit performed in accordance withGovernment Auditing Standards and should be considered in assessing the results of our audit.
12

The accompanying management's discussion and analysis and budgetary comparison information, as listed in the table ofcontents, are not a required part of the basic financial statements but are supplementary information required byaccounting principles generally accepted in the United States of America. We have applied certain limited procedures,which consisted principally of inquiries of management regarding the methods of measurement and presentation of therequired supplementary information. However, we did not audit the information and express no opinion on it.
Our audit was conducted for the purpose of forming opinions on the financial statements that collectively comprise theLower Township School District's basic financial statements. The accompanying Schedule of Expenditures of FederalAwards and State Financial Assistance are presented for purposes of additional analysis as required by U.S. Office ofManagement and Budget Circular A-l33, Audits of States, Local Governments, and Non-Profit Organizations and Stateof New Jersey Circular 04-04-0MB, Single Audit Policy for Recipients of Federal Grants, State Grants and State Aid,and are not a required part of the financial statements. In addition, the introductory section, combining statements andrelated major fund supporting statements and schedules, and statistical section listed in the table of contents are alsopresented for purposes of additional analysis and are not a required part of the basic fmancial statements. The Schedulesof Expenditures of Federal Awards and State Financial Assistance, combining statements and related major fundsupporting statements and schedules have been subjected to the auditing procedures applied in the audit of the basicfinancial statements and, in our opinion, are fairly stated in all material respects in relation to the basic financialstatements taken as a whole. The introductory and statistical sections have not been subjected to the auditing proceduresapplied in the audit of the basic financial statements, and accordingly, we express no opinion on them.
Respectfully submitted,
INVERSO & STEWART, LLCCertified Public Accountants
(}P A--Robert P. InversoCertified Public AccountantRegistered Municipal Accountant
Marlton, New JerseyOctober 16, 2012
13
INVERSO & STEWART, LLC
Certified Public AccountantsRegistered Municipal Accountants
12000 Uncoln Drive West, Suite 402Marlton, New Jersey 08053(856) 983-2244Fas (8S6) 983-6674E-Mail: Ist.plIstlVcOnCenlril..nel
-Member or-Ameril'an Institute or CPAsNew Jersey Sodety orCpAs
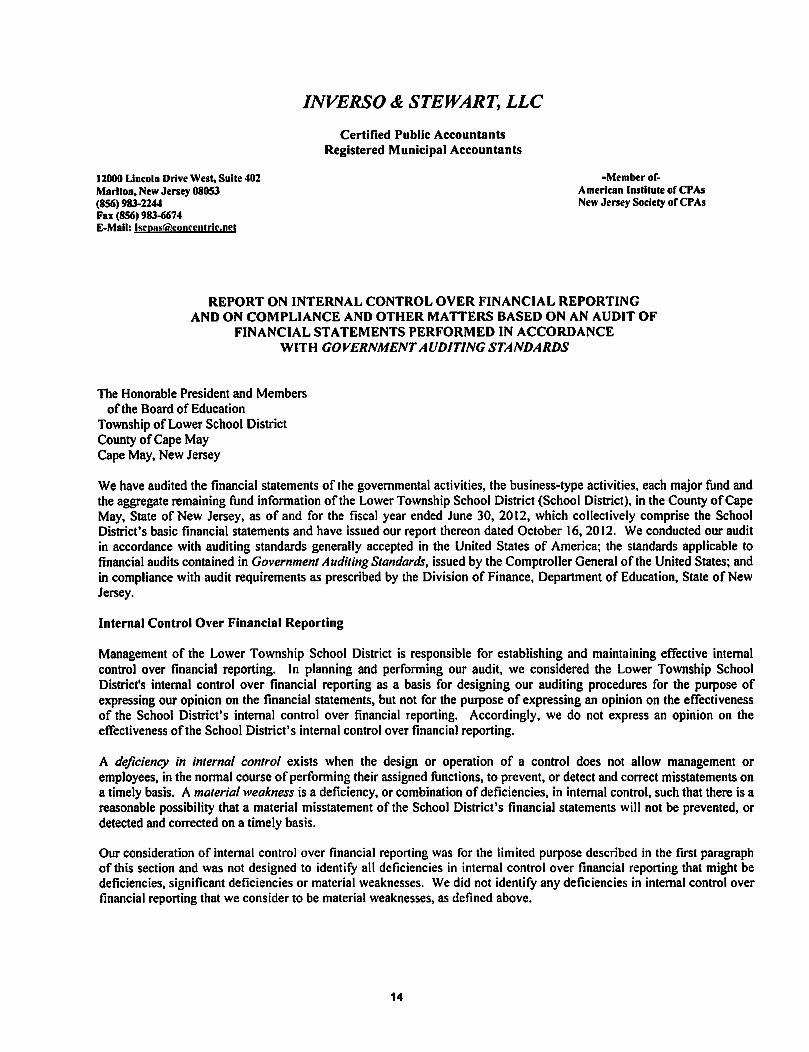
REPORT ON INTERNAL CONTROL OVER FINANCIAL REPORTINGAND ON COMPLIANCE AND OTHER MA TIERS BASED ON AN AUDIT OF
FINANCIAL STATEMENTS PERFORMED IN ACCORDANCEWITH GOVERNMENT AUDITING STANDARDS
The Honorable President and Membersof the Board of Education
Township of Lower School DistrictCounty of Cape MayCape May, New Jersey
We have audited the financial statements of the governmental activities, the business-type activities, each major fund andthe aggregate remaining fund information of the Lower Township School District (School District), in the County of CapeMay, State of New Jersey, as of and for the fiscal year ended June 30, 20' 2, which collectively comprise the SchoolDistrict's basic financial statements and have issued our report thereon dated October 16,2012. We conducted our auditin accordance with auditing standards generally accepted in the United States of America; the standards applicable tofinancial audits contained in Government Auditing Standards, issued by the Comptroller General of the United States; andin compliance with audit requirements as prescribed by the Division of Finance, Department of Education, State of NewJersey.
Internal Control Over Financial Reporting
Management of the Lower Township School District is responsible for establishing and maintaining effective internalcontrol over financial reporting. In planning and performing our audit, we considered the Lower Township SchoolDistrict's internal control over financial reporting as a basis for designing our auditing procedures for the purpose ofexpressing our opinion on the financial statements, but not for the purpose of expressing an opinion on the effectivenessof the School District's internal control over financial reporting. Accordingly, we do not express an opinion on theeffectiveness of the School District's internal control over financial reporting.
A deficiency in internal control exists when the design or operation of a control does not allow management oremployees, in the normal course of performing their assigned functions, to prevent, or detect and correct misstatements ona timely basis. A material weakness is a deficiency, or combination of deficiencies, in internal control, such that there is areasonable possibility that a material misstatement of the School District's financial statements will not be prevented, ordetected and corrected on a timely basis.
Our consideration of internal control over financial reporting was for the limited purpose described in the first paragraphof this section and was not designed to identify all deficiencies in internal control over financial reporting that might bedeficiencies, significant deficiencies or material weaknesses. We did not identify any deficiencies in internal control overfinancial reporting that we consider to be material weaknesses, as defined above.
14

Compliance and Other Matters
As part of obtaining reasonable assurance about whether the Lower Township School District's fmancial statements arefree of material misstatement, we performed tests of its compliance with certain provisions of laws, regulations, contractsand grant agreements, noncompliance with which could have a direct and material effect on the determination of financialstatement amounts. However, providing an opinion on compliance with those provisions was not an objective of ouraudit and, accordingly, we do not express such an opinion. The results of our tests disclosed no instances ofnoncompliance or other matters that are required to be reported under Government Auditing Standards and auditrequirements as prescribed by the Division of Finance, Department of Education, State of New Jersey.
We noted certain matters that we reported to management of the Lower Township School District in a separate reportentitled, Auditors Management Report on Administrative Findings - Financial. Compliance and Performance datedOctober 16,2012.
This report is intended solely for the information and use of the management of the School District, the Division ofFinance, Department of Education, State of New Jersey, and federal and state awarding agencies and pass-through entitiesand is not intended to be and should not be used by anyone other than these specified parties.
Respectfully submitted,
INVERSO & STEWART, LLCCertified Public Accountants
Robert P. InversoCertified Public AccountantRegistered Municipal Accountant
Marlton, New JerseyOctober 16,2012
15

Required Supplementary Information - Part I
Management's Discussion and Analysis

Lower Township School DistrictManagement's Discussion and AnalysisFor the Fiscal Year Ended June 30, 2012
As management of the Board of Education of the Township of Lower, New Jersey (School District), weoffer readers of the School District's financial statements this narrative overview and analysis of the SchoolDistrict for the fiscal year ended June 30, 2012. We encourage readers to consider the informationpresented in conjunction with additional information that we have furnished in our letter of transmittal,which can be found in the introductory section of this report.
Financial Highlights
• The assets of the School District exceeded its liabilities at the close of the most recent fiscalyear by $10,681,869 (net assets).
• Governmental activities have an unrestricted net assets deficit of $2,331,539. The accountingtreatments in the governmental funds for compensated absences payable, and the last twostate aid payments, and the state statute that prohibits school districts from maintaining morethan 2% of its adopted budget as unrestricted fund balance are primarily responsible for thisdeficit balance.
• The total net assets of the School District decreased by $49,022, or a 0.5% decrease from theprior fiscal year-end balance.
• Fund balance of the School District's governmental funds increased by $49,656resulting in an ending fund balance of $2,056,958. This increase is largely due to the resultsof operations of the General Fund.
• Business-type activities have unrestricted net assets of$350,571.
• The School District's long-term obligations decreased by $217,518 which is a decrease incompensated absences.
Overview of the Basic Financial Statements
This discussion and analysis is intended to serve as an introduction to the School District's basic financialstatements. Comparison to the prior year's activity is provided in this document. The basic financialstatements are comprised of three components: I) District-wide financial statements, 2} Fund financialstatements, and 3) Notes to the basic financial statements. This report also contains other supplementaryinformation in addition to the basic financial statements themselves.
District-wide Financial Statements
The district-wide financial statements are designed to provide the reader with a broad overview of thefinancial activities in a manner similar to a private-sector business. The district-wide financial statementsinclude the statement of net assets and the statement of activities.
17

The statement of net assets presents information about all of the School District's assets and liabilities. Thedifference between the assets and liabilities is reported as net assets. Over time, changes in net assets mayserve as a useful indicator of whether the financial position of the School District is improving ordeteriorating.
The statement of activities presents information showing how the net assets of the School District changedduring the current fiscal year. Changes in net assets are recorded in the statement of activities when theunderlying event occurs, regardless of the timing of related cash flows. Thus, revenues and expenses arereported in this statement even though the resulting cash flows may be recorded in a future period.
Both of the district-wide financial statements distinguish functions of the School District that are supportedfrom taxes and intergovernmental revenues (governmental activities) and other functions that are intendedto recover all or most of their costs from user fees and charges (business-type activities). Governmentalactivities consolidate governmental funds including the General Fund, Special Revenue Fund, CapitalProjects Fund, and Debt Service Fund. Business-type activities consolidate the Food Service Fund and theAfter-School Program.
Fund Financial Statements
Fund financial statements are designed to demonstrate compliance with finance-related requirements. Afund is a grouping of related accounts that is used to maintain control over resources that have beensegregated for specific objectives. All of the funds of the School District are divided into three categories:governmental funds. proprietary funds and fiduciary funds.
Governmental funds account for essentially the same information reported in the governmental activities ofthe district-wide financial statements. However, unlike the district-wide financial statements, thegovernmental fund financial statements focus on near-term financial resources and fund balances. Suchinformation may be useful in evaluating the financing requirements in the near term.
Since the governmental funds and the governmental activities report information using the same functions,it is useful to compare the information presented. Because the focus of each report differs, a reconciliationis provided on the fund financial statements to assist the reader in comparing the near-term requirementswith the long-term needs.
The School District maintains four individual governmental funds. The major funds are the General Fund,the Special Revenue Fund, the Capital Projects Fund, and the Debt Service Fund. They are presentedseparately in the fund financial statements.
The School District adopts an annual appropriated budget for the General Fund, Special Revenue Fund andthe Debt Service Fund. A budgetary comparison statement has been provided for each of these funds todemonstrate compliance with budgetary requirements.
Proprietary funds are used to present the same functions as the business-type activities presented in thedistrict-wide financial statements. The School District maintains one type of proprietary fund - theEnterprise Fund. The fund financial statements of the enterprise fund provides the same information as thedistrict-wide financial statements, only in more detail.
The School District's two enterprise funds (Food Service Fund and Day Care Program Fund) are listedindividually and are considered to be major funds.
Fiduciary funds are used to account for resources held for the benefit of parties outside the government.Fiduciary funds are not reflected in the district-wide financial statements because the resources of thosefunds are not available to support the School District's programs.
18

Notes to the Basic Financial Statements
The notes to the basic financial statements provide additional information that is essential to a fullunderstanding of the data provided in the basic financial statements.
Other Information
In addition to the basic financial statements and accompanying notes, this report also contains othersupplementary information and schedules required by the New Jersey Audit Program, issued by the NewJersey Department of Education.
District-wide Financial Analysis
The assets of the School District are classified as current assets and capital assets. Cash, investments,receivables, inventories and prepaid expenses are current assets. These assets are available to provideresources for the near-term operations of the School District. The majority of the current assets are theresults of the tax levy and state aid collection process.
Capital assets are used in the operations of the School District. These assets are land, buildings,improvements, equipment and vehicles. Capital assets are discussed in greater detail in the section titled,Capital Assets and Debt Administration, elsewhere in this analysis.
Current and long-term liabilities are classified based on anticipated liquidation either in the near-term or inthe future. Current liabilities include accounts payable, accrued salaries and benefits, unearned revenues,and current debt obligations. The liquidation of current liabilities is anticipated to be either from currentlyavailable resources, current assets or new resources that become available during fiscal year 2012. Long-term liabilities such as long-term debt obligations and compensated absences payable will be liquidatedfrom resources that will become available after fiscal year 2012.
The assets of the primary government activities exceeded liabilities by $10,3 16,298 with an unrestricteddeficit balance of$2,33 1,539. The net assets of the primary government do not include internal balances.
A net investment of $10,203,897 in land, improvements, buildings, equipment and vehicles which providethe services to the School District's public school students. Net assets oUI have been restricted to provideresources for future capital expansion and renovation projects, $1,292,246 has been restricted formaintenance projects, and $1,186,059 has been restricted for budget appropriation.
As mentioned earlier, deficit unrestricted net assets are primarily due to the accounting treatment forcompensated absences payable, the last two state aid payments, and state statutes that prohibit schooldistricts from maintaining more than 2% of its adopted budget as unrestricted fund balance.
19

Lower Township School DistrictComparative Summary of Net Assets
As of June 30, 2012 and 2011
Governmental Activities Business- Type Activities District-Wide
2012 2011 2012 2011 2012 2011
Assets:Current assets s 2,141,201 s 2,025,471 s 441,610 s 417,611 s 2,582,811 s 2.443.082
Capital assets 10,203,897 10,541,268 15.001 18.034 10.218.898 10.559.302
Total assets 12.345.098 12,566,739 456,611 435.645 12.801.709 13.002.384
Liabilities:Current Liabilities 84,243 18.168 954 1.164 85.197 19.332
Noncurrent Liabilities 1.944.557 2.161.701 90.086 90.460 2.034.643 2.252.161
Total liabilities 2,028,800 2.179.869 91.040 91.624 2.119.840 2.271.493
Net assets s 10.316,298 s 10.386.870 s 365.571 s 344,021 s 10.681.869 s 10.730.891
Net assets consist of:Invested in capital
Assets s 10.203,897 s 10,541,268 S 15,000 s 18,034 S 10,218,897 S 10.559.302Restricted net assets 2,443,940 2.378.542 2.443,940 2.378.542
Unrestricted net assets -2.331.539 -2.532.940 350.571 325.987 -1.980.968 -2.206.953
Net assets s 10,316,298 s 10,386.870 s 365.571 s 344.021 s 10.681.869 s 10.730.891
20

Lower Township School DistrictComparative Schedule of Changes in Net Assets
As of and for the Fiscal Year Ended June 30, 2012 and 2011
Governmental Activities Business-Type Activities District-Wide
2012 2011 2012 2011 2012 2011
Revenues:Program Revenues
Charges for services s 677,423 s 666,854 s 677,423 s 666,854
Operating grants and
Contributions s 3,340,003 s 3,025,112 748,186 697,275 4,088,189 3,722,387
General Revenues:
Property Taxes 14,659,327 14,371,889 14,659,327 14,371,889
Unrestricted State Aid 10,199,023 9,435,089 10,199,023 9,435,089
Tuition 19,971 35,869 19,971 35,869
Other Revenues 182,353 82,233 383 993 182,736 83,226
Total Revenues 28,400,677 26,950,192 1.425,992 1,365,122 29,826,669 28,315,314
Expenses:Governmental Activities:
Instruction 12,239,156 12,335,514 12,239,156 12,335,514Tuition 508,575 331,532 508,575 331,532Related Services 2,737,645 2,779,070 2,737,645 2,779,070Administrative
Services 1,195,374 1,123,685 1,195,374 1,123,685Central Services 357,775 351,603 357,775 351,603Operations and
Maintenance 2,464,083 2,181,749 2,464,083 2,181,749Transportation 1,299,670 1,153,759 1,299.670 1,153,759Employee Benefits 7,666,662 7,222,560 7.666.662 7,222,560Interest on long-term
Debt
Other 2,309 23,465 2,309 23,465Business-Type Activities:Food Service Operations 1,119,007 1.154,673 1,119,007 1,132,556
Day Care Program 285,435 336,113 285,435 314,208
Total Expenses 28,471.249 27,502,937 1,404,442 1,446,764 29.875.691 28,949,701
Increase in net assetsBefore transfers -70,572 -552.745 21,550 -81,642 -49,022 -634,387
Transfers
Changes in net assets -70,572 -552,745 21.550 -81,642 -49,022 -634,387Net assets, July I, 101386,870 101939,615 3441021 425,663 10,730,891 11,365.278Net assets. June 30. S 10,316.298 S 10,386,870 s 365,571 S 344,021 s 10,681,869 S 10.730,891
21

Governmental Activities
Governmental activities decreased the net assets of the School District by $70,572 during the current fiscalyear. Key elements of the decrease in net assets for governmental activities are as follows:
• Capital additions less depreciation expense decreased $337,372.
• Compensated absences decreased by $217,144.
Business-type Activities
Business-type activities increased the School District's net assets by $21,550. Key elements of the increasein net assets for business-type activities are as follows:
• The Food Service Fund had a net loss of $14,55 I and the Day Care Program had a netgain of$36,101.
Financial Analysis of the Governmental Funds
As noted earlier, the School District uses fund accounting to ensure and demonstrate compliance withfinance-related legal requirements.
Governmental Funds» The focus of the School District's governmental funds is to provide information onnear-term inflows, outflows, and balances of spendable resources. Such information is useful in assessingthe School District's financing requirements. In particular, unreserved fund balance may serve as a usefulmeasure ofa government's net resources available for spending at the end of the fiscal year.
As of the end of the current fiscal year, the School District's governmental funds reported a combinedending fund balance of $2,056,959, an increase of $49,656 in comparison with the prior year. Most of thisincrease is due to the General Fund results of operations.
The deficit unreserved fund balance for the School District at the end of the fiscal year includes acombination of an unreserved deficit fund balance for the General Fund of ($386,982) and ($34,366)in the Special Revenue Fund. The remainder of the fund balance is reserved to indicate that it is notavailable for new spending because it has already been committed I) as restricted cash reserved for futurecapital outlay expenditures of $1,2) $771,286 appropriated as a revenue source in the subsequent year'sbudget, 3) $407,533 reserved for future budget appropriation in accordance with state statute, 4) $7,239reserved for encumbrances, and 5) $1,292,246 reserved for maintenance.
The general fund is the chief operating fund of the School District. As discussed earlier, the balance in theunreserved fund balance is due, primarily, to the accounting treatment of the last two state aid payments asdiscussed in Note 17 of the notes to the basic financial statements, and state statutes that prohibit NewJersey school districts from maintaining more than 2% of its adopted budget as unrestricted fund balance.
22

General Fund Budgetary Highlights
The difference between the original budget and the final amended budget was $24,929 or a increase of.001%. The increase to the budget was due to reserve for encumbrances, Education Jobs Funds andNonpublic Transportation.
At the end of the current fiscal year, unassigned fund balance (budgetary basis) of the general fund was$499,613 while total fund balance (budgetary basis) was $2,977,919. As a measure of the general fund'sliquidity, it may be useful to compare both unreserved fund balance (budgetary basis) and total fundbalance (budgetary basis) to total general fund expenditures. Actual (budgetary basis) expenditures of theGeneral Fund including other financing uses amounted to $26,952,122. Unreserved fund balance(budgetary basis) represents 1.85% of expenditures while total fund balance (budgetary basis) represents11.05% of that same amount.
Capital Asset and Debt Administration
The School District's investment in capital assets for its governmental and business-type activities as ofJune 30, 2012, totaled $10,218,898 (net of accumulated depreciation). This investment in capital assetsincludes land, improvements, buildings, equipment and vehicles. The total decrease in the District'sinvestment in capital assets for the current fiscal year was $340,404 or a 3.22% decrease. The decrease isdue to depreciation.
Capital Asset (net of accumulated depreciation)June 30, 20ll and 2011
Governmental Activities Business-Type Activities District-Wide
2012 2011 2012 2011 2012 2011
Land S 80,045 S 80,045 S 80,045 S 80,045Consnuctien inProgressBuildings and Building
Improvements 9,524,475 9,887,320 9,524,475 9,887,320Equipment 599,077 573,903 S 15,001 S 18,034 614,078 591,937
Net assets S 10,203,597 S 10,541,268 s 15.001 s 18,034 S 10.218,598 S 10,559,302
Additional information on the School District's capital assets can be found in the notes to the basicfinancial statements (Note 5) of this report.
Long-term debt - During the fiscal year ended June 30, 2012, the School District had $1,944,557 incompensated absences.
State statutes limit the amount of general obligation debt that the District may issue. At the end of thecurrent fiscal year, the legal debt limit was $104,439,224. The available amount as of June 30, 2012 is$104,439,224.
Additional information on the School District's long-term obligations can be found in the notes to the basicfinancial statements (Note 7) of this report.
23
Economic Factors and Next Year's Budgets and Rates
The following factors were considered and incorporated into the preparation of the School District's budgetfor the 2012-13 fiscal year.
• For 2012-13 fiscal year the School District will be receiving an increase in state aid. The local taxlevy in the General Fund increased by $293,187 or a 2.0%. Salaries continue to increasecontractually; however, the District has managed to control costs. The 2012-13 General FundBudget is $424,388 greater than the previous year or a 1.67 % increase. The tax rate was .355 in2011 and slightly increased to .362 in 2012.
For the Future
The Lower Township Public School District is in very good financial condition presently. However, amajor concern is the increased reliance on local property taxes as state aid has remained stagnant. LowerTownship is primarily a residential community, with very few large ratables; thus the burden is focused onhomeowners to share the tax burden.
In conclusion, the Lower Township Public School District has committed itself to financial excellence formany years. In addition, the School District's system for financial planning, budgeting, and internalfinancial controls are well regarded. The School District plans to continue its sound fiscal management tomeet the challenge of the future.
Requests for Information
This financial report is designed to provide a general overview of the School District's finances for allthose with an interest in the School District. Questions concerning any of the information provided in thisreport or requests for additional financial information should be addressed to the Lower Township SchoolDistrict Business Administrator, 834 Seashore Rd., Cape May, New Jersey 08204.
24

Basic Financial Statements

District-Wide Financial Statements

A-1LOWER TOWNSHIP SCHOOL DISTRICT
Statement of Net AssetsJune 30,2012
Governmental Business-typeActivities Activities Total
ASSETS:Cash and cash equivalents $2,037,872 $293,801 $2,331,673Receivables, net 186,863 48,562 235,425Inventory (Note 6) 15,712 15,712Internal balances (83,535) 83,535Restricted assets:
Restricted cash and cash equivalents 1 1Capital assets, net (Note 5) 10,203,897 15,001 10,218,898
Total assets 12,345,098 456,611 12,801,709
UABIUTlES:Accounts payable 84,243 84,243Deferred revenue 954 954Noncurrent liabilities (Note 7):
Due within one yearDue beyond one year 1,944,557 90,086 2,034,643
Total liabilities 2,028,800 91,040 2,119,840
NET ASSETS:Invested in capital assets, net of related debt 10,203,897 15,000 10,218,897Restricted for:
Special Revenue (34,366) (34,366)Capital Projects 1 1Other purposes 2,478,305 2,478,305
Unrestricted (2,331,539) 350,571 (1,980,968)
Total net assets $1013161298 $3651571 $1016811869
The accompanying Notes to the Basic Financial Statements are an integral part of this statement.
27

A-2
LOWER TOWNSHIP SCHOOL DISTRICTStatement of Activities
For the Fiscal Year Ended June 30, 2012
FunctionsIPrograms
Program RevenuesNet (Expense) Revenue and
Changes In Net Assets
ExpensesCharges for
Services
OperatingGrants and
ContributionsGovernmental Business-type
Activities Activities Total
Govemmental activities:Instruction:
RegularSpecial educationOther instruction
Support Services:TuitionStudent & instruction related servicesGeneral administrative servicesSchool administrative servicesCentral servicesPlanl operations and maintenancePupiltransportalionUnallocated employee benefits
Unallocated depreciation and amortizationTolal govemmental activities
BUSiness-type activities:Day care programFood service programTotal business-type activities
Total primary govemment
$9,592,665 $681.861 ($8.910,804) ($8,910.804)2,552,724 509.436 (2.043.288) (2.043,288)
93,767 (93.767) (93.767)
508.575 (508.575) (508,575)2.737.645 1n.248 (2,560.397) (2,560.397)
272.846 (272.846) (272.846)922,528 (922.528) (922,528)357,775 (357,775) (357,775)
2,464,083 (2,464,083) (2,464,083)1,299,670 (1,299,670) (1,299,670)7,666,662 1,971,458 (5,695,204) (5,695,204)
2,309 {2,309~ {2,309~28,471,249 3,340,003 (25.131,246) (25,131,246)
285,435 $321,536 $36,101 36,1011,119,007 3551887 748,186 {14,934} {141934}114041442 6n,423 748,186 21,167 21,167
$291875,691 $677,423 $4,088,189 {$25,131,246} $21,167 {$25,110,079}
General revenues:Taxes:
Property taxes, levied for general purposes, net 14,659,327 14,659,327Federat and state aid not restricted 10,199,023 10,199,023Tuition charges 19,971 19,971Miscellaneous income 182,353 383 182,736Transfer
Total general revenues, special items, extraordinary items and transfers 25,060,674 383 25,061,057Change in Net Assets (70,572) 21,550 (49,022)
Net Assets - July 1 10,386.870 344,021 10,730,891Net Assets - June 30 $10,316,298 $365,571 $10,681,869
The accompanying Notes to the Basic Financial Stalements are an integral part of this statement.
Fund Financial Statements

ASSETS
Assets:Cash and cash equivalentsReceivables, netInterfund receivableRestricted cash and cash equivalents
Total assets
UABIU"nES AND FUND BALANCESUabilities:
Accounts payableInterfund payables
Total liabilities
Fund Balances:Restricted for:
Excess surplusExcess surplus - designated for
subsequent year's expendituresMaintenance reserveCapital reserve
Assigned to:Year-end encumbrancesSubsequent year's expenditures
Unassigned
Total fund balances
Total liabilities and fund balances
LOWER TOWNSHIP SCHOOL DISTRICTBalance Sheet
Governmental FundsJune 30,2012
GeneralFund
SpecialRevenue
Fund
CapitalProjects
Fund
DebtServiceFund
$2,037,87216,316
136,6021
$138,315
$2,190,791 $138,315
13,81485,653
70,429102,252
99,467 172,681
B-1
TotalGovemmental
Funds
$2,037,872154,631136,602
1
$2,329,106
84,243187,905
272,148
407,534 407,534
507,648 507,6481,292,246 1,292,246
1 1
7,239 7,239263,638 263,638
(386,982) (34,366) (421,348)
2,091,324 (34,366) 2,056,958
$2,190,791 $138,315
Amounts reported for govemmental activities In the statement of net assets(A-1) are different because:
Capital assets used in govemmental activities are not financial resourcesand therefore are not reported in the funds. The cost of the assets Is$19,481,914 and the accumulated depreciation is $9,278,017.
Long-term liabilities, Including bonds payable, are not due and payableIn the current period and therefore are not reported as liabilities in thefunds.
Net assets of govemmental activities
The accompanying Notes to the Basic Financial Statements are an integral part of this statement.
30
10,203,897
(1 ,944,557)
$10,316,298

B-2LOWER TOWNSHIP SCHOOL DISTRICT
Statement of Revenues, Expenditures and Changes In Fund BalancesGovernmental Funds
for the Fiscal Year Ended June 30,2012
Special Capital Debt TotalGeneral Revenue Projects Service Governmental
Fund Fund Fund Fund FundsREVENUES:Local sources:
Local tax levy $14,659,327 $14,659,327Tuition charges 19,971 19,971Miscellaneous 1821353 1821353
Total revenues·1oca1sources 14,861,651 14,861,651
Local sources $1,500 I,SOOState sources 11,736,708 348,850 12,085,558Federal sources 4331n2 11°18.195 114511967
Total revenues 27,0321131 11368.545 28,4001676
EXPENDITURES:Current expense:
Regular instruction 8.811.018 676,667 9,487,685Special education instruction 2.043,288 509,436 2,552,724Other instruction 93,767 93,767Support services and undistributed costs:
Tuition 508.575 508,575Student & instruction related services 2,S60,397 In.248 2.737.645General administrative services 272,846 272,846School administrative services 876,S11 876,511Central services 357,nS 357,n5Plant operations and maintenance 2,313,328 2.313,328Pupil transportation 1,299.670 1.299,670Unallocated employee benefits 7.666.662 7,666,662
Capital outlay 1481285 148.285
Total expenditures 2619521122 113631351 281315.473
Excess (deficiency) of revenues over(under) expenditures 8°1009 51194 851203
Other Financing Sources (Uses):cancelled SOA Grant (35.548) (35,548)Transfers in 53.322 53,322Transfers out (531322} (53,322}
Total other financing sources (uses) 531322 (88.870} (3S1548}
Net change in fund balance 133.331 5,194 (88.870) 49,655Fund balances. July 1 1.9571993 (391560} 88,870 2.007,303
Fund balances. June 30 $2,091,324 ~$34I366l $2,OS6.958
The accompanying Notes to the Basic Financial Statements are an integral part of this statement.
31
,........;:::4

B-3LOWER TOWNSHIP SCHOOL DISTRICT
Reconciliation of the Statement of Revenues, Expendibnesand Changes in Fund Balances of Governmental Funds
to the Statement of Activitiesfor the Fiscal Year Ended June 30, 2012
Total net change in fund balances - governmental funds (from B-2) $49.656
Amounts reported for governmental activities in the statement of activities (A-2)are different because:
Capital outlays are reported in the governmental funds as expenditures.However. on the statement of activities. the cost of those assets is allocatedover their estimated useful lives as depreciation expense. This is the amountby which capital outlay exceeded depreciation in the current fiscal year.
Depreciation expenseCapital outlay
($410.720)73.348 (337.372)
In the statement of activities. certain operating expenses. e.g .• compensatedabsences (vacations) are measured by the amounts earned during theyear. In the governmental funds. however. expenditures for these itemsare reported in the amount of financial resources used (paid). When theearned amount exceeds the paid amount. the difference is a reduction inthe reconciliation (-); when the paid amount exceeds the earned amountthe difference is an addition to the reconciliation (+). 217.144
Change in net assets of governmental activities ($70.572)
The accompanying Notes to the Basic Financial Statements are an integral part of this statement.
32

LOWER TOWNSHIP SCHOOL DISTRICTStatement of Net Assets
Proprietary FundsJune 30, 2012
B-4
Business-typeActivities
Enterprise Funds
FoodService
FundASSETS:
Current assets:Cash and cash equivalents $247,120
45,85185,65315,712
Accounts receivableInterfund receivableInventories
Total current assets 394,336
Noncurrent assets:EquipmentLess accumulated depreciation
286,015(271,014)
Total noncurrent assets 15,001
Total assets $409,337
LIABILITIES
Current liabilities:Accounts payableDeferred revenueInterfund payable 2,118
Total current liabilities 2,118
Noncurrent liabilities:Compensated absences 90,086
Total noncurrent liabilities 90,086
Total liabilities 92,204
NET ASSETSInvested in capital assets net of
related debtUnrestricted
15,000302,133
Total net assets $317,133
DayCare
Program
$46,681
2,711
49,392
$49,392
954
954
954
48.438
$48.438
33
The accompanying Notes to the Basic Financial Statements are an integral part of this statement.

8-5
LOWER TOWNSHIP SCHOOL DISTRICTStatement of Revenues, Expenses and Changes in Fund Net Assets
Proprietary Fundsfor the Fiscal Year Ended June 30, 2012
Business-typeActivities
Enterprise Funds
FoodService
Fund
DayCare
ProgramOperating revenues:
Charges for services:Daily sales-reimbursable programsDaily sales-non-reimbursable programs
$168,748187,139 $321,536
Total operating revenue 355,887 321,536
Operating expenses:SalariesEmployee benefitsSupplies and materialsProfessional servicesDepreciationCost of salesPurchased property servicesOther
395,536233,96831,085
1.2283.033
435,30014,3394.518
239,41918.315
27.701
Total operating expenses 1.119.007 285,435
Operating income (loss) (763,120) 36.101
Nonoperating revenues (expenses):State sources:
State school lunch programFederal sources:ARRA - National school lunch equipmentNational school lunch programSchool breakfast programSnack ProgramU.S.D.A. commodities
Local sources:Operating transfer inInterest revenue
10,864
405,061264.392
3.32264.547
383
748.569
(14,551) 36.101
331.684 12.337
$317.133 $48,438
Total nonoperating revenues (expenses)
Change in net assets
Total net assets - July 1
Total net assets - June 30
The accompanying Notes to the Basic Financial Statements are an integral part of this statement.
34
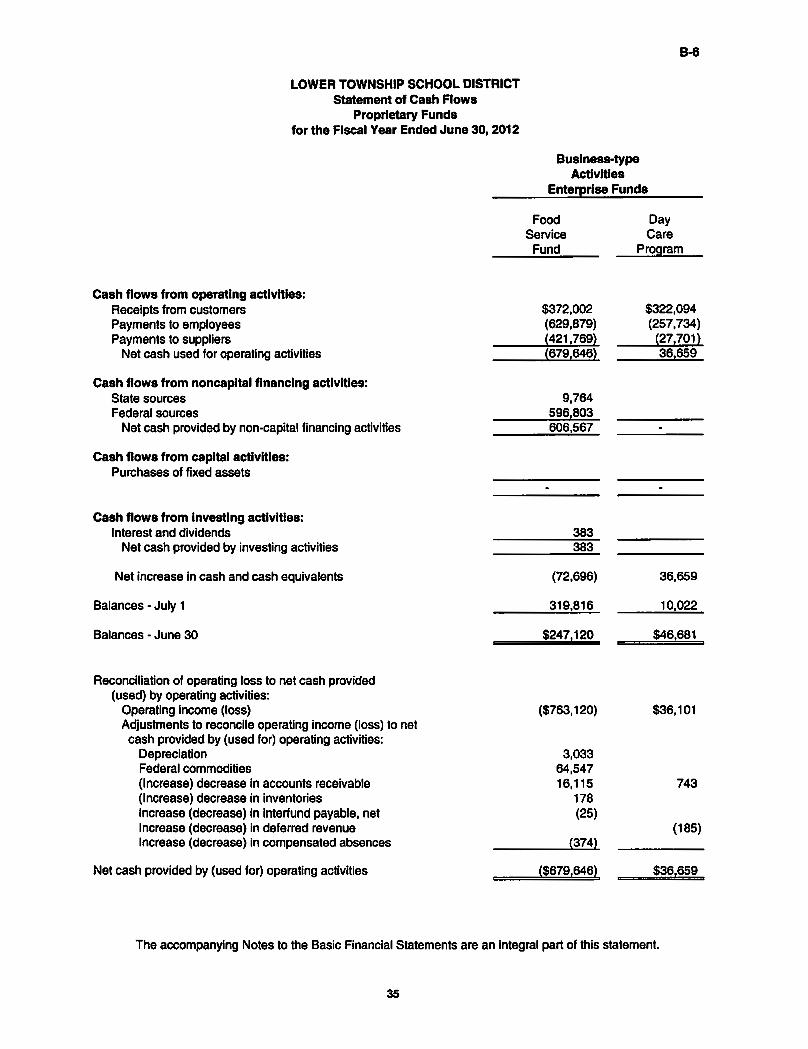
LOWER TOWNSHIP SCHOOL DISTRICTStatement of Cash Flows
Proprietary Fundsfor the Fiscal Year Ended June 30,2012
Business-typeActivities
Enterprise Funds
Cash flows from operating activities:Receipts from customersPayments to employeesPayments to suppliers
Net cash used for operating activities
Cash flows from noncapltal financing activities:State sourcesFederal sources
Net cash provided by non-capital financing activities
Cash flows from capital activities:Purchases of fixed assets
Cash flows from Investing activities:Interest and dividends
Net cash provided by investing activities
Net increase in cash and cash equivalents
Balances - July 1
Balances - June 30
Reconciliation of operating loss to net cash provided(used) by operating activities:
Operating income (loss)Adjustments to reconcile operating income (loss) to net
cash provided by (used for) operating activities:DepreciationFederal commodities(Increase) decrease in accounts receivable(Increase) decrease in inventoriesIncrease (decrease) in interfund payable, netIncrease (decrease) in deferred revenueIncrease (decrease) In compensated absences
Net cash provided by (used for) operating activities
FoodService
Fund
$372,002(629,879)(421,769)(679,646)
9,764596,803606,567
383383
(72,696)
319,816
$247,120
($763,120)
3,03364,54716,115
178(25)
(374)
($679.646)
DayCare
Program
$322,094(257,734)
(27,701)36,659
36,659
10,022
$46.681
$36,101
743
(185)
$36,659
The accompanying Notes to the Basic Financial Statements are an integral part of this statement.
35
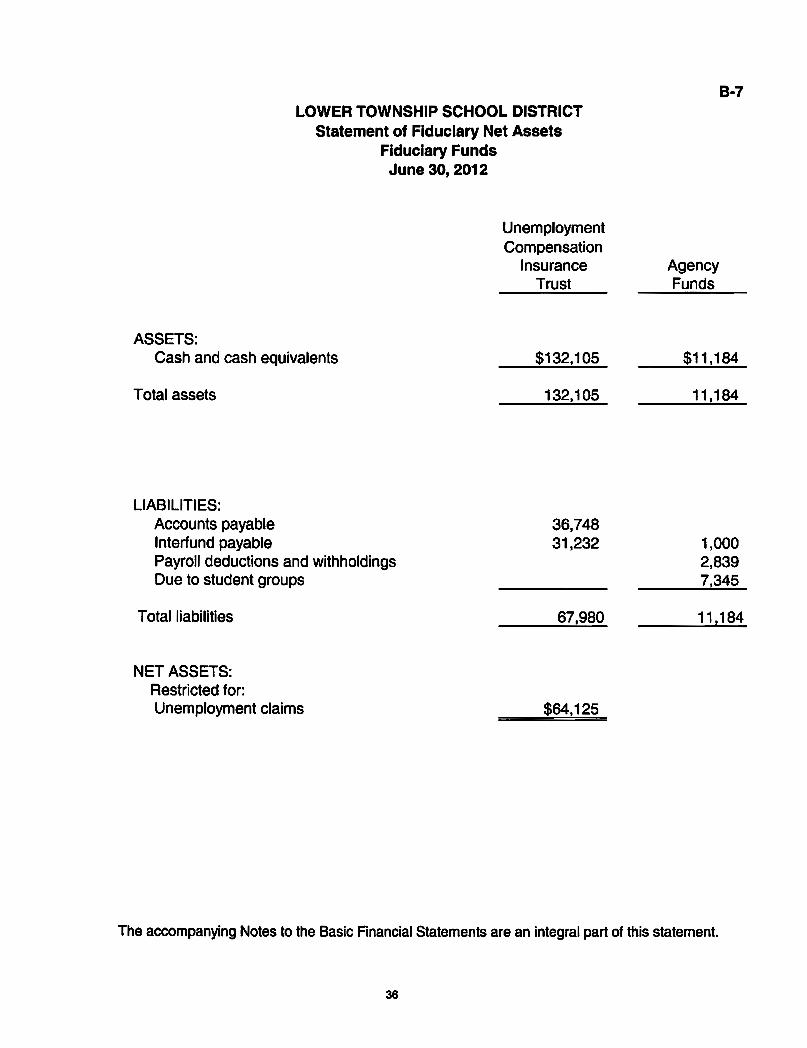
LOWER TOWNSHIP SCHOOL DISTRICTStatement of Fiduciary Net Assets
Fiduciary FundsJune 30, 2012
UnemploymentCompensation
InsuranceTrust
ASSETS:Cash and cash equivalents $132,105
Total assets 132,105
LIABILITIES:Accounts payableInterfund payablePayroll deductions and withholdingsDue to student groups
36,74831,232
Total liabilities 67,980
NET ASSETS:Restricted for:Unemployment claims $64,125
B-7
AgencyFunds
$11,184
11,184
1,0002,8397,345
11,184
The accompanying Notes to the Basic Financial Statements are an integral part of this statement.
36

LOWER TOWNSHIP SCHOOL DISTRICTStatement of Changes in Fiduciary Net Assets
Fiduciary FundsFor the Fiscal Year Ended June 30,2012
ADDITIONS:Contributions:
Board contributionsEmployee withholdings
Total Contributions
Investment earnings:InterestNet investment earnings
Total additions
DEDUCTIONS:Unemployment payments
Total deductions
Change in net assets
Net assets - July 1
Net assets - June 30
8-8
UnemploymentCompensation
InsuranceTrust
$48,86048,860
146146
49,006
25,46825,468
23,538
40,587
$64,125
The accompanying Notes to the Basic Financial Statements are an integral part of this statement.
37

Lower Township School DistrictNotes to Basic Financial Statements
For the Fiscal Year Ended June 30, 2012
I. DESCRIPTION OF SCHOOL DISTRICT AND REPORTING ENTITY
The Lower Township School District (District) is a Type II school district located in Cape May County, New Jersey andcovers an area of approximately 31 square miles. As a Type II school district, it functions independently through a Boardof Education. The Board is comprised of nine members elected to three-year terms. These terms are staggered so thatthree member's terms expire each year. The purpose of the District is to provide educational services for all of LowerTownship's students in grades preschool through 6. Students in grades 7 through 12 attend Lower Cape May Regional.The Lower Township School District has an approximate enrollment at June 30, 2012 of 1,828students.
The primary criteria for including activities within the School District's reporting entity, as set forth in Section 2100 of theGovernmental Accounting Standards Board (GASB) Codification of Governmental Accounting and Financial ReportingStandards is the degree of oversight responsibility maintained by the School District. Oversight responsibility includesfinancial interdependency, selection of governing authority, designation of management, ability to significantly influenceoperations and accountability for fiscal matters. The combined financial statements include all funds of the School districtover which the Board exercises operating control. There were no additional entities required to be included in the reportingentity under the criteria as described above. Furthermore, the School District is not includable in any other reporting entityon the basis of such criteria.
Basis of Presentation
The basic financial statements of the School District have been prepared in conformity with accounting principles generallyaccepted in the United States of America (GAAP) as applied to governmental units. The Governmental AccountingStandards Board (GASB) is the accepted standard-setting body for establishing governmental accounting and financialreporting principles. The School District also applies Financial Accounting Standards Board (FASB) Statements andInterpretations issued on or before November 30, 1989 to its governmental and business-type activities and to itsproprietary funds, provided they do not conflict with or contradict GASB pronouncements. The more significant of theSchool District's accounting policies are described below.
The School District's basic financial statements consists of government-wide statements, including a statement of net assetsand a statement of activities, and fund financial statements, which provide a more detailed level of financial information.
Government-wide Statements - The statement of net assets and the statement of activities display informationabout the School District as a whole. These statements include the financial activities of the primary government,except for fiduciary funds. The statements distinguish between those activities of the School District that aregovernmental and those that are considered business-type activities. The statement of net assets presents thefinancial condition of the governmental and business-type activities of the School District at fiscal year-end. Thestatement of activities presents a comparison between direct expenses and program revenues for each program orfunction of the School District's governmental activities and for the business-type activities of the School District.Direct expenses are those that are specifically associated with a service, program or department and, therefore,clearly identifiable to a particular function. The policy of the School District is to not allocate indirect expenses tofunctions in the statement of activities. Program revenues include charges paid by the recipient of the goods orservices offered by the program, grants and contributions that are restricted to meeting the operational or capitalrequirements of a particular program and interest earned on grants that is required to be used to support a particularprogram. Revenues, which are not classified as program revenues, are presented as general revenues of the SchoolDistrict. with certain limited exceptions. The comparison of direct expenses with program revenues identifies theextent to which each business segment or governmental function is self-financing or draws from the generalrevenues of the School District.
38

Lower Township School DistrictNotes to Basic Financial Statements
For the Fiscal Year Ended June 30,2012
I. SUMMARY OF SIGNIFICANT ACCOUNTING POLICIES (CONTINUED)
Fund Financial Statements - During the fiscal year, the School District segregates transactions related to certainSchool District functions or activities in separate funds in order to aid financial management and to demonstratelegal compliance. Fund financial statements are designed to present financial information of the School District atthis more detailed level. The focus of governmental and enterprise fund financial statements is on major funds.Each major fund is presented in a single column. The fiduciary fund is reported by type. The School District usesfunds to maintain its financial records during the fiscal year. A fund is defined as a fiscal and accounting entity witha self-balancing set of accounts. There are three categories of funds: governmental, proprietary, and fiduciary.
Governmental Funds - Governmental funds are those through which most governmental functions typically are financed.Governmental fund reporting focuses on the sources, uses and balances of current financial resources. Expendable assetsare assigned to the various governmental funds according to the purposes for which they mayor must be used. Currentliabilities are assigned to the fund from which they will be paid. The difference between governmental fund assets andliabilities is reported as fund balance. The following are the School District's major governmental funds:
General Fund - The general fund is the general operating fund of the School District and is used to account for allfinancial resources except those required to be accounted for in another fund. Included are certain expenditures forvehicles and movable instructional or non-instructional equipment classified in the capital outlay sub-fund.
As required by the New Jersey State Department of Education, the School District includes budgeted capital outlayin this fund. Accounting principles generally accepted in the United States of America as they pertain togovernmental entities state that general fund resources may be used to directly finance capital outlays for long-livedimprovements as long as the resources in such cases are derived exclusively from unrestricted revenues.
Resources for budgeted capital outlay purposes are normally derived from State of New Jersey aid, district taxes andappropriated fund balance. Expenditures are those which result in the acquisition of or additions to capital assets forland, existing buildings, improvements of grounds, construction of buildings, additions to or remodeling of buildingsand the purchase of built-in equipment.
In addition to the capital outlay sub-fund, the School District is accountable for an additional sub-fund, the EducationJobs Fund ("Ed Jobs"), resulting from federal legislation signed into law on August 10,2011. The Ed Jobs programwas created to provide funding assistance to states in order to save or create education jobs for the period from theSeptember 30, 2011 through September 30, 2012. Jobs funded under this program include those that provideeducational and related services for early childhood, elementary, and secondary education. Ed Jobs revenues andexpenditures are recorded in the general fund (fund 18) on a reimbursement basis. As such, revenue is not includedin the fiscal year surplus, and no portion of general fund balance at June 30, 2012 is considered to be attributable toEd Jobs. Ed Jobs expenditures are included as a component of overall general fund expenditures, and are alsoincluded in general fund expenditures for purposes of the excess surplus calculation.
Special Revenue Fund - The special revenue fund is used to account for and report the proceeds of specificrevenues sources that are restricted or committed to expenditure for specified purposes other than debt service orcapital projects.
Capital Projects Fund - The capital projects fund is used to account and report financial resources that arerestricted, committed, or assigned to expenditure for capital outlays, including the acquisition or construction ofcapital facilities and other capital assets, other than those financed by proprietary funds. The financial resources arederived from New Jersey Economic Development Authority grants, temporary notes or serial bonds which arespecifically authorized by the voters as a separate question on the ballot either during the annual election or at aspecial election.
Debt Service Fund - The debt service fund is used to account for and report financial resources that are restricted,committed, or assigned to expenditure for principal and interest.
39
Lower Township School DistrictNotes to Basic Financial Statements
For the Fiscal Year Ended June 30, 2012
1. SUMMARY OF SIGNIFICANT ACCOUNTING POLICIES (CONTINUED)
Proprietary Funds - Proprietary funds are used to account for the School District's ongoing activities, which are similar tothose in the private sector.
Enterprise Funds - The enterprise funds are used to account for operations that are financed and operated in amanner similar to private business enterprises, where the intent of the School District is that all costs (expenses,including depreciation) of providing goods or services to the students on a continuing basis be financed or recoveredprimarily through user charges; or, where the School District has decided that periodic determination of revenuesearned, expenses incurred, and/or net income is appropriate for capital maintenance, public policy, managementcontrol, accountability, or other purposes.
The School District's enterprise funds are:
Food Service Fund - This fund accounts for the financial transactions related to the food service operations of theSchool District.
Day Care Program - This fund accounts for the financial transactions related to the day care operations of theDistrict.
All proprietary funds are accounted for on a cost of services or "capital maintenance" measurement focus. This means thatall assets and all liabilities, whether current or noncurrent, associated with their activity are included on their balancesheets. Their reported fund equity (net assets) is segregated into investment in capital assets, net of related debt, andunrestricted net assets, if applicable. Proprietary fund type operating statements present increases (revenues) and decreases(expenses) in net total assets.
Depreciation of all exhaustive fixed assets used by proprietary funds is charged as an expense against their operations.Accumulated depreciation is reported on proprietary fund balance sheets. Depreciation has been provided over theestimated useful lives using the straight-line method. The estimated useful lives are as follows:
EquipmentLight Trucks and VehiclesHeavy Trucks and Vehicles
12 Years4 Years6 Years
Internal Service Fund - The internal service fund has been established to account for the financing of transportationservices and substitute teacher services provided by the Audubon School District for use by other school districts, as wellas for the Audubon School District itself. Services are provided on a cost-reimbursement basis.
Fiduciary Funds - Fiduciary fund reporting focuses on net assets and changes in net assets. The fiduciary fund category issplit into two classifications: trust funds and agency funds. Agency funds are used to account for assets held by the SchoolDistrict in a trustee capacity or as an agent for individuals, private organizations, other governments, and/or other funds(i.e, payroll and student activities). They are custodial in nature (assets equal liabilities) and do not involve measurementof results of operations. The School District has four fiduciary funds; an unemployment compensation trust fund, a privatepurpose scholarship fund, a student activity fund, and a payroll fund.
Measurement Focus
Government-wide Financial Statements - The government-wide financial statements are prepared using the economicresources measurement focus. All assets and all liabilities associated with the operation of the School District are includedon the statement of net assets.
40
Lower Township School DistrictNotes to Basic Financial Statements
For the Fiscal Year Ended June 30, 2012
1. SUMMARY OF SIGNIFICANT ACCOUNTING POLICIES (CONTINUED)
Fund Financial Statements - All governmental funds are accounted for using a flow of current financial resourcesmeasurement focus. With this measurement focus, only current assets and current liabilities generally are included on thebalance sheet. The statement of revenues, expenditures and changes in fund balances reports on the sources (i,e. revenuesand other financing sources) and uses (i.e. expenditures and other financing uses) of current financial resources. Thisapproach differs from the manner in which the governmental activities of the government-wide financial statements areprepared. Governmental fund financial statements, therefore, include a reconciliation with brief explanations to betteridentify the relationship between the government-wide statements and the statements for governmental funds.
Like the government-wide statements, all proprietary fund types are accounted for on a flow of economic resourcesmeasurement focus. All assets and all liabilities associated with the operation of these funds are included on the statementof net assets. The statement of changes in fund net assets presents increases (i.e. revenues) and decreases (i.e. expenses) innet total assets. The statement of cash flows provides information about how the School District finances and meets thecash flow needs of its proprietary activities. Fiduciary funds are reported using the economic resources measurementfocus.
Basis of AccountingBasis of accounting determines when transactions are recorded in the financial records and reported on the financialstatements. Government-wide financial statements are prepared using the accrual basis of accounting. Governmentalfunds use the modified accrual basis of accounting. Proprietary and fiduciary funds also use the accrual basis ofaccounting. Differences in the accrual and the modified accrual basis of accounting arise in the recognition of revenue, therecording of deferred revenue, and in the presentation of expenses versus expenditures.
Revenues - Exchange and Non-exchange Transactions - Revenue resulting from exchange transactions, in which eachparty gives and receives essentially equal value is recorded on the accrual basis when the exchange takes place. On amodified accrual basis, revenue is recorded in the fiscal year in which the resources are measurable and becomeavailable. "Measurable" means the amount of the transaction can be determined and "available" means that the resourceswill be collected within the current fiscal year or are expected to be collected soon enough thereafter to be used to payliabilities of the current fiscal year. For the School District, available means expected to be received within sixty daysafter fiscal year end.
Non-exchange transactions, in which the School District receives value without directly giving equal value in return,include Ad Valorem (property) taxes, grants, entitlements, and donations. Ad Valorem (Property) Taxes are susceptibleto accrual, as under New Jersey State Statute, a municipality is required to remit to its school district the entire balance oftaxes in the amount voted upon or certified, prior to the end of the school year. The School District records the entireapproved tax levy as revenue (accrued) at the start of the fiscal year since the revenue is both measurable and available.The School District is entitled to receive monies under the established payment schedule and the unpaid amount isconsidered to be an "accounts receivable". With the exception of restricted formula aids recorded in the special revenuefund, revenue from grants, entitlements, and donations is recognized in the fiscal year in which all eligibilityrequirements have been satisfied. Eligibility requirements include timing requirements, which specify the fiscal yearwhen the resources are required to be used or the fiscal year when use is first permitted, matching requirements, in whichthe School District must provide local resources to be used for a specified purpose, and expenditure requirements, inwhich the resources are provided to the School District on a reimbursement basis.
Under the modified accrual basis, the following revenue sources are considered to be both measurable and available atfiscal year-end; tuition, grants, fees, and rentals.
Expenses/Expenditures - On the accrual basis of accounting, expenses are recognized at the time they are incurred.The fair value of donated commodities used during the fiscal year is reported in the operating statement as an expense.Unused donated commodities are reported as deferred revenue. The measurement focus of governmental fundaccounting is on decreases in net financial resources (expenditures) rather than expenses. Expenditures are generallyrecognized in the accounting period in which the related fund liability is incurred, if measurable. Allocations of cost,such as depreciation and amortization, are not recognized in governmental funds.
41

Lower Township School DistrictNotes to Basic Financial Statements
For the Fiscal Year Ended June 30, 2012
1. SUMMARY OF SIGNIFICANT ACCOUNTING POLICIES (CONTINUED)
Budgets/Budgetary Control - Annual appropriated budgets are prepared in the spring of each fiscal year for the general,special revenue, and debt service funds. The budgets are submitted to the county office for their approval. Budgets areprepared using the modified accrual basis of accounting. The legal level of budgetary control is established at line itemaccounts within each fund. Line item accounts are defined as the lowest (most specific) level of detail as establishedpursuant to the minimum chart of accounts referenced in NJ.A.C. 6:23A-16.2(t)1. Transfers of appropriations may bemade by School Board resolution at any time during the fiscal year in accordance with N.J.A.C. 6A:23A-13.3.
Formal budgetary integration into the accounting system is employed as a management control device during the fiscalyear. For governmental funds there are no substantial differences between the budgetary basis of accounting andaccounting principles generally accepted in the United States of America with the exception of the legally mandatedrevenue recognition of the one or more June state aid payments for budgetary purposes only and the special revenue fund.Encumbrance accounting is also employed as an extension of formal budgetary integration in the governmental fund types.Unencumbered appropriations lapse at fiscal year end.
The accounting records of the special revenue fund are maintained on the budgetary basis. The budgetary basis differsfrom GAAP in that the budgetary basis recognizes encumbrances as expenditures and also recognizes the related revenues,whereas the GAAP basis does not. Sufficient supplemental records are maintained to allow for the presentation of GAAPbasis financial reports.
The budget, as detailed on Exhibit C-I, Exhibit C-2 and Exhibit 1-3, includes all amendments to the adopted budget, ifany.
Exhibit C-3 presents a reconciliation of the general fund revenues and special revenue fund revenues and expendituresfrom the budgetary basis of accounting as presented in the general fund budgetary comparison schedule and the specialrevenue fund budgetary comparison schedule to the GAAP basis of accounting as presented in the statement of revenues,expenditures and changes in fund balances - governmental funds. Note that the School District does not reportencumbrances outstanding at year end as expenditures in the general fund since the general fund budget follows modifiedaccrual basis with the exception of the revenue recognition policy for the one or more June state aid payments.
Encumbrances - Under encumbrance accounting purchase orders, contracts and other commitments for the expenditure ofresources are recorded to reserve a portion of the applicable appropriation. Encumbrances are a component of fund balanceat fiscal year end as they do not constitute expenditures or liabilities but rather commitments related to unperformedcontracts for goods and services. Open encumbrances in governmental funds, other than the special revenue fund, whichhave not been previously restricted, committed, or assigned, should be included within committed or assigned fundbalance, as appropriate.
Open encumbrances in the special revenue fund, however, for which the School District has received advances of grantawards, are reflected in the balance sheet as deferred revenues at fiscal year end.
The encumbered appropriation authority carries over into the next fiscal year. An entry will be made at the beginning ofthe next fiscal year to increase the appropriation reflected in the certified budget by the outstanding encumbrance amountas of the current fiscal year end.
Cash, Cash Equivalents and Investments - Cash and cash equivalents, for all funds, include petty cash, change funds,cash in banks and all highly liquid investments with a maturity of three months or less at the time of purchase and arestated at cost plus accrued interest. Such is the definition of cash and cash equivalents used in the statement of cash flowsfor the proprietary funds. U.S. Treasury and agency obligations and certificates of deposit with maturities of one year orless when purchased are stated at cost. All other investments are stated at fair value.
New Jersey school districts are limited as to the types of investments and types of financial institutions they may invest in.N.J.SA 18A:20-37 provides a list of penn issible investments that may be purchased by New Jersey school districts.
42

Lower Township School DistrictNotes to Basic Financial Statements
For the Fiscal Year Ended June 30,2012
1. SUMMARY OF SIGNIFICANT ACCOUNTING POLICIES (CONTINUED)
Cash, Cash Equivalents and Investments (Continued) - NJ.S.A. 17:9-41 et seq. establishes the requirements for thesecurity of deposits of governmental units. The statute requires that no governmental unit shall deposit public funds in apublic depository unless such funds are secured in accordance with the Governmental Unit Deposit Protection Act(GUDPA), a multiple financial institution collateral pool, which was enacted in 1970 to protect governmental units from aloss of funds on deposit with a failed banking institution in New Jersey. Public depositories include State or federallychartered banks, savings banks or associations located in or having a branch office in the State of New Jersey, the depositsof which are federally insured. All public depositories must pledge collateral, having a market value at least equal to fivepercent of the average daily balance of collected public funds, to secure the deposits of Governmental Units. If a publicdepository fails, the collateral it has pledged, plus the collateral of all other public depositories, is available to pay the fullamount of their deposits to the governmental units.
Tuition Receivable - Tuition charges were established by the School District based on estimated costs. The charges aresubject to adjustment when the final costs are determined.
Tuition Payable - Tuition charges for the fiscal years ended June 30,2012 and 2012 were based on rates established by thereceiving school district. These rates are subject to change when the actual costs have been determined.
Inventories - Inventories are valued at cost, which approximates market. The costs are determined on a first-in, first-outbasis.
The cost of inventories in governmental fund types is recorded as expenditures when purchased rather than whenconsumed, and is not recorded since any amounts are considered immaterial to the basic financial statements.
Inventories recorded in the government-wide financial statements and in the proprietary fund types are recorded asexpenditures when consumed rather than when purchased.
The proprietary fund type does not maintain any inventories as the School District has contracted with anothergovernmental entity to purchase prepared lunches.
Prepaid Expenses - Prepaid expenses recorded on the government-wide financial statements and in the proprietary fundtypes represent payments made to vendors for services that will benefit periods beyond June 30,2012.
In the governmental fund types, however, payments for prepaid items are fully recognized as an expenditure in the fiscalyear of payment. No asset for the prepayment is created, and no expenditure allocation to future accounting periods isrequired (non-allocation method). This is consistent with the basic governmental concept that only expendable financialresources are reported by a specific fund.
Deferred Expenditures - Deferred expenditures are disbursements that are made in one period, but are more accuratelyreflected as an expenditure/expense in the next fiscal period. Unlike prepaid expenses, deferred expenditures are notregularly recurring cost of operations.
Short-Term Interfund Receivables / Payables - Short-term interfund receivables I payables represent amounts that areowed, other than charges for goods or services rendered to / from a particular fund in the School District and that are duewithin one year. These amounts are eliminated in the governmental and business-type columns of the statement of netassets, except for the net residual amounts due between governmental and business-type activities, which are presented asinternal balances.
43

Lower Township School DistrictNotes to Basic Financial Statements
For the Fiscal Year Ended June 30, 2012
1. SUMMARY OF SIGNIFICANT ACCOUNTING POLICIES (CONTINUED)
Capital Assets - General capital assets are those assets not specifically related to activities reported in the proprietaryfunds. These assets generally result from expenditures in the governmental funds. These assets are reported in thegovernmental activities column of the government-wide statement of net assets but are not reported in the fund financialstatements. Capital assets utilized by the proprietary funds are reported both in the business-type activities column of thegovernment-wide statement of net assets and the proprietary fund statement of net assets.
All capital assets are capitalized at cost (or estimated historical cost) and updated for additions and retirements during thefiscal year. Donated fixed assets are recorded at their fair market value as of the date received. The School Districtmaintains a capitalization threshold of $2,000.00. The School District does not possess any infrastructure. Improvementsare capitalized; the cost of normal maintenance and repairs that do not add to the value of the asset or materially extend anasset's life are not. All reported capital assets except land and construction in progress are depreciated. Improvements aredepreciated over the remaining useful lives of the related capital assets.
Depreciation is computed using the straight-line method over the following useful lives:
Description
GovernmentalActivities
Estimated Lives
Business-TypeActivities
Estimated Uves
Land and ImprovementsBuildings and ImprovementsFurniture and EquipmentVehicles
10-20 years10-50 years5-20 years5-10 years
N/AN/A
12 years4-6 years
Compensated Absences - Compensated absences are those absences for which employees will be paid, such as vacation,sick leave, and sabbatical leave. A liability for compensated absences that are attributable to services already rendered, andthat are not contingent on a specific event that is outside the control of the School District and its employees, is accrued asthe employees earn the rights to the benefits. Compensated absences that relate to future services, or that are contingent ona specific event that is outside the control of the School District and its employees, are accounted for in the period in whichsuch services are rendered or in which such events take place.
The entire compensated absence liability is reported on the government-wide financial statements.
For governmental funds. the current portion of unpaid compensated absences is the amount that is normally expected to bepaid with expendable available financial resources. In proprietary funds, the entire amount of compensated absences isrecorded as a fund liability.
Deferred Revenue - Deferred revenue arises when assets are recognized before revenue recognition criteria have beensatisfied.
Accrued Liabilities and Long-Term Obligations - All payables, accrued liabilities, and long-term obligations arereported on the government-wide financial statements, and all payables, accrued liabilities and long-term obligationspayable from proprietary funds are reported on the proprietary fund financial statements. In general, governmental fundpayables and accrued liabilities that. once incurred, are paid in a timely manner and in full from current financial resourcesare reported as obligations of the funds. However, claims and judgments, compensated absences, special terminationbenefits and contractually required pension contributions that will be paid from governmental funds are reported as aliability in the fund financial statements only to the extent that they are normally expected to be paid with expendableavailable financial resources. Bonds are recognized as a liability on the fund financial statements when due.
44
Lower Township School DistrictNotes to Basic Financial Statements
For the Fiscal Year Ended June 30, 2012
1. SUMMARY OF SIGNIFICANT ACCOUNTING POLICIES (CONTINUED)
Net Assets - Net assets represent the difference between assets and liabilities. Net assets invested in capital assets, net ofrelated debt consists of capital assets, net of accumulated depreciation, reduced by the outstanding balance of anyborrowings used for the acquisition, construction, or improvement of those assets. Net assets are reported as restrictedwhen there are limitations imposed on their use either through the enabling legislation adopted by the School District orthrough external restrictions imposed by creditors, grantors, or laws or regulations of other governments.
It is the School District's policy to apply restricted resources when an expense is incurred for purposes for which bothrestricted and unrestricted net assets are available.
Fund Balance - The School District reports fund balance in classifications that comprise a hierarchy based primarily onthe extent to which the School District is bound to honor constraints on the specific purposes for which amounts in thosefunds can be spent. The School District's classifications, and policies for determining such classifications, are as follows:
Nonspendable - The nonspendable fund balance classification includes amounts that cannot be spent because theyare either not in spendable form or are legally or contractually required to be maintained intact. The "not inspendable form" criteria includes items that are not expected to be converted to cash, such as inventories and prepaidamounts. The School District had no nonspendable fund balance at June 30, 2012.
Restricted - This fund balance classification includes amounts that are restricted to specific purposes. Suchrestrictions, or constraints, are placed on the use of resources either by being (a) externally imposed by creditors,grantors, contributors, or laws or regulations of other governments; or (b) imposed by law through constitutionalprovisions or enabling legislation.
Committed - This fund balance classification includes amounts that can only be used for specific purposes pursuantto constraints imposed by formal action of the School District's highest level of decision making authority, which forthe School District is the Board of Education. Once committed, amounts cannot be used for any other purpose unlessthe Board of Education removes, or changes, the specified use by taking the same type of action imposing thecommitment.
Assigned - This fund balance classification includes amounts that are constrained by the School District's intent to beused for specific purposes, but are neither restricted nor committed. Intent is expressed by either the Board ofEducation or by the Business Administrator, to which the Board of Education has delegated the authority to assignamounts to be used for specific purposes.
Unassigned - This fund balance classification is the residual classification for the General Fund. It represents fundbalance that has not been assigned to other funds and that has not been restricted, committed, or assigned to specificpurposes within the general fund. The general fund is the only fund that reports a positive unassigned fund balanceamount. In other governmental funds, if expenditures incurred for specific purposes exceed the amounts restricted,committed, or assigned to those purposes, it may be necessary to report a negative unassigned fund balance.
When an expenditure is incurred for purposes for which both restricted and unrestricted fund balances are available, it isthe School District's policy to spend restricted fund balances first. Likewise, when an expenditure is incurred for purposesfor which amounts in any of the unrestricted fund balance classifications can be used, it is the policy of the School Districtto spend fund balances, if appropriate, in the following order: committed, assigned, then unassigned.
Operating and Non-Operating Revenues and Expenses - Operating revenues are those revenues that are generateddirectly from the primary activity of the proprietary funds. For the School District, these revenues are sales for the foodservice program and tuition fees for the before and after school program and transportation fees for the internal servicefund. Non-operating revenues principally consist of interest income earned on various interest bearing accounts andfederal and state subsidy reimbursements for the food service program.
Operating expenses are necessary costs incurred to provide the goods or services that are the primary activity of the fund.There are no non-operating expenses.
45
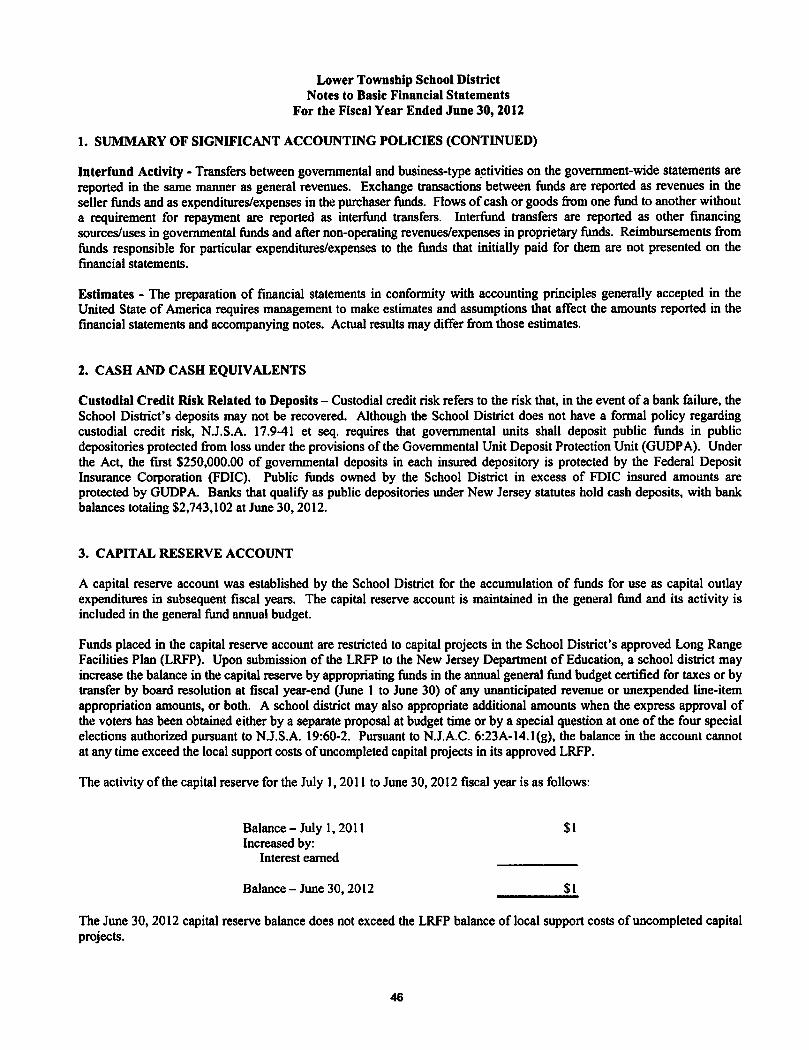
Lower Township School DistrictNotes to Basic Financial Statements
For the Fiscal Year Ended JUDe 30,2012
1. SUMMARY OF SIGNIFICANT ACCOUNTING POLICIES (CONTINUED)
Interfund Activity - Transfers between governmental and business-type activities on the government-wide statements arereported in the same manner as general revenues. Exchange transactions between funds are reported as revenues in theseller funds and as expenditures/expenses in the purchaser funds. Flows of cash or goods from one fund to another withouta requirement for repayment are reported as interfund transfers. Interfund transfers are reported as other fmancingsources/uses in governmental funds and after non-operating revenues/expenses in proprietary funds. Reimbursements fromfunds responsible for particular expenditures/expenses to the funds that initially paid for them are not presented on thefinancial statements.
Estimates - The preparation of fmancial statements in conformity with accounting principles generally accepted in theUnited State of America requires management to make estimates and assumptions that affect the amounts reported in thefinancial statements and accompanying notes. Actual results may differ from those estimates.
2. CASH AND CASH EQUIVALENTS
Custodial Credit Risk Related to Deposits - Custodial credit risk refers to the risk that, in the event of a bank failure, theSchool District's deposits may not be recovered. Although the School District does not have a formal policy regardingcustodial credit risk, NJ.S.A. 17.9-41 et seq. requires that governmental units shall deposit public funds in publicdepositories protected from loss under the provisions of the Governmental Unit Deposit Protection Unit (GUDPA). Underthe Act. the first $250,000.00 of governmental deposits in each insured depository is protected by the Federal DepositInsurance Corporation (FDIC). Public funds owned by the School District in excess of FDIC insured amounts areprotected by GUDP A. Banks that qualify as public depositories under New Jersey statutes hold cash deposits, with bankbalances totaling $2,743,102 at June 30, 2012.
3. CAPITAL RESERVE ACCOUNT
A capital reserve account was established by the School District for the accumulation of funds for use as capital outlayexpenditures in subsequent fiscal years. The capital reserve account is maintained in the general fund and its activity isincluded in the general fund annual budget.
Funds placed in the capital reserve account are restricted to capital projects in the School District's approved Long RangeFacilities Plan (LRFP). Upon submission of the LRFP to the New Jersey Department of Education, a school district mayincrease the balance in the capital reserve by appropriating funds in the annual general fund budget certified for taxes or bytransfer by board resolution at fiscal year-end (June 1 to June 30) of any unanticipated revenue or unexpended line-itemappropriation amounts, or both. A school district may also appropriate additional amounts when the express approval ofthe voters has been obtained either by a separate proposal at budget time or by a special question at one of the four specialelections authorized pursuant to N.J.S.A. 19:60-2. Pursuant to NJ.A.C. 6:23A-14.I(g), the balance in the account cannotat any time exceed the local support costs of uncompleted capital projects in its approved LRFP.
The activity of the capital reserve for the July 1,2011 to June 30, 2012 fiscal year is as follows:
Balance - July 1,2011Increased by:
Interest earned
$1
Balance - June 30, 2012 $1
The June 30, 2012 capital reserve balance does not exceed the LRFP balance oflocal support costs of uncompleted capitalprojects.
46
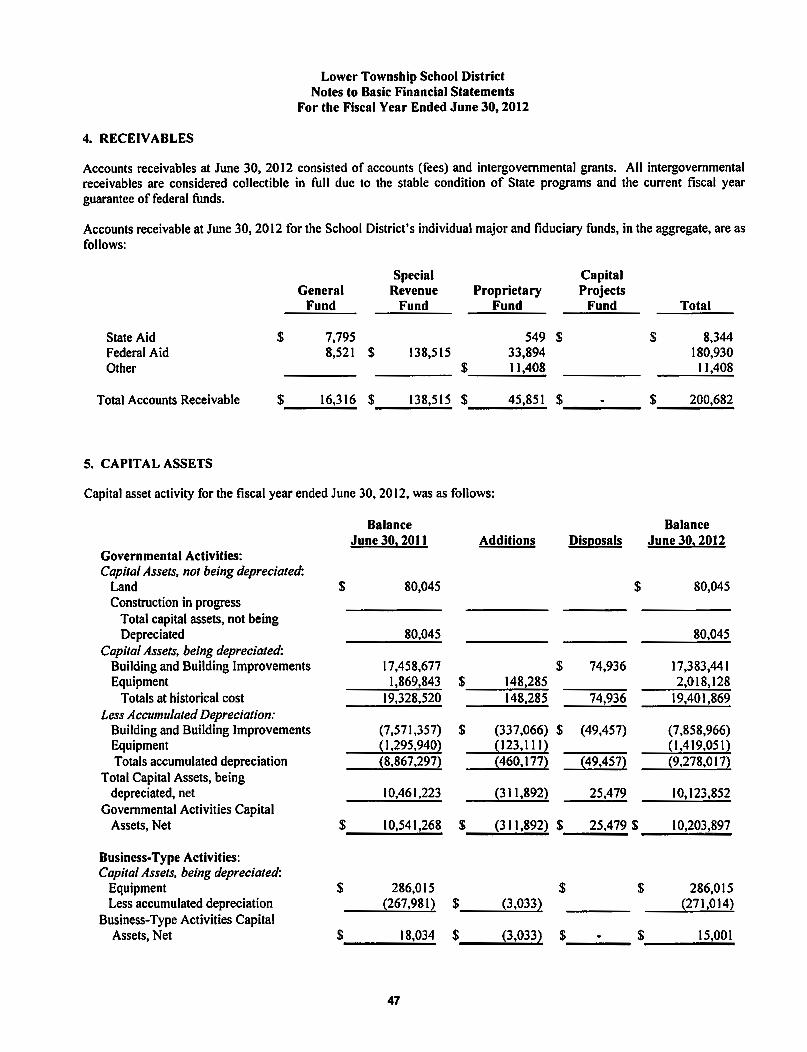
Lower Township School DistrictNotes to Basic Financial Statements
For the Fiscal Year Ended June 30, 2012
4. RECEIVABLES
Accounts receivables at June 30, 2012 consisted of accounts (fees) and intergovernmental grants. All intergovernmentalreceivables are considered collectible in full due to the stable condition of State programs and the current fiscal yearguarantee of federal funds.
Accounts receivable at June 30, 2012 for the School District's individual major and fiduciary funds, in the aggregate, are asfollows:
Special CapitalGeneral Revenue Proprietary Projects
Fund Fund Fund Fund
State Aid s 7,795 549 sFederal Aid 8,521 s 138,515 33,894Other s 11,408
Total Accounts Receivable s 16,316 s 138,515 s 45,851 s
Total
s 8,344180,93011,408
s 200,682
5. CAPITAL ASSETS
Capital asset activity for the fiscal year ended June 30, 2012, was as follows:
Balance BalanceJune 303 2011 Additions Disl!osals June 303 2012
Governmental Activities:Capital Assets, not being depreciated:
Land s 80,045 s 80,045Construction in progress
Total capital assets, not beingDepreciated 80,045 80,045
Capital Assets. being depreciated:Building and Building Improvements 17,458,677 s 74,936 17,383,441Equipment 1,869,843 s 148,285 2,018,128
Totals at historical cost 19,328,520 148,285 74,936 19,401,869Less Accumulated Depreciation:
Building and Building Improvements (7,571,357) s (337,066) s (49,457) (7,858,966)Equipment ~1.295.940} ~123,111} (1,419,051)Totals accumulated depreciation (8,867,297) (460,177} ~49,457} (9,278,017)
Total Capital Assets, beingdepreciated, net 10,461,223 (311,892~ 25,479 10,123,852
Governmental Activities CapitalAssets, Net s 10,541,268 s (311,892) s 25,479 s 10,203,897
Business-Type Activities:Capital Assets, being depreciated:
Equipment s 286,015 s s 286,015Less accumulated depreciation ~267,98Q s (J,033} ~271,014)
Business-Type Activities CapitalAssets, Net s 18,034 s p,0332 s s 15,001
47

Lower Township School DistrictNotes to Basic Financial Statements
For the Fiscal Year Ended June 30, 2012
5. CAPITAL ASSETS (CONTINUED)
Depreciation expense in the amount of $460, 177 was charged to governmental functions as follows:
Function Amount
InstructionSchool AdministrationPlant Operations and MaintenanceUnallocated
$ 322,12446,01769,02723,009
Total $ 4...60.,;.,1_7_7
6. INVENTORY
Inventory in the Proprietary Funds at June 30, 2012 consisted of the following:
Food Service
FoodSupplies
$ 12,0973,615
$ 15,712
7. LONG-TERM OBLIGATIONS
During the fiscal year ended June 30, 2012, the following changes occurred in long-term obligations:
Principal Principal AmountOutstanding Outstanding Due WithinJuly 1,2011 Additions Reductions June 30, 2012 One Year
Compensated Absences $ 2,161,701 $ $ 217,144 $ 1,944,557
Total Governmental Activity $ 2,161,701 s s 217,144 $ 1,944,557 s
Principal Principal AmountOutstanding Outstanding Due Within
Business - Type Activities: July I, 20lJ Additions Reductions June 30, 2012 One Year
Compensated Absences $ 90,460 $ s 374 $ 90,086 $
Bonds PayabJe - At June 30, the District had no bonds payable.
Capital Leases - At June 30, the District had no capital leases payable.
Compensated Absences
Compensated absences will be paid from the fund from which the employees' salaries are paid.
48

Lower Township School DistrictNotes to Basic Financial Statements
For the Fiscal Year Ended June 30, 2012
8. OPERATING LEASES
At June 30, 2012, the School District had an operating lease agreement in effect for the following:
Copiers
Total operating lease payments made during the year ended June 30, 2012 and 2011, were $46,325, and $50,707respectively. Future minimum lease payments are as follows:
Year EndedJune 30, 2013June 30,2014June 30, 2015
Amount$ 33.354
18,06010,535
s 61,849Total future minimum lease payments
9. PENSION PLANS
Description of Plans - Substantially all of the School District's employees participate in one of the following pensionplans which have been established by State statute, and are administered by the New Jersey Division of Pensions andBenefits (Division): the Teachers' Pension and Annuity Fund (TPAF), the Public Employees' Retirement System (PERS) orthe Defined Contribution Retirement Program (DCRP). Each plan has a Board of Trustees that is primarily responsible forits administration. The Division issues a publicly available financial report that includes financial statements and requiredsupplementary information. That report may be obtained by writing to the State of New Jersey, Division of Pensions andBenefits. P.O. Box 295, Trenton, New Jersey, 08625-0295.
Teachers' Pension and Annuity Fund (TPAF)
The Teachers' Pension and Annuity Fund is a cost-sharing contributory defined benefit pension plan which was establishedon January I, 1955, under the provisions of NJ.S.A. 18A:66. The TPAF provides retirement, death and disability, andmedical benefits to qualified members. Vesting and benefit provisions are established by N.J .S.A. 18A:66.
The contribution requirements of plan members are determined by State statute. In accordance with Chapter 92 andChapter 103, P.L. 2007, plan members were required to contribute 5.5% of their annual covered salary. Chapter 78 P.L.20 II changed the employee contribution rate as follows: Effective with the first payroll check to be paid on or afterOctober 1,2011 plan members rate will increase to 6.5% with an additional increase of .14% beginning in July 2012 andcontinuing each year until the rate reaches 7.5% in July 2018. The State Treasurer has the right under the current law tomake temporary reductions in rates based on the existence of surplus pension assets in the retirement system; however,statute also requires the return to the normal rate when such surplus pension assets no longer exists.
Under current statute, all employer contributions are made by the State of New Jersey on-behalf of the School District andall other related non-contributing employers. No normal or accrued liability contribution by the School District has beenrequired over the several preceding fiscal years.
Public Employees' Retirement System (PERS)
The Public Employees' Retirement System is a cost-sharing multiple-employer defined benefit pension plan which wasestablished on January 1, 1955. The PERS provides retirement, death and disability, and medical benefits to certainqualified members. Vesting and benefit provisions are established by N.J.S.A. 43: 15A and 43:3B.
49

Lower Township School DistrictNotes to Basic Financial Statements
For the Fiscal Year Ended June 30, 1012
9. PENSION PLANS (CONTINUED)
Public Employees' Retirement System (PERS) (Continued)
The contribution requirements of plan members are determined by State statute. In accordance with Chapter 92 andChapter 103, P.L. 2007, plan members were required to contribute 5.5% of their annual covered salary. Chapter 78 P.L.20 II changed the employee contribution rate as follows: Effective with the first payroll check to be paid on or afterOctober 1,2011 plan members rate will increase to 6.5% with an additional increase of .14% beginning in July 2012 andcontinuing each year until the rate reaches 7.5% in July 2018. The State Treasurer has the right under the current law tomake temporary reductions in rates based on the existence of surplus pension assets in the retirement system; however,statute also requires the return to the normal rate when such surplus pension assets no longer exists.
The School District is billed annually for its normal contribution plus any accrued liability. The School District'scontributions, equal to the required contribution for each fiscal year, were as follows
Non-Contr.Fiscal Normal Accrued Group Life Total Delayed Delayed Paid byXw: Contribution Liability Insurance Liability Enrollments Appropriation District
2012 $153,121 $306,242 $29,267 $488,630 $9,130 $29,714 $527,4742011 156,516 249,397 30,829 436,742 35,401 111,900 584,0432010 128,291 164,839 40,650 333,780 333,780
Defined Contribution Retirement Program (DCRP)
The Defined Contribution Retirement Program is a cost-sharing multiple-employer defined contribution pension planwhich was established on July I, 2007, under the provisions of Chapter 92, P.L. 2007 and Chapter 103, P.L. 2007(NJ.S.A.43:15C-I et. seq), and expanded under the provisions of Chapter 89, P.L. 2008 and Chapter I, P.L. 2010. TheDefined Contribution Retirement Program Board oversees the DCRP, which is administered for the Divisions of Pensionsand Benefits by Prudential Financial. The DCRP provides eligible members, and their beneficiaries, with a tax-sheltered,defined contribution retirement benefit, along with life insurance and disability coverage. Vesting and benefit provisionsare established by NJ.S.A. 43:15C-I et. seq.
The contribution requirements of plan members are determined by State statute. In accordance with Chapter 92, P.L. 2007and Chapter 103, P.L. 2007, plan members are required to contribute 5.5% of their annual covered salary. Chapter 78 P.L.20 II changed the employee contribution rate as follows: Effective with the first payroll check to be paid on or afterOctober I, 20 II plan members rate will increase to 6.5% with an additional increase of .14% beginning in July 2012 andcontinuing each year until the rate reaches 7.5% in July 2018. The State Treasurer has the right under the current law tomake temporary reductions in rates based on the existence of surplus pension assets in the retirement system; however,state statute also requires the return to the normal rate when such surplus pension assets no longer exist. The employeecontributions along with the School District's contribution for each pay period are transmitted to Prudential Financial notlater than the fifth business day after the date on which the employee is paid for that pay period.
There were no School District employees enrolled in the DCRP for the fiscal years ended June 30, 2012,2011 and 2010.
50

Lower Township School DistrictNotes to Basic Financial Statements
For the Fiscal Year Ended June 30,2012
1O. POST-RETIREMENT BENEFITS
The School District contributes to the New Jersey State Health Benefits Program (SHBP), a cost-sharing multiple-employer defined benefit post-employment healthcare plan administered by the State of New Jersey Division of Pensionand Benefits. SHBP was established to provide medical, prescription drug, mental health/substance abuse and MedicarePart B reimbursement to retirees and their covered dependents. The State Health Benefits Program Act is found in NewJersey Statutes Annotated, Title 52, Article 17.25 et seq. Rules governing the operation and administration of the programare found in Title 17, Chapter 9 of the New Jersey Administrative Code. The State of New Jersey Division of Pensionissues a publicly available financial report that includes financial statements and required supplementary information forSHBP. That report may be obtained by writing to the Division of Pension and Benefits, PO Box 295, Trenton, NJ 08625-0295.
P.L. 1987, c.384 and P.L. 1990, c.6 required Teachers' Pensions and Annuity Fund (TPAF) and the Public Employees'Retirement System (PERS), respectively, to fund post-retirement medical benefits for those State employees who retireafter accumulating 25 years of credited service or on a disability retirement. P.L. 2007, c. 103 amended the law toeliminate the funding of post-retirement medical benefits through the TPAF and PERS. It created separate funds outside ofthe pension plans for the funding and payment of post-retirement medical benefits for retired State employees and retirededucational employees. As of June 30, 2011 there were 87,288 retirees eligible for post-retirement medical benefits. Thecost of these benefits is funded through contributions by the State in accordance with P.L. 1994, c.62. Funding of post-retirement medical premiums changed from a pre-funding basis to a pay-as-you-go basis beginning in fiscal year 1994.
The State is also responsible for the cost attributable to P.L. 1992 c.126, which provides free health benefits to members ofPERS and Alternate Benefit Program who retired from a board of education or county college with 25 years of service.The State paid $126.3 million toward Chapter 126 benefits for 14,050eligible retired members in fiscal year 20 II.
The State establishes the contribution rate based on the annual required contribution of the employers (ARC), an amountactuarially determined in accordance with the parameters of GASB Statement 45. The ARC represents the level of fundingthat, ifpaid on an ongoing basis, is projected to cover normal cost each year and amortize any unfunded actuarial liabilities(or funding excess) of the plan over a period not to exceed thirty years. The State's contribution to the SHBP Fund forTPAF retirees' post-retirement benefits on behalf of the School District for the year ended June 30, 2012 was $738,584, which equaled the required contributions. The State's contribution to the SHBP Fund for PERS retirees' post-retirementbenefits on behalf of the School District was not determined or made available by the State of New Jersey.
11. ON-BEHALF PAYMENTS
For the fiscal year ended June 30, 2012, the School District has recognized as revenues and expenditures $367,408of on-behalf payments made by the State of New Jersey for normal retirement costs related to TPAF and $865,466for employer's share of social security contributions for TPAF members, as calculated on their base salaries.
12. RISK MANAGEMENT
Property and Liability Insurance - The District is a member of the Atlantic and Cape May Counties Association ofSchool Business Officials Joint Insurance Fund (ACCASBOJIF), a public entity risk pool currently operating as a commonrisk management and insurance program. The District pays an actuarial determined annual assessment to ACCASBOJIFfor its insurance coverage. Supplemental assessments may be levied to supplement the fund. The District has not beennotified of any supplemental assessments.
In addition, the District carries commercial insurance for all other risks of loss, including employee health, accidentinsurance and public official surety bonds. Settled claims resulting from these risks have not exceeded commercialinsurance coverage in any of the past three fiscal years.
A complete schedule of insurance coverage can be found in the "Statistical Section" of this report.
51

Lower Township School DistrictNotes to Basic Financial Statements
For the Fiscal Year Ended June 30,2012
12. RISK MANAGEMENT (Continued)
New Jersey Unemployment Compensation Insurance - The District has elected to fund its New Jersey UnemploymentCompensation Insurance under the "Business Reimbursement Method". Under this plan, the District is required toreimburse the New Jersey Unemployment Trust Fund for benefits paid to its former employees and charged to its accountwith the State. The District is billed quarterly for amounts due to the State.
The following is a summary of District contributions, employee contributions, reimbursements to the State for benefits paidand the ending balance of the District's expendable trust fund for the current and prior four years:
District Employee Interest Amount EndingFiscal Year Contributions Contributions Earned Reimbursed Balance
2011-2012 $ $ 48,860 $ 146 $ 25,468 $ 64,1252010-2011 49,385 304 88,179 40,5872009-2010 30,000 47,660 678 45,623 79,0772008-2009 30,000 47,076 1,262 53,050 46,3622007-2008 60,000 41,339 1,713 104,575 21,074
13. DEFERRED COMPENSATION
The School District offers its employees a choice of various deferred compensation plans created in accordance withInternal Revenue Code Section 403(b). The plans, available to all permanent School District employees, permitparticipants to defer a portion of their current salary to future years. Participation in the plans is optional. The deferredcompensation is not available to the participants until termination, retirement, death, or an unforeseeable emergencyoccurs. The plan assets are held in trust for the benefit of the employee and are administered by a third party therefore theyare not reflected on the financial statements of the School District.
14. COMPENSATED ABSENCES
The School District accounts for compensated absences (e.g. unused vacation, sick leave) as directed by GovernmentalAccounting Standards Board Statement No. 16 (GASB 16), "Accounting for Compensated Absences". A liability forcompensated absences attributable to services already rendered and not contingent on a specific event that is outside thecontrol of the employer and employee is accrued as employees earn the rights to the benefits.
School District employees are granted varying amounts of vacation and sick leave in accordance with the School District'spersonnel policy. Upon termination, employees are paid for accrued vacation. The School District's policy permitsemployees to accumulated unused sick leave and carry forward the full amount to subsequent years. Upon retirementemployees shall be paid by the School District for the unused sick leave in accordance with the School District'sagreements with the various employee unions.
The liability for vested compensated absences is recorded within those funds as the benefits accrued to the employees. Asof June 30, 2012, the liability for compensated absences in the governmental activities and proprietary fund types was$1,944,557 and $90,086, respectively.
52

Lower Township School DistrictNotes to Basic Financial Statements
For the Fiscal Year Ended June 30,2012
IS. INTERFUND RECEIVABLES AND PAY ABLES
Interfund receivables/payables are recorded to cover temporary cash shortages and/or timing differences in the respectivefunds. There are no interfund balances that are not expected to be repaid by June 30, 2013. The following interfundbalances were recorded on the various balance sheets as of June 30, 2012:
Interfund InterfundFund Receivable Payable
General s 136,602 s 85,653Special Revenue 102,252Proprietary 85,653 2,118Fiduciary 32,232
s 222,255 s 222,255
16. CONTINGENCIES
The School District participates in a number of federal and state programs that are fully or partially funded by grantsreceived from other governmental units. Expenditures financed by grants are subject to audit by the appropriate grantorgovernment. If expenditures are disallowed due to noncompliance with grant program regulations, the School District maybe required to reimburse the grantor government.
At June 30, 2012, significant amounts of grant expenditures have not been audited by the granting agency, but the SchoolDistrict believes that disallowed expenditures discovered in subsequent audits, if any, will not have a material effect on anyof the individual funds or the overall financial position of the School District. Additionally, deferred revenues arerecognized in those funds that have received grant monies in advance of future, reimbursable expenditures.
17. DEFICIT UNASSIGNED FUND BALANCE
The School District has a deficit unassigned fund balance of $386,982 in the General Fund and $34,366 in the specialrevenue fund as of June 30, 2012 as reported in the fund statements (modified accrual basis). NJ.S.A. 18A:22-44.2provides that in the event a state school aid payment is not made until the following school budget year, school districtsmust record the delayed one or more June state aid payments as revenues, for budget purposes only, in the current schoolbudget year. The statute provides legal authority for school districts to recognize this revenue in the current budget year.For intergovernmental transactions, GASa Statement No. 33 requires that recognition (revenue, expenditure, asset,liability) should be in symmetry, i.e., if one government recognizes an asset, the other government recognizes a liability.Since the State is recording the June state aid payments in the subsequent fiscal year, the School District cannot recognizethe June state aid payment on the GAAP financial statements until the year the State records the payable. Due to thetiming difference of recording the June state aid payments, the general and special revenue fund balance deficit does notalone indicate that the School District is facing financial difficulties.
Pursuant to N.J.S.A. 18A:22-44.2 any negative unassigned general fund balance that is reported as a direct result from adelay in the June payments of state aid until the following fiscal year, is not considered in violation of New Jersey statuteand regulation nor in need of corrective action. The School District deficit in the GAAP funds statements of $421,348is equal to or less than the June state aid payment.
53

Lower Township School DistrictNotes to Basic Financial Statements
For the Fiscal Year Ended June 30, 2012
18. DEFICIT UNRESTRICTED NET ASSETS
As of June 30. 2012. a deficit of $2.331.539 existed in the Unrestricted Net Assets of the Governmental Activities. Areconciliation of Unreserved Fund Balance reported on Exhibit B-1 to Unrestricted Net Assets reported on Exhibited A-Ias follows:
Balances June 30. 2012Fund Balance (Deficit)(Exclusive of Capital Projects and Debt Service Funds):
Fund Balance - UnassignedAdd - Unamortized Bond Issuance CostsLiabilities:
Accrued interest PayableCompensated Absences
$ (386.982)
(1.944.557)
Unrestricted Net Assets (Deficit) $ _ ......(2;.:,;;.3..;.,3;;.:,;1.5;.;,3:..49)
19. FUND BALANCES
RESTRICTED
As stated in Note I. the restricted fund balance classification includes amounts that are restricted to specific purposes.Such restrictions. or constraints. are placed on the use of resources by either of the following: (a) externally imposed bycreditors, grantors, contributors. or laws or regulations of other governments; or (b) imposed by law through constitutionalprovisions or enabling legislation. Specific restrictions of the School District's fund balance are summarized as follows:
General Fund:
Excess Surplus -In accordance with N.J.S.A. 18A:7F-7. as amended, the designation of restricted fund balance -excess surplus is the result of a required calculation pursuant to the New Jersey Comprehensive EducationalImprovement and Financing Act of 1996 (CEIFA). New Jersey school districts are required to restrict generalfund, fund balance at the fiscal year end of June 30 if they did not appropriate a required minimum amount asbudgeted fund balance in their subsequent years' budget. The excess fund balance at June 30, 2012 is $407,534presented on the budgetary basis of accounting (Exhibit C-I). Additionally, $507,648 of excess fund balancegenerated during the 2010-2011 fiscal year has been restricted and designated for utilization in the 2012-2013budget.
Capital Reserve - As of June 30, 2012, the balance in the capital reserve account is $1.
Maintenance Reserve Account - As of June 30, 2012, the balance in the maintenance reserve account is$1,292,246. These funds are restricted for the required maintenance of school facilities in accordance with theEducational Facilities Construction and Financing Act (EFCFA) (N.J.S.A. 18A:7G-9) as amended by P.L. 2004,c. 73 (SI701).
54

Lower Township School DistrictNotes to Basic Financial Statements
For the Fiscal Year Ended June 30,2012
19. FUND BALANCES (CONTINUED)
ASSIGNED
As stated in Note 1, the assigned fund balance classification includes amounts that are constrained by the School District'sintent to be used for specific purposes, but are neither restricted nor committed. Specific assignments of the SchoolDistrict's fund balance are summarized as follows:
General Fund:
Other Purposes - At June 30, 2012 the School District has $7,239 of encumbrances outstanding for purchaseorders and contracts signed by the School District, but not completed, as of the close of the fiscal year.
Designated for Subsequent Year's Expenditures - The School District has appropriated and included as ananticipated revenue for the fiscal year ending June 30, 2013, $263,638 of general fund balance at June 30, 2012.
UNASSIGNED
As stated in Note 1, the unassigned fund balance classification represents fund balance that has not been restricted,committed, or assigned to specific purposes. The School District's unassigned fund balance is summarized as follows:
General Fund - As of June 30, 2012, the fund balance of the general fund was a deficit of $386,982, thus resulting inthe fund balance classification of unassigned. The deficit is a result of the delay in the recording of the payment ofstate aid until the following fiscal year (See Note 17).
Special Revenue Fund - As of June 30, 2012, the fund balance of the special revenue fund was a deficit of$34,366,thus resulting in the fund balance classification of unassigned. The deficit is a result of the delay in the recording ofthe payment of state aid until the following fiscal year (See Note 17).
55

Required Supplementary Information - Part II

Budgetary Comparison Schedules

C·1LOWER TOWNSHIP SCHOOL DISTRICT
Budgetary Comparison ScheduleGeneral Fund
Fiscal Year Ended June 30, 2012
VarianceOriginal Budget Final Final toBudget Transfers Budllet Actual Actual
REVENUES:Local sources:
Local tax levy $14.659.327 $14.659.327 $14.659.327Tuition 19.971 $19.971Unreslicfed miscellaneous revenue 168.851 168,851 182,353 13.502
Total local sources 14.628.178 14,628,178 14,861,651 33,473
State sources:SChool choice aid 597.760 597.760 588.420 (9.340)Special education aid 825.603 625.603 825.603EqualiZation aid 5.229.911 5.229.911 5.229.911Security aid 442.635 442.635 442.635Adjustment aid 1.684.777 $263.638 1.948.415 1.948.415Transportation aid 756,830 758,830 756.830Additional Non Public Transportation Aid 7.795 7.795 7.795Anti-bulling aid 2.043 2,043On·behalf TPAF pension contributions (non·budgeted) 367,408 367.408On-behalf TPAF Medical (non·budgeted) 738.584 738.584Reimbursed TPAF social security contributions (non·budgeted) 865,466 865.466
Total state sources 9,537,516 271,433 9,808,949 11.773,110 1.984.161
Federal sources:Special Education Medicaid Initiative (SEMI) 47,745 47,745 73,394 25.649Education Jobs Fund 349,431 10947 360,378 360,378
Total federal sources 397.176 10.947 408,123 433.772 25,649
TOTAL REVENUES 24,762.870 282,380 25.045,250 27,068.533 2.023.283
EXPENDITURES:CURRENT EXPENSE:Regular Programs· InstnJction:
Salaries of teachersPreschool 173.243 $56.472 229.715 229.715Kindergarten 904.679 19.015 923.694 923.693 1Grades 1-5 5.500.871 (162.349) 5.338.522 5,337.024 1.498Grades 6-8 890.360 65.375 955,735 955,734 1
TotallnstnJction 7.469.153 !21.4871 7,447.668 7.446.166 1.500
Regular Programs - Home InstnJction:Salaries of teaChers 3,500 4.437 7.937 7.937Other purchased services 250 270 520 280 240General Supplies
Total Home Instruction 3,750 4.707 8.457 8.217 240
see Managemenfs DiSCUssion and Analysis section of this report for explanation of significant budget variances. original and final.
ICONTlNUEDTO NEXTP_,
58
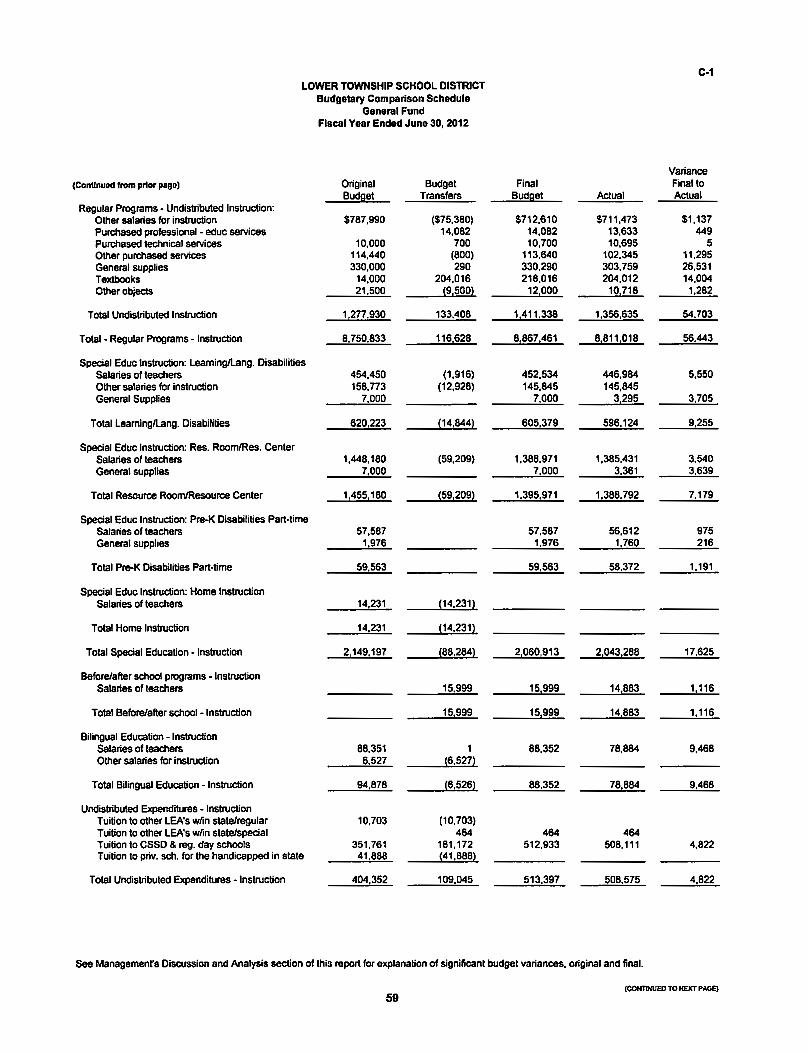
C-1LOWER TOWNSHIP SCHOOL DISTRICT
Budgetary Comparison ScheduleGeneral Fund
Fiscal Year Ended June 30, 2012
Variance(Contlnuodfromprior psgol Original Budget Final Final to
Budget Transfers Budget Actual ActualRegular Programs - Undistributed Instruction:
Other salaries for instruction $787,990 ($75,380) $712,610 $711,473 $1,137Purchased professional - educ services 14,082 14,082 13,633 449Purchased technical services 10,000 700 10,700 10,695 5Other purchased services 114,440 (800) 113,640 102,345 11,295General supplies 330,000 290 330,290 303,759 26,531Textbooks 14,000 204,016 218,016 204,012 14,004Other objects 21,500 {9,500l 12,000 10,718 1,282
Total Undistributed Instruction 1,277,930 133,408 1.411,338 1.356.635 54.703
Total- Regular Programs - Instruction 8,750,833 116,628 8.867,461 8,811.018 56443
Special Educ Instruction: LeaminglLang. DisabilitiesSalaries of teachers 454,450 (1,916) 452,534 446,984 5,550Other salaries for instruction 158,773 (12,928) 145,845 145,845General Supplies 7.000 7000 3,295 3.705
Total LeaminglLang. Disabilities 620,223 {14.844l 605,379 596.124 9,255
Special Educ Instruction: Res. RoomlRes. CenlerSalaries of teachers 1,448,180 (59.209) 1,388,971 1,385,431 3.540General supplies 7.000 7.000 3,361 3,639
Total Resource RoomlResource Center 1.455,180 {59,209l 1,395,971 1,388.792 7,179
Special Educ Instruction: Pre-K Disabilities Part·timeSalaries of teachers 57,587 57.587 56,612 975General supplies 1.976 1.976 1.760 216
Total Pre-K Disabilities Part-time 59.563 59,563 58,372 1191
Special Educ Instruction: Home InstructionSalaries of teachers 14231 114.231l
Total Home Instruction 14231 114.231l
Total Special Education - Instruction 2,149,197 188,284l 2,060,913 2,043,288 17,625
Before/after school programs - InstructionSalaries of teachers 15.999 15,999 14883 1,116
Total Before/after school-Instruction 15.999 15,999 14.883 1.116
Bilingual Education - InstructionSalaries of teachers 88.351 1 88.352 78,884 9.468Other salaries for instruction 6527 16.527l
Total Bilingual Education -Instruction 94.878 16,526l 88.352 78,884 9.468
Undistributed ExpendillJres - InstructionTuition to other LEA's wlin state/regular 10,703 (10,703)Tuition to other LEA's wlin state/special 464 464 464Tuilion to eSSD & reg. day schools 351,761 161,172 512.933 508,111 4,822Tuition to priv. sch. for the handicapped in state 41888 141,888!
Total Undistributed ExpendillJres - Instruction 404,352 109.045 513.397 508.575 4.822
See Managemenrs Discussion and Analysis section of this report for explanation of significant budget variances, original and final.
(CC)NTlMI£D TO NEXT PAGE)
59

<:-1LOWER TOWNSHIP SCHOOL DISTRICT
Budgetary Comparison ScheduleGeneral Fund
FIscal Yea, Ended June 30, 2012
Variance(Continued from prior page) Original Budget Final Final to
BUdget TransfelS Budget Actual ActualUndislributed Expenditures· Attendance & Social Work
Salaries $27,553 $27,553 $27,552 $1Purchased professional and technical services 9,870 ($870) 9,000 9,000Supplies and materials 165 (38) 127 113 14Other objects
Total Undistributed Expenditures· Attendance & Soc. 371588 (90S} 36,680 361665 15
Undistributed Expenditures· Health ServicesSalaries 392,590 (6,028) 386,562 386,562Purchased professional and technical services 24,000 (1,848) 22,152 22,152Other purchased services (400-500) 260 (210) 50 50Supplies and materials 2°1000 !.r1584} 12,416 121416
Total Undistributed Expenditures - Health Sves. 4361850 (151670) 4211180 4211180
Undist. Expend•• Speech, OT, PT & Related ServicesSalaries 397,682 (60,267) 337,415 337,414Purchased professional - educ services 2,500 (2,500)Supplies and materials 21500 (1z178) 722 722
Total Undst. Expend.• Speech, OT, PT & Related Services 4021682 (64,545} 338,137 338.136
Undist. Expend.• GuidanceSalaries of other professional staff 336,119 (10,260) 325,859 325,859Supplies and materials 765 60 825 516 309Other objects 400 400 9 391
Total Undst. Expend.• Guidance 337,284 (10,200) 3271084 3261384 700
Undist. Expend.• Child Study TeamsSalaries of other professional staff 628,964 (65,860) 563,104 563,103 1Salaries of secretarial and clerical assistants 120,111 (9,170) 110,941 110,940 1Purchased professional - educ services 230,000 230,000 189,155 40,845Other purchased professional - tech services 28,000 (8,170) 19,830 18,699 1,131Misc. purchased services (4()()..5OO) 5,760 (660) 5,100 3,660 1,440Supplies and materials 16,000 (10,180) 5,820 5,817 3Other objects 1,300 (1,000) 300 125 175
Total Undst. Expend. - Child Siudy Teams 1,0301135 (951040) 9351°95 891,499 43,596
Undist. Expend.• Improvement of Instr. ServicesSalaries of supervisor of instructionSalaries of other professional staff 10,400 10,400 10,000 400Salaries of Secr and Clerical Assist. 35,461 5,909 41,370 41,370Other purchased professional and tech services 1,986 1,986 1,986Other purchased services (400-500) 500 500 500Supplies and materials 1,000 1,000 231 769Other objac1s 250 250 250
Total Undst. Expend. - Improvement of Instr. Services 491597 5,909 55,506 511601 3,905
Undisl. Expend.• Educ. Media Serv./Sch. UbrarySalaries 483,973 (100,000) 383,973 381,754 2,219Other purchased services (400-500) 800 800 557 243Supplies and materials 35,000 35,000 28,168 6,832Other objects 31700 3loo 3,360 340
Total Undst. Expend.• Educ. Media ServJSch. Ubrary 523,473 (t00,000) 423,473 413,839 9,634
See Managemenrs Discussion and Analysis section of this report for explanation of significant budget variances, original and final.
60(~UEl) TO NEXT PAGE)

C·1LOWER TOWNSHIP SCHOOL DISTRICT
Budgetary Comparison ScheduleGeneral Fund
Fiscal Year Ended June 30,2012
Variance(Continued from prior page) Original Budget Final Final to
Budget Transfers Budget Actual ActualUndisl Expend.• Instructional Staff Training Services
Salaries of supervisor of instructionSalaries of other professional staff $10,400 $425 $10,825 $10,825Salaries of secretarial and clerical assistants 57,363 57.363 57.362 51Other salaries 2.500 2.300 4,800 4.800Purchased professional. educ services 19.045 (8,634) 10,411 3.500 6.911Other purchased services 5.000 5,000 1.403 3,597Supplies and materials 5.000 (2,000) 3,000 1,459 1.541Other objects 16,000 ('4,0001 21000 1.744 256
Total Undst. Expend.• Instructional Staff Training Svcs. 115,308 {21.9091 93.399 81.093 12.306
Undist. Expend.• Supp. Serv. General Admin.Salaries 225.230 (30.455) 194.775 134.696 60.079legal services 31.731 31.731 31.221 510Audit fees 22.836 22.836 20.872 1.964Other purchased professional services 9.500 (3.500) 6.000 2.150 3.850Communications I telephone 65.000 (18,288) 46.712 46.712Other purchased services 64.585 11.900 76.485 61.689 14.796General supplies 10.150 10.150 2.487 7.663BOE in-house training/meeting supplies 3.000 3,000 1.529 1.471Miscellaneous expenditures 10.000 (5.400) 4.600 3.304 1.296BOE membership dues and fees 15.400 15.400 14.898 502
Total Undsl Expend.• Supp. Serv. General Admin. 457.432 !45.7431 411.689 272.846 138.643
Undist. Expend.• Supp. ServoSchool Admin.Salaries of principals/assist. principals 457.671 24,188 481.859 481.859Salaries of secretarial and clerical assistants 376.023 497 376.520 376.520Purchased professional and technical services 1.000 1.000 1.000Other purchased services (400-500) 27.500 (19.615) 7,885 3.825 4.060Supplies and materials 15.400 (6.766) 8.634 8.633 1Other objects 17.519 {11.845) 5674 5.674
Total Undst. Expend.• Supp. Serv. School Admin. 895.113 !13.5411 881.572 876.511 5.061
Undist. Expend•• Central ServiCesSalaries 329.225 (5.711) 323.514 323.514Purchased professional services 14.000 3,350 17.350 17.346 4Miscellaneous purchased services 9.683 (3.045) 6.638 4.722 1.916Supplies and materials 9.000 9.000 8.694 306Miscellaneous expenditures 4.000 (305) 3.695 3.499 196
Tolal Undsl. Expend.· Central Services 365.908 {5.7111 360.197 357.775 2.422
Undisl Expend.• Required Maint. Sch. FacilitiesSalaries 289.906 (8,000) 281.906 264.008 17.898Cleaning. Repair and Maintenance Services 170.000 (40.582) 129.418 128.394 1,024Supplies and materials 130.000 (1.003) 128.997 127,954 1.043Other objects 1.000 {2OOI 800 482 318
Total Undst. Expend•• Required Maint. Sch. Facilities 590.906 {49.785) 541.121 520.838 20,283
See Managemenfs Discussion and Analysis section of this report for explanation of significant budget variances. original and final.
61 (CONTINUED TO NEXT PAGE)

C-1LOWER TOWNSHIP SCHOOL DISTRICT
Budgetary Comparison ScheduleGeneral Fund
Fiscal Year Ended June 30, 2012
Variance(Continued trom prior page) Original Budget Rnal Final to
Bud!let Transfers Bud!let Actual ActualUndlst. Expend .• Custodial Services
Salaries $792.189 $36.276 $828.465 $828.465Salaries of Non·lnstructional Aides 68.667 6.518 75.185 75.184 $1Purchased professional & tech. services 13.000 29.300 42.300 39,042 3,258Other purchased property services 55,000 (2.821) 52.179 48,704 3.475Insurance 126,983 (6,105) 120.878 120,878Cleaning. repair and maintenance services 1,000 (1.000)Travel 500 500 500Miscellaneous purchased services 6.500 3.122 9.622 6,457 3.165Generel supplies 108,000 8.000 116.000 111,538 4.462Energy (naturel gas) 188.893 (126.830) 62.063 62,063Energy (electricity) 443.475 (68.726) 374.749 374,749Other objects 2,000 !57Ol 1430 395 1,035
Total Undst. Expend .• Custodial Services 1,805,707 (122,336l 1,683,371 1,667,475 15,896
Undist. Expend .• Care & Upkeep of GroundsSalaries 8.000 8.000 3.643 4.357Purchased professional & tech. services 8,550 8.550 3.050 5.500Cleaning, rapair and maintenance services 12.150 (10,950) 1.200 1,200General supplies 19,236 (1,0001 18,236 18,053 183
Total Undst. Expend .• Care & Upkeep of Grounds 39,386 (3,4001 35,986 24,746 11,240
Undist. Expend .• SecuritySalaries 26.104 5.521 31.625 31.624 1Purchased Professional & technical services 63.990 2.000 65.990 65,963 27Cleaning. repair and maintenance services 1.200 375 1.575 818 757Generel supplies 2,000 2,000 1.864 136
Total Undst. Expend .• Security 91,294 9,896 101,190 100,269 921
Total Undst. Expend .• Oper. & Mainl of Plant Services 2,527,293 !165,6251 2,381,668 2,313,328 48,340
Undist. Expend .• Student Transportation ServicesSalaries of non-instructional aides 76.026 11.060 87,086 87,085 1Salaries for pupil trans. (bet home & sch) • ragular 773,198 28.525 801,723 796.452 5,271Salaries for pupil trans. (other than bet home & sch) 19,000 (13,635) 5,365 5.364 1Rental Payments· School Buses 2,100 2,100 2,099 1Contr. servo (sp ed stds) • joint agrmnts 56,000 (9,643) 46,357 38.882 7,475Contr. servo • Aide in lieu Pymts • Non Public 70,000 (13,097) 56,903 49,050 7.853Contr. servo • Aide in lieu Pymts· Charter Schools 15,283 15.283 15,282 1Miscellaneous purchased services· transportation 30.140 3,360 33.500 31.855 1.645Supplies and materials 88.000 6,350 94.350 93.520 830Transportation supplies 200.000 (16,766) 183.234 177.728 5.506Other objects 1700 685 2,385 2.353 32
Total Undst. Expend •• Student Transportation Services 1,314,064 14,222 1,328,286 1~,670 28,616
Unallocated Benefits· Employee BenefitsSocial security contributions 415.656 17.332 432.988 428,329 4,659Other retirement contributions· regular 607.406 (79.932) 527,474 527.474Unemployment compensation 40.000 (40.000)Workers' compensation 167,547 (7.191) 160,356 160.356Health benefits 3.801.236 285,216 4,086.452 4.076.906 7.546Tuilion reimbursement 50,000 (26.798) 23,202 23,202Other employee benefits 377,058 99,909 476,967 476,937 30
Total Unallocated Benefits· Employee Benefits 5,458,903 248,536 5,707,439 5,695,204 12,235
See Managemenrs Discussion and Analysis section of this report for explanation of significant budget variances. original and final.
62(COHTlNUED TO NEXT PAGE)

Co1LOWER TOWNSHIP SCHOOL DISTRICT
Budgetary Comparison ScheduleGeneral Fund
Fiscal Yeer Ended June 30. 2012
Variance(Conllnuocl from prior page) Original Budget Final Final to
Budget Transfers Budget Actual ActualEXPENDITURES:
On-behalf TPAF pension (non-budgetedl $367.408 ($367.408)On-behalf TPAF medical (non-budgeted) 738.584 (738.584)Reimbursed TPAF social security contribUtions (non-budgeted 865,466 1865.466l
Total Undistributed Expenditures· TPAF 1,971.458 {1,971.458l
Total Undistributed Expenditures $14.355,982 ($161,180l $14,194,802 15.855,764 !1.660.962l
Total General Current Expense 25.350,890 {123,383l 25,227,527 26.803,837 (1.576.31Ol
CAPITAL OUTLAY:Equipment:
Undist. Exp • support selVlces • students· regularUndlst. Exp • req. malnt • school facilities 148.292 148.292 148.285 7Undist. Exp • Non Instructional • School Buses· Regular
Total Equipment 148,292 148.292 148,285 7
Total Capital Outlay 148,292 148,292 148.285 7
Total Expenditures 25.350,890 24,929 25,375,819 26,952,122 (1.576.303l
Excess (Deficiency) of RevenuesOver (Under) Expenditures: 1588.02Ol 257,451 1330,569l 116411 448,980
Other Financing Sources (UseS):
Operating transfer in • Capital Projects Fund 53,322 53.322
Total Other Flnanclng Sources 53,322 53.322
Excess (Deficiency) of Revenues and OtherFinancing Sources Over (Under) Expendituresand Other Financing Sources (Uses): (588,020) 257.451 (330.589) 169.733 500.302
Fund Balance. July 1 2,808,188 2,808,188 2,808,186
Fund Balance. June 30 $2,220,166 $257.451 $2.4n.617 $2,9n.919 $500.302
Recapitulation of Fund Balance:Restricted Fund Balance:
ReselVed Excess Surplus· Designated for SubsequentYeers Expenditures $507.648
ReselVe for Excess Surplus 407.534Maintenance ReselVe 1.292.248Capital ReselVe 1
Assigned Fund BalanceYear-end Encumbrances 7.239Deslgnatad for Subsequent Yeers Expenditures 283.838
Unassigned Fund Balance 499,6132.9n.919
Reconciliation on Governmental Fund Statements (GAAP):Less: State Aid Payment not Recognized on GAAP Basis 1886.595l
Fund Balance per Government Fund (aMP) 210911324
See Managemenrs Discussion and Analysis seellon of this report for explanaUon of significant budget variances. original and final.
63

VarianceOriginal Budget Final Final 10Budget Transfers Budget Actual Actual
5349,431 510,947 $380,378 $380,378
349,431 10947 380,378 380,378
LOWER TOWNSHIP SCHOOL DISTRICTBudgetary Comparison Schadule
General FundEducation Jobs Fund
Fiscal Year Ended June 30. 2012
REVENUES:Federal sources:Education Jobs Fund
Total Revenue
EXPENDITURES:CURRENT EXPENSE:Undistributed Expendituras
Custodial ServicesSalaries 10947349431
Total Instruction 349431 10947
Total Expendituras $349,431 $10,947
Excess (Deficiency) of RevenuesOver (Under) Expendituras:
Fund Balance, July 1
Fund Balance, June 30
380,378
380,378
5380,378
See Managemenfs Discussion and Analysis section of this raport for explanation of significant budget variances, original and final.
64
380,378
380,378
5360,378
C·1b

C-2LOWER TOWNSHIP SCHOOL DISTRICT
Budgetary Comparison ScheduleSpecial Revenue Fund
Fiscal Year Ended June 3D, 2012
Original Budget Final Final toBudget Transfers Budget Actual Actual
REVENUES:Local sources $1,500 $1,500 $1,500State sources $343,656 343,656 343,656Federal sources 837,968 180,227 110181195 1,018,195
Total revenues 1,1811624 181127 1,363,351 1,363,351
EXPENDITURES:Instruction:
Salaries of teachers 599,124 57,273 656,397 656,397Other salariesOther purchased servicesTuition 436,166 73,270 509,436 509,436General supplies 4,315 15,955 20,270 20,270Miscellaneous expendituresTextbooks
Total instruction 1,039,605 146,498 1,186,103 1,186,103
Support services:Salaries of program directorSalaries of teachersSalaries of supervisor of instruction 62,142 62,142 62,142Personal services - employee benefits 79,877 35,229 115,106 115,106Purchased prof. and educational servicesOther purchased professional servicesPurchased professional and technical servicesTravelTuitionOther purchased servicesMiscellaneousSupplies and materials
Total support services 142,019 35,229 177,248 177,248
Facilities acquisition and construction services:Instructional eqUipmentNon·instructional equipment
Total facilities acq. and const. services
Transfer to charter schools
Total expenditures 111811624 181,727 1,363,351 1,3631351
Total outflows 1,181,624 181?27 1,3631351 11363,351
Excess (Deficiency) of revenues over (under)expenditures and other financing sources (uses)
65
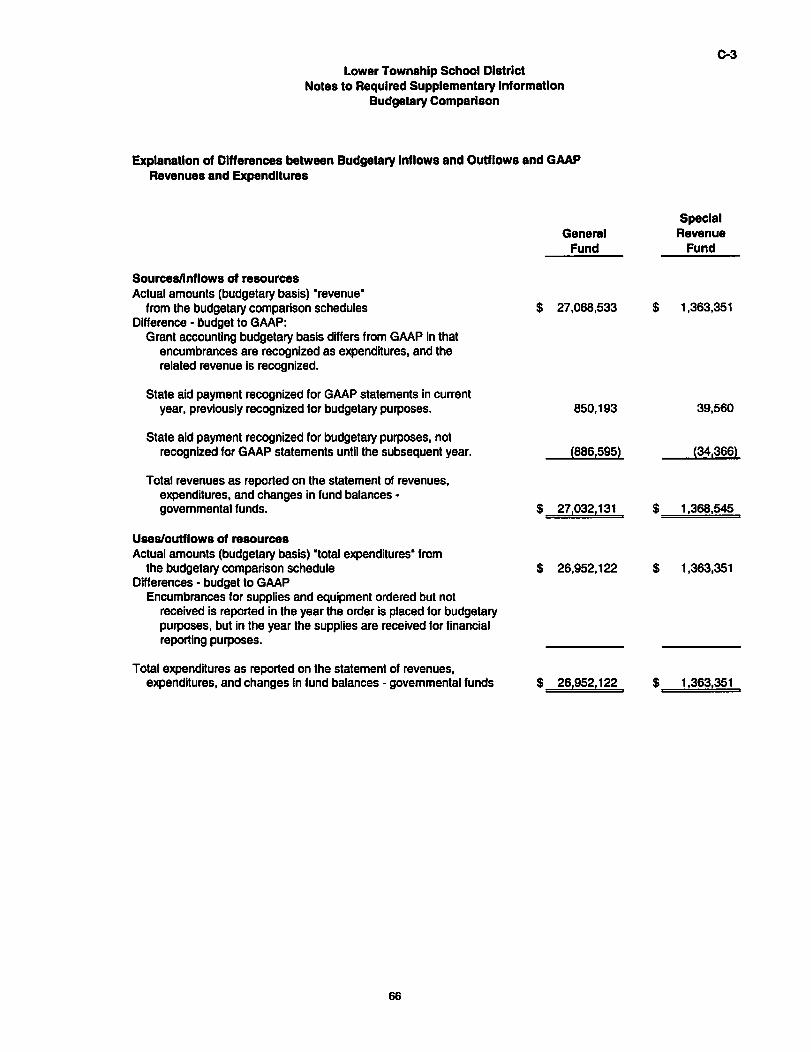
Lower Township School DistrictNotes to Required Supplementary Information
Budgetary Comparison
explanation of Differences between Budgetary Inflows and Outflows and GAAPRevenues and expenditures
Sourcesllnflows of resourcesActual amounts (budgetary basis) "revenue"
from the budgetary comparison schedulesDifference • ~udget to GAAP:
Grant accounting budgetary basis differs from GAAP in thatencumbrances are recognized as expenditures, and therelated revenue is recognized.
State aid payment recognized for GAAP statements in currentyear, previously recognized for budgetary purposes.
State aid payment recognized for budgetary purposes, notrecognized for GAAP statements until the subsequent year.
Total revenues as reported on the statement of revenues,expenditures, and changes in fund balances-governmental funds.
Uses/outflows of resourcesActual amounts (budgetary basis) ·total expenditures· from
the budgetary comparison scheduleDifferences· budget to GAAP
Encumbrances for supplies and equipment ordered but notreceived is reported in the year the order is placed for budgetarypurposes, but in the year the supplies are received for financialreporting purposes.
Total expenditures as reported on the statement of revenues,expenditures, and changes in fund balances- governmental funds
66
GeneralFund
$ 27,068,533
850,193
(886,595)
$ 27,032,131
$ 26,952,122
$ 26,952,122
SpecialRevenue
Fund
$ 1,363,351
39,560
(34,366)
$ 1.368,545
$ 1,363,351
$ 1,363,351

Other Supplementary Information
Special Revenue FundDetail Statements

E-1ALOWER TOWNSHIP SCHOOL DISTRICT
Special Revenue FundCombining Statement of Revenues and Expenditures
Budgetary Basisfor the Fiscal Year Ended June 30, 2012
(With comparative totals for June 30, 2011)
BroughtForward Totals
{Exh. E-1B~ 2012 2011REVENUES:State sources $343,656 $343,656 $395,604Federal sources 1,018,195 1,018,195 983,782Local sources 1,500 1,500
Total Revenues 1,363,351 1,363,351 1,379,386
EXPENDITURES:Instruction:
Salaries of teachers 656,397 656,397 677,400Tuition 509,436 509,436 513,132General supplies 20,270 20,270 5,213MiscellaneousTextbooks
Total instruction 1,186,103 1,186,103 1,195,745
Support services:Salaries of supervisors of instruction 62,142 62,142 57,199Personal services-employee benefits 115,106 115,106 126,442Supplies and materials
Total support services 177,248 177,248 183,641
Facilities acquisition and const. serv.:Instructional equipment
Total facilities acquisition and const. serv.:
Total Expenditures 1,363,351 1,363,351 1,379,386
Excess (Deficiency) of revenues over (under)expenditures and other financing sources (uses)
69

E-1BLOWER TOWNSHIP SCHOOL DlSllUCT
Special Rewnuo FundCombining Stltomont of Rev_ end ExpGndJturatl
Budgotary a....for tho Fiscal Yoar Endod Juno 30, 2012
lncIivtduals wI1h Dlsobllities Pd E.S.EA as amemled !1x No ChlId Left BahInd IN.C.L.B·1Preschool IDEA· PartB IOEA·PaItS
Capo Ed ACE Program Basic Preschool lIIIal Tille II • Part A TIlle IIIFund Grant Aid CunentYr. CunentYr. Current Yr. CunenlYr. CunemYr. Totals
REVENUES:Statl! soun:es $343.656 $343.656Fod&ral soun:es $482,714 526,722 $379.922 $116,213 $12.624 1,018,195Local BOUIti8t S500
" 0001500
Total Revenues 500 1000 343656 462.714 26722 379.922 116,213 12.624 1.363,351
EXPENDITURES:1nsIIucIIDn:
SolazIes of teachets 246,073 302,012 96.844 9.468 656,397General suppIios 500 1,000 17,508 1,262 20,270TulIiDn 462,714 26,722 509.4311
~ Mlsc:
TDIaIInsIruction 500 1000 246,073 462 714 26,722 319~0 96644 10730 1,'66,103
Support setvices:SolazIes of suponri$Dr of inslIucIkIn 62,142 62.142PemIII8l sorvices-employee benefits 33,441 60.402 19,369 1,894 115,106Mlsc:eDanaous
Total suppol1 services 60402 19369 1 B94 In 246
Facilities acquisition and consl. SeN.:InstructJonal equipmentNon-lnstructJonal equipment
TollJl facilities acqulsltloo and const. serv.:
Total Expenditures 500 1000 246,073 482714 28722 379,922 116213 12624 1,363,351
Excess (Deficiency) of revenues over (untler)~lluros lIIId olller finanI:inIJ sources (uses)

LOWER TOWNSHIP SCHOOL DISTRICTSpecial Revenue Fund
Statement of Preschool Education AidBudgetary Basis
for the Fiscal Year Ended June 30, 2012
School: District Wide Total
E-2
EXPENDITURES:Instruction:
Salaries of teachersGeneral supplies
Total instruction
Budgeted Actual Variance
$248,073 $248,073
248,073 248,073
62,142 62,14233,441 33,441
95,583 951583
Support Services:Salaries of program directorsEmployee beneifts
Total support services
Facilities acquisition and const. serv.:Instructional equipment
Total expenditures
Total facilities acquisition and const. servo
$343,656 $343,656
CALCULATION OF BUDGET AND CARRYOVER
Total Revised 2011-2012 Preschool Education Aid AllocationAdd: Actual ECPA Carryover (June 30, 2011)
Total Preschool Education Aid Funds Available for 2011-2012Less: 2011-2012 Budgeted Preschool Education Aid
(Including prior year budgeted carryover)
Available & Unbudgeted Preschool Education Fundsas of June 30, 2012
Add: June 30, 2012 Unexpended Preschool Education Aid
2011-2012 Preschool Education Aid Carryover
2011-2012 Preschool Education Aid CarryoverBudgeted for Preschool Programs in 2012-2013
71
$343,656
343,656
343,656

Capital Projects FundDetail Statements

F·1
LOWER TOWNSHIP SCHOOL DISTRICTCapital Projects Fund
Summary Statement of Revenues, Expenditures,and Changes in Fund Balance· Budgetary Basis
For the Fiscal Year ended June 30,2012
Revenues and Other Financing Sources:State Aid - SDA GrantTransfer from capital outlayTotal revenues and other financing sources
expenditures and Other Financing (Uses):Purchased professional servicesConstruction servicesCancelled SOA GrantTransfer to General FundTotal expenditures and other financing (uses)
$35,54853,32288,870
Excess (deficiency) or revenues over (under) expenditures (88,870)
Fund Balance - July 1, 2011 88,870
Fund Balance - June 30, 2012
73

F·1a
LOWER TOWNSHIP SCHOOL DISTRICTCapital Projects Fund
Statement of Project Revenues, expenditures, Project Balance,and Project Status· Budgetary Basis
Sandman Elementary School· Roof ReplacementFrom Inception and for the Fiscal Year ended June 3D, 2012
Revenues and Other Financing Sources:State seureea- SCC GrantTransfer from capital outlay
Total revenues
expenditures and Other Financing Uses:Purchased professional servicesConstruction servicesTransfer to General Fund
Excess (deficiency) or revenues over(under) expenditures
Additional project Information:Project NumberGrant DateBond Authorization DateBonds AuthorizedBonds IssuedOriginal Authorized CostAdditional Authorized CostRevised Authorized Cost
Percentage Increase over OriginalAuthorized Cost
Percentage CompletionOriginal target completion daleRevised target completion date
RevisedAuthorized
Prior Periods Current Year Total Costs
$511,200 (535,548) $475,652 $475,652766,800 766,800 766,800
1.2781000 (351548} 1,2421452 1,242,452
94,519 94,519 94,5191,094,611 1,094,611 1,094,611
531322 53,322 53,3221,1891130 531322 11242,452 1,242,452
$88.870 (~88,870}
#2840-050-09-0ZAB07/01/09N/AN/AN/A
$1,278,000$0
$1,278,000
0.00%100.00%09130/0912/31/09
74
Proprietary FundsDetail Statements
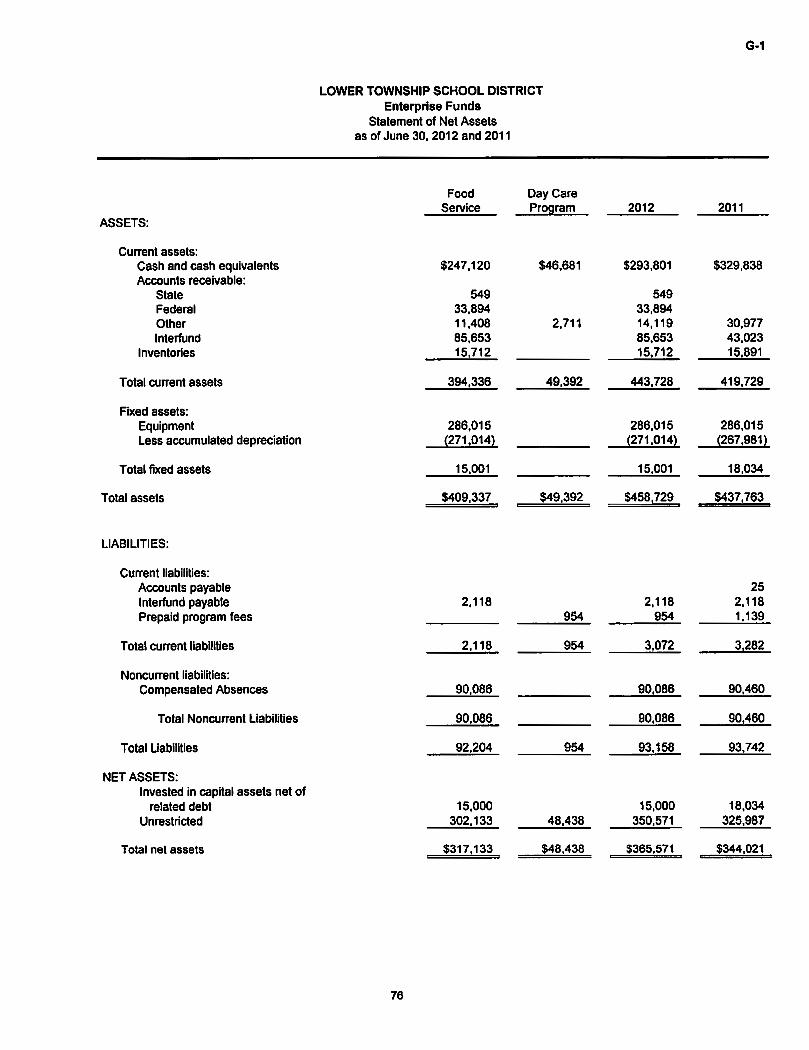
G-1
LOWER TOWNSHIP SCHOOL DISTRICTEnterprise Funds
Statement of Net Assetsas of June 30, 2012 and 2011
Food Day CareService Program 2012 2011
ASSETS:
Current assets:Cash and cash equivalents $247,120 $46,681 $293,801 $329,838Accounts receivable:
State 549 549Federal 33,894 33,894Other 11,408 2,711 14,119 30,977Interfund 85,653 85,653 43,023
Inventories 15,712 15,712 15,891
Total current assets 394,336 49,392 443,728 419,729
Fixed assets:Equipment 286,015 286,015 286,015Less accumulated depreciation (271,014) (271,014) (267,981)
Total fixed assets 15,001 15,001 18,034
Total assets $409,337 $49,392 $458,729 $437,763
LIABILITIES:
Current liabilities:Accounts payable 25Interfund payable 2,118 2,118 2,118Prepaid program fees 954 954 1,139
Total current liabilities 2,118 954 3,072 3,282
Noncurrent liabilities:Compensated Absences 90,086 90,086 90,460
Total Noncurrent liabilities 90,086 90,086 90,460
Total liabilities 92,204 954 93,158 93,742
NET ASSETS:Invested in capital assets net of
related debt 15,000 15,000 18,034Unrestricted 302,133 48,438 350,571 325,987
Total net assets $317,133 $48,438 $365,571 $344,021
76

G-2
LOWER TOWNSHIP SCHOOL DISTRICTEnterprise Funds
Comparative Statement of Revenues, Expenses and Changes in Fund Net Assetsfor the Fiscal Years ended June 30, 2012 and 2011
Food Day CareService Pr~ram 2012 2011
OPERATING REVENUES:Local sources:
Daily sales-reimbursable programs:School lunch program $1681748 $168,748 $178,673
Totakjaily sales-reimbursable programs 168,748 168,748 178,673
Daily sales non-reimbursable programs:Adult and AiaCarte meals 151,742 151,742 159,196Registration Fees $321,536 321,536 303,179Other reimbursements 17,538 17,538 10,075Special Functions 17,859 17,859 15,731
Total operating revenue 355,887 321,536 6n,423 666,854
OPERATING EXPENSES:Salaries 395,536 239,419 634,955 733,024Employee benefits 233,968 18,315 252,283 254,852Supplies and materials 31,085 31,085 25,965Depreciation 3,033 3,033 3,497Cost of sales 435,300 27,701 463,001 413,434Professional services 1,228 1,228 1,000Purchased property services 14,339 14,339 10,801Other 4,518 4,518 4,191
Total operating expenses 1,119,007 285,435 1,404,442 1,446,764
Operating income (loss) {763,1201 36,101 {727,0191 {n9,9101
Non-operating revenues:State sources:
State school lunch program 10,864 10,864 10,404Federal sources:
ARRA - National schoOl lunch equipmentNational school lunch program 405,061 405,061 384,823School breakfast program 264,392 264.392 249.137Snack Program 3.322 3.322 2,792
U.S.D.A. commodities 64.547 64,547 50,119Operating transfer InInterest revenue 383 383 993
Total non-operating revenues 748.569 748,569 698.268
Change in net assets (14.551) 36.101 21.550 (81,642)
Total net assets - July 1 331,684 121337 344,021 425,663
Total net assets - June 30 $317,133 $48,438 $365,571 $344,021
rr

G·3
LOWER TOWNSHIP SCHOOL DISTRICTEnterprise Funds
Statement of Cash Flowsfor the Fiscal Years ended June 30, 2012 and 2011
Food Day CareService Program 2012 2011
Cash flows from operating activities:Cash receipts from customers $372,002 $322.094 $694.096 $665.798Cash payments to employees for services (629.879) (257.734) (887.613) (946.503)Cash payments to suppliers for goods and services {421.769} {27,701} {449,470} {413:578}
Net cash used by operating activities {679,646} 36.659 {642.987} {694.283}
Cash flows from noncapital financing activities:Board subsidiesCash received from state and federal reimbursements 606.567 606.567 667,447
Net cash provided by noncapital financing activities 606.567 606.567 667,447
Cash flows from capital financing activities:Purchases of fixed assets
Net cash used by capital financing activities
Cash flows from investing activities:Interest on investments 383 383 993
Net cash provided by investing activities 383 383 993
Net increase (decrease) in cash and cash equivalents (72.696) 36,659 (36.037) (25.843)
Cash and cash equivalents. July 1 319.816 10,022 329.838 355,681
Cash and cash equivalents. June 30 $247.120 $46.681 $293.801 $329:838
Reconciliation of operating income (loss) to net cash provided(used) by operating activities:Operating income (loss) ($763.120) $36.101 ($727,019) ($779,910)Adjustments to reconcile operating income (loss)to cash provided (used) by operating activities:
Depreciation 3,033 3,033 3.497Federal commodities 64,547 64,547 50.119ARRA • National school lunch equipmentOperating transfer inChange in assets and liabilities:
(Increase)Jdecrease in accounts receivable 16,115 743 16.858 470(Increase)/decrease in inventory 178 178 (3.845)Increase/(decrease) in accounts payable (25) (25) (4.460)Increase/(decrease) in interfund payable. netIncreasel(decrease) in deferred revenue (185) (185) 396Increase/(decrease) in compensated absences (374} !374} 39,450
Net cash used by operating activities !$679,646} $36,659 ($642.987} {$694.283}
78

Fiduciary FundsDetail Statements

H-1
LOWER TOWNSHIP SCHOOL DISTRICTFiduciary Funds
Combining Statement of Net AssetsJune 30,2012
(With comparative totals for June 30. 2011)
Agen~ Funds UnemploymentCompensation
Student Insurance TotalsActivity PayrOll Trust 2012 2011
ASSETS:Cash and cash equivalents $7.345 $3,839 $132.105 $143.289 $142.115Interfund receivable 23.086
TOTAL ASSETS $7.345 $3.839 $132,105 $143.289 $165.201
LIABILITIES:Cash overdraft 3,767Accounts payable 36.748 36,748 62.683Interfund payable 1.000 31.232 32,232 41,473Payroll deductions and with holdings 2.839Due to student groups 7.345 7.345 7.614
Total liabilities 7,345 3,839 67.980 76.325 115.537
NET ASSETS:Restricted for:
Unemployment claims 64.125 64.125 40.587
Total net assets $64.125 $64,125 $40,587
80

H-2
LOWER TOWNSHIP SCHOOL DISTRICTFiduciary Fund
Comparative Statement of Changes in Fiduciary Net Assetsfor the Fiscal Years ended June 30,2012 and 2011
UnemploymentCompensation
Insurance TotalsTrust Fund 2012 2011
REVENUES:
Local sources:Board ContributionsOther Contributions $48,860 $48,860 $49,385Interest on Investments 146 146 304
Total Revenues 49,006 49,006 49,689
EXPENDITURES:
Current Expense:Undistributed Expenditures:
Unemployment payments 25,468 25,468 88,179
Total Expenditures 25,468 25,468 88,179
Change in net assets 23,538 23,538 (38,490)
Total net assets - July 1 40,587 40,587 79,077
Total net assets - June 30 $64,125 $64,125 $40,587
81

H·3
LOWER TOWNSHIP SCHOOL DISTRICTStudent Activity Agency Fund
Schedule of Receipts and Disbursementsfor the Fiscal Year ended June 30, 2012
AccountsBalance Cash Cash Payable Balance
July 1, 2011 Receipts Disbursements June 30,2012 June 30, 2012
Elementary scnoois- A" $7,614 $6,677 $6,946 $7,345
Total $7,614 $6,677 $6,946 $7,345
82

H-4
LOWER TOWNSHIP SCHOOL DISTRICTPayroll Agency Fund
Schedule of Receipts and Disbursementsfor the Fiscal Year ended June 30,2012
Balance BalanceJuly 1, 2011 Additions Deletions June 30, 2012
ASSETS:
Cash and cash equivalents $19,319 $19,060,814 $19,076,294 $3,839
Total assets $19,319 $19,060,814 $19,076,294 $3,839
LIABILITIES:
Payroll deductionsand withholdings $9,077 $7,526,435 $7,532,673 $2,839
Interfund payable 10,242 1,000 10,242 1,000Net payroll 11,533,379 11,533,379
Total liabilities $19,319 $19,060,814 $19,076.294 $3,839
83
Statistical Section
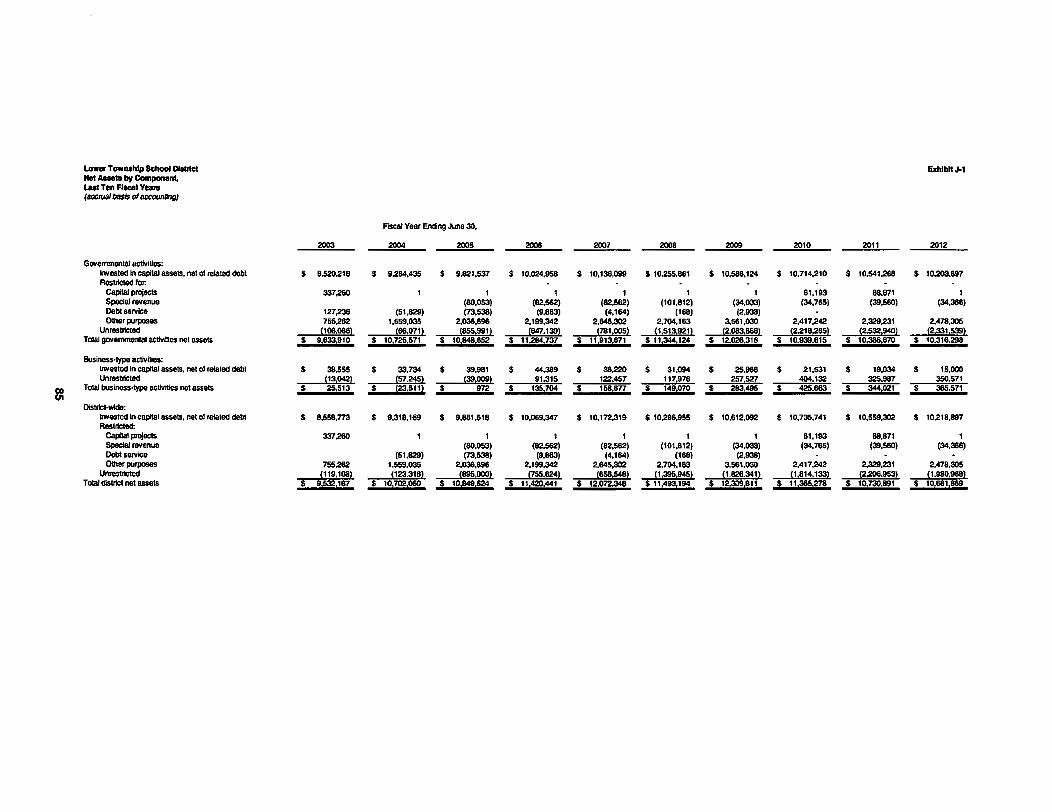
Lower Towlllhip School DlaIJld Exhlbll J..1Net Allele by Component,LQI Ten Fltcal YealS(MClVIIloasis of accounling)
FIsca' Year Ending June 30,
2003 2004 200S 2006 2007 2008 2009 2010 2011 2012
Govemmonlal activities:Invosted In capital assets, net 01related debt S 8,520.218 $ 9.284.435 $ 9.821.537 $ 10.024.958 $ 10.138,099 $ 10.255,861 S 10.586.124 $ 10.714.210 $ 10.541,268 S 10.203.897RosIriCIed lor.
CapftaI p:ojects 337.260 I 1 1 I I 61.193 88,871 1SpeclailllYenua (00.053) (82.562) (82.562) (101.812) (34.033) (34,765) (39.560) (34.388)Debt sOl'iIlce 127.238 (51.829) (73.536) (9.863) (4,184) (168) (2.938)Other purposes 755.282 1.559.035 2.038,696 2.199.342 2.845.302 2.704,163 3.581.030 2.417.242 2.329,231 2.478.305
Unrestricted 1106•0661 166,0711 1655,9911 1847•1391 1781,0051 11.513,9211 12•083,8881 12.218.g651 12•532,9401 12•331•5391Total govemmenlal actIvilios net assets $ 9.633.910 S 10.725.571 $ 10,848,652 $ 11~,737 $ 11.913,671 S 11.344,124 S 12.028.316 $ 10.939.615 $ 10.386,870 S 10.318.298
Bus'ness'lypo actIvllies:Invosled In capital assets, net 01related debl S 38,555 $ 33.734 S 39.981 $ 44.389 $ 38.220 $ 31,094 S 25.968 $ 21.531 $ 18.034 S 15.000Unrestricted 113,0421 157.2451 139,0091 91.315 122.457 117.978 257527 404.132 325.987 350.571
a lola! business-Iype acllYlties nol assets S 25,513 S 123•5111 S 972 S 135.704 $ 158,677 S 149,070 $ 263.495 S 425,683 $ 344,021 S 385.571
Distrlct-wfde:Invostecl in capIIaI assets, net 01related detlI S 8.558.773 S 9.318.189 S 9.881.518 S 10.069.347 $ 10.112.319 S 10.286.955 S 10,612.092 s 10.735.741 S 10.559.302 s 10.218.897Rostrlcled:
caplal p:ojects 337.260 1 1 1 1 1 81.193 88.871 1SpeclailllYenua (00.053) (82.562) (82.562) (101,812) (34.033) (34.785) (39.560) (34.386)Deb1 service (51.829) (73.536) (9.863) (4.164) (188) (2.938)OIlIer purposes 755.282 1.559.035 2.038.898 2.199.342 2.645.302 2.704.163 3.561.030 2.417.242 2.329.231 2.478,305
Unrestricted 1119,1081 1123.3181 1895,0001 1755•8241 1658•5491 1',395,9451 11,828.3411 1
',8'4,1331 12•206•9531 11,980,9681
Total district net assets s 9,532,'87 s 10,702.060 S 10.849.824 S ",420.44' $ 12.072.348 S '1,493,'94 s 12,309.811 S 11.385.278 S 10,730.891 $ 10,881,889

~ Townahlj> School DIstrtct EahIIIII .1-2CIIa .... 1n Net AuaIs, I...Ut Ton FlKaI Yea ..(1ICaIJI)} bliss of_tiling}
Fiseal Year EndlnO June 30,
2003 2004 2005 2006 2007 2008 2009 2010 2011 2012
ExponlO.:GovommllflUli 0C1Iv1ti8B:
Inalnldlon:Regular S 9,440,775 S 7,522,781 5 10,694,139 S 9,098,943 S 9,098,158 $ 9,822,955 S 9,085,370 9,514,282 5 9,743,580 $ 9,592,665SpeciIIl ecIucalion 1,930,083 4,7811,580 2,750,400 2,396,143 2,473,287 2,615,030 2,520,758 2,942,703 2,507,108 2,552,72401hat inallUCtion 14,452 13,459 13,222 10,512 10,512 10,512 2.226 91,224 84,826 93,767
Suwo:I ServIces:TuWon 248,408 95,894 147,586 255,684 337,307 247,578 472,665 449,787 331,532 508,575SbJd8nl & insIrucIion reIa18d I8Mces 3,742,766 4,OBII,671 3,m,740 3,053,827 2,m,703 2,942,790 2,911,069 3,071,712 2,779,070 2,737,845ScIIoaI ocImilIi$InItMt seMceI 952,719 969,412 897,529 668,873 726,108 794,739 848,452 883,487 879,408 922,528GenetlIIIII1d business adIItniIInltive eerviCes I,OBII,382 905,606 959,448 770,082 796,085 779,555 807,778 808,848 595,680 930,621PI4nl CIp8IlItiOns anti rnain!enance 3,348,431 3,438,349 3,177,338 2,995,420 2.649,551 3,037,883 2,735,170 3,644,913 2,181,749 2,464,083PIJI)iIlnInspotIation 1,323,7811 1.239,763 1,309,747 1,145,572 1.208,360 1,258,081 1,166,298 1,195,005 1,153,759 1.299,670UIIIIlloco1ed employee beneIiIs 5,149,668 6,641,039 7,028,477 6,123,656 6,726,8111 7.222,580 7,666,682
1n1e18111 on long-term dab! 282,012 235,911 213,147 120,992 129,131 105,601 67,958 33,353Uno!IocoIed depleCiabOn 88,585 88919 24245 24729 24302 24,651 21728 23122 23465 2309
T010Igovernmenlal octMties expenses 22,430,373 23,347,345 23,964,541 25,690,445 26,871,523 28,667,832 28,763,124 29,085,015 27,502,937 28,471,249
Buslness.!ype OCtiVlties:Mtr·1!ChooI program 248,542 263,503 258,430 272,258 327,852 333,689 352,947 338,113 314,208 285,435FoocIseMce 1,052,408 1,077,827 1,052,391 1,069,776 1,133,185 1,154,226 1,139,221 1,154,673 1,132,556 1,119,007
ToIoI buSlneSa.!ype Odlvities expense 1,298,950 1341330 1308821 1342,034 1,461,037 1468095 1491168 1490,788 1446,764 1404442T0loi dIs!1td 8lI;Ienses S 23,729,323 s 24,688,675 S 25.2731392 527,0;12,479.00 528,332,580 00 530,155,927.00 $28,254,292.00 $3015'3,8111.00 $28,949.701.00 $29,875.691.00
CXI ContinuedCl)

Lowe, Township School Dlltllct E1hlbltJ.ZChanges In Not "-Hie, Last Ten Fbcal Yea,.(acctual ""$Is c/ occounling)
Fiacol Yeor Endlll9 J,,"o 30.
2003 2004 2005 2006 2007 2008 2009 2010 2011 2012
8usiness-1ypo oIIclivitiea:CIIotg88 for 1Se1VIce8:
AII8t·1Chool ptOgnUII 271.395 251.801 269.033 290.973 340.307 296.648 387.080 322.827 303.179 321.538Food service 381.655 391.689 396.484 387.563 394.241 394.997 408.825 406.152 383.675 355.687
Operating grants lind ccntrtbulions 450.297 448.570 429.262 514.973 538.406 584.316 678.235 732.403 697,275 748.188CoIIplIaI gronts lind contriIMions
Tola!bu3i!leu Iypo aClivltlos program revenues 1,103,347 1,002,069 1,094,759 1,193,509 1,272,954 1,275,961 1,454,140 1,481,382 1,364,129 1,425,809Tola!dislrid ptOgnUII rovenues $ 71OO317ib i 81002,604 S 511331~ i 41281ii'75 I 6,3901285 S 617851656 S 41688,784 i 5.334.449 $ 4.389~41 S 4,765.612
Not (&penso)/Re.mnue:Governmental adMlies $(15.929.957) $ (18.438.810) $ (19.925.852) S 122.602.179) (21.754.192) S (23.176.137) $ (23.528.480) S (25.211.948) $ (24.477.825) $ (25.131.248)1IuIlness-1ypo Odivities 1195,8031 1249,2611 [214,0621 (148,5251 1168,0831 1212,1341 137,0291 129,4041 182,8351 21167Tola! cfislrId.wIde net 0lfI)eI1$8 $116,125,5601 s 1181688.0711 1120,139,9141 s !22;75O.7041 s 121194212751 s 123,39012711 s 123,565,5081 $ 125.241,3521 s 124,560.4601 $ 125,110,0791
Genoral RGwnUG8 and 0Ihct Changes In Not AaIClte:Go¥emmantal activi!les:
Propeny taxes levied for genemI ~. net S 11.989.447 S 12.755.123 $ 11.631.420 S 12.907.390 S 13.606.148 S 13.364.508 $ 13.699.088 S 13.899.068 $ 14.371.689 $ 14.659.327Toxes levied for dObI sennce 473.074 494.484 471.558 474.410 470.775 472.801Urvellb1dod grants lind conlIIbu!ioM 4.598.468 4.987.253 7.953.699 9.568.438 8.133.435 8.628.209 9.863.807 9.m.801 9.435.089 10.199.023Tuition 63.079 50.821 124.821 87.888 39.737 26,299 37.015 35.889 19.971Inveslment earnings 100.542 34.175 65.606 148.034 183.368 127,189 67.208 25.595Miscellaneous ir1COma 46.911 64.931 157.134 75.340 109.138 174.684 33.397 83.147 62.233 182.353LosS on Disposal 01 ~ AaseIS (47,281) (183.832)Tronafers 1230,0001 1200,0001 12320001 1279.1431 1208,2051 12OO,32!1 1169,7021 [170.0001
(XI T_ gavemmental octivlties 16,519,168 17528471 20,048,933 23038264 22,383,126 22,608,590 24,210,672 24125.247 23,925,080 25.060674.....IIuIlness-Iypo 0CIM1Jes'
InvesImenI eamrngs 815 238 382 4.114 2.651 2.200 1.751 1.572 993 383Misce!loneous Inccme 6.183LosS on Disposal 01 ~ AaseIS 12.904)Tronafers 230000 200000 232000 279143 208205 200,327 169702 170.000
T_ buIinOss-lypo_ 230,815 197332 238,545 283257 211,056 202,527 171453 171.572 993 383ToIIIIdislrid_ S 16,749,981 S 11.7251603 $ 20.287.478 S 23.321.521 i 22,594,182 S 22.811.117 $ 24.382,125 S 24.298.819 $ 23.926.073 S 25,061.057
Change In Not AaIClte:Govemmental_ $ 569.209 S 1.091.681 $ 123.081 S 438.085 $ 628.934 S (569.547) $ 682.192 5 (1.086.7011 $ (552.745) $ (70.572)Business-Iypo IIdM1ies 35212 151,9291 24483 134,732 22973 ~9,6071 134.425 142.168 161,6421 21550ToIIII__
5 624421 S 1.0391732 S 147584 S 570817 S 651.907 S 15'1,1541 S 816.617 S !844·S331 5 1634.38!1 s 149.0221

~ Township School Dllllrtct ExhIbltJ.3Fund Balan-. Governmental Fund&,UIat Ten RIICIII Years(mocIifis4 acctUallNlSis 01acoounting)
Fiscal Year Ending JU11030,
2003 2004 200S 2006 2008 2009 2010 2011 2012
o-taI Fund:RoseMId lor.
Encumblances S 56,870 S 31,582 $ 499,735 $ 42,780 S 167,854 $ 30,194 $ 6,S92 S 23,358 S 6,187 S 7.239Maintenance reserve 400,000 400,000 700,000 1,000,000 1,292.246 1.292.246 1.292,246 1.292.246 1.292.246CapiIalIOS8Ml 1 1 1 1 1 1 1 1 1 1EII:eSS surplus 698,S92 1,127,453 482,941 973,621 503.827 681.254 514,138 323,150 507,646 407,534E_ sutp!us • CIesigna!ed lor subsequent
yoalS mcpencIiIuros 439,432 482,941 973,621 503,827 681.254 514,138 323,150 507,646Unrese1Ved • de3igna1ed lor sutsequenI years
oxpendiIuros 196,642 1,066,800 200,000 200,000 263,638Unrese1Ved 764,425 807,780 250,659 45,893 64a'2 59,56S 1470,872! 14~6831 1371~ I~~
TCIIaJ genoraIlund S 1,519,688 S 2,366,816 S 2,072,768 $ 2.245,236 $ ~70915'5 S 2?63?29 $ 3,090,159 $ 1,876,220 S '19571993 $ 2.0911324
I AI 0Ihe1 GovemmetttaJ FundsResorved:
Encumblances~rved, repoI1eCI in:
Special revenue lund S (85,882) $ (81,954) $ (80,053) $ (82.562) $ (82,562) $ (101,812) S (34,033) $ (34,765) S (39,560) S (34,366)CapiIal projee1s lund 337,259 125,532 88.870Deb! seMce lund 147,477 (19,888) (19,455) 1,340 1,738 1,832 94
TllIaIaD 0Iher govemmenl8llunds $ 398,854 $ 1101,6421 $ 19915081 s 181~1 $ 18018241 $ 199,9801 s 133,9391 $ 901767 $ 491310 $ 134,3661

Lower Township School District exhibit J-4Changes In Fund Balances, Governmental Funds,Last Ten Fiscal Years(modified accl1J8l basis of accounting)
2003 2004 2005 2006 2007 2008 2009 2010 2011 2012
RevenuesTax levy s 11,989.447 s 12.755.123 s 12.104,494 s 13,401.874 s 14,077,704 $ 13.838.918 s 14.369.863 s 14.371.889 s 14.371.889 s 14.659.327Tuition charges 63.079 SO.821 62,398 124.821 87,688 39.737 26,299 37.015 35.869 19.971InteleSt eamings 65,606 146.934 183,368 127.189 67.208 25.595Miscellaneous 161.136 100.562 96,704 81.340 110,132 176.339 35.397 89.144 82.233 183.853State sources 9.944.661 10.664.668 10,799,221 11.496.486 12.171.222 13.082.136 12.092.683 12.799.561 11.397.813 12.085.558Federal sources 1.138.539 1,211,664 1,191,199 1.154.218 1,078,548 1.034.293 1,023.588 1,356,310 1,062.388 1,451,967
Total revenue 23,296,862 24,802,838 24,319,622 26,405,673 27,708,662 28,298,612 27,615,018 28,679,514 26,950,192 28,400,676
ExpendituresInstruction
Regular Instruction 7,796,130 5,762,128 8,232,672 8,751.768 8,805,744 8.749,588 8,741.665 9,319,145 8,994,949 9,487,685Special education instruction 1,461,641 3,594,069 2,186,748 2,396.143 2,473,287 2.615.030 2,520,758 2,642,703 2,S07,l08 2.552.724Other special instruction 10,932 10,237 10,512 10.512 10,512 10,512 2,226 91,224 84,826 93,767Other instruction
SY:QPOrtServices:co Tuition 248,408 95,894 147,586 255,664 337,307 247.578 472,665 449,787 331,532 508,575
Student & instruction related services 3.071.027 3,259,806 3,003,551 3,053,827 2.777,703 2,942,790 2,911,069 3,071.712 2.779,070 2.737,645School administrative services 875.007 737,668 675,042 619,415 677.504 745.437 807.776 837,244 832,478 876,511General and business admin.services 731,007 749,349 762.863 770.082 796.065 779,555 804,996 808,646 595,880 630,621Plant operations and maintenance 2,607.291 3,000,035 2,698,718 2.937.838 2,595,257 2,606,225 2,631,538 2,542,554 2,334,858 2,313,328Pupll transportation 978,770 1,003,249 1,041,335 1,145,572 1.208,360 1,258,081 1,166,298 1,195,005 1.153.759 1.299,670Other support services 3,772,861 4,467,404 4,696,391 5.149.668 6,641,039 7.028.477 6,123.656 6.726,801 7,222,560 7.666,662
Capital outlay 345,243 272,358 232.271 151,394 23,571 388,373 179.371 1,222,540 72,856 148.285Debt service:
Principal 790,000 1.080,000 500,000 530.000 555,000 590,000 620.000 655.000Interest and other charges 2611772 2241210 191,647 163.873 1341431 103.601 70,827 38,386
Total expenditures 2219501089 24,2561405 24,379,336 25,935,776 27,035,780 28,063,227 27,052,845 29.5981747 2619091876 28,315.473Excess (Deliclency) 01 revenues
over (under) eKP8ndllures 346,773 546,433 (59,714) 469,897 672,882 235,385 562,173 (919.233) 40,316 85.203
Other Financing sources (UBes)Cancelled SOA Grant (35,548)Loss on sale of securities (47.281)Translers in 766.800Translers out 1230,0001 1200,0001 1232,0001 1279•1431 1208•2051 1200,3271 1'6917021 193818001
Total other financing sources (uses) 127712811 1200,0001 1232,0001 1279•1431 1208•2051 1200,3271 1'6917021 1'7010001 135,5481
Net change in fund balances $ 69,492 $ 346,433 $ 1291,714} s 190,754 s 464,677 $ 35,058 s 392,471 $ 11,089,2331 $ 401316 $ 49,655
Debt service as a percentage ofnoncapital eKP8ntfitures 4.65% 5.44% 2.86% 2.69% 2.55% 2.51% 2.57% 2.44% 0.00% 0.000/0
Source: DIstrict records

Lower Township School DistrictGeneral Fund - Other Local Revenue by SourceLast Ten Fiscal Years(modified accrual basis of accounting)
ExhlbitJ-5
Refunds ofFiscal Year Interest on Prior Years Contraced Sale of Used
Endin9 June 30, Investments Tuition Expenditures Refunds Rentals Services Eguiement Miscellaneous Total
2003 $ 43,168 $ 63,079 $ 24,818 $ 19,800 $ 12,831 $ 725 $ 1,568 $ 165,9892004 33,875 50,821 31,298 21,780 11,853 149,6272005 65,285 62,398 38,334 23,960 32,331 222,3082006 146,934 124,821 41,957 26,360 6,116 346,1882007 183,368 87,688 79,523 28,200 1,015 379,7942008 127,189 39,737 140,529 30,160 4,081 341,6962009 67,208 26,299 290 32,260 847 126,9042010 25,595 37,015 47,897 33,500 1,750 145,7572011 8,338 35,869 2,400 69,600 1,895 118,1022012 4,584 19,971 $ 91,851 16,287 69,600 31 202,324
$ 705,544 $ 547,698 $ 91,851 s 423,333 s 355,220 s 12,831 $ 725 $ 61,487 $ 2,198,689
Source: District records

~ TOWMIIlp Scftool 0IaIrIctAueuod ValllO and AcWaI Valuo of Tuablo Property,Last Ten FIscal Yea ...
co...
IownaI!'e of L!!Wl!f
FlICaIYear
EndedJuno 30, Vacant LAnd Rosldontlal Farm RoS. Qfarm Commorclal
2003 S 35.040.300 S 1.266,401,200 S 3,400,100 $ 753,900 S 130,424,0002004 31,668,200 1,292,620.800 3,200,800 890.000 130,204,8002005 30,765,500 1,320.048,900 3.564,400 946,700 131,287,9002008 29,777.500 1,347,708,100 3.489,700 899,200 130.801,5002007 139.128.300 4,221.414.400 10.553,100 1.188,000 310,577.5002008 133,431,800 4.217,537,900 9,472,800 1,092,000 309,843,8002009 135.540,800 4,236,864.100 5,612,800 951,900 309,691.2002010 98,832,700 3.893,887,300 6.757,300 967.900 275,537,4002011 91.427,900 3,694,390.400 6,219,800 942,300 278,275.9002012 87,921,400 3.705,980.700 4,460,700 911.900 276,929,100
Source: MunIcipal TOl AssGn«
Total DIrectPublic Tn· SchoolTaa EaIlmAIocI Actual
Total Aaacsaed UtlIItIGa HoI Valuation Exempl RaIG (County Equallzodlindustrial !)!!rtmGnt Value a Tnabla P"'I!!!!X b Valuo
1,124,800 S 8,059.200 S 1,443,203,500 S 5.349,591 $ 1.448,553,091 S 107,542,800 S 0.854 S 1.905,719,6231,124,800 8.059,200 1,485,988,200 4,245,714 1.470.213,914 109,210,500 0.847 2.346,825,5871,124.800 8,059,200 1,493,797.400 3,535,783 1,497,333,183 110,162.100 0.852 2,913,105,728
6,059.200 1,518,733,200 2,738.571 1,521.471.771 114,453,300 0.905 3,530,553.71513.282.500 4.696.123,800 6,437,653 4.702,561,453 324,196,400 0,297 4,114,474,58413.282,500 4,684,840.800 6,343,694 4,690,984,294 325.244,700 0,301 4,419,878,07014,165.900 4,702,828,500 6,790,522 4,709,617,022 319,778,100 0.308 4,503,993,50613,375,400 4,089,338.000 6,782,972 4.096,120,972 281.510,700 0,351 4,418,591,95113,375.400 4,084,631,700 5,957,340 4.090,589,040 288,718,900 0,355 4,227,524,47313,161.400 4,089,365,200 6,102.592 4,095,487,792 268,088,300 0362 4.034,131.771
NOlO:Roal properly IS requaod 10bo asaGsSfld al some _!age 0I1rue value (fair or lNI1I<elvalue, es_ by em:h county _ oIlaxIItion
Reassessment CCICUt$ _ ordc18d by II>e County IloarcI 01Taxation
b Tox rates oro per S100
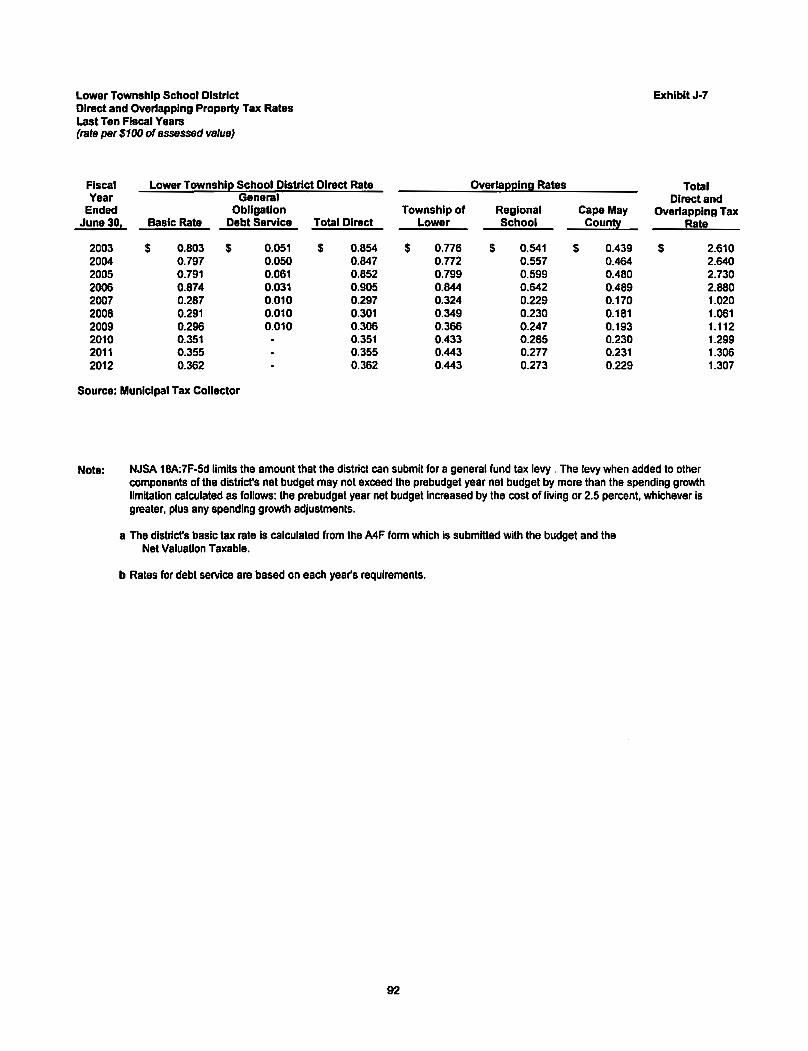
Lower Township School DistrictDirect and OVerlapping Property Tax RatesLast Ten Fiscal Years(rate per $100 of 8sseSSed v8lue)
ExhibitJ·7
Fiscal Lower Townshll! School District Direct Rate Overlal!elng Rates TotalYear General Direct and
Ended Obligation Township of Regional Cape May OVerlapping TaxJune 30, Basic Rate Debt Service Total Direct Lower School Coun~ Rate
2003 $ 0.803 $ 0.051 s 0.854 $ 0.776 s 0.541 $ 0.439 $ 2.6102004 0.797 0.050 0.847 0.772 0.557 0.464 2.6402005 0.791 0.061 0.852 0.799 0.599 0.480 2.7302006 0.874 0.031 0.905 0.844 0.642 0.489 2.8802007 0.287 0.010 0.297 0.324 0.229 0.170 1.0202008 0.291 0.010 0.301 0.349 0.230 0.181 1.0612009 0.296 0.010 0.306 0.366 0.247 0.193 1.1122010 0.351 0.351 0.433 0.285 0.230 1.2992011 0.355 0.355 0.443 0.277 0.231 1.3062012 0.362 0.362 0.443 0.273 0.229 1.307
Source: Municipal Tax Collector
Note: NJSA 18A:7F·5d limits the amount that the district can submit for a general fund tax levy. The levy when added to othercomponents of the district's net budget may not exceed the prebudget year net budget by more than the spending growthlimitation calculated as follows: the prebudget year net budget increased by the cost of living or 2.5 percent, whichever isgreater, plus any spending growth adjustments.
a The district's basic tax rate is calculated from the A4F form which is submitted with the budget and theNet Valuation Taxable.
b Rates for debt service are based on each year's requirements.
92
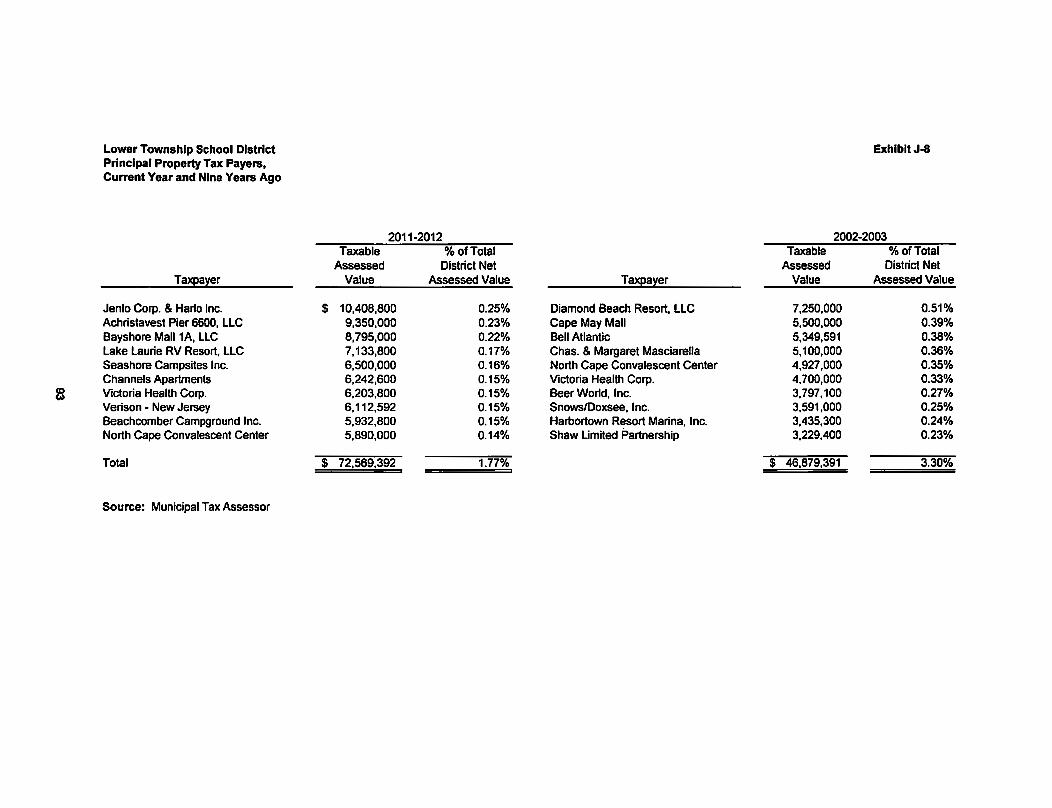
Lower Township School DistrictPrincipal Property Tax Payers,Current Year and Nine Years Ago
ExhlbltJ-8
2011·2012 2002·2003Taxable % ofTotal Taxable % ofTotal
Assessed District Net Assessed District NetT~a~er Value Assessed Value Taxpaler Value Assessed Value
Jenlo Corp. & Harlo Inc. $ 10,408,800 0.25% Diamond Beach Resort, LLC 7,250,000 0.51%Achristavest Pier 6600, LLC 9,350,000 0.23% Cape May Mall 5,500,000 0.39%Bayshore Mall 1A, LLC 8,795,000 0.22% Bell Atlantic 5,349,591 0.38%lake Laurie RV Resort, LlC 7,133,800 0.17% Chas. & Margaret Masciarella 5,100,000 0.36%Seashore Campsites Inc. 6,500,000 0.16% North Cape Convalescent Center 4,927,000 0.35%Channels Apartments 6,242,600 0.15% Victoria Health Corp. 4,700,000 0.33%
co Victoria Health Corp. 6,203,800 0.15% Beer World, Inc. 3,797,100 0.27%Co)
Verison • New Jersey 6,112,592 0.15% SnowslDoxsee, Inc. 3,591,000 0.25%Beachcomber Campground Inc. 5,932,800 0.15% Hamortown Resort Marina, Inc. 3,435,300 0.24%North Cape Convalescent Center 5,890,000 0.14% Shaw Limited Partnership 3,229,400 0.23%
Total $ 72,569,392 1.77% s 46,879,391 3.30%
Source: Municipal Tax Assessor

Lower Township School DistrictProperty Tax Levies and Collections,Last Ten Fiscal Years
Exhibit J-9
Collected within the Fiscal Year
Fiscal Year Taxes Levied for of the Le~· Collections inEnded June the Calendar Percentage Subsequent
30, Year Amount of Levy Years
2003 $ 10,396,347 $ 10,396,347 100.00%2004 11,532,166 11,532,166 100.00%2005 12,429,809 12,429,809 100.00%2006 12.429.809 12.429,809 100.00%2007 12.753.184 12.753.184 100.00%2008 13.739.789 13.739.789 100.00%2009 13.958.311 13.958.311 100.00%2010 14.104.390 14,104,390 100.00%2011 14.371.889 14,371,889 100.00%2012 14,659,327 14,659.327 100.00%
Source: District records Including the Certificate and Report of School Taxes (A4F form)
a School taxes are collected by the Municipal Tax Collector. Under New Jersey State Statute.a municipality is required to remit to the school district the entire property tax balance. in theamount voted upon or certified prior to the end of the school year.
94
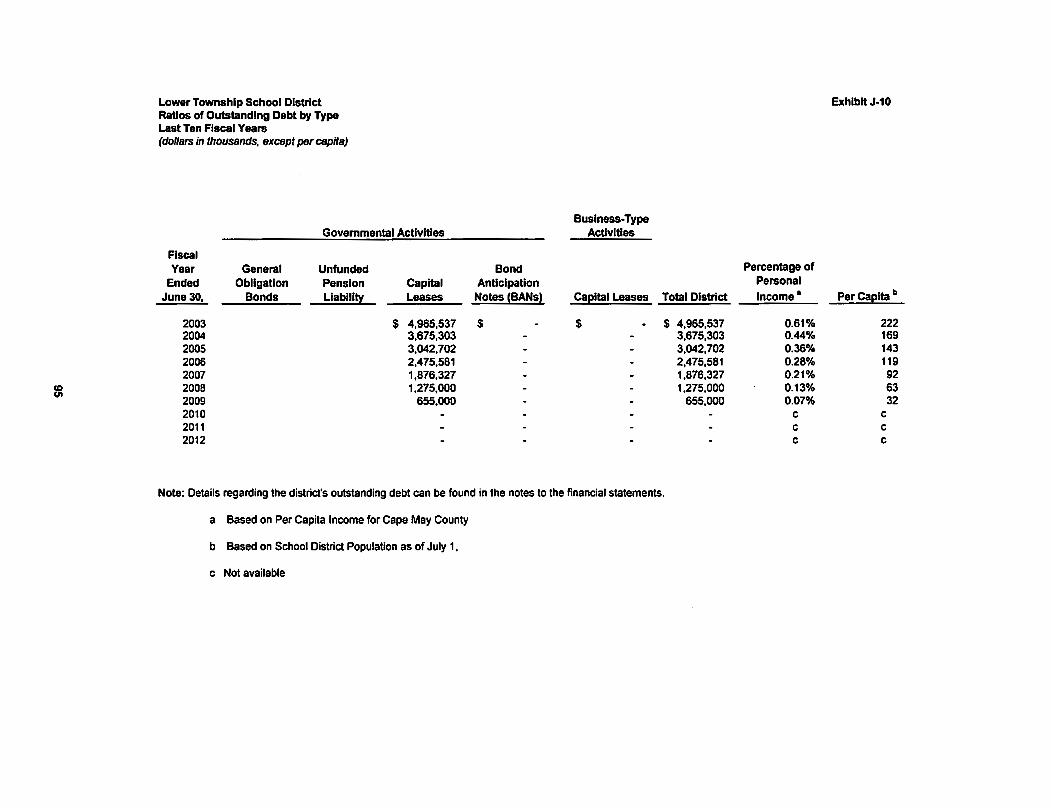
Lower Township School DistrictRatios of Outstanding Debt by TypeLast Ten Fiscal Years(dollars in thousands, except per capits)
exhibit J-10
Business-TypeGovernmental Activities Activities
FiscalYear General Unfunded Bond Percentage of
Ended Obligation Pension Capital Anticipation PersonalJune 30. Bonds Llablll!l Leases Notes {BANs~ Cal!ltal Leases Total District Income· Per Cal!lta b
2003 $ 4,965,537 $ $ $ 4,965,537 0.61% 2222004 3,675,303 3,675,303 0.44% 1692005 3,042,702 3,042,702 0.36% 1432006 2,475,581 2,475,581 0.28% 1192007 1,876,327 1,876,327 0.21% 92
CD 2008 1,275,000 1,275,000 0.13% 63<11
2009 655,000 655,000 0.07% 322010 c c2011 c c2012 c c
Note: Details regarding the district's outstanding debt can be found in the notes to the financial statements.
a Based on Per Capila Income for Cape May County
b Based on School District Population as of July 1,
c Not available

Lower Township School DistrictRatios of Net General Bonded Debt OutstandingLast Ten Fiscal Years(dollars in thousands, except per capita)
FiscalYear
EndedJune 30,
2003200420052006200720082009201020112012
General Bonded Debt Outstanding
GeneralObligation
Bonds Deductions
Net GeneralBonded DebtOutstanding
$
Percentage ofActual Taxable
Value' ofProperty
0.00%0.00%0.00%0.00%0.00%0.00%0.00%0.00%0.00%0.00%
Per Capita b
$
Note: Details regarding the district's outstanding debt can be found in the notes to the financial statements.a See Exhibit J-6 for property tax data.b Population data can be found in Exhibit J-14.
$ $
96
Exhibit J-11

Lower Township School DistrictRatios of Overlapping Governmental Activities DebtAs of December 31.2011
exhibit J-12
Governmental UnitDebt
Outstanding
EstimatedPercentageApplicable-
EstimatedShare of
OverlappingDebt
Debt repaid with property taxes:
Township of LowerCape May County General Obligation DebtLower Cape May Regional School District Debt
$ 17,590,494133,812,537
4,177,568,970
100.000%8.219%
55.718%
$ 17,590,49410,998,0524,616,206
Subtotal, overlapping debt 33,204,752
Lower Township SchoOl District Direct Debt
Total direct and overlapping debt $ 33,204,752
Sources: Assessed value data used to estimate applicable percentages provided by the Cape May County Board of Taxation.
Debt outstanding data provided by each governmental unit.Note: Overlapping governments are those that coincide, at least in part, with the geographic boundaries of the District.
This schedule estimates the portion of the outstanding debt of those overlapping governments that is borne by the residents andbusinesses of Lower TownShip. This process recognizes that, when considering the District's ability to issue and repay long-term debt, theentire debt burden borne by the residents and businesses should be taken into account. However this does not imply thatevery taxpayer is a resident, and therefore responsible for repaying the debt, of each overlapping payment.
a For debt repaid with property taxes, the percentage of overlapping debt applicable is estimated using taxable assessed property values.Applicable percentages were estimated by determining the portion of another governmental unit's taxable value that is within thedistrict's boundaries and dividing it by each unit's total taxable value.
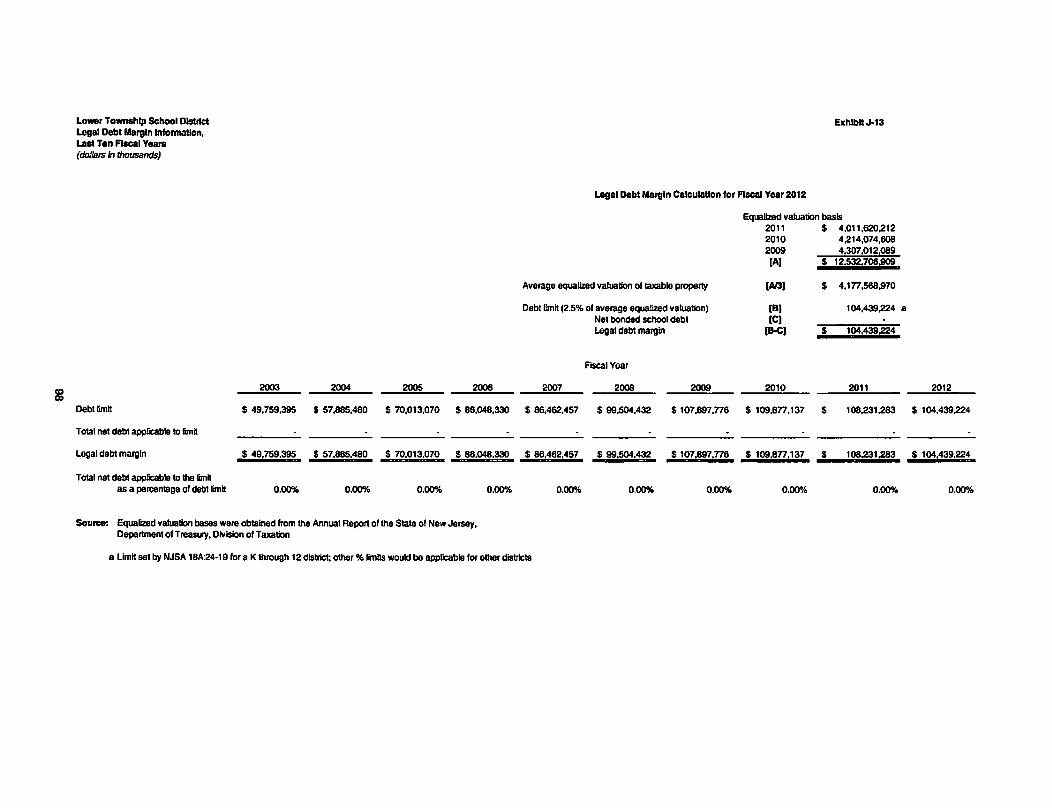
Lower Townahlp School DISIItctLegal Debt Margin Information,Last Ten Fiscal Years(dollars In thousands)
ExhlbftJ-13
Legal Debt Margin Calculation for Fiscal Year 2012
Equalized valuation basis2011 $ 4.011.620,2122010 4,214,074,6082009 4.307.012.089[A) $ 12,532,708.909
Average equalized valuation of taxable property
Debt limit (2.5% of avarage equalized valuation)Net bonded school deblLegal debt margin
[AI3)
[B)[C)
[B-C)
104,439,224 a
$ 4.1n.568.970
$ 104.439,224
FascalYear
2003 2004 2005 2006 2007 2008 2009 2010 2011 2012
Debllimlt $ 49,759.395 s 57,885,480 $ 70.013.070 $ 86,048,330 $ 86,462.457 $ 99.504.432 $ 107.897.n6 $ 109.8n.137 $ 108,231,283 $ 104.439,224
Tolal net debt applicable to limit
Legal dabt margin $ 49,759.395 $ 57.885,480 $ 70.013,070 $ 86.048.330 $ 86,462,457 $ 99.504,432 $ 107,897,n6 $ 109.8n,137 $ 108,231,283 $ 104,439,224
Tolal net debt applicable to the limitas a peroentage of debt limit 0.00% 0.00% 0.00% 0.00% 0.00% 0.00% 0.00% 0.00% 0.00% 0.00%
Source: Equalized valuation bases were obtained from the Annual Report of the State 01New Jersey,Department of Trea5UIY,Division of Taxation
a Limit set by NJSA 18A:24·19 for a K through 12 district; other % limits would be applicable for other districts

Lower Township School DistrictDemographic and Economic StatisticsLast Ten Fiscal Years
Exhibit J-14
Personal Income Per Capita(thousands of Personal Unemployment
Year Population 8 dollars) b lncome " Rated
2003 22,337 $ 811,838,265 $ 36,345 10.50%2004 21,777 838,632,270 38,510 7.20%2005 21,216 848,979,456 40,016 7.90%2006 20,731 869,209,368 41,928 8.40%2007 20,329 901,794,440 44,360 8.00%2008 20,369 952,189,643 46,747 9.90%2009 20,239 931,095,195 46,005 13.90%2010 22,862 1,085,899,276 47,498 14.50%2011 22,707 e e 15.20%2012 e e e e
Source:a Population information provided by the NJ Dept of Labor and Workforce Development.b Personal income for the Township of Lower.c Per Capita income for Cape May County.d Unemployment data provided by the NJ Dept of Labor and Workforce Development.e Not available.
99

Lower Township School District exhibit J-16Full-tlma Equlvalant DIstrict Employees by FunctlonIProgram,Last Ten Fiscal Years
2003 2004 2005 2006 2007 2008 2009 2010 2011 2012FunctlonIProgram
InstructionRegular 125 121 116 116 116 112 112 112 112 112Special education 26 26 26 26 26 30 30 30 29 29Other special educationVocationalOther instructionNonpubllc school programsAdull/continulng education programs
Support Services:Student & Instruction related services 37 37 37 37 37 38 38 38 38 38School administrative services 12 12 12 12 12 12 12 12 12 12General and business administrative services 3 3 3 3 7 2 2 2 2 2_..Plant operations and maintenance 20 20 20 20 16 26 26 25 22 228 Pupjltransportation 20 20 20 20 20 20 20 20 20 20Business and other support services 4 4 4 4 4 4 4 4 4 4
Special SchoolsFood Service 11 16 16 16 16 14 14 13 14 14Child Care 2 2 2 2 2 2 2 2 2 2
Total 261 262 257 257 257 260 260 258 255 255
Source: District Personnel Records

Lower Township School DlatrtctOperating Statistics,Last Ten Fiscal Y8a18
exhibit Jo17
PuplllTeacher Ratio
AverageDally Average Dally % Change In Student
Fiscal Operating Cost Per Percentage Teaching Enrollment Attendance Average Dally AttendanceYear Enrollment Expenditures • Pupil Change Staffb Bementary (ADEle (ADA)e Enrollment Percentage
2003 1,975 $ 21,553,074 $ 10,913 12.00% 151 1:13 1,9n 1,866 -3.94% 94.390/02004 1,940 22,679,837 11,691 7.13% 147 1:13 1,908 1,801 -3.49% 94.390/02005 1,882 23,455.418 12,463 6.60% 142 1:13 1,900 1,789 -0.42% 94.16%2006 1,934 25,090,509 12,973 4.09% 142 1:14 1,919 1,801 0.67% 93.85%2007 1,905 26,322,778 13,818 6.51% 142 1:14 1,892 1,n9 -1.40% 94.030/02008 1,837 26,983,253 14,689 6.30% 142 1:13 1,827 1,732 -3.430/0 94.80%
.... 2009 1,874 26,182,647 13,972 4.88% 142 1:13 1,857 1,763 1.64% 94.94%0 2010 1,897 27,684,821 14,594 4.88% 142 1:13 1,885 1,763 1.51% 93.53%....
2011 1.834 26,837,020 14,633 0.26% 141 1:13 1,848 1,731 -1.96% 93.67%2012 1,841 28,167,188 15,300 4.55% 141 1:13 1,828 1,720 -1.08% 94.090/0
Sources: District records
Note: Enrollment based on annual October district count.
a Operating expenditures equal total expenditures less debt service and capital outlay.b Teaching staff includes only full-time equivalents 01certificated staIf.c Average daily enrollment and average daily attendance are obtained from the School Register Summary (SRS).

Lower Township School District exhibit J·18School Building InformationLast Ten FIscal Years
2003 2004 2005 2006 2007 2008 2009 2010 2011 2012District BuildingElementaryChaJ1es W Sandman Consolidated (1929)
Square Feet 61,711 61,711 61,711 61,711 61,711 61,711 61,711 61,711 61,711 61,711Capacity (students) 581 581 581 581 581 581 581 581 581 581Enrollment 572 561 560 559 492 480 505 517 500 475
Maud Abrams (1966)Square Feet 58,639 58,639 58,639 58,639 58,639 58,639 58,639 58,639 58,639 58,639Capacity (students) 593 593 593 593 593 593 593 593 593 593Enrollment 538 503 470 479 486 488 477 467 485 476
David C Douglass Veterans Memorial (1979)Square Feet 39,303 39,303 39,303 39,303 39,303 39,303 39,303 39,303 39,303 39,303Capacity (students) 395 395 395 395 395 395 395 395 395 395Enrollment 392 404 382 392 421 425 417 442 427 426
_"Carl T Mitnick (1989)
0 Square Feet 67,481 67,481 67,481 67,481 67,481 67,481 67,481 67,481 67,481 67,481II.) Capacity (students) 527 527 527 527 527 527 527 527 527 527
Enrollment 473 472 470 504 489 444 458 459 436 451
~Central Administration (1938)
Square Feet 3,469 3,469 3,469 3,469 3,469 3,469 3,469 3,469 3,469 3,469Maintenance (1930)
Square Feet 3,848 3,848 3,848 3,848 3,848 3,848 3,848 3,848 3,848 3,848Transportation(1999)
Square Feet 2,880 2,880 2,880 2,880 2,880 2,880 2,880 2,880 2,880 2,880Curriculum Trailer (1995)
Square Feet 938 938 938 938 938 938 938Special Programs Trailer (1986)
Square Feet 684 684 684 684 684 684 684
Number of Schools at June 30, 2011Elementary = 4Middle School = 0Senior High School = 0Other = 3
Source: District Facilities OfficeNote: Year of original construction is shown in parentheses. Increases in square footage and capacity are the result of
additions. Enrollment is based on the annual October district count.
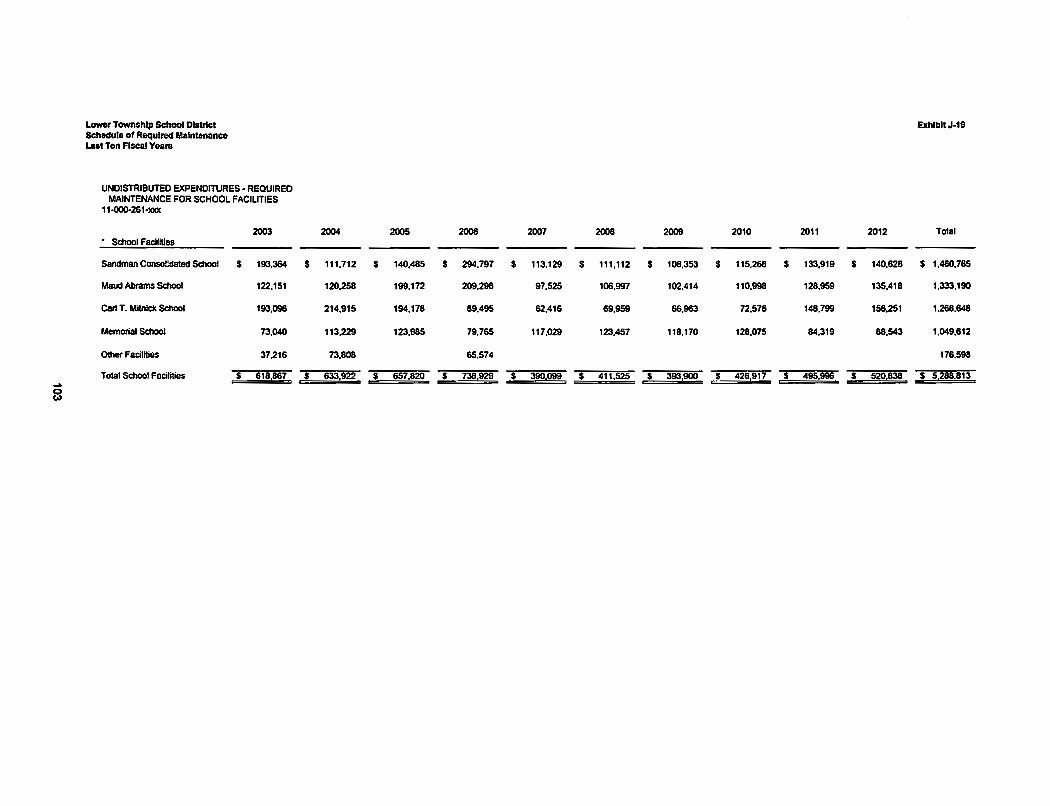
Lower Township SchOOl Dlstrfct Exhibit J-19Schedulo of Required MalntenonceLast Ton Fiscal Yoars
UNDISTRIBUTED EXPENDITURES· REQUIREDMAINTENANCE FOR SCHOOL FACILITIES
11-OOO-261-lOCX
2003 2004 2005 2006 2007 2008 2009 2010 2011 2012 Total• School Facilities
Sandman Consolidated School $ 193.364 $ 111.712 $ 140.485 $ 294.797 $ 113.129 $ 111.112 $ 106.353 $ 115.268 $ 133.919 $ 140.626 $ 1.460.765
Maud Abrams School 122.151 120.258 199.172 209.298 97.525 106.997 102.414 110.998 128.959 135.418 1.333.190
Cart T. Mitnick School 193.096 214.915 194.178 89.495 62.416 69.959 66.963 72.576 148.799 156.251 1.268.648
Memorial School 73.040 113.229 123.985 79.765 117.029 123.457 118.170 128.075 84.319 88.543 1.049.612
Other FaCilities 37.216 73.808 65.574 176.598
Total School Facilities $ 618,867 $ 633,922 $ 657.820 $ 738,929 $ 390.099 $ 411.525 $ 393,900 S 426,917 $ 495.996 S 520,838 S 5,288,813..<:)W

Lower Township School DistrictInsurance ScheduleJune 3D, 2012
Exhibit J-20
CoverageSelf-insured
Retention Deductible
School Package Policy (1)Building and Contents (All Locations)
Limits of liability per occurrenceBoiler and MachineryCrime coverageGeneral and automobile liabilityWorkers' compensationEducator's legal liabilityPublic Employee DishonestyPollution legal liabilityStudent Accident
Surety Bonds (2)TreasurerBoard Secretary
$ 150,000,000 $ 250,000 $125,000,000
500,000 200,00010,000,000 250,000
Statutory 250,00010,000,000 100,000
500,000 250,0003,000,0001,000,000
275,000100,000
5001,000
500
50025,000
(1) Atlantic & Cape May Counties Joint Insurance Fund(2) RLilnsurance Company
Source: District records
104

Single Audit Section

INVERSO & STEWART, LLC
Certified Public AccountantsRegistered Municipal Accountants
12000 Lincoln Drive West, Suite 402Marlton. New Jersey 08053(856) 983-2244Fax(8S6)9~74E-Mail: l~pll~liltQncentrh:.net
-Member of-Americ:an Institute ofCPAsNew Jersey Society ofCPAs
INDEPENDENT AUDITOR'S REPORT ON COMPLIANCE WITH REQUIREMENTSTHAT COULD HAVE A DIRECT AND MATERIAL EFFECT ON EACH MAJOR PROGRAM
AND ON INTERNAL CONTROL OVER COMPLIANCE IN ACCORDANCE WITHOMB CIRCULAR A-I33 AND NEW JERSEY OMB CIRCULAR 04-04
The Honorable President and Membersof the Board of Education
Township of Lower School DistrictCounty of Cape MayCape May, New Jersey
Compliance
We have audited Lower Township School District (School District), in the County of Cape May. State of New Jersey'scompliance with the types of compliance requirements described in the OMB Circular A-/JJ Compliance Supplement.and the New Jersey State Grant Compliance Supplement that could have a direct and material effect on each of the SchoolDistrict's major federal and state programs for the fiscal year ended June 30,2012. The School District's major federaland state programs are identified in the Summary of Auditor'S Results section of the accompanying Schedule of Findingsand Questioned Costs. Compliance with the requirements of laws, regulations, contracts and grants applicable to each ofits major federal and state programs is the responsibility of the School District's management. Our responsibility is toexpress an opinion on the School District's compliance based on our audit.
We conducted our audit of compliance in accordance with auditing standards generally accepted in the United States ofAmerica; the standards applicable to financial audits contained in Government Auditing Standards, issued by theComptroller General of the United States; OMB Circular A-133 Audits of State. Local Governments. and Non-ProfitOrganizations: audit requirements as prescribed by the Division of Finance, Department of Education, State of NewJersey; and State of New Jersey Circular 04-04-0MB, Single Audit Policy for Recipients of Federal Grants. State Grantsand State Aid. Those standards and OMB Circular A-133 and State of New Jersey Circular 04-04-0MB, require that weplan and perform the audit to obtain reasonable assurance about whether noncompliance with the types of compliancerequirements referred to above that could have a direct and material effect on a major federal or state program occurred.An audit includes examining, on a test basis, evidence about the School District's compliance with those requirements andperforming such other procedures as we considered necessary in the circumstances. We believe that our audit provides areasonable basis for our opinion. Our audit does not provide a legal determination on the School District's compliancewith those requirements.
In our opinion. the Lower Township School District, in the County of Cape May, State of New Jersey complied, in allmaterial respects, with the compliance requirements referred to above that could have a direct and material effect on eachof its major federal and state programs for the fiscal year ended June 30, 2012.
106

Internal Control Over Compliance
Management of the Lower Township School District is responsible for establishing and maintaining effective internalcontrol over compliance with requirements of laws, regulations, contracts and grants applicable to federal and stateprograms. In planning and performing our audit, we considered the School District's internal control over compliancewith the requirements that could have a direct and material effect on a major federal or state program to determine theauditing procedures for the purpose of expressing our opinion on compliance and to test and report on internal controlover compliance in accordance with OMB Circular A-l33 and State of New Jersey Circular 04-04-0MB, but not for thepurpose of expressing an opinion on the effectiveness of internal control over compliance. Accordingly, we do notexpress an opinion on the effectiveness of the School District's internal control over compliance.
A deficiency in internal control over compliance exists when the design or operation of a control over compliance doesnot allow management or employees, in the normal course of performing their assigned functions, to prevent, or detectand correct, noncompliance with a type of compliance requirement of a federal or state program on a timely basis. Amaterial weakness in internal control over compliance is a deficiency, or combination of deficiencies, in internal controlover compliance, such that there is a reasonable possibility that material noncompliance with a type of compliancerequirement of a federal or state program will not be prevented, or detected and corrected, on a timely basis.
Our consideration of internal control over compliance was for the limited purpose described in the first paragraph of thissection and was not designed to identify all deficiencies in internal control over compliance that might be deficiencies,significant deficiencies or material weaknesses. We did not identify any deficiencies in internal control over compliancethat we consider to be material weaknesses, as defined above.
This report is intended solely for the information and use of the management of the School District, the Division ofFinance, Department of Education, State of New Jersey, and federal and state awarding agencies and pass-through entitiesand is not intended to be and should not be used by anyone other than these specified parties.
Respectfully submitted,
INVERSO & STEWART, LLCCertified Public Accountants
Robert P. InversoPublic School Accountant
Marlton, New JerseyOctober 16, 2012
107

U.S.~oIE __ F_Educaton.lolls Fund~,...._ Pn>g1amU__ Pn>g1am
TOIAI Genend Fund
U.s. Doparlmcllt 01 educationSopcinI Rmmusz Fund'
No CI!iId le!I Be!!ndIN C L B.lTM2e •TdIG.TM2e II • P&1t ATdIGII· PIItIATM2e II· PIItIDTM2e IIITdlGlII
Indiy!dual. Will! Q!stlbiliIIM Ad Itp. E.A'>PIItIB·&.osic:PIItIB·&.oticPartB·Pre_
.... Part B • Prelehool
g TOIIII Special Rovenu. Fund
U.S. Dctpartmonl 01 AgricultureEntermiH Fund'
Food OIsblbu,"", ProgrDmNalional S<IlOOIluntll ProgramSdIooI Bre.~f.$1 ProgrDmAllor SdIooI _ Progrum
TOla! Enlorprise Fund
TOla! FederDI A_
ExhIbit K-3Behocl"IoA
LOWER TOWNSHIP SCHOOL DISTRICTBehoclulo of Eqlendlturos of _ Awards
'orllleFllCO'Year_ .......»'1012
F_ Pn>g1am Of June 30 2011 CarJyovor Rcp8jmOIIl Juno 30 2012CFDA GIanI or Slate A_ GIanI - Dofetred Cuero (W.-) Cosh QudooIary 01 Prior y...,.' - Dof_ Cuero
Numbet Pn!jec!- AmouIII - Rocelvable R_ GIanlorol ...l!!!!!!!!!!L Received Expen!fI!u!!! Qalaftcos R_ R_ Gtan!or 01
IIUIGA NlA $360.378 711111·8130112 $360.378 (S3&O.378)93.778 NlA 73.393 711111·lII30I12 &1.873 (73.394) (18.521)93.778 NlA 711._ 711110·8/30111 [188601 8860
[188601 ---- $434111 [S433.ml [18 52'1
&I.OlGA NCLQ.2840-12 379.922 911111·8131112 241.607 (378.922) (138.31~)&I.OIGA NCLQ.2&1O-11 330.805 811110·8131111 (166.911) '66.91'&I.387A NCLB-2840-'2 116,2'3 811111·8131112 116.2'3 (116,213)&I.387A NCLQ.2840-II 127,213 81'110·8131111 (63.607) 63.607&I.31ax NCLQ.2&1O-II 829 11111'0·8131111 (367) 367&I.36M NCLB-Z&lO-'2 12.624 9111'I ·8131112 12.624 (IZ.624)&I.36M NCLQ.Z&lO-II 11.803 9111'0·8131111 (11.603) 1'.803
&1.027 FT·2640-12 482.714 911111·8131112 482.714 (462.714)64.027 FT·2840-" 466.207 9W'0·813111' (194.463) '94.463&1.173 P5-2640-12 26.722 111111' ·8131112 20.722 (26.722)64,'73 P5-2640-" 26,925 11111'0·81311" 1107691 '0769
1447.9401 ---- ',327,820 11.018,1951 [138,315)
10.550 NlA &I,~7 911111·8130112 &1.547 (&I.~7)10.555 NlA 4~,061 911111• 8130112 384.663 (4~.061) (20,398)10.553 NlA 2&1,392 911111·6/30112 250.955 (284.392) (13.437)10.5~ NlA 3,322 911111·81301'2 3~3 133221 [591
---- 70U28 1!373221 1338941(S04~,8001 52,465,359 ($2.189.289) 11160,730)
TIle ucompanrlnll NOIe.10_"lea of Eopondllu .... of Awards .nd financial _nco ... In Intog ..... part oIlh1s sc:hocIlilo.
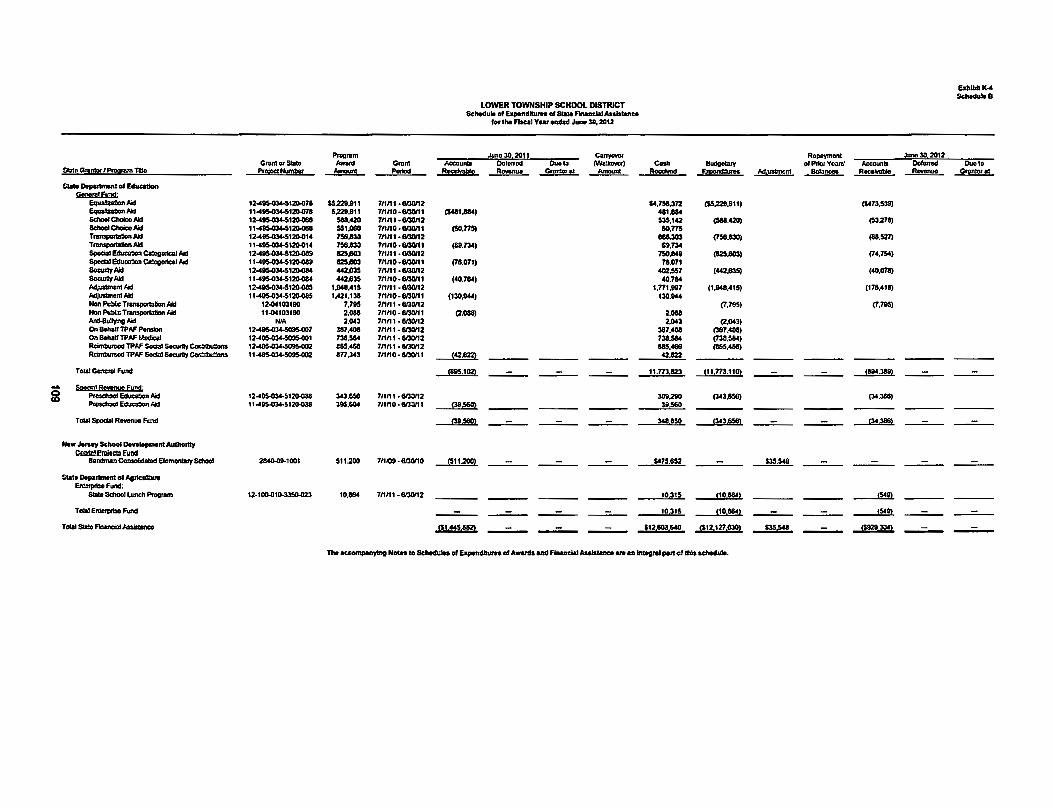
EaIlIbII K~_loB
LOWER TOWNSHIP SCHOOL DISTRICT6c_1o 01Eapoftd_ oI_flry~IolAs_
'0 ..... Flaal V.., o.dod Juno :Ill, lOU
P"'ll11lm Juno:lll,i1!!11 ~ Ro_1II J.... :IlI2012Gront .. _ Award 0.l1l1I '"-unll Ocl.nod 0.0. to twa_, Cooh ~ 01 Pl10r y• .,.' - DcIonod 0.0010_ Oro_'l'!ogr!!m l1lo ProjOdN_ ~ Period R_. RO\Ienuo ~ ~ R_ ~ ~ ~ - - ~_Oo~oIEd_
Sismem'fund'~AiI! 12~1ISo03'-512Go07I $5.229,811 711II I • 613U112 $4,758.372 ($5.229,911) (1473.5311Equa!za:Ion Ail! 11~1ISo03'-512Go071 5.229.911 7nIlO ·6I3UII1 ($441,084) "',No!_CIIOicoAil! 12~1_ 5e8,QO 711111·6I3UII2 53$,IQ (581,420) (53211)_CIIOicoNd 11-411So03'-51_ 55I.oeo 711110·1lI30II1 (SO,n$) 5O,nST'__Nd 12-411So03'-512Q.Q14 7$6~ 711111·flI»'12 eeU03 (7$6.alO) (88,5Z1)T~oIIId 1I~12GoO'4 7$6~ 711nO ·1lI30II1 (88,734) U,734SjIodal EduaI:Ion CologOl1c8l Ail! 12~12Q.48!j 125.803 7nnl·1II3OII2 750,84, (125.603) (74,754)SjIodal Educ:a:lon ~ Ail! 11-411So03'-512Q.Q1e 125.803 7nnO·1II3OII1 (71,071) 71,071Socurttrollld 12~1ISo03'-51_ 442.835 7n1l1·1II3OII2 402.557 (442.835) (40,078)Socurttrollld 11~1ISo03'-51_ 442.6)5 7n1lO·flI»'11 (40,714) 40,714Mi_AiI! 12-4as.o36-Sl2Q.Q15 l,aq,4IS 7nnl·flI»'12 l,n1,887 (1.941,415) (176,411)MjonImel1l Aid l1-4as.o36-S12Q.Q15 1.421.131 711110·1lI30II1 (130,944) 130,844Non PIl* TransportDllonoIIId 12004103190 7.785 7nlll·1II3OII2 (7.785) (7,785)NonPllbllcT~oIIId 11004103190 2,088 711110·1lI30II1 (2,018) 2,088AnII-8uJ¥ng Ail! NlA 2.043 7n1l1·1II3OII2 2,043 (2.043)en_TPAF_ 12-4~7 367.401 711111·1lI30II2 367,408 (367.401)en_TPAF_ 12~_5OfI5.OO1 731,514 7n1l1·1II3OII2 731,514 (731.514)_TPAF_s-tly~ 12-4_ 1185,466 7n1l1·1II3OII2 665,469 (MS.486)_TPAF_s-tly~ 11-4_ In,343 711110·1lI30II1 IQ,~ Q.822
TOlaI_F ..... ~,I~ lI.n3.123 !1I,m.l1~ !eIM.~.... $ptcirn Rmmye Fund'2
__ Aid12-4_34-51_ 343._ 711111·1lI30II2 3UIl.290 (343.8561 (34.3IiII)__ Nd11-4_34-51_ 38$,&04 711110·1lI30II1 @!~ 1lI.5IO ----
ToIol_ R_ Fund (38SJ9l ---- ---- 341150 (343658) ---- ~ ----Now.lotHy _ DonlopmolllAulhorll)r
CuDJ,e1l)jtQs ElIlICISo_~otodElmlOlllO,,_ 2141).$. lGOI 511.2GO 71110lHI131l110 !51t.200! $47S,852 ~
S_ Ooparlmolll01Agricu_Entcrprbe F..... :__ 1.undI Progrnm
12·11)O.011).3350.Q23 10,184 711111·flI»'12 1031S 1'01841 I~TOIOIEntcrprbe F..... ---- ---- 10315 1101841 ---- ~!1 ---- ----TotaI ___
(!1+4!!82) - - 112_140 G'21271!3OJ $35,541 - P!2!3GoI)
Tho.~N_'. __ oI~oIA_I_F __ .... ."lMogrolporlollbla'-".

Lower Township School DistrictNotes to the Schedules of Expenditures
of Federal Awards and State Financial AssistanceFor the Fiscal Year Ended June 30,2012
I. GENERAL
The accompanying schedules of expenditures of federal awards and state financial assistance present the activity of allfederal awards and state financial assistance programs of the Board of Education, Township of Lower School District. TheBoard of Education is defined in Note I to the School Districts basic financial statements. All federal awards and statefinancial assistance received directly from federal and state agencies, as well as federal awards and state financialassistance passed through other government agencies, are included on the schedules of expenditures of federal awards andstate financial assistance.
2. BASIS OF ACCOUNTING
The accompanying schedules of expenditures of federal awards and state financial assistance are presented using thebudgetary basis of accounting with the exception of programs recorded in the food service fund, which are presented usingthe accrual basis of accounting. These bases of accounting are described in Note I to the School District's basic financialstatements. The information in this schedule is presented in accordance with the requirements of OMB Circular A- I33,Audits of State. Local Governments. and Non-Profit Organizations; therefore, some amounts presented in this schedulemay differ from amounts presented in, or used in the preparation of, the basic financial statements.
3. RELATIONSHIP TO BASIC FINANCIAL STATEMENTS
The basic financial statements present the general fund and special revenue fund on a GAAP basis. Budgetary comparisonstatements or schedules (RSI) are presented for the general fund and special revenue fund to demonstrate finance-relatedlegal compliance in which certain revenue is permitted by law or grant agreement to be recognized in the audit year,whereas for GAAP reporting, revenue is not recognized until the subsequent year or when the expenditures have beenmade.
The general fund is presented in the accompanying schedules on the modified accrual basis with the exception of therevenue recognition of the one or more deferred June state aid payments in the current budget year, which is mandatedpursuant to N.J.S.A. 18A:22-44.2. For GAAP purposes, payments are not recognized until the subsequent budget year dueto the state deferral and recording of the one or more of the June state aid payments in the subsequent year. The specialrevenue fund is presented in the accompanying schedules on the grant accounting budgetary basis which recognizesencumbrances as expenditures and also recognizes the related revenues, whereas the GAAP basis does not. The specialrevenue fund also recognizes the one or two June state aid payments in the current budget year, consistent with N.J.S.A.I 8A:22-44. 2.
The net adjustment to reconcile expenditures from the budgetary basis to the GAAP basis is ($36,40 I) for the general fundand $5,194 for the special revenue fund. See Exhibit C-3, Notes to Required Supplementary Information for areconciliation of the budgetary basis to the modified accrual basis of accounting for the general and special revenue funds.Awards and financial assistance expenditures are reported in the School District's basic financial statements on a GAAPbasis as presented as follows:
Federal State Total
General Fund $433,772 $11,736,709 $12,170,481Special Revenue Fund 1,018,195 348,850 1,367,045Food Service Fund 737,322 10,864 748,286
Total Awards & Financial Assistance $2,189,289 $12,096,423 $14,285,712
110

Lower Township School DistrictNotes to the Schedules of Expenditures
of Federal Awards and State Financial AssistanceFor the Fiscal Year Ended June 30, 2012
(Continued)
4. RELATIONSHIP TO FEDERAL AND STATE FINANCIAL REPORTS
Amounts reported in the accompanying schedules agree with the amounts reported in the related federal and state financialreports.
5. OTHER
Revenues and expenditures reported under the Food Distribution Program represent current year value received and currentyear distributions respectively. The amount reported as TPAF Pension Contributions represents the amount paid by thestate on behalf of the School District for the year ended June 30, 2012. TPAF Social Security Contributions represents theamount reimbursed by the State for the School District's share of social security contributions for TPAF members for theyear ended June 30, 2012.
6. MAJOR PROGRAMS
Major programs are identified in the Summary of Auditor's Results section of the Schedule of Findings and QuestionedCosts.
111

LOWER TOWNSHIP SCHOOL DISTRICTSCHEDULE OF FINDINGS AND QUESTIONED COSTS
FOR THE FISCAL YEAR ENDED JUNE 30, 2012
Section I -Summary of Auditor's Results
Financial Statements
Type of auditor's report issued: UNQUALIFIED
Internal control over financial reporting:
1) Material weaknesses identified? yes x no
2) Significant deficiencies identified that arenot considered to be a material weakness? yes __ .;...X,--_ none reported
Noncompliance material to basic financialstatements noted? yes x no
Federal Awards
Internal Control over major programs:
1) Material weakness(es) identified? yes x no
2) Significant deficiencies identified that arenot considered to be a material weakness? yes __ .;...X,--_ none reported
Type of auditor's report on compliance for major programs: UNQUALIFIED
Any audit findings disclosed that are required to be reportedin accordance with section 510(a) of OMS Circular A-133 ? yes x no
Identification of major programs:
CFDA Number(s) Name of Federal Program or Cluster
64.410A Education Jobs Fund
10.555 National School Lunch Program
Dollar threshold used to distinguish betwwen type A and type S programs: $300.000
Auditee qualified as low-risk auditee? x yes no
112

LOWER TOWNSHIP SCHOOL DISTRICTSCHEDULE OF FINDINGS AND QUESTIONED COSTS (CONT'D)
FOR THE FISCAL YEAR ENDED JUNE 30, 2012
Section 1 - Summary of Auditor's Results (Cont'd)
State Awards Section
Dollar threshold used to distinguish between type A and type B programs: $363.829
Auditee qualified as low-risk auditee? x yes no
Internal Control over major programs:
1) Material weakness(es) identified? yes x no
2) Significant deficiencies identified that arenot considered to be material weakness? yes _ ___;X..:.,__ none reported
Type of auditor's report on compliance for major programs: UNQUALIFIED
Any audit findings disclosed that are required to be reportedin accordance with N.J. OMS Circular 04-04? yes x no
Identification of major programs:
GMIS Number(s) Name of State Program
12-495-034-5120-078 Equalization Aid
12-495-034-5120-068 School Choice Aid
12-495-034-5120-089 Special Education Categorical Aid
12-495-034-5120-014 Transportation Aid
12-495-034-5120-084 Security Aid
12-495-034-5120-085 Adjustment Aid
12-495-034-5095-002 Reimbursed TPAF Social Security Contributions
12-495-034-5120-086 Preschool Education Aid
12-100-010-3350-023 School Lunch Program
113

LOWER TOWNSHIP SCHOOL DISTRICTSCHEDULE OF FINDINGS AND QUESTIONED COSTS
FOR THE FISCAL YEAR ENDED JUNE 30,1012
Section 1- Schedule of Financial Statement Findings
This section identifies the significant deficiencies. material weaknesses. and instances of noncompliance related tothe financial statements that are required to be reported in accordance with Government Auditing Standards and withaudit requirements as prescribed by the Division of Finance. Department of Education. State of New Jersey.
No findings identified.
114

LOWER TOWNSHIP SCHOOL DISTRICTSCHEDULE OF FINDINGS AND QUESTIONED COSTS
FOR THE FISCAL YEAR ENDED JUNE 30, 2012
Section 3 - Schedule of Federal Awards and State Financial AssistanceFindings and Questioned Costs
This section identifies the significant deficiencies, material weaknesses, and instances of noncompliance, includingquestioned costs, related to the audit of major Federal and State programs, as required by OMB Circular A-133 andNew Jersey Circular Letter 04-04.
FEDERAL AWARDS:
No findings and/or questioned costs identified.
STATE AWARDS:
No findings and/or questioned costs identified.
115
LOWER TOWNSHIP SCHOOL DISTRICTSUMMARY SCHEDULE OF PRIOR-YEAR AUDIT FINDINGS
AND QUESTIONED COSTS AS PREPARED BY MANAGEMENTFOR THE FISCAL YEAR ENDED JUNE 30, 2012
This section identifies the status of prior year findings related to the basic financial statements and federal and stateawards that are required to be reported in accordance with Chapter 6.12 of Government Auditing Standards, OMSCircular A-I33 and State of New Jersey OMS's Circular 04·04.
FINANCIAL STATEMENT FINDINGS
There were no prior year audit findings
FEDERAL AWARDS
There were no prior year audit findings.
STATE AWARDS
There were no prior year audit findings.
116