scholarships programs in indonesia - documents & … · scholarships programs in indonesia...
TRANSCRIPT

1
Scholarships Programs in Indonesia:
Past, Present and Future
Cut Dian Agustina
Dandan Chen
Andrew Ragatz
Imam Setiawan
The World Bank East Asia and Pacific Region Human Development Sector Unit October 2009
Pub
lic D
iscl
osur
e A
utho
rized
Pub
lic D
iscl
osur
e A
utho
rized
Pub
lic D
iscl
osur
e A
utho
rized
Pub
lic D
iscl
osur
e A
utho
rized
Pub
lic D
iscl
osur
e A
utho
rized
Pub
lic D
iscl
osur
e A
utho
rized
Pub
lic D
iscl
osur
e A
utho
rized
Pub
lic D
iscl
osur
e A
utho
rized

2
Abstract
This paper examines Indonesia’s experience in implementing scholarships programs
as a demand-side intervention to stimulate primary and secondary school enrollment,
continuation, and completion. It compares the key features and effects of several
scholarships programs in Indonesia starting from the School Grant Program (SGP) during
the Asian Financial Crisis in the late 90s. It provides an early assessment of the effects of
most recent ―scholarships for the poor‖ program started in 2008, including program
implementation arrangements such as selection and targeting beneficiaries, flow of funds, as
well as monitoring arrangements. The findings of this paper indicate that, compared with
Indonesia’s large scale scholarship programs under the SGP, the current targeting is less
effective and the average amount received by beneficiary students is less than half of what
was intended. To improve program effectiveness, this paper recommends: (1) focusing on
the transition from primary to secondary education by significantly increasing resources and
support to Grade 6 students; (2) starting to allocate more resources to primary school
scholarships, but gradually increasing the share for junior secondary scholarships; (3) using
complementary household-based intervention such as Conditional Cash Transfer (CCT) to
target out-of-school children; and (4) integrating programs at district level, and re-adopting
independent monitoring arrangement for better efficiency and transparency.

3
Introduction
Increasing school attainment is a challenge in much of the developing world. To
reach a higher level achievement will require targeting those below average, in terms of both
education participation and quality. In Indonesia, both the Ministry of National Education
(MoNE) and the Ministry of Religious Affairs (MoRA) have long history of managing
targeted scholarships programs. The scholarships program under MoNE covers students in
the regular schools at the primary, junior secondary, and senior secondary level; whereas the
scholarships program managed by MoRA supports targeted religious school students in
madrasah and pondok pesantren (boarding school) at the primary and junior secondary level.
The mandate of the Government of Indonesia in providing scholarships is explicitly
specified in the education Law 20/2003, in the context of providing equal education
opportunities to all Indonesian children and implementing nine-year compulsory basic
education. Article 12:1c and 12:1d of the Law state that every student in every school has the
right to receive financing support including scholarships for those that are performing well
academically and from poor family background, and whose parents cannot afford the cost of
schooling.
There is strong justification for public investment in compensatory programs such as
scholarships targeting the poor and the disadvantaged. These programs address both the
equity and efficiency concerns in education. Although education constitutes an attractive
option for households to invest in, the inability of a large number of households to meet the
present costs of a complete basic education despite the existence of significant future returns
provides a strong rationale for a public subsidy. For the poor, the cost of education is a

4
barrier to continuing education that for many becomes insurmountable, particularly beyond
primary school. Demand-side interventions such as scholarships programs can be effective
tools to assist families in covering the costs of education in order to make education more
affordable.
Scholarships are often targeted to encourage schooling for particular groups. The
most common target is poor students who face a particularly hard time continuing schooling
due to the monetary or opportunity cost of staying in school. But scholarships may also be
used to target girls, ethnic minorities or other groups that are the most vulnerable when
household financial resources are limited.
This paper will examine Indonesia’s recent history with scholarships programs,
particularly since its major effort of using scholarships to keep children in school during the
1998-2000 Asian financial crises. Indonesia has also a history of using scholarships to
encourage better academic performance (―performance scholarships‖). This particular
program will not be the principal focus of this paper. Instead, this paper will focus on the
programs of ―scholarships for the poor‖, as our main interest is in scholarship programs as a
demand-side intervention in Indonesia to simulate school enrollment, continuation, and
completion. This program also has much larger coverage, together with more significant
public budget allocation.
The paper is organized as the following. After an overview of Indonesia’s
experience in scholarships programs, it will put much focus on the on-going programs. It
will describe the key features of the current program design, including program
implementation arrangements such as selection and targeting beneficiaries, flow of funds, as
well as monitoring arrangements. These will be followed by an assessment of the early

5
impact of the programs. Finally, we will conclude with recommendations for improvement
of the current program.
Data source
We review a number of publications on Indonesia scholarship programs as well as
administrative documents by MoNE and MoRA, including guidelines, implementation
manuals, and monitoring and evaluation guidebooks. These administrative documents,
together with the administrative data obtained from MoNE and MoRA’s respective
management directorates’ planning unit, constitute the basis for elaborating the programs’
original objectives, planned scope, as well as budget allocation.
Our key data for the assessment of the effectiveness of the program are largely
various household survey data sources. These include: the National Indonesian Household
Survey, SUSENAS, produced by the Central Bureau of Statistics (BPS), and the Indonesian
Family Life Survey (IFLS), carried out by RAND Corporation. For the sector-wide
enrollment trend, we also rely on MoNE-published annual statistics for corroboration.
History of scholarship programs in Indonesia
Over the past decade, scholarships programs targeting the poor have played an
important role in Indonesia education, particularly during the financial crisis of 1997. Since
then, the evolution of the scholarship programs in Indonesia can be grouped into four eras.
(1) 1998 – 2003 School Grants Program; (2) 2001 – 2005 Oil Subsidy Savings Scholarships;
(3) 2005 – 2007 post-BOS (Bantuan Operasional Sekolah, School Operations Assistance

6
Grant) minimalist scholarships; and (4) 2008 – present re-expansion of scholarship
programs.
1998 – 2003: School Grants Program (SGP)
School Grants Program (SGP) was introduced in 1998 in the midst of a severe
economic crisis in East Asia. The program aimed at delivering resources quickly to a large
number of schools and students to protect education outcomes, particularly given the state
of social turmoil, and thus the need to generate broad political support. SGP included a
large scale scholarships component (demand protection), on top of the grants directly to
schools (supply support).
The scholarships were intended to reach 6 percent of primary students, 17 percent of
junior secondary students, and 10 percent of senior secondary students. Scholarships
amounted to Rp. 10,000, Rp. 20,000 and Rp. 25,000 a month per student at the primary,
junior secondary and senior secondary school level respectively, regardless of whether a
student was enrolled in a public or private school. At the primary school level only students
enrolled in grades 4, 5 and 6 were eligible. Apart from enrolled students, latest dropouts
were also eligible. The recipients could continue receiving assistance in subsequent years
provided that they were promoted to the next school grade, and continued to meet the
eligibility criteria of the scholarships program. The implementation arrangement of the
scholarships program under SGP has laid important foundation for the subsequent
scholarships programs. In addition, its impact has also been the interest of many policy
studies ever since. The following sub-sections provide a brief summary of the findings on
these aspects of the program.

7
Lessons from the implementation of SGP scholarships
The SGP scholarship program’s general planning, implementation, and fund flow
mechanism are illustrated in Error! Reference source not found. below. The planning
starts at the central level where a budget allocation is given based on total coverage target at
each education level and the unit amount per recipient of the scholarship. A quota is then
given to each province based on a range of macro and demographic indicators. The poorer
and more populated provinces got larger quota in general. The similar allocating process
was replicated at district and school levels.
Figure 1: Implementation arrangement of SGP scholarships
Source: Illustration based on description from interview with MONE.
The selection of the recipients took place at school level. Upon receiving quota, the
head teacher, or school principal, together with school committee, determines the list of
Central allocates
scholarship quota to
provinces
Province allocates
quota to districts
District selects
schools & number of
scholarships for each
school
Head teacher
identifies poor
students to receive
scholarship
List of students
given to district
Funding given to
provinces through
dekon
Funding sent to
student bank
account
Funding sent to
nearest post office
and collected by
head teacher
List of students
given to province
bank
account?
Yes No

8
recipients. The list was then submitted to districts and further to provinces for fund release.
The fund was disbursed directly to recipient’s bank account or through post office.
The recipient selection and targeting method shows both strengths and weaknesses.
A SMERU study (SMERU, 2003) of the SGP program found that school committees
encountered problems deciding on the most eligible recipients because the number of
potential beneficiaries was far greater than the total number of allocated scholarships. In
very few cases, part of the allocation for school grant component had been used to provide
scholarships to poor students who were not getting them through the scholarships
component. In other cases, and contrary to the rules, scholarships were split among more
students to ensure equal opportunity among those in need of assistance. Furthermore, the
required BKKBN (Badan Kordinasi Keluarga Berencana Nasional, National Family Welfare
Planning Agency) criteria were not applicable in all cases because BKKBN data were not
always available for all households. Finally, in some cases the targeting criteria were modified
at the local level based on other school or community factors. Based on a qualitative study
in eight sub-districts, Jones et al. (1999) also noted that school committees had problems
with identifying those individuals most affected by the crisis (the original targeting objective
as a crisis-response program) because the selection criteria were focused on general living
conditions and not on changes in those. They also noted that the selection process was
sometimes changed by school committees (for example, new criteria were added such as the
information on a household poverty status from the head of the village, and the nature of
employment of parents).
Although the SUSENAS does not record the household’s official BKKBN
classification, it does collect information on the criteria that determine the classification. A
9
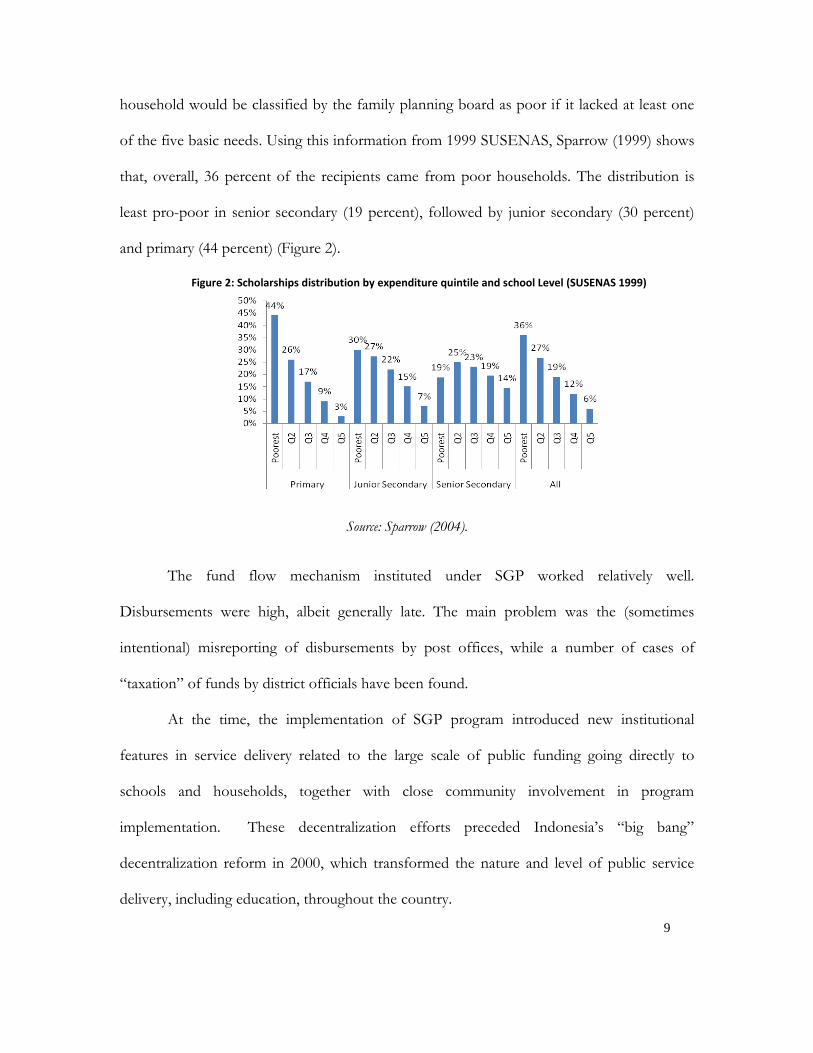
household would be classified by the family planning board as poor if it lacked at least one
of the five basic needs. Using this information from 1999 SUSENAS, Sparrow (1999) shows
that, overall, 36 percent of the recipients came from poor households. The distribution is
least pro-poor in senior secondary (19 percent), followed by junior secondary (30 percent)
and primary (44 percent) (Figure 2).
Figure 2: Scholarships distribution by expenditure quintile and school Level (SUSENAS 1999)
Source: Sparrow (2004).
The fund flow mechanism instituted under SGP worked relatively well.
Disbursements were high, albeit generally late. The main problem was the (sometimes
intentional) misreporting of disbursements by post offices, while a number of cases of
―taxation‖ of funds by district officials have been found.
At the time, the implementation of SGP program introduced new institutional
features in service delivery related to the large scale of public funding going directly to
schools and households, together with close community involvement in program
implementation. These decentralization efforts preceded Indonesia’s ―big bang‖
decentralization reform in 2000, which transformed the nature and level of public service
delivery, including education, throughout the country.

10
Other key implementation features that have been replicated widely since (i.e. for the
nationwide school grant scheme started in 2005) is the program’s safeguarding arrangement
particularly including independent monitoring and complaint handling arrangement.
Impact of SGP scholarships
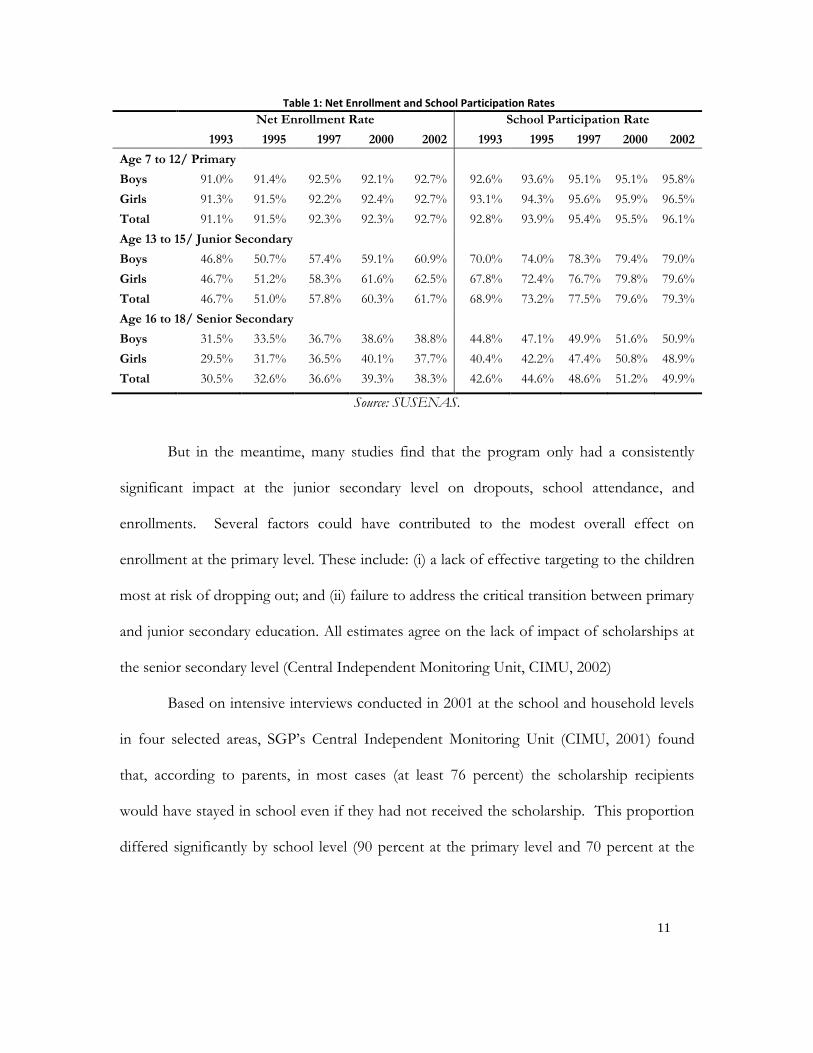
The SGP was successful in the sense that it appeared to have protected school
enrollments, which did not change very much during the crisis. Table 1 shows that during
the economic crisis in the late 90s, with the severity of the economic crisis, enrolment rates
did not change very much during the crisis. This is in sharp contrast to the recession in the
1980s which saw enrolment rates decline substantially. Nevertheless, the upward trend in
enrollments to 1997 came to an abrupt halt in the crisis year. By 1999, after the SGP had
already been initiated, enrollment picked up again, exceeding pre-crisis levels, and it
continued increasing in subsequent years. The key transition between primary and junior
secondary school was also negatively affected by the crisis, although it had been decreasing
prior to the crisis. In particular, the percentage of children entering secondary school right
after graduating from primary school reached a peak in 1997, fell sharply in 1998, and only
recovered slightly in subsequent years.
11
Table 1: Net Enrollment and School Participation Rates
Net Enrollment Rate School Participation Rate
1993 1995 1997 2000 2002 1993 1995 1997 2000 2002
Age 7 to 12/ Primary
Boys 91.0% 91.4% 92.5% 92.1% 92.7% 92.6% 93.6% 95.1% 95.1% 95.8%
Girls 91.3% 91.5% 92.2% 92.4% 92.7% 93.1% 94.3% 95.6% 95.9% 96.5%
Total 91.1% 91.5% 92.3% 92.3% 92.7% 92.8% 93.9% 95.4% 95.5% 96.1%
Age 13 to 15/ Junior Secondary
Boys 46.8% 50.7% 57.4% 59.1% 60.9% 70.0% 74.0% 78.3% 79.4% 79.0%
Girls 46.7% 51.2% 58.3% 61.6% 62.5% 67.8% 72.4% 76.7% 79.8% 79.6%
Total 46.7% 51.0% 57.8% 60.3% 61.7% 68.9% 73.2% 77.5% 79.6% 79.3%
Age 16 to 18/ Senior Secondary
Boys 31.5% 33.5% 36.7% 38.6% 38.8% 44.8% 47.1% 49.9% 51.6% 50.9%
Girls 29.5% 31.7% 36.5% 40.1% 37.7% 40.4% 42.2% 47.4% 50.8% 48.9%
Total 30.5% 32.6% 36.6% 39.3% 38.3% 42.6% 44.6% 48.6% 51.2% 49.9%
Source: SUSENAS.
But in the meantime, many studies find that the program only had a consistently
significant impact at the junior secondary level on dropouts, school attendance, and
enrollments. Several factors could have contributed to the modest overall effect on
enrollment at the primary level. These include: (i) a lack of effective targeting to the children
most at risk of dropping out; and (ii) failure to address the critical transition between primary
and junior secondary education. All estimates agree on the lack of impact of scholarships at
the senior secondary level (Central Independent Monitoring Unit, CIMU, 2002)
Based on intensive interviews conducted in 2001 at the school and household levels
in four selected areas, SGP’s Central Independent Monitoring Unit (CIMU, 2001) found
that, according to parents, in most cases (at least 76 percent) the scholarship recipients
would have stayed in school even if they had not received the scholarship. This proportion
differed significantly by school level (90 percent at the primary level and 70 percent at the

12
junior secondary level) and by school type (81 percent in government schools and 65 percent
in private schools).
However, there is evidence that one significant impact of SGP during the previous
financial crisis is in mitigating the effect of household income reduction on education
expenditure. The size of the SGP scholarships covered a large share of household
expenditure on education. Overall, the contribution of scholarships to educational
expenditures was substantial. Data from 2000 SUSENAS show that at the primary level the
scholarship covered a big share of monthly direct costs of schooling (68 percent) during
July-December 1999 at the primary level (Table 2). At the junior and senior secondary levels
this covered about 56 percent and 37 percent of direct expenditures respectively (Filmer,
2001). Among scholarship recipients, the scholarship represented 62 percent of educational
expenditures on average, and 77 percent among the poorest three expenditure quintiles.
Table 2: Monthly expenditures on education (July-December 1999, Rp. 000)
Primary Junior Secondary
Senior Secondary
Fees 3.9 13.1 27.2
Materials 6.8 11.9 16.5
Transport 1.3 6.8 15.3
other 2.8 5 8.3
Total 14.6 36.7 67.2
Source: Analysis of SUSENAS 2000 from Filmer (2001).

13
2001 – 2005: Oil Subsidy Scholarships
During the crisis, the world oil prices dropped sharply, and thus the Government
had savings from decreased fuel subsidies1. During 2001, the economic and political
situation had stabilized in the country, and SGP gradually phased out. In the meantime, the
Government decided to divert part of the fuel subsidy savings to help school children from
less fortunate families through scholarships (Bantuan Khusus Murid, BKM) funded by the
Compensation for Fuel Subsidy Decreased Program.
Using 2003 SUSENAS data, we estimated the coverage of the scholarships during
this period. Table 3 shows the results. The targeting is generally pro-poor. One significant
change appears to be the shift towards giving junior secondary education much more
coverage overall. In addition, the unit cost has also significantly increased, nearly tripling the
nominal amounts of those during the SGP, which had only started phasing out two years
before.
Table 3: BKM (Bantuan Khusus Murid) coverage and amount, 2003
School Per capita expenditure quintile Total
poorest 2 3 4 richest
Primary % receiving scholarship 10.9% 7.1% 4.9% 3.9% 3.3% 6.9%
Amount per yr (Rp.) 271,446 315,116 310,634 264,080 437,407 295,337
Junior secondary % receiving scholarship 16.6% 12.2% 9.4% 6.3% 4.5% 10.0%
Amount per yr (Rp.) 550,679 506,781 540,600 544,352 604,788 539,798
Senior secondary % receiving scholarship 9.8% 8.1% 7.2% 5.3% 3.1% 6.1%
Amount per yr (Rp.) 634,256 731,386 719,267 738,232 1,236,104 773,243
Source: SUSENAS 2003.
1 Before 2005, prices for these fuels were fixed by the Government, and decreasing
international oil prices thus translated automatically to decreased fuel subsidies.

14
2005 – 2007: Post-BOS minimalist scholarships
In 2005 the Government of Indonesia took a bold move to reduce regressive fuel
subsidies. The government raised fuel prices in March 2005 by a weighted average of 29
percent, followed by a more dramatic increase in October 2005, when prices rose by an
additional 114 percent. The annualized budgetary savings from the 2005 October fuel price
increase (as they apply to the 2006 budget) are estimated to be equivalent to some US$10.1
billion.
With the budget savings, the Government decided to put into place a few large scale
social programs. For the education sector , the GOI had chosen to change course and in the
period of July-December 2005 decided to provide block grants for operational aid to
participating schools at the primary (SD/MI/SDLB) and junior secondary school levels
(SMP/MTs/SMPLB and for Islamic and non-Islamic religious schools) while only partially
continuing the BKM Scholarship program.
In 2005 the smaller scholarship component of the program was kept, with about
700,000 students at the junior secondary and senior secondary school levels (with 57 percent
of beneficiaries at the junior secondary level) and had a budget of about Rp. 272 billion
(MONE, 2005). For primary schools, though, the coverage of the scholarships is extremely
narrow: with over 25 million enrollees, only around 600,000 were scholarships recipients.
Furthermore, in both primary and secondary schools, the number of scholarships dropped
significantly in 2006 and 2007.
BKM amounts were allocated based on poverty and achievement criteria rather than
simply poverty. 2006 SUSENAS data show that the number of students who received
scholarships was small and tended to be spread out among expenditure quintiles (Table 3).

15
Only 2.3 percent of primary, 2.4 percent of junior secondary and 3.2 percent of senior
secondary school students received scholarships (Table 4). While the poorest quintile tends
to be targeted slightly more than the upper quintiles, the variance is small.
Table 4: BKM (Bantuan Khusus Murid) coverage and amount, 2006
School Per capita expenditure quintile Total
poorest 2 3 4 richest
Primary % receiving scholarship 3.20 2.50 2.41 2.28 1.24 2.31 Amount per yr (Rp.) 242,837 228,764 272,645 285,283 278,853 256,128
Junior secondary % receiving scholarship 4.34 3.32 2.64 2.10 1.14 2.44 Amount per yr (Rp.) 344,729 388,190 375,254 399,021 362,707 373,209 Senior secondary % receiving scholarship 6.93 6.25 4.30 2.79 1.46 3.19 Amount per yr (Rp.) 318,937 420,476 503,131 453,738 466,772 443,460
Source: SUSENAS 2006.
2008 – present: re-expansion of scholarship programs
In 2008, both MoNE and MoRA significantly increased their budget for scholarship
programs. This arguably followed the reaffirmation of the constitutional target of allocating
20 percent of the Government’s budget to education. An assessment of the program
implementation so far would distill lessons so as to refine the design of the program,
improve effectiveness, and achieve better results. These will be the focus of the next
section.
Current scholarship programs in Indonesia
Compared with the scholarships program during 2005-2007, the current scholarships
program has wider coverage, and emphasizes on supporting students from poor family
background, with much less mention of academic performance as part of the eligibility
criteria. Table 5 shows a comparison of the key characteristics of the primary school level
scholarships programs of these two periods.

16
Table 5: A comparison of BKM and current scholarships program (primary level)
BKM program Current scholarships
Period 2005-2007
2008 – current
Target Academically performing and poor students Poor students
Unit cost per year
Rp. 300,000/student Rp. 360,000/student
Management MoNE managed both regular and religious schools originally; separate management at MoNE and MoRA starting in 2007
MoNE and MoRA separately (MoRA program was not implemented in 2009 due to budget cut)
Number of recipients
2005: 70,000 students 2006: 53,920 students 2007: 52,121 students
2008: 698,570 students 2009: 1,796,800 students
Source: MoNE scholarship manual and minutes of meeting with MoNE scholarship officials.
Coverage and spending
The 2008 education budget for MoNE and MoRA both included much expanded
scholarships spending, covering about 7 percent of the students on average. The planned
coverage at MoRA schools is much higher, reaching over 20 percent of the total enrollment,
considering that a majority of students attending schools under MoRA are from families at
lower socioeconomic strata. The unit cost of scholarships is between US$30 to US$70 per
year, depending on the level and type of schools the student is attending.
In 2009, the scholarships program for the poor planned to cover around 3.7 million
students or about 9.1 percent of total students at the primary and junior secondary level. Of
this number about 68 percent or 2.5 million students are targeted for regular schools, and the
remaining 32 percent are targeted for religious schools. The targeted number of scholarships
recipients in regular schools would represent about 7.1 percent of the total regular school
students at the primary and junior secondary level, while the number in religious schools
represents nearly a quarter of the total religious schools students. Among all recipients, two-
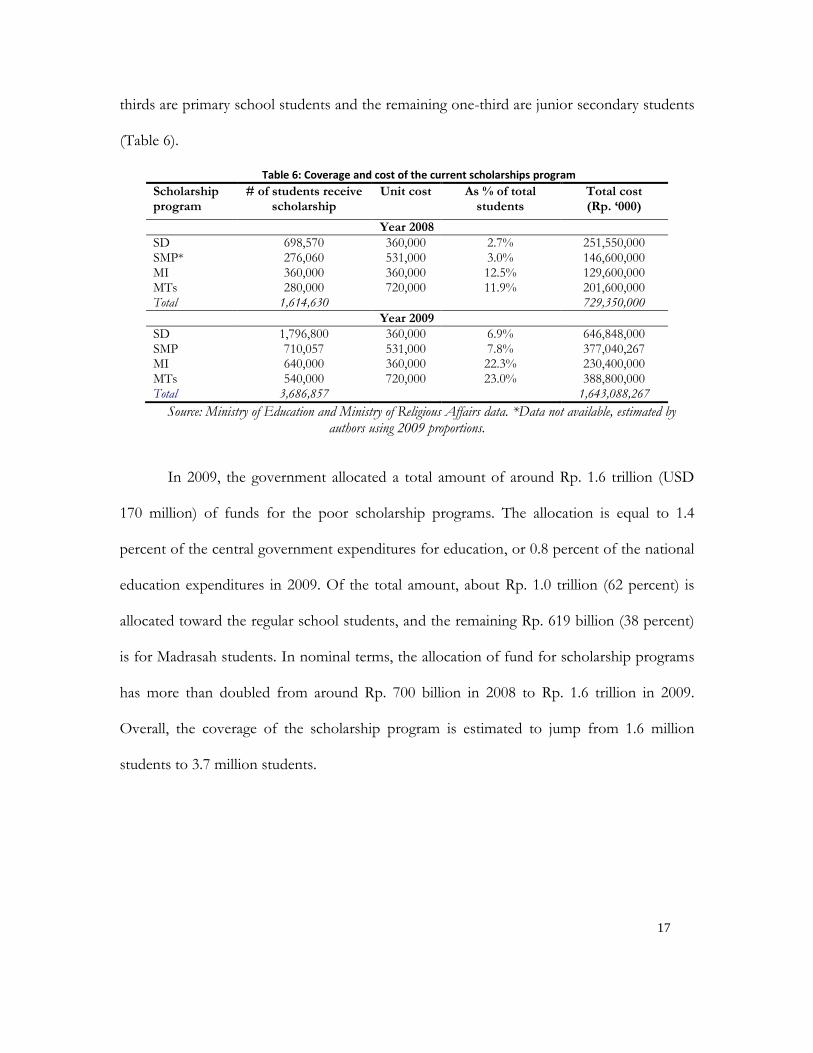
17
thirds are primary school students and the remaining one-third are junior secondary students
(Table 6).
Table 6: Coverage and cost of the current scholarships program
Scholarship program
# of students receive scholarship
Unit cost As % of total students
Total cost (Rp. ‘000)
Year 2008
SD 698,570 360,000 2.7% 251,550,000 SMP* 276,060 531,000 3.0% 146,600,000 MI 360,000 360,000 12.5% 129,600,000 MTs 280,000 720,000 11.9% 201,600,000 Total 1,614,630 729,350,000
Year 2009
SD 1,796,800 360,000 6.9% 646,848,000 SMP 710,057 531,000 7.8% 377,040,267 MI 640,000 360,000 22.3% 230,400,000 MTs 540,000 720,000 23.0% 388,800,000 Total 3,686,857 1,643,088,267
Source: Ministry of Education and Ministry of Religious Affairs data. *Data not available, estimated by authors using 2009 proportions.
In 2009, the government allocated a total amount of around Rp. 1.6 trillion (USD
170 million) of funds for the poor scholarship programs. The allocation is equal to 1.4
percent of the central government expenditures for education, or 0.8 percent of the national
education expenditures in 2009. Of the total amount, about Rp. 1.0 trillion (62 percent) is
allocated toward the regular school students, and the remaining Rp. 619 billion (38 percent)
is for Madrasah students. In nominal terms, the allocation of fund for scholarship programs
has more than doubled from around Rp. 700 billion in 2008 to Rp. 1.6 trillion in 2009.
Overall, the coverage of the scholarship program is estimated to jump from 1.6 million
students to 3.7 million students.

18
Table 7: GoI scholarships budget
Expenditures 2008 2009
Scholarship program for the poor nominal (Rp. million) 582,750 1,643,088
Scholarship program for the poor in real term (2006=100, Rp. million) 499,730 1,337,458
Scholarship program for the poor as % of national education budget 0.4 0.8
Scholarship program for the poor as % of central education budget 0.8 1.4
Scholarship program for the poor as % of central expenditure 0.08 0.2
Source: MoNE, MoRA, and WB staff calculation based on SIKD and APBN data.
Implementation arrangement
At present, MoNE and MoRA continued to manage the programs separately.
Within MoNE, the programs for primary and secondary level students are also managed
separately by the respective directorates for primary and secondary education. In terms of
quota allocation, budgeting, and channeling of fund, the processes have more or less
followed the blueprint laid out by the SGP program, albeit with some key variations.
A. MONE Scholarships Program at primary level
Quota and data collection. The Directorate of Kindergarten (TK) and Primary
Education (SD) in MoNE decides on the scholarships quota for primary school students for
every province in the country. The calculation of quota at each level (central, province, and
district) is based on a set of factors. At the central level, the quota is determined based on
the number of students that come from the poor population and the poverty conditions of
the province as a whole. At the provincial level, the Education Office takes into account
information on the number of poor students, the poverty conditions of districts, and the
geographical location of the schools within districts to allocate quota to districts, and finally,

19
the Education Office at district level allocates the quota based on the poverty conditions of
school community, school location, and other equity factors.
The data collection process starts from the school after the information of quota is
received. The school principals create a decree that lists the recipient candidates of the
scholarship, which are selected based on a set of criteria. The letter is submitted by each
principal to District Education Office, who then recapitulates all the data received from
schools. The District Education Office creates a decree on the scholarship candidates and
proposes it to the Provincial Education Office. The Provincial Education Office continues
compiling all the data from districts and submits them to MoNE. The Directorate at MoNE
ratifies the list of students that are entitled to receive the scholarships based on the proposal
received from the Provincial Education Office.
Fund flow: The scholarship funds are from central budget and released through the
central line ministry budget mechanism. The process starts with the Directorate of TK and
SD submits the SPP (disbursement request) to the financing unit of MoNE by attaching the
decree of the scholarships, the agreement letter of cooperation between MoNE and the post
office, the invoice of fund recipients, and the list of the names of the students who receive
the scholarships. The financing unit then issues the SPM (request for disbursement
authorization) to the treasury office, who then issues the SP2D (disbursement authorization).
The fund is disbursed to the central post office and channeled to the district post offices
annually. The district post office notifies the District Education Office when the fund is
ready to be withdrawn by students.

20
Figure 3: Distribution of scholarship fund
Financial Unit of MoNE
KPPN Office
( State Treasury)
Directorate of TK and SD, MoNE
KPPN Bank
PT. Post Indonesia
Recipients/ students
Fund
release
Issues SPM
Submits SPP
Districts Post Office
Issues SP2D
Source: Scholarship for poor student manual 2008.
The disbursement period from the post office to the students can be extended if
after a certain period the fund is still not fully disbursed. If after the first 40 days since the
fund arrived in the district post office the withdrawal is less than 100 percent, then the post
office will extend the payment period without written agreement with the Directorate of TK
and SD. The extensions of withdrawal period are based on the following rules: (i) if the
withdrawal only reaches 65 percent, the extension period will be 20 working days; (ii) if the
withdrawal only reaches 75 percent, the extension period will be 15 working days; (iii) if the
withdrawal rate only reaches 85 percent, the extension period will be 10 working days; (iv) if
after 10 working days, the total withdrawal still does not reach 100 percent, then at the end
of December, the post office has to return the remaining fund to the state account and
submit the receipt to the Directorate of TK and SD.
The scholarship fund can be withdrawn directly by the students themselves or
collectively through their school. If the students wish to withdraw the money by themselves,

21
they are required to bring the student ID card, show the scholarship decree letter from
school, and sign the receipt that is provided by the post office. If the fund is collectively
taken by a school, then the school has to provide authorized letter that is signed by all
recipient students. The only eligible representative of a school for the fund withdrawal is the
school principal. The school principal has to distribute the scholarships fund to the
recipients within 12 working days after the withdrawal from post office. The recipients
provide signatures as disbursement record.
Program review. At the end of an implementation period, the Directorate of TK and
SD prepares a review report covering: student and scholarship allocation, selection process,
fund distribution, withdrawal process, and reporting. The review process also includes
soliciting feedback from implementation experience in the field involving discussions with
provinces and districts, and observations and interviews at schools with students. For
example, in 2007, monitoring and evaluation was carried out in 33 provinces and 54 sampled
districts with the most scholarship recipients. The interviews were carried out with school
principals, students that received the scholarships, the district education officials that
responsible to handle scholarship, and post office officials.
B. MoNE Scholarship at junior secondary level
Quota allocation and data collection. For junior secondary schools, the management of
scholarship program is under the Directorate of Junior Secondary Education (SMP). Similar
to that at primary level, the quota allocation at junior secondary level also starts at the central
level to provinces and then cascades downwards. Allocation to districts by respective
provinces takes into account factors that include: (i) total number of students by district, (ii)
poverty indicators, and (iii) fiscal gap. Apart from these criteria, provinces are also given

22
opportunity to select other criteria that are relevant to any particular conditions of the
province. After the province sets the quota for districts, districts continue by selecting the
schools and allocating the quota for schools. The allocation for schools is based on a
number of indicators such as the number of students, number of poor students, distance of
school to the district capital, and other local indicators. Just like provinces, districts can also
develop their own criteria based on their needs.
At the school level, after receiving the allocation from the district, the school
principal continues the process by selecting students based on a set of criteria, including: (i)
from families with poor status card; (ii) being an orphan; (iii) from a big family that has more
than three children; (iv) parents with low-security and low-paying jobs; (v) long distance
between residence and school; and (vi) academic performance. Once the school has selected
the students to receive the scholarship, the data is submitted to the District Education
Office, which then summarizes the data and sends it on to the provincial office for further
forwarding to the central.
Fund flow. Unlike the fund flow to post offices directly for primary school
scholarships, the fund of SMP scholarships is channeled through the de-concentration
mechanism. Under the de-concentration mechanism, the province as the representative of
the central government has a significant level of authority to channel the funds through the
financial institutions (post offices and banks) and manages the allocation of funds to the
districts.
The channeling process of the fund starts with the creation of provincial budget
allocation (DIPA). The province will then request the payment to the state treasury office to
disburse the fund to the post office. The fund is disbursed every six months or twice a year.

23
After the money is transferred to the post office, the post office informs District Education
Office that the fund is ready to be withdrawn. The District Education Office then notifies
schools. School withdrawal process is the same as that at primary level.
C. MORA Scholarships Program
The scholarships program under the management of Directorate of Madrasah
Education in MoRA covers Madrasah Ibtidaiyah (MI) at the primary level and Madrasah
Tsanawiyah (MTs) at the junior secondary level, including both public and private madrasah.
The scholarships for madrasah students include two categories: general scholarship and
special scholarship. General scholarships target students that are poor or academically
performing, while special scholarships target students that live in remote and disadvantaged
areas or students with disability.
Quota allocation and data collection. The allocation of scholarships quota is proportional
to school enrollments. The selection of scholarship recipients starts at the school level and
continues at the district level through the MoRA representative office in the region. The
selection of students at the school level is led by the head of the madrasah with the
assistance of teachers and the school committee. The proposed students by schools are
further screened at the district level by the head of MoRA district office with the help of
principals and teachers clusters. The result of selection is then submitted to the provincial
office and officially approved by the head of provincial office. The approved list is then
forwarded to the Directorate in MoRA.
Fund flow. The mechanism of MoRA scholarships fund channeling is similar to that
for the SMP scholarships program at MoNE, using the de-concentration mechanism with
provincial DIPA. Also similarly, the fund is disbursed one time at the beginning of the year

24
and channeled through the post office. Students can withdraw the fund by bringing with
them the statement letter from the head of madrasah and a copy of student card. The
scholarship fund has to be withdrawn by students themselves with the company of a parent
or a teacher.
The table below summarized the similarities and differences of the implementation
arrangement for different categories of schools under different directorates and Ministries.

25
Table 8: Summary of current implementation arrangements of scholarship programs
MoNE DGPSE: Directorate for TK and SD
MoNE DGPSE: Directorate for SMP
MoRA: DG for Islamic education
Responsibility for scholarships management
Regular primary schools Regular and open Junior secondary schools
Madrasah Ibtidaiyah (MI) at primary level and Madrasah Tsanawiyah (MTs) at junior secondary level
Targeting Poverty, population, and
school enrollments are key factors for targeting. Each level can set up additional criteria based on local conditions
Poverty, population, and school enrollments are key factors for targeting. District’s fiscal condition is also considered Each level can set up additional criteria based on local conditions
Enrollment is key factor. ―General scholarships‖ targeting poor and academically outstanding students ―Special scholarships‖ targeting students in remote areas and students with disability
Quota allocation MoNE allocates to
provinces, provinces to districts and districts to schools
MoNE allocates to provinces, provinces to districts and districts to schools
MoRA allocates to provinces, provinces to districts and districts to schools
Selection at school level
Principal decides with consultation and issues decree
Principal decides with consultation, and issues decree
Principal decides with consultation and issues decree
Fund flow From DGPSE directly to
post offices Deconcentration via provincial DIPA to post offices
Deconcentration via provincial DIPA to post offices
Frequency of disbursement
Once a year Twice a year Once a year
Fund withdrawl By students or by principal with signed authorization letter
By students or by principal with signed authorization letter
By students only with company of a parent or a teacher

26
Early assessment of implementation
We use the fourth wave of Indonesia Family Life Survey (IFLS4) to estimate some
early effects of the much expanded scholarships scheme. IFLS 4’s fieldwork was carried out
between October 2007 and June 2008. Even though it did not coincide exactly with the
school year, the impact of the GoI expanded scholarships program can already been
detected.
Figure 4 shows the coverage of the government scholarships by household
expenditure quintile and student’s level of schooling. The overall expansion of the
scholarships for the poor program can be seen from the much higher percentage of students
receiving scholarships at primary and junior secondary school now than that during previous
years, as well as that at senior secondary level. The expanded coverage has reached around
15 percent and 13 percent of the children who are from the poorest households, for primary
and junior secondary school students respectively.
Figure 4: % of students covered by GoI scholarships (2007-2008), by education level and household expenditure quintile
IFLS 4 (2007-2008).

27
However, compared with SGP scholarships, the targeting seems to be less effective:
the correlation between whether received government scholarships and household
expenditure is not as significant as what is shown in Figure 2, indicating that compared with
the program under SGP, the current scholarships program does not seem to target as well,
and benefited better-off households more significantly.
In addition, it appears that the amount received by student per year is much less than
originally planned by the central ministry. On average, primary and junior school recipients
only receive Rp. 120,000 and Rp. 210.000 annually on average, far from the intended unit
cost of Rp. 360,000 and Rp. 531,000, respectively. Furthermore, these scholarships amounts
seem to be very little compared to the education spending from the household side. For
example, it is estimated that even the poorest households spent over Rp. 980,000 per year
out-of-of pocket for keep a child in school (Figure 5). The expenditure items include fees,
supplies, transportation, and pocket money. The relatively small amount leads to the doubt
that this program can serve as an effective demand stimulant.

28
Figure 5: Average GoI scholarship amount vs. average household education expenditure, by education level and household expenditure quintile
Source: IFLS 4 (2007-2008).
This newly expanded scholarships program targeting the poor aims at maintaining
the growth of enrollment, as well as increasing the transition from primary to junior
secondary education. Figure 6 graphs trend of the Gross Enrollment Rate (GER) at primary
and junior secondary level. There seems no indication that it has any significantly positive
effect on household enrollment decision.

29
Figure 6: Trend of gross enrollment rate at primary and junior secondary level
Source: MoNE statistics.
In addition to the inaccurate targeting and small scholarships amount, there is one
key design issue that may hinder the program to achieve its full impact: currently the
scholarships program specifically does not include Grade 6 students. This was explained by
the scholarships administrative staff as administratively difficult, since fund release is usually
delayed, and sometimes when fund reaches the schools, the Grade 6 students have already
graduated and left their primary schools.
Data shows that the highest ―dropout‖ during the nine year basic education is
between grade six and seven (Figure 7). In other words, making a successful transition to
secondary education is the key to completing 9-year basic education. Given the near
universality of primary education in Indonesia, however a big gap of enrollment between
primary and junior secondary education, moving the graduating cohort from primary to
continuing secondary education is the key to narrowing the gap.

30
Figure 7: Completion Rates of 16-18 year olds by Income Quintile 2007
2040
6080
100
Per
cen
t
(%
)
0 1 2 3 4 5 6 7 8 9 10 11 12
Grade
quintile 1 quintile 2 quintile 3 quintile 4 quintile 5
SUSENAS 2007.
Improving the Scholarships for the Poor program: the way forward
Given the large amount of resources allocated to the scholarships for the poor
program, increasing the effectiveness of the program aiming at better outcome, better
targeting, better monitoring and reporting, and better overall coordination and alignment are
the key challenges for moving ahead.
Focusing on transition from primary to secondary education
Making a successful transition to secondary education is a key to completing 9-year
basic education. In this sense, Grade 6 is a critical year – as almost all Indonesian children
now go through Grade 6, putting in place a primary school-based incentive scheme at this
point to encourage moving up to the next cycle is particularly promising. In particular,
Grade 6 scholarship program can introduce variations in design to tackle the between-cycle
transition issue. For example, Grade 6 scholarship recipients can be guaranteed continued

31
scholarships for the first year of junior secondary school, together with guaranteed
admissions at certain junior secondary schools.
Starting to allocate more resources to primary scholarships, but gradually increasing the
share for junior secondary school
Since the students from the poorest families are still the most likely to dropout and
not making the transition to junior secondary school, they are under-represented at the
secondary school level. Therefore, public resources spent at the primary school level favor
the poor more than that spent at the junior secondary school level where enrollment rates
drop, and the current benefit incidence favors the middle-upper quintiles. Therefore, the
current big gap between primary and junior secondary enrollment justifies more than a
proportionally bigger share of scholarships resource to primary school students.
However, this situation is not static: the proportion of poor students at junior
secondary level will increase over time, particularly with increased public interventions
targeting the poor households. Therefore, the allocation of scholarships fund between
primary and secondary school should also be adjusted over time, gradually increasing the
share for junior secondary students.
Using complementary household-based intervention to target out-of-school children
As currently designed and implemented in Indonesia, the scholarships program is a
school-based demand-side intervention. The targeted recipients are in schools already. This
design seems to miss out the out-of-school children, particularly those who have finished
primary school, but are out of junior secondary school.
Even though the awareness of the existence of school-based scholarships programs
may encourage parents to send their children to school because of reduced overall cost to

32
households, other non-financial reasons can also keep parents from sending their children to
school. These could include perceptions of low labor market returns to schooling or just in
general low perceived value of education. Under these circumstances, conditional cash
transfer should be a good complement intervention to stimulate demand for children out-of-
school. In many cases, it is not the cash, but the ―condition‖ that sends a stronger signal to
parent on the value of education.
Indonesia’ CCT program has implemented for a few years. The coverage is still not
national wide. There is great potential to scale up the program and create synergy between
the demand-side intervention programs for better education outcome.
Integrating programs and re-adopting good practices for better efficiency and transparency
The current scholarships programs are managed by three separate central
directorates, with slightly different fund flow channels, frequencies, and withdrawal
requirements. On one hand, the three seemingly separate programs need to be integrated
for streamlined management; on the other hand, there are few justifications that the program
should remain a central level program. Fund allocation and program management at district
level should be a better option with potentially shortened fund flow process, more coherent
targeting, and closer program monitoring.
Some implementation arrangements from SGP can also be re-established particularly
the functions of the independent monitoring unit, and the complaint handling unit. They
contributed greatly to the transparency and effectiveness of the SGP scholarships program,
and the current scholarships can surely benefit from these good practices in implementation.

33
References:
1. Arze del Granado, Javier, Wolfgang Fengler, Andy Ragatz, and Elif Yavuz (2007). Investing in Indonesia’s Education: allocation, equity, and efficiency of public expenditures. Policy Research Working Paper, World Bank, Washington D.C.
2. Bjork, Christopher (2006). Indonesian Teaching Culture, Classroom Realities, and the Potential for Reform. Background Paper, August.
3. Borman, G.D., G.M. Hewes, L.T. Overman, and S. Brown (2003). Comprehensive School Reform and Achievement: A Meta-Analysis. Review of Educational Research 73(2): 125-230.
4. Cameron, L. (2002), Did Social Safety Net Scholarships Reduce Drop-Out Rates During the Indonesian Economic Crisis? Policy Research Working Paper No 2800, the World Bank, Washington DC.
5. CIMU (2000), The Management of Block Grants (DBO), Central Independent Monitoring Unit, Jakarta.
6. CIMU (2001), The Effect of the Scholarship Program at the Household Level, Central Independent Monitoring Unit, Jakarta.
7. CIMU (2002a), A Summary of CIMU Monitoring Findings on the School Improvement Grants Program, Central Independent Monitoring Unit, Jakarta.
8. CIMU (2002b), A Study of the School Improvement Grant Program and its Impact, Central Independent Monitoring Unit, Jakarta.
9. CIMU (2003), CIMU Investigation of Alleged Malpractices in Program Implementation, Central Independent Monitoring Unit, Jakarta.
10. Filmer, D. (2001), Issues and options for an exit strategy for Indonesia’s Scholarships and Grants Program, mimeo, the World Bank, Washington DC.
11. Filmer, D., and H. Dean Nielsen, N. Suwaryani, B. Indriyanto (2001), Indonesia’s Primary and Junior Secondary Schools in a Post-Crisis Environment: Findings from a Follow-up Survey of 600 Schools, mimeo, the World Bank, Washington DC.
12. Frankenberg, Elizabeth, Duncan Thomas, and Kathleen Beegle (1999), The Real Costs of Indonesia’s Economic Crisis: Preliminary Findings from the Indonesia Family Life Survey, July, RAND, Santa Monica, CA, Mimeo.

34
13. Jones, G., J. Maxwell, S.K. Rahayu, B. Soelaksono, Akhamadi, Hastuti, S. Budiyati, P. Wibowo, M. Nabiu, and W. Nunawar (1999), Permasalahan Pendidikan dan Program JPS Beasiswa dan DBO di Empat Propinsi, SMERU Research Institute, Jakarta.
14. Jones, G., P. Hagul, and Damayanti (2000), A Study of the Impact of the Scholarships and Grants Program, Central Independent Monitoring Unit of the Scholarships and Grants Program, Jakarta.
15. Jones, G., and P. Hagul (2001), Schooling in Indonesia: Crisis-related and Longer-term Issues, Bulletin of Indonesian Economic Studies, 37(2), 207—231.
16. Jones, G. (2003), Assessment of educational trends at primary and junior secondary levels in Indonesia since the crisis began in 1997, Annex 2 of 17th CIMU Quarterly Report, Jakarta.
17. Kraft, Richard (2008), Sector Governance and Management: Theoretical Background and Measurement Indicators of SGM in Indonesian Schools and Districts. Background Paper, February.
18. Pritchett, L., S. Sumarto, and A. Suryahadi (2002), Targeted Programs in an Economic Crisis: Empirical Findings from the Experience of Indonesia, SMERU working paper, Jakarta.
19. Rawlings, L.B, and G.M. Rubio (2003), Evaluating the Impact of Conditional Cash Transfer Programs: Lessons from Latin America, Policy Research Working Paper No 3119, the World Bank, Washington DC.
20. Ridao-Cano, Cristóbal and Deon Filmer (2004), Evaluating the Performance of SGP and SIGP: A Review of the Existing Literature and Beyond.
21. SMERU (2003), Rapid Assessment of Education Problems, and the JPS Scholarship and Block Grants Program in Four Provinces, the SMERU Research Institute, Jakarta.
22. SMERU (2009). Teacher Absenteeism and Remote Allowance Baseline Survey.
23. Sparrow, R. (2004), Protecting Education for the Poor in Times of Crisis: An Evaluation of the Scholarships Program in Indonesia, mimeo, Vrije Universiteit Amsterdam.
24. Suryahadi, A., Y. Suharso, and S. Sumarto (1999): Coverage and Targeting in the Indonesian Social Safety Net Programs: Evidence from 100 Village Survey, SMERU working paper, Jakarta.
25. World Bank (1998), Education in Indonesia: From Crisis to Recovery, Report No. 16369-IND, Education Sector Unit, East Asia and Pacific Regional Office, the World Bank, Washington DC.
26. World Bank (2004), Education in Indonesia: Managing the Transition to Decentralization, Indonesia Education Sector Review, the World Bank, Washington, D.C.

35
27. World Bank (2009). District Education Expenditure Review: A review of district-level public expenditures and financial management.