scgis hands-on workshop: introduction to gis for habitat analysis and home range estimation
DESCRIPTION
SCGIS Hands-on Workshop: Introduction to GIS for Habitat Analysis and Home Range Estimation. Sadie Ryan, UC Berkeley. What is GIS?. Geographic Information System – object often uses software Geographic Information Science – discipline Blueprint of a house – simplest GIS - PowerPoint PPT PresentationTRANSCRIPT

SCGIS Hands-on Workshop: Introduction to GIS for Habitat Analysis
and Home Range Estimation
Sadie Ryan, UC Berkeley

What is GIS?• Geographic Information System – object
– often uses software• Geographic Information Science – discipline
– Blueprint of a house – simplest GIS
• Important qualities: – Overlay operations
• Map equations in layers
– Spatial relationships • point to point
– Ancillary data • data associated with locations
• Points vs. Grids
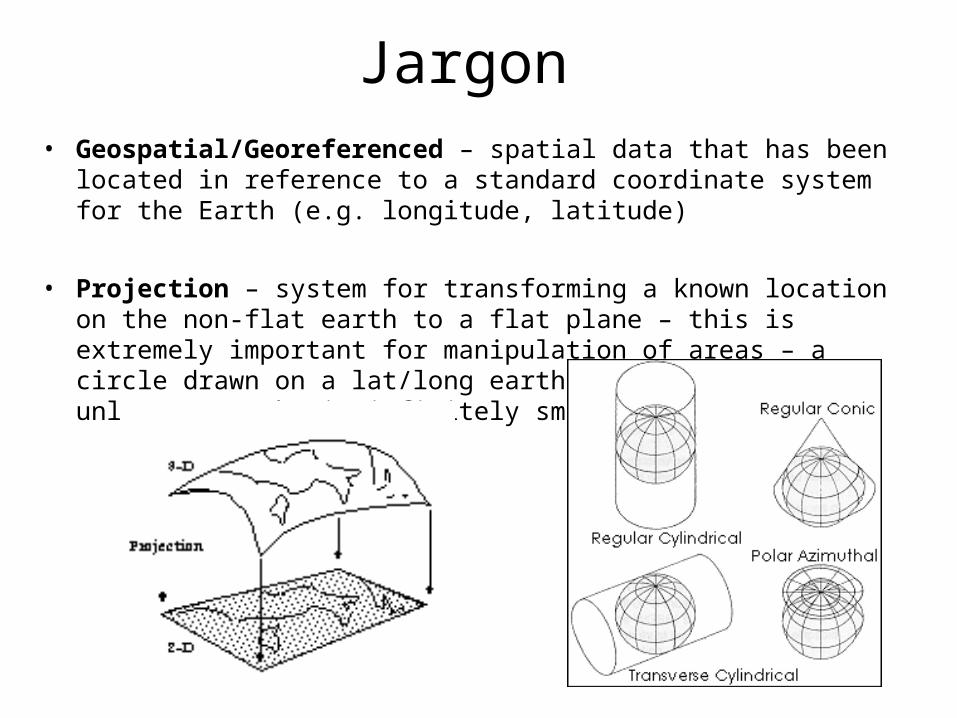
Jargon• Geospatial/Georeferenced – spatial data that has been located in reference
to a standard coordinate system for the Earth (e.g. longitude, latitude)
• Projection – system for transforming a known location on the non-flat earth to a flat plane – this is extremely important for manipulation of areas – a circle drawn on a lat/long earth is not a circle, unless you make it infinitely small at the equator.

How do we collect spatial data?
• Radio collars
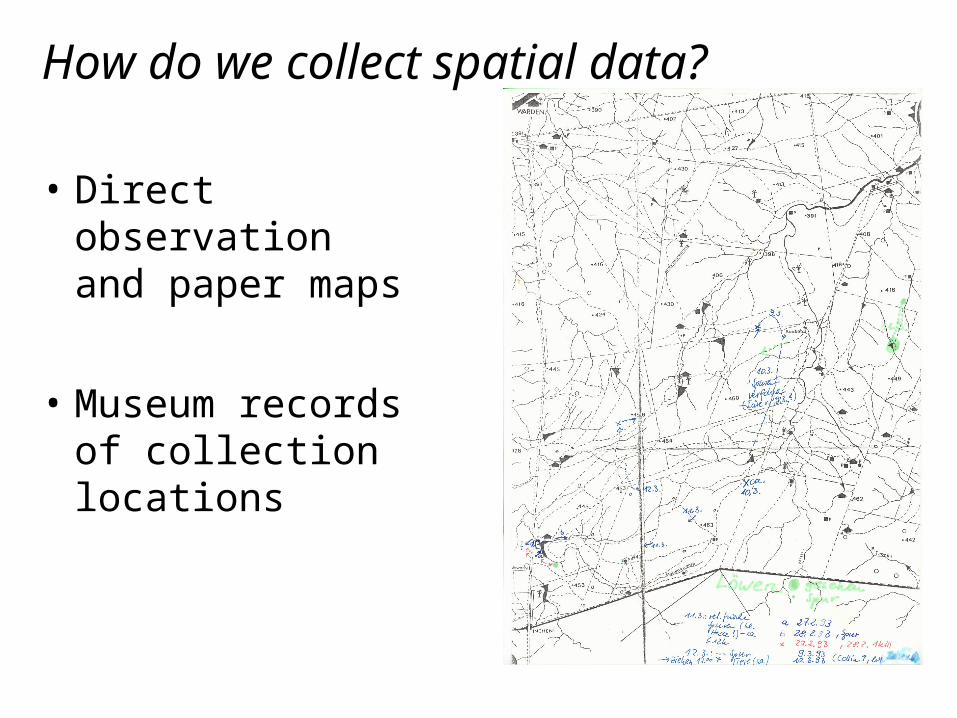
• Direct observation and paper maps
• Museum records of collection locations
How do we collect spatial data?

• GPS– Collars/patches that upload
– Handheld records of indicators • – scat, tracks
• Remotely sensed data– Satellite imagery
• Vegetation, landcover, climate
– Aerial photgraphy
– Radar etc.
How do we collect spatial data?
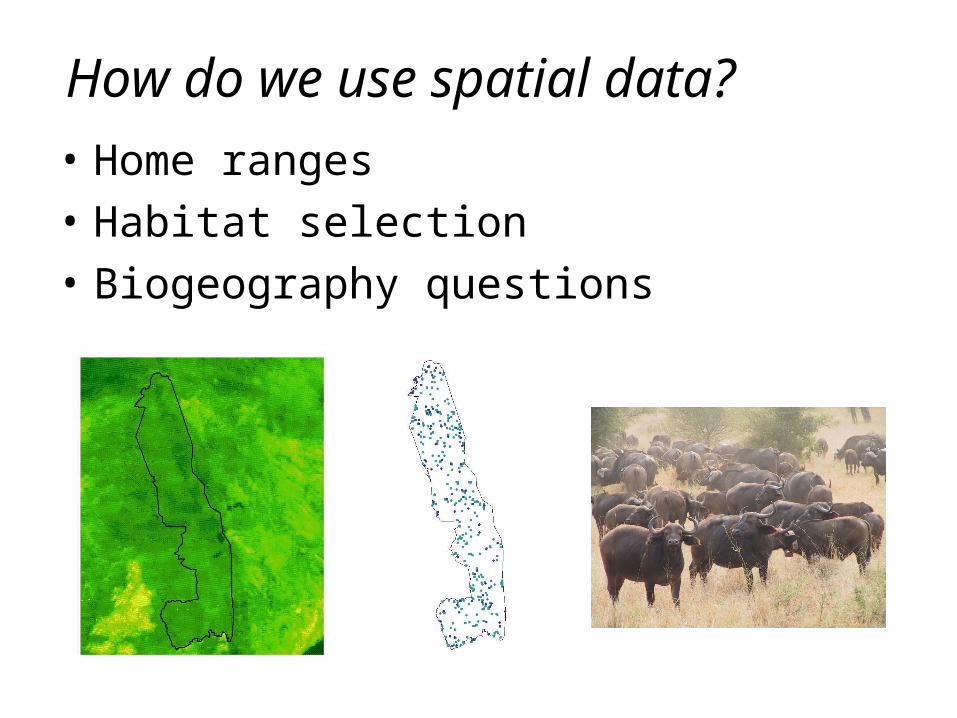
How do we use spatial data?
• Home ranges
• Habitat selection
• Biogeography questions

Home range methods
• Traditional: Minimum Convex Polygon (MCP)– Join the outermost points together
– Useful for delineating overall area used – useful for conservation and reserve design with sparse data
– You can use just 95% of points to define error, but no clear selection method for it
– Assumes animals are using the whole area equally

•Kernel methods
–Smoothing of points, predicts likelihood of occurrence, even beyond points
–Shows areas of higher and lower densities – useful to define key areas like feeding grounds
–Similar assumption of whole area use; no holes
–Alarming property of increasing as you add data
–Harmonic Mean
–Accents areas of higher density
–Similar to Kernel methods
•Local convex hull method – LoCoH
–More data needs newer methods (GPS data is huge)
–Good for ID of non-use areas
–Allows for physical barriers to movement
Home range methods
Harmonic mean
Adaptive Kernel

1 Buffalo Herd, 4085 locations in 2000
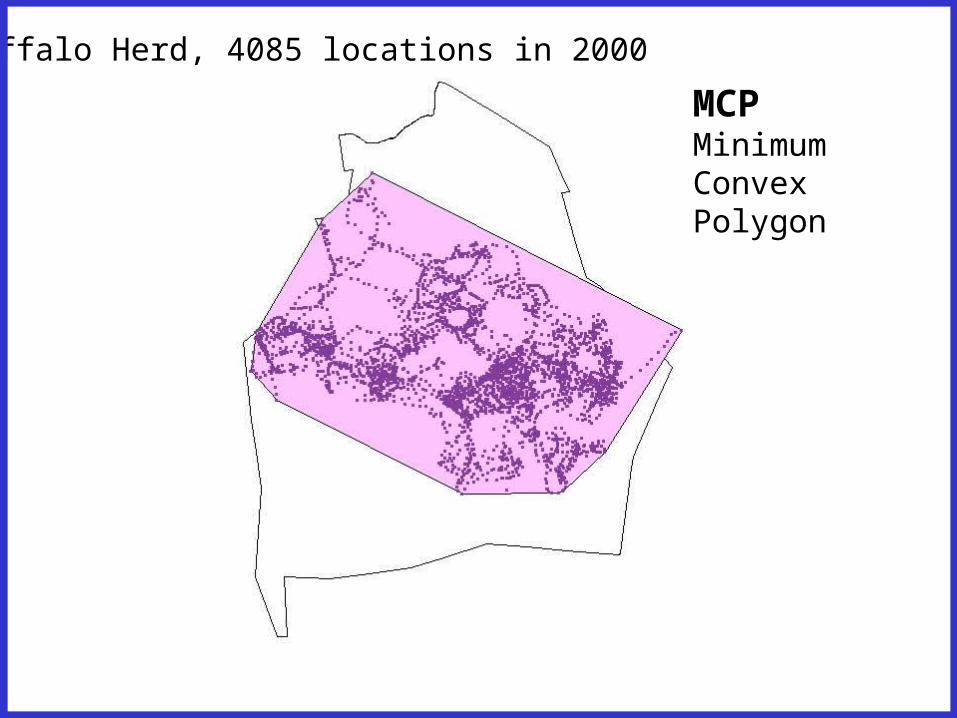
1 Buffalo Herd, 4085 locations in 2000
MCPMinimumConvexPolygon

1 Buffalo Herd, 4085 locations in 2000
Kernel Method95%50%Default Smoothing H
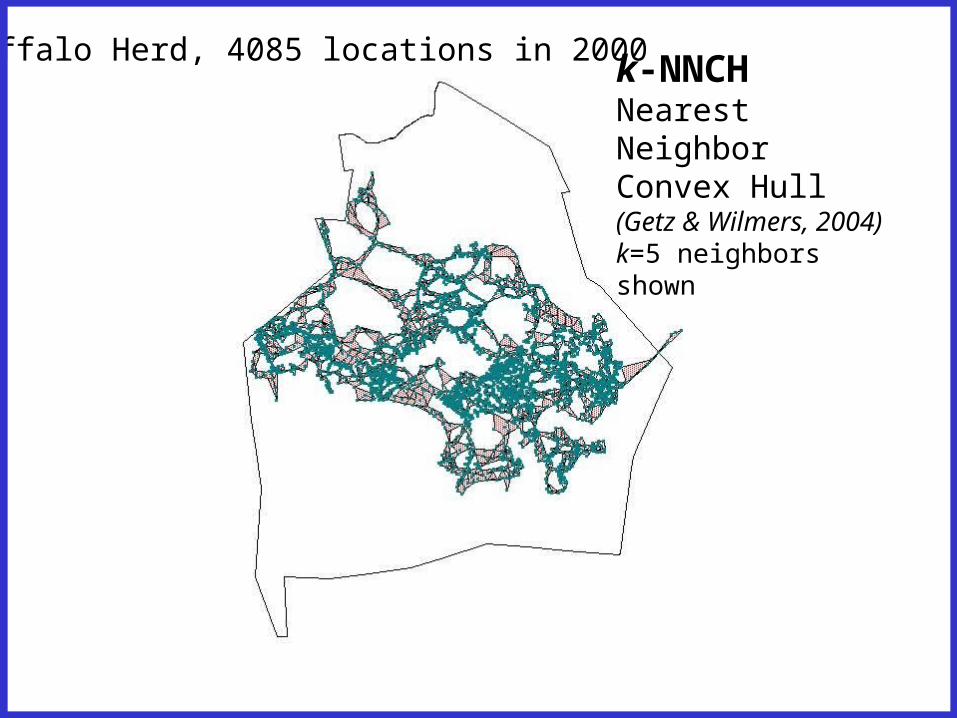
1 Buffalo Herd, 4085 locations in 2000k-NNCHNearest NeighborConvex Hull(Getz & Wilmers, 2004)k=5 neighbors shown

1 Buffalo Herd, 4085 locations in 2000k-NNCHNearest NeighborConvex Hull(Getz & Wilmers, 2004)k=20 neighbors shown

Habitat Selection methods
• Points on a map– Points are then associated with location-specific data
• e.g. vegetation type, distance from water, slope, elevation, aspect, soil type etc.
– Many different statistical analyses of results– Demo of simple proportional occurrence
• Buffalo and vegetation type, distance to water

Study Site
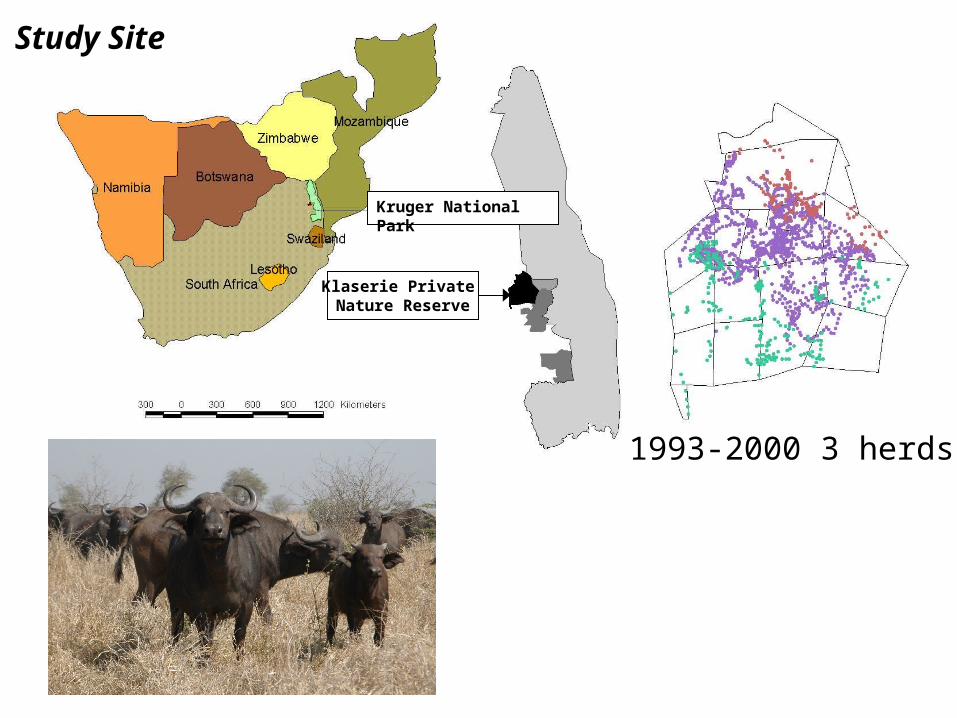
Klaserie Private Nature Reserve
Kruger National Park
1993-2000 3 herds
Study Site
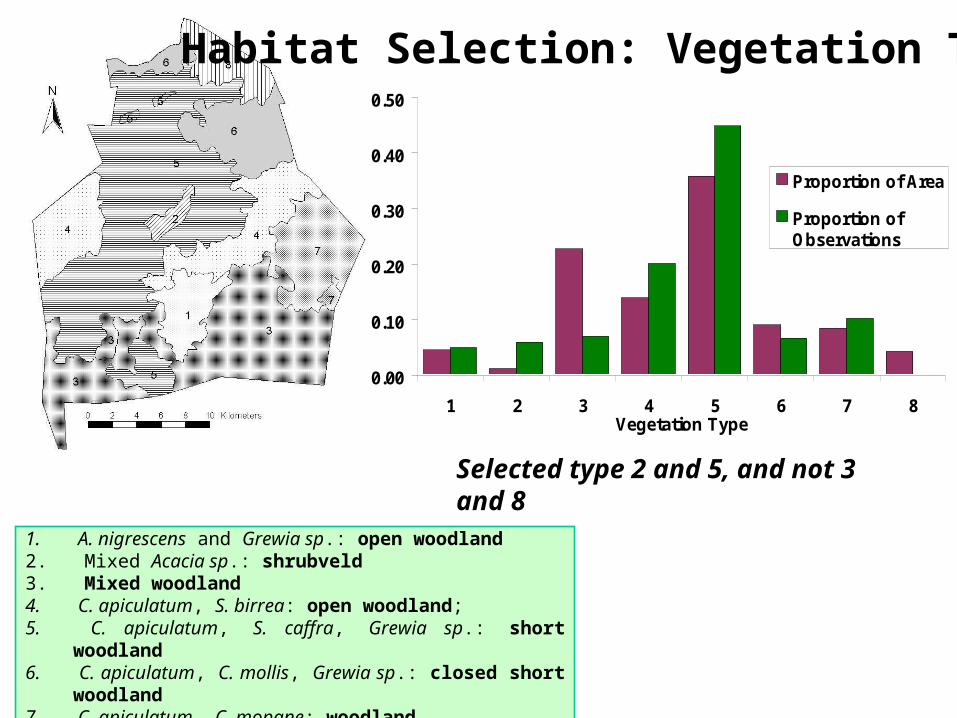
1. A. nigrescens and Grewia sp.: open woodland 2. Mixed Acacia sp.: shrubveld 3. Mixed woodland4. C. apiculatum, S. birrea: open woodland; 5. C. apiculatum, S. caffra, Grewia sp.: short woodland6. C. apiculatum, C. mollis, Grewia sp.: closed short woodland 7. C. apiculatum, C. mopane: woodland 8. C. mopane: woodland and shrubveld
Selected type 2 and 5, and not 3 and 8
0.00
0.10
0.20
0.30
0.40
0.50
1 2 3 4 5 6 7 8Vegetation Type
Proportion of Area
Proportion ofObservations
Habitat Selection: Vegetation Type

0
0.1
0.2
0.3
0.4
0.5
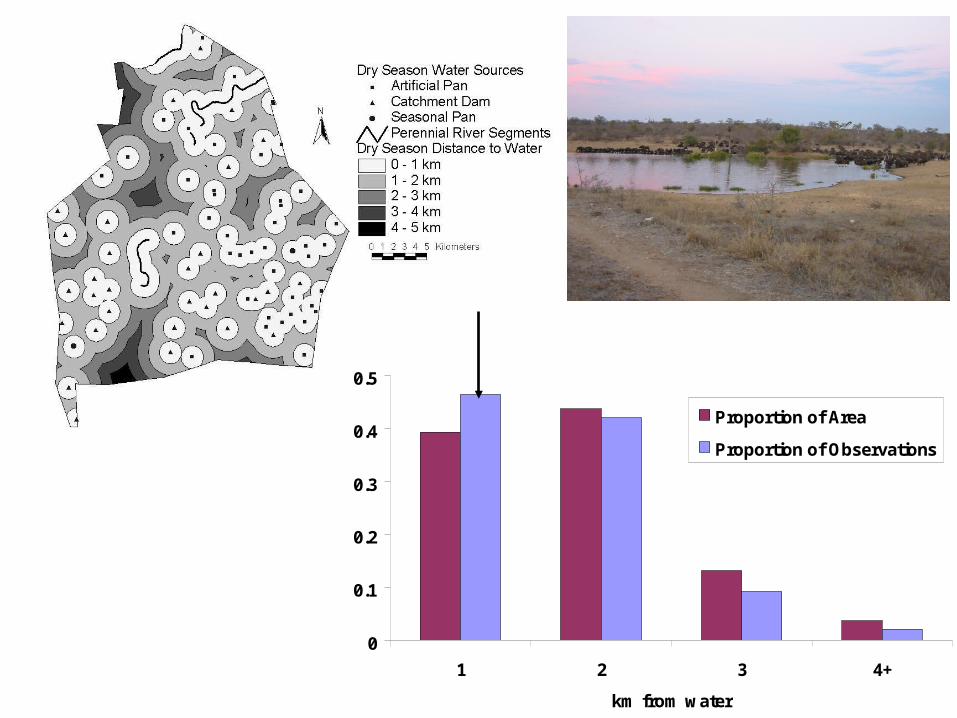
1 2 3 4+
km from water
Proportion of Area
Proportion of Observations

Hawth’s tools is a free extension:
www.spatialecology.comwww.spatialecology.com