scaling of soil moisture: a hydrologic perspective€¦ · pielke 2001), and on soil moisture...
TRANSCRIPT
27 Mar 2002 8:49 AR AR154-06.tex AR154-06.SGM LaTeX2e(2001/05/10)P1: GSR10.1146/annurev.earth.30.091201.140434
Annu. Rev. Earth Planet. Sci. 2002. 30:149–80DOI: 10.1146/annurev.earth.30.091201.140434
Copyright c© 2002 by Annual Reviews. All rights reserved
SCALING OF SOIL MOISTURE:A Hydrologic Perspective
Andrew W. Western1, Rodger B. Grayson1, andGunter Bloschl21Cooperative Research Centre for Catchment Hydrology and Centre forEnvironmental Applied Hydrology, Department of Civil and EnvironmentalEngineering, The University of Melbourne, Victoria 3010, Australia;e-mail: [email protected], [email protected] fur Hydraulik, Gewasserkunde und Wasserwirtschaft, TechnischeUniversitat Wien, Austria; e-mail: [email protected]
Key Words hydrologic modeling, subgrid variability, scaling methods,land-atmosphere interaction, runoff generation
■ Abstract Soil moisture is spatially and temporally highly variable, and it influ-ences a range of environmental processes in a nonlinear manner. This leads to scaleeffects that need to be understood for improved prediction of moisture dependent pro-cesses. We provide some introductory material on soil moisture, and then review resultsfrom the literature relevant to a variety of scaling techniques applicable to soil moisture.This review concentrates on spatial scaling with brief reference to results on temporalscaling. Scaling techniques are divided into behavioral techniques and process-basedtechniques. We discuss the statistical distribution of soil moisture, spatial correlationof soil moisture at scales from tens of meters to thousands of kilometers and relatedinterpolation and regularization techniques, and the use of auxiliary variables such asterrain indices. Issues related to spatially distributed deterministic modeling of soilmoisture are also briefly reviewed.
INTRODUCTION
Soil moisture is a small proportion (only 0.15%) of the liquid freshwater on Earth(Dingman 1994), but it is an influential store of water in the hydrologic cycle. Itmodulates interactions between the land surface and the atmosphere, thereby influ-encing climate and weather (Entekhabi 1995), and is important in determining therainfall-runoff response of catchments, especially where saturation excess runoffprocesses are important (Dunne et al. 1975). Soil moisture also influences a varietyof processes related to plant growth [and hence ecological patterns (Rodr´ıguez-Iturbe 2000) and agricultural production], as well as a range of soil processes(Brady 1990, White 1997).
0084-6597/02/0519-0149$14.00 149
Ann
u. R
ev. E
arth
Pla
net.
Sci.
2002
.30:
149-
180.
Dow
nloa
ded
from
arj
ourn
als.
annu
alre
view
s.or
gby
Uni
vers
ity o
f C
olor
ado
- B
ould
er o
n 08
/22/
10. F
or p
erso
nal u
se o
nly.
30 Mar 2002 8:15 AR AR154-06.tex AR154-06.SGM LaTeX2e(2001/05/10)P1: GSR
150 WESTERN ¥ GRAYSON ¥ BLOSCHL
Soil moisture is variable in space and time and many moisture dependent pro-cesses are nonlinear. This leads to scale effects that need to be understood if weare to make accurate predictions of the behavior of hydrologic systems, where itis generally necessary to aggregate in space and/or time. Similarly, many otherspatial and temporal fields (e.g., soil, vegetation, topography, meteorology) thatinfluence soil moisture and other hydrologic responses are variable. The conse-quence of this is that scale effects are complex, making hydrologic simulation andprediction very challenging. This review concentrates on the scale characteristicsand the scaling of soil moisture in the root zone, focusing on catchment-scalespatial patterns with some reference to temporal patterns.
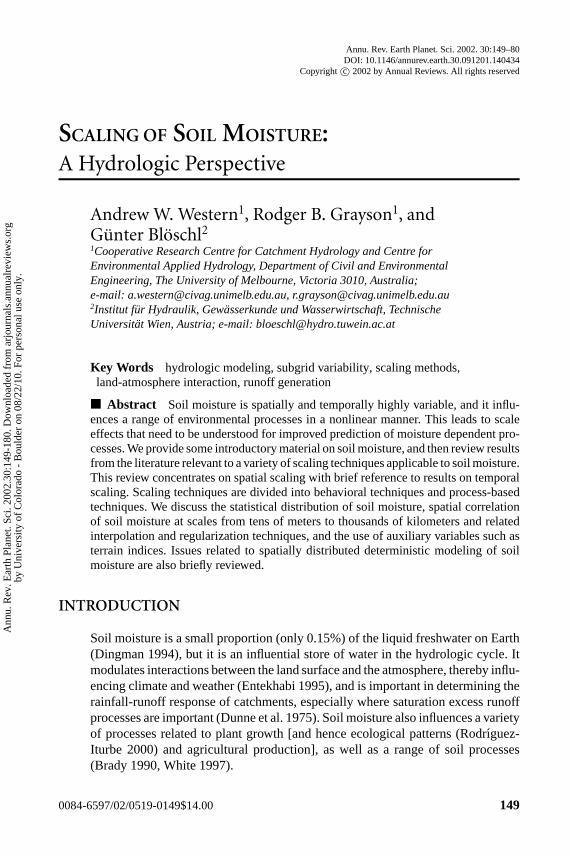
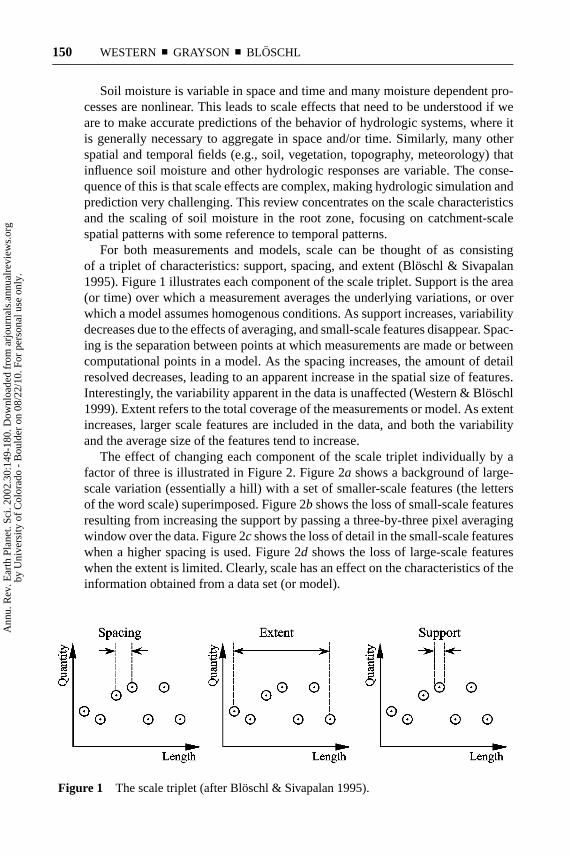
For both measurements and models, scale can be thought of as consistingof a triplet of characteristics: support, spacing, and extent (Bl¨oschl & Sivapalan1995). Figure 1 illustrates each component of the scale triplet. Support is the area(or time) over which a measurement averages the underlying variations, or overwhich a model assumes homogenous conditions. As support increases, variabilitydecreases due to the effects of averaging, and small-scale features disappear. Spac-ing is the separation between points at which measurements are made or betweencomputational points in a model. As the spacing increases, the amount of detailresolved decreases, leading to an apparent increase in the spatial size of features.Interestingly, the variability apparent in the data is unaffected (Western & Bl¨oschl1999). Extent refers to the total coverage of the measurements or model. As extentincreases, larger scale features are included in the data, and both the variabilityand the average size of the features tend to increase.
The effect of changing each component of the scale triplet individually by afactor of three is illustrated in Figure 2. Figure 2a shows a background of large-scale variation (essentially a hill) with a set of smaller-scale features (the lettersof the word scale) superimposed. Figure 2b shows the loss of small-scale featuresresulting from increasing the support by passing a three-by-three pixel averagingwindow over the data. Figure 2c shows the loss of detail in the small-scale featureswhen a higher spacing is used. Figure 2d shows the loss of large-scale featureswhen the extent is limited. Clearly, scale has an effect on the characteristics of theinformation obtained from a data set (or model).
Figure 1 The scale triplet (after Bl¨oschl & Sivapalan 1995).
Ann
u. R
ev. E
arth
Pla
net.
Sci.
2002
.30:
149-
180.
Dow
nloa
ded
from
arj
ourn
als.
annu
alre
view
s.or
gby
Uni
vers
ity o
f C
olor
ado
- B
ould
er o
n 08
/22/
10. F
or p
erso
nal u
se o
nly.
20 Mar 2002 7:47 AR AR154-06.tex AR154-06.SGM LaTeX2e(2001/05/10)P1: GSR
SCALING OF SOIL MOISTURE 151
We often need to use information from one scale at another scale. This is thescaling problem (Beven 1995), and it is challenging because practical problemstypically involve using information from one scale to make predictions at a scalethat has a greater information requirement; i.e., taking sparse data and estimatingintervening values (converting Figure 2c to 2a), taking areal averages and disaggre-gating them (converting Figure 2b to 2a), or taking results at small extents and ex-trapolating to larger areas (converting Figure 2d to 2a). Also, scaling often involveschanging more than one component of the scale triplet at a time (e.g., often both sup-port and spacing change together). The essence of successful scaling is to distill thekey patterns from information at one scale and to use these to make good predictionsat another scale. Such efforts often rely on a suite of relevant supplementary infor-mation ranging from digital elevation models to meteorological time series data.
It is important to note at this point that there are several uses of the term scalingin soil science and hydrology. We have chosen the broad definition outlined aboveand have opted to confine most of our discussion to soil moisture; however, a briefoverview of related concepts is in order. In soil science, scaling is sometimes lim-ited to concepts of similar media in the context of scaling soil hydraulic propertiesand flow and transport equations (Kut´ılek & Nielsen 1994, Sposito 1998a). Theessential aim has been to either describe soil heterogeneity or the integrated effectof soil heterogeneity on flow or transport processes. The concept of geometri-cally similar media was first introduced by Miller & Miller (1955a,b) to relate soilhydraulic properties to the pore structure. Using capillary theory, this assumptionleads to the soil water pressure head functions and hydraulic conductivity functionsbeing related to a microscopic length scale that can be used to characterize het-erogeneity. Further research has led to approaches for scaling static soil hydraulicbehavior (Warrick 1990). Attempts are also being made to scale the dynamic unsat-urated flow equations directly (Haverkamp et al. 1998, Sposito 1998b); however,limitations related to the dependence on the type of boundary condition used in theanalyses exist at present. Stochastic approaches are also being used to understandthe effects of heterogeneity on flow and transport in porous media (Jury et al. 1987,Russo 1998) and to derive effective hydraulic properties for analysis of flow andtransport processes in heterogeneous soils at field scales (Yeh 1998). Research intothe characteristics and representation of soil heterogeneity can contribute to thebroader understanding of the effect of scale on the hydrologic cycle to the extentthat soil heterogeneity is one of several scale-dependent influences on hydrologicfluxes and states. In summary, these approaches relate soil hydraulic propertiesto media properties, whereas in this review the focus is on inferring the spatialdistribution of soil moisture from a few point data and on inferring the temporaldynamics of soil moisture from a few snapshots.
In hydrology, the term scaling is sometimes used to refer to techniques basedon fractal approaches or scaling invariance (Gupta & Waymire 1998, Rinaldo &Rodrıguez-Iturbe 1998, Rodr´ıguez-Iturbe & Rinaldo 1997). These have been usedto analyze properties of stream networks and topography. However, in this paperwe use the term scaling exclusively to denote a transfer of information from onescale to another as discussed above.
Ann
u. R
ev. E
arth
Pla
net.
Sci.
2002
.30:
149-
180.
Dow
nloa
ded
from
arj
ourn
als.
annu
alre
view
s.or
gby
Uni
vers
ity o
f C
olor
ado
- B
ould
er o
n 08
/22/
10. F
or p
erso
nal u
se o
nly.
20 Mar 2002 7:47 AR AR154-06.tex AR154-06.SGM LaTeX2e(2001/05/10)P1: GSR
152 WESTERN ¥ GRAYSON ¥ BLOSCHL
The literature contains a number of examples of important scale effects as-sociated with soil moisture variation. Merz & Plate (1997) studied the effect ofspatially variable patterns of soil moisture and soil infiltration characteristics onthe event rainfall-runoff response at Weiherbach in southwest Germany using aprocess-based distributed rainfall-runoff model. Three types of spatial patternswere considered: uniform, structured, and random. The structured patterns werecharacterized by relatively wet gullies and dry hilltops and/or by lower infiltrationcapacity in the gullies. Substantial differences in both peak discharge and eventrunoff volume were found between each of the three types of patterns, with initialsoil moisture being more important than the infiltration properties. The differ-ences were dependent on the rainfall characteristics, with medium-sized eventsinfluenced most by the spatial variability. Similar studies have been conducted byGrayson et al. (1995) and Western et al. (2001).
Variability in the land surface can also have a significant impact on atmo-spheric processes. Weaver & Avissar (2001) studied the impact of variations in thesurface latent and sensible heat fluxes on mesoscale atmospheric circulation overOklahoma and Kansas, using the Colorado State University Regional AtmosphericModeling System. At the land surface boundary, they applied a 2-km grid pattern ofland surface sensible and latent heat flux over a 252-km square area, derived fromsurface measurements. The spatial variations were primarily due to vegetation pat-terns and moisture availability, and they had characteristic scales of 20–100 km.The simulations suggested that strong mesoscale atmospheric circulations devel-oped under a range of synoptic conditions as a result of surface heterogeneity.They led to moisture being transported higher into the atmosphere and would beexpected to lead to increased cloud formation and precipitation. The atmosphericsimulations were also compared with satellite cloud images, which could not besimulated realistically when ignoring the spatial variability of surface latent andsensible heat fluxes.
While the studies described above are model based and the conclusions, there-fore, depend on the validity of the model assumptions, significant efforts have beenmade to test the models using appropriate spatial data. The studies indicate signifi-cant scale effects associated with variability in soil moisture, or, in the second case,evapotranspiration, which is partially moisture controlled. The effects on fluxes areof practical significance in both cases, but the characteristic scales of importanceare very different, illustrating the problem-specific nature of scaling issues.
The rest of this paper is structured as follows. First, the key physical processescontrolling soil moisture are briefly discussed. Second, measurement of soil mois-ture by ground-based and remote sensing techniques is discussed, and the key scalecharacteristics of different measurements are identified. In the final section, scalingtechniques applicable to soil moisture are presented, including a brief discussionof temporal scaling and then concentrating on spatial controls on soil moisture,scaling based on behavioral analysis, and scaling based on process analysis.
There are several published reviews that also provide useful information ofrelevance to soil moisture scaling. They include reviews on scaling in hydrology
Ann
u. R
ev. E
arth
Pla
net.
Sci.
2002
.30:
149-
180.
Dow
nloa
ded
from
arj
ourn
als.
annu
alre
view
s.or
gby
Uni
vers
ity o
f C
olor
ado
- B
ould
er o
n 08
/22/
10. F
or p
erso
nal u
se o
nly.
20 Mar 2002 7:47 AR AR154-06.tex AR154-06.SGM LaTeX2e(2001/05/10)P1: GSR
SCALING OF SOIL MOISTURE 153
in general (Bloschl & Sivapalan 1995, Dunne et al. 1975, Koltermann & Gorelick1996), on land-atmosphere interactions (Entekhabi 1995, Giorgi & Avissar 1997,Pielke 2001), and on soil moisture modeling (Mahmood 1996). Sposito (1998a)presents a collection of papers on scaling in hydrology and soil science.
SOIL MOISTURE PROCESSES
In this section we briefly describe the parts of the hydrologic cycle that directlyaffect soil moisture, as well as some elementary soil physics. More detailed treat-ments can be found in text books (Dingman 1994, Hillel 1998, Kut´ılek & Nielsen1994). Soil is a complex porous media containing mineral particles, water and air,together with small amounts of organic matter, and the soil biota. Soil water isa reservoir in the hydrologic cycle that influences runoff, evapotranspiration, anddrainage to groundwater systems and to streams. There are two standard quantita-tive definitions of soil moisture: gravimetric,θg, and volumetric,θv. θg is definedas the mass of water divided by the mass of dry soil, andθv is defined as thevolume of water divided by the volume of soil. It is possible to convert betweenthe two using the dry soil bulk density,ρb: θv = ρb θg. Soil moisture is an integralquantity that represents the average conditions in a finite volume of soil. For properinterpretation, it is important to know the volume, and particularly the depth range,that a soil moisture value represents.
From a theoretical perspective, the range in soil moisture is bounded by zeroand the soil porosity,η. η is the volume of soil pores divided by the volume ofsoil. In the field the practical lower limit on soil moisture is positive due to theinability of plants to extract water below a particular level, commonly called thewilting point. The bounded nature of soil moisture has important implications forits statistical characteristics in space and time, as is explored in more detail later.
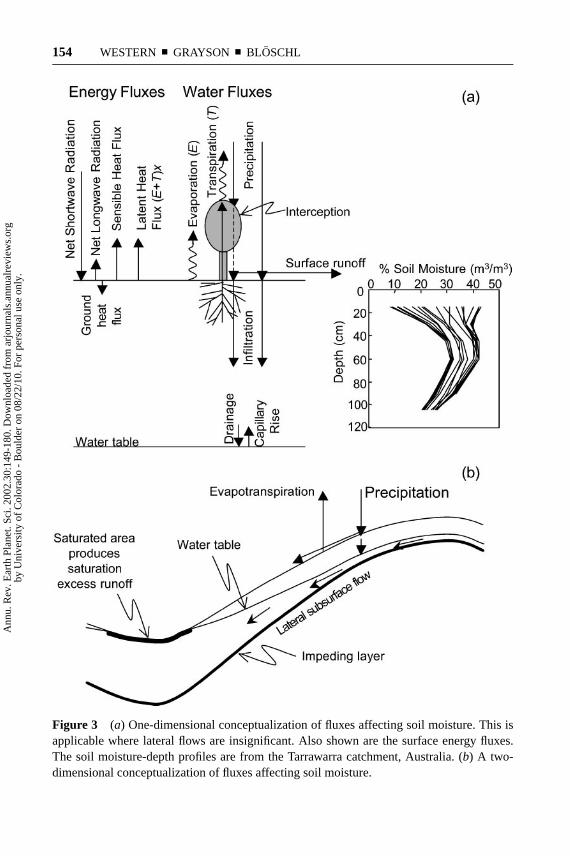
Figure 3a illustrates a standard one-dimensional conceptualization of the soilprofile and the fluxes that influence the soil moisture stored in the profile. Gen-erally, the exchanges between the atmosphere and the soil dominate changes insoil moisture. The soil moisture store is primarily replenished by infiltration anddepleted by soil evaporation and plant transpiration. The relative importance ofevaporation and transpiration depends on the vegetation cover, with transpirationdominating in well-vegetated landscapes. Fluxes between the soil and groundwater(or deeper parts of the regolith) can be important in some contexts. Drainage fromthe soil profile is the primary source of recharge for many groundwater systems,and capillary rise from shallow groundwater tables can be an important source ofwater replenishing the soil water store during drier periods.
Included in Figure 3a is a series of soil moisture profiles measured for a clay-loam soil in Victoria, Australia. Both the amount of soil moisture and its dynamicschange with depth. In the upper 50 cm, soil moisture is strongly influenced bythe fluxes between the active root zone and the atmosphere; the moisture hereis more variable than the moisture at depth. Surface soil moisture also responds
Ann
u. R
ev. E
arth
Pla
net.
Sci.
2002
.30:
149-
180.
Dow
nloa
ded
from
arj
ourn
als.
annu
alre
view
s.or
gby
Uni
vers
ity o
f C
olor
ado
- B
ould
er o
n 08
/22/
10. F
or p
erso
nal u
se o
nly.
20 Mar 2002 7:47 AR AR154-06.tex AR154-06.SGM LaTeX2e(2001/05/10)P1: GSR
154 WESTERN ¥ GRAYSON ¥ BLOSCHL
Figure 3 (a) One-dimensional conceptualization of fluxes affecting soil moisture. This isapplicable where lateral flows are insignificant. Also shown are the surface energy fluxes.The soil moisture-depth profiles are from the Tarrawarra catchment, Australia. (b) A two-dimensional conceptualization of fluxes affecting soil moisture.
Ann
u. R
ev. E
arth
Pla
net.
Sci.
2002
.30:
149-
180.
Dow
nloa
ded
from
arj
ourn
als.
annu
alre
view
s.or
gby
Uni
vers
ity o
f C
olor
ado
- B
ould
er o
n 08
/22/
10. F
or p
erso
nal u
se o
nly.
20 Mar 2002 7:47 AR AR154-06.tex AR154-06.SGM LaTeX2e(2001/05/10)P1: GSR
SCALING OF SOIL MOISTURE 155
more quickly and so has both short and long timescale variability, whereas themoisture at depth is less responsive to short term variations in the fluxes across thesoil-atmosphere interface.
Figure 3b illustrates a standard conceptualization of a hillslope. The key dif-ference between Figure 3a and 3b is that lateral flows now act to redistribute soilwater and influence runoff processes. For significant lateral drainage to occur thefollowing conditions are necessary.
■ Topographic relief (surface slopes greater than a few percent).■ An impeding layer in the soil profile limiting vertical drainage [or anisotropy
between vertical and horizontal hydraulic conductivities (Zavlasky & Sinai1981)].
■ Sufficiently high moisture contents for periods long enough for flow to occurover significant distances.
In higher parts of the landscape lateral drainage can deplete the soil moisturestore. This lateral drainage collects in convergent parts of the hillslope (the hollows)and replenishes the soil moisture store in those areas, often leading to soil saturationand generation of saturation excess runoff. It is important to emphasize that theexistence of lateral flow depends on the above conditions, which only occur insome landscapes and at some times.
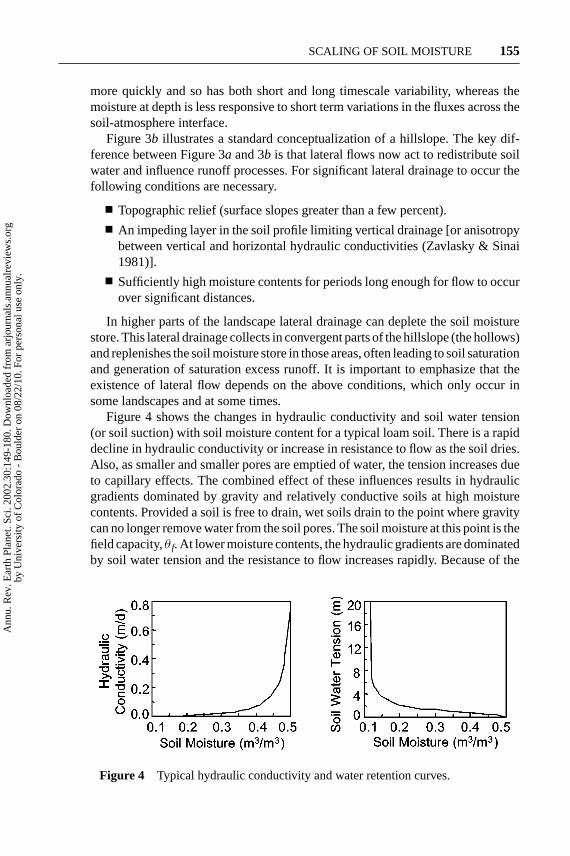
Figure 4 shows the changes in hydraulic conductivity and soil water tension(or soil suction) with soil moisture content for a typical loam soil. There is a rapiddecline in hydraulic conductivity or increase in resistance to flow as the soil dries.Also, as smaller and smaller pores are emptied of water, the tension increases dueto capillary effects. The combined effect of these influences results in hydraulicgradients dominated by gravity and relatively conductive soils at high moisturecontents. Provided a soil is free to drain, wet soils drain to the point where gravitycan no longer remove water from the soil pores. The soil moisture at this point is thefield capacity,θ f. At lower moisture contents, the hydraulic gradients are dominatedby soil water tension and the resistance to flow increases rapidly. Because of the
Figure 4 Typical hydraulic conductivity and water retention curves.
Ann
u. R
ev. E
arth
Pla
net.
Sci.
2002
.30:
149-
180.
Dow
nloa
ded
from
arj
ourn
als.
annu
alre
view
s.or
gby
Uni
vers
ity o
f C
olor
ado
- B
ould
er o
n 08
/22/
10. F
or p
erso
nal u
se o
nly.
20 Mar 2002 7:47 AR AR154-06.tex AR154-06.SGM LaTeX2e(2001/05/10)P1: GSR
156 WESTERN ¥ GRAYSON ¥ BLOSCHL
rapidly decreasing flow velocities as soil dries, the spatial scale at which soilwater flow processes operate is very much smaller for dry soils than for wet soils.The changes in soil water tension also affect evapotranspiration by increasing theenergy required to extract water from the soil as soil moisture decreases. This leadsto a marked reduction in evapotranspiration under dry conditions. Eventually thetension becomes so large that plants can no longer extract water from the soiland they wilt. This soil moisture content is referred to as the wilting point,θw.The plant-available water (paw) is the soil water storage capacity that is readilyavailable to plants.Paw = (θ f − θw)D, whereD is the depth of soil exploited bythe plant roots.
It is important to realize that typical soil hydraulic conductivity curves, such asthat shown in Figure 4a, often neglect the effects of plant roots and other soil biotain creating macropores that can transmit water rapidly through the soil profile,effectively bypassing the soil matrix under certain conditions (Beven & Germann1982). Soil cracks can also be important in conveying water rapidly in both thevertical and horizontal directions (Western & Grayson 2000).
The change in evapotranspiration with moisture content has important implica-tions for both the moisture and energy fluxes involved in the interaction betweenthe atmosphere and the land surface. The surface energy balance components areshown in Figure 3a in addition to the moisture fluxes. The energy and moisturefluxes are intimately linked together via the evapotranspiration process. When soilmoisture is evapotranspired a phase change from liquid water to water vapor oc-curs. The moisture flux,E, and latent heat flux,λ, are linked by the latent heat ofvaporization of waterxsuch thatλ = xE. Soil moisture availability, in conjunctionwith atmospheric conditions, controls the evapotranspiration and the partitioningof incoming solar energy into latent and sensible heat fluxes. Because of the ef-fects on atmospheric heating and the atmospheric moisture content, land-surfaceinteraction and the role of soil moisture in this interaction have become an area ofgreat interest to atmospheric modelers. Improving our understanding in this areahas motivated, and will continue to motivate, a series of major interdisciplinarystudies, many of which are coordinated under GEWEX (Global Water and En-ergy Cycle Experiment—see http://www.gewex.com/). Scaling of soil moisture isespecially important for these studies because much of our understanding of soilmoisture and related processes is based on point and small catchment studies, butatmospheric modeling requires land-surface predictions over large 5–500-km gridsizes and global extents.
MEASUREMENT OF SOIL MOISTURE
Soil moisture is a difficult quantity to measure in a comprehensive manner. Thereare essentially two groups of approaches to moisture measurement; remote sens-ing and ground-based measurements. The data collected using each of these ap-proaches have quite different scale characteristics.
Ann
u. R
ev. E
arth
Pla
net.
Sci.
2002
.30:
149-
180.
Dow
nloa
ded
from
arj
ourn
als.
annu
alre
view
s.or
gby
Uni
vers
ity o
f C
olor
ado
- B
ould
er o
n 08
/22/
10. F
or p
erso
nal u
se o
nly.
20 Mar 2002 7:47 AR AR154-06.tex AR154-06.SGM LaTeX2e(2001/05/10)P1: GSR
SCALING OF SOIL MOISTURE 157
Remote Sensing Measurement
Most remote sensing of soil moisture has concentrated on using microwave wave-lengths (Dobson & Ulaby 1998, Engman 2000, Jackson et al. 1996). Both active[e.g., synthetic aperture radar (SAR), where a signal is sent from the sensor and thereturned signal measured] and passive (e.g., microwave radiometers that measurethe naturally emitted microwave radiation) have been used. These instruments re-spond to soil moisture in the top few mm to few cm of the soil profile, dependingon the exact wavelength used, so long as the vegetation canopy is not too dense (Duet al. 2000). Compared with instruments using visible and infrared wavelengths,microwave instruments have the advantage of “seeing through” cloudy conditions(Engman 2000). From a user’s perspective, the most fundamental difference be-tween these instruments is their spatial and temporal resolution. As implementedat the present time on satellites (or spaceborne), SAR provides data with pixel sizesof roughly 10 m, although some aggregation is required to overcome the problemof noise due to speckle. This increases the effective pixel size at which sensibleinterpretations of soil moisture can be made to roughly 100 m (A.W. Western,T. Sadek, R.B. Grayson, H.N. Turral, in review). Spaceborne SAR imagery has atypical repeat time of about two weeks. In contrast to SAR, spaceborne microwaveradiometer instruments have spatial resolutions of tens of km, that is three orders ofmagnitude coarser than SAR, but coverage is repeated daily. Airborne microwaveradiometers including ESTAR (electronically scanned thinned array radiometer)and PBMR (push broom microwave radiometer) have been used quite extensivelyto map soil moisture at pixel sizes of hundreds of m during large-scale field experi-ments such as FIFE, MONSOON90, Washita 92 (Jackson et al. 1996), and SGP97(Jackson et al. 1999).
Several important practical issues for operational measurement of soil moistureexist. These are primarily related to the fact that the microwave signal responds tothe dielectric constant (largely determined by soil moisture), soil surface rough-ness, and the vegetation canopy (Dobson & Ulaby 1998, Jackson et al.1996). Thismeans that several pieces of information are required to extract an estimate of soilmoisture from the signal. Either this extra information can be preexisting mappingor it can be remotely sensed; however, because the vegetation and soil roughnessare dynamic characteristics, at least some generally need to be remotely sensed.
Another important limitation of microwave remote sensing is that the instru-ments respond only to near surface soil moisture, not to the soil water stores ofmost interest to hydrologists, which are the root zone and the whole profile. Oneapproach to overcome this limitation is to assimilate a series of surface soil mois-ture measurements into a soil moisture model, thereby estimating the moistureprofile (Entekhabi et al. 1994, Walker et al. 2001), although the accuracy will behighly dependent on the validity of the models.
Another option is to use thermal remote sensing to measure land surface tem-perature and to infer evapotranspiration rates via a surface energy balance model(e.g., Bastiaanssen et al. 1998). Because the evapotranspiration response dependsto some extent on root zone moisture availability, this can provide semiquantitative
Ann
u. R
ev. E
arth
Pla
net.
Sci.
2002
.30:
149-
180.
Dow
nloa
ded
from
arj
ourn
als.
annu
alre
view
s.or
gby
Uni
vers
ity o
f C
olor
ado
- B
ould
er o
n 08
/22/
10. F
or p
erso
nal u
se o
nly.
20 Mar 2002 7:47 AR AR154-06.tex AR154-06.SGM LaTeX2e(2001/05/10)P1: GSR
158 WESTERN ¥ GRAYSON ¥ BLOSCHL
information on soil moisture availability; however, this approach can only be ap-plied during cloud-free conditions, and it is unlikely to provide the same degreeof quantification of absolute soil moisture content as microwave techniques.
Ground-Based Measurement
Ground-based soil moisture measurements will provide more precise soil moisturedata than remote sensing in the foreseeable future, provided appropriate calibra-tion of instruments is performed. It also allows measurement of soil moistureover depths of more interest to hydrologists than does remote sensing. Standardtechniques include thermogravimetric determination, neutron scattering, and mea-surement of dielectric properties of the soil. One example of the latter method istime domain reflectometry (TDR). Modern sensor and logging technology allowroutine monitoring at points, and the Global Positioning System allows accuratelocation of roving instruments such as the University of Melbourne’s Terrain DataAcquisition System (TDAS) (Tyndale-Biscoe et al. 1998, Western & Grayson1998). Highly detailed temporal and spatial soil moisture data sets such as thosefrom Tarrawarra (Western & Grayson 1998) and MARVEX (Woods et al. 2001)can be collected with these systems, but logistical considerations mean it is onlypossible to study small areas (generally<1 km2).
All of the common ground-based soil moisture measurement techniques havevery small supports, typically from 1 cm to 10 cm. This is three to six orders ofmagnitude smaller than remote sensing measurements, and it enables collectionof more highly detailed spatial information than does remote sensing. However,spacing between permanently installed moisture sensors varies widely, from metersup to hundreds of km, depending on experimental objectives. This means that,unlike remotely sensed soil moisture patterns, moisture contents are measured ina very small proportion of a study area. Another key difference between ground-based techniques and remote sensing is that ground-based sensors can be loggedproviding detailed temporal patterns at a point, whereas remote sensing typicallyprovides spatial patterns at points in time.
There is a substantial amount of spatial variability in soil moisture. Given thesmall support and large spacing of ground-based techniques, interpretation of thedata is challenging. Two possibilities exist. The first is to make a large numberof measurements with sufficiently high spatial resolution to define the spatialvariability or the spatial pattern (Western & Grayson 1998). The second is to relatethe point scale measurements to areal soil moisture, a promising possibility thathas been studied by Grayson & Western (1998), Kachanoski & de Jong (1988), andVachaud et al. (1985). To be practical, such an approach requires that a predictabletime-stable relationship exist between point soil moisture and the spatial mean.
Remote sensing and ground-based measurement methods are in many wayscomplementary. Remote sensing provides excellent spatial coverage over largeareas, but the shallow measurement depth, confounding influence of vegetation(and surface roughness for SAR), indirect nature of the method, and relatively
Ann
u. R
ev. E
arth
Pla
net.
Sci.
2002
.30:
149-
180.
Dow
nloa
ded
from
arj
ourn
als.
annu
alre
view
s.or
gby
Uni
vers
ity o
f C
olor
ado
- B
ould
er o
n 08
/22/
10. F
or p
erso
nal u
se o
nly.
20 Mar 2002 7:47 AR AR154-06.tex AR154-06.SGM LaTeX2e(2001/05/10)P1: GSR
SCALING OF SOIL MOISTURE 159
infrequent repeat cycles make use of the data problematic. On the other hand,ground-based methods can be applied over any depth, accurately calibrated, andlogged at any time scale, but are essentially point measurements, making spatialinterpretation difficult. It is obvious that future work should focus on combiningthese two data sources to exploit their complementary features.
SCALING OF SOIL MOISTURE
In any problem it is important to be clear on the objectives of the scaling exercise.Where spatially or temporally variable quantities are important, there is a rangeof characteristics that can characterize the variation. One possible classification isgiven below, approximately in order of increasing detail. Some example applica-tions of each piece of information are then given in the context of spatial soil mois-ture. It should be noted that all but the first of these is scale dependent. How far weneed to progress down this list for any given problem will depend on our objectives.
■ Central tendency (i.e., mean, median, etc.)■ Spread (i.e., variance, interquartile range, etc.)■ Extremes (i.e., percentage above or below a threshold, a high or low per-
centile)■ Probability density function (pdf )■ Spatial (or temporal) relationships [correlation functions or variograms and
cross-correlations or covariograms with, say, terrain, connectivity (see be-low)]
■ The actual pattern
The most fundamental problem in hydrology is to understand the water balance.Making measurements of the fluxes in and out of a soil profile is possible withvarying degrees of accuracy. To close the water balance, the change in the amountof soil water and hence the mean soil moisture at the start and end of a period isrequired. If this change in soil moisture is to be measured to some specified accu-racy, knowledge of the variance is also required to calculate the required number ofsampling points. In the absence of spatial correlation between measurements, thiscan be done using standard statistical approaches based on Student’s t distribution.
An important runoff process in many landscapes is saturation excess runoff,which is runoff generated from areas of saturated soil. To predict this runoff we needto know about the wet extreme of the soil moisture distribution; specifically we wantto know about the percentage of area with soil moisture above a threshold valueclose to porosity. It is likely that one would also need to know the mean moistureand possibly the variance if one needed to predict (rather than measure) this area.Evapotranspiration processes depend on soil moisture in a nonlinear manner, andthis can lead to important scale effects in atmospheric models (Giorgi & Avissar1997, Pielke 2001). One way in which the variability of soil moisture could be
Ann
u. R
ev. E
arth
Pla
net.
Sci.
2002
.30:
149-
180.
Dow
nloa
ded
from
arj
ourn
als.
annu
alre
view
s.or
gby
Uni
vers
ity o
f C
olor
ado
- B
ould
er o
n 08
/22/
10. F
or p
erso
nal u
se o
nly.
20 Mar 2002 7:47 AR AR154-06.tex AR154-06.SGM LaTeX2e(2001/05/10)P1: GSR
160 WESTERN ¥ GRAYSON ¥ BLOSCHL
accounted for in this situation is to integrate the evapotranspiration processes overthe area using the probability density function of the soil moisture as input in themanner suggested by Beven (1995). This would provide the mean flux and thespatial variability in the flux, both of which may be important for atmosphericprocesses.
There are a variety of reasons for which one may wish to know about spatialrelationships relevant to soil moisture that are discussed in more detail below. Oneexample is for predicting the change in subgrid variance due to changing the gridsize in a model that parameterizes the effects of subgrid variability in soil moistureusing the variance. If the correlation function is known, the technique of regular-ization (discussed later) can then be employed to predict this change in variance.
The most complete description of the variation in soil moisture in space is toknow the actual spatial pattern. If the actual pattern is known, then all the pre-ceding characteristics can be estimated from the data. It is rare to know the actualpattern of soil moisture from readily interpretable measurements. Actual patternsof soil moisture can provide initial conditions for, or spatial data for testing of,distributed hydrologic models, although most often such patterns are estimatedthrough some scaling analysis. Recently, actual patterns have been used to testdistributed models and they have been found to be extremely valuable in assess-ing model performance (Grayson & Bl¨oschl 2000) particularly for soil moisture(Western & Grayson 2000).
TEMPORAL SCALING
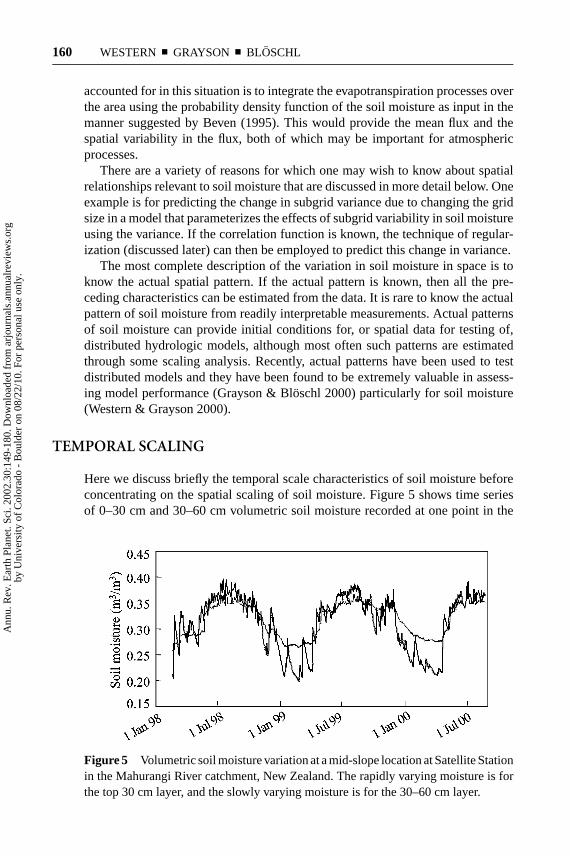
Here we discuss briefly the temporal scale characteristics of soil moisture beforeconcentrating on the spatial scaling of soil moisture. Figure 5 shows time seriesof 0–30 cm and 30–60 cm volumetric soil moisture recorded at one point in the
Figure 5 Volumetric soil moisture variation at a mid-slope location at Satellite Stationin the Mahurangi River catchment, New Zealand. The rapidly varying moisture is forthe top 30 cm layer, and the slowly varying moisture is for the 30–60 cm layer.
Ann
u. R
ev. E
arth
Pla
net.
Sci.
2002
.30:
149-
180.
Dow
nloa
ded
from
arj
ourn
als.
annu
alre
view
s.or
gby
Uni
vers
ity o
f C
olor
ado
- B
ould
er o
n 08
/22/
10. F
or p
erso
nal u
se o
nly.
20 Mar 2002 7:47 AR AR154-06.tex AR154-06.SGM LaTeX2e(2001/05/10)P1: GSR
SCALING OF SOIL MOISTURE 161
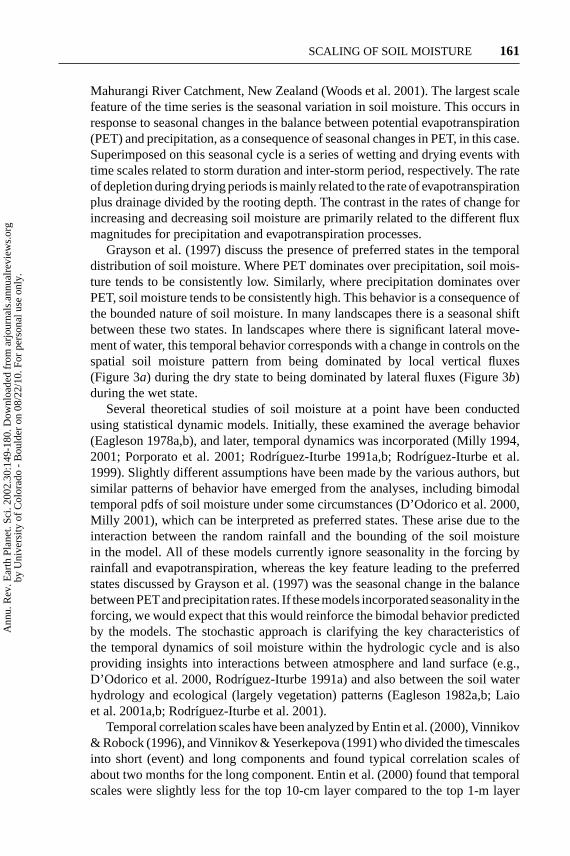
Mahurangi River Catchment, New Zealand (Woods et al. 2001). The largest scalefeature of the time series is the seasonal variation in soil moisture. This occurs inresponse to seasonal changes in the balance between potential evapotranspiration(PET) and precipitation, as a consequence of seasonal changes in PET, in this case.Superimposed on this seasonal cycle is a series of wetting and drying events withtime scales related to storm duration and inter-storm period, respectively. The rateof depletion during drying periods is mainly related to the rate of evapotranspirationplus drainage divided by the rooting depth. The contrast in the rates of change forincreasing and decreasing soil moisture are primarily related to the different fluxmagnitudes for precipitation and evapotranspiration processes.
Grayson et al. (1997) discuss the presence of preferred states in the temporaldistribution of soil moisture. Where PET dominates over precipitation, soil mois-ture tends to be consistently low. Similarly, where precipitation dominates overPET, soil moisture tends to be consistently high. This behavior is a consequence ofthe bounded nature of soil moisture. In many landscapes there is a seasonal shiftbetween these two states. In landscapes where there is significant lateral move-ment of water, this temporal behavior corresponds with a change in controls on thespatial soil moisture pattern from being dominated by local vertical fluxes(Figure 3a) during the dry state to being dominated by lateral fluxes (Figure 3b)during the wet state.
Several theoretical studies of soil moisture at a point have been conductedusing statistical dynamic models. Initially, these examined the average behavior(Eagleson 1978a,b), and later, temporal dynamics was incorporated (Milly 1994,2001; Porporato et al. 2001; Rodr´ıguez-Iturbe 1991a,b; Rodr´ıguez-Iturbe et al.1999). Slightly different assumptions have been made by the various authors, butsimilar patterns of behavior have emerged from the analyses, including bimodaltemporal pdfs of soil moisture under some circumstances (D’Odorico et al. 2000,Milly 2001), which can be interpreted as preferred states. These arise due to theinteraction between the random rainfall and the bounding of the soil moisturein the model. All of these models currently ignore seasonality in the forcing byrainfall and evapotranspiration, whereas the key feature leading to the preferredstates discussed by Grayson et al. (1997) was the seasonal change in the balancebetween PET and precipitation rates. If these models incorporated seasonality in theforcing, we would expect that this would reinforce the bimodal behavior predictedby the models. The stochastic approach is clarifying the key characteristics ofthe temporal dynamics of soil moisture within the hydrologic cycle and is alsoproviding insights into interactions between atmosphere and land surface (e.g.,D’Odorico et al. 2000, Rodr´ıguez-Iturbe 1991a) and also between the soil waterhydrology and ecological (largely vegetation) patterns (Eagleson 1982a,b; Laioet al. 2001a,b; Rodr´ıguez-Iturbe et al. 2001).
Temporal correlation scales have been analyzed by Entin et al. (2000), Vinnikov& Robock (1996), and Vinnikov & Yeserkepova (1991) who divided the timescalesinto short (event) and long components and found typical correlation scales ofabout two months for the long component. Entin et al. (2000) found that temporalscales were slightly less for the top 10-cm layer compared to the top 1-m layer
Ann
u. R
ev. E
arth
Pla
net.
Sci.
2002
.30:
149-
180.
Dow
nloa
ded
from
arj
ourn
als.
annu
alre
view
s.or
gby
Uni
vers
ity o
f C
olor
ado
- B
ould
er o
n 08
/22/
10. F
or p
erso
nal u
se o
nly.
30 Mar 2002 8:17 AR AR154-06.tex AR154-06.SGM LaTeX2e(2001/05/10)P1: GSR
162 WESTERN ¥ GRAYSON ¥ BLOSCHL
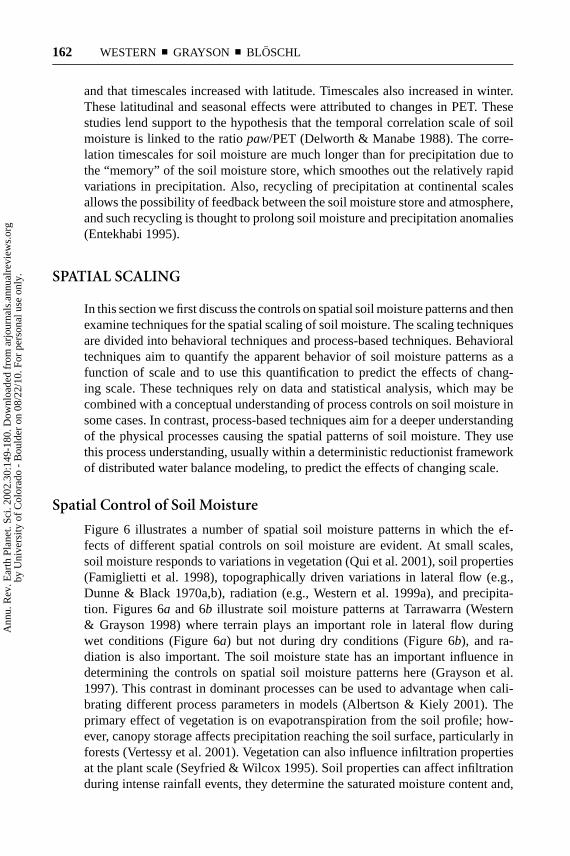
and that timescales increased with latitude. Timescales also increased in winter.These latitudinal and seasonal effects were attributed to changes in PET. Thesestudies lend support to the hypothesis that the temporal correlation scale of soilmoisture is linked to the ratiopaw/PET (Delworth & Manabe 1988). The corre-lation timescales for soil moisture are much longer than for precipitation due tothe “memory” of the soil moisture store, which smoothes out the relatively rapidvariations in precipitation. Also, recycling of precipitation at continental scalesallows the possibility of feedback between the soil moisture store and atmosphere,and such recycling is thought to prolong soil moisture and precipitation anomalies(Entekhabi 1995).
SPATIAL SCALING
In this section we first discuss the controls on spatial soil moisture patterns and thenexamine techniques for the spatial scaling of soil moisture. The scaling techniquesare divided into behavioral techniques and process-based techniques. Behavioraltechniques aim to quantify the apparent behavior of soil moisture patterns as afunction of scale and to use this quantification to predict the effects of chang-ing scale. These techniques rely on data and statistical analysis, which may becombined with a conceptual understanding of process controls on soil moisture insome cases. In contrast, process-based techniques aim for a deeper understandingof the physical processes causing the spatial patterns of soil moisture. They usethis process understanding, usually within a deterministic reductionist frameworkof distributed water balance modeling, to predict the effects of changing scale.
Spatial Control of Soil Moisture
Figure 6 illustrates a number of spatial soil moisture patterns in which the ef-fects of different spatial controls on soil moisture are evident. At small scales,soil moisture responds to variations in vegetation (Qui et al. 2001), soil properties(Famiglietti et al. 1998), topographically driven variations in lateral flow (e.g.,Dunne & Black 1970a,b), radiation (e.g., Western et al. 1999a), and precipita-tion. Figures 6a and 6b illustrate soil moisture patterns at Tarrawarra (Western& Grayson 1998) where terrain plays an important role in lateral flow duringwet conditions (Figure 6a) but not during dry conditions (Figure 6b), and ra-diation is also important. The soil moisture state has an important influence indetermining the controls on spatial soil moisture patterns here (Grayson et al.1997). This contrast in dominant processes can be used to advantage when cali-brating different process parameters in models (Albertson & Kiely 2001). Theprimary effect of vegetation is on evapotranspiration from the soil profile; how-ever, canopy storage affects precipitation reaching the soil surface, particularly inforests (Vertessy et al. 2001). Vegetation can also influence infiltration propertiesat the plant scale (Seyfried & Wilcox 1995). Soil properties can affect infiltrationduring intense rainfall events, they determine the saturated moisture content and,
Ann
u. R
ev. E
arth
Pla
net.
Sci.
2002
.30:
149-
180.
Dow
nloa
ded
from
arj
ourn
als.
annu
alre
view
s.or
gby
Uni
vers
ity o
f C
olor
ado
- B
ould
er o
n 08
/22/
10. F
or p
erso
nal u
se o
nly.

20 Mar 2002 7:47 AR AR154-06.tex AR154-06.SGM LaTeX2e(2001/05/10)P1: GSR
SCALING OF SOIL MOISTURE 163
in conjunction with the vegetation, the wilting point. They also influence drainage(both vertical and lateral). Figure 6cshows a soil moisture pattern on sandy soils atPoint Nepean, Australia, where consistently high soil moisture is associated withareas of finer soils in the center and on the east side of the sampling area.
As the spatial scale increases, different sources of variation become apparent.Variation in vegetation shifts from the plant to the patch to the community scale.Some vegetation communities are associated with changes in moisture availability,for example riparian vegetation. Soil properties vary as different soil types andgeologies are encountered. Figures 6d and 6eshow soil texture and a soil moisturepattern respectively, measured on June 18, 1997, using ESTAR during SGP97(Jackson et al. 1999). The correlation between soil texture and surface soil moistureis clearly evident. Variations in rainfall can occur at spatial scales as small ashundreds of meters due to the passage of storm cells (Goodrich et al. 1995);however, the long-term effect on soil moisture variability may be at a larger spacescale as the soil store integrates precipitation over time and thus smoothes someof the spatial and temporal variation in instantaneous rainfall rates. Certainly atspatial scales of kms, examples of soil moisture variability due to spatial variabilityin event rainfall depth can be found. Figure 6f shows the effect of rainfall patternon soil moisture on June 30, 1997 during the SGP97 field experiment (Jacksonet al. 1999).
At still larger scales, climatic variations in precipitation lead to substantialchanges in general soil moisture conditions between climate regions. Variation inhumidity, temperature and radiation also affect soil moisture through the evapo-transpiration process. Figures 6g and 6h show the pattern of maximum vegetationgreenness (a measure of vigor of vegetation growth) across Australia during 1996and 2000, mapped using data from AVHRR (advanced very high resolution ra-diometer). Climatic impacts are clear, with inland Australia generally having lowamounts of vegetation due to low precipitation and soil moisture. The interannualvariation in vegetation is also clear. This is a response to variation in precipitationand moisture availability between 1996 and 2000. 1996 was a dry year in cen-tral Australia and wet in the Southeast and Southwest, whereas 2000 was a wetyear with significant rainfall over large areas of inland Australia, but drier in theSoutheast and Southwest.
All of the factors affecting the distribution of soil moisture mentioned above arecorrelated in space to some degree. For example, rainfall is likely to be more similarfor two points 1 m apart than for two points 1 km apart. These spatial correlationsintroduce spatial correlations into the soil moisture pattern. In addition lateralredistribution of soil water enhances spatial variation and correlation.
Behavioral Scaling Techniques
In this section we review results relating to the statistical distribution of spatialsoil moisture, spatial correlation of soil moisture, and relationships between soilmoisture and surrogate variables. The joint use of the latter two for spatial inter-polation is discussed at the end of the section. All of these characterize different
Ann
u. R
ev. E
arth
Pla
net.
Sci.
2002
.30:
149-
180.
Dow
nloa
ded
from
arj
ourn
als.
annu
alre
view
s.or
gby
Uni
vers
ity o
f C
olor
ado
- B
ould
er o
n 08
/22/
10. F
or p
erso
nal u
se o
nly.
20 Mar 2002 7:47 AR AR154-06.tex AR154-06.SGM LaTeX2e(2001/05/10)P1: GSR
164 WESTERN ¥ GRAYSON ¥ BLOSCHL
aspects of the statistical behavior of soil moisture, although sensible selection ofsurrogate variables enables consideration of the physical processes controlling thespatial pattern of soil moisture.
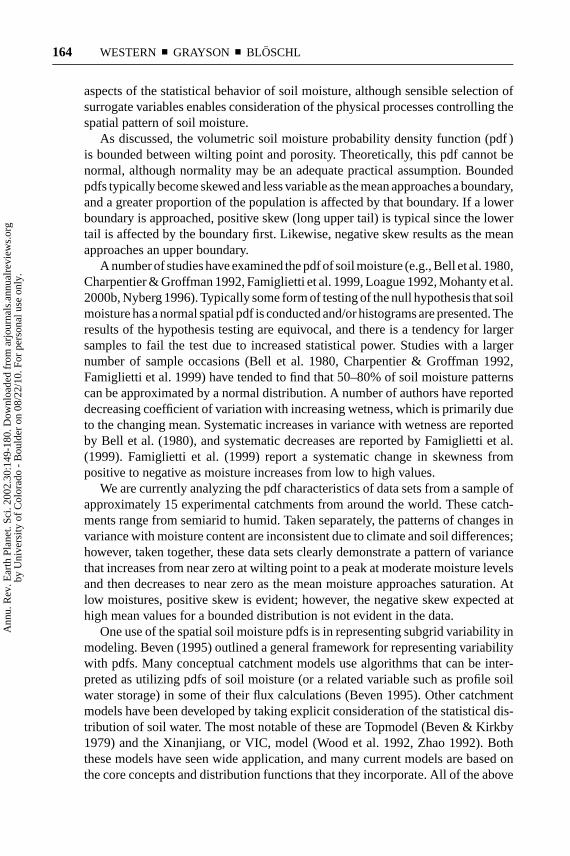
As discussed, the volumetric soil moisture probability density function (pdf )is bounded between wilting point and porosity. Theoretically, this pdf cannot benormal, although normality may be an adequate practical assumption. Boundedpdfs typically become skewed and less variable as the mean approaches a boundary,and a greater proportion of the population is affected by that boundary. If a lowerboundary is approached, positive skew (long upper tail) is typical since the lowertail is affected by the boundary first. Likewise, negative skew results as the meanapproaches an upper boundary.
A number of studies have examined the pdf of soil moisture (e.g., Bell et al. 1980,Charpentier & Groffman 1992, Famiglietti et al. 1999, Loague 1992, Mohanty et al.2000b, Nyberg 1996). Typically some form of testing of the null hypothesis that soilmoisture has a normal spatial pdf is conducted and/or histograms are presented. Theresults of the hypothesis testing are equivocal, and there is a tendency for largersamples to fail the test due to increased statistical power. Studies with a largernumber of sample occasions (Bell et al. 1980, Charpentier & Groffman 1992,Famiglietti et al. 1999) have tended to find that 50–80% of soil moisture patternscan be approximated by a normal distribution. A number of authors have reporteddecreasing coefficient of variation with increasing wetness, which is primarily dueto the changing mean. Systematic increases in variance with wetness are reportedby Bell et al. (1980), and systematic decreases are reported by Famiglietti et al.(1999). Famiglietti et al. (1999) report a systematic change in skewness frompositive to negative as moisture increases from low to high values.
We are currently analyzing the pdf characteristics of data sets from a sample ofapproximately 15 experimental catchments from around the world. These catch-ments range from semiarid to humid. Taken separately, the patterns of changes invariance with moisture content are inconsistent due to climate and soil differences;however, taken together, these data sets clearly demonstrate a pattern of variancethat increases from near zero at wilting point to a peak at moderate moisture levelsand then decreases to near zero as the mean moisture approaches saturation. Atlow moistures, positive skew is evident; however, the negative skew expected athigh mean values for a bounded distribution is not evident in the data.
One use of the spatial soil moisture pdfs is in representing subgrid variability inmodeling. Beven (1995) outlined a general framework for representing variabilitywith pdfs. Many conceptual catchment models use algorithms that can be inter-preted as utilizing pdfs of soil moisture (or a related variable such as profile soilwater storage) in some of their flux calculations (Beven 1995). Other catchmentmodels have been developed by taking explicit consideration of the statistical dis-tribution of soil water. The most notable of these are Topmodel (Beven & Kirkby1979) and the Xinanjiang, or VIC, model (Wood et al. 1992, Zhao 1992). Boththese models have seen wide application, and many current models are based onthe core concepts and distribution functions that they incorporate. All of the above
Ann
u. R
ev. E
arth
Pla
net.
Sci.
2002
.30:
149-
180.
Dow
nloa
ded
from
arj
ourn
als.
annu
alre
view
s.or
gby
Uni
vers
ity o
f C
olor
ado
- B
ould
er o
n 08
/22/
10. F
or p
erso
nal u
se o
nly.
20 Mar 2002 7:47 AR AR154-06.tex AR154-06.SGM LaTeX2e(2001/05/10)P1: GSR
SCALING OF SOIL MOISTURE 165
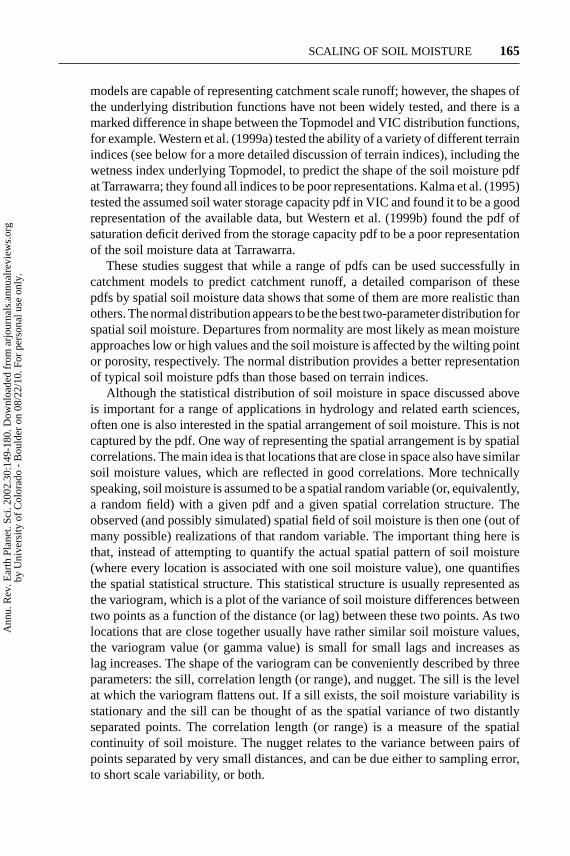
models are capable of representing catchment scale runoff; however, the shapes ofthe underlying distribution functions have not been widely tested, and there is amarked difference in shape between the Topmodel and VIC distribution functions,for example. Western et al. (1999a) tested the ability of a variety of different terrainindices (see below for a more detailed discussion of terrain indices), including thewetness index underlying Topmodel, to predict the shape of the soil moisture pdfat Tarrawarra; they found all indices to be poor representations. Kalma et al. (1995)tested the assumed soil water storage capacity pdf in VIC and found it to be a goodrepresentation of the available data, but Western et al. (1999b) found the pdf ofsaturation deficit derived from the storage capacity pdf to be a poor representationof the soil moisture data at Tarrawarra.
These studies suggest that while a range of pdfs can be used successfully incatchment models to predict catchment runoff, a detailed comparison of thesepdfs by spatial soil moisture data shows that some of them are more realistic thanothers. The normal distribution appears to be the best two-parameter distribution forspatial soil moisture. Departures from normality are most likely as mean moistureapproaches low or high values and the soil moisture is affected by the wilting pointor porosity, respectively. The normal distribution provides a better representationof typical soil moisture pdfs than those based on terrain indices.
Although the statistical distribution of soil moisture in space discussed aboveis important for a range of applications in hydrology and related earth sciences,often one is also interested in the spatial arrangement of soil moisture. This is notcaptured by the pdf. One way of representing the spatial arrangement is by spatialcorrelations. The main idea is that locations that are close in space also have similarsoil moisture values, which are reflected in good correlations. More technicallyspeaking, soil moisture is assumed to be a spatial random variable (or, equivalently,a random field) with a given pdf and a given spatial correlation structure. Theobserved (and possibly simulated) spatial field of soil moisture is then one (out ofmany possible) realizations of that random variable. The important thing here isthat, instead of attempting to quantify the actual spatial pattern of soil moisture(where every location is associated with one soil moisture value), one quantifiesthe spatial statistical structure. This statistical structure is usually represented asthe variogram, which is a plot of the variance of soil moisture differences betweentwo points as a function of the distance (or lag) between these two points. As twolocations that are close together usually have rather similar soil moisture values,the variogram value (or gamma value) is small for small lags and increases aslag increases. The shape of the variogram can be conveniently described by threeparameters: the sill, correlation length (or range), and nugget. The sill is the levelat which the variogram flattens out. If a sill exists, the soil moisture variability isstationary and the sill can be thought of as the spatial variance of two distantlyseparated points. The correlation length (or range) is a measure of the spatialcontinuity of soil moisture. The nugget relates to the variance between pairs ofpoints separated by very small distances, and can be due either to sampling error,to short scale variability, or both.
Ann
u. R
ev. E
arth
Pla
net.
Sci.
2002
.30:
149-
180.
Dow
nloa
ded
from
arj
ourn
als.
annu
alre
view
s.or
gby
Uni
vers
ity o
f C
olor
ado
- B
ould
er o
n 08
/22/
10. F
or p
erso
nal u
se o
nly.

20 Mar 2002 7:47 AR AR154-06.tex AR154-06.SGM LaTeX2e(2001/05/10)P1: GSR
166 WESTERN ¥ GRAYSON ¥ BLOSCHL
There are two main applications of spatial soil moisture statistics; descriptiveand predictive. In the first, one calculates the variogram from field data to coalescethe field information into one single curve, which is easier to interpret than a largeset of data points. This is a behavioral (or phenomenological) approach that aims torepresent the overall effect of the spatial soil moisture processes in terms of spatialcontinuity. From knowledge of the spatial continuity (i.e., the spatial correlationlength), one then infers what the important processes dominating the hydrologicresponse in a certain environment may be. Western et al. (1998, 1999a) and Graysonet al. (1997) have shown that this is indeed possible, as they were able to capturethe switch over from mainly vertical soil moisture redistribution (associated withlong correlation lengths and differences in radiation between hillslopes) to lateralsoil moisture redistribution (associated with short correlation lengths and watermovement down a hillslope) in a small humid catchment in Southeast Australia,and there are a number of other studies that have also linked spatial soil moisturestatistics with process (Fitzjohn et al. 1998, Nyberg 1996).
In a predictive mode, one can use the spatial correlation structure for solving anumber of spatial estimation problems. These are, among others, calculating spa-tial fields of soil moisture from a few point observations [i.e., interpolation basedon geostatistical techniques such as kriging, (e.g., B´ardossy & Lehmann 1998)];correcting for measurement error of field measurements (based on similar geosta-tistical techniques); simulating spatial fields of soil moisture without data [basedon stochastic simulation techniques such as the turning bands method (Mantoglou& Wilson 1981) and sequential Gaussian simulations (Deutsch & Journel 1997)];and estimating the change in variance one would expect when aggregating (orchanging the support of) data or a model (based on regularization). Additionally,most of these techniques can be used in conjunction with covariates (or auxiliaryvariables) that are related to soil moisture and are sometimes used to improve thespatial soil moisture estimates (see below). As two of the methods are particularlyrelevant to soil moisture scaling, we discuss them here in more detail.
Spatial interpolation, based on geostatistical concepts, consists of two phases.In the first phase (termed structural analysis) a variogram is estimated from theobserved data. This is done by plotting the sample variogram and fitting a smoothfunction, known as the theoretical variogram, which is assumed to be the vari-ogram of the population. There are a number of functions that can be used for thetheoretical variogram, but it is common to use an exponential function or a powerlaw function. In the second phase, a spatial pattern is estimated from both the dataand the characteristics of the variogram, based on best linear unbiased estimation(BLUE). BLUE implies a linear combination of all of the measurements with adifferent weight for each measurement calculated such that the mean of the dataand the mean of the interpolated pattern are identical (unbiased), and the varianceof the estimation error is minimized (best). There is a wide range of geostatisti-cal estimation methods that differ in the assumptions about the way the randomfunction varies spatially and in the way they are constrained by other informa-tion, resulting in different levels of complexity of the interpolation method. One
Ann
u. R
ev. E
arth
Pla
net.
Sci.
2002
.30:
149-
180.
Dow
nloa
ded
from
arj
ourn
als.
annu
alre
view
s.or
gby
Uni
vers
ity o
f C
olor
ado
- B
ould
er o
n 08
/22/
10. F
or p
erso
nal u
se o
nly.
20 Mar 2002 7:47 AR AR154-06.tex AR154-06.SGM LaTeX2e(2001/05/10)P1: GSR
SCALING OF SOIL MOISTURE 167
of the simpler and widely used methods is ordinary kriging (Journel & Huijbregts1978).
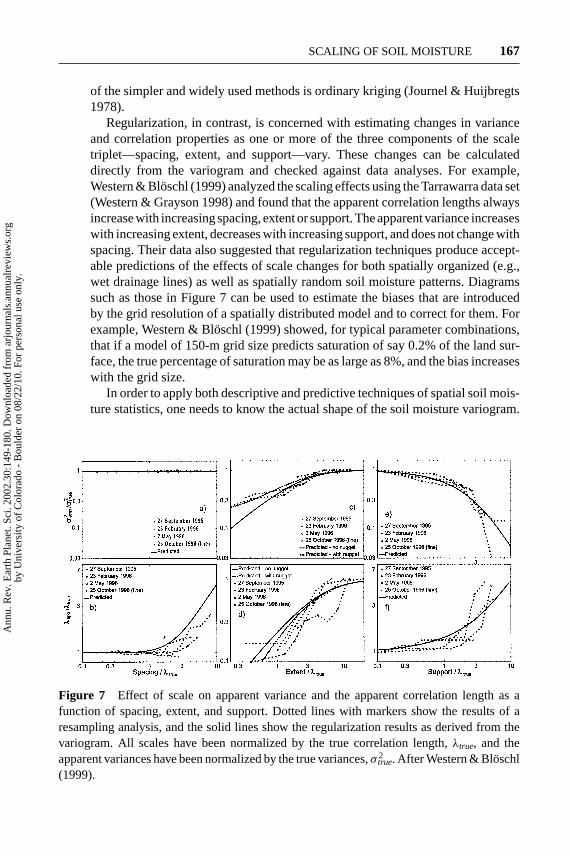
Regularization, in contrast, is concerned with estimating changes in varianceand correlation properties as one or more of the three components of the scaletriplet—spacing, extent, and support—vary. These changes can be calculateddirectly from the variogram and checked against data analyses. For example,Western & Bloschl (1999) analyzed the scaling effects using the Tarrawarra data set(Western & Grayson 1998) and found that the apparent correlation lengths alwaysincrease with increasing spacing, extent or support. The apparent variance increaseswith increasing extent, decreases with increasing support, and does not change withspacing. Their data also suggested that regularization techniques produce accept-able predictions of the effects of scale changes for both spatially organized (e.g.,wet drainage lines) as well as spatially random soil moisture patterns. Diagramssuch as those in Figure 7 can be used to estimate the biases that are introducedby the grid resolution of a spatially distributed model and to correct for them. Forexample, Western & Bl¨oschl (1999) showed, for typical parameter combinations,that if a model of 150-m grid size predicts saturation of say 0.2% of the land sur-face, the true percentage of saturation may be as large as 8%, and the bias increaseswith the grid size.
In order to apply both descriptive and predictive techniques of spatial soil mois-ture statistics, one needs to know the actual shape of the soil moisture variogram.
Figure 7 Effect of scale on apparent variance and the apparent correlation length as afunction of spacing, extent, and support. Dotted lines with markers show the results of aresampling analysis, and the solid lines show the regularization results as derived from thevariogram. All scales have been normalized by the true correlation length,λtrue, and theapparent variances have been normalized by the true variances,σ 2
true. After Western & Bloschl(1999).
Ann
u. R
ev. E
arth
Pla
net.
Sci.
2002
.30:
149-
180.
Dow
nloa
ded
from
arj
ourn
als.
annu
alre
view
s.or
gby
Uni
vers
ity o
f C
olor
ado
- B
ould
er o
n 08
/22/
10. F
or p
erso
nal u
se o
nly.
20 Mar 2002 7:47 AR AR154-06.tex AR154-06.SGM LaTeX2e(2001/05/10)P1: GSR
168 WESTERN ¥ GRAYSON ¥ BLOSCHL
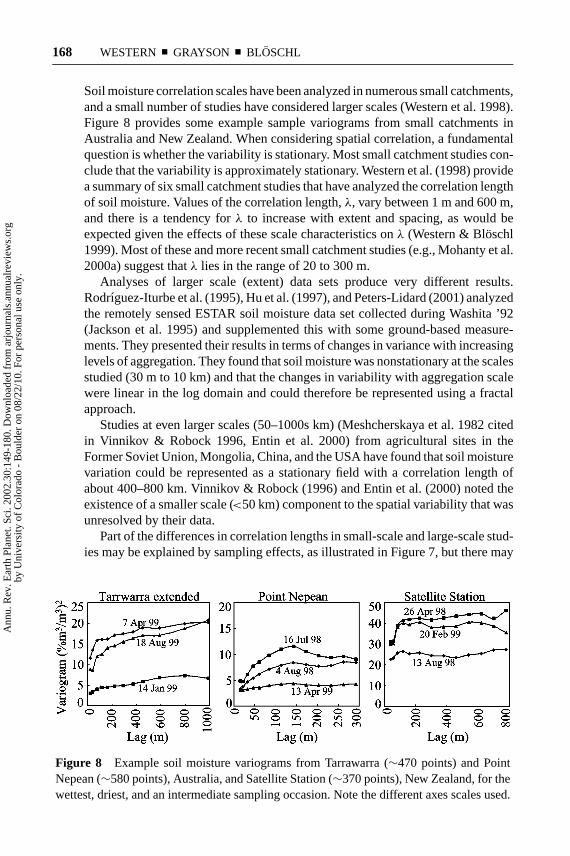
Soil moisture correlation scales have been analyzed in numerous small catchments,and a small number of studies have considered larger scales (Western et al. 1998).Figure 8 provides some example sample variograms from small catchments inAustralia and New Zealand. When considering spatial correlation, a fundamentalquestion is whether the variability is stationary. Most small catchment studies con-clude that the variability is approximately stationary. Western et al. (1998) providea summary of six small catchment studies that have analyzed the correlation lengthof soil moisture. Values of the correlation length,λ, vary between 1 m and 600 m,and there is a tendency forλ to increase with extent and spacing, as would beexpected given the effects of these scale characteristics onλ (Western & Bloschl1999). Most of these and more recent small catchment studies (e.g., Mohanty et al.2000a) suggest thatλ lies in the range of 20 to 300 m.
Analyses of larger scale (extent) data sets produce very different results.Rodrıguez-Iturbe et al. (1995), Hu et al. (1997), and Peters-Lidard (2001) analyzedthe remotely sensed ESTAR soil moisture data set collected during Washita ’92(Jackson et al. 1995) and supplemented this with some ground-based measure-ments. They presented their results in terms of changes in variance with increasinglevels of aggregation. They found that soil moisture was nonstationary at the scalesstudied (30 m to 10 km) and that the changes in variability with aggregation scalewere linear in the log domain and could therefore be represented using a fractalapproach.
Studies at even larger scales (50–1000s km) (Meshcherskaya et al. 1982 citedin Vinnikov & Robock 1996, Entin et al. 2000) from agricultural sites in theFormer Soviet Union, Mongolia, China, and the USA have found that soil moisturevariation could be represented as a stationary field with a correlation length ofabout 400–800 km. Vinnikov & Robock (1996) and Entin et al. (2000) noted theexistence of a smaller scale (<50 km) component to the spatial variability that wasunresolved by their data.
Part of the differences in correlation lengths in small-scale and large-scale stud-ies may be explained by sampling effects, as illustrated in Figure 7, but there may
Figure 8 Example soil moisture variograms from Tarrawarra (∼470 points) and PointNepean (∼580 points), Australia, and Satellite Station (∼370 points), New Zealand, for thewettest, driest, and an intermediate sampling occasion. Note the different axes scales used.
Ann
u. R
ev. E
arth
Pla
net.
Sci.
2002
.30:
149-
180.
Dow
nloa
ded
from
arj
ourn
als.
annu
alre
view
s.or
gby
Uni
vers
ity o
f C
olor
ado
- B
ould
er o
n 08
/22/
10. F
or p
erso
nal u
se o
nly.

20 Mar 2002 7:47 AR AR154-06.tex AR154-06.SGM LaTeX2e(2001/05/10)P1: GSR
SCALING OF SOIL MOISTURE 169
also be important process controls causing such differences. Generally the spatialsoil moisture field has been found to be stationary at small catchment scales (<1 km)and at large (100s+ km) scales. It should be noted that this is not inconsistent be-cause there is a large difference (three orders of magnitude) in the correlationlengths, so the large-scale variability component basically has no effect at thesmall catchment scale. Seasonal changes occur in the correlation length at bothsmall and large scales that are associated with changes in the processes controllingthe soil moisture pattern. Robock et al. (1998) and Entin et al. (2000) have pro-posed that spatial soil moisture correlation is controlled by catchment processeswith short correlation lengths at smaller scales and by atmospheric processes withlarge (100s km) correlation lengths at regional scales. In their conceptualization,a wide separation in the scales of variability exists that needs to be confirmedwith data from intervening scales. It would be expected that soil characteristicsand vegetation may play a significant role over these intervening scales; however,this has not been fully analyzed to date. The one data set analyzed for small andintermediate scales suggests nonstationary behavior. This data set was remotelysensed rather than ground measured, and at small scales it is inconsistent with therest of the literature in that Rodr´ıguez-Iturbe et al. (1995) suggest that varianceschange at lags of 30–200 m. Clarification of the behavior of soil moisture at theseintermediate scales will require further studies.
As well as being correlated to soil moisture at nearby locations, soil moisturecan be correlated to other characteristics of the landscape. Such relationships canbe used to assist in spatial scaling of soil moisture by providing more spatiallycomplete patterns that can be combined with sparse spatial moisture measurementsand by providing a basis for disaggregating data from large supports. Terrain datais often used to calculate patterns of surrogate variables (such as the wetness andradiation indices described below) that are used to estimate the spatial patternof soil moisture. Terrain data is widely available from mapping agencies, terrainanalysis techniques are well developed, and many are implemented within commongeographic information systems and related software (Moore et al. 1991, Wilson &Gallant 2000). Indeed, terrain data is the most readily available source of spatiallydistributed data used in hydrological modeling. As a result, its use may be overlyprominent, compared to topography’s role in hydrologic processes (Grayson &Western 2001).
Nevertheless, there are two key processes that affect soil moisture and areinfluenced by terrain. Lateral redistribution of moisture by shallow subsurface flowcan be a dominant process controlling soil moisture patterns at the hillslope scale(see Figure 3b). In this case, indices reflecting upslope area, slope, or convergenceshould be related to the soil moisture. The most commonly used terrain index is thetopographic wetness index of Beven & Kirkby 1979 (see also O’Loughlin 1981,1986). The standard topographic wetness index assumes:
■ steady-state lateral flow;■ spatially uniform recharge;■ hydraulic gradient equal in magnitude and direction to the surface slope; and
Ann
u. R
ev. E
arth
Pla
net.
Sci.
2002
.30:
149-
180.
Dow
nloa
ded
from
arj
ourn
als.
annu
alre
view
s.or
gby
Uni
vers
ity o
f C
olor
ado
- B
ould
er o
n 08
/22/
10. F
or p
erso
nal u
se o
nly.
30 Mar 2002 8:18 AR AR154-06.tex AR154-06.SGM LaTeX2e(2001/05/10)P1: GSR
170 WESTERN ¥ GRAYSON ¥ BLOSCHL
■ a spatially uniform (in plan) exponential saturated hydraulic conductivity-depth profile.
With these assumptions the wetness index,wi, can be derived aswi = ln{a/tan(β)}, wherea is the specific contributing area andβ is the surface slope.Beven and Kirkby’s index forms the basis of Topmodel. Various authors haverelaxed different assumptions underlying the topographic wetness index [Barlinget al. (1994)—steady-state assumption; Woods et al. (1997)—uniform recharge;Ambroise et al. (1996) and Duan & Miller (1997)—exponential conductivity pro-file; Quinn et al. (1991)—hydraulic gradient assumption]. Willgoose & Perera(2001) have combined wetness index concepts with landscape slope-area rela-tionships to produce lumped models that parameterize the spatial variability inmoisture.
Similarly, if evapotranspiration is important, slope and aspect may be relatedto soil moisture due to their effect on the distribution of solar radiation acrossthe landscape. This can be represented using the potential solar radiation index(Moore et al. 1991, Western et al. 1999a) or alternatively, a radiation-weightedindex developed by Vertessy et al. (1990), which solves a spatially distributedsteady-state water balance.
The predictive ability of terrain indices has been examined in a number of smallcatchment studies. The standard approach to analysis has been to correlate somemeasure of soil water with the values of terrain indices at corresponding spatiallocations. It is rare to find that more than 50% of the variation in soil moisture (ordepth to saturation) is explained by the best performing terrain indices. Amongstudies that have considered soil moisture, the best R2 value quoted in the literatureis 81% for a site near Beer-Sheba in Israel two weeks after 250 mm of rainfall(Zavlasky & Sinai 1981). In this case curvature was used as the index, and itis likely that the lateral redistribution occurred as unsaturated flow. At WaggaWagga in N.S.W, Australia, a combination of the steady-state wetness index andaspect explained 31–41% of the variance (Moore et al. 1988). In Kansas, Ladson& Moore (1992) found that less than 10% of the variance was explained. At theGardsjon catchment in Sweden, Nyberg (1996) found that the wetness index couldexplain 34–42% of the soil moisture variance. Western et al. (1999a) analyzeddetailed spatial patterns of soil moisture from the Tarrawarra catchment and foundR2 values of 0–50% for either the specific upslope area or the steady-state wetnessindex. When one of these was combined with a radiation index, the best R2 was61%. There was a substantial reduction in R2 as the catchment dried and thesoil moisture came to be controlled by local vertical fluxes. Figure 9 shows thewetness index pattern at Tarrawarra, the soil moisture pattern on October 25, 1996,an error map for predictions based on a combination of the wetness index and aradiation index, and a scatter plot of soil moisture against wetness index. Therandomness of the error map indicates that these terrain indices do a good jobof predicting the general pattern of soil moisture on this occasion at Tarrawarra.Famiglietti et al. (1998) measured soil moisture in the top 5 cm on an along slope
Ann
u. R
ev. E
arth
Pla
net.
Sci.
2002
.30:
149-
180.
Dow
nloa
ded
from
arj
ourn
als.
annu
alre
view
s.or
gby
Uni
vers
ity o
f C
olor
ado
- B
ould
er o
n 08
/22/
10. F
or p
erso
nal u
se o
nly.
20 Mar 2002 7:47 AR AR154-06.tex AR154-06.SGM LaTeX2e(2001/05/10)P1: GSR
SCALING OF SOIL MOISTURE 171
transect in Texas and found R2 of up to 73% with clay content and 69% with relativeelevation. These two parameters were highly cross-correlated and the fact that thehigh R2 values occurred during dry conditions indicates that the clay content wasprobably the dominant control on the moisture.
A key lesson from the various studies on soil moisture and terrain indices is thatthe indices can explain a significant proportion of variance under favorable condi-tions, but this explanatory power drops off rapidly as catchments dry and terrainbecomes less important. Also there is always a significant amount of unexplainedvariance, which is likely to be related to variation in soils and vegetation.
All of these indices can be used in assisting with the spatial interpolation ofsoil moisture. More specifically, they can be used to estimate a spatial pattern (or aspatial distribution) from average catchment soil moisture (i.e., downscaling) andto estimate a spatial pattern from point measurements. In the latter case, similargeostatistical methods can be used as discussed above, but they are extended toaccommodate the index as an auxiliary variable. One popular approach is externaldrift kriging (Ahmed & de Marsily 1987) where the existence of a linear rela-tionship between the additional information and soil moisture is postulated andthe auxiliary variable is assumed to be error free. Due to these assumptions, theinterpolated patterns look very similar to the pattern of the auxiliary variable, i.e.,a lot of spatial structure is imposed. Another variant is co-kriging, where the co-variance (or the cross-variogram) between the auxiliary variable and soil moistureis exploited. Both the auxiliary and the original variables may be subject to mea-surement error. This method imposes less structure than external drift kriging andhence the interpolated patterns tend to be smoother. However, in co-kriging theappropriate choice of the variograms (of the auxiliary data and the original data)and the cross-variogram is not straightforward and needs to meet certain criteriafor the method to work (e.g., Deutsch & Journel 1997, Journel & Huijbregts 1978).Both external drift kriging and co-kriging require the additional information to benumerical, such as a wetness index, rather than categorical, such as land use or soiltype. Methods such as Bayes Markov Kriging (Zhu & Journel 1993), or the simplerBayes Markov updating (e.g., B´ardossy & Lehmann 1998) can be used to incor-porate this type of categorical information and so enable a wide range of auxiliaryinformation to be utilized for interpolating and downscaling soil moisture.
Process-Based Scaling Techniques
The terrain indices discussed above are a simple attempt to model process controlson patterns of soil moisture and, under appropriate circumstances, can be useful inscaling of moisture patterns. But these approaches are limited in practice by theirrestrictive assumptions. Dynamic, spatially explicit, hydrological models relaxmany of these restrictive assumptions and can be used to address scaling issues,including soil moisture. The notion is that if we can represent key hydrologicalprocesses and their interactions in a model, then we can use these models to
Ann
u. R
ev. E
arth
Pla
net.
Sci.
2002
.30:
149-
180.
Dow
nloa
ded
from
arj
ourn
als.
annu
alre
view
s.or
gby
Uni
vers
ity o
f C
olor
ado
- B
ould
er o
n 08
/22/
10. F
or p
erso
nal u
se o
nly.
20 Mar 2002 7:47 AR AR154-06.tex AR154-06.SGM LaTeX2e(2001/05/10)P1: GSR
172 WESTERN ¥ GRAYSON ¥ BLOSCHL
investigate scale effects by running them at different scales or aggregating modeloutput, and potentially provide a basis for scaling up or down. If we are to interpretthe modeled scale effects physically, the models must be a true representation ofthe processes, otherwise we are simply representing the scaling behavior of themodel. This may be useful for setting parameters in the models when applied todifferent scales [e.g., Topmodel—(Bruneau et al. 1995)], but it does not representthe manifestation of the basic processes at different scales.
To model the spatial behavior of soil moisture, we need a distributed model.Here we solve equations describing the water balance for an array of elements,each of which can have its own input information (to allow for spatial variabilityin, say, precipitation) and parameters of the algorithms in the water balance (toallow for differences in vegetation, soils, topography, etc.) (e.g., Abbott & Refs-gaard 1996). All models are greatly simplified representations of reality and aredeveloped for particular applications, focusing on the key processes that dominatethe response at the scale of interest, while other processes may be either ignoredor represented simply. By focusing on particular ranges of time and space scales,the modeling task becomes tractable, but it also imposes limits to the scales overwhich output from the models can be applied (and interpreted). For example, mod-els of hillslope hydrology need to represent the controls on lateral redistributionof water and variations in moisture content, but the models do not need to beable to represent atmospheric feedbacks (atmospheric influences are simple inputsto these models). Alternatively atmospheric general circulation models (GCMs)treat lateral redistribution very crudely and concentrate on vertical fluxes of waterand energy so that they feed back the appropriate information to the atmosphericcomponents of the models.
There are also considerations regarding the basic equations that are used todescribe the water balance. For example, it is common to use simplifications of theRichards Equation to represent saturated and unsaturated soil water movement.This equation was derived by consideration of small-scale water movement pro-cesses as might be observed in a laboratory soil column. Even at that scale there issome debate about its efficacy, but as the scale of application increases, the physicalvalidity decreases. The functional behavior of the model may still be acceptable ifthe parameters are chosen to represent the appropriate scale of response, but thismakes the parameters scale dependent. Similarly overland flow processes (thatdramatically affect, and are affected by, soil moisture patterns) are conceptualizedin a way that makes their parameters scale dependent (Grayson & Bl¨oschl 2000).These problems of scale dependency in model formulation and parameterizationlimit the interpretations of scaling behavior of natural systems, using distributedmodels.
Applications of distributed models need distributed parameter values and inputinformation on the patterns of climate, terrain, soils, and vegetation. Climate in-formation is generally good at larger scales but can be problematic at catchmentscales where rain gauge distribution is often poor and there may be strong spatial
Ann
u. R
ev. E
arth
Pla
net.
Sci.
2002
.30:
149-
180.
Dow
nloa
ded
from
arj
ourn
als.
annu
alre
view
s.or
gby
Uni
vers
ity o
f C
olor
ado
- B
ould
er o
n 08
/22/
10. F
or p
erso
nal u
se o
nly.
30 Mar 2002 8:19 AR AR154-06.tex AR154-06.SGM LaTeX2e(2001/05/10)P1: GSR
SCALING OF SOIL MOISTURE 173
precipitation gradients (due, for example, to elevation or type of storm activity).We generally have quite good data on topography or at least can relatively easilyobtain such information from additional surveys. Patterns of vegetation type canbe obtained over a range of scales from remote sensing, but key features of thevegetation that affect soil moisture such as rooting behavior and evapotranspirationparameters are less certain. The most problematic information for distributed hy-drologic modeling is soils data. There is often information on soil type (and someindex to soil texture) but little on the soil hydrological properties that control soilmoisture. Pedo-transfer functions are relationships derived between mapped soilproperties (generally percent sand, silt, clay, organic matter, etc.) and soil hy-draulic properties (e.g., Rawls et al. 1982, Romano & Santini 1997, Elsenbeer2001). These are widely used to convert maps of soil type into patterns of soil hy-draulic properties for use in distributed models across virtually all scales of modelsfrom hillslope to GCM. However, these patterns of soil hydraulic properties candominate the resulting patterns of soil moisture and mislead interpretations ofmodel output, including scale effects, if the imposed patterns are not correct (e.g.,Christiaens & Feyen 2001, Houser et al. 2000, Vertessy et al. 2000).
Despite all of these limitations, carefully developed models supported by de-tailed data sets and applied over an appropriate range of scales, are capable ofreproducing bulk soil moisture response, as well as observed patterns (Figure 10)(Western & Grayson 2000). This implies that they may be useful for investiga-ting the scaling of hydrological behavior, albeit over a limited range of scales.They can also be useful in establishing and/or testing some of the relationshipsneeded in models used at larger scales to represent the effects of the process scalevariability—e.g., to develop the shape of functions that relate saturated area toaverage catchment wetness, or to parameterize the effects of spatial variability onevapotranspiration over heterogeneous areas.
Although there has been some success at modeling soil moisture patterns atsmall scales, in the studies conducted so far at continental or global scales (e.g.,Entin et al. 1999, Robock et al. 1998, Srinivasan et al. 2000), model performancehas been quite poor with particular problems in high latitudes and failure to captureobserved interannual variability. With corrections for biases, some models in theGlobal Soil Wetness project were able to represent seasonal cycles, but these biaseswere different in different areas. The problems with soil moisture simulation atlarge scales are not only in the algorithms that define moisture behavior in a soilcolumn or a landscape, but also in (a) the accuracy of the forcing (atmospheric)information (especially where the land-surface model is coupled to an atmosphericmodel) and (b) the difficulty in obtaining measurements at the right scale forcomparisons with modeled response (remote sensing fails to capture root zone soilmoisture and ground measurements can be highly uncertain at the model grid scalesdue to small measurement supports). Future studies, particularly in the context ofclimate impact analyses, are likely to shed more light on the potential of large-scalesoil moisture simulations.
Ann
u. R
ev. E
arth
Pla
net.
Sci.
2002
.30:
149-
180.
Dow
nloa
ded
from
arj
ourn
als.
annu
alre
view
s.or
gby
Uni
vers
ity o
f C
olor
ado
- B
ould
er o
n 08
/22/
10. F
or p
erso
nal u
se o
nly.
20 Mar 2002 7:47 AR AR154-06.tex AR154-06.SGM LaTeX2e(2001/05/10)P1: GSR
174 WESTERN ¥ GRAYSON ¥ BLOSCHL
SUMMARY
Spatial and temporal variability of soil moisture is ubiquitous. Because many soilmoisture–dependent processes are nonlinear, this variability leads to significantscale effects. There are a variety of scaling techniques that can be used to estimatethe effect of changing the scale (spacing, support, or extent) of data or a model.These have been reviewed above, and progress is being made in understandingtheir applicability and reliability.
Many of the techniques rely on statistical methods. Fundamental to understand-ing and applying statistical methods is knowledge of the underlying statistical dis-tribution and statistical relationships between different data. The number of studiesthat have examined statistical characteristics is still fairly small, and they are of-ten for agricultural land uses; nevertheless, some general patterns have emerged.Results from small catchment studies suggest that the normal distribution is a rea-sonable approximation of the soil moisture pdf, but departures from normality dooccur and they are probably more likely under very wet or very dry conditions.Some progress is also being made on understanding the links between the pdf char-acteristics (parameters) and the wetness state. Soil moisture is correlated in spaceand time due to a variety of processes. An understanding of correlation scales forsmall catchments and also regionally is emerging, but there is a gap in understand-ing for intermediate scales due to a lack of data. It appears that it is often possibleto assume stationarity at both these scales. The spatial pattern of soil moisture isalso related to environmental characteristics such as terrain, soils, and vegetation.Studies of the correlation between terrain indices and soil moisture suggest thatuseful statistical relationships explaining up to 50% (occasionally more) of thevariance can be developed under favorable conditions, but that quite often theserelationships are weak.
Process-based scaling techniques also exist and rely on distributed hydrologicalmodels. Such models are applicable to specific spatial scale ranges, and they arevery data intensive. At small scales, models have been used to successfully simulatespatial patterns of soil moisture, but at large scales there has been limited success.
A major constraint on furthering our understanding of soil moisture scaling isdata availability. At small scales (<1 km), ground-based measurements are possibleand advances in measurement technology mean that more and more detailed datasets are being collected. At larger scales, surface soil moisture can be measuredusing remote sensing, but we need proven methods for interpreting soil moisture atgreater depth because this is much more significant hydrologically. While remotesensing technology is advancing, this is still a major challenge. Exploiting thecomplementary advantages of ground-based and remotely sensed methods shouldbe a focus of future work.
It is likely that future applications of soil moisture scaling will tend to be concen-trated in the area of parameterizing the effects of variability on moisture-dependentenvironmental processes. This will require developing new algorithms that can in-tegrate the emerging knowledge of moisture variability with our understanding of
Ann
u. R
ev. E
arth
Pla
net.
Sci.
2002
.30:
149-
180.
Dow
nloa
ded
from
arj
ourn
als.
annu
alre
view
s.or
gby
Uni
vers
ity o
f C
olor
ado
- B
ould
er o
n 08
/22/
10. F
or p
erso
nal u
se o
nly.
20 Mar 2002 7:47 AR AR154-06.tex AR154-06.SGM LaTeX2e(2001/05/10)P1: GSR
SCALING OF SOIL MOISTURE 175
dominant processes at different scales. It will also require that we generalize ourunderstanding of moisture variability and scaling from existing and future casestudies.
ACKNOWLEDGMENTS
Our soil moisture research has been supported financially by the Australian Re-search Council, the Oesterreichische National Bank, Vienna, and the AustralianDepartment of Industry Science and Tourism. David Wilson, Rodger Young andSen-Lin Zhou have assisted in various aspects of the work. Tom McMahon hasprovided enthusiastic support, encouragement and guidance for the projects.
Visit the Annual Reviews home page at www.annualreviews.org
LITERATURE CITED
Abbott MB, Refsgaard JC, eds. 1996.Distri-buted Hydrological Modelling. Dordrecht/Boston: Kluwer Academic
Ahmed S, de Marsily G. 1987. Comparison ofgeostatistical methods for estimating trans-missivity using data on transmissivity andspecific capacity.Water Resour. Res.23:1717–37
Albertson JD, Kiely G. 2001. On the structureof soil moisture time series in the context ofland surface models.J. Hydrol.243:101–19
Ambroise B, Beven K, Freer J. 1996. Toward ageneralization of the TOPMODEL concepts:topographic indices of hydrological similar-ity. Water Resour. Res.32:2135–45
Bardossy A, Lehmann W. 1998. Spatial dis-tribution of soil moisture in a small catch-ment. Part 1: geostatistical analysis.J. Hy-drol. 206:1–15
Barling RD, Moore ID, Grayson RB. 1994. Aquasi-dynamic wetness index for character-izing the spatial distribution of zones of sur-face saturation and soil water content.WaterResour. Res.30:1029–44
Bastiaanssen WGM, Pelgrum H, Wang J, MaY, Moreno JF, et al. 1998. A remote sens-ing surface energy balance algorithm for land(SEBAL)-2. Validation.J. Hydrol.213:213–29
Bell KR, Blanchard BJ, Schmugge TJ, Wit-
czak MW. 1980. Analysis of surface mois-ture variations within large-field sites.WaterResour. Res.16:796–810
Beven K. 1995. Linking parameters acrossscales: subgrid parameterizations and scaledependent hydrological.Hydrol. Process.9:507–25
Beven KJ, Germann P. 1982. Macroporesand water flow in soils.Water Resour. Res.18:1311–25
Beven KJ, Kirkby MJ. 1979. A physically-based variable contributing area model ofbasin hydrology.Hydrol. Sci. Bull.24:43–69
Bloschl G, Sivapalan M. 1995. Scale issuesin hydrological modelling: a review.Hydrol.Process.9:251–90
Brady NC. 1990.The Nature and Properties ofSoils. New York: Macmillian. 621 pp.
Bruneau P, Gascuel-Odoux C, Robin P, MerotP, Beven KJ. 1995. The sensitivity to spaceand time scales of a hydrological model us-ing digital elevation data.Hydrol. Process.9:69–82
Charpentier MA, Groffman PM. 1992. Soilmoisture variability within remote sensingpixels.J. Geophys. Res.97:18987–95
Christiaens K, Feyen J. 2001. Analysis of un-certainties associated with different methodsto determine hydraulic properties and their
Ann
u. R
ev. E
arth
Pla
net.
Sci.
2002
.30:
149-
180.
Dow
nloa
ded
from
arj
ourn
als.
annu
alre
view
s.or
gby
Uni
vers
ity o
f C
olor
ado
- B
ould
er o
n 08
/22/
10. F
or p
erso
nal u
se o
nly.
20 Mar 2002 7:47 AR AR154-06.tex AR154-06.SGM LaTeX2e(2001/05/10)P1: GSR
176 WESTERN ¥ GRAYSON ¥ BLOSCHL
propagation in the distributed hydrologicalMIKE SHE model.J. Hydrol.246:63–81
Delworth T, Manabe S. 1988. The influence ofpotential evapotranspiration on the variabili-ties of simulated soil wetness and climate.J.Clim. 1:523–47
Deutsch CV, Journel AG. 1997.GSLIB Geosta-tistical Software Library and User’s Guide.New York/Oxford: Oxford Univ. Press. 384pp.
Dingman SL. 1994.Physical Hydrology. NewYork: Macmillan. 575 pp.
Dobson MC, Ulaby FT. 1998. Mapping soilmoisture distribution with imaging radar.In Principles and Applications of ImagingRadar, ed. FM Henderson, AJ Lewis, pp.407–33. New York: Wiley/Am. Soc. Photo-gramm. Remote Sens.
D’Odorico P, Ridolfi L, Porporato A, Rodr´ı-guez-Iturbe I. 2000. Preferential states of sea-sonal soil moisture: the impact of climatefluctuations.Water Resour. Res.36:2209–19
Du Y, Ulaby FT, Dobson MC. 2000. Sensi-tivity to soil moisture by active and passivemicrowave sensors.IEEE Trans. Geosci. Re-mote Sens.38:105–14
Duan J, Miller NL. 1997. A generalized powerfunction for the subsurface transmissivityprofile in TOPMODEL.Water Resour. Res.33:2559–63
Dunne T, Black RD. 1970a. An experimentalinvestigation of runoff production in perme-able soils.Water Resour. Res.6:478–90
Dunne T, Black RD. 1970b. Partial area contri-butions to storm runoff in a small New Eng-land watershed.Water Resour. Res.6:1296–311
Dunne T, Moore TR, Taylor CH. 1975. Recog-nition and prediction of runoff-producingzones in humid regions.Hydrol. Sci. Bull.20:305–27
Eagleson PS. 1978a. Climate, soil, and vegeta-tion 1. Introduction to water balance dynam-ics.Water Resour. Res.14:705–12
Eagleson PS. 1978b. Climate, soil, and vegeta-tion. 6. Dynamics of the annual water bal-ance.Water Resour. Res.14:749–64
Eagleson PS. 1982a. Ecological optimality in
water-limited natural soil vegetation systems1. Theory and hypothesis.Water Resour. Res.18:325–40
Eagleson PS. 1982b. Ecological optimality inwater-limited natural soil vegetation systems2. Tests and applications.Water Resour. Res.18:341–54
Engman ET. 2000. Soil moisture. InRemoteSensing in Hydrology and Water Manage-ment, ed. GA Schultz, ET Engman, pp. 197–216. Berlin: Springer
Elsenbeer H. 2001. Pedotransfer functions inhydrology.J. Hydrol.251:121–22
Entekhabi D. 1995. Recent advances in land-atmosphere interaction research.Rev. Geo-phys.33:995–1003
Entekhabi D, Nakamura H, Njoku EG. 1994.Solving the inverse problem for soil moistureand temperature profiles by sequential assim-ilation of multifrequency remotely sensedobservations.IEEE Trans. Geosci. RemoteSens.32:438–48
Entin JK, Robock A, Vinnikov KY, HollingerSE, Liu SX, Namkhai A. 2000. Temporaland spatial scales of observed soil moisturevariations in the extratropics.J. Geophys.Res.-Atmos.105:11865–77
Entin JK, Robock A, Vinnikov KY, Zabelin V,Liu SX, et al. 1999. Evaluation of Global SoilWetness Project soil moisture simulations.J.Meteorol. Soc. Jpn.77:183–98
Famiglietti JS, Devereaux JA, Laymon CA,Tsegaye T, Houser PR, et al. 1999. Ground-based investigation of soil moisture variabil-ity within remote sensing footprints duringthe Southern Great Plains 1997 (SGP97)Hydrology Experiment.Water Resour. Res.35:1839–51
Famiglietti JS, Rudnicki JW, Rodell M. 1998.Variability in surface moisture content alonga hillslope transect: Rattlesnake Hill, Texas.J. Hydrol.210:259–81
Fitzjohn C, Ternan JL, Williams AG. 1998.Soil moisture variability in a semi-arid gullycatchment: implications for runoff and ero-sion control.Catena32:55–70
Giorgi F, Avissar R. 1997. Representationof heterogeneity effects in earth system
Ann
u. R
ev. E
arth
Pla
net.
Sci.
2002
.30:
149-
180.
Dow
nloa
ded
from
arj
ourn
als.
annu
alre
view
s.or
gby
Uni
vers
ity o
f C
olor
ado
- B
ould
er o
n 08
/22/
10. F
or p
erso
nal u
se o
nly.
20 Mar 2002 7:47 AR AR154-06.tex AR154-06.SGM LaTeX2e(2001/05/10)P1: GSR
SCALING OF SOIL MOISTURE 177
modelling: experience from land surfacemodeling.Rev. Geophys.35:413–38
Goodrich DC, Faur`es J-M, Woolhiser DA,Lane LJ, Sorooshian S. 1995. Measurementand analysis of small-scale convective stormrainfall variability.J. Hydrol.173:283–308
Grayson RB, Bl¨oschl G, eds. 2000.Spatial Pat-terns in Hydrological Processes: Observa-tions and Modelling. Cambridge, UK: Cam-bridge Univ. Press. 406 pp.
Grayson RB, Bl¨oschl G, Moore ID. 1995.Distributed parameter hydrologic modellingusing vector elevation data: Thales andTAPES-C. InComputer Models of Water-shed Hydrology, ed. VP Singh, pp. 669–95.Highlands Ranch, CO: Water Resour. Pub.
Grayson RB, Western AW. 1998. Towards areal estimation of soil water content frompoint measurements: time and space stabil-ity of mean response.J. Hydrol.207:68–82
Grayson RB, Western AW. 2001. Terrain andthe distribution of soil moisture.Hydrol. Pro-cess.15(13):2689–90
Grayson RB, Western AW, Chiew FHS,Bloschl G. 1997. Preferred states in spatialsoil moisture patterns: local and non-localcontrols.Water Resour. Res.33:2897–908
Gupta VK, Waymire EC. 1998. Spatial vari-ability and scale invariance in hydrologic re-gionalization. See Sposito 1998a, pp. 88–135
Haverkamp R, Parlange J-Y, Cuenca R, RossPJ, Steenhuis TS. 1998. Scaling of theRichards equation and its application to wa-tershed modelling. See Sposito 1998a, pp.190–223
Hillel D. 1998. Environmental Soil Physics.San Diego, CA: Academic. 771 pp.
Houser P, Goodrich D, Syed K. 2000. Runoff,precipitation, and soil moisture at WalnutGulch. InSpatial Patterns in Catchment Hy-drology: Observations and Modelling, ed. RGrayson, G Bl¨oschl, pp. 125–57. Cambridge:Cambridge Univ. Press
Hu Z, Islam S, Cheng Y. 1997. Statistical char-acteriszation of remotely sensed soil mois-ture images.Remote Sens. Environ.61:310–8
Jackson TJ, Le Vine DM, Hsu AY, Oldak A,
Starks PJ, et al. 1999. Soil moisture mappingat regional scales using microwave radiome-try: the Southern Great Plains hydrology ex-periment.IEEE Trans. Geosci. Remote Sens.37:2136–51
Jackson TJ, Le Vine DM, Swift CT, SchmuggeTJ, Schiebe FR. 1995. Large-area mappingof soil-moisture using the estar passive mi-crowave radiometer in Washita92.RemoteSens. Environ.54:27–37
Jackson TJ, Schmugge J, Engman ET. 1996.Remote sensing applications to hydrology:soil moisture.Hydrol. Sci. J.41:517–30
Journel AG, Huijbregts CJ. 1978.Mining Geo-statistics. London: Academic. 600 pp.
Jury WA, Russo D, Sposito G. 1987. Thespatial variability of water and solute trans-port properties in unsaturated soil. II. Scalingmodels of water transport.Hilgardia 55:33–56
Kachanoski RG, de Jong E. 1988. Scale depen-dence and the temporal persistence of spatialpatterns of soil water storage.Water Resour.Res.24:85–91
Kalma JD, Bates BC, Woods RA. 1995. Pre-dicting catchment-scale soil moisture sta-tus with limited field measurements.Hydrol.Process.9:445–67
Koltermann CE, Gorelick SM. 1996. Hetero-geneity in sedimentary deposits: a reviewof structure-imitating, process-imitating anddescriptive approaches.Water Resour. Res.32:2617–58
Kutılek M, Nielsen DR. 1994.Soil Hydrology.Cremlingen-Destedt: Catena. 370 pp.
Ladson AR, Moore ID. 1992. Soil water pre-diction on the Konza Prairie by microwaveremote sensing and topographic attributes.J.Hydrol. 138:385–407
Laio F, Porporato A, Fernandez Illescas CP,Rodrıguez-Iturbe I. 2001a. Plants in water-controlled ecosystems: active role in hydro-logic processes and response to water stressIV. Discussion of real cases.Adv. Water Re-sour.24:745–62
Laio F, Porporato A, Ridolfi L, Rodr´ıguez-Iturbe I. 2001b. Plants in water-controlledecosystems: active role in hydrologic
Ann
u. R
ev. E
arth
Pla
net.
Sci.
2002
.30:
149-
180.
Dow
nloa
ded
from
arj
ourn
als.
annu
alre
view
s.or
gby
Uni
vers
ity o
f C
olor
ado
- B
ould
er o
n 08
/22/
10. F
or p
erso
nal u
se o
nly.
20 Mar 2002 7:47 AR AR154-06.tex AR154-06.SGM LaTeX2e(2001/05/10)P1: GSR
178 WESTERN ¥ GRAYSON ¥ BLOSCHL
processes and response to water stress II.Probabalistic soil moisture dynamics.Adv.Water Resour.24:707–23
Loague K. 1992. Soil water content at R-5. Part1. Spatial and temporal variability.J. Hydrol.139:233–51
Mahmood R. 1996. Scale issues in soil moisturemodelling: problems and prospects.Prog.Phys. Geogr.20:273–91
Mantoglou A, Wilson JL. 1981.Simulation ofrandom fields with the turning bands method.Rep. 264, Dept. Civil Eng., Massachusetts In-stitute of Technology, Cambridge, MA
Merz B, Plate EJ. 1997. An analysis ofthe effects of spatial variability of soil andsoil moisture on runoff.Water Resour. Res.33:2909–22
Meshcherskaya AV, Boldreva NA, ShapaevaND. 1982.Districts Average Plant AvailableWater Storage and the Depth of Snow Cover,Statisical Analysis and its Usage (Some Ex-amples). Gidrometeoizdat, Leningrad, USSR(in Russian)
Miller EE, Miller RD. 1955a. Theory of capil-liary flow: I. Experimental information.SoilSci. Soc. Am. Proc.19:271–75
Miller RD, Miller EE. 1955b. Theory of capil-liary flow: II. Practical implications.Soil Sci.Soc. Am. Proc.19:267–71
Milly PCD. 1994. Climate, soil water storage,and the average annual water balance.WaterResour. Res.30:2143–56
Milly PCD. 2001. A minimalist probabilisticdescription of root zone soil water.Water Re-sour. Res.37:457–63
Mohanty BP, Famiglietti JS, Skaggs TH.2000a. Evolution of soil moisture spatialstructure in a mixed vegetation pixel dur-ing the Southern Great Plains 1997 (SGP97)Hydrology Experiment.Water Resour. Res.36:3675–86
Mohanty BP, Skaggs TH, Famiglietti JS.2000b. Analysis and mapping of field-scale soil moisture variability using high-resolution, ground-based data during theSouthern Great Plains 1997 (SGP97) Hy-drology Experiment.Water Resour. Res.36:1023–31
Moore ID, Burch GJ, Mackenzie DH. 1988.Topographic effects on the distribution ofsurface soil water and the location ofephemeral gullies.Trans. Am. Soc. Agric.Eng.31:1098–107
Moore ID, Grayson RB, Ladson AR. 1991.Digital terrain modelling: a review of hy-drological, geomorphological, and biologi-cal applications.Hydrol. Process.5:3–30
Nyberg L. 1996. Spatial variability of soil watercontent in the covered catchment at G˚ardsjon,Sweden.Hydrol. Process.10:89–103
O’Loughlin EM. 1981. Saturation regions incatchments and their relations to soil and to-pographic properties.J. Hydrol.53:229–46
O’Loughlin EM. 1986. Prediction of surfacesaturation zones in natural catchments bytopographic analysis.Water Resour. Res.22:794–804
Peters-Lidard CD, Pan F, Wood EF. 2001. A re-examination of modeled and measured soilmoisture spatial variability and its implica-tions for land surface modeling.Adv. WaterResour.24(9,10):1069–83
Pielke RA Sr. 2001. Influence of the spatial dis-tribution of vegetation and soils on the pre-diction of cumulus convective rainfall.Rev.Geophys.39:151–77
Porporato A, Laio F, Ridolfi L, Rodr´ıguez-Iturbe I. 2001. Plants in water-controlledecosystems: active role in hydrologic pro-cesses and response to water stress III.Vegetation water stress.Adv. Water Resour.24:725–44
Qui Y, Fu B, Wang J, Chen L. 2001. Soilmoisture variation in relation to topographyand land use in a hillslope catchment of theLoess Plateau, China.J. Hydrol. 240:243–63
Quinn P, Beven K, Chevallier P, PlanchonO. 1991. The prediction of hillslope flowpaths for distributed hydrological modellingusing digital terrain models.Hydrol. Process.5:59–79
Rawls WJ, Brakensiek DL, Saxton KE. 1982.Estimation of soil water properties.Trans.Am. Soc. Agric. Eng.25:1316–20
Rinaldo A, Rodr´ıguez-Iturbe I. 1998. Scaling
Ann
u. R
ev. E
arth
Pla
net.
Sci.
2002
.30:
149-
180.
Dow
nloa
ded
from
arj
ourn
als.
annu
alre
view
s.or
gby
Uni
vers
ity o
f C
olor
ado
- B
ould
er o
n 08
/22/
10. F
or p
erso
nal u
se o
nly.
20 Mar 2002 7:47 AR AR154-06.tex AR154-06.SGM LaTeX2e(2001/05/10)P1: GSR
SCALING OF SOIL MOISTURE 179
in river networks. See Sposito 1998a, pp. 61–87
Robock A, Schlosser CA, Vinnikov KY, Sper-anskaya NA, Entin JK, Qiu S. 1998. Evalu-ation of the AMIP soil moisture simulations.Glob. Planet. Chang.19:181–208
Rodrıguez-Iturbe I. 1991a. Nonlinear dynamicsof soil-moisture at climate scales 1. Stochas-tic analysis.Water Resour. Res.27:1899–906
Rodrıguez-Iturbe I. 1991b. Nonlinear dynamicsof soil-moisture at climate scales 2. Chaoticanalysis.Water Resour. Res.27:1907–15
Rodrıguez-Iturbe I. 2000. Ecohydrology: a hy-drologic perspective of climate-soil-vege-tation dynamics.Water Resour. Res.36:3–9
Rodrıguez-Iturbe I, Porporato A, Laio F,Ridolfi L. 2001. Plants in water-controlledecosystems: active role in hydrologic pro-cesses and response to water stress I. Scopeand general outline.Adv. Water Resour.24:695–705
Rodrıguez-Iturbe I, Porporato A, Ridolfi L,Isham V, Cox DR. 1999. Probabalistic mod-elling of water balance at a point: the roleof climate soil and vegetation.Proc. R. Soc.London Ser. A455:3789–805
Rodrıguez-Iturbe I, Rinaldo A. 1997.FractalRiver Basins: Chance and Self-Organisation.Cambridge: Cambridge Univ. Press. 565 pp.
Rodrıguez-Iturbe I, Vogel GK, Rigon R, En-tekhabi D, Castelli F, Rinaldo A. 1995.On the spatial organization of soil moisturefields.Geophys. Res. Lett.22:2757–60
Romano N, Santini A. 1997. Effectiveness ofusing pedo-transfer functions to quantify thespatial variability of soil water retention char-acteristics.J. Hydrol.202:137–57
Russo D. 1998. Stochastic modeling of scale-dependent macrodispersion in the vadosezone. See Sposito 1998a, pp. 266–90
Seyfried MS, Wilcox BP. 1995. Scale and thenature of spatial variability: field exampleshaving implications for hydrologic model-ing. Water Resour. Res.31:173–84
Sposito G, ed. 1998a.Scale Dependence andScale Invariance in Hydrology. Cambridge:Cambridge Univ. Press. 423 pp.
Sposito G. 1998b. Scaling invariance and the
Richards Equation. See Sposito 1998a, pp.167–89
Srinivasan G, Robock A, Entin JK, Luo LF,Vinnikov KY, Viterbo P. 2000. Soil mois-ture simulations in revised AMIP models.J.Geophys. Res.-Atmos.105:26635–44
Tyndale-Biscoe JP, Moore GA, Western AW.1998. A system for collecting spatially vari-able terrain data.Comput. Electron. Agric.19:113–28
Vachaud G, De Silans Passerat A, Balabanis P,Vauclin M. 1985. Temporal stability of spa-tially measured soil water probability densityfunction.Soil Sci. Soc. Am. J.49:822–27
Vertessy R, Elsenbeer H, Bessard Y, Lack A.2000. Storm runoff generation at La Cuenca.In Spatial Patterns in Catchment Hydrology:Observations and Modelling, ed. R Grayson,G Bloschl, pp. 247–71. Cambridge: Cam-bridge Univ. Press
Vertessy RA, Watson FGR, O’Sullivan SK.2001. Factors determining relations betweenstand age and catchment water yield in moun-tain ash forests.For. Ecol. Manag.143:13–26
Vertessy RA, Wilson CJ, Silburn DM, Con-nolly RD, Ciesiolka CA. 1990.PredictingErosion Hazard Areas Using Digital TerrainAnalysis. Presented at Res. Needs Appl. Re-duce Eros. Sediment. Trop. Steeplands, Fiji
Vinnikov KY, Robock A. 1996. Scales of tem-poral and spatial variability of midlatitudesoil moisture.J. Geophys. Res.101:7163–74
Vinnikov KY, Yeserkepova IB. 1991. Soil-moisture: empirical-data and model results.J. Clim.4:66–79
Walker JP, Willgoose GR, Kalma JD. 2001.One-dimensional soil moisture profile re-trieval by assimilation of near-surface obser-vations: a comparison of retrieval algorithms.Adv. Water Resour.24:631–50
Warrick AW. 1990. Application of scaling tothe characterization of spatial variability insoils. InScaling in Soil Physics: Principlesand Applications, ed. D Hillel, DE Elrick, pp.39–51. Madison, WI: Soil Sci. Soc. Am.
Weaver CP, Avissar R. 2001. Atmosphericdisturbances caused by human modification
Ann
u. R
ev. E
arth
Pla
net.
Sci.
2002
.30:
149-
180.
Dow
nloa
ded
from
arj
ourn
als.
annu
alre
view
s.or
gby
Uni
vers
ity o
f C
olor
ado
- B
ould
er o
n 08
/22/
10. F
or p
erso
nal u
se o
nly.
20 Mar 2002 7:47 AR AR154-06.tex AR154-06.SGM LaTeX2e(2001/05/10)P1: GSR
180 WESTERN ¥ GRAYSON ¥ BLOSCHL
of the landscape.Bull. Am. Meteorol. Soc.82:269–81
Western AW, Bloschl G. 1999. On the spatialscaling of soil moisture.J. Hydrol.217:203–24
Western AW, Bloschl G, Grayson RB. 1998.Geostatistical characterisation of soil mois-ture patterns in the Tarrawarra Catchment.J. Hydrol.205:20–37
Western AW, Bloschl G, Grayson RB. 2001.Towards capturing hydrologically significantconnectivity in spatial patterns.Water Re-sour. Res.37:83–97
Western AW, Grayson RB. 1998. The Tar-rawarra data set: soil moisture patterns, soilcharacteristics and hydrological flux mea-surements.Water Resour. Res.34:2765–68
Western AW, Grayson RB. 2000. Soil moistureand runoff processes at Tarrawarra. InSpatialPatterns in Catchment Hydrology-Observa-tions and Modelling, ed. RB Grayson, GBloschl, pp. 209–46. Cambridge: CambridgeUniv. Press
Western AW, Grayson RB, Bl¨oschl G, Will-goose GR, McMahon TA. 1999a. Observedspatial organisation of soil moisture and itsrelation to terrain indices.Water Resour. Res.35:797–810
Western AW, Grayson RB, Green TR. 1999b.The Tarrawarra project: high resolution spa-tial measurement, modelling and analysis ofsoil moisture and hydrological response.Hy-drol. Process.13:633–52
White RE. 1997.Principles and Practice of SoilScience. The Soil as a Natural Resource. Ox-ford, UK: Blackwell Sci. 348 pp.
Willgoose G, Perera H. 2001. A simple modelof saturation excess runoff generation basedon geomorphology, steady state soil mois-ture.Water Resour. Res.37:147–55
Wilson JP, Gallant JC, eds. 2000.Terrain Anal-ysis: Principles and Applications. New York:Wiley
Wood EF, Lettenmaier DP, Zartarian VG. 1992.A land-surface hydrology parameterizationwith subgrid variability for general circula-tion models.J. Geophys. Res.97(D3):2717–28
Woods RA, Grayson RB, Western AW, Dun-can MJ, Wilson DJ, et al. 2001. Experimentaldesign and initial results from the MahurangiRiver variability experiment: MARVEX. InObservations and Modeling of Land SurfaceHydrological Processes, ed. V Lakshmi, JDAlbertson, J Schaake. Washington, DC: Am.Geophys. Union
Woods RA, Sivapalan M, Robinson JS. 1997.Modeling the spatial variability of subsurfacerunoff using a topographic index.Water Re-sour. Res.33:1061–73
Yeh T-CJ. 1998. Scale issues of heterogeneity invadose zone hydrology. See Sposito 1998a,pp. 224–65
Zavlasky D, Sinai G. 1981. Surface hydrology.I. Explanation of phenomena.J. Hydraul.Div., Proc. Am. Soc. Civ. Eng.107:1–16
Zhao R-J. 1992. The Xinanjiang model appliedin China.J. Hydrol.135:371–81
Zhu H, Journel AG. 1993. Formatting and in-tegrating soft data: stochastic imaging viathe Markov-Bayes algorithm. InGeostatis-tics Troia ’92, ed. A Soares, pp. 1–12. Dor-drecht: Kluwer
Ann
u. R
ev. E
arth
Pla
net.
Sci.
2002
.30:
149-
180.
Dow
nloa
ded
from
arj
ourn
als.
annu
alre
view
s.or
gby
Uni
vers
ity o
f C
olor
ado
- B
ould
er o
n 08
/22/
10. F
or p
erso
nal u
se o
nly.
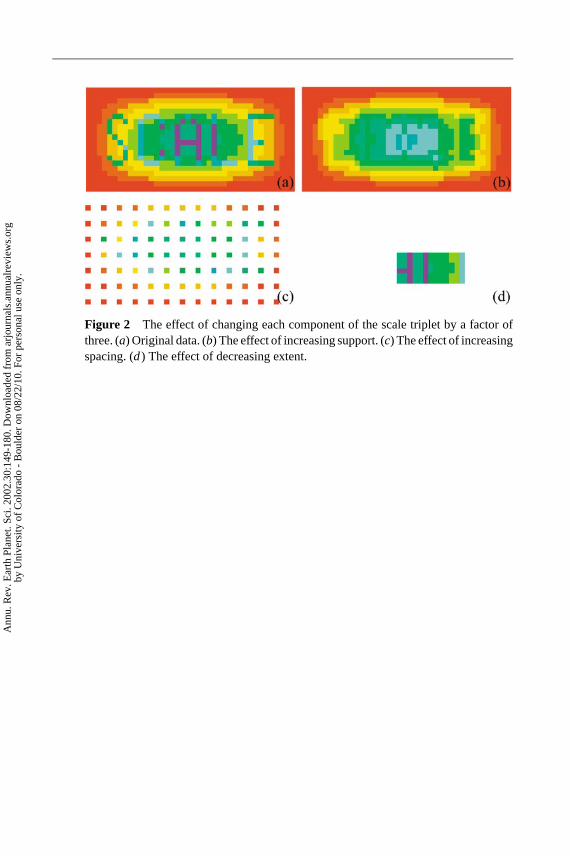
30 Mar 2002 14:26 AR AR154-06-COLOR.tex AR154-06-COLOR.SGM LaTeX2e(2002/01/18)P1: GDL
Figure 2 The effect of changing each component of the scale triplet by a factor ofthree. (a) Original data. (b) The effect of increasing support. (c) The effect of increasingspacing. (d) The effect of decreasing extent.
Ann
u. R
ev. E
arth
Pla
net.
Sci.
2002
.30:
149-
180.
Dow
nloa
ded
from
arj
ourn
als.
annu
alre
view
s.or
gby
Uni
vers
ity o
f C
olor
ado
- B
ould
er o
n 08
/22/
10. F
or p
erso
nal u
se o
nly.
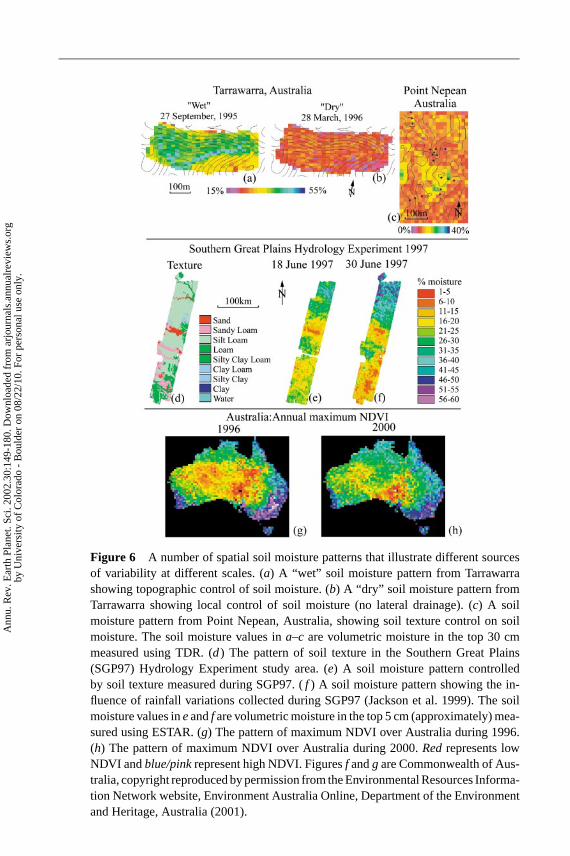
30 Mar 2002 14:26 AR AR154-06-COLOR.tex AR154-06-COLOR.SGM LaTeX2e(2002/01/18)P1: GDL
Figure 6 A number of spatial soil moisture patterns that illustrate different sourcesof variability at different scales. (a) A “wet” soil moisture pattern from Tarrawarrashowing topographic control of soil moisture. (b) A “dry” soil moisture pattern fromTarrawarra showing local control of soil moisture (no lateral drainage). (c) A soilmoisture pattern from Point Nepean, Australia, showing soil texture control on soilmoisture. The soil moisture values ina–c are volumetric moisture in the top 30 cmmeasured using TDR. (d) The pattern of soil texture in the Southern Great Plains(SGP97) Hydrology Experiment study area. (e) A soil moisture pattern controlledby soil texture measured during SGP97. (f ) A soil moisture pattern showing the in-fluence of rainfall variations collected during SGP97 (Jackson et al. 1999). The soilmoisture values ineandf are volumetric moisture in the top 5 cm (approximately) mea-sured using ESTAR. (g) The pattern of maximum NDVI over Australia during 1996.(h) The pattern of maximum NDVI over Australia during 2000.Redrepresents lowNDVI andblue/pinkrepresent high NDVI. Figuresf andg are Commonwealth of Aus-tralia, copyright reproduced by permission from the Environmental Resources Informa-tion Network website, Environment Australia Online, Department of the Environmentand Heritage, Australia (2001).
Ann
u. R
ev. E
arth
Pla
net.
Sci.
2002
.30:
149-
180.
Dow
nloa
ded
from
arj
ourn
als.
annu
alre
view
s.or
gby
Uni
vers
ity o
f C
olor
ado
- B
ould
er o
n 08
/22/
10. F
or p
erso
nal u
se o
nly.
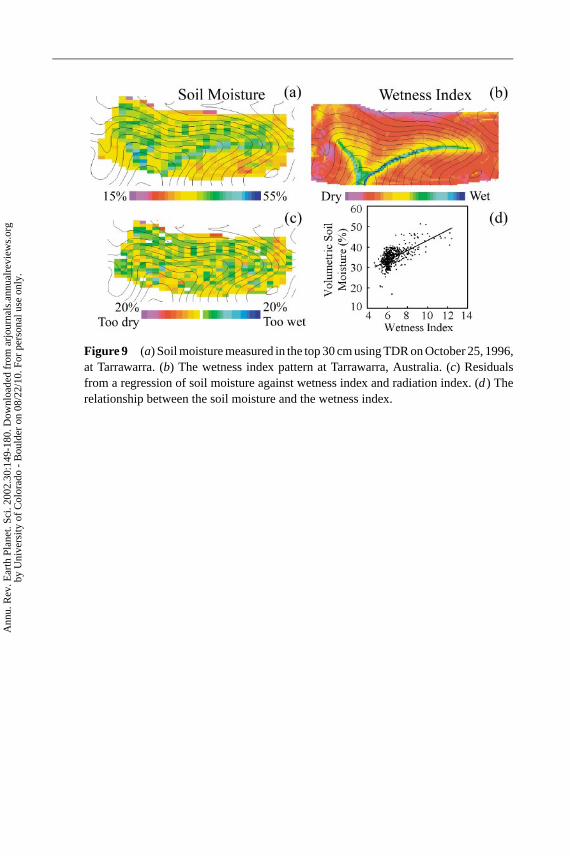
30 Mar 2002 14:26 AR AR154-06-COLOR.tex AR154-06-COLOR.SGM LaTeX2e(2002/01/18)P1: GDL
Figure 9 (a) Soil moisture measured in the top 30 cm using TDR on October 25, 1996,at Tarrawarra. (b) The wetness index pattern at Tarrawarra, Australia. (c) Residualsfrom a regression of soil moisture against wetness index and radiation index. (d) Therelationship between the soil moisture and the wetness index.
Ann
u. R
ev. E
arth
Pla
net.
Sci.
2002
.30:
149-
180.
Dow
nloa
ded
from
arj
ourn
als.
annu
alre
view
s.or
gby
Uni
vers
ity o
f C
olor
ado
- B
ould
er o
n 08
/22/
10. F
or p
erso
nal u
se o
nly.

30 Mar 2002 14:26 AR AR154-06-COLOR.tex AR154-06-COLOR.SGM LaTeX2e(2002/01/18)P1: GDL
Figure 10 Observed, simulated, and error patterns from Tarrawarra for fouroccasions during 1996.
Ann
u. R
ev. E
arth
Pla
net.
Sci.
2002
.30:
149-
180.
Dow
nloa
ded
from
arj
ourn
als.
annu
alre
view
s.or
gby
Uni
vers
ity o
f C
olor
ado
- B
ould
er o
n 08
/22/
10. F
or p
erso
nal u
se o
nly.
P1: FDS
March 20, 2002 13:51 Annual Reviews AR154-FM
Annual Review of Earth and Planetary SciencesVolume 30, 2002
CONTENTS
Frontispiece—Vladimir Keilis-Borok xvi
EARTHQUAKE PREDICTION: STATE-OF-THE-ART AND EMERGINGPOSSIBILITIES, Vladimir Keilis-Borok 1
MODELING COMPLEX, NONLINEAR GEOLOGICAL PROCESSES,Greg A. Valentine, Dongxiao Zhang, and Bruce A. Robinson 35
DATING THE TIME OF ORIGIN OF MAJOR CLADES: MOLECULARCLOCKS AND THE FOSSIL RECORD, Andrew B. Smith andKevin J. Peterson 65
MODERN INTEGRATIONS OF SOLAR SYSTEM DYNAMICS, A. Morbidelli 89
IMPLICATIONS OF EXTRASOLAR PLANETS FOR UNDERSTANDINGPLANET FORMATION, Peter Bodenheimer and D.N.C. Lin 113
SCALING OF SOIL MOISTURE: A HYDROLOGIC PERSPECTIVE,Andrew W. Western, Rodger B. Grayson, and Gunter Bloschl 149
STREAMFLOW NECESSARY FOR ENVIRONMENTAL MAINTENANCE,Peter J. Whiting 181
PETROLOGY OF SUBDUCTED SLABS, Stefano Poli and Max W. Schmidt 207
GEODYNAMO SIMULATIONS—HOW REALISTIC ARE THEY?,Gary A. Glatzmaier 237
MODERN IMAGING USING SEISMIC REFLECTION DATA, Michael C.Fehler and Lianjie Huang 259
PRELUDE TO THE CAMBRIAN EXPLOSION, James W. Valentine 285
PLUTO AND CHARON: FORMATION, SEASONS, COMPOSITION,Michael E. Brown 307
GEOLOGIC STRUCTURE OF THE UPPERMOST OCEANIC CRUST CREATEDAT FAST-TO INTERMEDIATE-RATE SPREADING CENTERS,Jeffrey A. Karson 347
VOLCANOES, FLUIDS, AND LIFE AT MID-OCEAN RIDGE SPREADINGCENTERS, Deborah S. Kelley, John A. Baross, and John R. Delaney 385
MANTLE MIXING: THE GENERATION, PRESERVATION, ANDDESTRUCTION OF CHEMICAL HETEROGENEITY, Peter E. van Keken,Erik H. Hauri, and Chris J. Ballentine 493
ix
Ann
u. R
ev. E
arth
Pla
net.
Sci.
2002
.30:
149-
180.
Dow
nloa
ded
from
arj
ourn
als.
annu
alre
view
s.or
gby
Uni
vers
ity o
f C
olor
ado
- B
ould
er o
n 08
/22/
10. F
or p
erso
nal u
se o
nly.

P1: FDS
March 20, 2002 13:51 Annual Reviews AR154-FM
x CONTENTS
FOSSIL PLANTS AS INDICATORS OF THE PHANEROZOIC GLOBALCARBON CYCLE, D.J. Beerling and D.L. Royer 527
INDEXESSubject Index 557Cumulative Index of Contributing Authors, Volumes 20–30 583Cumulative Index of Chapter Titles, Volumes 20–30 586
ERRATAAn online log of corrections to Annual Review of Earth andPlanetary Sciences chapters (if any, 1997 to the present)may be found at http://earth.annualreviews.org/
Ann
u. R
ev. E
arth
Pla
net.
Sci.
2002
.30:
149-
180.
Dow
nloa
ded
from
arj
ourn
als.
annu
alre
view
s.or
gby
Uni
vers
ity o
f C
olor
ado
- B
ould
er o
n 08
/22/
10. F
or p
erso
nal u
se o
nly.