scaling of respiratory variables in mammals1.pdodds/files/papers/others/1966/stahl1966a.pdf ·...
TRANSCRIPT
Scaling of respiratory variables in mammals1.
WALTER R. STAHLDepartment of Biometrics, Oregon Regional Primate Research Center,Beaverton, Oregon, and Department of Mathematics,Oregon State University, Corvallis, Oregon
Stahl, Walter R. Scaling of respiratory variables in mammals.J. Appl. Physiol. 22(3): 453-460. 1967.—Data have beencollected from the literature on respiratory variables and correlated against body weight on the assumption of log-log relationships (allometry) with the use of computer regression analysis. Statistically validated power law formulas, with correlationcoefficients of 0.99-0.90, are presented for lung weight, VC,TLC, FRC, Vt, Vd, Vo2, Ve, f, Cl, Dlco, Dlo2, total respiratory flow resistance, work per breath, and several nonrespiratory parameters. The study de.-is principally with the rat-human size range, but the prediction formulas probably covermice to steer and possibly all mammals. Predicted and observedvalues are compared for the rat, cat, dog, and man; goodagreement is demonstrated. Size-independent dimensionlessand dimensional respirator)- invariants or "design parameters"may be obtained by forming simple and complex quotientsfrom the individual power laws that have net residual massexponents (dependency on body weight) approaching zero.
respiratory scaling laws; respiratory allometry; body size andrespiratory variables; respiratory dimensional constants
ammals occur in the size range of 2.5-g shrews to150-metric-ton biue whales, which represents a weightincrease of roughly 70 million. In spite of this enormousvariation in weight the heart, lungs, kidneys and othermajor organs of mammals show much similarity inmorphology and function. The 1- to 2-g heart of a ratand 100-kg heart of a medium-sized whale look surprisingly alike except for size. Integrated scaling ofphysical variables is a necessity for function of themammalian system over any substantial changes in bodyweight. This study deals with the scaling laws or powerlaw prediction formulas for basic respiratory variables.
In a series of previous reports the author (54, 57)explored the application of engineering dimensionalanalysis or physical analogue theor)" in physiology. Bycanceling statistically fitted power law prediction formu-
Rcceivcd for publication 14 February 1966."This study was supported by National Institutes of Health
Grants FR 00163 and GM 13605-01.'Publication No. 181 ofthe Oregon Regional Primate Research
Center.
las for various physiological parameters it is possible toobtain dimensional constants and dimensionless "designcriteria" which characterize integrated mammalianphysiology. It follows that lungs in small and largemammals are physically similar systems or physicalanalogues of each other, as this concept is used indimensional analysis theory. The reduction of data to
species of mammals.
Data were collected from standard physiologicaljournals, handbooks, etc., checked for units consistencyand general validity, and key punched for computerprocessing. Handbooks examined include those editedby Spector (27), Dittmer and Grebe (3), Altman andDittmer (7, 8), and Fenn and Rahn (22, 23). Major setsof comparative respiratory data are provided by Crosfilland Widdicombe (17), Agostoni, Thimm, and Fenn(2), and Radford (50). Power law formulas for respiratory parameters have been discussed previously byBrody (10), Adolph (1), Guyton (25), Gunther andGuerra (24), Drorbaugh (18), Bartels (5), Kleinman andRadford (34), and Tenney and Remmers (59). Specificreports were also used, containing data on the rat (38,39, 43), cat (6, 11, 19, 22, 31, 37, 44-46, 52), dog (3, 12,13, 16, 29, 33, 36, 40, 41, 49, 53, 58), goats and sheep(3, 4, 26), and steer and horses (10, 23). Normal humanvalues are given by Comroe et al. (14). The majority ofdata points are from a comparatively small number ofreports by experienced respiratory physiologists who didrepeated determinations on groups of animals.
Statistical analysis was performed on a SDS-920 computer (with the assistance of D. L. Lindgren and D.Williams). The data were transformed to base 10 logsand then fitted by a conventional least-squares regressionanalysis, to yield the parameters in the "allometric"formula x = aMb, with x = any variable and M =mass or body weight in kilograms. The parameter a isthe actual value of the variable for a i-kg "standardanimal" while b is the slope on a log-log graph. Themost informative statistical measures were taken to bethe correlation coefficient (r), 95 % confidence limits for
\V. R. STAHL
TABLE i. Power law prediction parameters for respiratoryvariables in mammals*
V a r i a b l e . L m t s . : 6 r X - S o I S , .
I otal lung wt, gfTotal lung cap, mlVital cap, mlFunct rcsid cap, mlTidal vol, mlDead space, mlResp rate, min-1Minute vol ml/minOxygen uptake, ml/
minLung complianee,
ml/cm H«0Thoracic compli
ance, ml/cm PLOTotal compliance,
ml/cm H--0Total airway resist,
cm H-O/(l iter/sec)
Work/breath, g-cmPower of breath
ing, g-cm/minDiffusing cap-CO,
ml/min per mmHg
Diffusing cap 0»,nil/min per mmHg
Total blood vol, ml1 leart wt, g jCardiac output,
ml /minCardiac rate, min-1Bodv area, n-
O.99 0.96 > 100 ^-15 500.021 . 0 6 0 . 9 8 3 3 3 1 4 4 0 0 . 0 2• • ° 3 ° - 9 9 3 ' 5 • ' 1 9 0 - 0 11 . 1 3 0 . 9 7 2 6 1 2 4 4 5 0 . 0 31 . 0 4 0 . 9 9 6 8 8 7 4 5 0 . 0 1o - 9 6 ° - 9 5 • 5 - 5 9 4 - 0 . 0 9
- 0 . 2 6 — 0 . 9 1 6 9 2 6 4 0 0 . 0 10 .80 0 .98 ( 691 7 450 .010 . 7 6 0 . 9 8 3 4 9 11 3 0 0 . 0 1
1 . 0 8 0 . 9 8 2 8 6 1 5 3 2 0 . 0 2
0 . 8 6 0 . 9 8 6 0 3 1 3 8 0 . 0 5
1 . 0 4 0 . 9 9 11 4 2 1
— 0.70 —0.96 137
1 . 0 8 0 . 9 9 6 8 2 50 . 7 8 0 . 9 8 8 9 2 2
1 . 1 4 0 . 9 6 2 5 8 2 9
1 .18 o. 98 58 39
1 . 0 2 0 . 9 9 5 ^ 4 ° 50.98 o.qo >2fio 10-150 . 8 1 o 9 8 5 6 8 7
• O . 2 5 - O . 8 8 4 4 7 9O . 6 5 > O . C | j > ! ( ) ( ) I O - 2 0
360.O3
380.O4
47 0.044OO.O3
41 O.OI31 O.OI
340.02■300.04
•' Statistical lit of \ = a.W', M in kg; • = correlation coefficient; N = total data points; s„ = 95', conlidencc limits ofa in percent; S„ = mean l±) standard error ofthe estimate of<; in percent; s>. = 95' , confidence limits on /< in slope units frommean slope value. f Modified from Brody (101. J FromStahl 1561.
repeated lines fits (s„ and sb), and the standard error ofthe estimate (.S„), which has much the same significancefor a regression line as a standard deviation for a mean,i.e., 2 S., limits should include 95 r< of cases. With Iosj-Iog;analysis + S„ and — S„ differ slightly (see figures'); amean of the two values is shown in the tables for purposes of simplicity.
As seen from Table 1, over 250 data points werefound for many variables, with greater than 600 fortidal volume, minute volume, and blood volume. Inorder to prevent excessive bias towards human valuesthe generally accepted means for humans were weightedas 20-50 data points, depending on the total number ofnonliiunan values. The number of data points, X, shownin Table 1 is the summation of individual measurementsplus one-half of the number of determinations enteringmean values used in the correlation. This is an arbitrarvbut conservative means for summing means and singledata values; more complex statistical techniques were
not attempted because necessary statistics are not givenwith most published means. A computer program wasalso written for predicting expected ranges of variablesfrom the values and standard errors of the a and bcoefficients.
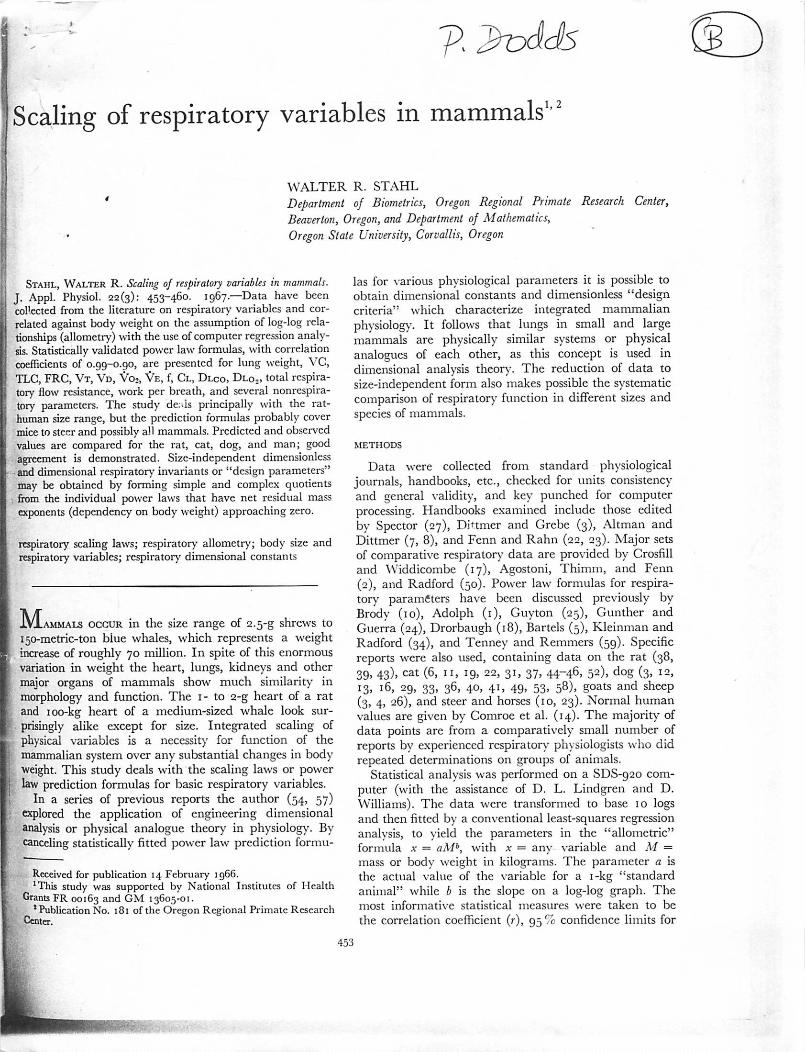
Table 1 presents the power law (allometric) coefficients for respiratory variables. Figs. 1-4 are representative graphs of the data which demonstrate that the linefits are generally satisfactory. The data in Tabic 1 arcnotable for high r values and narrow 95% confidencelimits (s„ and s-,), even in the case of variables on whichthere is limited data, e.g., Dl0«,.
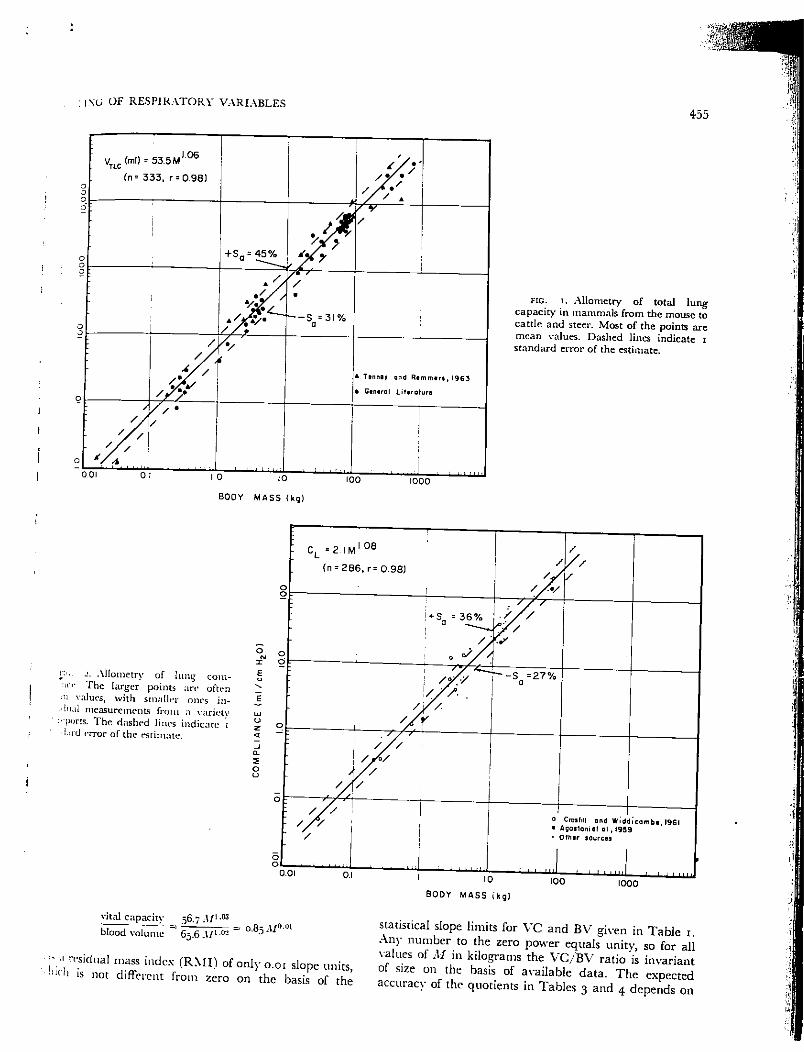
Table 2 contains systematic predictions of 10 respiratory variables for the rat, cat, dog, and man. The valueshown is a range based on simultaneous 1 standard errorlimits of the a and b coefficients. This table reveals surprisingly good agreement of predicted and observedvalues; even better results can be obtained if the specificweights of animals are used in the formulas rather thanan over-all mean species figure. It should be noted thatfor an individual species such as the cat or dog theexperimental results often differ among themselves byiooTc or more because of experimental error or animalvariations. The formulas also give reasonable order ofmagnitude estimates for basic respiratory variables inkangaroos (42) and giraffes (51), although these animalsare probably too specialized to fit precisely on the "normal mammalian" prediction lines. Good results havealso been obtained in prediction of values in the rhesusmonkey. Studies on smaller groups of animals andduring growth of individual species often give less satis-iactory correlations; the power laws arising in maturation are usually not the same as, but comparable to,those found in adult size-change comparisons.
The validity of the computed power law formulas isalso confirmed by comparisons with previously publishedestimates of respiratory allometric coefficients, such asthose of Guyton (25), Drorbaugh (18), and Tenney andRemmers (59). For example, in a report from 1947Guyton found \'t (ml) = 7.4 .\/100, while the newvalue is Vr (ml) = 7.69 .I/1"1; Drorbaugh (18) obtainedVC (ml) = 63 AP-n", with the new formula: VC (ml) =56.7 A/1,08. This author also reported a formula forcompliance (ml 'cm FLO) =1.21 M1-0"; Table 1 yieldsthe formula, compliance (ml cm FLO) = 1.56 A/1-04.The prior allometric estimates were* given withoutnecessary statistical limits, but the old and new regressionformulas agree within -±- 10TI in several cases.
Tables 3 and 4 illustrate what the author (54-56)has called the "allometric cancellation" technique andapplied to a wide variety of physiological and somaticallometric prediction formulas. Consider, for example,the power laws VC (ml) = 56.7 A/1-03 and blood volume(ml) = 65.6 MlM (Af in kg), which were computedindependently using 315 and 840 data points, respectively. The quotient:
; ing OF RESPIRATORY VARIABLES
I o i o
B O O Y M A S S ( k g )
100 1 0 0 0
fig. i . A l lometry of to ta l lungcapacity in mammals from the mouse tocattle and steer. Most of the points aremean values. Dashed lines indicate istandard error of the estimate.
. ,!1C(2. Allometry of lung com-The larger points are often
-:i values, with smaller ones in-•lii.il measurements from a variety
;-ports. The dashed lines indicate iTtrd error ofthe estimate.
0.011 ' I I I ! '
0.11 ' ' '"
o Crosfill and Wi'ddi'eombt.1961• Agosloniat ol, 1959* Othar sources
' 1 0
B O D Y M A S S i k g )
j—i ■ . ■ .--I100 1000
_| 1 I I UM
vital capacity 56.7 M103blood volume = 65.6.1/-■«« = a85^001
v residual mass index (RMI) of only o.ot slope units"<>• >s not different from zero on the basis of the
statistical slope limits for VC and BV given in Table iAny number to the zero power equals unitv, so for allvalues of M in kilograms the VC/BV ratio 'is invariantof size on the basis of available data. The expectedaccuracy of the quotients in Tables 3 and 4 depends on

W. R. STAK
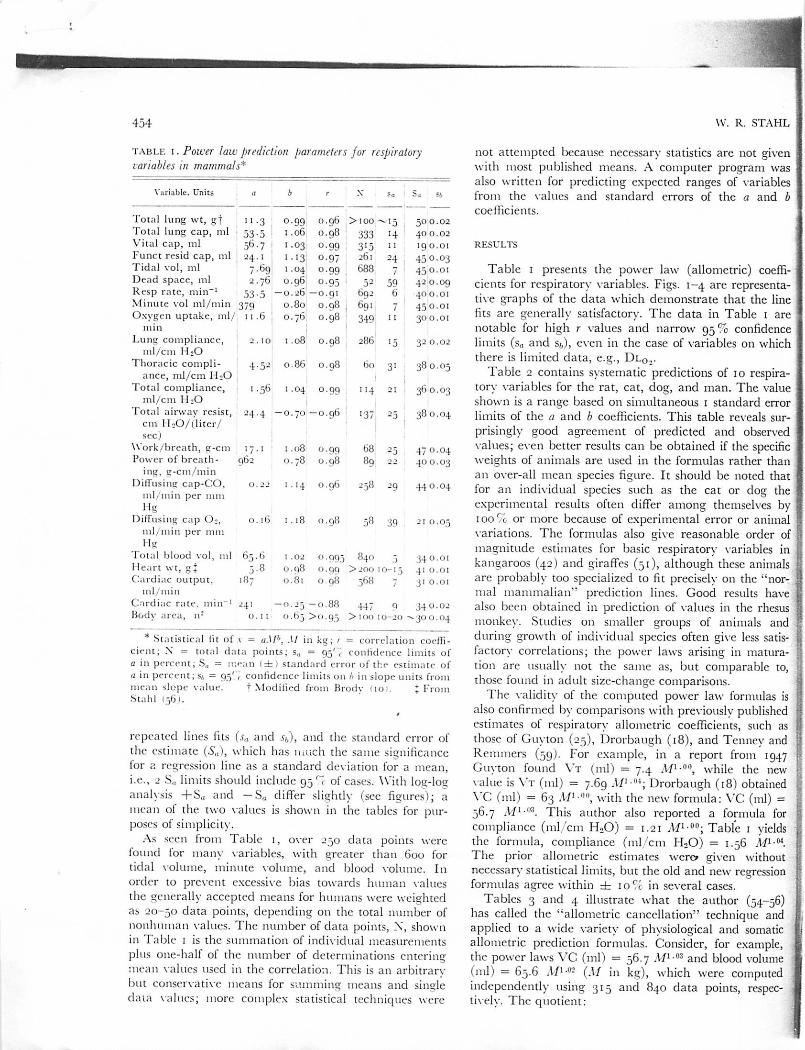
fig. 3. Allometry of carbon monoxide diffusing capacity. Most of thepoints arc individual determinations forthe cat, dog, and man, from sourcescited in the text. The dashed linesindicate 1 standard error ofthe estimate.
0^ 0
DL_C0*0.2(n«258,r=C
2M,M).96) / /
/ / /e —•'e0>IEE
I O
•
/ / r" H u m o n
O : / A /0
-+S =51%
. ' • D o gJH
O
1 0O — : ww vwnO
■
Ca* /A.? 1\ - S Q = 3 4 %2
[/)"3u.J_5 / / /.
0 -r—
1 1 111 in 1 1 1 1 1 11; . i 1 1 n n
B O D Y M A S S ( k g )
— M ( g ) = l I M ° "
Mature Mamma Is (Brody, 1945)
— M ( g ) = 9 6 M 0 9 5
Primates (r = 0.94)
* Zl , Bo boon
SquirrelMonkey
0 . 0 1 0 1
B O D Y M A S S ( k g )
the standard errors of their components and is approximately ±15 to ±50 for various constants. The last twoentries in Table 4 are composed of three variables,yielding dimensionless group with RMI's of —0.02 and0.08, respectively, both within statistical limits of zero.
o Knezavic , 19 65. a H i r d l i c k a . 1 9 2 5
• Crile and Quiring1 9 4 0
•+ Kennard and Wil lner1941
FIG. 4. Allometry of lung weighThe data points are for primates rangirin size from about 0.2 to 100 kg, witsome data also on the tree shrew, whicis an insectivore related to primates. .line previously computed for mammain the mouse-elephant range near)overlaps the new one for primateFrom Stahl (56), which gives citatioifor additional sources'shown on figure.
For respiratory variables RMI values below 0.08 aiprobably not significant but several values above o.in Tables 3 and 4 suggest a systematic small "size effeelon the dimensional constant or dimensionless proportiain question. For example, Dlco per unit of lung weigl
ISG OF RESPIRATORY VARIABLES
.., Predicted and observed basal values of respiratory variables in common mammals*
, .■■ . , . , ! T L C F R C V t V d f \ E C l
130-300130-260
1.0-2.7 0.38-1.2 45-105 0.07-0.18 0.31-0.64: 38-93 ! 0.02-0.071 . 5 - 1 . 8 I 9 7 - 11 5 0 . 1 6 - 0 . 2 4 ■ 0 . 3 - 0 . 6 7 1 - 11 9 1
! 2 7 > 3 9 j 1 7 - 3 9 » 7 * 3 9 ' 7 . 5 0 \ 1 7
58-16066-1456, 17
• 6 - 4 4 5 _ I 5 2 2 - 5 2 0 . 6 - 1 . 6 5 - 1 22 5 - 3 4 5 _ l 6 I 2 6 - 3 0 0 . 3 - 1 . 0 5 - 1 5
' 7 . 4 5 ! 3 * » 4 6 2 , 7 1 7 , 3 1 , 4 5 , 5 0
5 5 0 - 1 , 4 0 0 2 7 0 - 8 0 0 6 9 - 1 9 2 1 7 - 6 7 1 5 - 3 7 1 , 8 0 0 - 4 , 9 0 0 ! 2 5 - 5 4 I 2 . 1 - 5 . 6 2 . 4 - 7 . 79 0 0 - 1 , 0 0 0 2 5 0 - 6 0 0 1 4 0 - 2 6 0 ; 7 0 - 1 0 0 1 8 - 2 6 2 , 0 0 0 - 6 , 0 0 0 : 3 0 - 7 5 0 . 6 - 3 . 7 • - 7 - 1 0
2 1 6 , 5 0 ' 1 6 , 1 7 2 , 4 0 7 , 1 6 4 0 , 5 8 I 4 0 , 5 0 I 1 7 , 4 0 4 9 , 5 8
0 . 7 - 1 . 23*. 37
217-470250-1,000
•7
1,500-3,9001,300-2,900
4,500-12,0002,200-9,500
'7
■led 2,700-7,300 1,500-4,700 330-970 67-330 10-25 6,000-17,000 130-290 0.7-2.0 13-47 15,000-44,000r ied I 5 ,000-6 ,000 2 ,400-3 ,7001400-500 150 11-22 6 ,000-7 ,000 125-200 0 .9-1 .9 17-50 30,000-50,000: ' " r c s 2 > ' 4 ' 4 , 5 0 1 4 , 1 7 1 4 7 » * 4 ' 4 , ' 7 ' 4 , 5 0 1 4 , * 7 ' 4 , 2 1 1 4 , 1 7
i ,• reported range is usually the total range from one or more references. * Predicted values for 0.25-kg rat, 3.7-kg cat, 15.0-:. ■■_•. 70.0-kg man, shown with estimated 1 standard error limits based both on slope and intercept values. TLC = total lung, uv mil): FRC = functional residual capacity (ml); Vt = tidal volume (iii1);Vd = dead space (ml); f = frequency of res-liun iiiiin-'.); VE = minute volume (ml/min); Cl = lung compliance (ml/cm HjO); R = flow resistance (cm H26/(litcrs/
Dlco - diffusing capacity CO (ml/mm Hg per mini; WBR = power of breathing (g-cm/min).
reuses slowly with size, which is not unexpected.uisc of probable changes in proportions of the airways: lung parenchyma during adult size increase. Theill applicability of the respiratory constants, which
-amiably apply to any "typical" mammals, can also-Titicd by comparison with specific animal findings.
I lie over-all mammalian value of VC, body wt is 57kg and does not differ in a statistically significantmcr from the TLC figure of 53.5 ml kg on the basislata in Table 1. Agostoni, Thimm, and Fenn (2)iiccl VC in a variety of animals, finding values of
. |u nl kg in the guinea pig or rabbit and 80-100ky in the cat and dog, but with an over-all mean in-,•< i)>) ml kg range. Cook et al. (16), working with
.-. found FRC body wt = 32.9 ml kg, while thedieted range using 1 standard error and the RMI" 13 shown in Table 1 is 27-43 ml kg. The nominalluf of Vt/body wt is 7.7 ml kg, which agrees withmal data. The power law ratio FRC/TLC is 0.45,
th ;i 0.07 RMI of borderline statistical significance.r human beings, Comroc et al. (14) and Briscoe (9)
I RC as 40-50 % of TLC. A dead space-to-tidal"Inine (Vd/Vt) ratio of 0.3-0.4 is usually cited asurinal for human beings or laboratory mammals (34),•liile the allometric quotient value is 0.36 with a RMII -0.08 which is probably not significant.
I he ratio Ve/Vo2 is sometimes called the "ventilationilex" and has a normal value for humans (14) of about
- I he power law quotient for this variable is 32.7 withvery low RMI. Proportions may also be formed among
!■ V'e and \'o2- The value of Vo2'Q. from Table 1 is"62 (RMI = —0.05), which defines a mean whole-■ony arteriovenous oxygen extraction of 6.2 vol %,
in reasonable agreement with reported data. The valueof Ve/Q is 2.03 (RMI = —0.01); figures of 1.0-2.0 aretypical for human beings.
The same technique may be applied to more complexvariables. The ratio of lung compliance over VC has amean value of 0.037 (cm H20)-1 or 37 ml/cm H20 perliter (RMI = 0.06). Agostoni, Thimm, and Fenn (2)found 28-39 m-/cm HoO per liter in a rat, cat, dog, andman series. Table 3 shows lung compliance per gramlung to be 0.18 ml/cm HsO per g (RMI = 0.99).Crosfill and Widdicombe (17) report figures of 0.2-0.7ml cm FLO per g in a mouse-man series. Cook, Helliesen,and Agathon (15) found quite similar values in growingchildren, though ordinarily it cannot be assumed thatthe scaling laws and constants obtained from adultmammalian comparisons will apply precisely to maturation data. In studies on dogs, Collier and Mead (13)normalized total compliance by body weight, obtainingfigures of 1.6 ml/cm H20 per kg. The predicted valueis 1.56 ml/cm H20 per kg (RMI = 0.04). However,other studies on dogs by Cook et al. (16) yielded 4.6ml/cm H20 per kg.
There are no known prior estimates of the scaling lawsfor diffusing capacity. The observed somatic indices of1.14 for Dlco and 1.18 for Dl0. are in good agreement,suggesting that the somatic index of Dl is distinctlyabove unity; predictions for specific animals in Table 2are in reasonable agreement with measurements. Table3 shows Dlco TLC to be 0.0041 ml/mm Hg per min perml with a RMI of 0.08, which implies that Dl scalesmore closely as TLC than lung weight. In a study of cats,Lawson et al. (37) include data that makes Dlco/TLCequal 0.0039 ml/mm Hg per min per ml, while figures
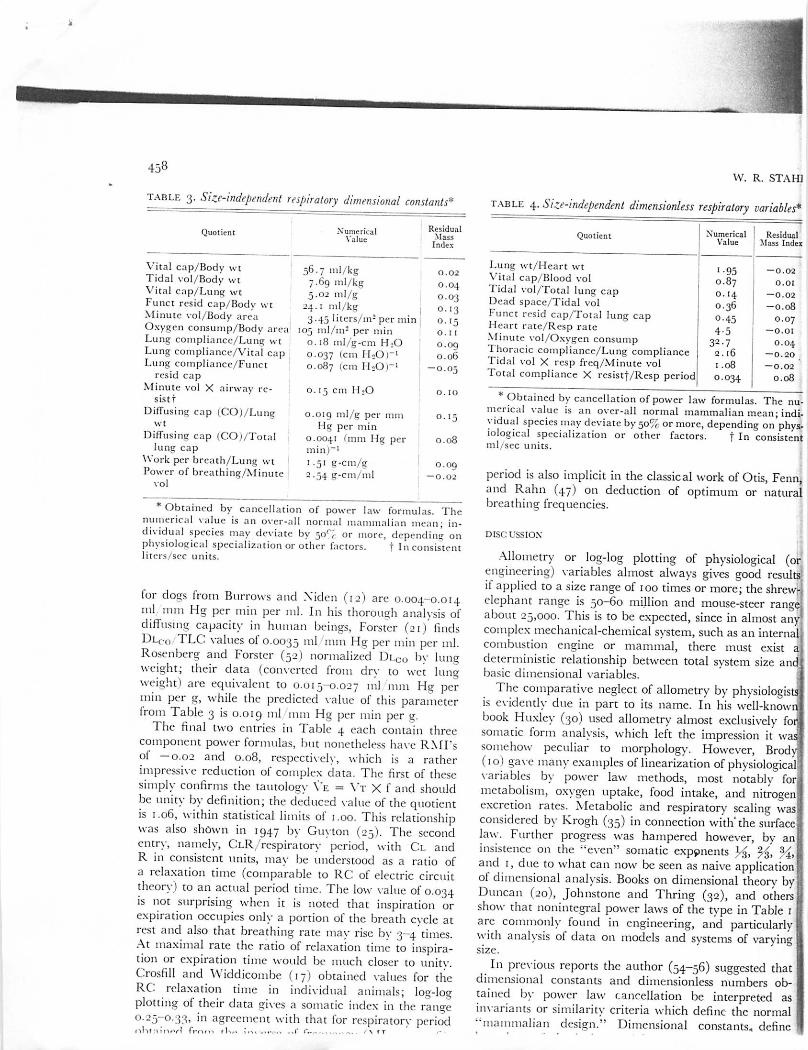
W. R. STAPHTABLE 3. Size-independent respiratory dimensional constants* TABLE 4. Size-independent dimensionless respiratory variables*
Vi ta l cap/Body wtTida l vo l /Body wtVi ta l cap /Lung w tFunct resid cap/Body wtMinute vol /Body areaOxygen consump/Body areaLung compl iance/Lung wtLung compl iance/Vi ta l capLung compl iance /Func t
resid capMinute vol X airway re
s is t !D i f fus ing cap (CO) /Lung
w tD i f f us ing cap (CO j /To ta l
lung capWork per breath/Lung wtPower of breathing/Minute
v o l
NumericalValue
56.7 ml /kg7.69 ml /kg5.02 ml/g
24.1 ml/kg3.45 liters/in2 per min
105 ml/m2 per mino. 18 ml/g -cm HjO0.037 <cm PLO)-10.087 (<-'•■ HiOr1
0.15 cm HjO
0.019 •■■•/? per mmMi; per min
0.0041 lmm Hg permin) -11.51 g-cm/g2.54 g-cm/ml
ResidualMassIndex
numerical value is an over-al l normal mammalian mean; individual species may deviate by 50',' or more, depending onphys io log ica l spec ia l iza t ion or o ther fac tors . f Incons is tentl iters/sec units.
for dogs from Burrows and Xiden (12) are 0.004-0.014ml mm Hg per min per ml. In his thorough analysis ofdiffusing capacity in human beings, Forster (21) findsDlcq TLC values of 0.0035 •••• ■■••" Hg per min per ml.Rosenberg and Forster (52) normalized Dlco by lungweight; their data (converted from dry to wet lungweight) are equivalent to 0.015-0.027 ml mm Hg permin per g, while the predicted value of this parameterfrom Table 3 is 0.019 ml mm Hg per min per °\
The final two entries in Table 4 each contain threecomponent power formulas, but nonetheless have RMI'soi —0.02 and 0.08, respectively, which is a ratherimpressive reduction of complex data. The first of thesesimply confirms the tautology Ve = Vt X f and shouldbe unity by definition; the deduced value of the quotientis 1.06, within statistical limits of 1.00. This relationshipwas also shown in 1947 by Guyton (25). The secondTitry, namely, CLR/respiratory period, with Cl andA in consistent units, may bc understood as a ratio ofa relaxation time (comparable to RC of electric circuittheory) to an actual period time. The low value of 0.034is not surprising when it is noted that inspiration orexpiration occupies only a portion of the breath cycle atrest and also that breathing rate may rise by 3-4 times.At maximal rate the ratio of relaxation time to inspiration or expiration time would be much closer to unity.Crosfill and Widdicombe (17) obtained values for theRC: relaxation time in individual animals; log-loo-plotting of their data gives a somatic index in the range°*257°-33> m agreement with that for respiratory periodn h t I i n o r l l \ - r \ . > > t h . . I , > . f f _ . , \ t r
Q u o t i e n t N u m e r i c a l ! R e s i d u a lV - U l l P \ t , « T „ . U .
L u n g w t / P I c a r t w t . . 9 _ _ Q Q 2V i t a l c a p / B l o o d v o l 0 . 8 ? 0 0 ,T i d a l v o l / T o t a l l u n g c a p 0 . 1 4 - 0 . 0 2D e a d s p a c e / T i d a l v o l Q ^ - 0 . 0 8F u n c t r e s i d c a p / T o t a l l u n g c a p 0 . 4 5 0 0 7H e a r t r a t e / R c s p r a t e 4 . 5 _ 0 - 0 IM i n u t e v o l / O x y g c n c o n s u m p 3 2 . 7 0 . 0 4T h o r a c i c c o m p l i a n c e / L u n g c o m p l i a n c e 2 . 1 6 - 0 . 2 0T i d a l v o l X r e s p f r e q / M i n u t e v o l 1 . 0 8 - 0 . 0 2 "To t a l c o m p l i a n c e X r e s i s t f / R e s p p e r i o d 0 . 0 3 4 0 . 0 8
* Obtained by cancellation of power law formulas. The nu
merical value is an over-al l normal mammalian mean; individual species may deviate by 50^ or more, depending on physi o l o g i c a l s p e c i a l i z a t i o n o r o t h e r f a c t o r s . f I n c o n s i s t e n tml/sec units.
period is also implicit in the classical work of Otis, Fenn,and Rahn (47) on deduction of optimum or naturalbreathing frequencies.
DISCUSSION
Allometry or log-log plotting of physiological (orengineering) variables almost always gives good resultsif applied to a size range of 100 times or more; the shrew-elephant range is 50-60 million and mouse-steer rangeabout 25,000. This is to bc expected, since in almost anycomplex mechanical-chemical system, such as an internacombustion engine or mammal, there must exist adeterministic relationship between total system size andbasic dimensional variables.
The comparative neglect of allometry by physiologistsis evidently due in part to its name. In his well-knownbook Huxley (30) used allometry almost exclusively foisomatic form analysis, which left the impression it wassomehow peculiar to morphology. However, Brody(10) gave many examples of linearization of physiologicalvariables by power law methods, most notably forimetabolism, oxygen uptake, food intake, and nitrogenexcretion rates. Metabolic and respiratory scaling wasconsidered by Krogh (35) in connection with' the surfacelaw. Further progress was hampered however, by aninsistence on the "even" somatic exponents }4, %, %,and 1, due to what can now be seen as naive applicationof dimensional analysis. Books on dimensional theory byDuncan (20), Johnstone and Thring (32), and othersshow that nonintegral power laws of the type in Table 1are commonly found in engineering, and particularlywith analysis of data on models and systems of varyingsize.
In previous reports the author (54-56) suggested thatdimensional constants and dimensionless numbers obtained by power law cancellation be interpreted asinvariants or similarity criteria which define the normal"mammalian design." Dimensional constants, define
" •'-•■* •-»-«.l ̂ --iKAAULES
, >ri::ii
I"■ ire: i.l.
K i l l• .,11
ions ol mammals. Exactly the same sort of« has been used for analysis of numerous
..u,cal artifacts. In the case of internal combustionor example, one finds that homology is defined
dimensional constants of fuel, air, metals etc■nincnt similarity criteria include volume ratios'ratios, flow ratios, thermodynamic combustiontemperature ratios, etc.ou-log plotting technique tends to minimizeal species differences, which is desirable for anprediction formula. Values found in detailed
459
Sf":: r i::;r,s may "rbc mm̂d -*dc„10nstrati»;eh%:io - *; * ** goal of
i I KENCES
\'.r«MOM, fc., 1. I-. Iin.MM, and VV O Ffvv rv,
iMi-Roso, E. C, P. Scott Avr, k" r* •»•
VviRv. M. E„ andC D fnov v 7
" / W . , 6 : , 0 3 4 - 1 0 3 8 , ' . g o , ' " * ; ' d u , t ^ 0 a t S ' L
BxRJ-BU, II. Comparative physiology of oxygen transport in• i m n a l s . / W / 2 : 5 9 9 - 6 0 4 , . 9 6 4 . y & t r a n s p o r t i n
f t \KIORELLI , C. v \n A rVn, - . . . t - 1 ,
,»..;. cardiac i^t-b^^^ESS 2"?. '«•• '« '■ 205:588-590, .963. ' ,L ca[ ' • ' " ' 7-
^ ^»W,,„„„ ,w GiovUi. New vork: RelnhoWi
1 " M R O E . I l l ) . , o r 1 -•few* E Si n r ^' A- R DuBois. U- A.
( 111 jk c" n p 1 11■ - •> r. j. 11EUJESEN, AND S If.™-.., o 1 •l » m v c r n m e e l n m V c . ^ f , . , • • , • • G A r n o . \ . R e l a t i o n
; <** c a, j. Mead> g. l Schre;i( */ edema ,n anesthetized dogs. J. Appl. r,iysioL H, /___
- of ^cht; ANVi G" U,D™-" ^ical eharacteris-• k chest and lungs and the work of breathing in
,J"» mammalian species. J. Physiol., London ,58: -,4)
**ZpTp«u K*̂ monary furon in diff— -—*•'// hysio/. I0. ,069-1072, ,960."■ " • N - . a n d W . R o u s e . P u I m o n a i T d i f r u s i n g c a p a d i y
20.
21.
22.
-•3
I-28
29
30-
3**
32-
33-
34-
35
36
37-
38.
39-
3. vol. ,, chap,. 33, p. 3'39.8;a. Am "l"* &°c., ,964, sect.
£r,*2£-±£S*25i**- -j- l. »««,„„.
;^.-.:v,.|. S. /',„,,/„,„ „//f„teCr„.,/; Lont|on; Methua)i
..̂ ./w r9,:'r3,;;';;:̂ rp °,,a,y vascu,ature-J-Johnstone, R E ami*, m \\t -r
Jouasset-Stweder, D...J. M. Cahill, r.'f gL. ,«„ r *.
LAWSON, W. H. , Jr. , H. N Dl-k f « u- , rFo,ST,..a. RCUoih-p rfjSS^ L2*%ff± E'P-s,.c ,„ diffusi„B capaci,,. ,. ^ ^ ,;nd38l.78U'
Leono, K. J., G. F. Dou-d, and M. X. MacFaRLano. a nevv
W. R. STAHL
technique for tidal volume measurements in unanesthetizedsmall animals. Can. J. Physiol. Pharmacol. 42: 189-198, 1964.
40. Lim, T. P. K., U. C. LOFT, and F. S. Grodins. Effects ofcervical vagotomy on pulmonary ventilation and mechanics.J. Appl. Physiol. 13: 317-324, 1958.
41. Massion, VV. H., D. R. Caldwell, N. A. Early, and J. A.Schilling. The relationship of dry lung weights to pulmonaryfunction in dogs and humans. J. Surg. Res. 2: 287-292, iq62.
42. Maxwell, G. M., R. B. Elliott, and G. M. Kneebone.Hemodynamics of kangaroos and wallabies. Am, J. Physiol.206: 967-970, 1964.
43. Mount, L. E. Ventilation flow-resistance and compliance ofrat lungs. J. Physiol., London 127: 157-167, 1955.
44. Mount, L. E. Variations in the components of the ventilationhindrance of cat lungs. J. Physiol., London 131 : 393-399, 1956.
45. Nadel, J. A., H.J. H. Colebatch, and C. R. Olsen. Location and mechanism of airway constriction after barium sulfatemicroembolism. J. Appl. Physiol. 19: 387-394, 1964.
46. Olsen, C. R., H. J. H. Colebatch, P. E. Mebel, J. A.Nadel, and N. C. Staub. Motor control of pulmonary airwaysstudied by nerve stimulation. J. Appl. Phvsiol. 30: 202-208,•965-
47. Otis, A. B., W. O. Fenn, and H. Rahn. Mechanics of breathing in man. J. Appl. Physiol. 2: 592-607, 1950.
48. Patterson, J. L., Jr., R. H. Goetz, J. T. Doyle, J. V.Warren, et al. Cardiorespiratory dynamics in the ox andgiraffe, with comparative observations on man and othermammals. Am. A*.}'. Acad. Sci. 127: 393-413, 1965.
49. Piiper, J., P. Haab, and II. Rahn. Unequal distribution ofpulmonary diffusing capacity in the anesthetized dog. J.Appl. Physiol. 16: 499-506, i960.
50. Radford, E. P., Jr. Static mechanical properties of mammalian lungs. In: Handbook of Physiology. Respiration. Washington,D. C.: Am. Physiol. Soc, 1964, sect. 3, vol. 1, chapt. 15, p.429-449.
51. Robin, E., J. M. Corson, and G.J. Dammin. The respiratorydead space ofthe giraffe. Nature 186: 24-26, i960.
52. Rosenberg, E., and R. E. Forster. Changes in diffusingcapacity of isolated cat lungs with blood pressure and flow.J. Appl'. Physiol. 15: 883-892, i960.
53. Salzano, J., and F. G. Hall. Cardiopulmonary effects ofcontinous pressure breathing in hypothermic dogs. J. Appl.Physiol. 20:669-674, 1965.
54. Stahl, VV. R. Similarity and dimensional methods in biology.Science 137: 205-212, 1962.
55. Stahl, W. R. The analysis of biological similarity. Advan.Biol. Med. Phys. 9: 355-464, 1963.
56. Stahl, W. R. Organ weights in primates and other mammals.Science 150: 1039-1042, 1965.
57. Stahl, W. R. Scaling of respiratory variables in mammals.Proc. 181/1 Conf. F.ngr. Med. Biol., Philadelphia, 1965, p. 94.
58. Teates, C. D. Effects of unilateral thoracic irradiation on lungfunction. J. Appl. Physiol. 20: 628-636, 1965.
59. Tennev, S. M., and J. E. Remmers. Comparative quantitativemorphology of the mammalian lung: diffusing area. Nature•97o4-57. -963-