scale up for success year 2 mid-year formative evaluation
TRANSCRIPT

Scale Up for Success Year 2 Mid-Year Formative
Evaluation Report
March 2016
Pinellas County Schools Office of Assessment, Accountability and Research
& Title I

2 SCALE UP FOR SUCCESS YEAR 2 FORMATIVE EVALUATION REPORT
Table of Contents
INTRODUCTION Overview of the Scale Up for Success Initiative 3
Goals 3 Interventions 3 Evaluation Design 4
Focus Areas of the Initiative and Corresponding Evaluation Questions 5 Evaluation Methods and Outcome Measures 5 Description of Methodology and Instruments Used 6 Limitations 8
LEARNING ENVIRONMENT: MID-YEAR ACADEMIC FINDINGS Guiding Evaluation Questions for Academic Achievement 9 Instruments and Evaluation Methods Used for the Mid-Year Formative Evaluation 9
Learning Environment: Summary of Academic Achievement Data 9 Additional Guiding Indicators for Academics 10 Teacher, Paraprofessional, and Principal Perceptions of Academic Achievement 12 Paraprofessionals as Teaching Partners 14 Enhanced ELP Supports 16
Summary for Academic Achievement 18 LEARNING ENVIRONMENT: SCHOOL CLIMATE AND STUDENT BEHAVIOR FINDINGS Guiding Questions for the Evaluation of School Climate and Student Behavior 19 Instruments and Evaluation Methods Used for Mid-Year Formative Evaluation 19 Learning Environment: Summary of School Climate and Student Behavior Data 19 Teacher, Paraprofessional, and Principal Perceptions of School Climate and Student Behavior 21 Implementation of PBS and Best Practices in Behavior Intervention 23 Full-time Psychologist and Social Worker 23 Summary for School Climate and Student Behavior 25 LEADERSHIP SUPPORT FINDINGS Guiding Evaluation Questions for Leadership Support 26 Instruments and Evaluation Methods Used for the Mid-Year Formative Evaluation 26
Leadership Support Overview 26 Leadership Support Overview 26 Principal Perceptions of Scale Up for Success Leadership Supports 27 Summary for Leadership Supports 29 FAMILY AND COMMUNITY ENGAGEMENT FINDINGS Guiding Evaluation Questions for Family and Community Involvement 30 Instruments and Evaluation Methods Used for the Mid-Year Formative Evaluation 30 Family and Community Engagement Overview 30 Family and Community Engagement Findings 31
Placement of Mental Health Clinicians and Family Navigators (funded by JWB) 32 Family and Community Engagement Summary 34
RECOMMENDATIONS 35 APPENDIX 39 ADDENDUM FOR MARCH 30, 2016: UPDATED CYCLE ASSESSMENT AND DISCIPLINE DATA 42

3 SCALE UP FOR SUCCESS YEAR 2 FORMATIVE EVALUATION REPORT
Introduction
Overview of the Scale Up for Success Initiative
To combat low performance and support the continued growth of student achievement, the Scale Up for
Success Initiative focuses on five elementary schools in the Pinellas County School District: Campbell Park, Fairmount
Park, Lakewood, Maximo, and Melrose. The initiative was launched in the fall of 2014 and is aimed at increasing student
achievement through a multi-pronged approach.
Goals
Immediate: Build the capacity and effectiveness of school leaders and instructional staff to increase student
achievement at each of the five Scale Up schools.
Long-term: Apply a transference of best practices in the five Scale Up schools to other school sites in the district to
support a widespread increase in student achievement.
Interventions
The interventions in place in these five schools are born out of an extensive literature review around the best
practices in turnaround schools. The work is closely aligned to the 5Essentials framework developed over 20 years
through The University of Chicago Consortium on Chicago School Research (UChicago CCSR). The 5Essentials are
effective leadership, collaborative teachers, supportive environment, involved families, and ambitious instruction.
Rooted in the 5Essentials framework for school reform, the following interventions were put in place:
Intensive support and training for every teacher, including the hiring of a paraprofessional for every classroom to
serve as a teaching partner;
Intensive coaching and support for school leaders, including a district partnership with The New Teacher Project
(TNTP), a national leader in school improvement and principal growth;
Advanced behavior management systems as well as frequent district monitoring to reduce student discipline
incidences and support a stronger learning climate for teachers and students;
Recruitment, retention, and performance bonuses for teachers;
Comprehensive mental health and counseling services available for students and families;
Enhanced extended learning programs and family engagement opportunities to provide unique learning
experiences.

4 SCALE UP FOR SUCCESS YEAR 2 FORMATIVE EVALUATION REPORT
Evaluation Design
The Scale Up for Success Formative Mid-Year Evaluation Report for Year 2 (2015-2016) is an internal
evaluation conducted in partnership between Pinellas County School’s Title I office and the Assessment,
Accountability, and Research (AAR) office. The evaluation design used for the Year 1 (2014-2015) initiative was
collaborative and multi-method. External stakeholders, internal partners, key district personnel, and the evaluation
team met periodically to discuss the implementation and monitoring activities. The Year 1 evaluation provided
baseline data for the Scale Up for Success Initiative. It included evaluation of the processes, inputs, and preliminary
outcomes of the initiative. The primary purpose of the Year 1 Summative Evaluation was to provide a snapshot of the
project implementation strategies as well as to identify the program’s strengths and areas that need to be addressed
for Year 2.
The evaluation design for Year 2 is also collaborative and involves mixed methods—both quantitative and
qualitative. This allows for triangulation of information sources, and to provide a more in-depth understanding of the
initiative as well as the strength of its implementation. The mid-year formative report serves as a checkpoint for the
initiative, with a focus on recommendations on how to enhance implementation. In addition, it provides an overview of
information that can be used to help support decision-making and planning for the 2016-2017 school year. The evaluation
process has been guided by the Program Evaluation Standards developed by the Joint Committee on Standards for
Educational Evaluation1. The Year 2 evaluation follows a developmental evaluation2 process and also follows the
Model for Collaborative Evaluation3 to address the continued growth of the initiative. In this way, data are analyzed
frequently with key stakeholders throughout the school year to provide information for continuous improvement. The
summative report that will be conducted during summer of 2016 will provide more specific outcomes information in
comparison to the Year 1 baseline data. Some of the quantitative data that will be included are assessments in various
subject areas and discipline data across the past two years.
1 Yarbrough, D. B., Shulha, L. M., Hopson, R. K., and Caruthers, F. A. (2011). The program evaluation standards: A guide for evaluators and evaluation users (3rd ed.). Thousand Oaks, CA: Sage. 2 According to Michael Quinn Patton, who established the concept of developmental evaluation, “Developmental Evaluation (DE) is an evaluation approach that can assist social innovators to develop social change initiatives in complex or uncertain environments. DE originators liken their approach to the role of research & development in the private sector product development process because it facilitates real-time, or close to real-time, feedback to program staff thus facilitating a continuous development loop.” (Source: http://betterevaluation.org/plan/approach/developmental_evaluation) 3 “The Model for Collaborative Evaluation (MCE) is a comprehensive framework for guiding collaborative evaluations in a precise, realistic, and useful manner.” Rodríguez-Campos, L., & Rincones-Gómez, R. (2012). Collaborative evaluations: Step-by-step. Stanford, CA: Stanford Business Books.

5 SCALE UP FOR SUCCESS YEAR 2 FORMATIVE EVALUATION REPORT
Focus Areas of the Initiative and Corresponding Evaluation Questions
Learning Environment: This includes Academic Achievement as indicated by improved student achievement and School Climate/Student Behavior, including behavior as indicated by more students being on-task. Guiding Evaluation Questions: (1) How are the additional supports within Scale Up for Success schools resulting in increased academic achievement? (2) How are the additional supports within the Scale Up for Success Initiative supporting the school climate and student behavior? (3) How can these continue to be enhanced?
Leadership Capacity: This encompasses enhanced schoolwide leadership practices to enhance the learning environment including student academic achievement, school climate, and student behavior. Guiding Evaluation Questions: (1) How are the additional supports for school leadership enhancing the schoolwide learning environment? (2) How can these continue to be enhanced?
Family and Community Engagement: This aims to increase family and community involvement in direct support of student academic achievement, enhanced school climate, and improved behavior.
Guiding Evaluation Questions: (1) How has family and community engagement been enhanced in the Scale Up schools to support student success/access to learning? (2) How can this continue to be enhanced?
Evaluation Methods and Outcome Measures
The following table lists the key evaluation methods and indicators for the current formative report
and those that will be used for the end of year summative report. Following the table, a more detailed
description of district-specific instruments and methods that were used within multiple sections of the
evaluation (e.g., both Academic Achievement and School Climate and Behavior) is provided. Additional
information on instruments and methodology used are provided in each corresponding section throughout
the document.

6 SCALE UP FOR SUCCESS YEAR 2 FORMATIVE EVALUATION REPORT
Focus Areas Key Evaluation Methods and Outcome Measures
Learning Environment: Academic Achievement
Formative (Mid-Year) include: Reading proficiency (Istation progress and District cycle data) Math Proficiency (ST Math progress and District cycle data) Science proficiency (District cycle data) AAR Walkthrough Tool Principal interview data Paraprofessional and teacher focus group data
Summative (End of Year) will include: Reading and math proficiency (SAT-10 for 1st and 2nd grade and FSA for 3rd-5th grade) Reading and math gains (SAT-10 for 1st and 2nd grade and FSA for 3rd-5th grade) Science proficiency (5th grade Science FCAT) Staff and parent survey data
Learning Environment: School Climate and Behavior
Formative (Mid-Year) include: Number of disciplinary referrals/repeated misbehaviors Number of Out of School Suspensions (OSS) Evidence of Positive Behavior Support (PBS) through PBS walkthroughs AAR Walkthrough Tool Principal interview data Paraprofessional and teacher focus group data Summative (End of Year) will include: The indicators listed above as well as staff and parent survey data
Leadership Supports Formative (Mid-Year) include: Principal interviews Overview and evidence of implementation of principal supports (TNTP coaching, district ISM visits, etc.)
Summative (End of Year) will include: Trend data from the 2014-2015 school year in comparison to the 2015-2016 school year based on the AdvancED
survey
Family and Community Involvement
Formative (Mid-Year) include: Attendance at family engagement activities Overview of students utilizing school support services (school social worker, school psychologist) Use of family navigation and mental health counseling services for students and families Summative (End of Year) will include: The indicators listed above as well as staff and parent survey data
Description of Methodology and Instruments Used
The following is a detailed description of specific instruments and methodologies used as part of the
mid-year formative evaluation. Again, it is important to note that the instruments and methods used have
been formative in nature, and an end of year summative report will be conducted in the summer of 2016.
AAR Classroom Walkthroughs
The evaluation team developed a classroom walkthrough tool specific to the Scale Up initiative, which is
referred to as the AAR Classroom Walkthrough Tool. The purpose of this tool is to provide a snapshot of the classrooms
in relation to the specified goals and benchmarks of the initiative, especially those regarding paraprofessionals.
Specifically, this tool helps to monitor whether the paraprofessional is present in the room and is actively supporting
learning. In addition, it allows the evaluation team a way to see trends in the number of students demonstrating on-task

7 SCALE UP FOR SUCCESS YEAR 2 FORMATIVE EVALUATION REPORT
behavior. In order to ensure accuracy and validity4, the evaluation team completed an in-depth process to develop the
tool and to calibrate observation findings with each other. A total of 162 classrooms were visited for three to five
minutes each, with one series of observations occurring during September-October 2015 and one series occurring in
December of 2015.
Teacher and Paraprofessional Focus Groups, and Summary of Written Responses
Teacher and paraprofessional focus groups were conducted in each of the five schools by the lead evaluator and
members of the evaluation team, following a detailed focus group protocol and guiding questions. In total, there were
five teacher focus groups and five paraprofessional focus groups—one of each at each Scale Up school site. The teacher
focus group at each school had seven to ten participants who were randomly selected from each grade level, including
pre-K and specials. Paraprofessional focus groups also followed a similar process. There were thirty teachers and thirty-
one paraprofessionals from the focus groups who completed and returned the anonymous written response forms.
Responses from the focus groups were analyzed and coded based on the evaluation questions. Relevant and
prevalent themes that emerged are noted in this evaluation5. The data for written responses were coded separately by
two members of the evaluation team to add a layer of validity and to confirm interpretation of answers provided. For
the results section, if a response was not provided or if the teacher did not address the question asked, then the answer
was not included in the analysis for that specific question. It is important to note that quotes and individual responses, in
some cases, are school-specific and may not reflect what is occurring at all school sites.
Principal Interviews
Individual principal interviews were conducted with each Scale Up school principal by the lead evaluator and the
executive manager of evaluation for Pinellas County Schools. Each interview followed a specified interview protocol and
guiding questions. Themes from these interviews were combined, and are presented within the academic achievement,
school climate/behavior, and leadership sections of this evaluation report. The process of developing themes was similar
to that of the focus groups, in which two members of the evaluation team reviewed themes to enhance validity.
Development of Recommendations
The evaluation team met with representatives from the school district and from the Juvenile Welfare Board
(JWB) to refine and make additions to the recommendations. This collaborative process is in place to support the
utilization of the evaluation recommendations in this report. These recommendations were further vetted through AAR,
district leadership, and the newly hired director of school leadership to align recommendations with best practices in
school turnaround.
4 Aligns with best practices on instrument development according to the Standards for Educational and Psychological Testing (2014) and the Program Evaluation Standards for accuracy as outlined by the Joint Committee on Standards for Educational Evaluation (JCSEE). 5 Miles, M.B., Huberman, A.M., & Saldaña, J. (2014). Qualitative data analysis: A methods sourcebook. Los Angeles: Sage.

8 SCALE UP FOR SUCCESS YEAR 2 FORMATIVE EVALUATION REPORT
Limitations
Due to the complex nature of organizations and the school improvement processes, a mixed methods
approach was used. In terms of quantitative data that has been used, the quality of the data sources and consistency
with data entry can potentially be a limitation. As such, the evaluation team worked closely with district personnel and
schools to support data accuracy. In some cases, the cycle assessments used by the district had changes to the format
of the test from last school year to this school year. These are noted in the academic section. Therefore,
interpretations of comparative data are limited.
The qualitative data are an important component to the overall evaluation, especially in addressing individual
perceptions of change in the schools and recommendations for how to continue to enhance the initiative. In some
cases, numerical trend data have been provided. While this information shows the frequency of specific answers, due
to the nature of the qualitative data, interpretation of these data is limited. These trends provide a preliminary
overview and do not provide a summative or definitive answer to the evaluation questions. More summative
conclusions will be provided in the end of year summative report once survey and state assessment data are available.

9 SCALE UP FOR SUCCESS YEAR 2 FORMATIVE EVALUATION REPORT
Learning Environment: Mid-Year Academic Findings
Guiding Evaluation Questions for Academic Achievement
(1) How are the additional supports within Scale Up schools resulting in increased academic achievement?
(2) How can these continue to be enhanced?
Instruments and Evaluation Methods Used for the Mid-Year Formative Evaluation
Reading proficiency (Istation progress and District cycle data)
Math Proficiency (ST Math progress and District cycle data)
Science proficiency (District cycle data)
AAR Walkthrough Tool
Principal interview data
Paraprofessional and teacher focus group data
Learning Environment: Summary of Academic Achievement Data
This section provides a summary of how the Scale Up schools are progressing toward increased student
achievement in the areas of reading, math, and science. In addition, it provides a comparison of Scale Up schools to the
district overall. The charts below show the overall percentages of students testing at the level of “proficient” for the
Pinellas School District cycle assessments for math, language arts (ELA), and science. Comparisons are provided
between the 2014 data (2014-2015 school year) and the 2015 data (2015-2016 school year) as well as between totals
for all of the five Scale Up schools combined in comparison to district averages. The percent change for the math and
ELA cycle assessments in every grade level indicated that there was a greater percentage increase in the Scale Up
schools than in the district overall. However, the results for science are mixed. More definitive data will be included in
the end of year summative evaluation report. This will include results from FSA, SAT-10, and 5th Grade Science FCAT.
Additional school by school data is provided in Appendix A.
The main academic outcome indicators used for the formative evaluation are the year-to-year growth comparisons for all
Scale Up schools as they relate to overall district growth. Based on the data, it appears that the strategies employed are
potentially making a difference in reading and math achievement at the five Scale Up schools as a whole.

10 SCALE UP FOR SUCCESS YEAR 2 FORMATIVE EVALUATION REPORT
District Cycle Assessment Proficiency Percentages and Growth Data
ELA Cycle I Percentages of Students Testing as Proficient
Total for Scale Up Schools Pinellas School District
2014 2015 % Change 2014 2015 % Change
1st Grade Proficient 51% 55% 4% 68% 63% -6%
2nd Grade Proficient 16% 22% 6% 44% 40% -4%
3rd Grade Proficient* 22% 43%
4th Grade Proficient** 8% 9% 1% 38% 29% -9%
5th Grade Proficient 14% 21% 7% 48% 51% 3%
Math Cycle II Percentages of Students Testing as Proficient
Total for Scale Up Schools Pinellas School District
2014 2015 % Change 2014 2015 % Change
1st Grade Proficient 21% 42% 21% 36% 40% 4%
2nd Grade Proficient 24% 29% 5% 57% 49% -8%
3rd Grade Proficient*** 34% 21% -13% 58% 34% -24%
4th Grade Proficient**** 5% 9% 4% 34% 25% -9%
5th Grade Proficient**** 12% 22% 10% 39% 46% 7%
Science Cycle I Percentages of Students Testing as Proficient
Total for Scale Up Schools Pinellas School District
2014 2015 % Change 2014 2015 % Change
1st Grade Proficient 51% 57% 6% 72% 74% 2%
2nd Grade Proficient 35% 46% 11% 68% 72% 4%
3rd Grade Proficient 11% 20% 9% 39% 43% 4%
4th Grade Proficient 8% 13% 5% 42% 49% 7%
5th Grade Proficient 18% 19% 1% 54% 56% 2%
*The test for ELA 3rd grade was rewritten for the 2015-2016 school year. As such, comparisons for 3rd grade were omitted. **The testing format for ELA 4th grade changed from paper-based in 2014-2015 to computer-based in 2015-2016. As such, interpretations or conclusions based on these data are limited. ***The testing format changed from paper-based to online and multi-select items were added. As such, interpretations or conclusions based on these data are limited. ****The testing format changed to include multi-select items (note: the testing for 4th and 5th grade were online for both 2014-2015 and 2015-2016). Therefore, interpretations or conclusions based on these data are limited.
Additional Guiding Indicators for Academics
One of the primary interventions currently being implemented in Pinellas’s L3006 elementary schools is an
extended day and the Intervention Hour, an hour dedicated to small groups and individualized support for
6 L300 refers to those 300 schools throughout the State of Florida that have the lowest performance, as indicated by Florida Department of Education indicators.

11 SCALE UP FOR SUCCESS YEAR 2 FORMATIVE EVALUATION REPORT
students. One of the primary components of this extended time is the use of the computer-based program Istation7
to support reading growth. Istation incorporates monthly assessments that provide an ability score, corresponding
Instructional Tier Level8, and a Cycle of Instruction. The progress of students in Istation provides an indication of
student achievement in reading comprehension.
A useful indicator for student growth and for demonstration of implementation fidelity at each school site is
the percentage of students who have moved from one Tier to a different Tier, with Tier 3 being associated with the
lowest achievement level and Tier 1 indicating the highest achievement level. The graph below shows the
percentage of students who have moved from each Tier Level within Istation to a different Tier Level since the
beginning of the school year. From September 2015 to January 2016, three of the five schools did see an increase in
students moving to Tier 1 with the exception of Lakewood and Melrose. Maximo had the highest percentage of
students that moved into Tier 1 (11%). Based on these results, there is a demonstrated need for Lakewood and
Melrose to increase the usage of Istation to provide more individualized support for students in reading. Additional
information regarding Istation usage and ability levels across schools is provided in Appendix B. These data were
presented to district leadership for follow-up within these schools.
A computer-based program that is used to supplement math instruction is ST Math, which is a fluency software
program for math comprehension and proficiency. An overview of the progress at each school in ST Math is presented
below. The expected progress for ST Math for the end of December 2015 is 40%. The graph below shows those schools
that are at the level of expected progress for this time point in the year. Campbell Park and Fairmount Park are the only
7 “Istation’s computer-adaptive assessments (known as ISIP™) immediately place students on personalized instructional paths unique to their academic needs.” (Source: http://www.istation.com/About) 8 “Tiers” in Istation are defined differently than those tier levels with the response to Intervention process. The data presented here reflects the expected growth of a student at a particular grade level based on the normative Instructional Tier Goals between the months of September and January of 2016. These goals are research based and are determined by Istation.

12 SCALE UP FOR SUCCESS YEAR 2 FORMATIVE EVALUATION REPORT
schools that are at or above the 40% level, which was the expected progress at that point in time. Usage data indicates
that Campbell Park and Fairmount Park also have a higher average number of student sessions for ST Math, with 90
sessions at Campbell Park and 73 sessions at Fairmount Park (as of 12/18/15). Maximo is at 52 sessions, Lakewood is at
45 sessions, and Melrose is at 41 sessions. An increase in sessions is associated with a higher level of progress for
students within the program. Again, these data were presented to district leadership for follow-up within these schools.
Teacher, Paraprofessional, and Principal Perceptions of Academic Achievement
The following information is based on paraprofessional and teacher focus groups as well as individual principal
interviews held at each school9 10. The responses suggest that teachers, paraprofessionals, and principals perceive that
there are incremental improvements in student academic achievement for students. However, additional intensive
supports are needed to make this even stronger.
Comparison of Academic Achievement from Last School Year to the Current School Year
Teachers at the five Scale Up schools were asked, “In comparison to last year, how would you describe the
student learning and academic achievement at your school?” According to the written responses collected from 30
teachers, almost half indicated that student learning and academic achievement has improved overall. Some indicated
that there has not been a marked improvement in student learning and academic achievement.
Paraprofessionals were asked, “How would you describe the student learning and academic achievement at your
school and in your classroom?” The written responses to this question were mixed, with approximately three-fourths of
the responses being positive or neutral. Overall, the responses reflected the different classroom make-ups and how
9 Five teacher focus groups and five paraprofessional focus groups were held in in December 2015, one of each at each Scale Up school site. There were thirty teachers and 31 paraprofessionals from the focus groups who completed and returned the anonymous written responses. In addition, hour-long principal interviews were conducted with each of the five principals. Additional details on this process are provide in the section entitled Description of Methodology and Instrument Used. 10 Note: A faculty and parent survey will be conducted in Spring 2016 as part of the end of year summative evaluation.

13 SCALE UP FOR SUCCESS YEAR 2 FORMATIVE EVALUATION REPORT
behaviors of a few students can impact the learning of the other students in the class. Combined with the mostly
positive responses regarding the ways in which behavior has improved from last year to this year, one possibility is that
while behavior is showing improvement at the majority of the Scale Up school sites, there are still concerns about the
ways in which some student behaviors are continuing to distract others from learning in the classroom. Other themes
that emerged were concerns about the lack of foundational skills that students have when they enter school and the
importance of family involvement to reinforce learning at home. In addition, during the paraprofessional focus groups,
the paraprofessionals mentioned that there are many academic supports for these students. Principal interviews
reinforced these themes as well.
Teachers’ Perceptions of Current Interventions That are Making a Positive Difference in Academics
Teachers were asked, “What are the current interventions that are in place at your school that have helped make a
positive difference in student learning and academic achievement?” The most frequently mentioned interventions, in
order of frequency of responses, were having strong schoolwide behavioral processes in place to allow more learning to
occur; utilizing paraprofessionals to work with small groups; implementation of PBS strategies (such as providing
incentives to students and increasing the amount of positive to negative interactions between the teacher and student);
academic coaches; TNTP; the “Magic Hour” (Intervention Hour) for more individualized instruction; iStation and ST
Math; professional learning communities to consistently review and act upon student data; and small class sizes.
Teacher, Paraprofessional, and Principal Suggestions to Support Academic Achievement
Teachers and paraprofessionals were asked, “What other supports at the district or school level would you
recommend to support you in the area of academics?” An overview of their responses is provided below.
Themes Based on Teacher and Paraprofessional Suggestions (By Order of Frequency)
Need for more modeling and coaching
More relevant curriculum and flexibility in lesson planning
More relevant training and observations of highly effective teachers
More time to plan and prepare for lessons, and for teachers and paraprofessionals to plan together
Teachers mentioned that they need more time for lesson planning and preparation. In addition, while the TNTP
strategies that they are learning have been helpful, there is a need for more specific trainings, modeling, and coaching
on more extreme behavior issues. Another theme that emerged in both the teacher and paraprofessional focus groups
was the way in which behavior holds students back and how students need more support prior to coming to school to
“Our kids are art kids, music kids…They love to
perform. We need to do more at our school to
embrace or bridge the gap…”
“I think that the coaches help you feel supported
because when you have difficulty with teaching a
standard they will help you find the most effective
method to teach.”

14 SCALE UP FOR SUCCESS YEAR 2 FORMATIVE EVALUATION REPORT
ensure their academic growth. Teachers expressed that paraprofessionals are a helpful addition, especially when they
have a strong background in working with children and the training to support them. Although the paraprofessionals are
helpful with behavior and with pulling small groups, they may be limited in their expertise to support struggling learners
in comparison to the teacher or a specialist. While the teachers see the need to assess student growth and gaps in
learning, many of them expressed that there is too much testing and that students are getting “burnt out” from all of
the testing. Instead, they would like to implement more strategies to engage students.
Paraprofessionals as Teaching Partners
The principals were given the opportunity to team each classroom teacher with a full-time
paraprofessional as a teacher partner. The addition of the paraprofessional is intended to support the goal of
improved academic and behavioral outcomes across the five schools. Three of the five Scale Up schools had 100%
of the paraprofessional positions filled by the first day of school. The other two schools, Fairmount Park and
Melrose, had 87% and 91% of their positions filled, respectively.
Paraprofessional Trainings and Clarity of Role
Based on feedback from the Scale Up for Success Year 1 Summative Evaluation Report, the school district
recognized a need to further clarify the role of the paraprofessionals and to provide trainings as early as possible in the
school year. This school year, the majority of the paraprofessionals received training that addressed the
paraprofessional’s role, strategies for managing student behavior, and how to support academics through small group
and individualized instruction. Seventy-nine of the paraprofessionals received this training prior to school starting
(August 11, 2015) and an additional 56 received a make-up training in September, for a total of 135 paraprofessionals
trained out of the 141 paraprofessional positions across the five Scale Up school sites11. In addition, the elementary
math supervisor and the ST Math coordinator developed and implemented a plan to provide additional training to the
majority of the paraprofessionals. These trainings occurred in late November and early December. During the
paraprofessional focus groups at each Scale Up school site, paraprofessionals mentioned that the trainings that have
been provided to them overall have been helpful, and that more trainings in behavior management, especially for
dealing with more challenging behaviors, is necessary.
During the focus groups, paraprofessionals were asked, “Do you feel that you have a clear understanding of your
role as a paraprofessional at a Scale Up for Success school (e.g., job description, role in the classroom)?” The written
responses to this question were analyzed. Over 90% responded that the role was clear to them or somewhat clear (21
total). Paraprofessionals provided some suggestions regarding clarity of roles, which included introducing one
intervention at a time and having the opportunity to work with the curriculum materials more during the trainings so
11 Since not all of the 141 paraprofessional positions were filled at the time of the trainings, the percentage of paraprofessionals trained is not available.

15 SCALE UP FOR SUCCESS YEAR 2 FORMATIVE EVALUATION REPORT
that they gain more familiarity with them. Other supports for helping paraprofessionals enhance behavior, school
climate, and academics that paraprofessionals suggested were:
They would like to have more extensive training on how to manage student behavior. For example, one
paraprofessional mentioned that it would be helpful to observe how to deal with difficult behaviors in an actual
classroom setting. Training on Positive Behavior Supports was mentioned multiple times as well.
Team leaders and mentors would be helpful in supporting paraprofessionals in their role.
Assigning paraprofessionals to the music and art classrooms would allow them more time to plan with teachers.
They would like additional support from administration with addressing behavior issues, such as having more
behavior specialists.
Based on the principal interviews, some principals had additional suggestions for how to further support
paraprofessionals:
Continue to have trainings for paraprofessionals prior to the school year starting. Provide additional professional
development for the paraprofessionals and make it ongoing.
Continue to refine the role of the paraprofessional and develop a system of accountability for the paraprofessionals.
Provide time for the paraprofessionals to lesson plan for their small groups.
Continue to train the teachers how to more fully utilize the paraprofessionals.
The evaluation team developed a classroom walkthrough tool specific to the Scale Up initiative, which is
referred to as the AAR Classroom Walkthrough Tool12. There were 162 classrooms visited for three to five minutes
each, with one series of observations occurring during September-October 2015 and one series occurring in
December of 2015. The data that was collected during the walkthroughs indicated that 86% of paraprofessionals
who were present in the classroom demonstrated that they were actively supporting learning13.
*Of those who were present14
12 Details of this tool are provided in the section entitled Description of Methodology and Instrument Used. 13 Supporting the learning environment is defined as being actively involved in the whole-group, small group, or one-on-one instruction. 14 In some cases, paraprofessionals were not present in the class because they were at a training, working with a student outside of the classroom, etc.
Yes, 86%
No, 14%
Percentage of Paras Demonstrating Support of the Learning Environment*
(Source: AAR Walkthrough Data)

16 SCALE UP FOR SUCCESS YEAR 2 FORMATIVE EVALUATION REPORT
Of the 2,305 students that the evaluation team observed, 90% of students demonstrated on-task
behavior15. These data suggest that the majority of students across the five Scale Up schools are complying with
teachers and other instructional staff. While one cannot make a direct connection between the paraprofessionals
being present and students who were on-task, based on anecdotal evidence and data from focus groups, having
paraprofessionals is perceived as having an overall positive influence on student behavior. Still, there is no direct
evidence to support the fact that the paraprofessionals are having a marked impact on academic achievement.
Enhanced ELP Supports
The Scale Up schools received an increased budget for their Extended Learning Programs, which allows the
schools to provide a deeper, wider scope to after school programs. This includes Promise Time and implementation of
the i-Ready computer-based instructional program that focuses on reading and math skills. It is important to note that
Promise Time is not the sole after school program offered at these schools, but is the one that has received additional
funding as part of this initiative to potentially serve more students16. Promise Time is designed to provide a structured,
safe and enriching academic program after school for students to accelerate achievement. Tutoring and enrichment
programs are led by certified Pinellas County teachers or paraprofessionals. Promise Time is open to all students who
are in kindergarten through 5th grade at the target school sites. The target enrollment for Promise Time is 100
students. In order to have a more accurate picture of students who are actively enrolled, the number of students who
have tested in math or reading for the i-Ready computer program was used. As of January 2016, Fairmont Park and
Lakewood were the only Scale Up schools at or above 100 students enrolled and tested. The range of enrollment by
grade level across the five schools is from 57 in 5th grade to 100 in 4th grade. This indicates that there is fairly even
distribution of students from each grade level attending Promise Time, with a dip in participation for 5th grade
students.
15 Student’s on-task behavior was defined as students complying with the teacher’s directions as opposed to not following directions. Data from AAR/Title I observations were based one to two visits to the majority of classrooms at each of the school sites. As such, it is recommended to look at the schools as a whole to make a more grounded interpretation of the data. 16 For example iClass is another after school program that is in place at each of the five Scale Up schools. Campbell Park, Fairmount Park, and Melrose will have funding until the end of the 2015-2016 school year (targeting grades 2-5), and Lakewood and Maximo have funding for this program until the end of the 2019-2020 school year (targeting grades 3-5). The average enrollment across the seven current iClass school sites is 30 students.

17 SCALE UP FOR SUCCESS YEAR 2 FORMATIVE EVALUATION REPORT
In order to monitor the implementation of Promise Time at each of the five Scale Up school sites, the lead
evaluator worked with the Promise Time administrative staff to develop a walkthrough tool and monitoring process,
which includes an implementation checklist and rubric. Interviews and walkthroughs were conducted at each school
with the site-based Promise Time facilitator and a school-based administrator present. The following strengths and
areas for improvement represent trends across the five schools.
Promise Time Implementation Strengths:
The Title I Promise Time administrative staff have trainings and systems in place to support site facilitators, including
a monthly newsletter.
The i-Ready computer-based program is research-based and has many tools for teachers to use to support student
learning.
All site facilitators have a foundational understanding of the core components of the program.
Small group tutoring and schedules to support tutoring are in place at all five school sites.
Promise Time Implementation Areas for Improvement:
There is a demonstrated need to refine the process of small group tutoring to maximize learning time and to fill in
learning gaps for students.
Two out of five school sites are meeting the active enrollment goal of 100 students.
Implementation of enrichment activities could be enhanced and expanded across most school sites.
The sites that have a non-classroom teacher as a site facilitator appeared to have less obstacles to implementation.
This may be, in part, due to a more flexible schedule.

18 SCALE UP FOR SUCCESS YEAR 2 FORMATIVE EVALUATION REPORT
Summary for Academic Achievement
Evaluation Questions Addressed: How are the additional supports within Scale Up schools resulting in increased
academic achievement? How can these continue to be enhanced?
Note: Recommendations for enhancement are provided at the end of this document.
Outcome Indicators: (1) Cycle Assessments; (2) ST Math Progress; (3) iStation Tier Levels
District cycle assessment results indicate that the interventions are showing promise in supporting increased academic achievement, particularly in math and reading. The outcome indicators used for this are the year-to-year growth comparisons for all Scale Up schools as they relate to overall district growth. Fairmount Park is showing notable gains in math cycle data. This warrants a deeper analysis to determine best practices to potentially replicate at other sites.
Two of the five schools are reaching the expected progress for ST Math, Maximo and Campbell Park. Three of the five schools are demonstrating more movement of students into Tier 1 for the Istation computer-
based program, which indicates that more students are moving toward on grade-level reading achievement. These schools are Campbell Park, Fairmount Park, and Maximo.
Qualitative data from focus groups and interviews: Principal, teacher, and paraprofessional feedback suggest that there have been some incremental improvements in academics. Having paraprofessionals in place; PBS and implementation of schoolwide behavior plans; support from academic coaches; and training and support from TNTP were mentioned most frequently as making a difference on academic achievement.
Though the additional supports appear to have some positive impact on the learning environment overall, stronger support may be needed to see more significant learning gains.
Process Evaluation: Clearly defined role and supports for paraprofessionals
Although more than half of the paraprofessionals asked said that they felt that they were clear about their roles, there was some feedback from them that more training regarding their roles would be beneficial.
Process Evaluation: Targeted professional development for paraprofessionals and teachers
Foundational professional development was provided at the beginning of the school year for the majority of paraprofessionals. Feedback surveys indicated that this resulted in increased knowledge and skills in the targeted areas of clarification of the para role and behavior management.
Process Evaluation: More frequent observations of teachers with actionable feedback
In addition to the Marzano teacher observations that take place four times throughout the school year, TNTP has been working with Scale Up school principals and academic coaches on developing systems of support for teachers and on how to provide specific, actionable feedback.
Process Evaluation: Active Participation in Promise Time Extended Learning
Two of the five schools, Fairmount Park and Lakewood, have met the benchmark of 100 students enrolled in Promise Time and tested in the iReady computer-based program. While many elements of the program model are somewhat in place, there is a need to refine this more fully to support student attendance in the program and cater instruction to achieve solid academic gains.
19 SCALE UP FOR SUCCESS YEAR 2 FORMATIVE EVALUATION REPORT
Learning Environment: School Climate and Student Behavior Findings
Guiding Questions for the Evaluation of School Climate and Student Behavior
(1) How are the additional supports within the Scale Up for Success Initiative supporting the school climate and student
behavior?
(2) How can these continue to be enhanced?
Instruments and Evaluation Methods Used for Mid-Year Formative Evaluation
Number of disciplinary referrals/repeated misbehaviors
Number of Out of School Suspensions (OSS)
Evidence of Positive Behavior Support (PBS) through PBS walkthroughs
AAR Walkthrough Tool
Principal interview data
Paraprofessional and teacher focus group data
Learning Environment: Summary of School Climate and Student Behavior Data
The number of referrals has gone down substantially (approximately 33%) when looking at the same time point
this year compared to last year (end of December), with 1,448 referrals in 2014 and 970 referrals in 2015. Out of school
suspensions have also gone down from 514 at this same time point during the 2014-2015 school year to 310 in the
current 2015-2016 school year. This is a nearly 40% reduction. Based on the qualitative data collected from the teacher
and paraprofessional focus groups as well as the principal interviews17 18, there are several potential factors contributing
to this change. One factor is that there has been a stronger foundation in developing a schoolwide behavior system at
each of the school sites this academic year. Additionally, teachers have had the support of the paraprofessionals to help
address student behavior in most classrooms. Instructional staff have also received more trainings and strategies to
intervene with student behaviors prior to the point of a student receiving a referral. These systems and approaches are
aligned with the positive behavior support system that the district has been implementing, and helps keep students in
the classrooms during instructional time as much as possible.
17 Five teacher focus groups and five paraprofessional focus groups were held in in December 2015, one of each at each Scale Up school site. There were thirty teachers and 31 paraprofessionals from the focus groups who completed and returned the anonymous written responses. In addition, hour-long principal interviews were conducted with each of the five principals. More details on this process are provide in the section entitled Description of Methodology and Instrument Used. 18 Note: A faculty and parent survey will be conducted in Spring 2016 as part of the end of year summative evaluation.

20 SCALE UP FOR SUCCESS YEAR 2 FORMATIVE EVALUATION REPORT
In taking a closer look at referrals, the evaluation team examined the numbers and percentages of “violent
infractions,” which is defined as those infractions that include striking a student or adult and fighting. The percentage of
“violent infractions” out of the total number of referrals have remained relatively consistent in 2015–2016, at 51%
(n=493) as compared to 48% (n=703) in 2014-201519. It is important to examine these data within the context of the
current school environments. Referrals have decreased overall, along with an emphasis on positive behavior supports
and classroom interventions. As such, the fact that the percentage of “violent infractions” has remained relatively the
same should also be looked at in terms of the actual number of students. The reduction of 210 referrals for “violent
infractions” suggests that there may be some improvement in student behavior and school climate across the five
schools. More conclusive end of year data will be included in the end of year summative evaluation.
In addition, the AAR observational data20 from the classrooms show that most students were on-task (90%) and
that paraprofessionals appear to be successful in supporting the learning environment (86%). This includes addressing
off-task behavior and providing academic support to students. While this supports that paraprofessionals can provide
support for teachers and students when appropriately trained, the change that is occurring is incremental.
19 The number of incidences that involve “strike/adult” has remained relatively the same (n=80) for all Scale Up schools combined. Outside of “violent” incidences, the next greatest offense is noted for class/campus disruption (19%, n=186). There has been slight improvement when compared to 2014-2015 (21%, n=299). The number of referrals being written for “defiance/insubordination” has decreased in the current school year (4%, n=38) from the 2014–2015 school year (11%, n=160) at all five schools. 20 Details of this tool are provided in the section entitled Description of Methodology and Instrument Used. There were 162 classrooms visited for three to five minutes each, with one series of observations occurring during September-October 2015 and one series occurring in December of 2015. Data from AAR/Title I observations were based on one to two visits to the majority of classrooms at the each of the school sites. As such, it is recommended to look at the schools as a whole to make a more grounded interpretation of the data.
223291
666
80188
108
304 331
41186
0
200
400
600
800
CampbellPark
FairmountPark
Lakewood Maximo Melrose
Comparisons for the Number of Referrals
(End of December)
2014-2015 2015-2016
106 119
7949
161
86 8753
2559
0
50
100
150
200
CampbellPark
FairmountPark
Lakewood Maximo Melrose
Comparisons for the Number of Out of School Suspensions
(End of December)
2014-2015 2015-2016

21 SCALE UP FOR SUCCESS YEAR 2 FORMATIVE EVALUATION REPORT
Teacher, Paraprofessional, and Principal Perceptions of School Climate and Student Behavior
The following information is based on paraprofessional and teacher focus groups as well as individual principal
interviews held at each school21 22. The responses suggest that teachers, paraprofessionals, and principals perceive that
there are incremental improvements in student academic achievement for students. However, additional intensive
supports can help to make this even stronger.
Comparison of School Climate and Behavior from Last School Year to the Current School Year
During the teacher focus group, teachers were asked, “In comparison to last year, how would you describe the
behavior and school climate and your school?” Over half of the teachers indicated that the behavior at the school has
improved overall. Some noted that there has been incremental improvement, such as school climate and more solid
schoolwide procedures in place, but that behaviors in the classroom are similar to what they were during the previous
school year. Others indicated that there has not been a marked improvement in behavior. Paraprofessionals were also
asked, “How would you describe the behavior and school climate at your school and in your classroom?” While most of
the comments were positive, especially in comparison to the beginning of last year, there were still concerns expressed
about students who continually cause disruptions in the classroom and the need for even more interventions to help
with this.
Focus Group Responses Regarding School Climate and Student Behavior
Paraprofessionals at the majority of the Scale Up schools expressed in the focus groups that behavior was
getting better overall. For example, there are more schoolwide expectations set and set and reinforced for student
21 Five teacher focus groups and five paraprofessional focus groups were held in in December 2015, one of each at each Scale Up school site. There were thirty teachers and 31 paraprofessionals from the focus groups who completed and returned the anonymous written responses. In addition, hour-long principal interviews were conducted with each of the five principals. Additional details on this process are provide in the section entitled Description of Methodology and Instrument Used. 22 Note: A faculty and parent survey will be conducted in Spring 2016 as part of the end of year summative evaluation.
On-Task, 90%
Off-Task, 10%
Percentage of Students Demonstrating On-Task Behavior
(Source: AAR Walkthrough Data)

22 SCALE UP FOR SUCCESS YEAR 2 FORMATIVE EVALUATION REPORT
behavior in common spaces, such as the cafeteria and at dismissal. They shared that the school focused extensively on
establishing school climate and behavior expectations during the first two weeks of school. Teachers have received more
training on dealing with student behaviors, primarily through TNTP. Paraprofessionals have also received foundational
training on dealing with student behaviors. Along with this, the teachers and paraprofessionals are now addressing
minor behavior problems in their classroom more rather than relying on calling the office for support. The purpose
behind this is to keep students in the classroom as much as possible. Although teachers at some of the school sites said
that there is a very specific flowchart and process in place for dealing with behaviors, there may need to be more
clarification concerning when to give a referral and more consistent implementation of consequences at all school sites.
Teachers said that although having a schoolwide behavior system (such as a point system) provides continuity, it
may not be the best system for all teachers and students. Some teachers use a classroom-specific behavior system in
addition to the schoolwide point system. It is recommended that school leaders seek more input from the teachers and
staff when deciding on a schoolwide behavior plan, and throughout its implementation. Teachers also expressed the
need to teach character education more explicitly and to have time dedicated in the day or week to do this. The PBS
process also supports this. In addition, teachers emphasized the way in which paraprofessionals help to intervene with
behavior problems so that they can continue to teach. In some cases, however, the paraprofessionals are busy dealing
with behavior problems and are not always able to fully support the academics. Teachers also agreed that the
paraprofessionals need more training in both behavior and academics.
Teachers’ Perceptions of Current Interventions That are Making a Positive Difference in School Climate and Behavior
According to teachers, the most frequently mentioned interventions that are in place at their schools that have
helped make a positive difference in student behavior and school climate were TNTP (unspecified); paraprofessionals;
training (which includes TNTP trainings); schoolwide behavior plans and interventions (including point systems for
classrooms and PBS); academic and behavior coaches/specialists; and student services (such as the school social worker
and school psychologist). Other supports that were shared included the implementation of the “Intervention Hour” for
additional small group supports, having a volunteer “grandma” in the classroom, and having a strong principal who holds
students accountable for high expectations in regards to behavior.
Teacher, Paraprofessional, and Principal Suggestions to Supporting School Climate and Student Behavior
The most frequently mentioned recommendations by teachers, paraprofessionals, and principals to help
support these schools with student behavior and school climate, in order of frequency, were:
Themes Based on Teacher and Paraprofessional Suggestions for Supporting Behavior (By Order of Frequency)
More training and specific strategies for dealing with classroom disruptions and extreme behaviors for teachers and paraprofessionals.
Having coaches and trainers model in their classrooms with their students, and embedding behavior management techniques into their modeling.
Having more behavior support overall from the school/administration and a more positive climate for teachers.
A way for administration to seek input from school staff on a more regular basis.
Additional qualified behavior specialists and coaches on campus.
Time embedded in the day for character education, such as the "morning meetings." Having more positive adult role models for students.

23 SCALE UP FOR SUCCESS YEAR 2 FORMATIVE EVALUATION REPORT
Implementation of PBS and Best Practices in Behavior Intervention
The Scale Up schools are currently implementing Positive Behavior Supports (PBS) with ongoing training and
support through the University of South Florida. Each school developed a school-wide behavior plan, established a
school-based PBS leadership team to lead this behavioral support plan, and had their PBS team attend ongoing monthly
training sessions conducted by the University of South Florida. PBS is rooted in a belief system around routines and
reinforcing positive behaviors. It is based on understanding why problem behaviors occur (i.e., the behavior's function).
This approach to behavior can occur on a school-wide level, in a specific setting or classroom or with an individual
student. PBS is: “the application of evidence-based strategies and systems to assist schools to increase academic
performance, increase safety, decrease problem behavior, and establish positive school cultures23.”
In October 2015, the district PBS coordinator organized PBS Walkthroughs in collaboration with the lead
evaluator for Scale Up for Success. Using the PBS Walkthrough tool, interviews with school PBS team leads and brief
classroom observations were conducted. A PBS implementation specialist from USF worked with the PCS staff to train
them on the PBS walkthrough tool. Trends, feedback, and support were provided to the schools after each walkthrough.
The following trends in PBS implementation were present at the various school sites:
While most schools have a PBS team in place and are implementing the strategies, some of the schools requested
additional training and support to enhance implementation.
Most students had a basic understanding of expectations or could state the acronym that laid out the behavior
expectations.
At least three schools had a behavior flowchart in place that specifies how to address both positive and negative
behaviors.
Most schools had a positive reward system in place that faculty and students could identify.
School staff shared that finding time for character education has been a challenge.
Student input for the reward system was not consistent at each school site. It is recommended that students are
given the opportunity to give input or vote on rewards whenever possible to promote student buy-in.
Full-time Psychologist and Social Worker
Full-time psychological and social work services were provided at each Scale Up school beginning in the 2014-
2015 school year. The make-up of the student services team varied by school. A typical team was comprised of a
psychologist, a social worker, an educational diagnostician, a family navigator (funded through the Juvenile Welfare
Board) and a mental health clinician (also funded through JWB). Every student is served by the school social worker and
psychologist. This level is considered to be Tier 1, which means that support is provided to all students through social
worker and psychologist participation in the development, implementation, and monitoring of the School Improvement
Plan, School-Wide Behavior Plan, and other school initiatives and responsibilities. Since Tier 1 includes all students at the
23 Source: http://flpbs.fmhi.usf.edu

24 SCALE UP FOR SUCCESS YEAR 2 FORMATIVE EVALUATION REPORT
school this means that 420 to 660 students at each school site receive these core services from Student Services staff
every day.
The case load numbers that are reported in SSWIMS24 typically shows the range of students served for
supplemental Tier 2 and more intensive Tier 3 services. The total number of cases from the beginning of the school year
through the end of January varied from 81 to 445 at each of the five school sites25. Student Services staff duties at the
school include engaging in school-wide practices to promote learning and providing interventions, instructional
supports, and mental health services through a service delivery model that is permeated by data-based decision making,
consultation, and collaboration. These duties are designed to support the overall goals outlined on the school
improvement plan including but not limited to: facilitating and supporting academic/behavior plans, addressing
attendance concerns, conducting evaluations/reevaluations for consideration of ESE services, serving as a home-school
liaison, serving on school teams such as School Based Leadership and Child Study Teams, referring to community
resources, and providing individual and group counseling. Ultimately, the number of cases and the overview of
responsibilities reflect that all Student Services staff strive to improve the services that are provided to all students
within a multi-tiered system of supports (MTSS)26.
Student absences is another indicator that is important to examine when considering how to enhance learning
for students as well as the use of wrap-around services associated with the MTSS process. For example, Maximo stands
out as having the lowest percentage of students who have been absent 10% or more days of school (as of 12/31/2015).
Examining best practices and strategic ways to address absenteeism are currently being explored district-wide by a
cross-departmental committee, and it is recommended to look further into the best practices at school like Maximo to
see how to transfer the best practices from these schools to others.
24 Student Service-Wide Information Management System 25 These numbers include students that received more than one service. It is important to note that each case is unique. “Contacts” with a student can vary greatly in time and intensity, depending on the purpose of the work. 26 A Multi-Tiered System of Supports (MTSS) is a term used to describe an evidence-based model of schooling that uses data-based problem-solving to integrate academic and behavioral instruction and intervention. (http://www.florida-rti.org/educatorResources/MTSS_Book_ImplComp_012612.pdf)
24% 22%
18%
11%
19%
0%
5%
10%
15%
20%
25%
Campbell Park FairmountPark
Lakewood Maximo Melrose
Percentage of Students Absent 10% or More Days (Through 12/31/15)

25 SCALE UP FOR SUCCESS YEAR 2 FORMATIVE EVALUATION REPORT
Summary for School Climate and Student Behavior
Evaluation Question Addressed: How are the additional supports within the Scale Up for Success Initiative
supporting the school climate and student behavior? How can these continue to be enhanced?
Note: Recommendations for enhancement are provided at the end of this document.
Outcome Indicator: Referrals, Suspensions and Attendance Overall, behavior indicators suggest that the Scale Up for Success initiative is helping to enhance student behavior
and school climate at the majority of the schools when comparing referral and suspension data from the previous year.
Paraprofessionals and teacher focus groups and principal interview data was primarily positive regarding enhanced student behavior and school climate at the majority of Scale Up school sites.
While there is evidence to suggest improvements overall at the mid-year point, there are areas that will need to continue to be addressed proactively. Some of these areas include addressing the needs for students who are continually and extensively engaging in disruptive behaviors in a systematic way, enhancing implementation fidelity of key behavior intervention strategies (e.g., behavior trackers), and increased consistency in setting and maintaining high behavioral expectations for students.
Process Evaluation: Implementation of PBS and Best Practices in Behavior Intervention
There is evidence that schoolwide behavior plans and reward systems are in place at most school sites. Feedback from the focus groups indicate that there is a need for teachers to have more input on the behavior
interventions and PBS implementation. According to paraprofessional and teacher feedback (and PBS data from the Year 1 summative evaluation report),
many schools need to deliver character education and behavioral lessons to students throughout the school year.
Process Evaluation: Placement of a Full-time Psychologist and Social Worker
Ultimately, the data reflects that Student Services staff are working systematically to improve the services that are provided to all students within a multi-tiered system of support.
Student attendance continues to be a concern at the majority of Scale Up school sites, with Maximo showing the best attendance data out of the five schools. A district attendance team is currently working on strategies to support increased attendance for all schools.
MTSS implementation at each of the Scale Up school sites and providing targeted supports to students can help to enhance student behavior and attendance.

26 SCALE UP FOR SUCCESS YEAR 2 FORMATIVE EVALUATION REPORT
Leadership Support Findings
Guiding Evaluation Questions for Leadership Support
(1) How are the additional supports for school leadership enhancing the schoolwide learning environment?
(2) How can these continue to be enhanced?
Instruments and Evaluation Methods Used for the Mid-Year Formative Evaluation
Principal interviews
Overview and evidence of implementation of principal supports (TNTP coaching, district ISM visits, etc.)
Leadership Support Overview
Leadership is the key to high-performing schools. A primary emphasis within the Scale Up for Success Initiative is
to support the school leaders. District supports for principals and school leadership include Instructional Support Model
(ISM) visits at least monthly to each of the five Scale Up schools. The area superintendents assigned to each school
visited the sites to follow-up on action items from the ISM visits each month as well.
In addition to the district-based supports, TNTP (an outside consulting agency) has been providing ongoing
training and on-site coaching and support for school leadership. TNTP’s work includes: (1) supporting district and school
leadership to articulate a compelling vision for rigorous instruction and a strategy to achieve it in the Scale Up Schools;
and (2) training principal managers, school leaders, and coaches at the Scale Up schools to understand and execute their
vision and strategy, including the execution of a proven coaching model. The support provided to each school is
designed to vary depending on the school’s individual needs.
Also, the district-based research and evaluation team helps with monitoring, data analysis, and providing
support for continuous improvement in the Scale Up schools. This includes research to inform the implementation of
evidence-based practices. Based on the developmental evaluation model that has been implemented this year, school
district staff have been receiving ongoing updates on major indicators in real-time. The purpose of this is to help make
incremental decisions along the way and to expedite actions for improvement within these turnaround schools. As part
of this process, district leadership and TNTP meet with the evaluation team on a weekly basis to review qualitative and
quantitative data that has been collected. These data, combined with research-based evidence, are used to inform
important decisions around this work. Some of the work that has been influenced by these ongoing meetings include
developing cross-departmental teams to address a comprehensive, and systematic approach to key components of the
Scale Up plan and different levels of supports for schools throughout the district. These include academics, behavior and
school climate, talent recruitment and retention, leadership supports, and family and community engagement. In
addition, the decision was made by district leadership to hire a director of school leadership to support Scale Up
principals and to expand this work to other schools in need of additional leadership support.

27 SCALE UP FOR SUCCESS YEAR 2 FORMATIVE EVALUATION REPORT
Mid-Year Formative Evaluation Methods Used to Address Leadership Supports
The evaluation questions for leadership were primarily addressed through the principal interviews for the
current mid-year formative evaluation report. One-on-one principal interviews were conducted with each Scale Up
school principals by the lead evaluator and the executive manager of evaluation for PCS27. Themes from these interviews
were combined and are presented below. In addition, evaluation activities that were conducted in this area include
observing the district’s ISM visit process, school-based leadership team meetings, TNTP meetings with principals, and
various TNTP trainings. The year-end Scale Up evaluation will be more summative in nature, and will examine additional
measures and indicators, including AdvanceED Survey indicators from the 2014-2015 school year compared to the 2015-
2016 school year.
Principal Perceptions of How Scale Up for Success Leadership Supports Help to Enhance the
Learning Environment
Principal perceptions were primarily positive in regards to the supports provided by TNTP. Several principals
mentioned that TNTP has proven to be been helpful in setting expectations for behavior and classroom management. As
a result, their schools are experiencing more teachers better equipped to implement behavior strategies with
consistency and less students in the office.
According to one of the principal interviews, TNTP has a plan of action for supporting principals. They help
support principals through the problem-solving process, and to tackle challenging problems by breaking them down into
manageable chunks. They also provide the follow-up and practice for this by doing side-by-side coaching, conducting
weekly debriefings, and providing feedback on how the principal can continue to improve. In addition, TNTP helped to
initiate monthly principal professional learning community (PLC) meetings, in partnership with the areas
superintendents, to allow the Scale Up principals to share best practices with each other and to learn from one another.
Principals also stated that TNTP helps support the principals and coaches in knowing what to look for in
observations and knowing what type of feedback to provide to teachers. According to the Scale Up principals, the week-
long TNTP training for the instructional coaches has helped the coaches provide teachers with what they need to be
more successful. TNTP also offered a day-long training on coaching for the principals to align instructional coaching
practices. The coaches are now implementing these strategies to provide differentiated, or tiered, supports to teachers
that address the needs of each teacher.
27 For more detailed information on the interview methodology, please refer to the Methodology section of this report.
“TNTP is the catalyst for change. She makes me think…I think of TNTP as a personal coach.”
“Principals need mentors too.”

28 SCALE UP FOR SUCCESS YEAR 2 FORMATIVE EVALUATION REPORT
In addition, many principals expressed that they are fortunate to have the support from the district such as the
additional support from the area superintendents. One principal shared that the information from TNTP and the ISM
visits help her be a better leader and “sharpen her tools.” There is additional administrative support in some of the
schools, such as an additional assistant principal, and this was seen as beneficial overall. One principal stated that this is
especially helpful considering the additional work that a principal in a turnaround school is faced with. The most helpful
components of the initiative that were expressed include the family navigator, mental health counselor, school social
worker, psychologist, and the paraprofessionals—especially those who are highly qualified and properly trained.
Principal Suggestions on How to Enhance Leadership Supports
The following provides an overview of the suggestions that principals provided to help them improve the
learning environment at the Scale Up schools.
Instructional staff need to increase the rigor of their instruction and trust in the process. One suggestion on how to
approach this is to provide more professional development to teachers to support increased instructional rigor.
It was recommended to give the teachers more autonomy with academics. For example, some shared that it would
be helpful to have flexibility with curriculum. Additional support from the district on how to implement the current
curriculum with fidelity was also suggested.
Having interim assessments has been helpful overall to assess student needs and be able to address these needs.
There has been some concern expressed by principals about the need for quality assessments and sharing of best
practices for this, as well as a concern about the time it takes to develop some of these assessments.
One strategy to support turnaround schools is to provide more compensation to teachers. One principal pointed
out, “We have a lot more to deal with than the average school.”
They also expressed that the principals at these schools are doing additional work related to the initiative (e.g.,
hiring and maintaining additional staff, monitoring additional projects). As such, they suggested that it would be
helpful to receive additional compensation for this that goes beyond the current stipend. Some even recommended
having an additional administrator to support with teacher observations and other duties.
Additional coaching and staff were mentioned frequently. Furthermore, it was suggested that there may need to be
more flexibility for these schools when it comes to staffing models and other projects, such as the STARS classroom.
This would help principals be able to implement strategies that might be more effective for their unique needs.
“The district has been very supportive, it is obvious that this is a priority for us. They are asking us what would help. I (also) think the director of (school) leadership position is going to be great.”
“I believe that the initiative has been helpful.”

29 SCALE UP FOR SUCCESS YEAR 2 FORMATIVE EVALUATION REPORT
The principals said that it would be beneficial to have the schools collaborate more with each other to share best
practices. In addition, some shared that the district should continue to provide differentiated principal mentoring
and side-by-side coaching that goes beyond the current ISM process.
Summary for Leadership Supports Evaluation Question Addressed: How are the additional supports for school leadership enhancing the schoolwide learning environment? How can these continue to be enhanced? Note: Recommendations for enhancement are provided at the end of this document.
Process Evaluation: District and TNTP Supports
The principals had primarily positive responses regarding the TNTP support provided and district supports provided.
Some suggestions for enhancing the initiative included: More professional supports in place to for teachers, particularly supports for increasing instructional rigor. Interim assessments to support targeted instruction for students and differentiation. Provide higher compensation to teachers and to administrators at the school sites to support talent recruitment
and retention. Flexibility for the staffing model at the school to allow each school to address the needs of their schools. Continue principal coaching and expanded opportunities for leadership development.
30 SCALE UP FOR SUCCESS YEAR 2 FORMATIVE EVALUATION REPORT
Family and Community Engagement Findings
Guiding Evaluation Questions for Family and Community Involvement
(1) How has family and community engagement been enhanced in the Scale Up schools to support student success/access
to learning?
(2) How can this continue to be enhanced?
Instruments and Evaluation Methods Used for the Mid-Year Formative Evaluation
Attendance at family engagement activities
Overview of students utilizing school support services (school social worker, school psychologist)
Use of family navigation and mental health counseling services for students and families
Family and Community Engagement Overview
Family, school and community engagement is essential to building strong learning support systems. The ultimate
goal within this component of the Scale Up initiative is to intentionally link family engagement activities to learning and
school improvement by developing learning support systems, systems alignment, family and community engagement
opportunities and trainings/workshops. The plan also supports the families and students by developing a system of
supports that includes mental health services and family connection navigators.
The family engagement component of the Scale Up initiative was comprised of several components which
included: (1) a full-time mental health clinician (funded through the Juvenile Welfare Board); (2) a full-time family
navigator (also via JWB); (3) an emphasis on increasing attendance at family engagement activities; and (4) family
engagement activities that were linked to student learning.
The family engagement focus for the five Scale Up schools is to utilize Dr. Karen Mapp’s Dual-Capacity
Framework to cultivate and sustain effective family-school partnerships that support student and school improvement.
Last year, this intervention included a two-day professional development session led by Dr. Karen Mapp who is a senior
lecturer from the Harvard Graduate School of Education (HGSE). District and school leaders from all five Scale Up schools
attended this training related to the Dual-Capacity Framework for Family-School Partnerships. This framework
emphasizes:
A description of the capacity challenges that must be addressed to support the cultivation of effective home-school
partnerships;
An articulation of the conditions integral to the success of family-school partnerships initiatives and interventions;
An identification of the desired intermediate capacity goals that should be the focus of family engagement
programs; and
A description of the capacity-building outcomes for school and program staff as well as for families.

31 SCALE UP FOR SUCCESS YEAR 2 FORMATIVE EVALUATION REPORT
Family and Community Engagement Findings
As indicated by the chart below, there was a 53% increase in attendance at family engagement activities across the
five Scale Up schools at this same time point in 2015 compared to 2014.
Number of Participants Attending Family Engagement Activities in 2015-2016 as Compared to 2014-2015
Campbell Park
Fairmount Park
Lakewood Maximo Melrose All Scale Up
Schools
September 2015 52 23 87 24 79 265
October 2015 48 25 110 50 125 358
November 2015 123 13 65 45 65 311
December 2015 150 68 165 128 233 744
Total 2015-2016 Number in Attendance 373 129 427 247 502 1678
September 2014 7 34 41 114 43 239
October 2014 123 27 20 24 75 269
November 2014 33 34 79 63 35 244
December 2014 45 130 81 54 28 338
Total 2014-2015 Number in Attendance 208 225 221 255 181 1090
While the increase in attendance at family engagement events shows movement toward the goal of increased
family involvement, there are still many areas that the district sees a need to expand in order to fully implement the
Dual Capacity Framework. Some suggestions for how to help move this work forward are presented below, and were
developed in collaboration with the PCS Director of Strategic Partnerships.
Provide cross-departmental supports and monitoring of the quality of family engagement activities at the Scale Up
school sites to ensure alignment with best practices.
Provide professional development for family engagement to the principals at each of the Scale Up school sites. For
example, consider having a principal PLC early in the school year to address family engagement and ways to support
this at each school site.
Ensure the development and delivery of monthly professional development for instructional staff on engaging
families. The Office of Strategic Partnerships has suggested creating webinars and videos to train teachers on these
strategies. It is suggested to have the training take place at the beginning of each school year, and to develop a
monitoring system for administrators to implement at each school site to ensure implementation of these
strategies. Furthermore, these could be an item that is addressed during the ISM visit process with administration.

32 SCALE UP FOR SUCCESS YEAR 2 FORMATIVE EVALUATION REPORT
Consider developing and implementing a system to support home visits to families. This can serve multiple
purposes, including strengthening the relationship between the teacher/school and the family. It might be beneficial
to begin this process with one school, refine the model, and then expand this to other schools.
Placement of Mental Health Clinicians and Family Navigators (funded by JWB)
In order to support the Scale Up for Success initiative, the Juvenile Welfare Board (JWB) of Pinellas County helps
to arrange and fund (1) family wrap around and navigation services (family navigator); and a (2) school-based clinical
mental health services (mental health clinicians). The long-term goals of this are to improve student behavior and
academic achievement of those students’ families who receive these services. A fulltime family navigator, which is
managed by Personal Enrichment Through Mental Health Services (PEMHS), and a fulltime mental health clinician, which
is managed by Suncoast Center, Inc., have been placed at each of the five Scale Up sites. This component of the initiative
has been in place since the 2014-2015, with the exception of Fairmount Park, which has had some similar supports since
the 2010-2011 school year.
The maximum caseload at any one school is twelve for family navigators and twenty for mental health clinicians.
However, it is limiting to look just at numbers alone. The provision of social services is a complex process, and the
caseload that the family navigators and mental health clinicians can take on is dependent upon the complexity of the
cases that they are addressing at any given time. As such, there are many factors to consider when comparing current
caseload numbers to the maximum caseload numbers.
The numbers below are the total numbers referred for and served by family navigators at each school from
August through November of 2015. “Number of referrals” indicates how many referrals to services were made from
school staff. “Number served” represents the total number of students served at the school during each month. Please
note that these numbers reflect the current caseload of each family navigator and include duplications from month to
month, since services may continue for several months.
Family Navigator Referrals and Number Served, August-November 2015
Number of Referrals Number Served
August September October November August September October November
Campbell Park 1 6 6 6 1 3 8 9
Fairmount Park 9 9 9 6 2 7 11 3
Lakewood 2 13 6 8 3 7 9 6
Maximo 2 6 4 9 4 5 8 11
Melrose 2 6 8 6 1 10 13 13
Total 16 40 33 35 11 32 49 42
The “number served” by the mental health clinicians is represented by the census on the first day of the month,
and the “number referred” represents the total amount of referrals the agency received each month from each school.

33 SCALE UP FOR SUCCESS YEAR 2 FORMATIVE EVALUATION REPORT
Again, these numbers include duplicates since students can carry-over from month-to-month. Many of the mental
health clinicians are close to their maximum caseload of twenty even though there is a lower number of referrals
reported in comparison to the actual number served. A deeper look into the referral process and how to enhance this
has been part of the developmental evaluation model. This is explained in more detail below.
Mental Health Clinician Referrals and Number Served,
August-November 2015
Number of Referrals Number Served
August September October November August September October November
Campbell Park 0 2 7 2 12 14 11 17
Fairmount Park 8 17 3 1 5 15 15 19
Lakewood 0 4 7 0 15 19 16 18
Maximo 0 2 3 4 18 18 16 15
Melrose 7 6 3 5 12 20 12 17
Total 15 31 23 12 62 86 70 86
Quarterly meetings have been taking place among JWB staff, PCS district staff, family navigators, mental health
clinicians, school social workers, and school psychologists to share best practices for continuous improvement of this
model for wrap-around services. These meetings have served to clarify the role of the family navigators and mental health
clinicians. In addition, based on the feedback from the Year 1 evaluation and the questions that emerged from the
November quarterly meeting, school site-based visits were completed in the fall of 2015. School district personnel, JWB
representatives, the family navigator supervisor, and the mental health clinicians’ supervisor visited each of the five
schools. They met with each school’s family navigator, mental health clinician, school social worker, and school
psychologist. The purpose of these visits was to assess how the schools were approaching the student and family referral
process, and to help provide suggestions to facilitate the process. The themes and suggestions that emerged from these
visits included:
At each school site, the school social worker serves as the “hub” for the referral process. Referrals got to the school
social worker are then funneled out to the service providers. There is a flowchart that has been developed to help
guide this process.
Further clarification of family and student eligibility for both navigation and mental health services is needed at the
various school sites.
Further clarification of the roles and responsibilities of family navigators, mental health clinicians, and school staff
(i.e., school social worker) is needed.
In response to the identified need for clarification about the types of services that are available through family
navigators and mental health clinicians, PEMHS and Suncoast are working on a two page flyer to describe the
services available and the types of situations that would align with these services.

34 SCALE UP FOR SUCCESS YEAR 2 FORMATIVE EVALUATION REPORT
It is also important to note that a separate Year 1 evaluation for 2014-2015 was completed through JWB with an
external evaluator. Many of the recommendations that were provided for the process evaluation coincided with our
own findings. Within the current developmental evaluation approach, PCS is continuing to work in partnership with JWB
to enhance these services and to support schools in taking more full advantage of how these services can support
students. Specific recommendations regarding the utilization of the family navigators and mental health clinicians is
provided in Appendix C, and a summary of recommendations is listed in the Recommendations section at the end of this
document.
Family and Community Engagement Summary
Evaluation Questions Addressed: How has family and community engagement been enhanced in the Scale Up schools
to support student success/access to learning? How can this continue to be enhanced?
Note: Recommendations for enhancement are provided at the end of this document.
Process Evaluation: Family and Community Engagement Activities
Attendance at family engagement events has increased by 53% across the five Scale Up schools.
While there has been an increase in attendance, there continues to be a need to enhance the quality of family
engagement events and to more fully align the family engagement work with that of Karen Mapp’s Dual Capacity
Framework.
Process Evaluation: Full-time Family Navigator and Mental Health Clinicians at Each School Site
The services provided through the family navigators and the mental health clinicians are complex and are difficult
to quantify due to the nature of this work.
The family navigators are close to working at capacity, and the mental health are working at capacity.
There are processes in place to support the referral process. This will allow students and their families to more
fully take advantage of these services.

35 SCALE UP FOR SUCCESS YEAR 2 FORMATIVE EVALUATION REPORT
Recommendations
Academic Recommendations
Continue to Have an Increased Focus on Teacher Recruitment and Retention
(1) Restructure the teacher compensation structure for these schools to ensure that there is a higher percentage of
teachers who have been identified as highly qualified in the Scale Up schools.
(2) Continue and expand the job fairs that are specific to the Scale Up schools.
Continue to Enhance the Work of the Paraprofessionals to Support the Learning Environment
(1) Develop a more specific paraprofessional job description and duties for Scale Up schools, and refine the hiring
process to place a greater emphasis on the quality of the candidates as they relate to the more specified job
description.
(2) Have a cross-departmental team develop and help implement a more specific employee performance
monitoring and appraisal systems for non-teaching staff, including paraprofessionals. This process will help to
monitor and provide more specific feedback to these employees.
(3) Implement additional strategies to support paraprofessionals mirror those that are meant to support teachers,
such as having a paraprofessional “mentor” for first-year paraprofessionals and having more frequent and
relevant trainings for paraprofessionals, especially in behavior management strategies and techniques. Other
strategies include providing feedback to paraprofessionals when classroom walkthroughs are conducted in
addition to teachers.
(4) Provide updated and additional training to the teachers on working with paraprofessionals. Although there was
a training for teachers in 2014-2015, an updated training is recommended that aligns with the updated
paraprofessional job description and appraisal system.
Continue Current Coaching Work and Expand Even Further
(1) Continue to utilize the tiered coaching model that has been established across the Scale Up schools this year to
support teachers at different levels of demonstrated need.
(2) Consider a position, such as a “master teacher” or “lead teacher” who could model lessons and provide
additional support to teachers. There are various models for this can be explored by district leadership.
(3) Enhance the work of the instructional coaches through more extensive professional support. This includes
trainings on the coaching cycle (in addition to the foundational trainings that TNTP conducted this year),
monitoring of the implementation of the coaching cycle, training on the Marzano framework, and additional
support at the district level. In addition, refine vision for the coaching model at the Scale Up schools. Develop a
communication plan to ensure that this is clearly communicated to district staff, area superintendents,
principals, coaches and teachers in a systematic and comprehensive way.
Consider Adjustments to the Current Curriculum and to the Ongoing Monitoring of Students’ Academic Performance
(1) Teachers, paraprofessionals, and principals suggested that there is a need to provide even more academic
support and approaches to differentiation for students. While there is no simple solution to this, it is

36 SCALE UP FOR SUCCESS YEAR 2 FORMATIVE EVALUATION REPORT
recommended that the district’s academic strategic team examines this further and develops a plan for this that
can be employed for the 2016-2017 school year.
(2) Examine the current curriculum and alignment to standards, and the degree to which the materials support the
learning of the student population at the Scale Up schools. Consider modifications, as needed.
Enhance Monitoring of Students’ Progress to Better Meet Their Needs
In addition, the Scale Up schools have been refining their processes for monitoring students’ academic
performance to better support individual student’s needs. Consider having the academic strategic team examine
ways to approach this and work with the district’s director of school leadership to employ this at the Scale Up
school sites.
Develop a Cross-Departmental Team to Align and Strengthen Extended Learning Programs
Continue to work on enhancing communication with those who offer other after school programming to
maximize the enrollment of students in after school programs and to align these efforts (i.e., scheduling to make
it easier for sibling groups to come to different programs, targeting specific grade levels to reduce competition
among programs, and alignment of transportation efforts). It is recommended that there is a cross-
departmental team that addresses this (Teaching and Learning, Title I, Strategic Partnerships). For example, this
team could develop a short-term task force to address the alignment, and then meet on an ongoing basis to
monitor and refine these efforts.
Behavior Recommendations
Develop a Comprehensive Plan for In-School Suspensions
Develop a comprehensive process, training, and implementation monitoring system for in school suspensions at
the Scale Up school sites. This will help students have opportunities to stay at school and still receive instruction
in an alternate setting.
Continue to Provide Current Wrap-Around Services for Students and Continue to Enhance This Work
(1) Maintain the current staffing model for support staff (fulltime school counselor, psychologist, and social worker)
and develop systems to align this work. These systems can be developed collaboratively by the principal and the
director of school leadership.
(2) Shift the focus of the current evaluation from reporting primarily on numbers of students seen to the
implementation of support systems for students across the five Scale Up schools. This would include examining
best practices for MTSS implementation and working alongside the behavior and school climate strategic team,
including district MTSS specialists, to enhance and monitor these practices at the Scale Up school sites.
Continue to Support PBS and Provide Additional Behavior Training for Teachers (1) While we have much in place for PBS, fidelity of implementation is still a challenge, as evidenced by the current
PBS Walkthrough data and last year’s Benchmarks of Quality (BOQ) data. Examine the recommendations
presented in AAR’s research brief on discipline disparity. They mention PBS as a behavior intervention to
improve school climate and culture. Specifically, and potentially having the district set up systems in its most

37 SCALE UP FOR SUCCESS YEAR 2 FORMATIVE EVALUATION REPORT
struggling schools to support and ensure implementation fidelity. This would be above and beyond the current
PBS teams at each site.
(2) Continue to refine a plan to more extensively support teachers in the area of culturally responsive pedagogy and
determine ways to provide equity training for instructional staff at all five Scale Up school sites.
(3) Provide additional professional support for teachers and paraprofessionals in dealing with behaviors, including
extreme behaviors. Again, this is an area that potentially the behavior and school climate team can work on
developing, implementing, and monitoring.
Overall Supports for the Schools and Principals
Provide a Foundational Turnaround Staffing Model that Provides Flexibility for Individual School’s Needs
(1) Provide a framework or model for principals on what a typical staffing structure would look like within
turnaround schools. For example, include suggestions on use and placement of coaches, lead teachers,
paraprofessionals, etc. For example, while some schools mentioned that having an additional assistant principal
would be beneficial, other schools may decide to hire an additional academic coach. These staffing decisions can
also be supported by the area superintendents and the director of school leadership.
(2) It is important to note that many teachers mentioned the need for additional support with academic and with
behavior, such as additional coaches and coaches who fully implement the coaching model, including modeling
and scaffolding supports. While there are many approaches to addressing this, the district and school site should
take this into consideration. This is especially the case in looking at academics areas that where students are not
making significant gains in academic achievement levels.
Develop a Leadership Pipeline for Supporting the Development of Staff Leadership Positions
This work may also extend to teacher leaders and instructional coaches. The purpose of this is to support and
expand the expertise of instructional leaders in schools, especially those schools with the greatest need. Other
resources to explore may be USF’s Turnaround Leadership graduate initiative and research by the Wallace
Foundation on principal pipelines and supports. This work can be led by the director of school leadership and
the leadership development strategic team.
Family Engagement Recommendations
Continue to Enhance the Work of the Family Navigators and Mental Health Clinicians
(1) Refine a standard process for how referrals to services flow. While most school have a cohesive process for this,
this process can continue to be strengthened for all of the Scale Up schools. This includes referrals to family
navigators, mental health clinicians, and other support services. One suggestion for this is to have the school
social worker conduct a brief screening of the situation being referred so that he/she can determine which
38 SCALE UP FOR SUCCESS YEAR 2 FORMATIVE EVALUATION REPORT
services would best fit each family’s needs. Additionally, it would benefit school social workers to have a
comprehensive list of services that are available at the school and in the community to help support this work.
(2) Continue the quarterly meetings that are currently occurring with the JWB staff, PCS district staff, family
navigators, mental health clinicians, school social workers, and school psychologists to share best practices for
continuous improvement of this model.
(3) Continue to have PCS and JWB representatives meet with the individual schools at least twice a year, once in the
fall and once in the spring as a follow-up. This should include the family navigator, mental health clinician, school
social worker, school psychologist, and administration (i.e., principal or assistant principal) at each school site.
This will provide individualized support at each school site.
(4) Provide a structure for professional learning communities to occur among the school social workers with their
supervisor; the school psychologist with their supervisor; the family navigators with their supervisor; and the
mental health clinicians with their supervisor. These can potentially be conducted as break-out sessions at the
quarterly meetings or as part of a separate meeting. This will allow each group to share best practices and to
continue to enhance their work. For example, the school social workers could use this time to refine their
referral process and to develop a corresponding document.
Develop a Cross-Departmental Team for Family Engagement
Provide cross-departmental supports and monitoring of the quality of family engagement activities at the Scale
Up school sites to ensure alignment with best practices for family engagement. It is recommended that this
team includes representatives from the Teaching and Learning, Strategic Partnerships, and Title I departments.
Recommendations Regarding Additional District-Level Supports
(1) Continue to engage in School Improvement Networks such as the Florida Implementation Network to share best
practices and strategies with other school districts.
(2) Continue to utilize Assessment, Accountability and Research office along with Title I to support ongoing
refinement of the turnaround model for Scale Up schools and other schools needing additional supports28. This
includes facilitation support in strategic planning, research on evidence-based practices, and monitoring
processes to ensure implementations and continuous improvement of activities to support the goals of the Scale
Up for Success initiative.
(3) Consider developing a district Turnaround Team or Support Team to create consistent, research-based
interventions in the Scale Up schools and in similar “turnaround” school sites. Consider which district
departments have the personnel, time, and expertise to support this work and if additional infrastructure (i.e.,
hiring of personnel) is necessary to support this work. Align this work to the job responsibilities of the new
director of school leadership.
28 Consider which district departments have the personnel, time, and expertise to support this work and if additional infrastructure (i.e., hiring of personnel) is necessary to support this work.

39 SCALE UP FOR SUCCESS YEAR 2 FORMATIVE EVALUATION REPORT
Appendix A: School-by-School District Cycle Data
*The test for ELA 3rd grade was rewritten for the 2015-2016 school year. As such, caparisons for 3rd grade were omitted. **Testing format changed from paper-based to online and multi-select items were added. As such, interpretations or conclusions based on this data are limited. *** Testing format changed to include multi-select items (note: the testing for 4th and 5th grade were online for both 2014-2015 and 2015-2016). As such, interpretations or conclusions based on this data are limited.
2014 2015 Change 2014 2015 Change 2014 2015 Change 2014 2015 Change 2014 2015 Change 2014 2015 Change
1st Grade Proficient 49% 51% 2% 55% 53% -2% 50% 50% 0% 57% 79% 22% 38% 50% 12% 68% 63% -6%
2nd Grade Proficient 15% 22% 7% 23% 14% -10% 11% 16% 5% 10% 44% 34% 16% 22% 6% 44% 40% -4%
3rd Grade Proficient* 7% 20% 21% 48% 8% 8% 1% 16% 0% 11% 31% 43%
4th Grade Proficient 11% 6% -5% 4% 15% 11% 6% 10% 4% 8% 2% -6% 9% 8% -1% 38% 29% -9%
5th Grade Proficient 21% 28% 7% 8% 20% 12% 15% 24% 9% 13% 17% 4% 13% 15% 2% 48% 51% 3%
Campbell Park Fairmount Park Lakewood Maximo Melrose
ELA Cycle I Percentages of Students Testing as Proficient
Pinellas
2014 2015 Change 2014 2015 Change 2014 2015 Change 2014 2015 Change 2014 2015 Change 2014 2015 Change
1st Grade Proficient 15% 33% 18% 43% 67% 24% 5% 27% 22% 11% 38% 27% 15% 37% 22% 36% 40% 4%
2nd Grade Proficient 29% 24% -5% 32% 37% 5% 20% 20% 0% 16% 35% 19% 20% 30% 10% 57% 49% -8%
3rd Grade Proficient** 29% 15% -14% 54% 52% -2% 18% 7% -11% 48% 14% -34% 13% 10% -3% 58% 34% -24%
4th Grade Proficient*** 4% 9% 5% 3% 16% 13% 2% 7% 5% 8% 10% 2% 7% 2% -5% 34% 25% -9%
5th Grade Proficient*** 23% 30% 7% 7% 30% 23% 13% 12% -1% 11% 26% 15% 10% 10% 0% 39% 46% 7%
Campbell Park Fairmount Park Lakewood Maximo Melrose
Math Cycle II Percentages of Students Tesing as Proficent
Pinellas
2014 2015 Change 2014 2015 Change 2014 2015 Change 2014 2015 Change 2014 2015 Change 2014 2015 Change
1st Grade Proficient 15% 33% 18% 43% 67% 24% 5% 27% 22% 11% 38% 27% 15% 37% 22% 36% 40% 4%
2nd Grade Proficient 29% 24% -5% 32% 37% 5% 20% 20% 0% 16% 35% 19% 20% 30% 10% 57% 49% -8%
3rd Grade Proficient 29% 15% -14% 54% 52% -2% 18% 7% -11% 48% 14% -34% 13% 10% -3% 58% 34% -24%
4th Grade Proficient 4% 9% 5% 3% 16% 13% 2% 7% 5% 8% 10% 2% 7% 2% -5% 34% 25% -9%
5th Grade Proficient 23% 30% 7% 7% 30% 23% 13% 12% -1% 11% 26% 15% 10% 10% 0% 39% 46% 7%
Math Cycle II Percentages of Students Tesing as Proficent
Pinellas School DistrictCampbell Park Fairmount Park Lakewood Maximo Melrose

40 SCALE UP FOR SUCCESS YEAR 2 FORMATIVE EVALUATION REPORT
Appendix B: Istation Data on Ability Levels
The graph below shows the percentage of students at each tier level. Melrose and Lakewood have the highest percentages of students seriously below grade level (42%). Maximo has the lowest percentage of seriously below grade29 level students (25%). Fairmount Park is at 28% and Campbell Park is at 36% at Tier 3.
It is recommended that students at Tier 3 have 90 minutes or more on Istation. The graph below indicates the percentage of students at the Tier 3 level who were at the suggested amount of usage as of January 24, 2016. Campbell Park and Fairmount Park stand out as having at least 50% of Tier 3 students at the suggested 90 minutes or more of usage.
29 As indicated by Istation’s benchmarks
35%44%
31%
49%
29%29% 28% 27% 27% 29%36%
28%
42%
25%
42%
0%
20%
40%
60%
80%
100%
Campbell Park(N = 595)
FairmountPark
(N = 545)
Lakewood(N = 426)
Maximo(N = 366)
Melrose(N = 402)
% S
tud
en
ts
Istation Ability Scores by Tier Level (Pulled 1/24/2016)
Tier 1 Tier 2 Tier 3
50%
70%
15%8%
13%
0%
10%
20%
30%
40%
50%
60%
70%
80%
90%
100%
Campbell Park Fairmount Park Lakewood Maximo Melrose
Istation Data: Percent of Students Seriously Below Grade Level at the Target Level of Usage
(1/24/16)

41 SCALE UP FOR SUCCESS YEAR 2 FORMATIVE EVALUATION REPORT
Appendix C: Full Set of Recommendations Regarding Utilization of Family Navigators and Mental Health Clinicians
Refine the flowchart for the school social worker that is used in the referral process, and align this with a screening
process to match families with the best services for their specific need.
Refine a standard process for how referrals to services flow. While most school have a cohesive process for this, this
process can continue to be strengthened for all of the Scale Up schools. This includes referrals to family navigators,
mental health clinicians, and other support services. One suggestion for this is to have the school social worker
conduct a brief screening of the situation being referred so that he/she can determine which services would best fit
each family’s needs. Additionally, it would benefit school social workers to have a comprehensive list of services that
are available at the school and in the community to help support this work.
Continue the quarterly meetings that are currently occurring with the JWB staff, PCS district staff, family navigators,
mental health clinicians, school social workers, and school psychologists to share best practices for continuous
improvement of this model.
Continue to have PCS and JWB representatives meet with the individual schools twice a year, once in the fall and
once in the spring as a follow-up. This should include the family navigator, mental health clinician, school social
worker, school psychologist, and administration (i.e., principal or assistant principal) at each school site. This will
provide individualized support at each school site.
Provide a structure for professional learning communities to occur among the school social workers with their
supervisor; the school psychologist with their supervisor; the family navigators with their supervisor; and the mental
health clinicians with their supervisor. These can potentially be conducted as break-out sessions at the quarterly
meetings or as part of a separate meeting. This will allow each group to share best practices and to continue to
enhance their work. For example, the school social workers could use this time to refine their referral process and to
develop a corresponding document.

42 SCALE UP FOR SUCCESS YEAR 2 FORMATIVE EVALUATION REPORT
Addendum for March 30, 2016: District Cycle Assessment Proficiency Percentages and Growth Data
This section provides a summary of how the Scale Up schools are progressing toward increased student achievement in the areas of reading, math, and science. In addition, it provides a comparison of Scale Up schools to the district overall. The charts below show the overall percentages of students testing at the level of “proficient” for the Pinellas School District cycle assessments for math, language arts (ELA), and science. Comparisons are provided between the 2014-2015 data and the 2015-2016 data as well as between totals for all of the five Scale Up schools combined in comparison to the district. Results for the ELA Cycle II assessments are mixed, with third grade Scale Up schools showing a greater increase in the percentage of students demonstrating proficiency in comparison to the overall district changes in proficiency. On average, there was a greater increase in the percentage of students testing as proficient on the Math Cycle III assessment in grades one through four as compared to the district. Science scores remain mixed, with less gains for Scale Up schools in fourth and fifth grade compared to first and second grade gains at these schools. More definitive data will be included in the end of year summative evaluation report.
ELA Cycle II Percentages of Students Testing as Proficient
Total for Scale Up Schools Pinellas School District
2014-2015 2015-2016 % Change 2014-2015 2015-2016 % Change
1st Grade Proficient 46% 61% 15% 56% 72% 16%
2nd Grade Proficient 22% 40% 55% 65%
3rd Grade Proficient* 34% 48% 14% 68% 72% 4%
4th Grade Proficient** 23% 12% -11% 59% 41% -18%
5th Grade Proficient 25% 23% -2% 60% 56% -4%
Science Cycle II Percentages of Students Testing as Proficient
Total for Scale Up Schools Pinellas School District
2014-2015 2015-2016 % Change 2014-2015 2015-2016 % Change
1st Grade Proficient 73% 78% 5% 86% 83% -3%
2nd Grade Proficient 16% 35% 19% 48% 59% 11%
3rd Grade Proficient 12% 39%
4th Grade Proficient 2% 7% 5% 24% 29% 5%
5th Grade Proficient 17% 25% 8% 54% 62% 8%
*The test for ELA 2nd grade was rewritten for the 2015-2016 school year. As such, comparisons for 2nd grade were omitted. **The testing format for ELA 4th grade changed from paper-based in 2014-2015 to computer-based in 2015-2016. As such, interpretations or conclusions based on these data are limited. ***The testing format changed from paper-based to online and multi-select items were added. As such, interpretations or conclusions based on these data are limited. ****The testing format changed to include multi-select items (note: the testing for 4th and 5th grade were online for both 2014-2015 and 2015-2016). Therefore, interpretations or conclusions based on these data are limited. *****3rd grade Science Cycle II data are not yet available.
Math Cycle III Percentages of Students Testing as Proficient
Total for Scale Up Schools Pinellas School District
2014-2015 2015-2016 % Change 2014-2015 2015-2016 % Change
1st Grade Proficient 54% 56% 2% 68% 61% -7%
2nd Grade Proficient 17% 28% 11% 45% 53% 8%
3rd Grade Proficient*** 14% 25% 11% 34% 42% 8%
4th Grade Proficient**** 15% 20% 5% 45% 49% 4%
5th Grade Proficient**** 6% 5% -1% 32% 32% 0%
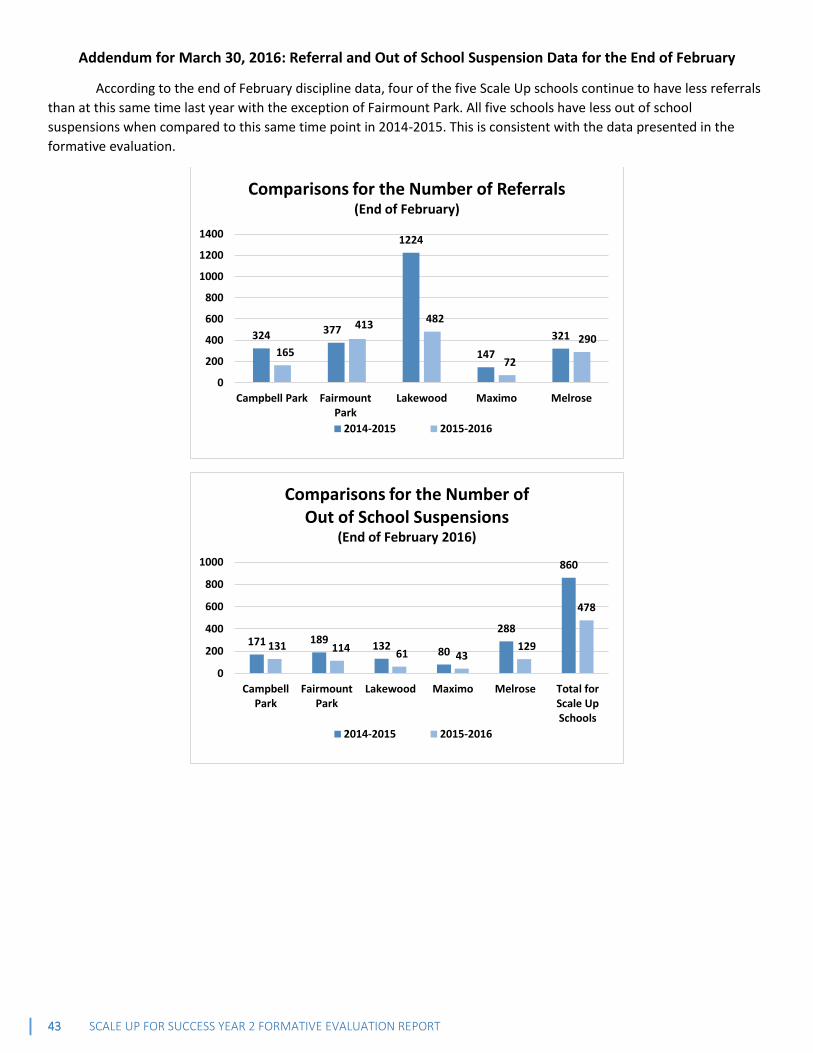
43 SCALE UP FOR SUCCESS YEAR 2 FORMATIVE EVALUATION REPORT
Addendum for March 30, 2016: Referral and Out of School Suspension Data for the End of February
According to the end of February discipline data, four of the five Scale Up schools continue to have less referrals
than at this same time last year with the exception of Fairmount Park. All five schools have less out of school
suspensions when compared to this same time point in 2014-2015. This is consistent with the data presented in the
formative evaluation.
324 377
1224
147
321
165
413482
72
290
0
200
400
600
800
1000
1200
1400
Campbell Park FairmountPark
Lakewood Maximo Melrose
Comparisons for the Number of Referrals (End of February)
2014-2015 2015-2016
171 189132 80
288
860
131 114 61 43129
478
0
200
400
600
800
1000
CampbellPark
FairmountPark
Lakewood Maximo Melrose Total forScale UpSchools
Comparisons for the Number of Out of School Suspensions
(End of February 2016)
2014-2015 2015-2016