sc workshop slidedeck · of a number of water auditing approaches, including awwa m36 – results...
TRANSCRIPT

1
Improving Water Efficiency, Loss Control & Your Bottom Line with
AWWA M36 Methodology
WELCOME
Expectations

2
Goal of the Workshop – gain hands-on training on the best practice water auditing to guide loss control methodsAgenda– Welcome & Expectations– Brief History of AWWA Water Audit method and its implementation– Fundamentals of the AWWA Water Audit Method– Compiling the Water Audit: Small Group Exercise
Lunch– Determining Data Validity: Small Group Exercise– Working with Your Data: Small Group Exercise– Monthly Data Collection and Auditing as a Standard Business Practice– Preview of the New AWWA Free Water Audit Software© v5.0– Open Forum: Question and Answer and recap discussion– Evaluations and Certificates
Adjourn
BRIEF HISTORY OR THE AWWA WATER AUDIT
METHOD

3
II. Brief History: Water Supply Efficiency
Focus for early system builders– Bring forth water supply for new
communities– Largely a supply-side focus – first seek a
larger water supply, conserve or become more efficient only if needed
Earliest mention of a structured approach for water efficiency– 1957 AWWA report: Revenue Producing
vs. Unaccounted-for water• Defines a “metered water ratio”
Guidance publications on water audits, leak detection – 1980’s
1950’s
1980’s
IWA/AWWA Collaboration
International Water Association’s Water Loss Task Force: 1996 -2000
– Formed to review world-wide approaches to water auditing and to identify best practices
– Included representatives from four countries and North America (AWWA)
– Devised best practice methodology by drawing from best features of a number of water auditing approaches, including AWWA M36
– Results published in 2000, Performance Indicators for Water Supply Service
The Water Loss Task Force continued its mission and is now the IWA Water Loss Specialist Group, which organizes the largest water loss conference in the world, held on a biennial basis– The next conference is “Water Loss 2014”, to be held
in Vienna, Austria from March 30 – April 2, 2014
Allan Lambert (UK)IWA WLTF Chair
1996 – 2000“the world’s foremost authority on leakage
management”

4
2001 AWWA States Survey – sponsored by AWWA Water Loss Control Committee
15%
10%
10%
10%
20%15%15%
15%
15%10%
10%15%
15%
15%
20%15%
7.5%
20%
20%
15%
15%
15%
Conclusion: “A better system of accounting is needed to instill better accountability in drinking water utilities”
AWWA Adopts Findings of IWA WLTF
AWWA adopted IWA’s best practice water audit method in 2003 in the Committee Report authored by the Water Loss Control Committee:“Applying World-wide Best Management Practices in Water Loss Control”– It included a recommendation to assess water
consumption and losses by volume and cost
– It included for the first time an AWWA recommendation to avoid use of the imprecise term “unaccounted-for” water and the “unaccounted-for” water percentage as a detailed performance measure
– It defined the economic level of leakage, and the economic levels of apparent loss as the desired target levels for utilities to seek, instead of seeking a specific “percentage”
AWWA’s Water Loss Control
Committee was originally formed in
the 1980’s as the “Leak Detection
Committee”

5
Best Practice Tools for Water Loss Control
AWWA M36 Publication – First Ed. (1991) based on State of CA pub– Second Ed. (1999)– Water Audits and Loss Control Programs
(2009), 3rd Edition features the IWA/AWWA Water Audit Methodology
– 4th Edition targeted for 2015 releaseAWWA Water Loss Control Committee’s Free Water Audit Software© (2006)– Current Version 4.2 exists in English and
French languages– Upgraded Version 5.0 targeted for 2014
Water Research Foundation ReportsTextbookswww.awwa.org - select “Water Loss Control” from resources menu
Water Audit Report for: Philadelphia Water DepartmentReporting Year:
ALL VOLUMES TO BE ENTERED AS ANNUAL QUANTITIES
WATER SUPPLIEDVolume from own sources: M 95,526.0 million gallons (US) per year
Master meter error adjustment: M 695.4 million gallons (US) per year
Water Imported: M 0.0 million gallons (US) per year
Water Exported: M 7,210.2 million gallons (US) per year.
WATER SUPPLIED: . 89,011.2 million gallons (US) per year..
AUTHORIZED CONSUMPTION .
Billed metered: M 57,535.2 million gallons (US) per year
Billed unmetered: M 0.0 million gallons (US) per year
Unbilled metered: M 179.3 million gallons (US) per year
Unbilled unmetered: E 693.6 million gallons (US) per year.
AUTHORIZED CONSUMPTION: . 58,408.1 million gallons (US) per year
.
WATER LOSSES (Water Supplied - Authorized Consumption) . 30,603.1 million gallons (US) per year.
Apparent Losses .
Unauthorized consumption: E 1,145.2 million gallons (US) per year
Customer metering inaccuracies: E 162.5 million gallons (US) per year
Data handling errors: E 2,751.2 million gallons (US) per year
Apparent Losses: . 4,058.9 million gallons (US) per year
Real Losses .
Real Losses (Water Losses - Apparent Losses): . 26,544.2 million gallons (US) per year.
WATER LOSSES: . 30,603.1 million gallons (US) per year..
NON_REVENUE WATER .
NON-REVENUE WATER: . 31,476.0 million gallons (US) per year
.
SYSTEM DATA ..
Length of mains: M 3,160.0 miles
Number of active AND inactive service connections: M 548,289Connection density: . 174 conn./mile main
Average length of private pipe: E 12.0 ft
.
Average operating pressure: E 55.0 psi
.
COST DATA ..
Total annual cost of operating water system: M $167,604,000 $/Year
Customer retail unit cost (applied to apparent losses): M $3.95Variable production cost (applied to real losses): M $133.58 $/million gallons (US)
DATA REVIEW - Please review the following information and make changes above if necessary:
- Input values should be indicated as either measured or estimated. You have entered:
12 as measured values 6 as estimated values 0 without specifying measured or estimated
- It is important to accurately measure the master meter - you have entered the measurement type as: measured
- Cost Data: No problems identified
PERFORMANCE INDICATORS
Financial IndicatorsNon-revenue water as percent by volume: 35.4%
Non-revenue water as percent by cost: 11.7%Annual cost of Apparent losses: $16,012,518
Annual cost of Real Losses: $3,545,768
Operational Efficiency Indicators
Apparent losses per service connection per day: 20.28 gallons/connection/day
Real losses per service connection per day*: 132.64 gallons/connection/day
Real losses per length of main per day*: N/A
Real losses per service connection per day per psi pressure: 2.41 gallons/connection/day/psi
Unavoidable Annual Real Losses (UARL): 5.98 million gallons/day
12.17
* only the most applicable of these two indicators will be calculated
AWWA WLCC Water Audit Software: Reporting Worksheet
Infrastructure Leakage Index (ILI) [Real Losses/UARL]:
2004
under-registered
$/1000 gallons (US)
??
?
?
?
? Click to access definition
??
?
?
?
?
Back to Instructions
Please enter data in the white cells below. Where possible, metered values should be used; if metered values are unavailable please estimate a value. Indicate this by selecting a choice from the gray box to the left, where M = measured (or accurately known value) and E = estimated.
?
?
?
???
?
?
?
(pipe length between curbstop and customer meter or property
Copyright © 2006, American Water Works Association. All Rights Reserved.
Water Research Foundation: Water Loss Projects
Evaluating Water Loss and Planning Loss Reduction Strategies (2005): assessed water auditing approaches and emerging loss control interventionsLeakage Management Technologies (2005): assessed innovative leakage management technologies and their applicability to North American water utilities. This included District Metered Areas (DMA) and pressure management. Criteria for Optimized Distribution Systems (2010): produced recommendations for Partnership for Safe WaterDistribution System program, including water main breaks and leaks and pressure managementEffective Organization and Component Analysis of Water Utility Leakage Data (anticipated 2014): will offer an Excel tool for leakage analysis and leakage management planning. Will compliment AWWA’s Free Water Audit Software©

6
Key Regulatory Milestones for Water in the United States
Strong national structures exist for water quality; less so for water “quantity” Clean Water Act (1972): Control of pollutants, wastewater into waterways (Wastewater Treatment)Safe Drinking Water Act (1974, amendments 1986): Drinking Water (Water Treatment, Source Water Protection, Capacity Development)– Partnership for Safe Water: Optimized water quality
leaving treatment plants – program launched in 1990’sUS Environmental Protection Agency focus on the distribution system– Partnership for Safe Water: Distribution Systems –
program launched in 2012US national “quantity” regulations are typically limited to reporting of source water withdrawals
Regulatory Activity: State and Regional Level in the United States
State Agencies – focus on water audit reporting – Georgia: Environmental Protection Division– Tennessee: Comptroller of the Treasury– Texas: Texas Water Development Board– Pennsylvania: Public Utility Commission– New Mexico: Office of the State Engineer– Wisconsin: Public Services Commission– Washington: Department of Health– Illinois: Department of Natural Resources– Southeastern States: NC, SC, KY, VA
Regional/Water Resource Agencies– California: California Urban Water Conservation
Council – focus on reporting and leakage control– Delaware River Basin Commission

7
RI
States with Varying Mechanisms for Water Loss Auditing, Reporting & Performance Targets
DV 65, NRW%(cost) 30%
25% WL (small) 15% (large)
10% Leakage10% Leakage, 3 year average
10% UFW
10% UFW
10% WL
15% NAW
15% UFW
15% WL
25% WL
Median UFW % of Class
8% UFW
WA
OR
TX
WI
MN
IL IN WV
MDPA NJ
DRBC
MANH
TN
GA
FL10% UFW
CA
NM
MO KYVA
NC
SC
NY
DE
Year 5, improvement or top 20% or below benchmark leakage value
10% UFW15% UFW
30% Leakage
15% NRW
15% WL

8
15
9
-
200
400
600
800
1,000
1,200
1,400
1,600
Mill
ion
Gal
lons
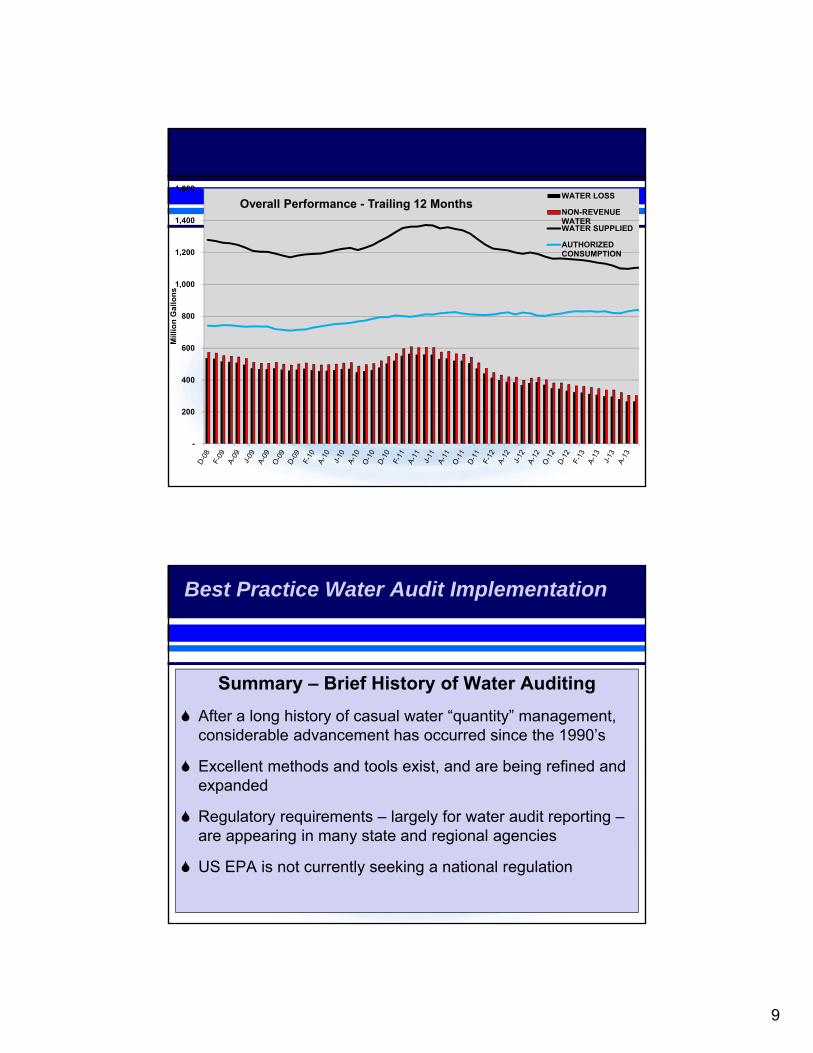
Overall Performance - Trailing 12 MonthsWATER LOSS
NON-REVENUEWATERWATER SUPPLIED
AUTHORIZEDCONSUMPTION
Best Practice Water Audit Implementation
Summary – Brief History of Water AuditingAfter a long history of casual water “quantity” management, considerable advancement has occurred since the 1990’s
Excellent methods and tools exist, and are being refined and expanded
Regulatory requirements – largely for water audit reporting –are appearing in many state and regional agencies
US EPA is not currently seeking a national regulation
10
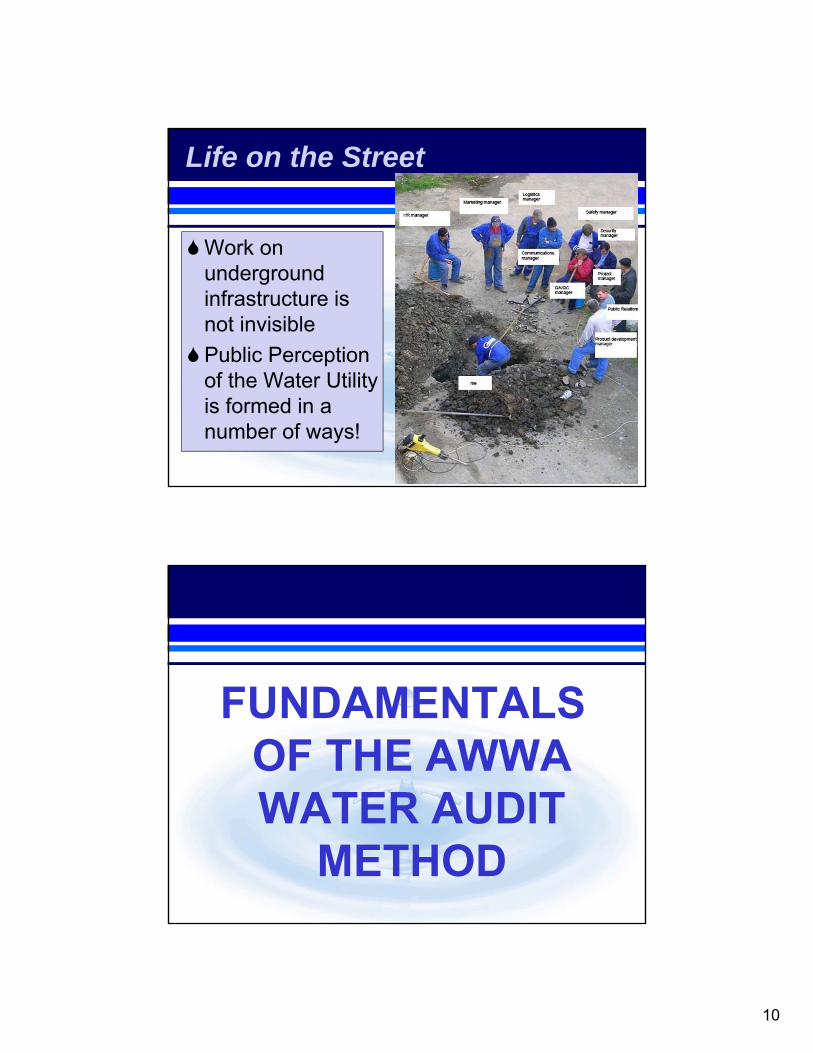
Life on the Street
Work on underground infrastructure is not invisiblePublic Perception of the Water Utility is formed in a number of ways!
FUNDAMENTALS OF THE AWWA WATER AUDIT
METHOD

11
WaterImported
OwnSources
TotalSystemInput
( allowfor
knownerrors )
TotalSystemInput
(allowfor
knownerrors)
WaterSupplied
WaterExported
WaterSupplied
WaterExported
WaterLosses
AuthorizedConsumption
WaterImported
OwnSources
TotalSystemInput
( allowfor
knownerrors )
WaterImported
OwnSources
TotalSystemInput
( allowfor
knownerrors )
TotalSystemInput
(allowfor
knownerrors)
WaterSupplied
WaterExported
WaterSupplied
WaterExported
WaterLosses
AuthorizedConsumption
WaterLosses
AuthorizedConsumption
RealLosses
ApparentLosses
UnbilledAuthorized
Consumption
BilledAuthorized
Consumption
Non-Revenue
Water
RevenueWater
Leakage & Overflows at Storage
Billed Unmetered Consumption
Billed Metered Consumption
Billed Water Exported
Leakage on Service Lines
Leakage on Mains
Customer Metering Inaccuracies
Unauthorized Consumption
Unbilled Unmetered Consumption
Unbilled Metered Consumption
Systematic Data Handling Error
Water Balance: Categorizing Use and Loss
USE
LOSS
QUIZ

12
QUIZBilled
Authorized Consumption
Unbilled Authorized Consumption
Apparent Losses
Real Losses
Fire Dept. flushing
Under‐registered customer meters
Pipe joint leakageWater theft
Customer billing adjustment
DOT metered usage
AMR reading device failureCustomer toilet leak
Water main break
Storage tank overflows
WaterImported
OwnSources
TotalSystemInput
( allowfor
knownerrors )
TotalSystemInput
(allowfor
knownerrors)
WaterSupplied
WaterExported
WaterSupplied
WaterExported
WaterLosses
AuthorizedConsumption
WaterImported
OwnSources
TotalSystemInput
( allowfor
knownerrors )
WaterImported
OwnSources
TotalSystemInput
( allowfor
knownerrors )
TotalSystemInput
(allowfor
knownerrors)
WaterSupplied
WaterExported
WaterSupplied
WaterExported
WaterLosses
AuthorizedConsumption
WaterLosses
AuthorizedConsumption
RealLosses
ApparentLosses
UnbilledAuthorized
Consumption
BilledAuthorized
Consumption
Non-Revenue
Water
RevenueWater
Leakage & Overflows at Storage
Billed Unmetered Consumption
Billed Metered Consumption
Billed Water Exported
Leakage on Service Lines
Leakage on Mains
Customer Metering Inaccuracies
Unauthorized Consumption
Unbilled Unmetered Consumption
Unbilled Metered Consumption
Systematic Data Handling Error
Water Balance: Categorizing Use and Loss

13
Real vs Apparent Loss
Real Loss – Physical loss - leakage– Cost impacts at ‘wholesale’ rate– Tools for control include leakage and pressure
managementApparent Loss – Non-physical / revenue loss - slow meters, billing
issues and theft – Cost impacts at ‘retail’ rate.– Tools for control include data management, quality
control policies/practices, & meter testing & repair
Non-Revenue Water
1. Water put into the system that does not return revenue to the Utility.
2. Real Loss + Apparent Loss + Unbilled Authorized Consumption.
3. “Unaccounted-for water” has been abandoned forever, as an “obsolete technology”.

14
CARL= Current Annual Real Loss(current leakage)
UARL= Unavoidable Annual Real Loss(theoretical low limit of leakage)
ILI = CARL > 1.0UARL
Infrastructure Leakage IndexILI
Data Validity
1. A quantitative measure of the reliability of your audit.
2. Quantified on a scale of 100.
3. Provides context to the audit, and guidance for – what are my next steps?

15
AWWA Free Water Audit Software© - Version 4.2Data Grading for each input
AWWA Free Water Audit Software©Guidance on Use of Water Audit Data
Functional Focus Area
Audit Data Collection
Short-term loss control
Long-term loss control
Target-setting
Benchmarking
Water Audit Data Validity Level / Score
Level I (0-25) Level II (26-50) Level III (51-70) Level IV (71-90) Level V (91-100)
Annual water audit is a reliable gauge of year-to-year water
efficiency standing
Research information on leak detection programs. Begin
flowcharting analysis of customer billing system
Conduct loss assessment investigations on a sample
portion of the system: customer meter testing, leak survey,
unauthorized consumption, etc.
Establish ongoing mechanisms for customer meter accuracy testing, active leakage control and infrastructure monitoring
Refine, enhance or expand ongoing programs based upon
economic justification
Stay abreast of improvements in metering, meter reading, billing,
leakage management and infrastructure rehabilitation
Launch auditing and loss control team; address production
metering deficiencies
Analyze business process for customer metering and billing
functions and water supply operations. Identify data gaps.
Establish/revise policies and procedures for data collection
Refine data collection practices and establish as routine business
process
Continue incremental improvements in short-term and
long-term loss control interventions
Establish long-term apparent and real loss reduction goals (+10
year horizon)
Establish mid-range (5 year horizon) apparent and real loss
reduction goals
Evaluate and refine loss control goals on a yearly basis
Begin to assess long-term needs requiring large expenditure:
customer meter replacement, water main replacement program,
new customer billing system or Automatic Meter Reading (AMR)
system.
Begin to assemble economic business case for long-term
needs based upon improved data becoming available through the
water audit process.
Conduct detailed planning, budgeting and launch of
comprehensive improvements for metering, billing or infrastructure
management
Identify Best Practices/ Best in class - the ILI is very reliable as a real loss performance indicator
Preliminary Comparisons - can begin to rely upon the
Infrastructure Leakage Index (ILI) Performance Benchmarking - ILI is meaningful in comparing real

16
A Word About Data Validity
Utilities with a lower Data Validity should focus program efforts on data collection and validation until the overall data quality becomes more reliable.
Utilities with higher Data Validity can trust their data to serve as the basis for budgetary decisions on major loss control initiatives such as leakage management controls or wholesale customer meter replacement.
Reliable data can also be benchmarked against data from other utilities with reliable data.
Reporting WorksheetWater Audit Report for: Philadelphia Water DepartmentReporting Year:
All volumes to be entered as: MILLION GALLONS (US) PER YEAR
WATER SUPPLIED
Volume from own sources: 7 94,536.900 Million gallons (US)/yr (MG/Yr)Master meter error adjustment: 10 2,779.300
Water imported: n/a MG/YrWater exported: 10 7,100.400 MG/Yr
WATER SUPPLIED: 84,657.200 MG/Yr.
AUTHORIZED CONSUMPTIONBilled metered: 7 57,242.400 MG/Yr
Billed unmetered: n/a MG/YrUnbilled metered: n/a MG/Yr Pcnt: Value:
Unbilled unmetered: 8 764.200 MG/Yr 1.25%
AUTHORIZED CONSUMPTION: 58,006.600 MG/Yr
WATER LOSSES (Water Supplied - Authorized Consumption) 26,650.600 MG/Yr
Apparent Losses Pcnt: Value:Unauthorized consumption: 8 2,086.300 MG/Yr 0.25%
Customer metering inaccuracies: 8 190.300 MG/YrSystematic data handling errors: 5 4,674.400 MG/Yr
Apparent Losses: 6,951.000 MG/Yr
Real LossesReal Losses = Water Losses - Apparent Losses: 19,699.600 MG/Yr
WATER LOSSES: 26,650.600 MG/Yr
NON-REVENUE WATERNON-REVENUE WATER: 27,414.800 MG/Yr
= Total Water Loss + Unbilled Metered + Unbilled Unmetered
2,086.300
764.200
AWWA WLCC Free Water Audit Software: Reporting Worksheet
2008
over-registered
7/2007 - 6/2008
<< Enter grading in column 'E'
MG/Yr
190.300
Choose this option to enter a percentage of
billed metered consumption. This is NOT a default value
?
?
?
?
?
? Click to access definition
?
?
Back to Instructions
Please enter data in the white cells below. Where available, metered values should be used; if metered values are unavailable please estimate a value. Indicate your confidence in the accuracy of the input data by grading each component (1-10) using the drop-down list to the left of the input cell. Hover the mouse over the cell to obtain a description of the grades
???
?
Use buttons to selectpercentage of water supplied
ORvalue
?Click here: for help using option buttons below
WAS v4.0
?
Copyright © 2009, American Water Works Association. All Rights Reserved.
?
?
?
?

17
SYSTEM DATA
Length of mains: 9 3,137.0 milesNumber of active AND inactive service connections: 7 547,932
Connection density: 175 conn./mile mainAverage length of customer service line: 7 12.0 ft
Average operating pressure: 10 55.0 psi
COST DATA
Total annual cost of operating water system: 10 $219,182,339 $/YearCustomer retail unit cost (applied to Apparent Losses): 9 $4.97
Variable production cost (applied to Real Losses): 9 $215.50 $/Million gallons
PERFORMANCE INDICATORS
Financial IndicatorsNon-revenue water as percent by volume of Water Supplied: 32.4%Non-revenue water as percent by cost of operating system: 17.8%
Annual cost of Apparent Losses: $34,546,470Annual cost of Real Losses: $4,245,264
Operational Efficiency Indicators
Apparent Losses per service connection per day: 34.76 gallons/connection/day
Real Losses per service connection per day*: 98.50 gallons/connection/day
Real Losses per length of main per day*: N/A
Real Losses per service connection per day per psi pressure: 1.79 gallons/connection/day/psi
Unavoidable Annual Real Losses (UARL): 2,178.15 million gallons/year
9.04
* only the most applicable of these two indicators will be calculated
WATER AUDIT DATA VALIDITY SCORE:
PRIORITY AREAS FOR ATTENTION:
1: Volume from own sources
2: Billed metered
3: Systematic data handling errors
$/1000 gallons (US)
A weighted scale for the components of consumption and water loss is included in the calculation of the Water Audit Data Validity Score
Based on the information provided, audit accuracy can be improved by addressing the following components:
*** YOUR SCORE IS: 82 out of 100 ***
Infrastructure Leakage Index (ILI) [Real Losses/UARL]:
?
?
?
?
?
?
?
?
?
(pipe length between curbstop and customer meter or property boundary)
For more information, click here to see the Grading Matrix worksheet
Life on the Street

18
Validating Production Metering and Supply Data to Produce an Accurate “Water Supplied Volume”
The importance of Production flows in the Water Audit– The “Volume from own Sources” and/or “Water Imported” volumes
are the basis of the “Water Supplied” calculation in the water audit– Master Meter Error Adjustment – takes into account several sources
of potential error in the production volumes that will skew the “Water Supplied” volume. These include:
• Volume error due to inaccuracies of the production meters• Volume adjustments as part of routine balancing tabulations across the supply
system to account for flows into- and out of storage tanks and reservoirs; and across pressure zones and DMA’s.
• Corrections due to data gaps
Obtaining high degree of accuracy for the “Water Supplied” volume is the most important step in the water audit process
3
Production Volumes – leading to Water Supplied
– Production Volumes: Volume from own sources, Water Imported, Water Exported

19
Production Meter Site & the Flow Profile
1. Flowmeters should be located and installed properly
a. Recognize the effects of pipe bends and obstructions on the flow profile and the meters ability to measure flow
i. Smooth pipe:
ii. Rough pipe:
iii. Downstream obstruction:iv. Downstream bend:
b. The shape of the flow profile has bearing on meter performance and the ability to test the meter
c. Production meters are better sited at locations with relatively smooth, unobstructed flow
Velocity Profiles at production meters
i.
ii.
iii.
iv.
Production Meter Site & the Flow Profile
Recommended clear spacing for flowmeters

20
Production Meter Site & the Flow Profile
What not to do
Accurately Quantifying “Water Supplied”
2. Meters should be regularly verified for accuracya. Large meters can be compared with an inline
insertion or strap-on meter measuring flow downstream of the primary meter
i. Make certain that the temporary metering location is representative and accurate
ii. Strive for minimum 24-hr period if using this method
iii. Philadelphia Water Department conducts over 50 verifications each year in this manner
b. Smaller meters might be tested using field test apparatus as is conducted on large customer meters; or meter sent to a test laboratory
c. Document/store the inaccuracy values to serve as a basis for data adjustments
Insertion pito rod measuring and recording flow
21
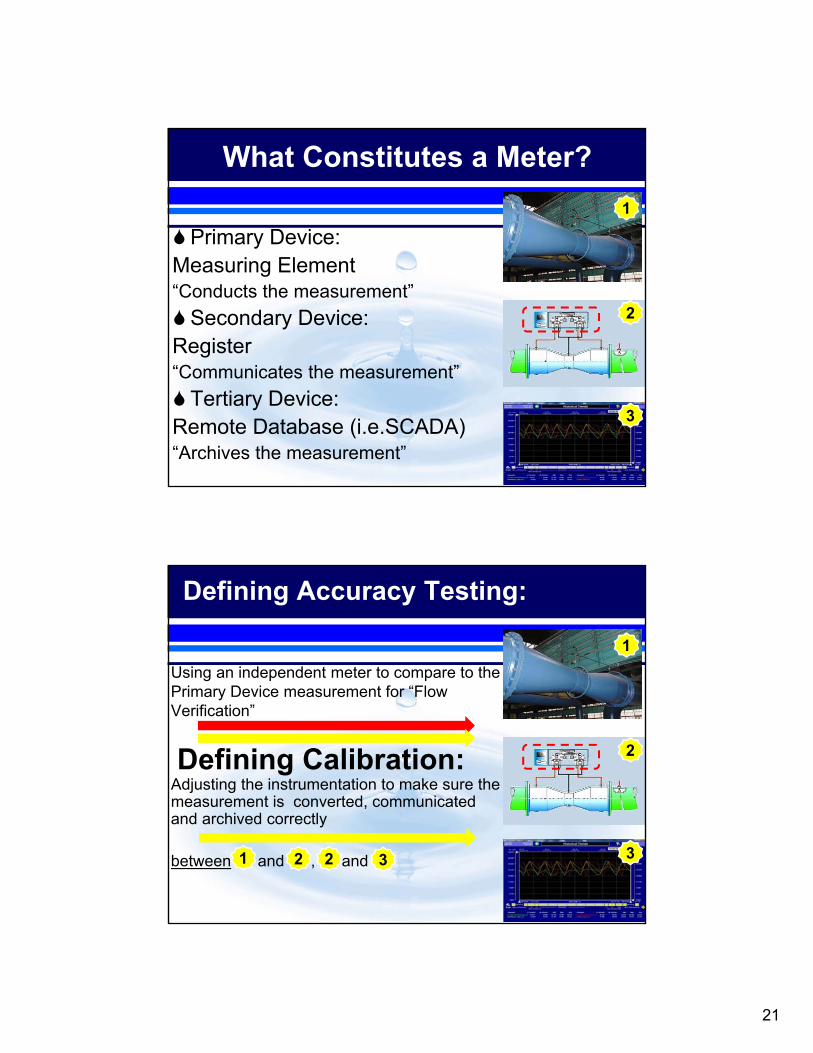
What Constitutes a Meter?
Primary Device: Measuring Element“Conducts the measurement”
Secondary Device: Register“Communicates the measurement”
Tertiary Device: Remote Database (i.e.SCADA)“Archives the measurement”
1
2
3
Defining Accuracy Testing:
Using an independent meter to compare to the Primary Device measurement for “Flow Verification”
Defining Calibration:Adjusting the instrumentation to make sure the measurement is converted, communicated and archived correctly
between and , and
1
2
31 2 2 3

22
Accurately Quantifying “Water Supplied”
3. Meters should be recalibrated, repaired or replaced regularly to maintain reliable performancea. New, current-technology meters
should replace dated or defective meters
b. Permanently installed insertion type meters can be a less costly means of establishing or renewing reliable metering
c. Refer to AWWA M33 guidance manual “Flowmeters in Water Supply” for information on meter selection
d. Many dated meters exist throughout the North American water industry
Full-bore Magnetic Flowmeter replacement on 48-inch untreated water line 2008 in Philadelphia
Insertion Magnetic Flowmeter in Birmingham, AL
Accurately Quantifying “Water Supplied”
4. Regularly determine Master Meter Error Adjustmenta. Data should be reviewed at least weekly, but
ideally, each business day, for trends/anomalies
b. Balance flows to account for storage level changes and district water transfers
c. Adjust for recorded inaccuracy levels of given meters
d. Adjustments due to data errore. Adjustments due to data gapsf. Aggregate master meter error is:
i. Added if source meter under-registration exists
ii. Subtracted if source meter over-registration exists
16-inch turbine meter on wholesale account being verified
via inline pito rod

23
Summary – Obtaining an Accurate “Water Supplied Quantity”
The “Volume from own Sources” and the “Water Supplied” quantities are the most important quantities in the water audit All water sources, imports and exports should be metered with good meter management and routine data surveillance Flow data should be monitored and balanced across the distribution systemCorrections should be carried-out to adjust for bad data and the composite adjustments become the quantity of “Master Meter Error Adjustment”
36-inch High Service Venturi Meter(Courtesy of Primary Flow Control)
Life on the Street
No matter how challenging your problems may seem to be, there is always someone with a bigger challenge!
24
WATER AUDIT
EXERCISES
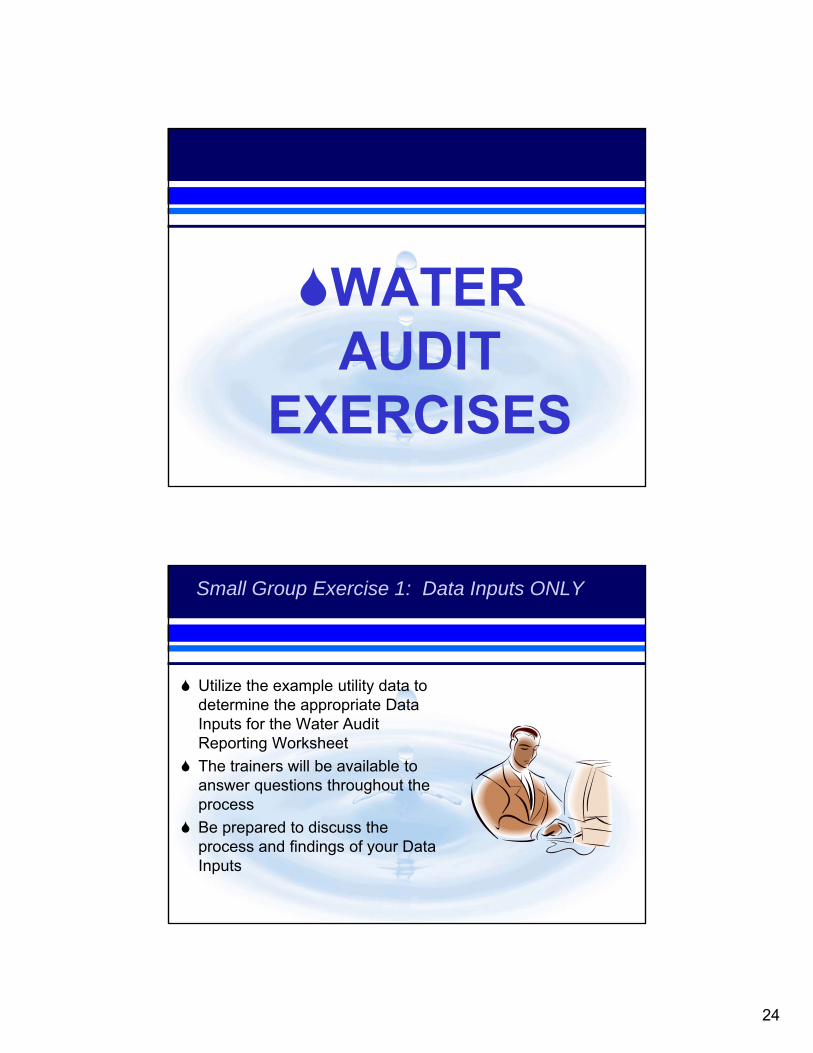
Small Group Exercise 1: Data Inputs ONLY
Utilize the example utility data to determine the appropriate Data Inputs for the Water Audit Reporting WorksheetThe trainers will be available to answer questions throughout the processBe prepared to discuss the process and findings of your Data Inputs

25
Small Group Exercise 2: Data Gradings ONLY
Review the example utility data to determine, as best you can, the appropriate data grading (1 – 10) for each data inputThe trainers will be available to answer questions throughout the processBe prepared to discuss the process and findings of your Data Validity
Small Group Exercise 3: Q&A with Your Audit
Discuss questions you brought with you regarding your Water AuditUse your Reference Sheet to take notes
26
Life on the Street
Monthly Data Collection and Auditing as a Standard
Business Practice

27
$1,349,895 67%
$673,122 33%
Water Loss by Type(Cost)
Apparent Loss $Real Loss $
- 100 200 300 400 500 600 700 800 900
Mill
ion
Gal
lons
Overall Water Loss - Trailing 12 Months
WATER LOSSES:WATER SUPPLIED:AUTHORIZED CONSUMPTION:
Building it Monthly
Water Audit Report for: Philadelphia Water DepartmentReporting Year:
ALL VOLUMES TO BE ENTERED AS ANNUAL QUANTITIES
WATER SUPPLIEDVolume from own sources: M 95,526.0 million gallons (US) per year
Master meter error adjustment: M 695.4 million gallons (US) per year
Water Imported: M 0.0 million gallons (US) per year
Water Exported: M 7,210.2 million gallons (US) per year.
WATER SUPPLIED: . 89,011.2 million gallons (US) per year..
AUTHORIZED CONSUMPTION .
Billed metered: M 57,535.2 million gallons (US) per year
Billed unmetered: M 0.0 million gallons (US) per year
Unbilled metered: M 179.3 million gallons (US) per year
Unbilled unmetered: E 693.6 million gallons (US) per year.
AUTHORIZED CONSUMPTION: . 58,408.1 million gallons (US) per year
.
WATER LOSSES (Water Supplied - Authorized Consumption) . 30,603.1 million gallons (US) per year.
Apparent Losses .
Unauthorized consumption: E 1,145.2 million gallons (US) per year
Customer metering inaccuracies: E 162.5 million gallons (US) per year
Data handling errors: E 2,751.2 million gallons (US) per year
Apparent Losses: . 4,058.9 million gallons (US) per year
Real Losses .
Real Losses (Water Losses - Apparent Losses): . 26,544.2 million gallons (US) per year.
WATER LOSSES: . 30,603.1 million gallons (US) per year..
NON_REVENUE WATER .
NON-REVENUE WATER: . 31,476.0 million gallons (US) per year
.
SYSTEM DATA ..
Length of mains: M 3,160.0 miles
Number of active AND inactive service connections: M 548,289Connection density: . 174 conn./mile main
Average length of private pipe: E 12.0 ft
.
Average operating pressure: E 55.0 psi
.
COST DATA ..
Total annual cost of operating water system: M $167,604,000 $/Year
Customer retail unit cost (applied to apparent losses): M $3.95Variable production cost (applied to real losses): M $133.58 $/million gallons (US)
DATA REVIEW - Please review the following information and make changes above if necessary:
- Input values should be indicated as either measured or estimated. You have entered:
12 as measured values 6 as estimated values 0 without specifying measured or estimated
- It is important to accurately measure the master meter - you have entered the measurement type as: measured
- Cost Data: No problems identified
PERFORMANCE INDICATORS
Financial IndicatorsNon-revenue water as percent by volume: 35.4%
Non-revenue water as percent by cost: 11.7%
AWWA WLCC Water Audit Software: Reporting Worksheet
2004
under-registered
$/1000 gallons (US)
?
?
?
?
?
? Click to access definition
?
?
?
?
?
?
Back to Instructions
Please enter data in the white cells below. Where possible, metered values should be used; if metered values are unavailable please estimate a value. Indicate this by selecting a choice from the gray box to the left, where M = measured (or accurately known value) and E = estimated.
?
???
?
?
?
(pipe length between curbstop and customer meter or property
Copyright © 2006, American Water Works Association. All Rights Reserved.

28
WaterImported
OwnSources
TotalSystemInput
( allowfor
knownerrors )
TotalSystemInput
(allowfor
knownerrors)
WaterSupplied
WaterExported
WaterSupplied
WaterExported
WaterLosses
AuthorizedConsumption
WaterImported
OwnSources
TotalSystemInput
( allowfor
knownerrors )
WaterImported
OwnSources
TotalSystemInput
( allowfor
knownerrors )
TotalSystemInput
(allowfor
knownerrors)
WaterSupplied
WaterExported
WaterSupplied
WaterExported
WaterLosses
AuthorizedConsumption
WaterLosses
AuthorizedConsumption
RealLosses
ApparentLosses
UnbilledAuthorized
Consumption
BilledAuthorized
Consumption
Non-Revenue
Water
RevenueWater
Leakage & Overflows at Storage
Billed Unmetered Consumption
Billed Metered Consumption
Billed Water Exported
Leakage on Service Lines
Leakage on Mains
Customer Metering Inaccuracies
Unauthorized Consumption
Unbilled Unmetered Consumption
Unbilled Metered Consumption
Systematic Data Handling Error
Monthly Tracking
WaterImported
OwnSources
TotalSystemInput
( allowfor
knownerrors )
TotalSystemInput
(allowfor
knownerrors)
WaterSupplied
WaterExported
WaterSupplied
WaterExported
WaterLosses
AuthorizedConsumption
WaterImported
OwnSources
TotalSystemInput
( allowfor
knownerrors )
WaterImported
OwnSources
TotalSystemInput
( allowfor
knownerrors )
TotalSystemInput
(allowfor
knownerrors)
WaterSupplied
WaterExported
WaterSupplied
WaterExported
WaterLosses
AuthorizedConsumption
WaterLosses
AuthorizedConsumption
RealLosses
ApparentLosses
UnbilledAuthorized
Consumption
BilledAuthorized
Consumption
Non-Revenue
Water
RevenueWater
Leakage & Overflows at Storage
Billed Unmetered Consumption
Billed Metered Consumption
Billed Water Exported
Leakage on Service Lines
Leakage on Mains
Customer Metering Inaccuracies
Unauthorized Consumption
Unbilled Unmetered Consumption
Unbilled Metered Consumption
Systematic Data Handling Error
Monthly Tracking

29
Monthly Tracking
WATER SUPPLIED1. Volume from Own Sources (with
error adjustment, if known)2. Water Imported3. Water Exported
WATER SUPPLIED = 1 + 2 - 3
Monthly Tracking
AUTHORIZED CONSUMPTION4. Billed Metered5. Billed Unmetered6. Unbilled Metered7. Unbilled Unmetered
AUTHORIZED CONSUMPTION = 4 + 5 + 6 + 7

30
Monthly Tracking
WATER SUPPLIED-AUTHORIZED CONSUMPTION= WATER LOSS
Monthly Tracking vs Annual Audit
Monthly AnnualVolume from Own Sources Data Validity ScoreWater Imported Master Meter Error AdjustmentWater Exported Customer Meter InaccuracyBilled Metered Use Systematic Data Handling ErrorsBilled Unmetered Use Length of MainsUnbilled Metered Use Number of ConnectionsUnbilled Unmetered Use Annual Operating Cost
Customer Retail RateVariable Production Cost

31
Essential Components for SuccessWater Loss Control Team
•Distribution•Metering•Billing•Finance•Customer Service•Fire Department•Parks & Rec•Engineering•Executive
•Multi-departmental•Cross-functional•Essential for establishing a culture of efficiency
Performance Benchmarking
Monthly Data, Lag-Time Adjusted
Monthly Data, Unadjusted
Trailing 12 Month Data
32
Life on the Street
Preview of AWWA Free Water Audit Software©
v5.0

33
Inputs & Outputs separated into 2 tabsMeter error adjustment for all water supplied componentsUpdated grading matrix and scoringUpdated definitionsNew Water Loss DashboardNew comments pageColor scheme improvements
Life on the Street

34
Evaluations & Certificates
Departing With Action