sbi dynamic bond fund : debt mutual fund - apr 2016
TRANSCRIPT
SBI DYNAMIC BOND FUND

This product is suitable for investors who are
seeking:
Investment in debt and money-
market securities
Regular income for medium term
Low risk
Disclaimer: Investors should consult their financial advisors if in doubt whether this
product is suitable for them.
SBI Dynamic Bond Fund

SBI Dynamic Bond Fund Features
Instruments % of Net Assets (Min – Max.)
Risk Profile
Debt# Instrumentsincluding GovernmentSecurities andCorporate Debt
0 - 100% Medium
Money Market Instruments
0 - 100% Low
#Debt Instruments may include securitized debt up to 40% of the net assets
Actively managed fund with the flexibility to
invest in overnight maturity papers to high
duration papers, it may move across different
asset types from money market to medium/long
bonds and G-sec based on the fund manager’s
outlook
Average maturity is dynamically managed
based on interest rate view, inflation & credit
risk
The Fund is best suited in volatile markets as
it endeavours to capture the best of duration
play, interest rate movements& credit
spreads. The fund focuses on generating
returns by way of market movements rather
than through interest accrual
15.9715.29 15.16 15.74
17.00 17.53
15.63
9.14
5.246.65 6.68
9.57
0
4
8
12
16
20

SBI Dynamic Bond Fund Performance
Past performance may or may not be sustained in future. Returns (in %) other than since inception are absolute,calculated for growth option of regular plan and in INR are point-to-point (PTP) returns calculated on a standard investment of10,000/-. Additional benchmark as prescribed by SEBI for long-term debt schemes is used for comparison purposes.
31-Mar-2015 To 31-Mar-2016
31-Mar-2014 To 31-Mar-2015
28-Mar-2013 To 31-Mar-2014
Since Inception
Absolute Returns (%)CAGR Returns
(%)PTP Returns
(INR)
SBI Dynamic Bond Fund 5.57 13.69 2.56 5.02 18,131Crisil Composite Bond Fund Index (Scheme Benchmark) 8.24 14.59 4.39 6.41 21,259Crisil 10 year Gilt Index (Additional Benchmark) 7.97 14.57 -0.96 5.32 18,767
Data as on March 31, 2016
-2
0
2
4
6
8
10
12
14
16
31-Mar-2015 To31-Mar-2016
31-Mar-2014 To31-Mar-2015
28-Mar-2013 To31-Mar-2014
Since Inception
SBI Dynamic Bond Fund
Crisil Composite Bond Fund Index(Scheme Benchmark)
Crisil 10 year Gilt Index (AdditionalBenchmark)

SBI Dynamic Bond Fund Competitive Advantage
Strategic Asset Allocation
Tactical Asset Allocation
Change in systemic liquiditydriven by factors such ascredit deposit growth andcurrency in circulation.
Policy rate actions.
Short term – corporate credit
Change in systemicliquidity driven by factorssuch as credit depositgrowth and currency incirculation.
Policy rate actions.
The issuance calendar ofbills.
Short term – Govt Bonds
Change in monetarystance.
Assessment of fiscalsituation.
Shape of the yield curve.
SLR holdings of banks.
RBI's open marketoperations.
Movement in commodityand forex markets .
Long term – Govt Bonds
Spread reversion w.r.tmedium term levels.
Changes in relative attractionbetween offshore anddomestic funding avenues.
Appetite from insurance co’sand PF's
Movement in commodity andforex markets
Long term – Corporate Credit
• Change in systemic liquidity driven by factors such as
• Supply issues for all segments
• News flow
• Global developments
• Market positioning

SBI Dynamic Bond Fund – Competitive Advantage - Instances
Strategic Asset Allocation
Yield on March 10, 2012:
Market analysis & call: (March 2012)
With the commencement of borrowing by the government in the new financial year, government bonds were
expected to underperform
With demand for wholesale funds from banks & consequent year end tightness, money market rates were at
elevated levels. 1 year CD’s during March were at 10.75-10.85%.
The short end corporate bonds (2-3 yrs.) at 9.65-9.70% levels were also fairly priced vis-à-vis G-Sec
considering moderate supply pipeline.
On account of above we invested 90% of our assets in 1 year CD and balance in the ST corporate bond
segment.
Securities 1 Year 2-3 Year 10 Year
G Sec 8.26 8.30
Corporate bonds 9.66 9.39
CD 10.80%
Yield on April 21, 2012:
Securities 1 Year 2-3 Year 10 Year
G Sec 8.22% 8.58%
Corporate bonds 9.46% 9.35%
CD 9.80%
Source: SBIMF Internal Analysis & Bloomberg
Past performance may or may not be sustained in future.
SBI Dynamic Bond Fund – Competitive Advantage - Instances
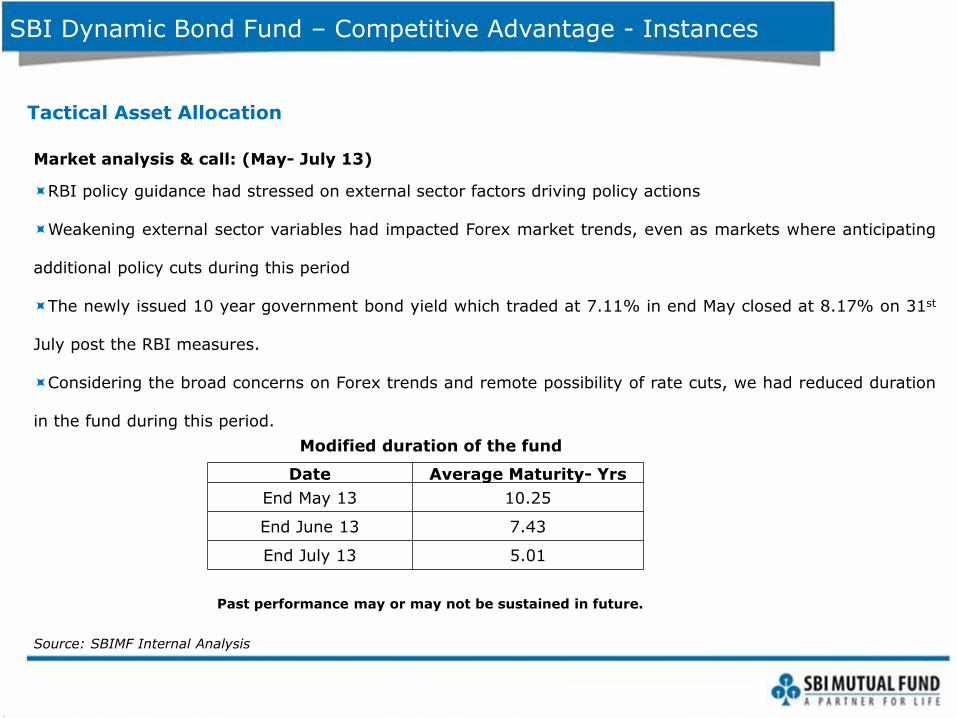
Tactical Asset Allocation
Market analysis & call: (May- July 13)
RBI policy guidance had stressed on external sector factors driving policy actions
Weakening external sector variables had impacted Forex market trends, even as markets where anticipating
additional policy cuts during this period
The newly issued 10 year government bond yield which traded at 7.11% in end May closed at 8.17% on 31st
July post the RBI measures.
Considering the broad concerns on Forex trends and remote possibility of rate cuts, we had reduced duration
in the fund during this period.
Modified duration of the fund
Date Average Maturity- Yrs
End May 13 10.25
End June 13 7.43
End July 13 5.01
Source: SBIMF Internal Analysis
Past performance may or may not be sustained in future.

SDBF aims to buildmid and long termexpectations onrate trajectory
SDBF aims to actively react to tactical opportunities in the market
SBI Dynamic Bond Fund – Current Strategy
• Lower GDP growth• Monsoon Deficit• Chinese Yuan
devaluation• Fed Rate Hike
uncertainty
• Impact of Forex flows• Effects of Geo-
political Events
We have added duration in the fund
post the policy review, and increased
allocation to the 5 – 10 year
government bonds. With the RBI
expected to conduct market
purchases of government bonds, we
expect this segment to deliver
reasonable risk adjusted returns.
The maturity of the fund as on 30th
April is 9.55 years with around 30%
allocation to Tax Free Bonds.

Rates Snapshot for April 2016
• Bond yields depicted a marginal downside bias in April.10 year yields fell by another 15bps during the month.
• Money-market rates, too, eased considerably in April as some of the year-end liquidity tightness reversed and RBI redirected itself
to ease liquidity in the system.
• Crude oil prices rose 10% during the month, third consecutive month of upward movement.
• Rupee depicted stability during the month, broadly hovering between 66-67 range.
Source: Bloomberg, PPAC, SBIMF Research; NB: **Crude oil price is average $/barrel for the month, rest of the data
are % month end; *Corporate bond rate is for AAA rated bonds ,*** Refers to PSU Banks CD rate; # INR and Oil price
changes are % change YTD
Feb-16 Mar-16 Apr-16Change YTD (in
bps)
1 Yr T-Bill 7.25 7.06 6.88 -35
3M T-Bill 7.26 7.13 6.81 -34
10 year GSec 7.63 7.47 7.44 -33
3M CD*** 8.49 8.28 7.40 20
12M CD*** 8.28 8.00 7.48 -23
3 Yr Corp Bond* 8.53 8.31 8.04 -30
5 Yr Corp Bond* 8.59 8.35 8.18 -21
10 Yr Corp Bond* 8.67 8.41 8.26 -16
1 Yr IRS 6.85 6.70 6.67 -40
5 Yr IRS 6.70 6.61 6.70 -26
Overnight MIBOR Rate 6.96 7.38 6.57 -46
INR/USD 68.4 66.2 66.3 0.3#
Crude Oil Indian Basket** 30.5 36.4 39.9 11.8#

RBI has cut Repo rate by 25bps in April and cumulatively delivered
150bps of rate cut in this easing cycle thus far.
The G-sec 10 year yield moved within a narrow range of 7.40%-
7.50% during the month of April displaying the market sentiments
which have been bearish even after the 25 bps cut by RBI at the
beginning of the month and March CPI inflation being more benign
than expected.
Supply of DISCOM bonds and likelihood of increased state bonds
supply continues to prevent any meaningful rally. The near term
direction of yields would largely be determined by the OMO schedule
as also the domestic banking system’s credit.
In the money market, liquidity conditions eased at the margin on
account of reversal of year end tightness. Government’s cash
balances came back into the system and RBI conducted Rs. 300bn of
OMO to diffuse liquidity into the system. This was partially offset by
higher currency withdrawals and seasonal increase in CRR
requirement. Easing of liquidity has helped to considerably ease the
short-term rates.
Given the current demand-supply dynamics of bonds and our view on
evolution of inflation trajectory, we have reduced duration in bond
funds by switching to front-end of the curve (5-7 year segment) that
looks attractive from a valuation perspective.
Market Outlook
Source: RBI, Bloomberg, SBIFM Research
6.00
6.50
7.00
7.50
8.00
8.50
9.00
9.50
Jan
-11
May
-11
Sep
-11
Jan
-12
May
-12
Sep
-12
Jan
-13
May
-13
Sep
-13
Jan
-14
May
-14
Sep
-14
Jan
-15
May
-15
Sep
-15
Jan
-16
10 year GSec yield (mth end, %) Repo Rate (mth end, %)
Average spread between G-sec and Repo in last 5 years: 75bps

Investment Objective &
Internal Guidelines
Sector Yield Curve
Credit
Duration
TradingQuantitative
Analysis
Portfolio Construction
Top Down Analysis
Bottom Up Security Selection
Risk Management
Investment Process
The portfolio construction process is a combination of top-down analysis and bottom up security selection done within the framework of internal risk control system
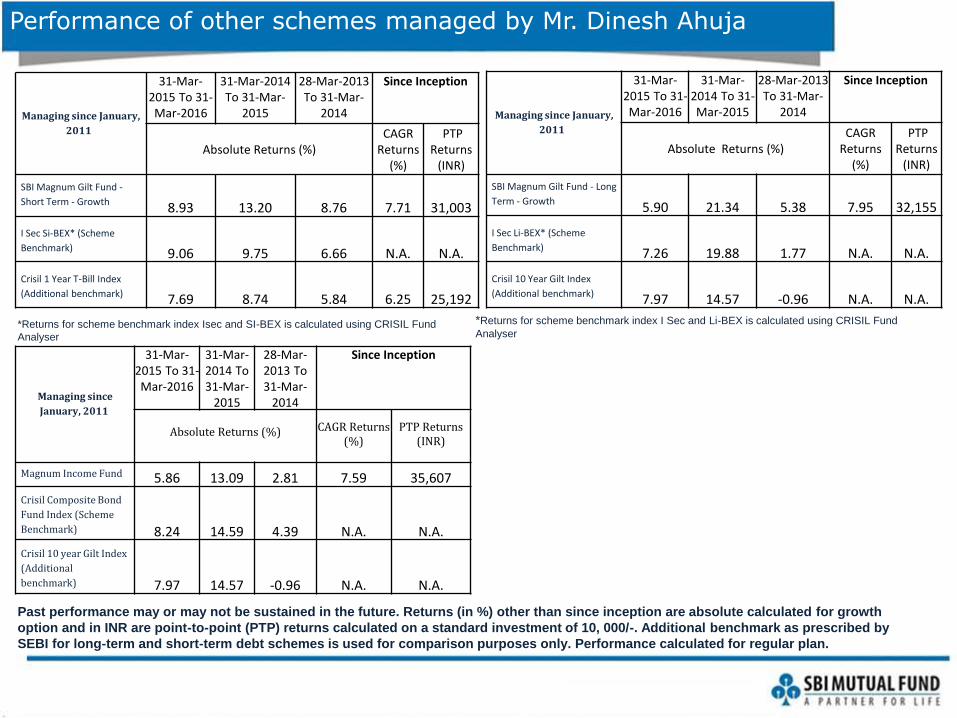
Performance of other schemes managed by Mr. Dinesh Ahuja
Managing since
January, 2011
31-Mar-2015 To 31-Mar-2016
31-Mar-2014 To 31-Mar-
2015
28-Mar-2013 To 31-Mar-
2014
Since Inception
Absolute Returns (%) CAGR Returns (%)
PTP Returns (INR)
Magnum Income Fund 5.86 13.09 2.81 7.59 35,607
Crisil Composite Bond
Fund Index (Scheme
Benchmark) 8.24 14.59 4.39 N.A. N.A.
Crisil 10 year Gilt Index
(Additional
benchmark) 7.97 14.57 -0.96 N.A. N.A.
Past performance may or may not be sustained in the future. Returns (in %) other than since inception are absolute calculated for growth
option and in INR are point-to-point (PTP) returns calculated on a standard investment of 10, 000/-. Additional benchmark as prescribed by
SEBI for long-term and short-term debt schemes is used for comparison purposes only. Performance calculated for regular plan.
*Returns for scheme benchmark index I Sec and Li-BEX is calculated using CRISIL Fund
Analyser*Returns for scheme benchmark index Isec and SI-BEX is calculated using CRISIL Fund
Analyser
Managing since January,
2011
31-Mar-2015 To 31-Mar-2016
31-Mar-2014 To 31-Mar-
2015
28-Mar-2013To 31-Mar-
2014
Since Inception
Absolute Returns (%)CAGR
Returns (%)
PTP Returns
(INR)
SBI Magnum Gilt Fund -
Short Term - Growth 8.93 13.20 8.76 7.71 31,003
I Sec Si-BEX* (Scheme
Benchmark) 9.06 9.75 6.66 N.A. N.A.
Crisil 1 Year T-Bill Index
(Additional benchmark) 7.69 8.74 5.84 6.25 25,192
Managing since January,
2011
31-Mar-2015 To 31-Mar-2016
31-Mar-2014 To 31-Mar-2015
28-Mar-2013To 31-Mar-
2014
Since Inception
Absolute Returns (%)CAGR
Returns (%)
PTP Returns
(INR)
SBI Magnum Gilt Fund - Long
Term - Growth5.90 21.34 5.38 7.95 32,155
I Sec Li-BEX* (Scheme
Benchmark) 7.26 19.88 1.77 N.A. N.A.
Crisil 10 Year Gilt Index
(Additional benchmark) 7.97 14.57 -0.96 N.A. N.A.
• Mr. Navneet Munot - CIO
Navneet Munot joined SBI Funds Management as Chief Investment Officer in December 2008. He
brings with him over 15 years of rich experience in Financial Markets. In his previous assignment,
he was the Executive Director & Head - multi - strategy boutique with Morgan Stanley Investment
Management. Prior to joining Morgan Stanley Investment Management, he worked as the CIO -
Fixed Income and Hybrid Funds at Birla Sun Life Asset Management Company Ltd. Navneet had
been associated with the financial services business of the group for over 13 years and worked in
various areas such as fixed income, equities and foreign exchange. Navneet is a postgraduate in
Accountancy and Business Statistics and a qualified Chartered Accountant. He is also a Charter
holder of the CFA Institute USA and CAIA Institute USA. He is also an FRM Charter holder of Global
Association of Risk Professionals (GARP).
• Mr. Dinesh Ahuja – Portfolio Manager
Dinesh Ahuja joined SBIFM in 2010. Prior to joining SBIFM, Dinesh was a portfolio manager at L&T
Asset Management and Reliance Group for four years. Dinesh started his career in 1998 as a fixed
income dealer on the sell side. Thereafter he worked in leading broking outfits for eight years
before moving on the buy side in 2006. Dinesh is a Commerce graduate and holds his Masters
degree in Finance from Mumbai University.
Biographies

Disclaimer
Mutual Fund investments are subject to market risks, read all scheme related documents carefully.
This presentation is for information purposes only and is not an offer to sell or a solicitation to buy any
mutual fund units/securities. These views alone are not sufficient and should not be used for the
development or implementation of an investment strategy. It should not be construed as investment advice
to any party. All opinions and estimates included here constitute our view as of this date and are subject to
change without notice. Neither SBI Funds Management Private Limited, nor any person connected with it,
accepts any liability arising from the use of this information. The recipient of this material should rely on
their investigations and take their own professional advice
SBI Funds Management Private Limited
(A joint venture between SBI and
AMUNDI)
Registered Office:
9th Floor, Crescenzo, C-38 & 39, ‘G’
Block,
Bandra Kurla Complex, Bandra (E),
Mumbai - 400 051
Board line: +91 22 61793000
Fax: +91 22 67425687
Call: 1800 425 5425
SMS: “SBIMF” to 56161
Email: [email protected]
Visit us @ www.facebook.com/SBIMF
www.sbimf.comWebsite
Visit us @ www.youtube.com/user/sbimutualfund