sbi etf it - mutual fund india
TRANSCRIPT
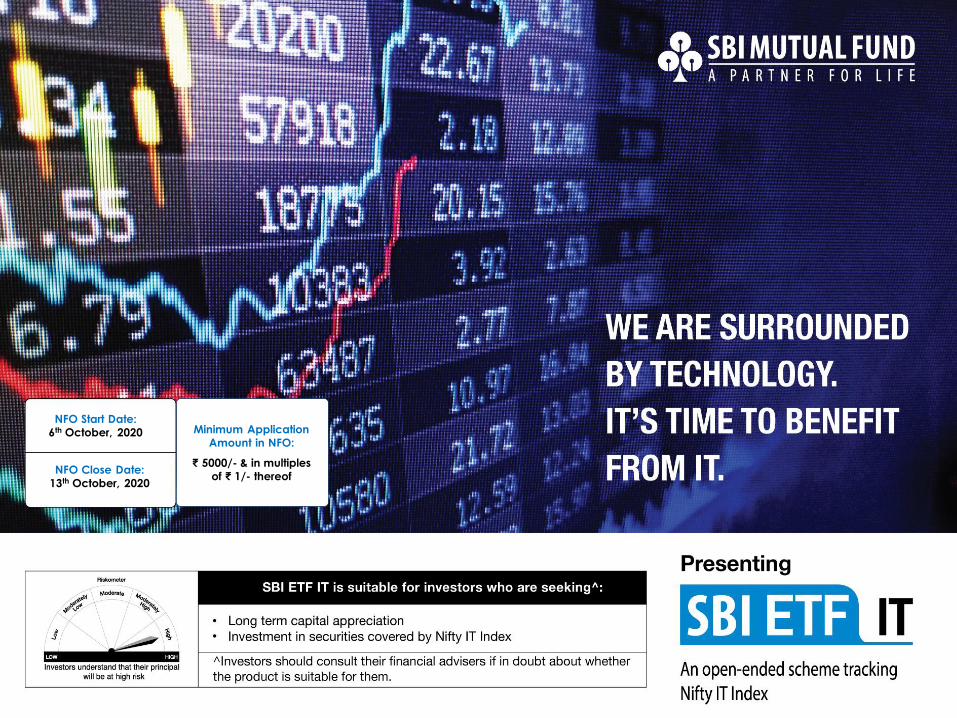
NFO Start Date:
6th October, 2020
NFO Close Date:
13th October, 2020
Exchange Traded Funds and their advantages
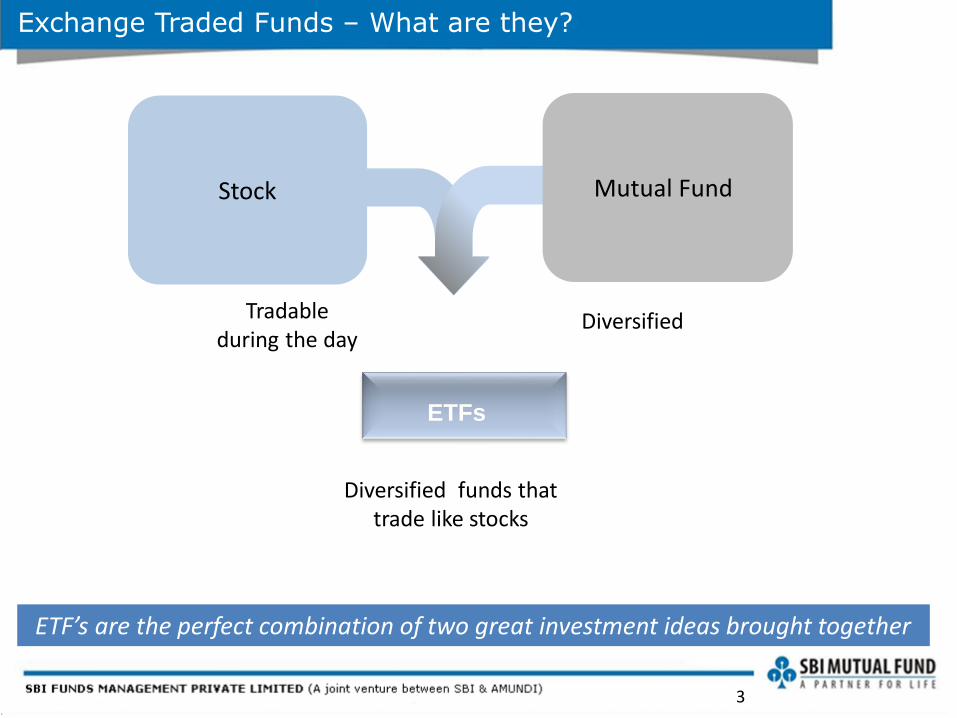
Exchange Traded Funds – What are they?
ETF’s are the perfect combination of two great investment ideas brought together
ETFs
DiversifiedTradable during the day
Diversified funds that trade like stocks
Mutual FundStock
3
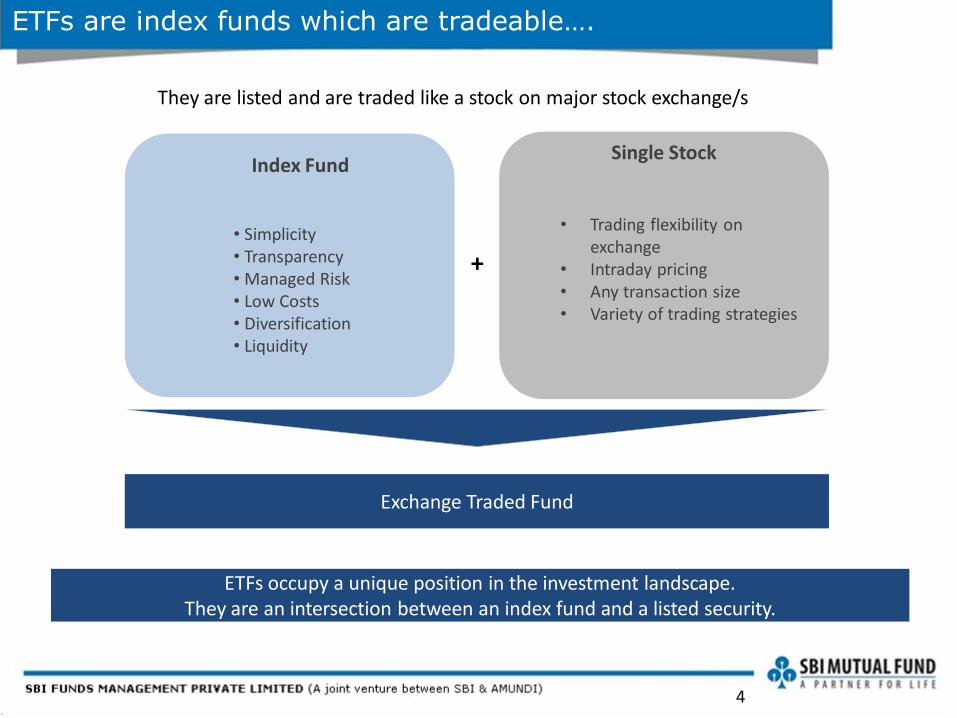
ETFs are index funds which are tradeable….
They are listed and are traded like a stock on major stock exchange/s
Single Stock
• Trading flexibility on exchange
• Intraday pricing• Any transaction size• Variety of trading strategies
Index Fund
• Simplicity• Transparency• Managed Risk • Low Costs• Diversification• Liquidity
Exchange Traded Fund
+
ETFs occupy a unique position in the investment landscape.They are an intersection between an index fund and a listed security.
4
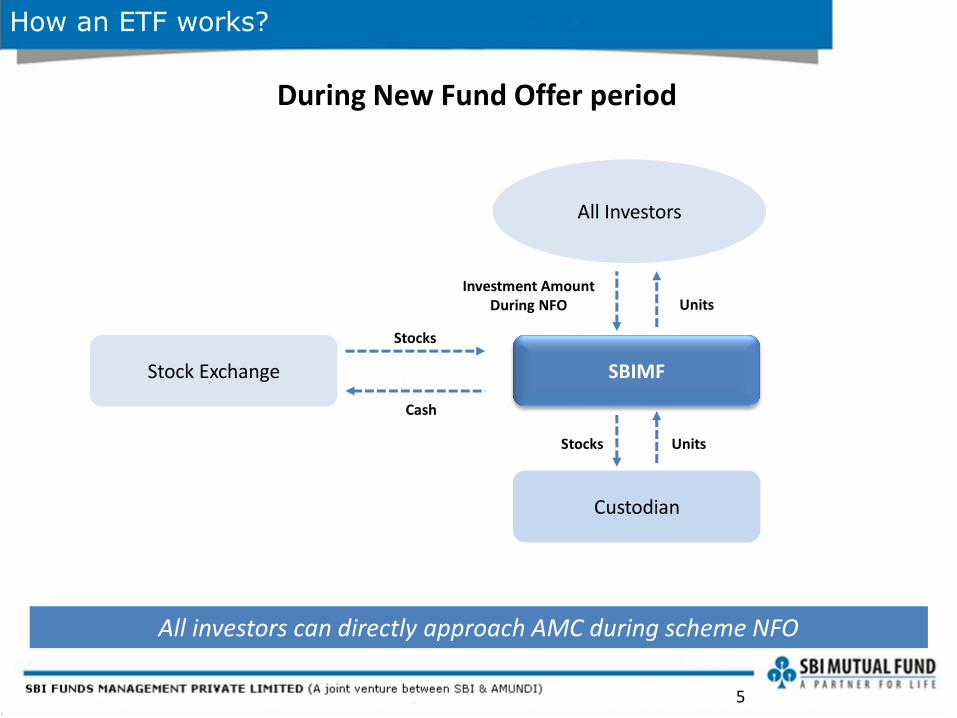
During New Fund Offer period
How an ETF works?
All investors can directly approach AMC during scheme NFO
SBIMFStock Exchange
Custodian
All Investors
Stocks
Cash
Investment Amount During NFO Units
UnitsStocks
5
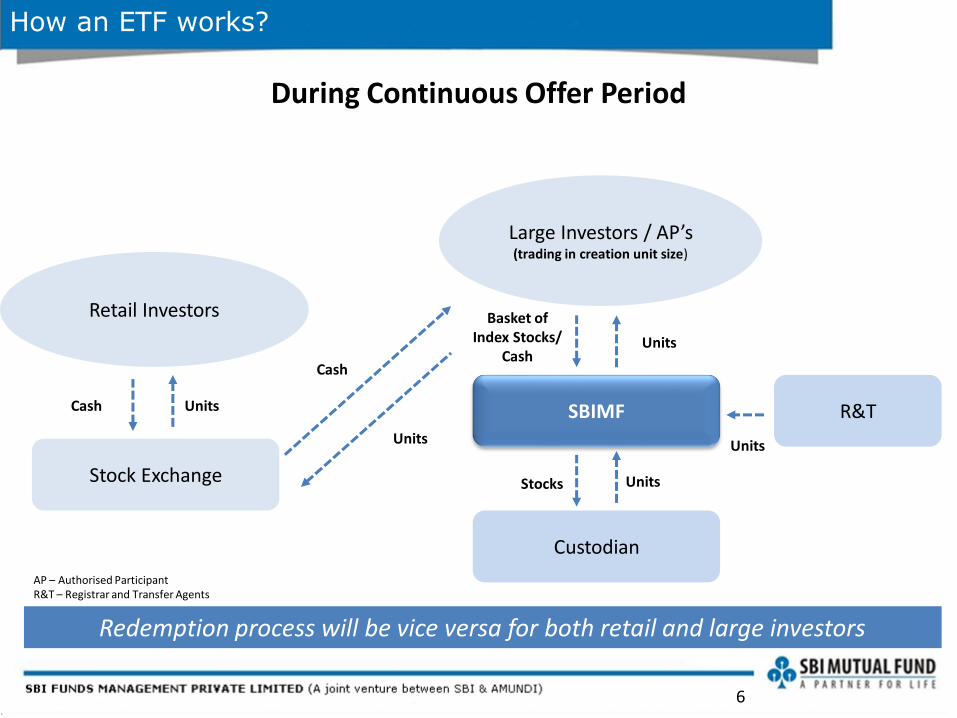
During Continuous Offer Period
How an ETF works?
Redemption process will be vice versa for both retail and large investors
Large Investors / AP’s (trading in creation unit size)
Retail Investors
SBIMF
Custodian
Units
Units
UnitsStocksStock Exchange
Basket of Index Stocks/
CashCash
UnitsCash
Units
R&T
AP – Authorised ParticipantR&T – Registrar and Transfer Agents
6
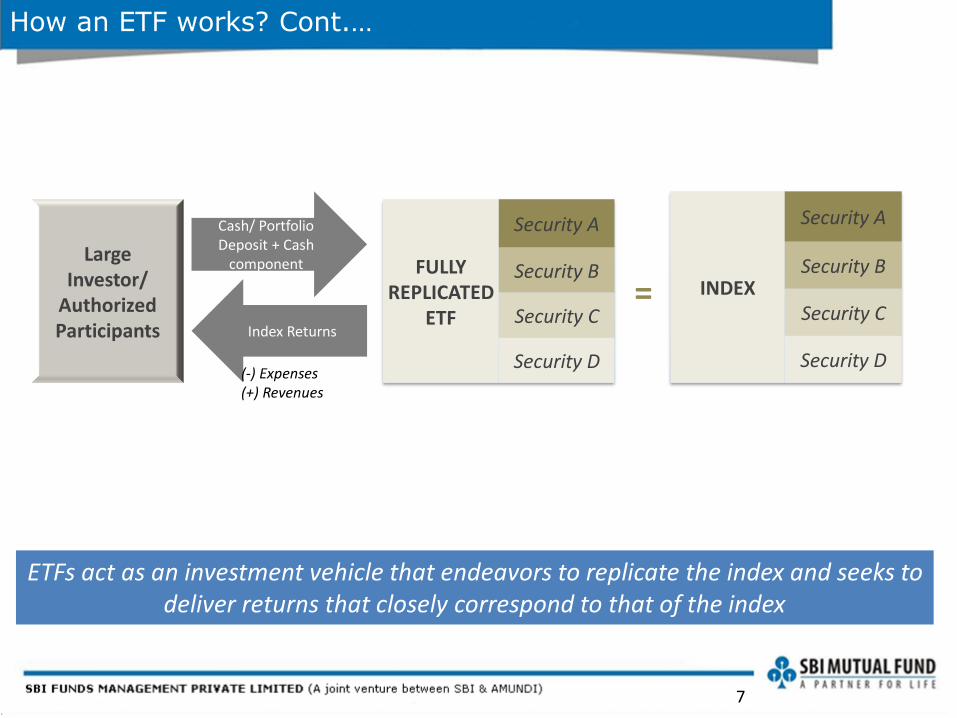
Large Investor/
Authorized Participants
FULLY REPLICATED
ETF
Security A
Security B
Security C
Security D
INDEX
Security A
Security B
Security C
Security D
=
Cash/ Portfolio Deposit + Cash
component
Index Returns
(-) Expenses (+) Revenues
How an ETF works? Cont.…
ETFs act as an investment vehicle that endeavors to replicate the index and seeks to deliver returns that closely correspond to that of the index
7
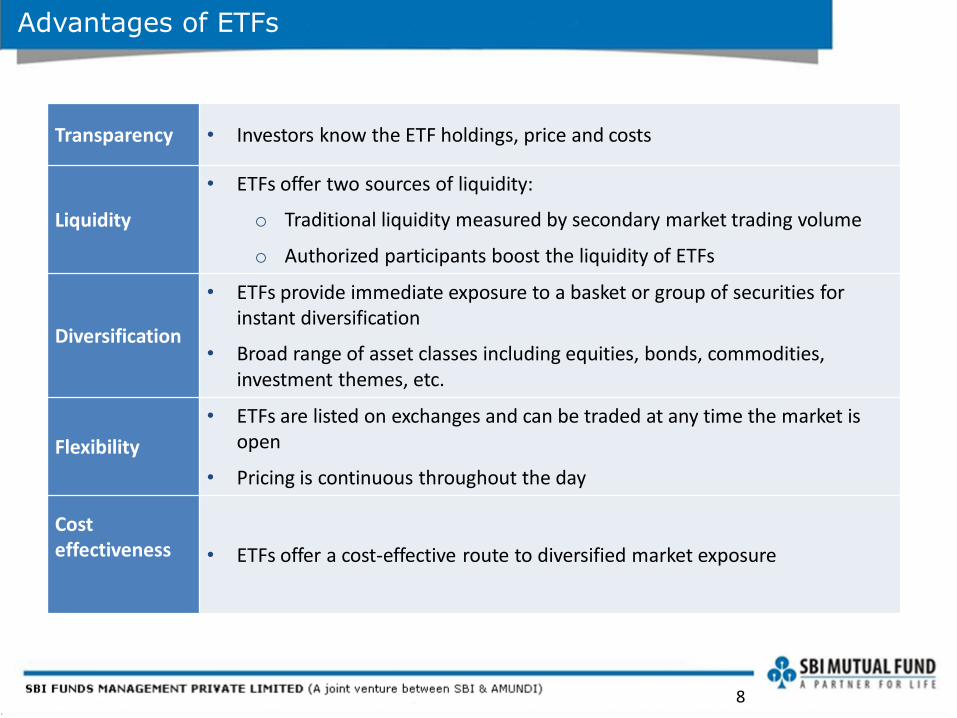
Advantages of ETFs
Transparency • Investors know the ETF holdings, price and costs
Liquidity
• ETFs offer two sources of liquidity:
o Traditional liquidity measured by secondary market trading volume
o Authorized participants boost the liquidity of ETFs
Diversification
• ETFs provide immediate exposure to a basket or group of securities for instant diversification
• Broad range of asset classes including equities, bonds, commodities, investment themes, etc.
Flexibility
• ETFs are listed on exchanges and can be traded at any time the market is open
• Pricing is continuous throughout the day
Cost effectiveness • ETFs offer a cost-effective route to diversified market exposure
8
Why ETFs?
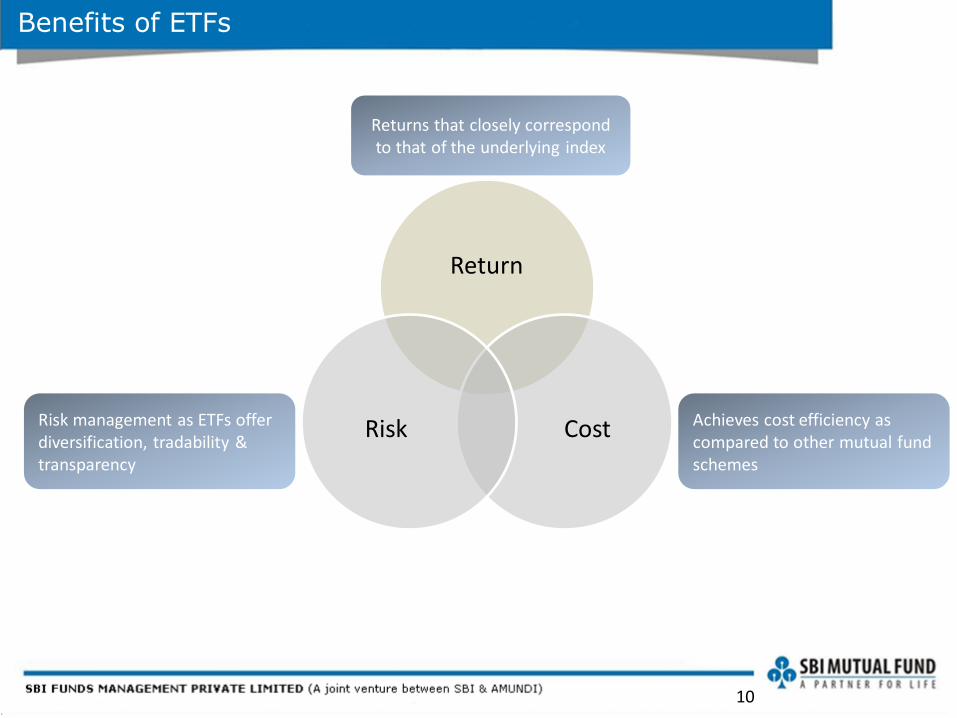
Benefits of ETFs
Return
CostRisk
Returns that closely correspond to that of the underlying index
Risk management as ETFs offer diversification, tradability & transparency
Achieves cost efficiency as compared to other mutual fund schemes
10
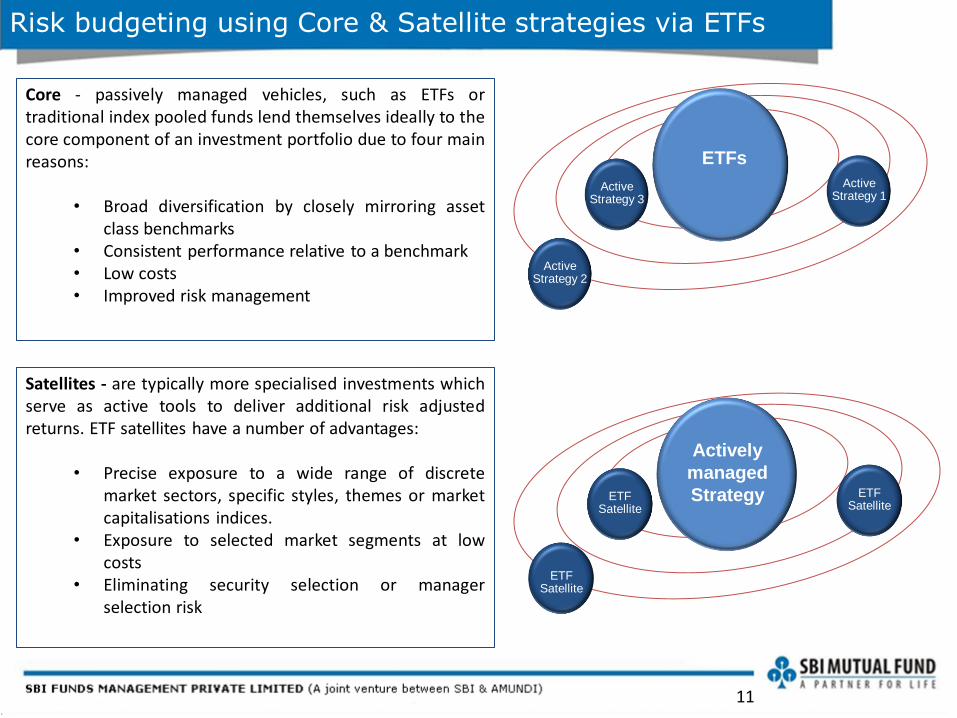
Risk budgeting using Core & Satellite strategies via ETFs
Core - passively managed vehicles, such as ETFs ortraditional index pooled funds lend themselves ideally to thecore component of an investment portfolio due to four mainreasons:
• Broad diversification by closely mirroring assetclass benchmarks
• Consistent performance relative to a benchmark• Low costs• Improved risk management
Active Strategy 2
Active Strategy 3
Active Strategy 1
ETFs
ETF Satellite
ETF Satellite
ETFSatellite
Actively
managed
Strategy
Satellites - are typically more specialised investments whichserve as active tools to deliver additional risk adjustedreturns. ETF satellites have a number of advantages:
• Precise exposure to a wide range of discretemarket sectors, specific styles, themes or marketcapitalisations indices.
• Exposure to selected market segments at lowcosts
• Eliminating security selection or managerselection risk
11
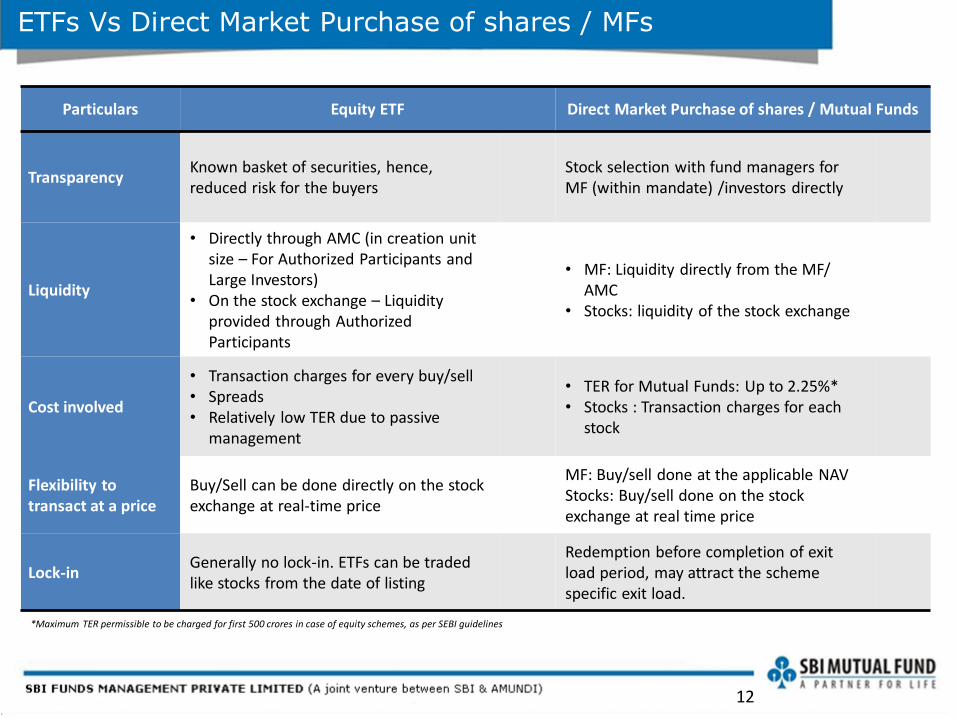
ETFs Vs Direct Market Purchase of shares / MFs
12
Particulars Equity ETF Direct Market Purchase of shares / Mutual Funds
Transparency Known basket of securities, hence, reduced risk for the buyers
Stock selection with fund managers for MF (within mandate) /investors directly
Liquidity
• Directly through AMC (in creation unit size – For Authorized Participants and Large Investors)
• On the stock exchange – Liquidity provided through Authorized Participants
• MF: Liquidity directly from the MF/ AMC
• Stocks: liquidity of the stock exchange
Cost involved
• Transaction charges for every buy/sell• Spreads• Relatively low TER due to passive
management
• TER for Mutual Funds: Up to 2.25%*• Stocks : Transaction charges for each
stock
Flexibility to transact at a price
Buy/Sell can be done directly on the stock exchange at real-time price
MF: Buy/sell done at the applicable NAVStocks: Buy/sell done on the stock exchange at real time price
Lock-inGenerally no lock-in. ETFs can be traded like stocks from the date of listing
Redemption before completion of exit load period, may attract the scheme specific exit load.
*Maximum TER permissible to be charged for first 500 crores in case of equity schemes, as per SEBI guidelines
Sector Review:Information Technology
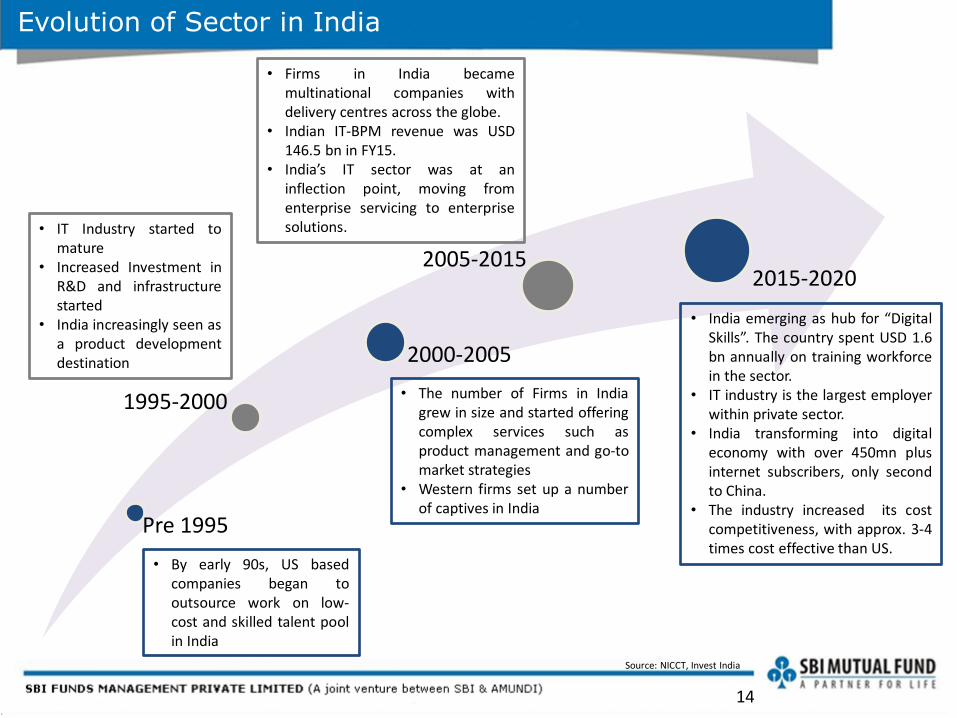
Evolution of Sector in India
Pre 1995
1995-2000
2000-2005
2005-20152015-2020
• By early 90s, US basedcompanies began tooutsource work on low-cost and skilled talent poolin India
• IT Industry started tomature
• Increased Investment inR&D and infrastructurestarted
• India increasingly seen asa product developmentdestination
• The number of Firms in Indiagrew in size and started offeringcomplex services such asproduct management and go-tomarket strategies
• Western firms set up a numberof captives in India
• Firms in India becamemultinational companies withdelivery centres across the globe.
• Indian IT-BPM revenue was USD146.5 bn in FY15.
• India’s IT sector was at aninflection point, moving fromenterprise servicing to enterprisesolutions.
• India emerging as hub for “DigitalSkills”. The country spent USD 1.6bn annually on training workforcein the sector.
• IT industry is the largest employerwithin private sector.
• India transforming into digitaleconomy with over 450mn plusinternet subscribers, only secondto China.
• The industry increased its costcompetitiveness, with approx. 3-4times cost effective than US.
Source: NICCT, Invest India
14
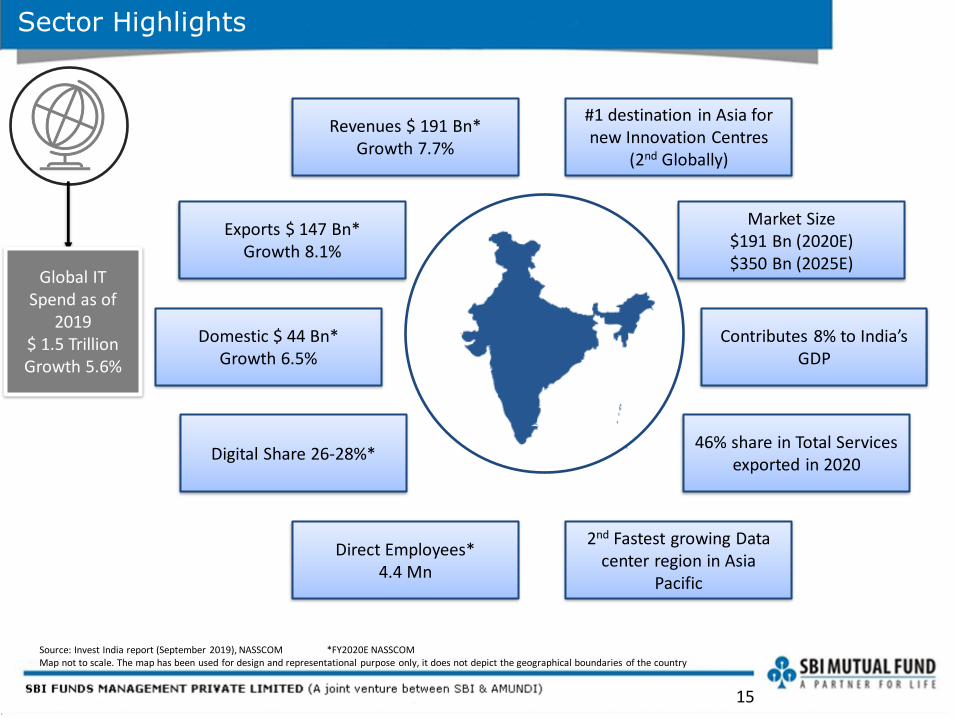
Sector Highlights
Revenues $ 191 Bn*Growth 7.7%
Exports $ 147 Bn*Growth 8.1%
Domestic $ 44 Bn*Growth 6.5%
Digital Share 26-28%*
Direct Employees* 4.4 Mn
Market Size$191 Bn (2020E)$350 Bn (2025E)
Contributes 8% to India’s GDP
46% share in Total Services exported in 2020
#1 destination in Asia for new Innovation Centres
(2nd Globally)
2nd Fastest growing Data center region in Asia
Pacific
Source: Invest India report (September 2019), NASSCOM *FY2020E NASSCOMMap not to scale. The map has been used for design and representational purpose only, it does not depict the geographical boundaries of the country
Global IT Spend as of
2019 $ 1.5 TrillionGrowth 5.6%
15
54%
23% 23%
47%
22%
8%
7%
3%3%
10%CADM
IMS
Testing
Support & Training
System Integration
IT Consulting
Others
43%
32%
25%
39%
22%
22%
13%2%
1%1%
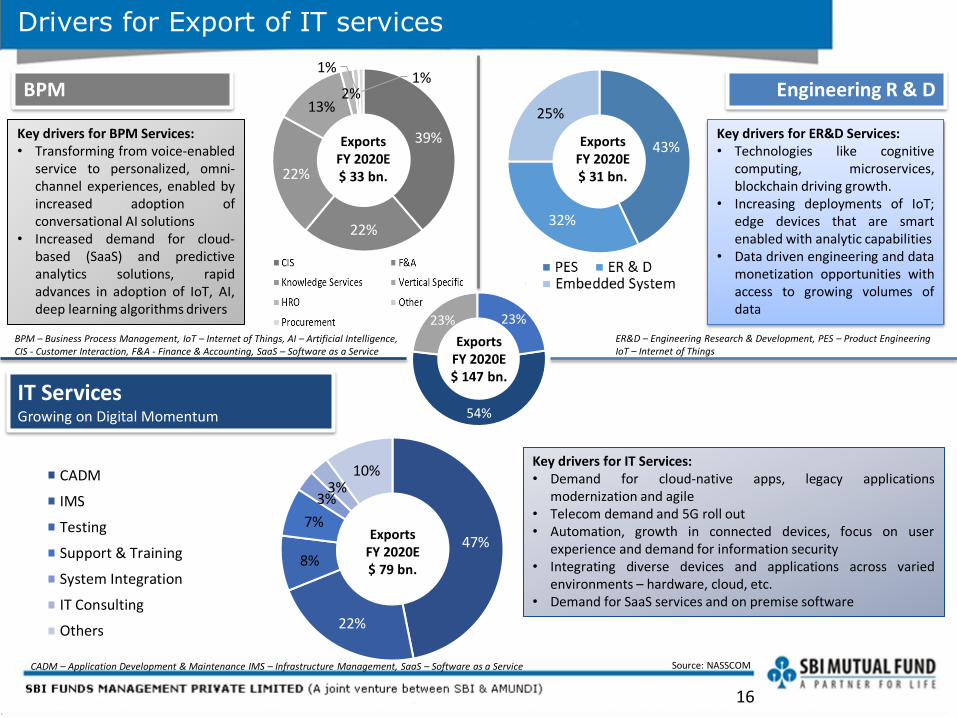
Drivers for Export of IT services
Source: NASSCOM
16
ExportsFY 2020E $ 147 bn.
IT ServicesGrowing on Digital Momentum
Key drivers for IT Services:• Demand for cloud-native apps, legacy applications
modernization and agile• Telecom demand and 5G roll out• Automation, growth in connected devices, focus on user
experience and demand for information security• Integrating diverse devices and applications across varied
environments – hardware, cloud, etc.• Demand for SaaS services and on premise software
ExportsFY 2020E $ 79 bn.
BPM
ExportsFY 2020E $ 33 bn.
Key drivers for BPM Services:• Transforming from voice-enabled
service to personalized, omni-channel experiences, enabled byincreased adoption ofconversational AI solutions
• Increased demand for cloud-based (SaaS) and predictiveanalytics solutions, rapidadvances in adoption of IoT, AI,deep learning algorithms drivers
Engineering R & D
BPM – Business Process Management, IoT – Internet of Things, AI – Artificial Intelligence,CIS - Customer Interaction, F&A - Finance & Accounting, SaaS – Software as a Service
ExportsFY 2020E $ 31 bn.
Key drivers for ER&D Services:• Technologies like cognitive
computing, microservices,blockchain driving growth.
• Increasing deployments of IoT;edge devices that are smartenabled with analytic capabilities
• Data driven engineering and datamonetization opportunities withaccess to growing volumes ofdata
ExportsFY 2020E $ 31 bn.
ER&D – Engineering Research & Development, PES – Product EngineeringIoT – Internet of Things
CADM – Application Development & Maintenance IMS – Infrastructure Management, SaaS – Software as a Service
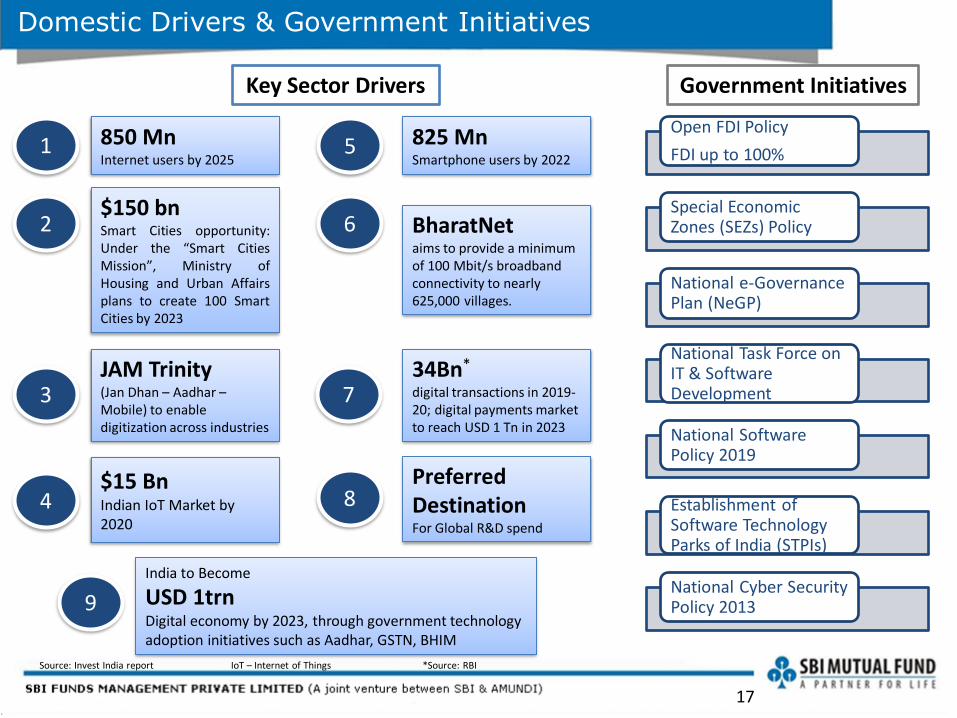
Domestic Drivers & Government Initiatives
Source: Invest India report IoT – Internet of Things *Source: RBI
1 850 MnInternet users by 2025
5 825 MnSmartphone users by 2022
2$150 bnSmart Cities opportunity:Under the “Smart CitiesMission”, Ministry ofHousing and Urban Affairsplans to create 100 SmartCities by 2023
4$15 BnIndian IoT Market by 2020
6 BharatNetaims to provide a minimum of 100 Mbit/s broadband connectivity to nearly 625,000 villages.
3JAM Trinity(Jan Dhan – Aadhar –Mobile) to enable digitization across industries
734Bn*
digital transactions in 2019-20; digital payments market to reach USD 1 Tn in 2023
8
India to Become
USD 1trnDigital economy by 2023, through government technology adoption initiatives such as Aadhar, GSTN, BHIM
9
Preferred DestinationFor Global R&D spend
Key Sector Drivers
Open FDI Policy
FDI up to 100%
Special Economic Zones (SEZs) Policy
National e-Governance Plan (NeGP)
National Task Force on IT & Software Development
National Software Policy 2019
Establishment of Software Technology Parks of India (STPIs)
National Cyber Security Policy 2013
Government Initiatives
17
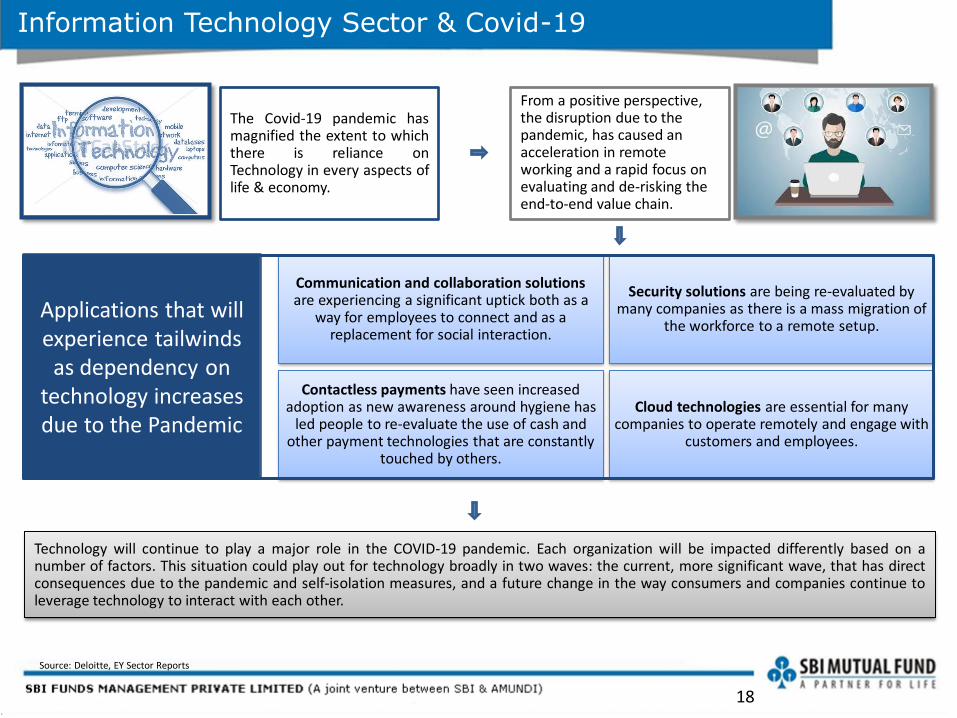
Information Technology Sector & Covid-19
Technology will continue to play a major role in the COVID-19 pandemic. Each organization will be impacted differently based on anumber of factors. This situation could play out for technology broadly in two waves: the current, more significant wave, that has directconsequences due to the pandemic and self-isolation measures, and a future change in the way consumers and companies continue toleverage technology to interact with each other.
The Covid-19 pandemic hasmagnified the extent to whichthere is reliance onTechnology in every aspects oflife & economy.
From a positive perspective, the disruption due to the pandemic, has caused an acceleration in remote working and a rapid focus on evaluating and de-risking the end-to-end value chain.
Communication and collaboration solutionsare experiencing a significant uptick both as a
way for employees to connect and as a replacement for social interaction.
Security solutions are being re-evaluated by many companies as there is a mass migration of
the workforce to a remote setup.
Contactless payments have seen increased adoption as new awareness around hygiene has
led people to re-evaluate the use of cash and other payment technologies that are constantly
touched by others.
Cloud technologies are essential for many companies to operate remotely and engage with
customers and employees.
Applications that will experience tailwinds
as dependency on technology increases due to the Pandemic
18
Source: Deloitte, EY Sector Reports

Key Themes driving the Sector
• Companies across the globe are investing in creation of mobile based platformsfor interaction with their customers, employees, distributors and suppliers.
• This means development of mobile apps for sales, implementation of apps thatenable employees to work remotely and apps for interacting with distributorsand suppliers.
• Websites and desktop applications are not sufficient anymore for engagement.
• Steady decline in prices of smartphones and crash in price of broadband isbringing millions of new Indians into the digital platforms.
• New internet-only companies are disintermediating traditional business modelsand creating value for shareholders.
• Industries like retail, real estate, education, finance and media are someexamples.
• Dramatic fall in cost of hardware and advancement in softwaretechniques over the last decade has enabled companies to developArtificial Intelligence models that can beat humans in several white-collared roles.
• Companies that supply chips and software platform for developmentof these models have a long runway for growth.
• Cloud platforms are the technology equivalent of dairy farms. Dairyfarms own cows, feed them and supply milk to consumers on a perlitre basis. Similarly, Cloud Platforms own and maintain data serversand applications.
• Their corporate customers use these assets and pay them on a per usebasis. It helps companies cut their cost.
Key Themes to drive the Technology Industry
Cloud Platforms
Enterprise Mobility
Increase in Internet
Adoption
Artificial Intelligence
19
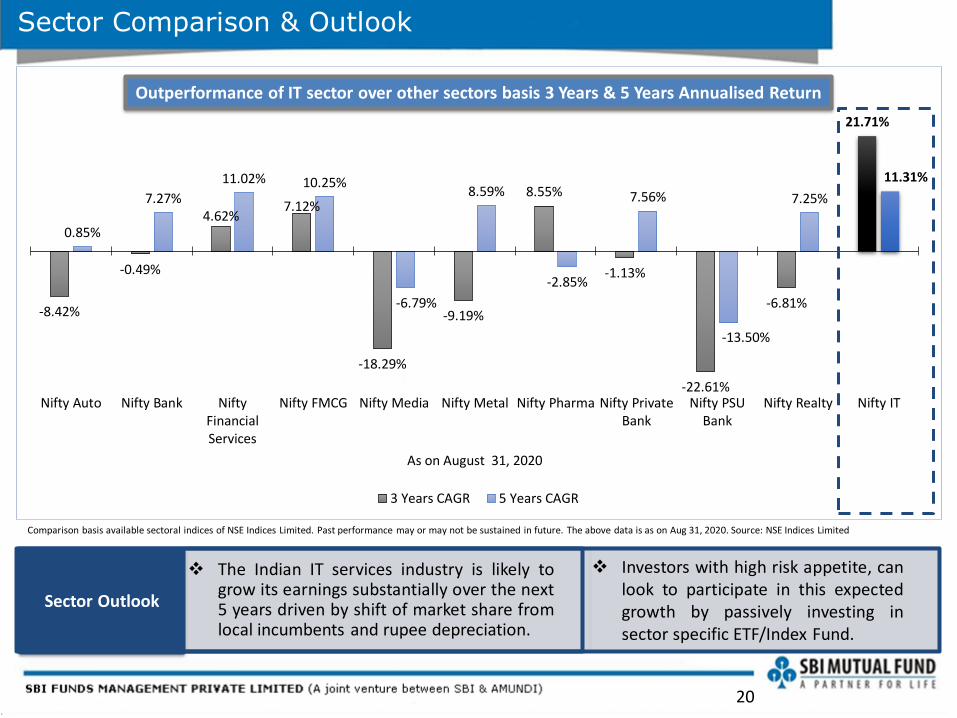
Sector Comparison & Outlook
❖ The Indian IT services industry is likely togrow its earnings substantially over the next5 years driven by shift of market share fromlocal incumbents and rupee depreciation.
Sector Outlook
-8.42%
-0.49%
4.62%7.12%
-18.29%
-9.19%
8.55%
-1.13%
-22.61%
-6.81%
21.71%
0.85%
7.27%
11.02% 10.25%
-6.79%
8.59%
-2.85%
7.56%
-13.50%
7.25%
11.31%
Nifty Auto Nifty Bank NiftyFinancialServices
Nifty FMCG Nifty Media Nifty Metal Nifty Pharma Nifty PrivateBank
Nifty PSUBank
Nifty Realty Nifty IT
As on August 31, 2020
3 Years CAGR 5 Years CAGR
Comparison basis available sectoral indices of NSE Indices Limited. Past performance may or may not be sustained in future. The above data is as on Aug 31, 2020. Source: NSE Indices Limited
20
Outperformance of IT sector over other sectors basis 3 Years & 5 Years Annualised Return
❖ Investors with high risk appetite, canlook to participate in this expectedgrowth by passively investing insector specific ETF/Index Fund.
NFO Start Date:
6th October, 2020
NFO Close Date:
13th October, 2020
Minimum Application
Amount in NFO:
₹ 5000/- & in multiples
of ₹ 1/- thereof

SBI ETF IT – About the Scheme
Investment Objective of the scheme: The investment objective of the scheme is to provide returns thatclosely correspond to the total returns of the securities as represented by the underlying index, subjectto tracking error.However there is no guarantee or assurance that the investment objective of the scheme will beachieved.
Asset Allocation
*Money market instruments include commercial papers, commercial bills, treasury bills, triparty repo, Government securities having an unexpiredmaturity up to one year, call or notice money, certificate of deposit, usance bills, and any other like instruments as specified by the Reserve Bank of Indiafrom time to timeThe cumulative gross exposure through Equities, Money Market Instruments including Triparty repo, units of Liquid mutual funds and derivatives (grossnotional exposure) shall not exceed 100%.The scheme will not make any investment in ADR/ GDR/ Foreign Securities/ Securitized Debt.The Scheme will not make any investment in debt instruments having structured obligations.The Scheme shall not invest in repo in corporate debt.The Scheme shall not engage in short sellingThe Scheme shall not invest in unrated debt instrument.The Scheme may engage in stock lending and borrowing up to 20% of net assets of the scheme
Benchmark: Nifty IT TRI
Instruments Indicative allocations
(% of total assets)
Risk Profile
Minimum Maximum High/Medium/Low
Securities covered by Nifty IT Index 95 100 Medium to High
Equity Derivatives 0 5 Medium to High
Money Market instruments* including Triparty repoand units of liquid mutual fund
0 5 Low
22
Nifty IT Index – About the underlying index
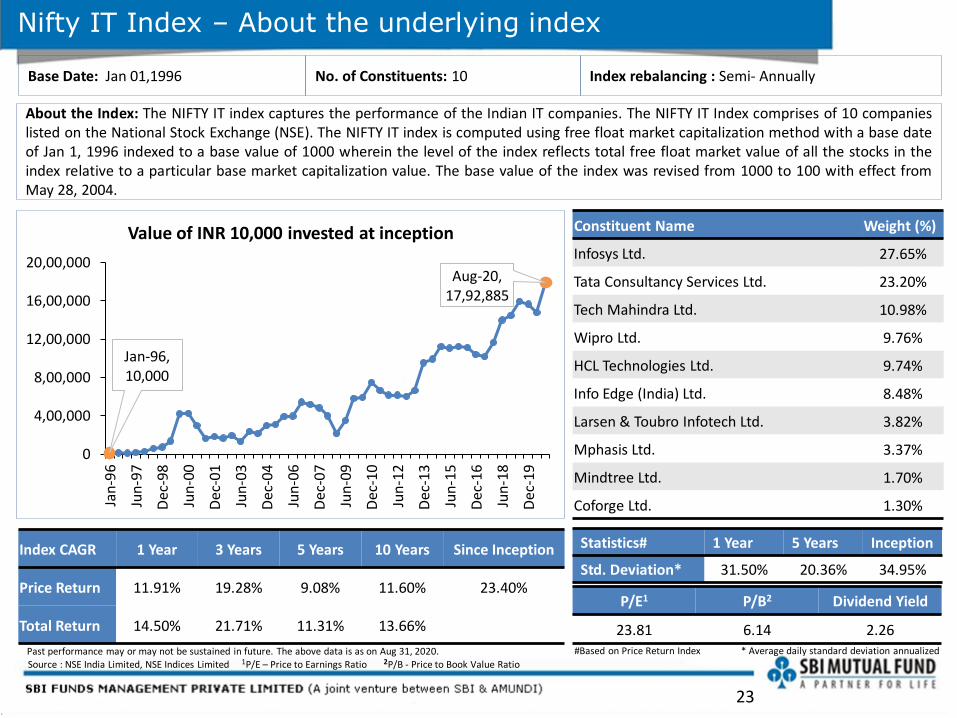
About the Index: The NIFTY IT index captures the performance of the Indian IT companies. The NIFTY IT Index comprises of 10 companieslisted on the National Stock Exchange (NSE). The NIFTY IT index is computed using free float market capitalization method with a base dateof Jan 1, 1996 indexed to a base value of 1000 wherein the level of the index reflects total free float market value of all the stocks in theindex relative to a particular base market capitalization value. The base value of the index was revised from 1000 to 100 with effect fromMay 28, 2004.
Base Date: Jan 01,1996 No. of Constituents: 10 Index rebalancing : Semi- Annually
Past performance may or may not be sustained in future. The above data is as on Aug 31, 2020.
Index CAGR 1 Year 3 Years 5 Years 10 Years Since Inception
Price Return 11.91% 19.28% 9.08% 11.60% 23.40%
Total Return 14.50% 21.71% 11.31% 13.66%
Constituent Name Weight (%)
Infosys Ltd. 27.65%
Tata Consultancy Services Ltd. 23.20%
Tech Mahindra Ltd. 10.98%
Wipro Ltd. 9.76%
HCL Technologies Ltd. 9.74%
Info Edge (India) Ltd. 8.48%
Larsen & Toubro Infotech Ltd. 3.82%
Mphasis Ltd. 3.37%
Mindtree Ltd. 1.70%
Coforge Ltd. 1.30%
P/E1 P/B2 Dividend Yield
23.81 6.14 2.26
Statistics# 1 Year 5 Years Inception
Std. Deviation* 31.50% 20.36% 34.95%
#Based on Price Return Index * Average daily standard deviation annualized
Source : NSE India Limited, NSE Indices Limited 1P/E – Price to Earnings Ratio 2P/B - Price to Book Value Ratio
Jan-96, 10,000
Aug-20, 17,92,885
0
4,00,000
8,00,000
12,00,000
16,00,000
20,00,000
Jan
-96
Jun
-97
Dec
-98
Jun
-00
Dec
-01
Jun
-03
Dec
-04
Jun
-06
Dec
-07
Jun
-09
Dec
-10
Jun
-12
Dec
-13
Jun
-15
Dec
-16
Jun
-18
Dec
-19
Value of INR 10,000 invested at inception
23
Nifty IT Index – About the underlying index
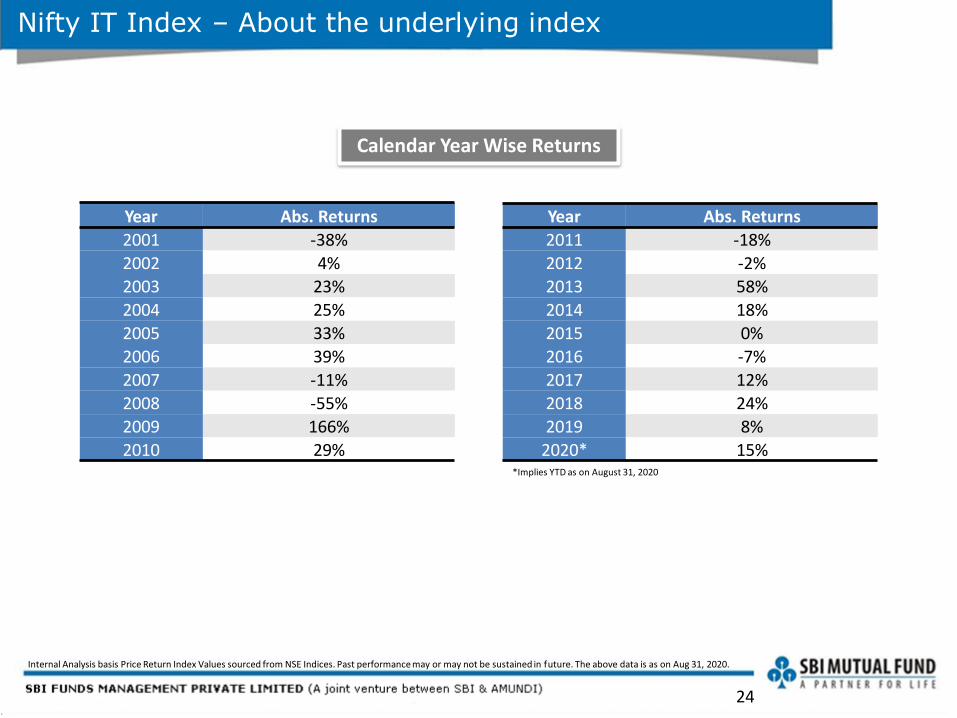
Internal Analysis basis Price Return Index Values sourced from NSE Indices. Past performance may or may not be sustained in future. The above data is as on Aug 31, 2020.
Calendar Year Wise Returns
Year Abs. Returns
2011 -18%
2012 -2%
2013 58%
2014 18%
2015 0%
2016 -7%
2017 12%
2018 24%
2019 8%
2020* 15%
Year Abs. Returns
2001 -38%
2002 4%
2003 23%
2004 25%
2005 33%
2006 39%
2007 -11%
2008 -55%
2009 166%
2010 29%*Implies YTD as on August 31, 2020
24
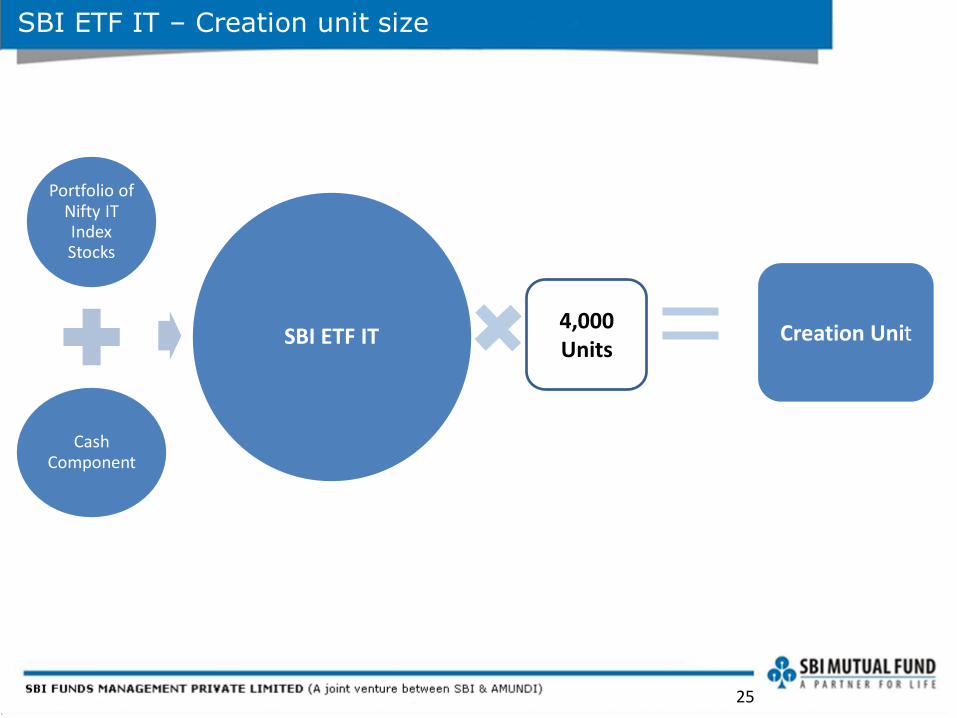
SBI ETF IT – Creation unit size
Portfolio ofNifty IT Index Stocks
CashComponent
SBI ETF IT Creation Unit4,000Units
25
Harsh Sethi, CA Fund Manager,(Over 18 years of industry experience)
Harsh Sethi joined SBIFM in 2007. He was assigned asan equity dealer in 2017. Previously, he was theProduct Manager responsible for product developmentand management. Prior to joining SBIFM, Harsh wasworking with J.P Mangal & Co. Harsh is a CommerceGraduate from Ajmer University. Harsh is also aChartered Accountant from Institute of CharteredAccountants of India and has completed his CompanySecretary from The Institute of Company Secretaries ofIndia.
Investment Management Team: Biographies
Navneet Munot, CFA Chief Investment Officer,(Over 25 years of industry experience)
Navneet joined SBIFM as Chief Investment Officer in2008. In his role Navneet is responsible for overseeinginvestments across asset classes worth over $160billion. His prior stint was with Morgan StanleyInvestment Management as Executive Director andhead- multi strategy boutique. Prior to that, Navneetwas the Chief Investment Officer - Fixed Income andHybrid Funds at Birla Sun Life Asset ManagementCompany Ltd. Navneet had and worked in various areassuch as fixed income, equities and foreign exchange.Navneet is the Chairman of Indian Association ofInvestment Professional (India society of CFA charterholders with over 2000 members). His articles onmatters related to financial markets have widely beenpublished. Navneet is Nominee Director on the Board ofSBI Pension Funds (P) Ltd. Navneet holds masters inaccountancy and business statistics from the Universityof Ajmer and is a Chartered Accountant from ICAI. He isa charter holder of the CFA Institute USA and CAIAInstitute USA. He is also a FRM from Global Associationof Risk professionals (GARP).
26
27
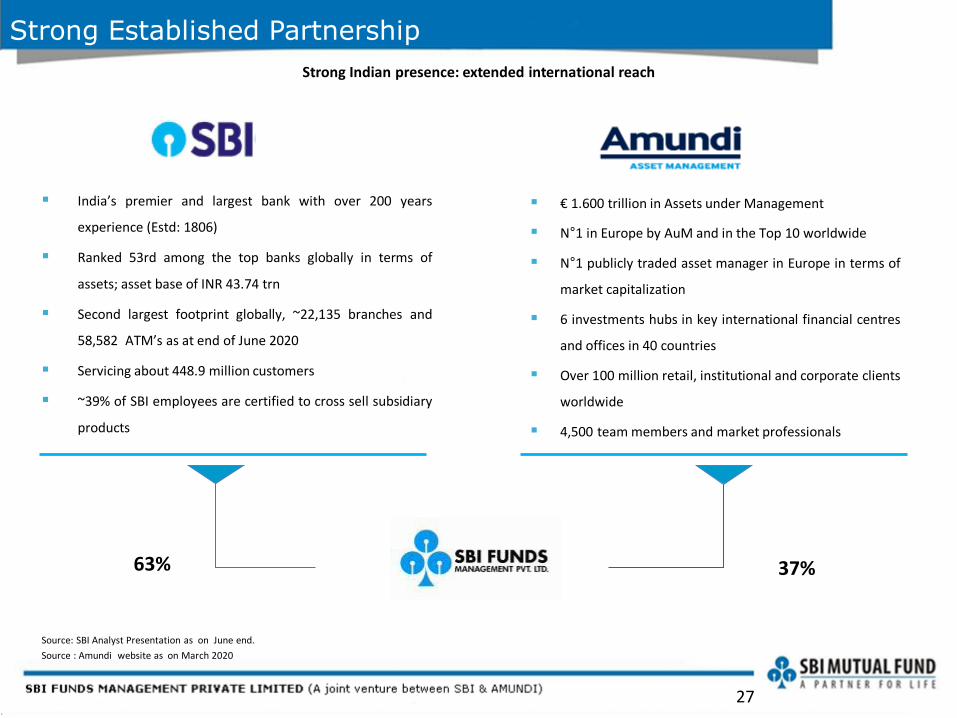
Strong Established Partnership
Strong Indian presence: extended international reach
Source: SBI Analyst Presentation as on June end.
Source : Amundi website as on March 2020
63% 37%
▪ India’s premier and largest bank with over 200 years
experience (Estd: 1806)
▪ Ranked 53rd among the top banks globally in terms of
assets; asset base of INR 43.74 trn
▪ Second largest footprint globally, ~22,135 branches and
58,582 ATM’s as at end of June 2020
▪ Servicing about 448.9 million customers
▪ ~39% of SBI employees are certified to cross sell subsidiary
products
▪ € 1.600 trillion in Assets under Management
▪ N°1 in Europe by AuM and in the Top 10 worldwide
▪ N°1 publicly traded asset manager in Europe in terms of
market capitalization
▪ 6 investments hubs in key international financial centres
and offices in 40 countries
▪ Over 100 million retail, institutional and corporate clients
worldwide
▪ 4,500 team members and market professionals
27
28
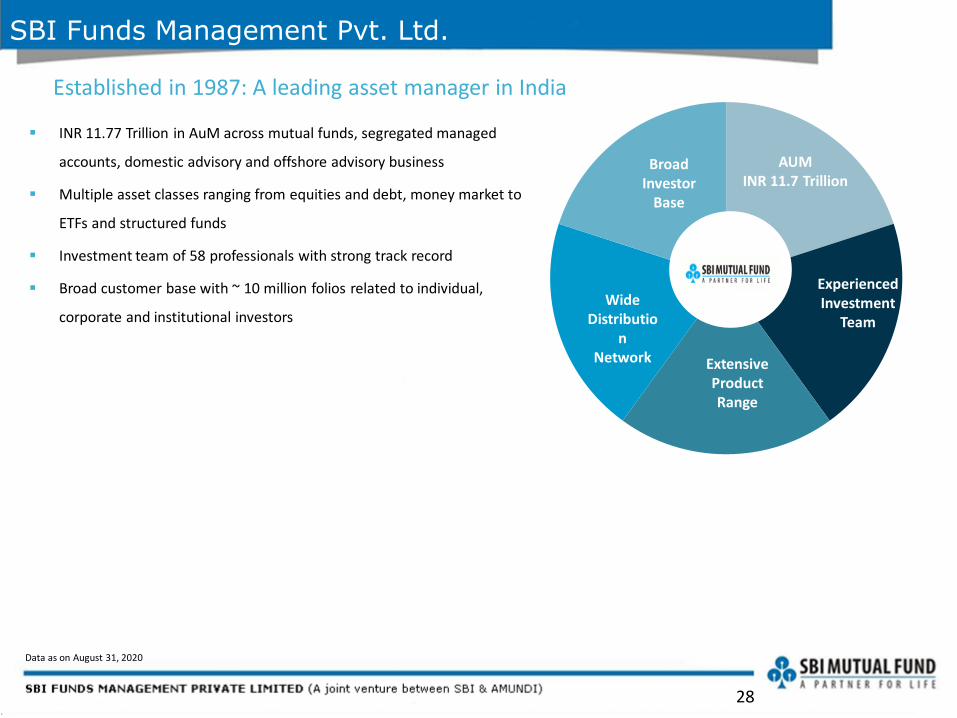
SBI Funds Management Pvt. Ltd.
Established in 1987: A leading asset manager in India
▪ INR 11.77 Trillion in AuM across mutual funds, segregated managed
accounts, domestic advisory and offshore advisory business
▪ Multiple asset classes ranging from equities and debt, money market to
ETFs and structured funds
▪ Investment team of 58 professionals with strong track record
▪ Broad customer base with ~ 10 million folios related to individual,
corporate and institutional investors
Broad Investor
Base
AUM INR 11.7 Trillion
Wide Distributio
n Network
Experienced Investment
Team
ExtensiveProductRange
Data as on August 31, 2020
28
This presentation is for information purposes only and is not an offer to sell or a solicitation to buy any mutual fund units/securities. Theseviews alone are not sufficient and should not be used for the development or implementation of an investment strategy. It should not beconstrued as investment advice to any party. All opinions and estimates included here constitute our view as of this date and are subject tochange without notice. Neither SBI Funds Management Private Limited, nor any person connected with it, accepts any liability arising fromthe use of this information. The recipient of this material should rely on their investigations and take their own professional advice.
Mutual Fund investments are subject to market risks, read all scheme related documents carefully.
For complete details, refer Scheme Related Documents available on https://www.sbimf.com/
Disclaimer & Risk Factors
NSE Indices LimitedThe Product(s) are not sponsored, endorsed, sold or promoted by NSE INDICES LIMITED (formerly known as India Index Services &Products Limited ("IISL")). NSE INDICES LIMITED does not make any representation or warranty, express or implied, to the owners of theProduct(s) or any member of the public regarding the advisability of investing in securities generally or in the Product(s) particularly or theability of the product to track general stock market performance in India. The relationship of NSE INDICES LIMITED to the Issuer is only inrespect of the licensing of the Indices and certain trademarks and trade names associated with such Indices which is determined,composed and calculated by NSE INDICES LIMITED without regard to the Issuer or the Product(s). NSE INDICES LIMITED does not have anyobligation to take the needs of the Issuer or the owners of the Product(s) into consideration in determining, composing or calculating. NSEINDICES LIMITED is not responsible for or has participated in the determination of the timing of, prices at, or quantities of the Product(s) tobe issued or in the determination or calculation of the equation by which the Product(s) is to be converted into cash. NSE INDICES LIMITEDhas no obligation or liability in connection with the administration, marketing or trading of the Product(s).NSE INDICES LIMITED do not guarantee the accuracy and/or the completeness of the product or any data included therein and NSEINDICES LIMITED shall have not have any responsibility or liability for any errors, omissions, or interruptions therein. NSE INDICES LIMITEDdoes not make any warranty, express or implied, as to results to be obtained by the Issuer, owners of the product(s), or any other personor entity from the use of the product or any data included therein. NSE INDICES LIMITED makes no express or implied warranties, andexpressly disclaim all warranties of merchantability or fitness for a particular purpose or use with respect to the index or any data includedtherein. Without limiting any of the foregoing, NSE INDICES LIMITED expressly disclaim any and all liability for any claims ,damages orlosses arising out of or related to the Products, including any and all direct, special, punitive, indirect, or consequential damages (includinglost profits), even if notified of the possibility of such damages.An investor, by subscribing or purchasing an interest in the Product(s), will be regarded as having acknowledged, understood and accepted the disclaimer referred to in Clauses above and will be bound by it.
29