savills australian student accommodation report 2018 · savills market report australian student...
TRANSCRIPT
Australian Student Accommodation savills.com.au
market report2018

Savills Market Report Australian Student Accommodation
*Front cover image: Urbanest Darling House, Sydney
Savills Market Report Australian Student Accommodation

Contents02 Introduction
04 Student Enrolment Statistics
08 Australia The Number Two Destination
10 Australian University Rankings
11 Cost of Living Analysis
12 Where Students Live
14 Market Focus Sydney
18 Market Focus Melbourne
22 Market Focus Brisbane
26 Market Focus Adelaide
30 Market Focus Perth
34 Market Focus Canberra
36 Top 10 Private Providers
38 Development Pipeline
39 Transactions
42 Yields
44 Where to Invest Next?
45 Co-Living Diversification Iglu Melbourne City
1

Savills Market Report Australian Student Accommodation
IntroductionWe are pleased to present the 2018 Savills Australian Student Accommodation Market Update. This paper provides an overview of the key drivers and market activity in this emerging asset class throughout the past 12 months.
Student Demographics The underlying dynamics of the Australian higher education market is continuing to support increasing development into new PBSA. As outlined in this paper, the international student population is continuing to increase in both universities and other education sectors.
However, Australia does have a very strong reliance on international students from a number of South East Asian countries. The latest demographic information available indicates that international student growth is stronger as evidenced by enrolments in higher education courses with student visas growing by 12.7% from 2016 to 2017. China (28.9%), India (11.0%), Brazil (4.6%), Nepal (4.4%) and Malaysia (4.1%)
are the top five countries of origin for international students studying in Australia.
In 2017, the strongest growth in international student numbers in Australia came from Nepal (56.2%), Sri Lanka (32.0%), Brazil (24.4%), Colombia (26.5%) and Spain (19.9%).
Market Activity The first three quarters of 2018 have been highlighted by a continued increase in the pipeline of new PBSA developments, with a strong focus on Melbourne and to a lesser extent Adelaide (driven in part by the availability of development opportunities).
A number of established developer/operators have also looked to raise
additional equity, including Scape, GSA, Cedar Pacific and Wee Hur. Successful completion of these capital-raising exercises is expected to provide significantly more liquidity in the sector moving towards 2019.
Several universities have entered the market to improve and grow their residential portfolios. This area of the market is relatively immature in Australia and it is expected that a range of transaction structures will emerge with specialist integrated on-campus developer/operators.
International student visa numbers are continuing to rise
rapidly at Australian universities, with
double-digit growth
The Australian PBSA sector remains in a predominately
development-focused phase, with limited
transactions of operational property
Brisbane is showing signs of an oversupply of more
expensive accommodation options; demand remains
robust in the other capital cities
2
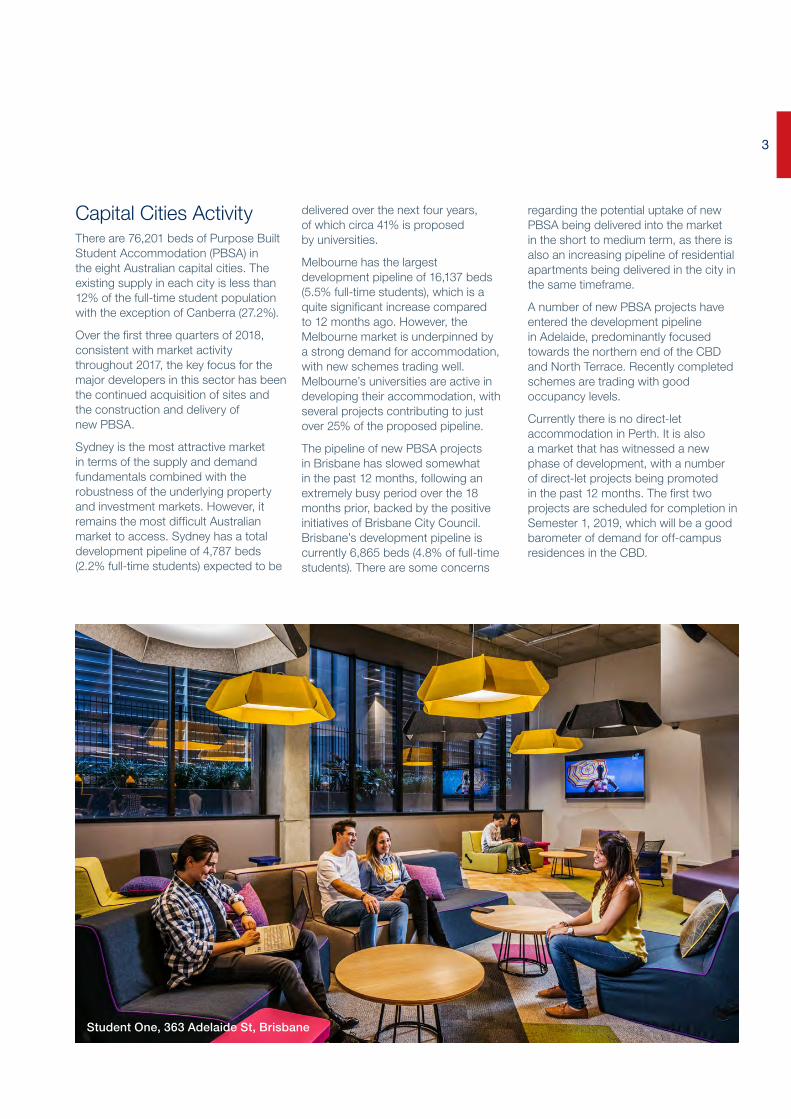
Capital Cities Activity There are 76,201 beds of Purpose Built Student Accommodation (PBSA) in the eight Australian capital cities. The existing supply in each city is less than 12% of the full-time student population with the exception of Canberra (27.2%).
Over the first three quarters of 2018, consistent with market activity throughout 2017, the key focus for the major developers in this sector has been the continued acquisition of sites and the construction and delivery of new PBSA.
Sydney is the most attractive market in terms of the supply and demand fundamentals combined with the robustness of the underlying property and investment markets. However, it remains the most difficult Australian market to access. Sydney has a total development pipeline of 4,787 beds (2.2% full-time students) expected to be
delivered over the next four years, of which circa 41% is proposed by universities.
Melbourne has the largest development pipeline of 16,137 beds (5.5% full-time students), which is a quite significant increase compared to 12 months ago. However, the Melbourne market is underpinned by a strong demand for accommodation, with new schemes trading well. Melbourne’s universities are active in developing their accommodation, with several projects contributing to just over 25% of the proposed pipeline.
The pipeline of new PBSA projects in Brisbane has slowed somewhat in the past 12 months, following an extremely busy period over the 18 months prior, backed by the positive initiatives of Brisbane City Council. Brisbane’s development pipeline is currently 6,865 beds (4.8% of full-time students). There are some concerns
Student One, 363 Adelaide St, Brisbane
regarding the potential uptake of new PBSA being delivered into the market in the short to medium term, as there is also an increasing pipeline of residential apartments being delivered in the city in the same timeframe.
A number of new PBSA projects have entered the development pipeline in Adelaide, predominantly focused towards the northern end of the CBD and North Terrace. Recently completed schemes are trading with good occupancy levels.
Currently there is no direct-let accommodation in Perth. It is also a market that has witnessed a new phase of development, with a number of direct-let projects being promoted in the past 12 months. The first two projects are scheduled for completion in Semester 1, 2019, which will be a good barometer of demand for off-campus residences in the CBD.
3
Savills Market Report Australian Student Accommodation
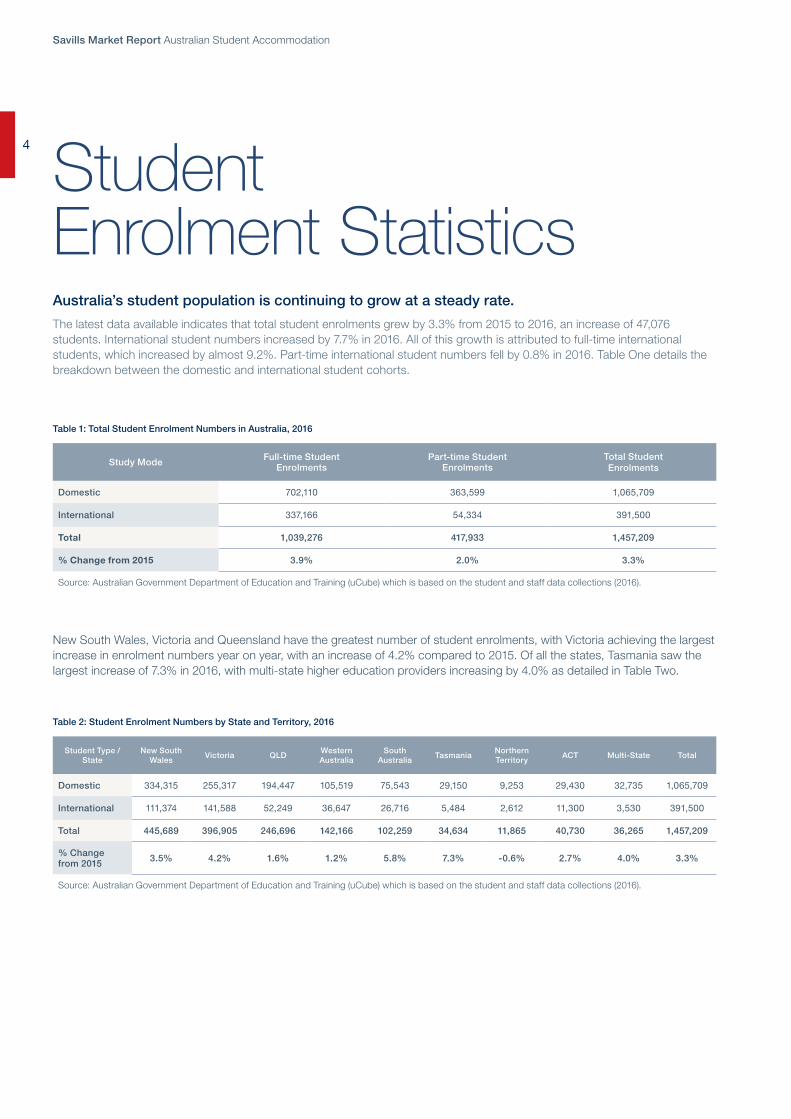
Student Enrolment StatisticsAustralia’s student population is continuing to grow at a steady rate.
The latest data available indicates that total student enrolments grew by 3.3% from 2015 to 2016, an increase of 47,076 students. International student numbers increased by 7.7% in 2016. All of this growth is attributed to full-time international students, which increased by almost 9.2%. Part-time international student numbers fell by 0.8% in 2016. Table One details the breakdown between the domestic and international student cohorts.
New South Wales, Victoria and Queensland have the greatest number of student enrolments, with Victoria achieving the largest increase in enrolment numbers year on year, with an increase of 4.2% compared to 2015. Of all the states, Tasmania saw the largest increase of 7.3% in 2016, with multi-state higher education providers increasing by 4.0% as detailed in Table Two.
Study Mode Full-time StudentEnrolments
Part-time Student Enrolments
Total Student Enrolments
Domestic 702,110 363,599 1,065,709
International 337,166 54,334 391,500
Total 1,039,276 417,933 1,457,209
% Change from 2015 3.9% 2.0% 3.3%
Source: Australian Government Department of Education and Training (uCube) which is based on the student and staff data collections (2016).
Table 1: Total Student Enrolment Numbers in Australia, 2016
Table 2: Student Enrolment Numbers by State and Territory, 2016
Student Type / State
New South Wales
Victoria QLDWestern Australia
South Australia
TasmaniaNorthern Territory
ACT Multi-State Total
Domestic 334,315 255,317 194,447 105,519 75,543 29,150 9,253 29,430 32,735 1,065,709
International 111,374 141,588 52,249 36,647 26,716 5,484 2,612 11,300 3,530 391,500
Total 445,689 396,905 246,696 142,166 102,259 34,634 11,865 40,730 36,265 1,457,209
% Change from 2015 3.5% 4.2% 1.6% 1.2% 5.8% 7.3% -0.6% 2.7% 4.0% 3.3%
Source: Australian Government Department of Education and Training (uCube) which is based on the student and staff data collections (2016).
4
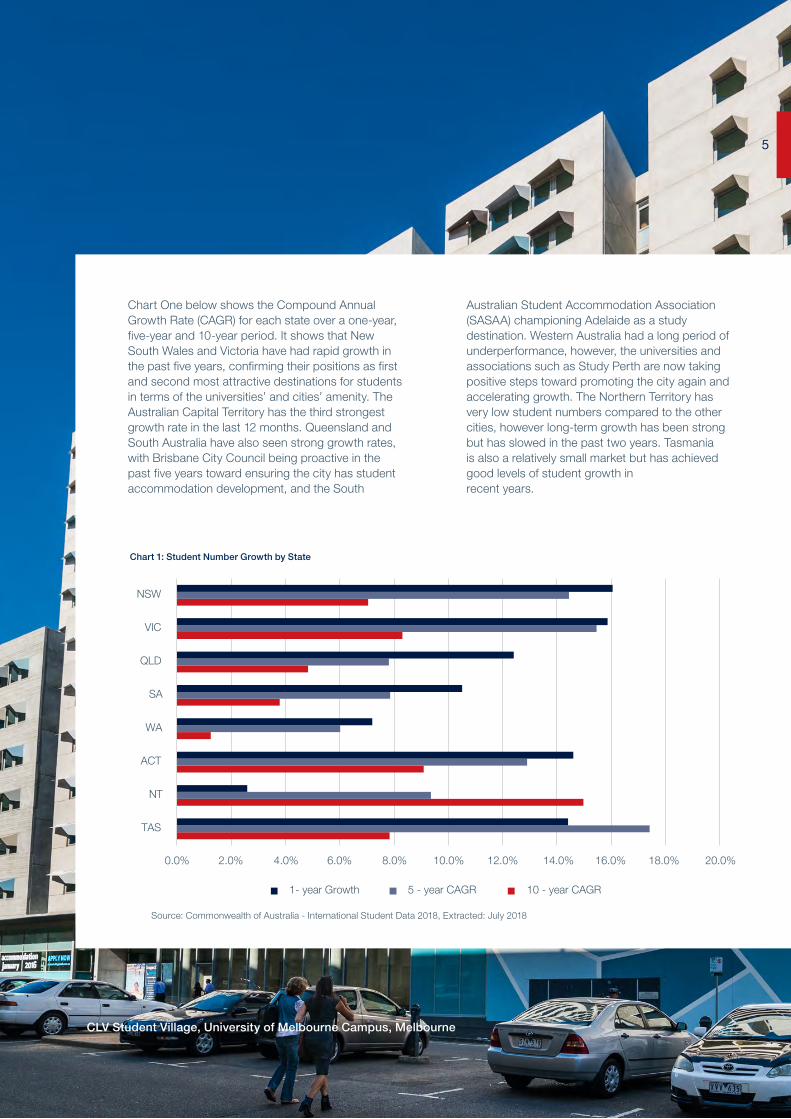
Chart One below shows the Compound Annual Growth Rate (CAGR) for each state over a one-year, five-year and 10-year period. It shows that New South Wales and Victoria have had rapid growth in the past five years, confirming their positions as first and second most attractive destinations for students in terms of the universities’ and cities’ amenity. The Australian Capital Territory has the third strongest growth rate in the last 12 months. Queensland and South Australia have also seen strong growth rates, with Brisbane City Council being proactive in the past five years toward ensuring the city has student accommodation development, and the South
Chart 1: Student Number Growth by State
Australian Student Accommodation Association (SASAA) championing Adelaide as a study destination. Western Australia had a long period of underperformance, however, the universities and associations such as Study Perth are now taking positive steps toward promoting the city again and accelerating growth. The Northern Territory has very low student numbers compared to the other cities, however long-term growth has been strong but has slowed in the past two years. Tasmania is also a relatively small market but has achieved good levels of student growth in recent years.
CLV Student Village, University of Melbourne Campus, Melbourne
Source: Commonwealth of Australia - International Student Data 2018, Extracted: July 2018
5

Savills Market Report Australian Student Accommodation
1 Note that students can enrol for more than one course in the same year, for example an English Language Intensive Course for Overseas Students (ELICOS) and then a higher education course.
The number of international students enrolled in higher education courses and utilising study visas in Australia has grown by 12.7% from 2016 to 2017, a marginally higher increase than the previous year, as detailed in Table Three below. There were 624,001 international students studying on a student visa in Australia in 2017, which represents a 12.7% increase over 2016 figures (554,179 student visas) . The top five nationalities are China, India, Brazil, Nepal and Malaysia.
Table 3: International Students Studying on Visas in Australia, 2017
Education Sector2017 Student
Numbers2016 Student
NumbersGrowth from 2016 to 2017
Higher Education 350,472 305,486 14.7%
VET 217,696 186,533 16.7%
Schools 25,762 23,270 10.7%
ELICOS 155,448 150,272 3.4%
Non-Award 49,993 44,044 13.5%
Total 799,371 709,605 12.7%
* The total is less than the sum of its components as individual students can undertake study in more than one sector during the year. Source: Australian Government Department of Education Research – “End of Year Summary of International Student Enrolment Data1 – Australia – 2017”.
Table 4: International Student Enrolments in Australia in 2017
Top 10 Nationalities Number of Students 2017 Proportion
China 231,191 28.9%
India 87,615 11.0%
Brazil 36,496 4.6%
Nepal 35,423 4.4%
Malaysia 32,899 4.1%
Korea, Republic of (South) 31,112 3.9%
Thailand 30,730 3.8%
Vietnam 30,536 3.8%
Colombia 21,628 2.7%
Indonesia 20,028 2.5%
Other Nationalities 241,713 30.3%
Total 799,371
*International student numbers relate only to international students in Australia on a student visa and are derived from AEI enrolments data.Source: Australian Government Department of Education Research – “End of Year Summary of International Student Enrolment Data1 – Australia – 2017”.
6
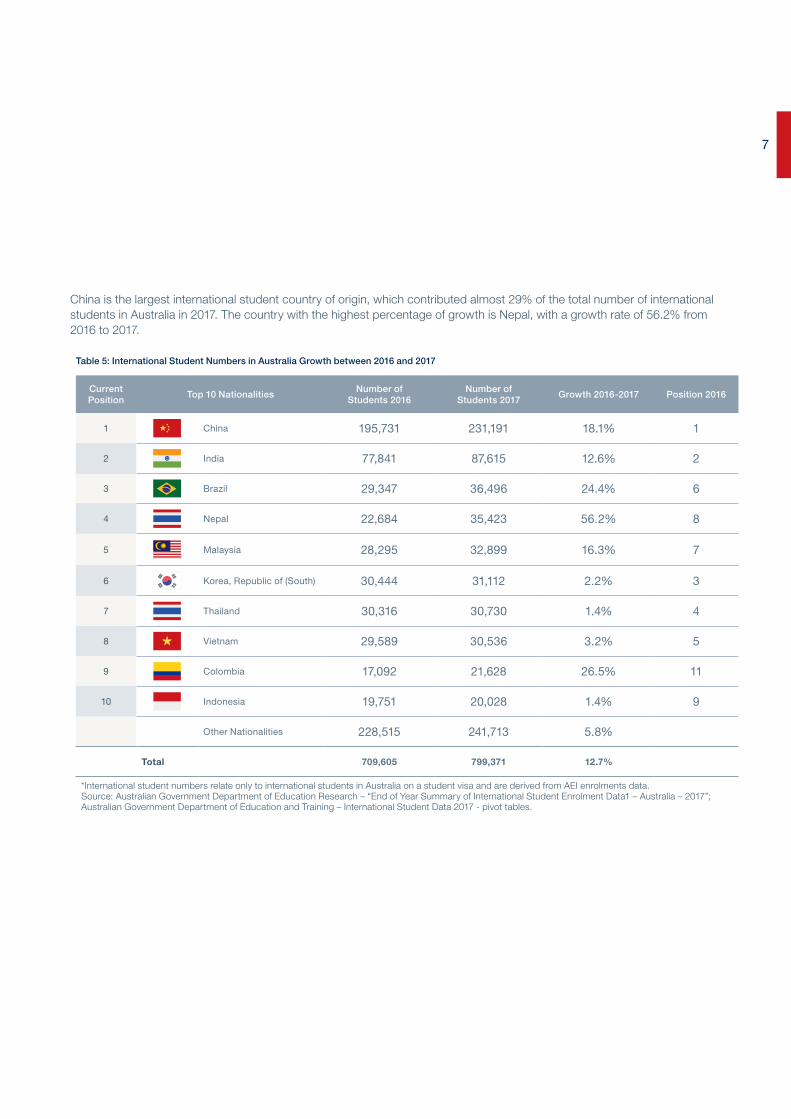
Table 5: International Student Numbers in Australia Growth between 2016 and 2017
Current Position
Top 10 NationalitiesNumber of
Students 2016Number of
Students 2017Growth 2016-2017 Position 2016
1 China 195,731 231,191 18.1% 1
2 India 77,841 87,615 12.6% 2
3 Brazil 29,347 36,496 24.4% 6
4 Nepal 22,684 35,423 56.2% 8
5 Malaysia 28,295 32,899 16.3% 7
6 Korea, Republic of (South) 30,444 31,112 2.2% 3
7 Thailand 30,316 30,730 1.4% 4
8 Vietnam 29,589 30,536 3.2% 5
9 Colombia 17,092 21,628 26.5% 11
10 Indonesia 19,751 20,028 1.4% 9
Other Nationalities 228,515 241,713 5.8%
Total 709,605 799,371 12.7%
*International student numbers relate only to international students in Australia on a student visa and are derived from AEI enrolments data.Source: Australian Government Department of Education Research – “End of Year Summary of International Student Enrolment Data1 – Australia – 2017”; Australian Government Department of Education and Training – International Student Data 2017 - pivot tables.
iglu
D6
Reg
ent
St,
Red
fern
China is the largest international student country of origin, which contributed almost 29% of the total number of international students in Australia in 2017. The country with the highest percentage of growth is Nepal, with a growth rate of 56.2% from 2016 to 2017.
7

Savills Market Report Australian Student Accommodation
Australia The Number Two DestinationAccording to UNESCO statistics, Australia is set to overtake the UK as the second most popular destination for international students.
Australia has witnessed strong growth in international student numbers as outlined in the table below. This has continued into 2017, with further growth of 12.7%. Growth has been largely static in the UK since 2013 and the impacts of Brexit could prove to be detrimental as the UK is heavily reliant on EU student enrolments. After Brexit, European students will have to pay international student fees as opposed to UK student fees, as well as having to pay up front for study, with tuition loans no longer available to them.
Table 6: 10 leading countries in international education: 2011 – 2016
2011 2012 2013 2014 2015 2016
United States 640,488 671,027 714,630 771,561 840,757
United Kingdom 290,382 294,288 288,766 289,514 301,558
Australia 251,676 239,533 239,031 255,525 283,043 321,352
France 268,212 271,399 228,639 235,123 239,409
Russia 112,655 125,392 168,818 177,286 197,206
Canada 107,172 119,047 132,558 142,863 148,458 164,262
Germany 118,933 121,072 133,481
Japan 147,428 147,051 131,855 128,623 128,108
Malaysia 98,526 110,499 123,061
China
World 3,131,898 3,195,639 3,311,693 3,497,599 3,759,060 3,890,874
Gaps = data not available.
Source: UNSECO Institute for Statistics, http://data.uis.unesco.org/#
8

Chart 2: Top four leading countries in international education: 2011 – 2016
900,000
800,000
700,000
600,000
500,000
400,000
300,000
200,000
100,000
2011
United States United Kingdom Australia Canada
2012 2013 2014 2015 20160
Source: UNSECO Institute for Statistics, http://data.uis.unesco.org/#
The Student Housing Company, Park Ave, Parkville
9
Savills Market Report Australian Student Accommodation
Australian University RankingsAustralian universities are continuing to rise in global rankings.
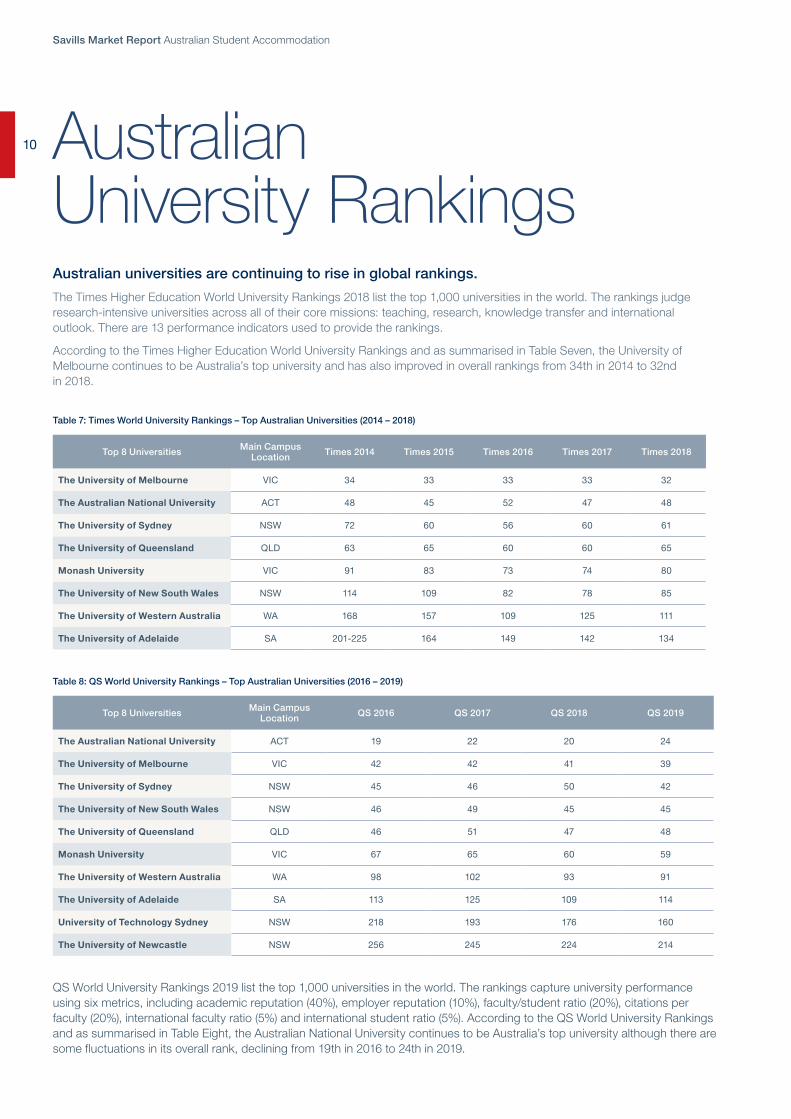
The Times Higher Education World University Rankings 2018 list the top 1,000 universities in the world. The rankings judge research-intensive universities across all of their core missions: teaching, research, knowledge transfer and international outlook. There are 13 performance indicators used to provide the rankings.
According to the Times Higher Education World University Rankings and as summarised in Table Seven, the University of Melbourne continues to be Australia’s top university and has also improved in overall rankings from 34th in 2014 to 32nd in 2018.
Top 8 Universities Main Campus Location Times 2014 Times 2015 Times 2016 Times 2017 Times 2018
The University of Melbourne VIC 34 33 33 33 32
The Australian National University ACT 48 45 52 47 48
The University of Sydney NSW 72 60 56 60 61
The University of Queensland QLD 63 65 60 60 65
Monash University VIC 91 83 73 74 80
The University of New South Wales NSW 114 109 82 78 85
The University of Western Australia WA 168 157 109 125 111
The University of Adelaide SA 201-225 164 149 142 134
Table 7: Times World University Rankings – Top Australian Universities (2014 – 2018)
Top 8 Universities Main Campus Location QS 2016 QS 2017 QS 2018 QS 2019
The Australian National University ACT 19 22 20 24
The University of Melbourne VIC 42 42 41 39
The University of Sydney NSW 45 46 50 42
The University of New South Wales NSW 46 49 45 45
The University of Queensland QLD 46 51 47 48
Monash University VIC 67 65 60 59
The University of Western Australia WA 98 102 93 91
The University of Adelaide SA 113 125 109 114
University of Technology Sydney NSW 218 193 176 160
The University of Newcastle NSW 256 245 224 214
Table 8: QS World University Rankings – Top Australian Universities (2016 – 2019)
QS World University Rankings 2019 list the top 1,000 universities in the world. The rankings capture university performance using six metrics, including academic reputation (40%), employer reputation (10%), faculty/student ratio (20%), citations per faculty (20%), international faculty ratio (5%) and international student ratio (5%). According to the QS World University Rankings and as summarised in Table Eight, the Australian National University continues to be Australia’s top university although there are some fluctuations in its overall rank, declining from 19th in 2016 to 24th in 2019.
10

Cost of Living AnalysisHistorical analysis of Australia’s international student population indicates that student enrolment number growth is correlated with changes in affordability.
Chart Three below shows a snapshot of current costs of living in a selected number of global cities and indicates that Australian capital cities rank towards the most expensive, with five of the six Australian cities ranking in the top 10 of the sample group.
Whilst recent depreciation of the Australian dollar to major trading currencies has counterbalanced overall costs, this will be a key consideration for students making choices about where to study moving towards 2020.
$- $1,000 $2,000 $3,000 $4,000 $5,000 $6,000
Boston
New York
San Francisco
London
Dublin
Toronto
Stockholm
Madrid
Singapore
Tokyo
Amsterdam
Paris
Lisbon
Milan
Berlin
Shanghai
Vienna
Warsaw
Living Accommodation Tuition
Chart 3: Global student cost of living analysis for selected cities
Source: Savills World Research, Student.com, universityreviews.com.au, numbeo.com/cost-of-living/
European course fees represent non-EU international student on non-specialist STEM undergraduate degree course at a top institution, residing in purpose-build accommodation. US dollars with August 2017 exchange rate.
SydneyMelbourne
Adelaide
Brisbane
PerthCanberra
11
Savills Market Report Australian Student Accommodation
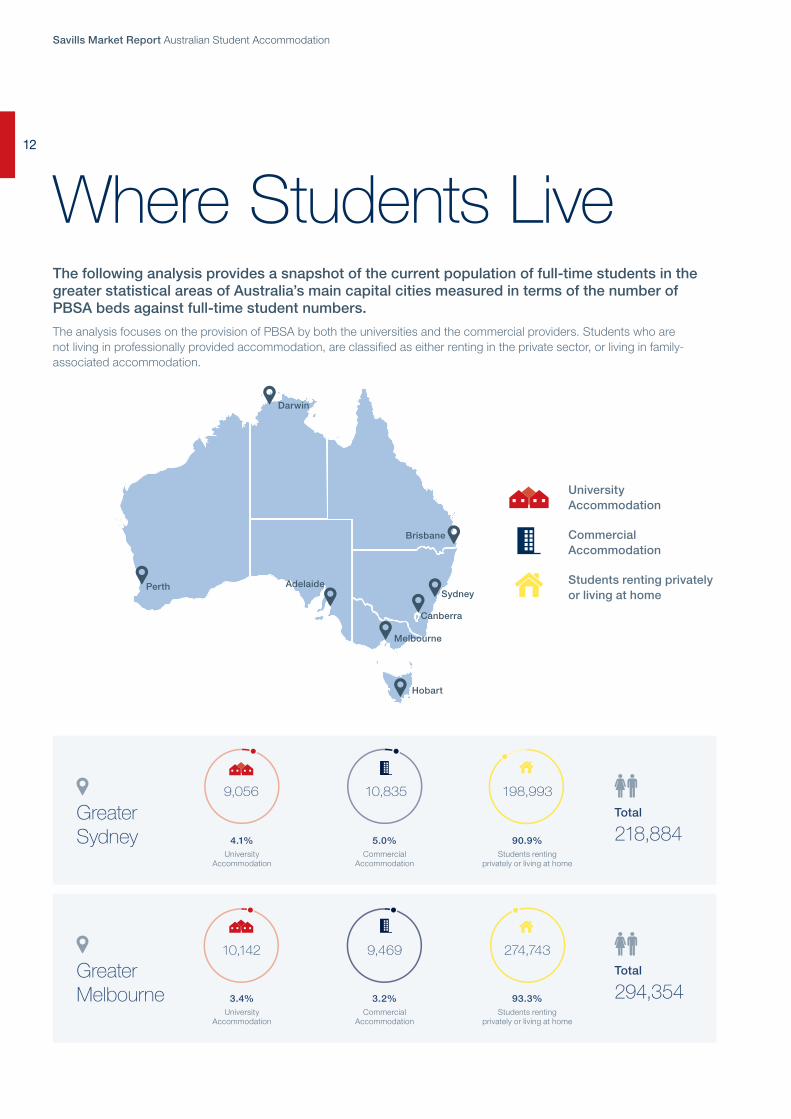
Greater Melbourne
Total
294,354
10,142 9,469 274,743
3.4%University
Accommodation
3.2%Commercial
Accommodation
93.3%Students renting
privately or living at home
The following analysis provides a snapshot of the current population of full-time students in the greater statistical areas of Australia’s main capital cities measured in terms of the number of PBSA beds against full-time student numbers.
The analysis focuses on the provision of PBSA by both the universities and the commercial providers. Students who are not living in professionally provided accommodation, are classified as either renting in the private sector, or living in family-associated accommodation.
University Accommodation
Commercial Accommodation
Students renting privately or living at home
Greater Sydney
Total
218,884
9,056 10,835 198,993
4.1%University
Accommodation
5.0%Commercial
Accommodation
90.9%Students renting
privately or living at home
Perth
Darwin
Brisbane
Sydney
Canberra
Melbourne
Hobart
Adelaide
Where Students Live 12
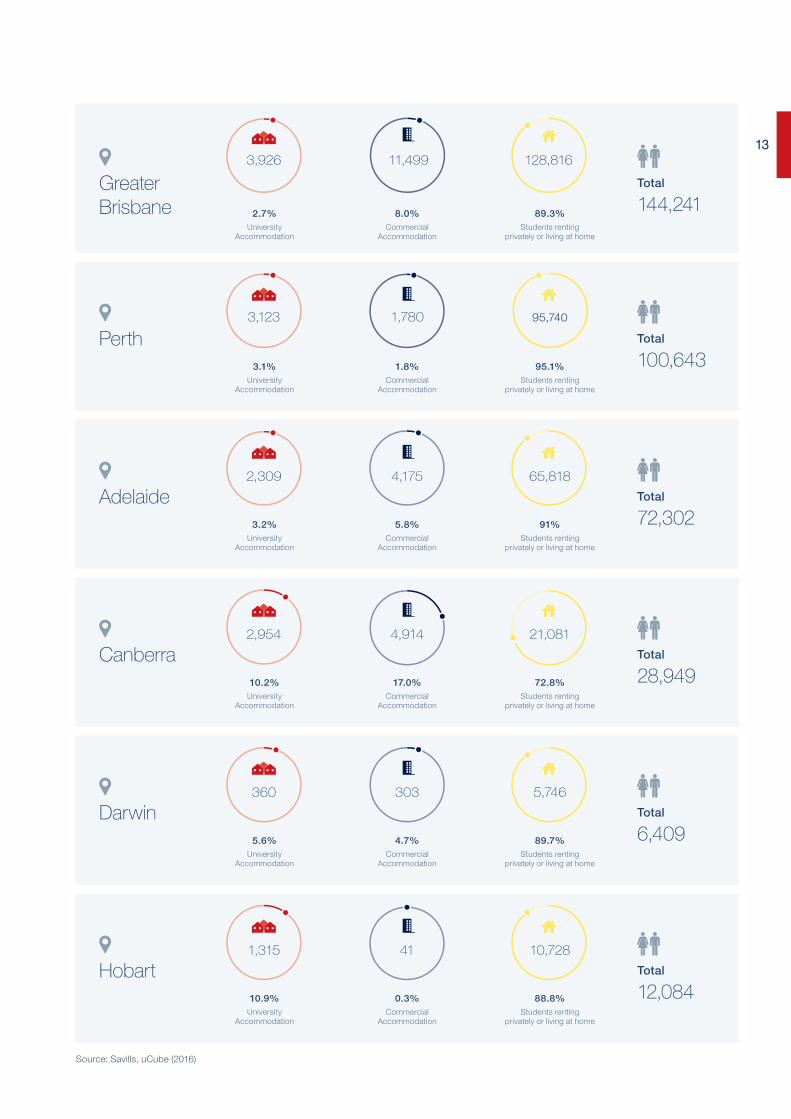
Adelaide Total
72,302
2,309 4,175 65,818
3.2%University
Accommodation
5.8%Commercial
Accommodation
91%Students renting
privately or living at home
Canberra Total
28,949
2,954 4,914 21,081
10.2%University
Accommodation
17.0%Commercial
Accommodation
72.8%Students renting
privately or living at home
Darwin Total
6,409
360 303 5,746
5.6%University
Accommodation
4.7%Commercial
Accommodation
89.7%Students renting
privately or living at home
Hobart Total
12,084
1,315 41 10,728
10.9%University
Accommodation
0.3%Commercial
Accommodation
88.8%Students renting
privately or living at home
Source: Savills, uCube (2016)
Greater Brisbane
Total
144,241
3,926 11,499 128,816
2.7%University
Accommodation
8.0%Commercial
Accommodation
89.3%Students renting
privately or living at home
Perth Total
100,643
3,123 1,780 95,740
3.1%University
Accommodation
1.8%Commercial
Accommodation
95.1%Students renting
privately or living at home
13

Savills Market Report Australian Student Accommodation
Market Focus Sydney
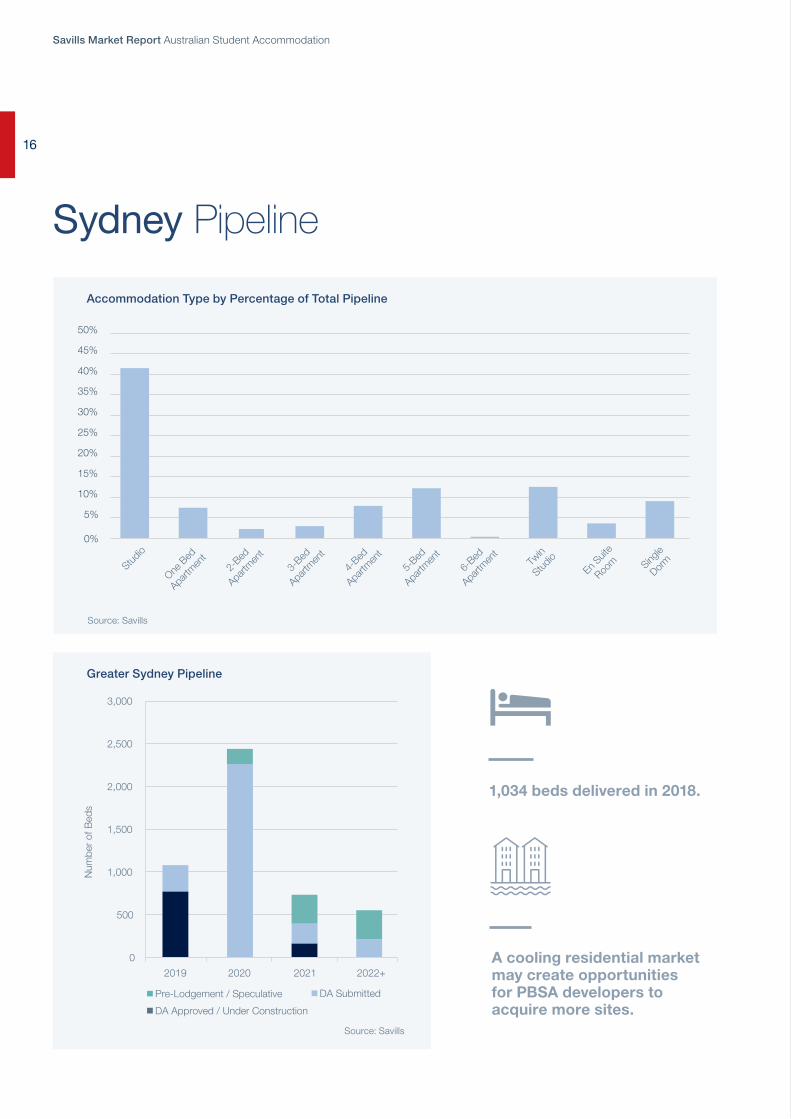
The total development pipeline in Sydney has decreased from 5,435 beds in 2017 to 4,787 beds in 2018 with the completion of a number of new schemes.
The largest new project completed this year has been Urbanest’s second stage of accommodation at Darling Square (Urbanest Darling House), comprising 664 beds. Urbanest Darling House is the first off-campus direct-let accommodation available in Australia with 21 meals per week provided to students. Iglu completed a 370-bed scheme on Regent Street in Redfern.
If all of the accommodation within the supply pipeline is delivered, the existing provision of circa 8.3% may remain at a relatively consistent level at 7.9% in 2020 and 7.9% in 2025.
Sydney continues to be the most attractive Australian market for investment into the student accommodation sector. The value of
land associated with competing land uses, primarily residential in CBD fringe locations, continues to be prohibitive. However, Singaporean developer Wee Hur has recently purchased its first Sydney student accommodation site in Redfern for $52million.
The University of Sydney continues to be a significant participant within the Sydney market, with several new developments proposed, including the redevelopment of the Regiment Building, which is under construction and due for completion prior to the first semester of 2019.
Analysis of the development pipeline by room type indicates that approximately 41% of the new accommodation will be provided in the most expensive form of accommodation, which is self-contained studios. The remaining accommodation will be provided in shared apartments, with 9% of the pipeline in dormitory-style rooms, which is primarily influenced by the University developments.
Urbanest Darling House, Sydney
14

The affordability of student rents influencing the financial viability of delivering new accommodation will continue to be a critical issue for Sydney throughout the next 12 months.
Significant barriers to entry include the value associated with competing land uses, particularly residential, which means there is a relatively low development pipeline.
Sydney is the most attractive market for investment due to a large supply and demand imbalance.
15
Savills Market Report Australian Student Accommodation
Sydney Pipeline
Accommodation Type by Percentage of Total Pipeline
Greater Sydney Pipeline
Source: Savills
Source: Savills
A cooling residential market may create opportunities for PBSA developers to acquire more sites.
1,034 beds delivered in 2018.
0%
5%
10%
15%
20%
25%
30%
35%
40%
45%
50%
Studio
One B
ed
Apartm
ent
2-Bed
Apartm
ent
3-Bed
Apartm
ent
4-Bed
Apartm
ent
5-Bed
Apartm
ent
6-Bed
Apartm
ent
Twin
Studio
En Suit
e
Room Sing
le
Dorm
0
500
1,000
1,500
2,000
2,500
3,000
2019 2020 2021 2022+
Num
ber
of B
eds
Pre-Lodgement / Speculative DA Submitted
DA Approved / Under Construction
16
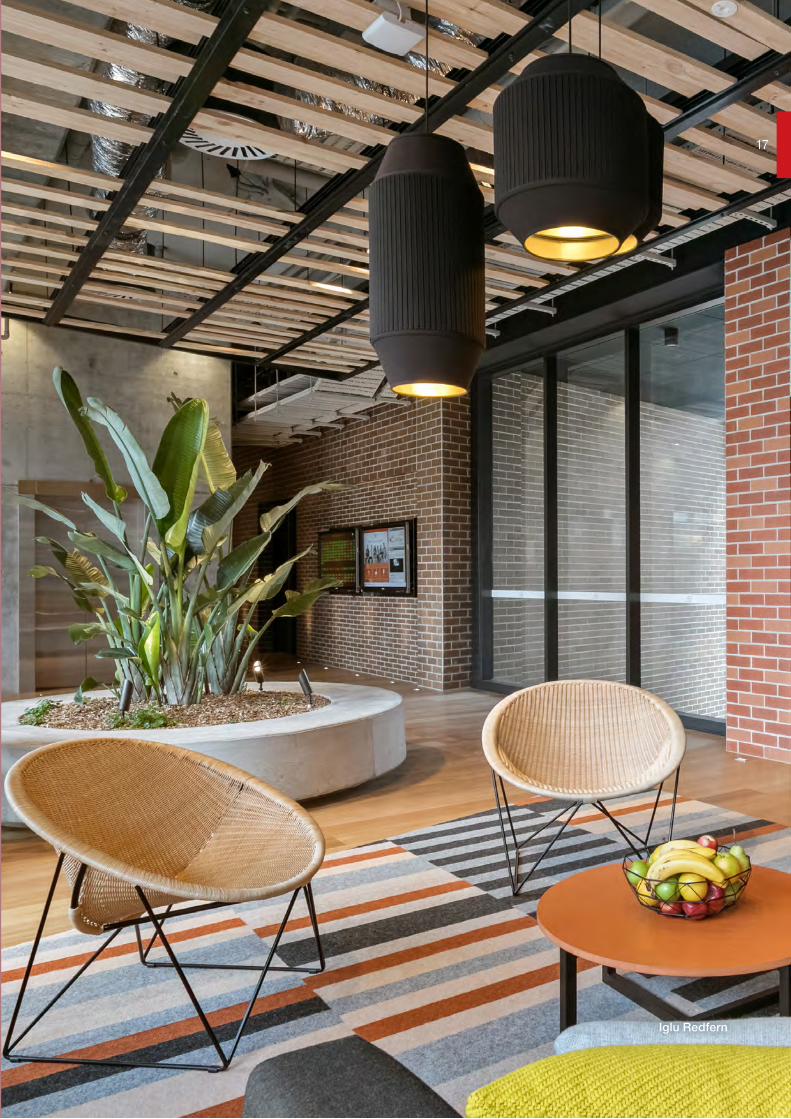
Iglu Redfern
1717
Market Focus Melbourne
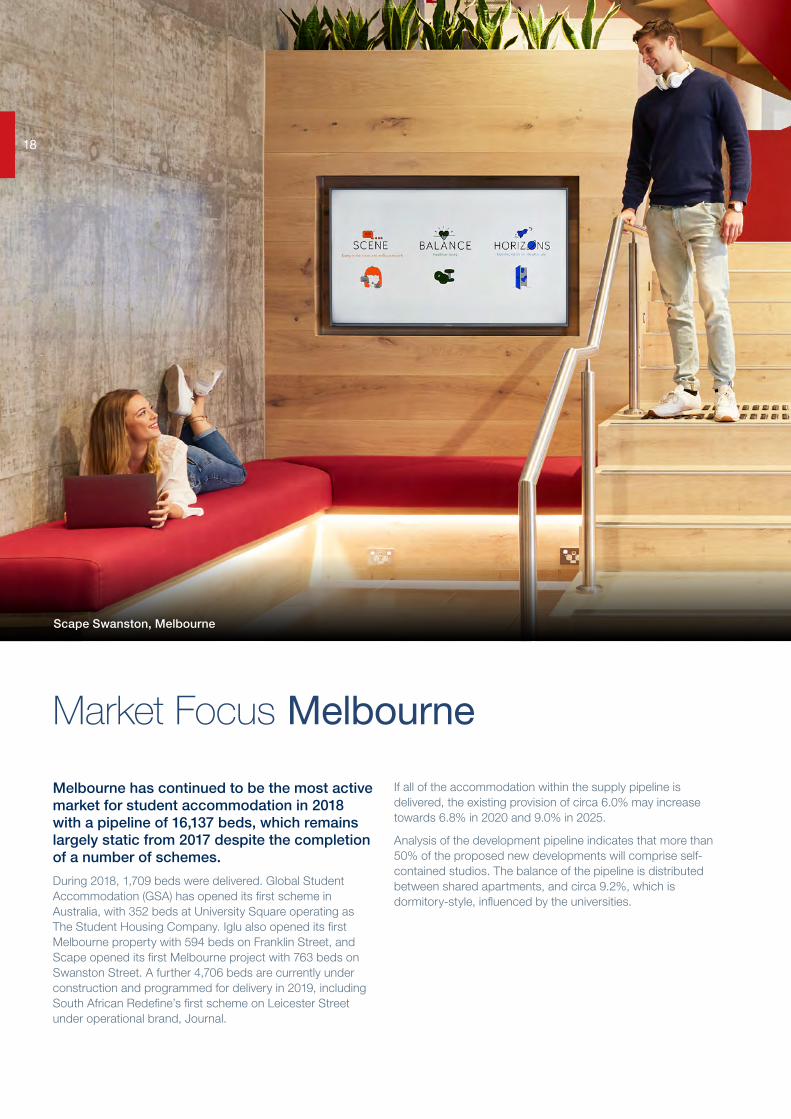
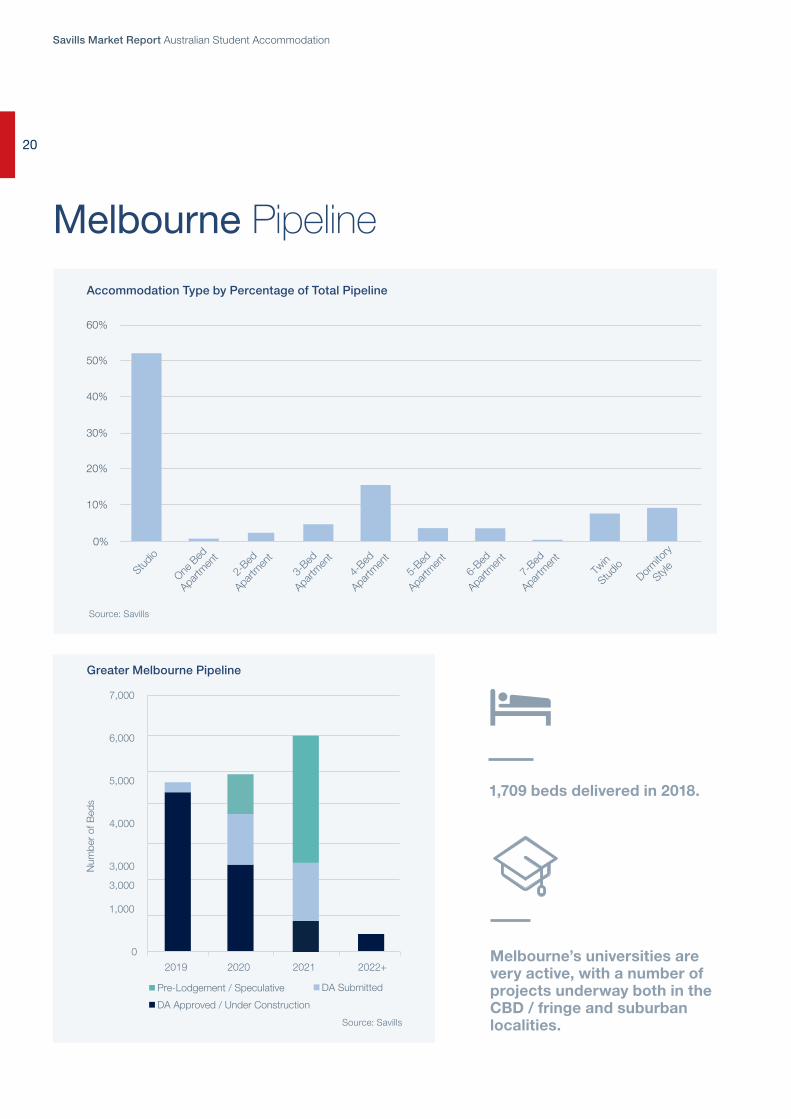
Melbourne has continued to be the most active market for student accommodation in 2018 with a pipeline of 16,137 beds, which remains largely static from 2017 despite the completion of a number of schemes.
During 2018, 1,709 beds were delivered. Global Student Accommodation (GSA) has opened its first scheme in Australia, with 352 beds at University Square operating as The Student Housing Company. Iglu also opened its first Melbourne property with 594 beds on Franklin Street, and Scape opened its first Melbourne project with 763 beds on Swanston Street. A further 4,706 beds are currently under construction and programmed for delivery in 2019, including South African Redefine’s first scheme on Leicester Street under operational brand, Journal.
If all of the accommodation within the supply pipeline is delivered, the existing provision of circa 6.0% may increase towards 6.8% in 2020 and 9.0% in 2025.
Analysis of the development pipeline indicates that more than 50% of the proposed new developments will comprise self-contained studios. The balance of the pipeline is distributed between shared apartments, and circa 9.2%, which is dormitory-style, influenced by the universities.
Scape Swanston, Melbourne
18

Melbourne’s PBSA development pipeline has remained static in the past 12 months at around 16,000 beds.
Approximately 4,706 beds are under construction and due for completion in 2019, with a similar number forecast for completion in 2020.
More than 50% of the pipeline is proposed to be self-contained studios.
1919
Savills Market Report Australian Student Accommodation
Source: Savills
Source: Savills
Melbourne Pipeline
Accommodation Type by Percentage of Total Pipeline
Greater Melbourne Pipeline
Melbourne’s universities are very active, with a number of projects underway both in the CBD / fringe and suburban localities.
0
1,000
3,000
3,000
4,000
5,000
6,000
7,000
20202019 2021 2022+
Num
ber
of B
eds
Pre-Lodgement / Speculative DA Submitted
DA Approved / Under Construction
0%
%
20%
30%
40%
50%
60%
Studio d
One B
e
Apartm
ent d
2-Be
Apartm
ent d
3-Be
Apartm
ent d
4-Be
Apartm
ent
5-Bed
Apartm
ent
6-Bed
Apartm
ent
7-Bed
Apartm
ent
Twin
Studio
Dormito
ry
Style
10
1,709 beds delivered in 2018.
20
Scape Swanston, Melbourne
2121

Savills Market Report Australian Student Accommodation
Market Focus Brisbane
The PBSA development pipeline in Brisbane increased significantly in 2015 and 2016, however additional activity has been subdued in 2017 and in 2018 to date.
Analysis indicates that the total combined PBSA pipeline has decreased from 10,682 in 2017 to 6,865 in 2018 with completion of a number of schemes.
During 2018, 3,450 beds were delivered to the Brisbane market, with a further 3,247 beds having development approval or under construction and programmed for completion in 2019. Wee Hur, UniLodge / Cedar Pacific and Scape have all opened schemes in Brisbane this year.
Rental growth in Brisbane has been relatively static in 2018 for existing assets, and occupancy levels for some new properties have been somewhat lower than forecast.
There are some concerns regarding the potential uptake of top-end new PBSA being delivered into the market in the short to medium term, as there is also a large pipeline of residential apartments being delivered in the city in the same timeframes.
Analysis indicates that the total provision based on the development pipeline completion forecast may increase from 9.8% of full-time students at present, to 10.8% in 2020 and 11.6% in 2025.
More than 30% of the pipeline comprises self-contained studios, with the balance incorporating shared apartments, primarily four, five, and six-bedroom apartments. There is approximately 11.8% of dormitory-style accommodation proposed.
UniLodge South Brisbane
2222
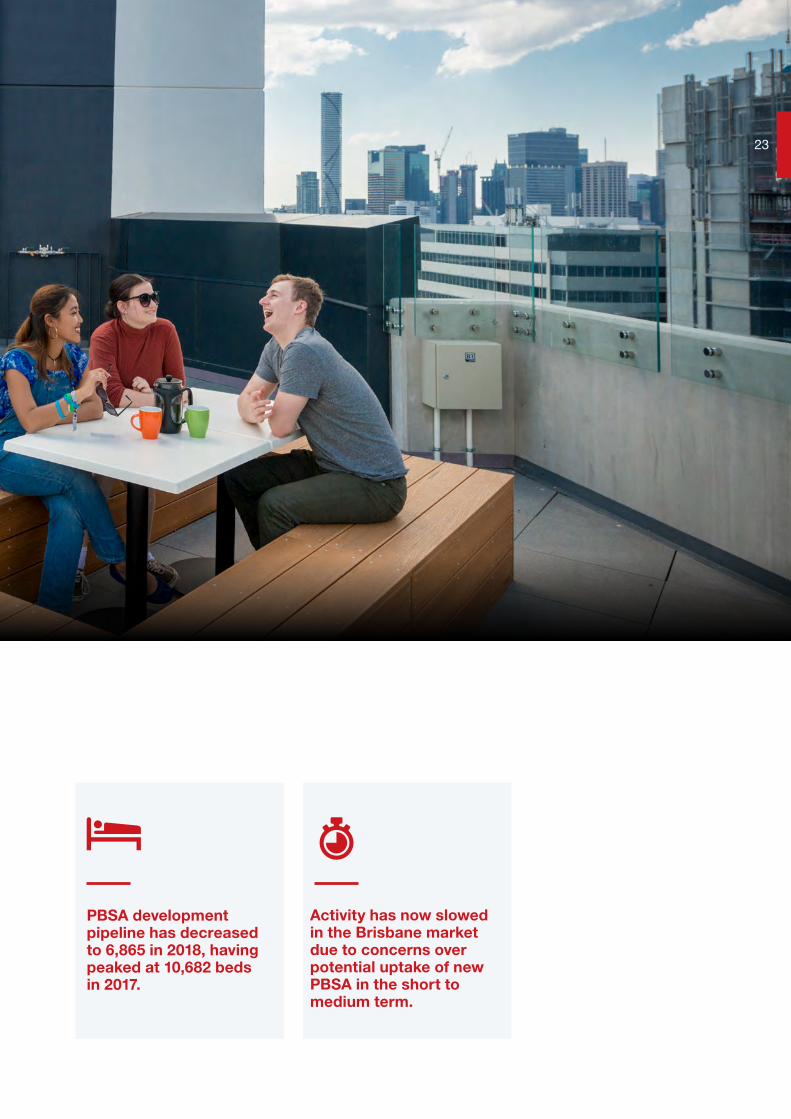
PBSA development pipeline has decreased to 6,865 in 2018, having peaked at 10,682 beds in 2017.
Activity has now slowed in the Brisbane market due to concerns over potential uptake of new PBSA in the short to medium term.
2323
Savills Market Report Australian Student Accommodation
Source: Savills
Source: Savills
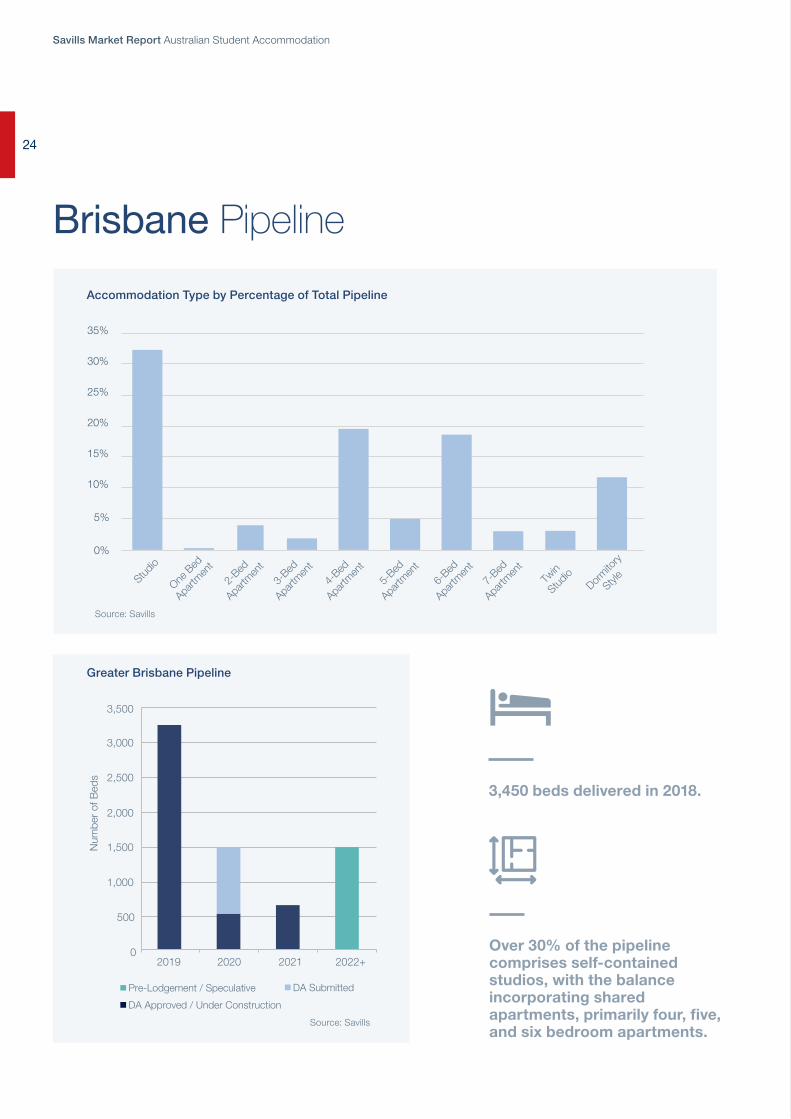
Brisbane Pipeline
Accommodation Type by Percentage of Total Pipeline
Greater Brisbane Pipeline
Over 30% of the pipeline comprises self-contained studios, with the balance incorporating shared apartments, primarily four, five, and six bedroom apartments.
0%
5%
10%
15%
20%
25%
30%
35%
Studio
One B
ed
Apartm
ent
2-Bed
Apartm
ent
3-Bed
Apartm
ent
4-Bed
Apartm
ent
5-Bed
Apartm
ent
6-Bed
Apartm
ent
7-Bed
Apartm
ent
Twin
Studio
Dormito
ry
Style
2019 2020 2021 2022+
Num
ber
of B
eds
0
500
1,000
1,500
2,000
2,500
3,000
3,500
3,450 beds delivered in 2018.
Pre-Lodgement / Speculative DA Submitted
DA Approved / Under Construction
24
Wee Hur, Park Central, Woolloongabba
25
Savills Market Report Australian Student Accommodation
Market Focus Adelaide
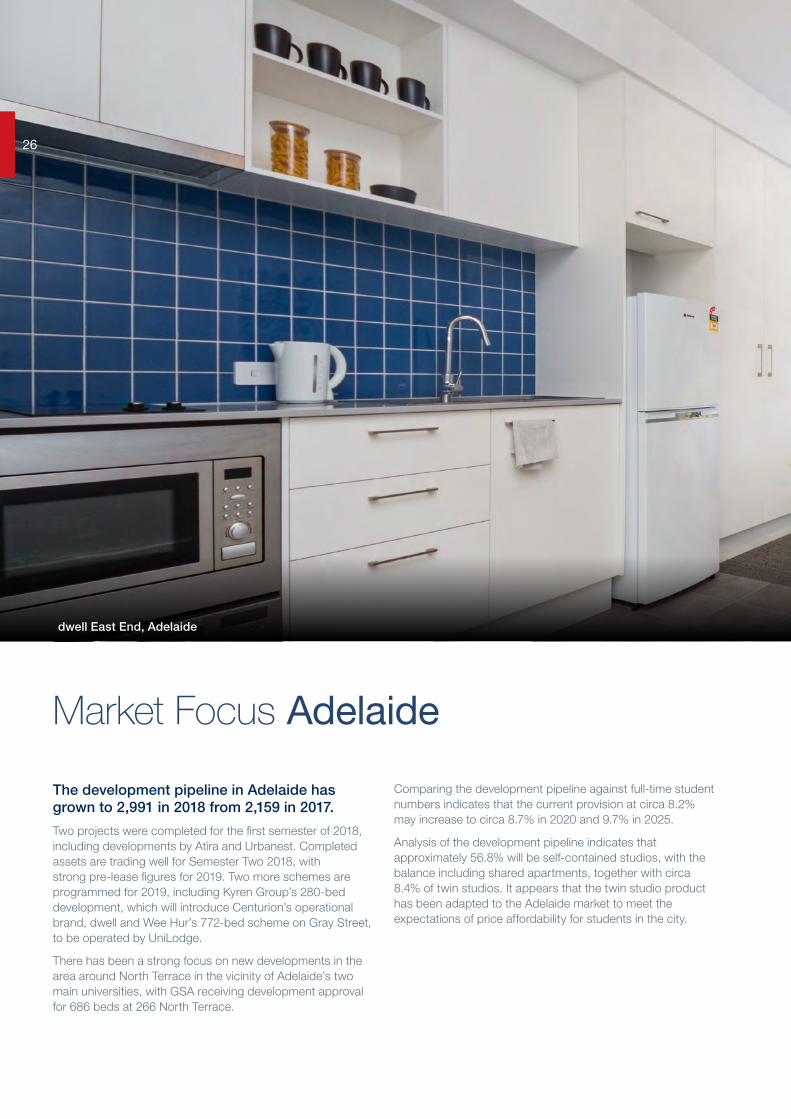
The development pipeline in Adelaide has grown to 2,991 in 2018 from 2,159 in 2017.
Two projects were completed for the first semester of 2018, including developments by Atira and Urbanest. Completed assets are trading well for Semester Two 2018, with strong pre-lease figures for 2019. Two more schemes are programmed for 2019, including Kyren Group’s 280-bed development, which will introduce Centurion’s operational brand, dwell and Wee Hur’s 772-bed scheme on Gray Street, to be operated by UniLodge.
There has been a strong focus on new developments in the area around North Terrace in the vicinity of Adelaide’s two main universities, with GSA receiving development approval for 686 beds at 266 North Terrace.
Comparing the development pipeline against full-time student numbers indicates that the current provision at circa 8.2% may increase to circa 8.7% in 2020 and 9.7% in 2025.
Analysis of the development pipeline indicates that approximately 56.8% will be self-contained studios, with the balance including shared apartments, together with circa 8.4% of twin studios. It appears that the twin studio product has been adapted to the Adelaide market to meet the expectations of price affordability for students in the city.
dwell East End, Adelaide
2626
Blue Sky, Waymouth Street, Adelaide
There has been a strong focus on the new developments in the area around North Terrace, in the vicinity of Adelaide’s two main universities.
The development pipeline in Adelaide has grown to 2,991 in 2018 from 2,159 in 2017.
57% will be self-contained studios, with the balance including shared apartments, together with circa 8% of twin studios.
27

Savills Market Report Australian Student Accommodation
Source: Savills
Source: Savills
Adelaide Pipeline
Accommodation Type by Percentage of Total Pipeline
Adelaide Pipeline
The proposed merger of the University of Adelaide and the University of South Australia does not look likely to proceed.
0
200
400
600
800
1,000
1,200
1,400
2020 2021 2022+
Num
ber
of B
eds
Pre-Lodgement / Speculative DA Submitted
DA Approved / Under Construction
0%
5%
10%
15%
20%
25%
30%
35%
40%
45%
50%
55%
60%
Studio
One B
ed
Apartm
ent
4-Bed
Apartm
ent
5-Bed
Apartm
ent
6-Bed
Apartm
ent
Twin
Studio
1920
1,128 beds delivered in 2018.
28
Hines Property, Twin Street, Adelaide
29
Savills Market Report Australian Student Accommodation
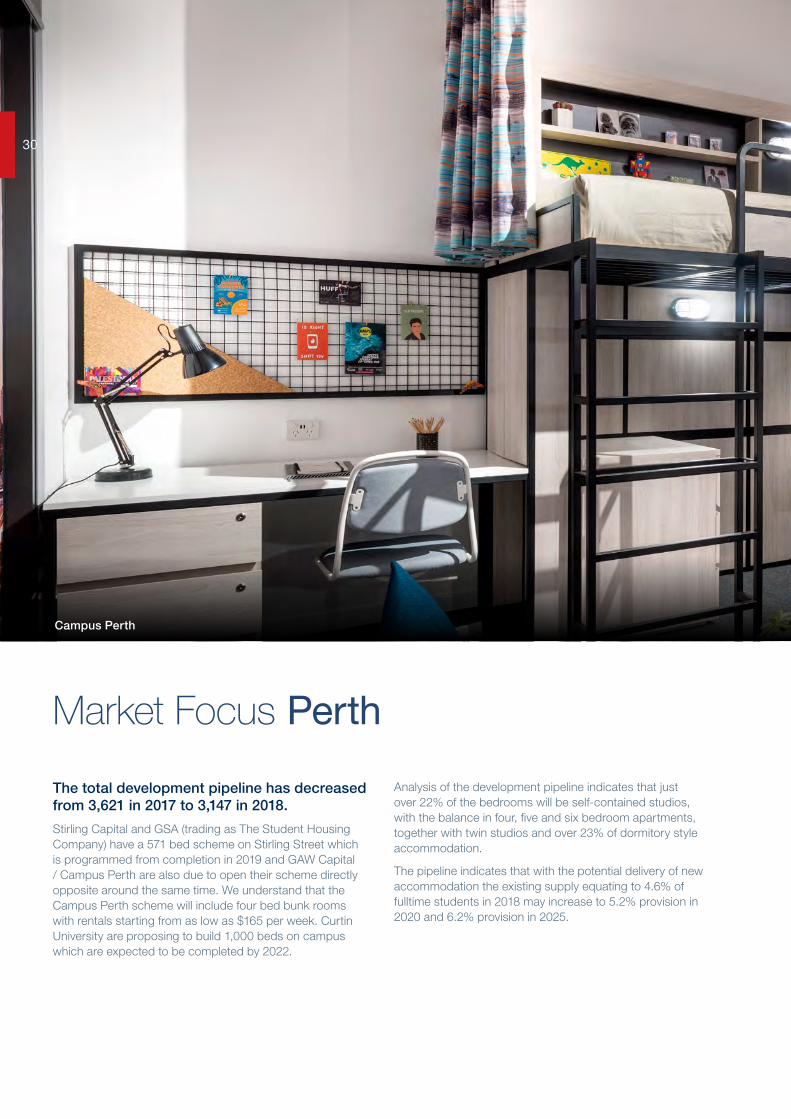
Market Focus Perth
The total development pipeline has decreased from 3,621 in 2017 to 3,147 in 2018.
Stirling Capital and GSA (trading as The Student Housing Company) have a 571 bed scheme on Stirling Street which is programmed from completion in 2019 and GAW Capital / Campus Perth are also due to open their scheme directly opposite around the same time. We understand that the Campus Perth scheme will include four bed bunk rooms with rentals starting from as low as $165 per week. Curtin University are proposing to build 1,000 beds on campus which are expected to be completed by 2022.
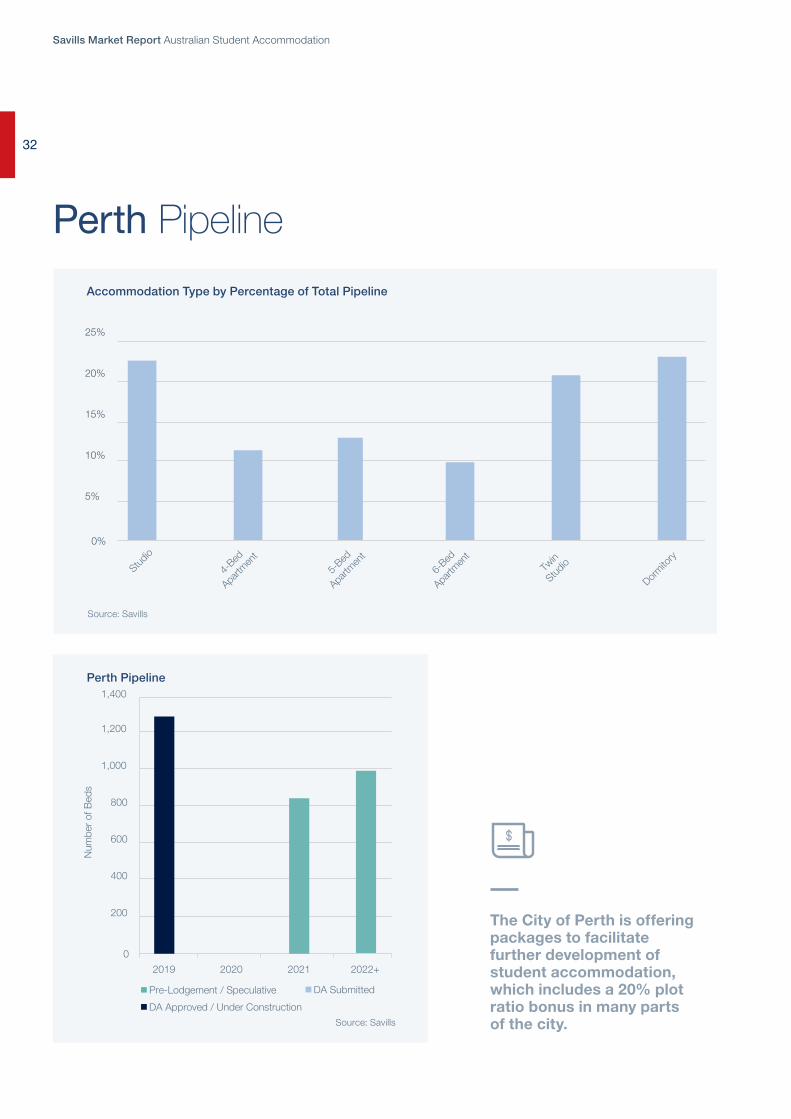
Analysis of the development pipeline indicates that just over 22% of the bedrooms will be self-contained studios, with the balance in four, five and six bedroom apartments, together with twin studios and over 23% of dormitory style accommodation.
The pipeline indicates that with the potential delivery of new accommodation the existing supply equating to 4.6% of fulltime students in 2018 may increase to 5.2% provision in 2020 and 6.2% provision in 2025.
Campus Perth
3030
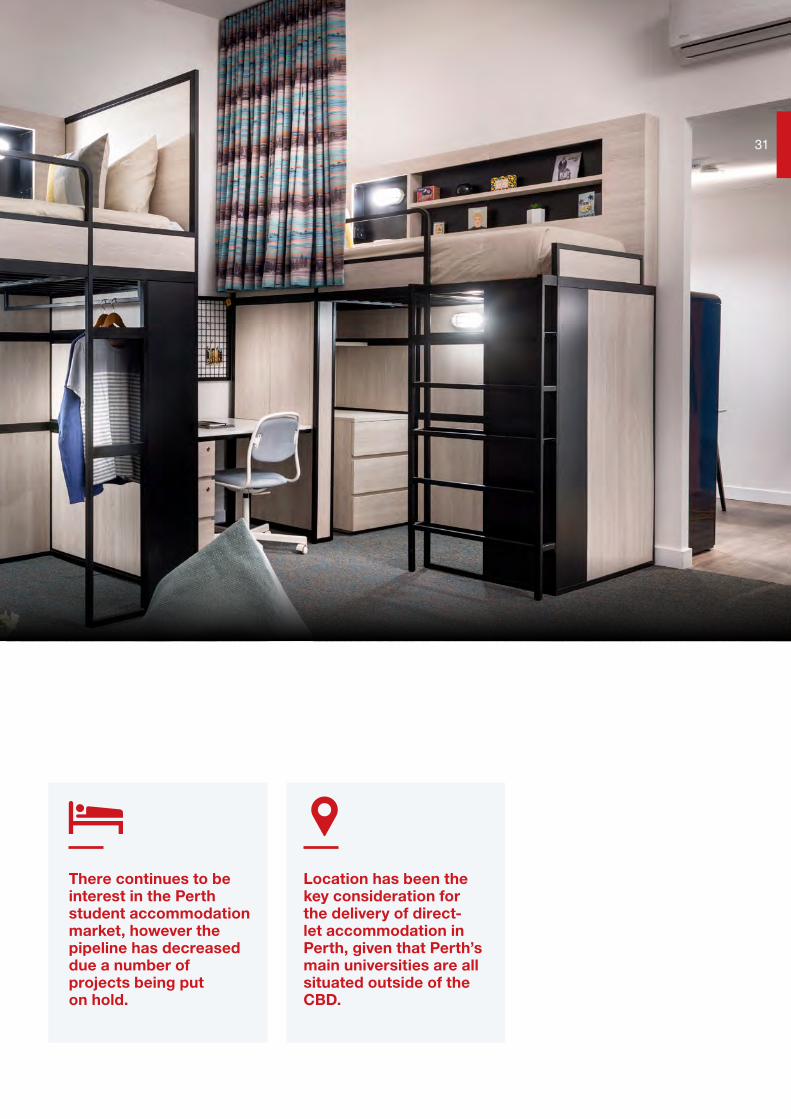
There continues to be interest in the Perth student accommodation market, however the pipeline has decreased due a number of projects being put on hold.
Location has been the key consideration for the delivery of direct-let accommodation in Perth, given that Perth’s main universities are all situated outside of the CBD.
31
Savills Market Report Australian Student Accommodation
Source: Savills
Source: Savills
Perth Pipeline
Accommodation Type by Percentage of Total Pipeline
Perth Pipeline
The City of Perth is offering packages to facilitate further development of student accommodation, which includes a 20% plot ratio bonus in many parts of the city.
0
200
400
600
800
1,000
1,200
1,400
2019 2020 2021 2022+
Num
ber
of B
eds
Pre-Lodgement / Speculative DA Submitted
DA Approved / Under Construction
0%
5%
10%
15%
20%
25%
Studio
4-Bed
Apartm
ent
5-Bed
Apartm
ent
6-Bed
Apartm
ent
Twin
Studio
Dormito
ry
32
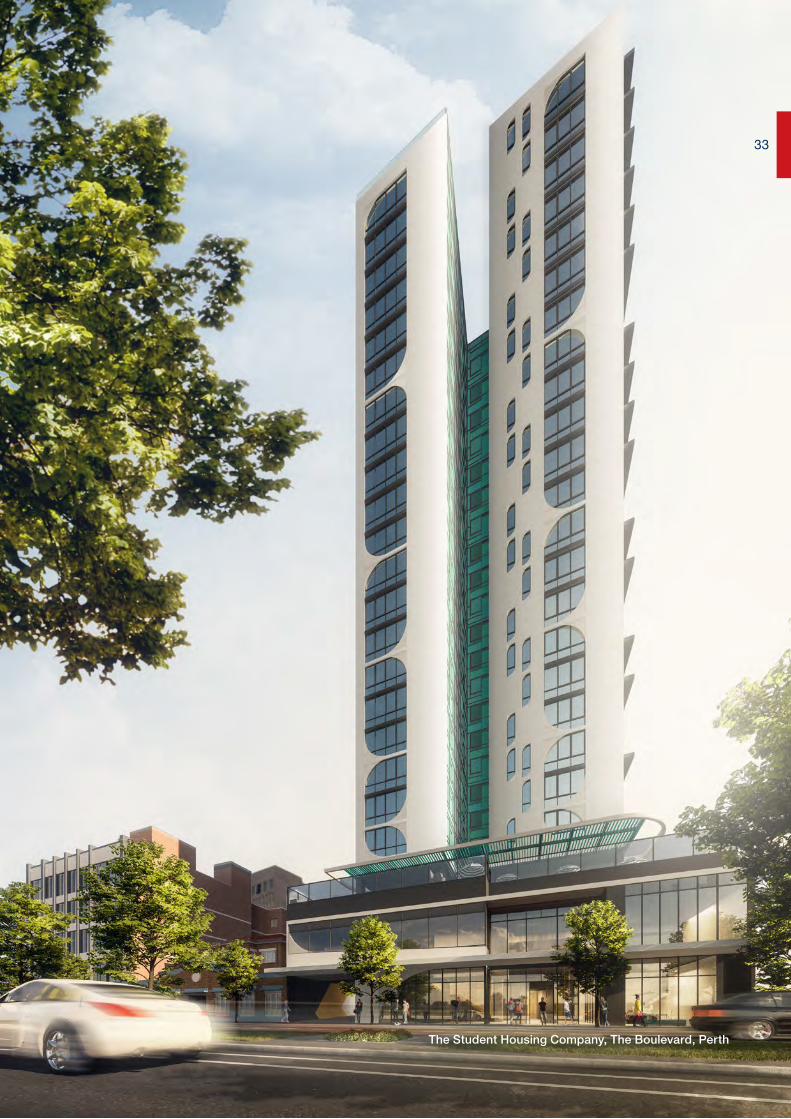
The Student Housing Company, The Boulevard, Perth
33
Savills Market Report Australian Student Accommodation
Market Focus Canberra
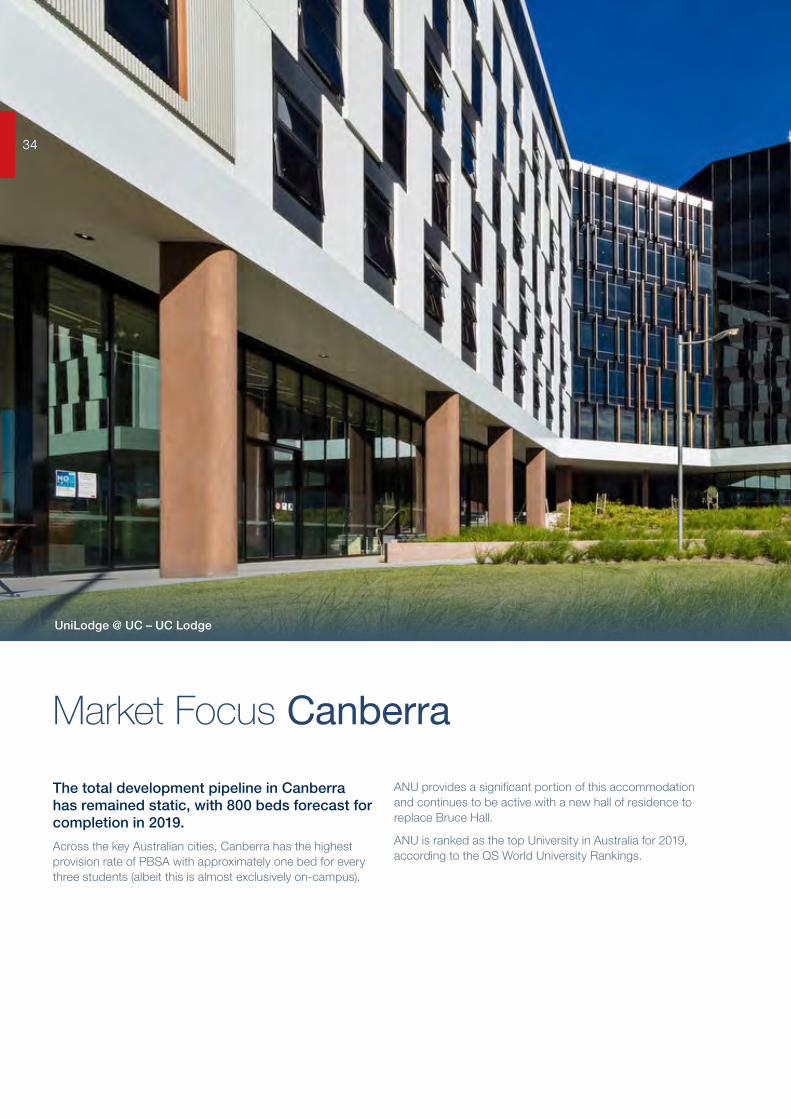
The total development pipeline in Canberra has remained static, with 800 beds forecast for completion in 2019.
Across the key Australian cities, Canberra has the highest provision rate of PBSA with approximately one bed for every three students (albeit this is almost exclusively on-campus).
ANU provides a significant portion of this accommodation and continues to be active with a new hall of residence to replace Bruce Hall.
ANU is ranked as the top University in Australia for 2019, according to the QS World University Rankings.
UniLodge @ UC – UC Lodge
3434
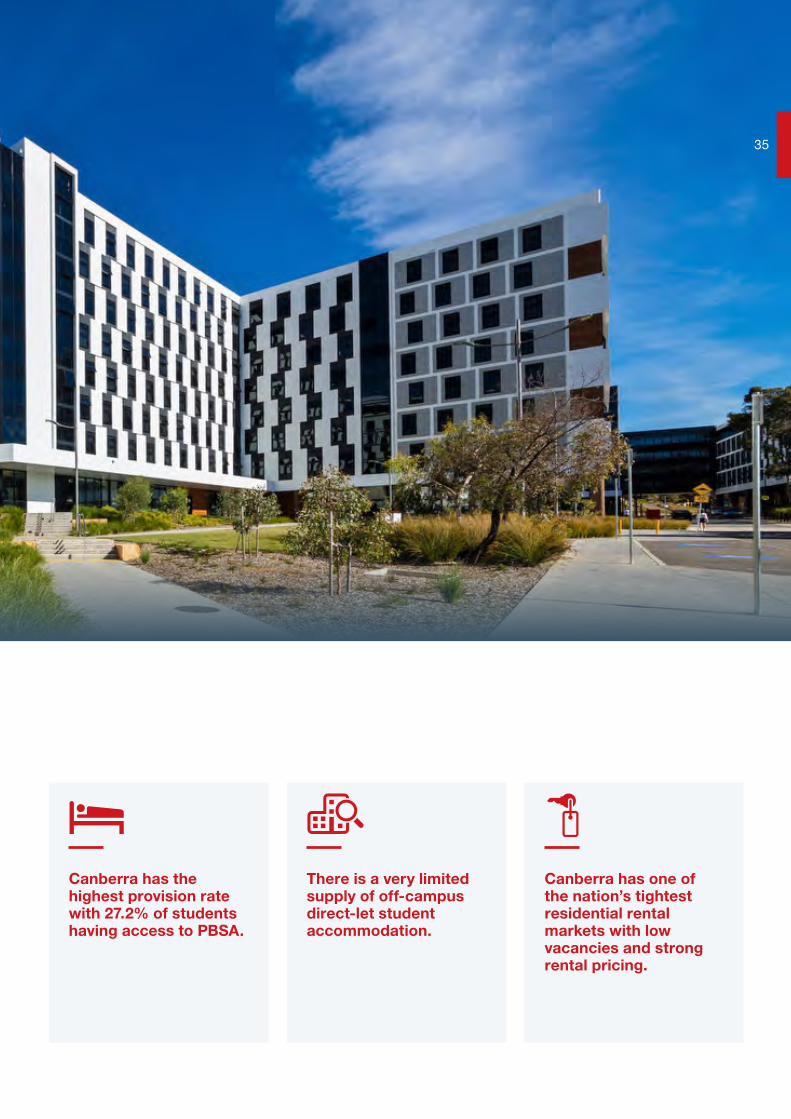
Canberra has the highest provision rate with 27.2% of students having access to PBSA.
There is a very limited supply of off-campus direct-let student accommodation.
Canberra has one of the nation’s tightest residential rental markets with low vacancies and strong rental pricing.
35
Savills Market Report Australian Student Accommodation
Student One Elizabeth Street, Brisbane
Top 10 Private Providers
Rank OperatorTotal Number of
Operational Properties Owned
Total Number of Operational Properties
Managed
Total Number of Operational Beds
Owned
Total Number of Operational Beds
Managed
Total Number of Operational Beds
(Owned or Managed)
1 UniLodge 0 54 0 15,763 15,763
2 CLV 9 14 4,719 5,688 10,407
3 HRL Morrison* 2 2 6,471 6,471 6,471
4 Urbanest 12 12 6,039 6,039 6,039
5 Iglu 8 8 3,366 3,366 3,366
6 Student Housing Australia 0 49 0 2,668 2,668
7 Atira 5 5 2,163 0 2,163
8 Scape 3 3 1,606 1,606 1,606
9 Student One 2 2 1,495 1,495 1,495
10 Cedar Pacific** 2 0 1,305 0 1,305
Total*** 43 149 27,164 43,096 51,283
*UniLodge manage 2,444 beds at ANU which are owned by HRL Morrison.**UniLodge manage all beds owned by Cedar Pacific. ***We note that the total number of beds includes a double count due to this (as does the total operational and development pipeline). The total number of existing supply of beds equates to 47,534 excluding any double up and our percentage calculations above have been based on this number.
Source: Savills, data correct as at Semester 1 2018.
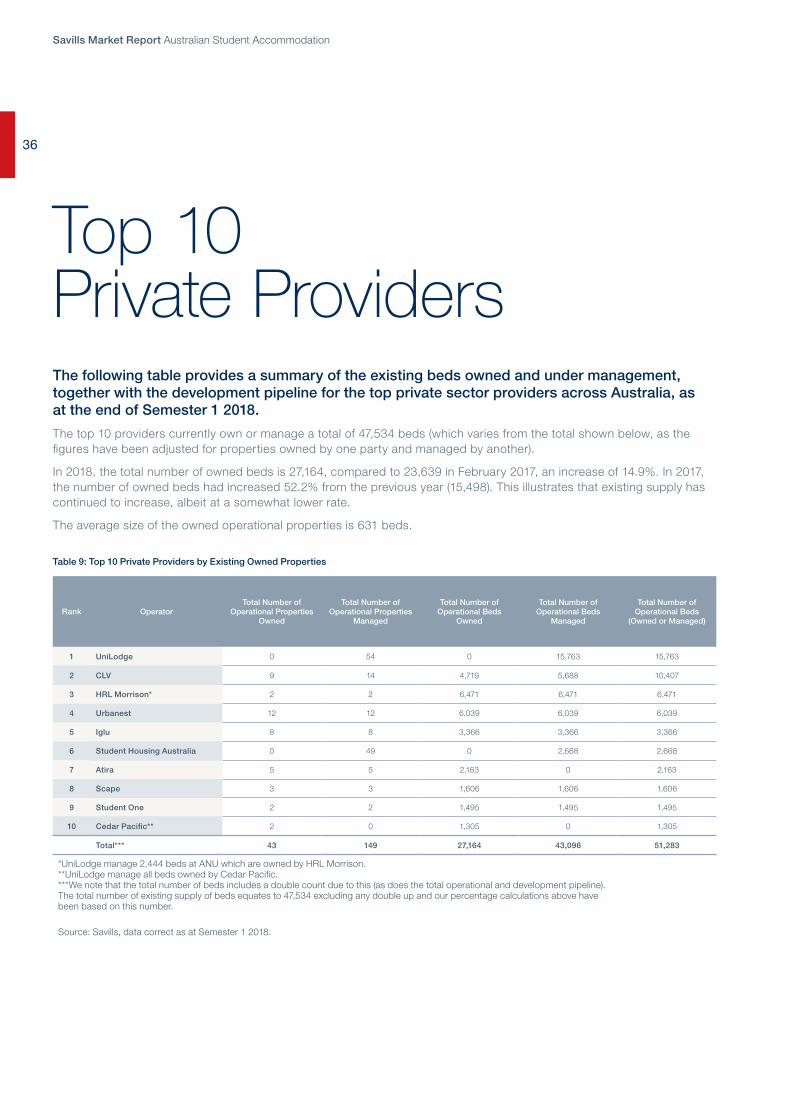
The following table provides a summary of the existing beds owned and under management, together with the development pipeline for the top private sector providers across Australia, as at the end of Semester 1 2018.
The top 10 providers currently own or manage a total of 47,534 beds (which varies from the total shown below, as the figures have been adjusted for properties owned by one party and managed by another).
In 2018, the total number of owned beds is 27,164, compared to 23,639 in February 2017, an increase of 14.9%. In 2017, the number of owned beds had increased 52.2% from the previous year (15,498). This illustrates that existing supply has continued to increase, albeit at a somewhat lower rate.
The average size of the owned operational properties is 631 beds.
Table 9: Top 10 Private Providers by Existing Owned Properties
36
Rank OperatorTotal Number of
Operational Beds (Owned or Managed)
Total Number of Properties in Planning or Under Construction
Total Number of Beds in Planning or Under
Construction
Total Number of Properties Owned (Operational and in
Development Pipeline)
Total by Number of Beds (Operational
and in Development Pipeline)
1 UniLodge 15,763 18 9,375 0 25,138
2 CLV 10,407 0 0 9 10,407
3 Scape 1,606 11 6,665 14 8,271
4 Urbanest 6,039 3 1,344 15 7,383
5 HRL Morrison* 6,471 1 450 3 6,921
6 Atira 2,163 4 2,869 9 5,032
7 Iglu 3,366 5 1,420 13 4,786
8 Wee Hur Holdings Ltd** 450 4 4,041 5 4,491
9 GSA Group 345 6 3,919 7 4,264
10 Cedar Pacific*** 1,305 3 1,905 5 3,210
Total**** 47,915 55 31,988 80 79,903
*UniLodge manage 2,444 beds at ANU which are owned by HRL Morrison and have 425 beds under construction also owned by HRL Morrison. **UniLodge manage 450 beds at Park Central, Woolloongabba which are owned by Wee Hur Holdings Ltd, and will also manage the second phase of this building (a total of 1,578, as well as future assets in Adelaide (772) and Melbourne).***UniLodge manage all beds owned by Cedar Pacific existing and development pipeline.****We note that the total number of beds includes a double count due to this (as does the total operational and development pipeline).
Source: Savills, data correct as at Semester 1 2018.
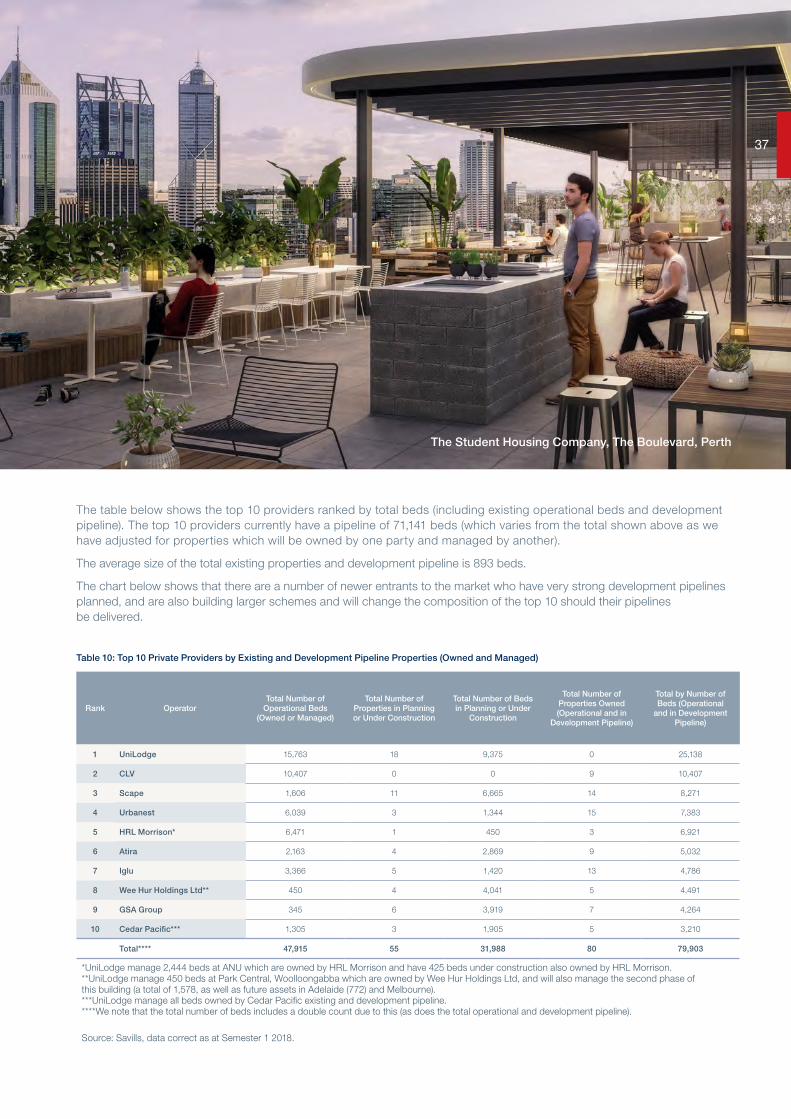
The table below shows the top 10 providers ranked by total beds (including existing operational beds and development pipeline). The top 10 providers currently have a pipeline of 71,141 beds (which varies from the total shown above as we have adjusted for properties which will be owned by one party and managed by another).
The average size of the total existing properties and development pipeline is 893 beds.
The chart below shows that there are a number of newer entrants to the market who have very strong development pipelines planned, and are also building larger schemes and will change the composition of the top 10 should their pipelines be delivered.
The Student Housing Company, The Boulevard, Perth
Table 10: Top 10 Private Providers by Existing and Development Pipeline Properties (Owned and Managed)
37
Savills Market Report Australian Student Accommodation
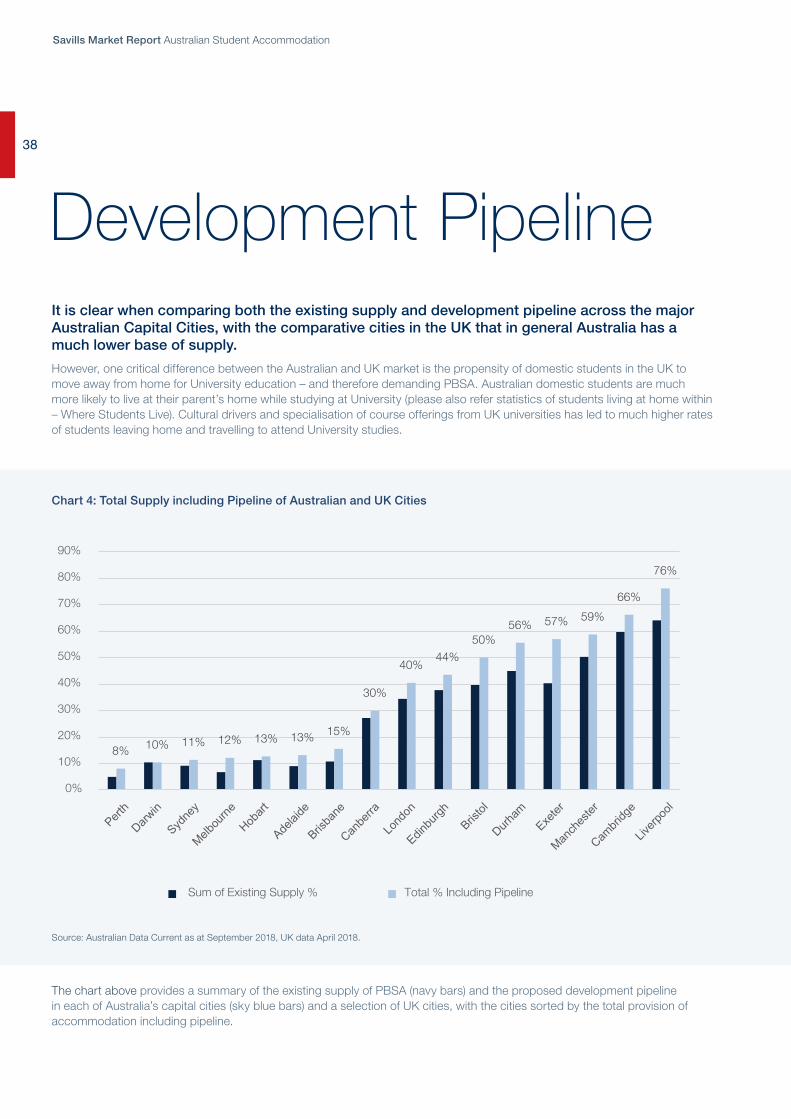
It is clear when comparing both the existing supply and development pipeline across the major Australian Capital Cities, with the comparative cities in the UK that in general Australia has a much lower base of supply.
However, one critical difference between the Australian and UK market is the propensity of domestic students in the UK to move away from home for University education – and therefore demanding PBSA. Australian domestic students are much more likely to live at their parent’s home while studying at University (please also refer statistics of students living at home within – Where Students Live). Cultural drivers and specialisation of course offerings from UK universities has led to much higher rates of students leaving home and travelling to attend University studies.
Chart 4: Total Supply including Pipeline of Australian and UK Cities
Source: Australian Data Current as at September 2018, UK data April 2018.
The chart above provides a summary of the existing supply of PBSA (navy bars) and the proposed development pipeline in each of Australia’s capital cities (sky blue bars) and a selection of UK cities, with the cities sorted by the total provision of accommodation including pipeline.
Development Pipeline38
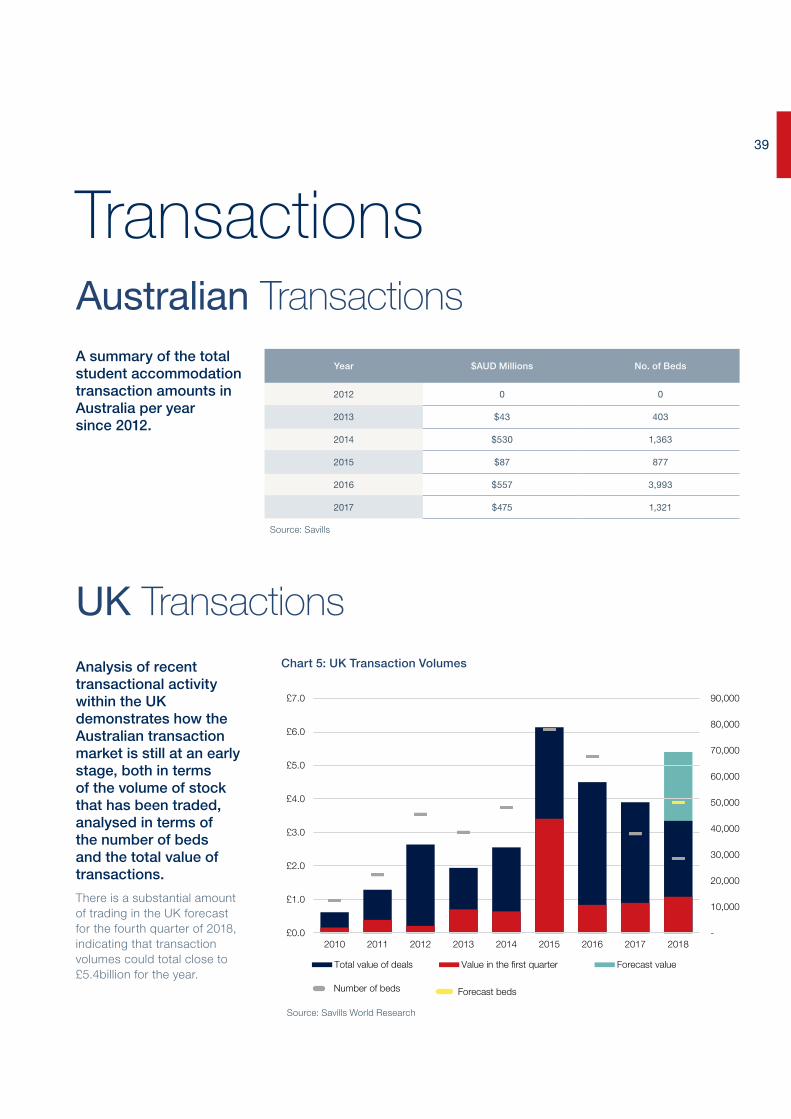
Transactions
A summary of the total student accommodation transaction amounts in Australia per year since 2012.
Year $AUD Millions No. of Beds
2012 0 0
2013 $43 403
2014 $530 1,363
2015 $87 877
2016 $557 3,993
2017 $475 1,321
Source: Savills
UK Transactions
Australian Transactions
Chart 5: UK Transaction Volumes
Source: Savills World Research
Analysis of recent transactional activity within the UK demonstrates how the Australian transaction market is still at an early stage, both in terms of the volume of stock that has been traded, analysed in terms of the number of beds and the total value of transactions.
There is a substantial amount of trading in the UK forecast for the fourth quarter of 2018, indicating that transaction volumes could total close to £5.4billion for the year.
39
Savills Market Report Australian Student Accommodation
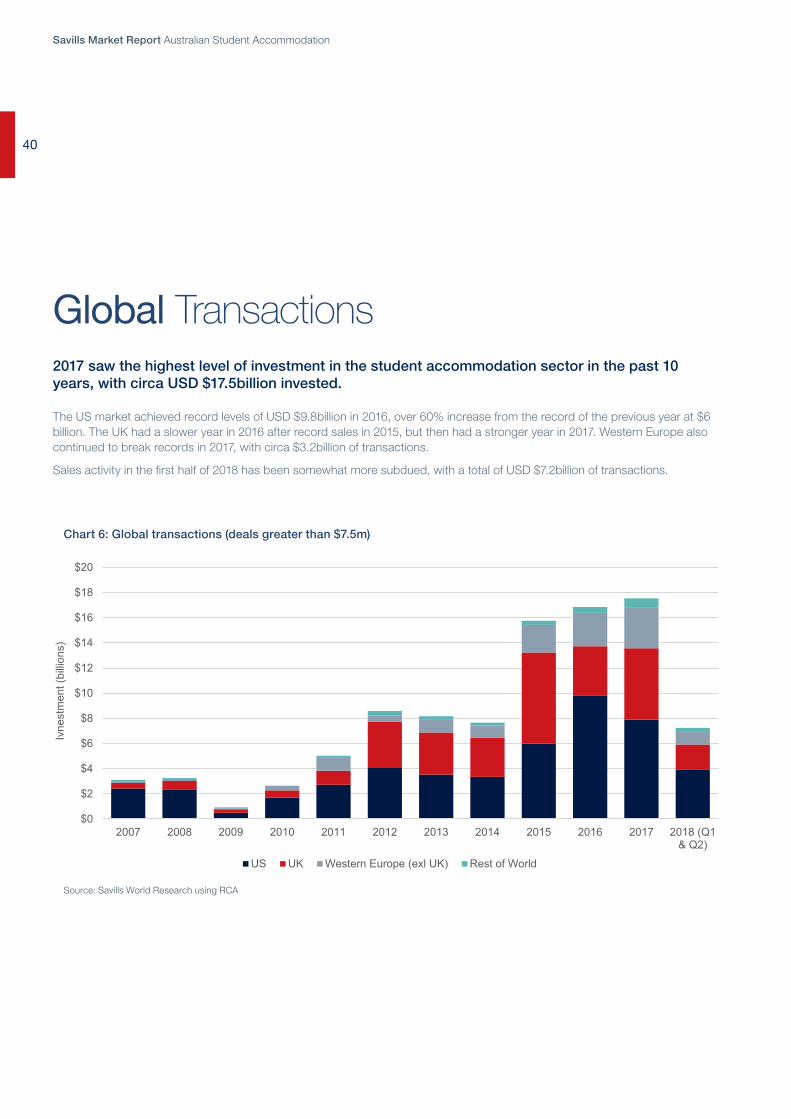
Global Transactions2017 saw the highest level of investment in the student accommodation sector in the past 10 years, with circa USD $17.5billion invested.
The US market achieved record levels of USD $9.8billion in 2016, over 60% increase from the record of the previous year at $6 billion. The UK had a slower year in 2016 after record sales in 2015, but then had a stronger year in 2017. Western Europe also continued to break records in 2017, with circa $3.2billion of transactions.
Sales activity in the first half of 2018 has been somewhat more subdued, with a total of USD $7.2billion of transactions.
Chart 6: Global transactions (deals greater than $7.5m)
Source: Savills World Research using RCA
40
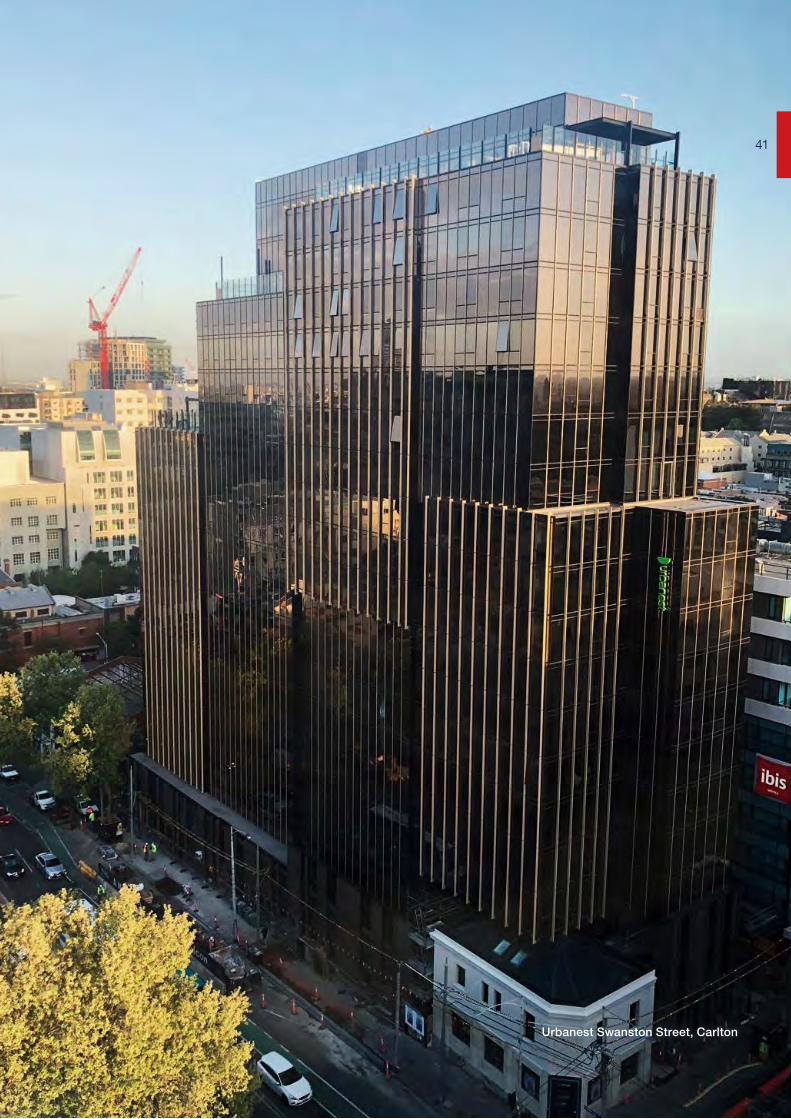
Urbanest Swanston Street, Carlton
4141

Savills Market Report Australian Student Accommodation
YieldsCurrent IndicativeInternational Yields
This table provides an indication of Net Initial Yields for prime student accommodation investments across several countries with emerging and established markets, as at September 2018.
Australia
Net Initial Yields in Australia have remained relatively static throughout the past 12 months, primarily due to the limited amount of transactional evidence.
There is strong sentiment to suggest that yields are contracting, given the weight of capital that has entered the market and also the spread of current yields to the 10-year bond rate, compared to more mature transaction markets.
This table indicates the current net initial yields for Australia in 2018.
Typical prime initial yield
Australia 6.75%
Germany 3.80%
Spain 5.25%
USA 5.91%
Netherlands 4.75%
France 4.25%
UK 4.30%
Source: Savills World Research
2017 Yields Direct-Let
SydneyPrime 5.75% - 6.25%
Secondary 6.50% - 7.00%
MelbournePrime 6.25% - 6.75%
Secondary 7.00% - 7.75%
BrisbanePrime 7.25% - 7.75%
Secondary 8.00% - 8.50%
Adelaide / PerthPrime 7.50% - 8.25%
Secondary 8.50% - 9.00%
Other Metropolitan AreasPrime 7.50% - 8.25%
Secondary 8.50% - 9.00%
Source: Savills
42
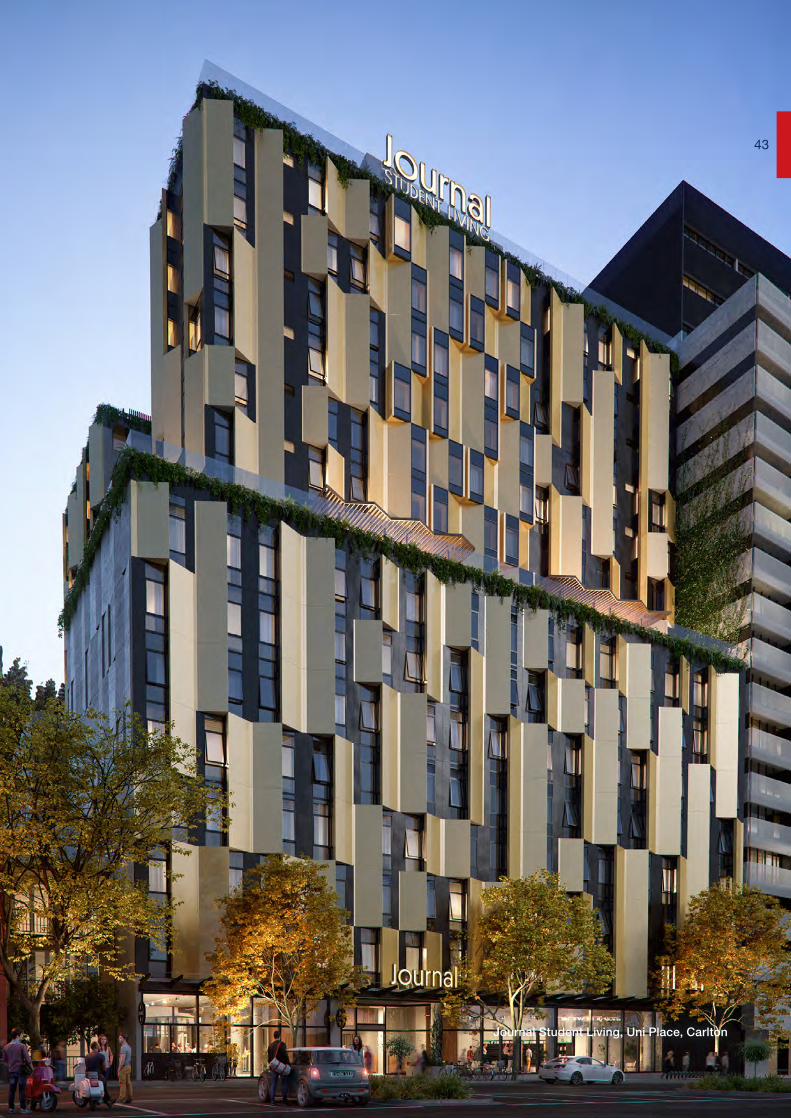
Journal Student Living, Uni Place, Carlton
43
Savills Market Report Australian Student Accommodation
400,000
Full Time students
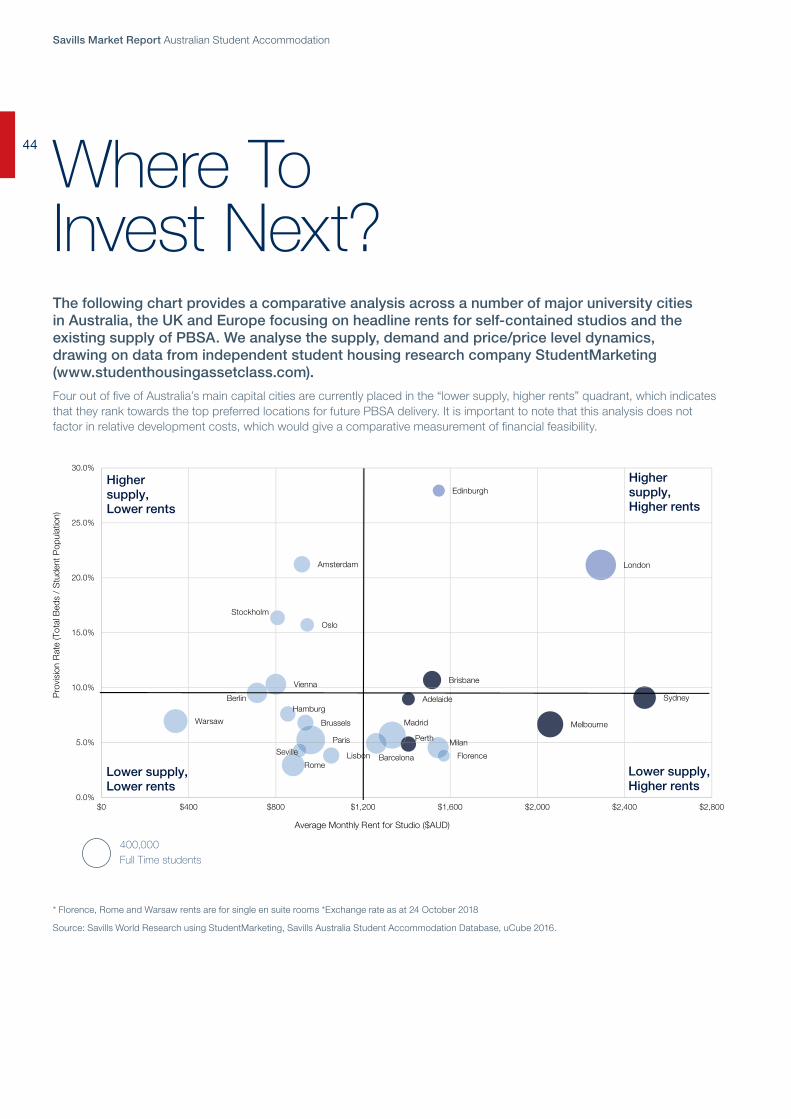
* Florence, Rome and Warsaw rents are for single en suite rooms *Exchange rate as at 24 October 2018
Source: Savills World Research using StudentMarketing, Savills Australia Student Accommodation Database, uCube 2016.
Where To Invest Next?The following chart provides a comparative analysis across a number of major university cities in Australia, the UK and Europe focusing on headline rents for self-contained studios and the existing supply of PBSA. We analyse the supply, demand and price/price level dynamics, drawing on data from independent student housing research company StudentMarketing (www.studenthousingassetclass.com).
Four out of five of Australia’s main capital cities are currently placed in the “lower supply, higher rents” quadrant, which indicates that they rank towards the top preferred locations for future PBSA delivery. It is important to note that this analysis does not factor in relative development costs, which would give a comparative measurement of financial feasibility.
Sydney
Melbourne
Brisbane
Adelaide
Perth
Edinburgh
Amsterdam London
Stockholm
Oslo
Vienna
BerlinHamburg
Warsaw Brussels Madrid
Paris
Barcelona
MilanSeville Lisbon Florence
Rome
0.0%
5.0%
10.0%
15.0%
20.0%
25.0%
30.0%
$0 $400 $800 $1,200 $1,600 $2,000 $2,400 $2,800
Pro
visi
on R
ate
(Tot
al B
eds
/ S
tude
nt P
opul
atio
n)
Average Monthly Rent for Studio ($AUD)
Higher supply,Lower rents
Higher supply,Higher rents
Lower supply,Lower rents
Lower supply,Higher rents
44
Can PBSA and Co-Living Co-Exist?
As the supply of new PBSA is accelerating in many of Australia’s major capital cities, the increasing influence of Gen Y’s demand for higher quality rental accommodation is creating opportunities for developers to provide hybrid co-living developments.
Co-living, Build to Rent (BTR) or multi-family accommodation, which are established institutional investment classes in the US and more recently the UK, are now gaining momentum in Australia as an emerging asset class. The recently completed UKO Stanmore is an example of a communal accommodation option available in Sydney, which has been delivered under the new generation boarding house planning designation.
Future government policy will be pivotal in attracting ongoing investment that will deliver sustainable long-term returns. Australian lawmakers should be mindful of passing legislation that may reduce the attractiveness of investments, or this country may run the risk of becoming less attractive to millennials and Gen Zs looking to study, live and work here.
The student accommodation sector, while targeting an alternative market, is not dissimilar to the co-living model and offers synergies that may allow future mixed co-living developments incorporating the student and non-student market.
The type of communal facilities designed, apartment mix and floor layouts will play pivotal roles in the success of these developments, ensuring there is a degree of separation between students and non-student residents, but ultimately offering a similar experience. A mixed co-living environment must maintain the present level of security and safety of the student body, provide segregated accommodation, and ensure the high level of resident experience is maintained, assuring partner institutions their students are not affected. Students would remain the core business of any site.
The successful design and operation of a mixed co-living development could provide many benefits to student accommodation providers and their investors, predominantly diversifying risk by increasing market pool and increasing length of lease terms. Incorporation of additional publicly available facilities such as cafes, bars, work spaces and convenience stores could complement current designs, creating an increasingly diversified community, while under the control of an experienced student accommodation operator.
Building design and security, while integral, are not the only considerations. A student accommodation provider would need to be cognisant of the added operational and legislative requirements to successfully manage a mixed-use development.
The propensity for flexible workspaces is increasing year on year, as can be seen by the emergence of companies such as WeWork. The Collective in the UK is also a good example of the increasing need for co-living communities, providing the same facilities as PBSA but targeting the non-student market. The Collective also provides flexible workspaces in separate locations. The synergies between PBSA and co-living communities are numerous, both offering all-inclusive rents, 24/7 staffing, communal spaces, event programs, high speed WIFI, and cleaning services. The hybrid addition of flexible working spaces into future PBSA developments along the lines of WeWork and The Collective would further enable the diversification of the PBSA market in Australia, providing a working, living, collaborative community, attracting current young professionals alongside future young professionals.
The combination of PBSA and co-living communities could act as a segue for investors into the wider institutional residential investment markets prior to any potential changes to government policy, such as taxation concessions. Furthermore, the student accommodation arena is becoming increasingly competitive and price sensitive. The need to offer flexible contracts has increased occupancy risk and provided students with more choice. A mixed co-living model, diversifying the risk, will stabilise the student accommodation industry in Australia, further enticing investment into the sector.
PBSA and Co-Living can co-exist and can complement each other - but design needs to be well planned, ensuring safety, community and inclusion, and ultimately creating a place to succeed.
Co-Living Diversification
45
Conal Newland Director
Student Accommodation +61 (0) 2 8215 8863 +61 (0) 422 406 611 [email protected]
savills.com.au