savannah river site dose reconstruction project - executive
TRANSCRIPT
SRS Dose Reconstruction Report August 2006
i
EXECUTIVE SUMMARY
1 Introduction
This report is the product of Phase III of the Savannah River Site (SRS) Dose Reconstruction Project. It estimates the radiation doses and associated cancer risks for hypothetical persons living near SRS and performing representative activities. SRS is a U.S. Department of Energy (DOE) facility that produced nuclear materials such as tritium and Pu-239 for national defense and other programs.
The SRS Dose Reconstruction Project examines the releases from the SRS for the 39-year period from its inception in 1954 to the end of 1992, when main production activities ceased. The Project is sponsored by the Radiation Studies Branch, National Center for Environmental Health, Centers for Disease Control and Prevention (CDC) of the U.S. Department of Health and Human Services. The Project is a study of the potential health risks to people exposed to chemicals and radioactive materials released to the environment resulting from historical SRS operations. However, this report only addresses radiation doses and risks.
1.1 Purpose
The original purpose of Phase III was to do screening calculations; after the study was underway the CDC and the Health Effects Subcommittee (HES) jointly decided to go ahead and estimate doses for hypothetical individuals. This phase of the Savannah River Site (SRS) Dose Reconstruction Project estimates the radiation doses and associated cancer risks for hypothetical persons living near SRS and performing representative activities. The purpose of this phase was 1) to determine if there was sufficient information available to make a preliminary dose assessment, 2) to perform a screening analysis to identify the significant pathways and radionuclides contributing to dose, and 3) provide preliminaryestimates of radiation doses and risks to members of seven hypothetical exposure scenarios.
1.2 Brief Summary of SRS Operations
SRS is located about 19 miles (32 km) south of Aiken, South Carolina, and about 22 miles (36 km) southeast of Augusta, Georgia. It borders the Savannah River for about 17 miles and comprises parts of Aiken, Barnwell, and Allendale Counties in southwestern South Carolina. Figure 1 shows the general location of SRS.
The SRS, a 300 square-mile site, was operated from 1954 to 1992, first by EI duPont de Nemours and Company (Dupont) for the U.S. Atomic Energy Commission (AEC), and later by Westinghouse Savannah River Company for DOE (1). SRS operated five reactors and two chemical separations operations and numerous laboratories and support facilities to produce and purify plutonium, tritium, and other radioactive isotopes. The primary mission was production of 239Pu and tritium. During the time of operation, radionuclides and chemicals were disposed of into the ground or released into surface waters and into the air. These releases potentially resulted in radioactive and chemical exposures to persons living near the site. By 1992, the production reactors had all ceased operation. Some separation processing and support facilities, waste management facilities, and environmental remediation facilities still operate.

SRS Dose Reconstruction Report August 2006
Figure 1 General Location of the SRS
1.3 CDC Phased Approach and Scope of Phase III
At the initiation of the SRS Dose Reconstruction Project in 1992, CDC designed the project to consist of five phases as summarized in XTable 1 X (2).
The design of the project ensured open public participation. Among other citizen outreach activities, the SRS Health Effects Subcommittee (SRSHES) was established to advise CDC on the health research and public health activities associated with SRS. An Advisory Committee to CDC constituted under the Federal Advisory Committee Act, the SRSHES is comprised of citizens selected to reflect the diversity of the communities impacted by SRS (3).
ii

SRS Dose Reconstruction Report August 2006
Phase I of the study was a search of SRS to find and copy documents and other records of potential value to the project. This effort was completed in 1995. An electronic document database was created to store information about the records.
Table 1 Phases of SRS Dose Reconstruction Project
Phases Description
Phase I A systematic review of available documents at SRS and the development of a document database.
Phases II Initial source-term development and pathway analysis. This work consisted of estimating the amount of radioactive materials and toxic chemicals released to the environment from the SRS from 1954 to 1992.
Phase III Screening dose and exposure calculations.
Phase IV Developing methods for assessing environmental pathways and environmental doses.
Phase V Calculation of environmental exposure and doses.
Phase II of the study began in October 1995 to develop an estimate of the releases of the most significant radionuclides and chemicals from various facilities at SRS from 1954 to 1992. This estimation included a list of radioactive materials and chemicals that were used or produced at the site as well as descriptions of key processes at SRS. In addition, the results of past SRS environmental monitoring programs were reviewed. In September 1998, CDC provided the results of the Phase II study to outside reviewers, including the National Academy of Science and the SRSHES. After considering and addressing comments, the final Phase II report was produced in April 2001 (4).
CDC’s original plan for the Phase III effort was to use “scenarios provided by CDC and a screening protocol approved by CDC” and to “perform screening calculations to determine which radionuclide releases from the Savannah River Site may have biological significance.” The implication was that those radionuclides not screened out as unimportant would warrant further analysis (in Phases IV and V) primarily to estimate doses. The screening analysis would have used conservative modeling assumptions, and the main focus of the analysis would have been the determination of radionuclides and exposure pathways for further study in Phases III and IV.
However, CDC recognized that the process set forth in XTable 1 X would take considerable time, perhaps several years, to complete through Phase V. During this time, questions would remain unanswered about the possible public health consequences from past SRS operations. In addition, there was concern about the availability of the funding required to complete the remaining phases given other competing priorities. Consequently, in late 2002 and early 2003, CDC expanded the scope of the Phase III effort to include a more detailed estimation of representative doses and risks using the CDC scenarios. In effect, the expanded scope went beyond the previously defined Phase III scope, but stopped short of the detailed modeling of environmental pathways contemplated for a Phase IV study. The CDC scenarios included several hypothetical sets of individuals performing realistic, but in some cases extreme, activities on and near the site. Each hypothetical scenario represented a family that lived, worked, and engaged in recreational activities in the vicinity of SRS, and raised children born during years of large SRS releases of radioactive material to the environment. In addition, the scope of Phase III was expanded to include evaluation of uncertainty in the calculated doses, in order to establish confidence intervals for the dose estimates.
iii

SRS Dose Reconstruction Report August 2006
1.4 Phase II Release Estimates
Estimates of release into the atmosphere and surface water, as developed in the Phase II study, were to be used as the basic source term for Phase III. Phase III uses from Phase II both the identification of important radionuclides and the detailed source terms for radionuclides determined to be especially important. This determination was accomplished by a two-step screening analysis (2). For completeness, the radionuclides meeting the less stringent Level 1 screening criterion were retained for study in Phase III. For radionuclides meeting the more stringent Level 2, Phase II developed detailed source terms.
Because the scenarios specified for study in Phase III had important space and time characteristics, the source terms used in Phase III needed to represent variations in space and time. Because some of the source term data in Phase II tended to be aggregated in space, or time, or both the detailed source terms were not used directly. Instead the adjustments made to develop detailed source terms in Phase II were applied to the detailed historical data on which Phase II was based.
1.5 Scenario Descriptions
In addition to the six exposure scenarios originally proposed by CDC (7), a seventh was added to provide more complete geographical representation around the SRS, with the concurrence of the CDC and the SRSHES. In each scenario, exposure locations were identified to represent where family members lived, worked, attended school, engaged in recreational activities, where their food was grown, and other activities. For this study a total of 12 exposure locations were used to model doses. Exposures to radionuclides were modeled at ten locations for radionuclides released to the air and two locations for radionuclides released to water. Depending upon the scenario specifications, a given receptor might be exposed at 1 to 6 exposure locations.
The exposure locations assumed for the seven exposure scenarios are shown in XFigure 2X. XTable 2 X
summarizes the exposure locations for contamination released into the air; XTable 3 X summarizes the exposure locations for contamination released to surface water. The Lower Three Runs Creek exposure location is in the vicinity of Martin, South Carolina. The downstream Savannah River exposure location is representative of multiple possible locations downstream from the site.
It was assumed that each of the seven hypothetical families had the same composition:
• A male who was an adult (over age 18) in 1954. • A female who was an adult (over age 18) in 1954. • A male child born in 1955. • A male child born in 1964.
This family composition facilitated comparisons based on birth year and gender; the child born in 1955 was exposed to relatively large releases of radionuclides to the environment during the early years of SRS operation, while the child born in 1964 was not. Male children were modeled because males receive slightly larger radiation exposures for some pathways than females (e.g., males eat more than females) and therefore provide more conservative estimates of doses and risks. It was desirable to make both children the same gender in order to allow direct comparison of the effect of being born at different times.
iv

SRS Dose Reconstruction Report August 2006
Figure 2 Exposure Locations for Exposure Scenarios
v
Gira
rd,
Way
ne
Mar
tin,
Aug
us
Will
ist
SRS
O
Bar
nw
Alle
nd
Jack
s
New
El
† Rural Family One All except high schoolP X
High school X
Rural Family Two All activities X
Urban/Suburban All except employment X Family Employment X
Migrant Worker All activities X Family
Delivery Person All except those below: X Family Employment X
Employment X
Church, grocery X (partial), swimming, boating, hunting, fishing
All except employment XOutdoors Person Family Employment X
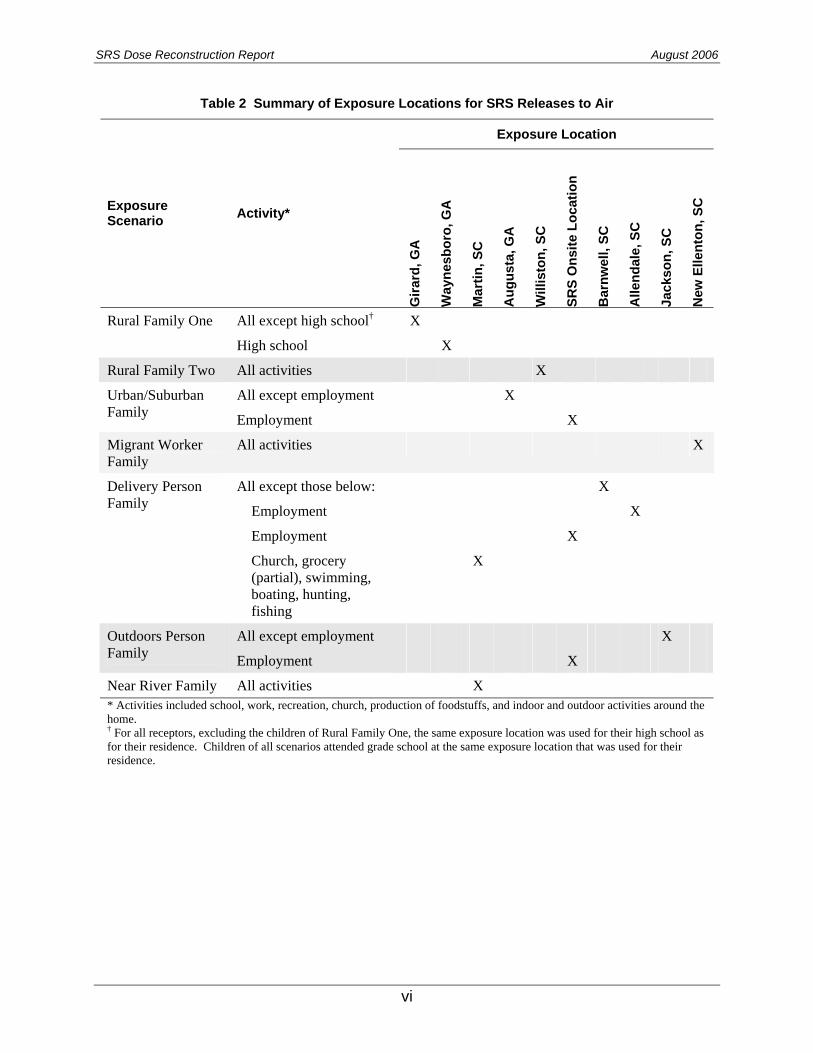
All activities XNear River Family * Activities included school, work, recreation, church, production of foodstuffs, and indoor and outdoor activities around the home. † For all receptors, excluding the children of Rural Family One, the same exposure location was used for their high school as for their residence. Children of all scenarios attended grade school at the same exposure location that was used for their residence.
Table 2 Summary of Exposure Locations for SRS Releases to Air
Exposure Location
Exposure Scenario Activity*
GA
sbor
o, G
A
SC
ta, G
A
on, S
C
nsite
Loc
atio
n
ell,
SC
ale,
SC
on, S
C
lent
on, S
C
SRS Dose Reconstruction Report August 2006
P
P P
vi
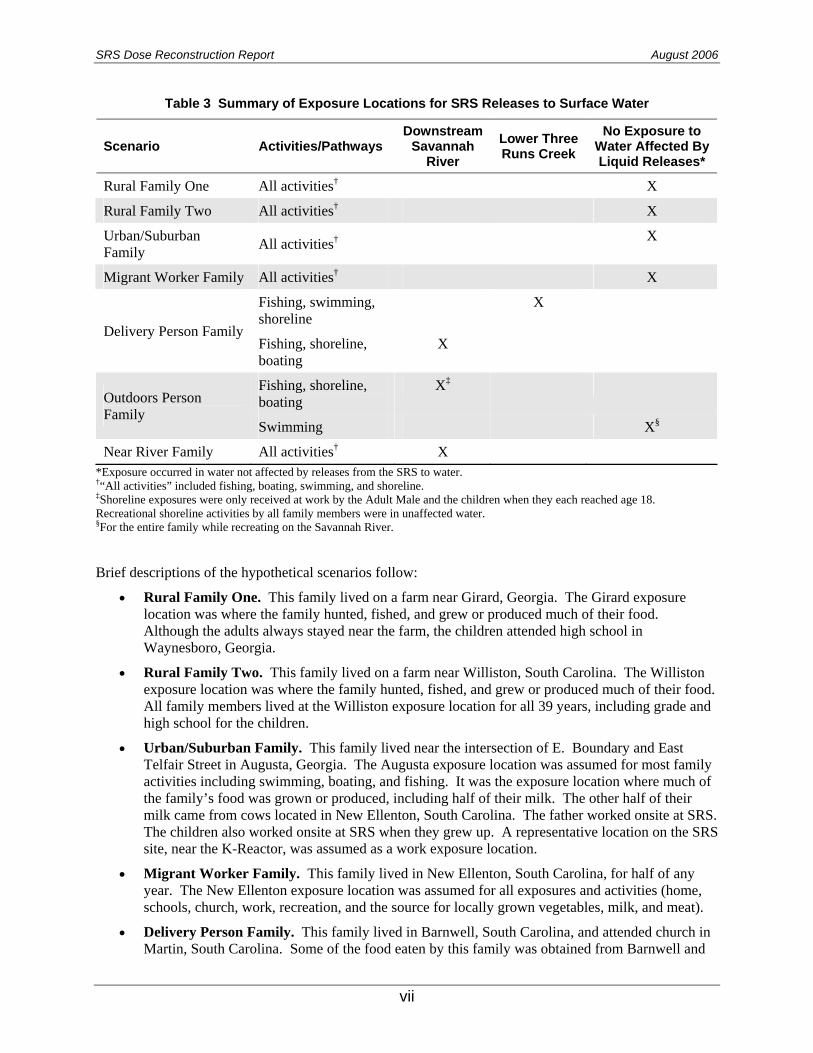
Table 3 Summary of Exposure Locations for SRS Releases to Surface Water
Downstream Lower Three No Exposure to Scenario Activities/Pathways Savannah Runs Creek Water Affected By
River Liquid Releases*
Rural Family One All activities P
† P X
Rural Family Two All activitiesP
† P X
Urban/Suburban † X Family
All activitiesP
Delivery Person Family shoreline
Migrant Worker Family All activitiesP
† P X
Fishing, swimming, X
Fishing, shoreline, X boating
Fishing, shoreline, XP
boating ‡
P
Outdoors Person Family
Swimming XP
§ P
Near River Family All activitiesP
† P X
*Exposure occurred in water not affected by releases from the SRS to water. †“All activities” included fishing, boating, swimming, and shoreline. ‡Shoreline exposures were only received at work by the Adult Male and the children when they each reached age 18. Recreational shoreline activities by all family members were in unaffected water. §For the entire family while recreating on the Savannah River.
SRS Dose Reconstruction Report August 2006
P
P P
P P
P P
Brief descriptions of the hypothetical scenarios follow:
• Rural Family One. This family lived on a farm near Girard, Georgia. The Girard exposure location was where the family hunted, fished, and grew or produced much of their food. Although the adults always stayed near the farm, the children attended high school in Waynesboro, Georgia.
• Rural Family Two. This family lived on a farm near Williston, South Carolina. The Williston exposure location was where the family hunted, fished, and grew or produced much of their food. All family members lived at the Williston exposure location for all 39 years, including grade and high school for the children.
• Urban/Suburban Family. This family lived near the intersection of E. Boundary and East Telfair Street in Augusta, Georgia. The Augusta exposure location was assumed for most family activities including swimming, boating, and fishing. It was the exposure location where much of the family’s food was grown or produced, including half of their milk. The other half of their milk came from cows located in New Ellenton, South Carolina. The father worked onsite at SRS. The children also worked onsite at SRS when they grew up. A representative location on the SRS site, near the K-Reactor, was assumed as a work exposure location.
• Migrant Worker Family. This family lived in New Ellenton, South Carolina, for half of any year. The New Ellenton exposure location was assumed for all exposures and activities (home, schools, church, work, recreation, and the source for locally grown vegetables, milk, and meat).
• Delivery Person Family. This family lived in Barnwell, South Carolina, and attended church in Martin, South Carolina. Some of the food eaten by this family was obtained from Barnwell and
vii

SRS Dose Reconstruction Report August 2006
some from Martin. The father worked in Allendale, South Carolina, and onsite at SRS. (So did the children when they grew up.) A representative location on the SRS site, near the K-Reactor, was assumed as a work exposure location. The father hunted deer and wild fowl near Martin. The family engaged in recreation on the shore of Lower Three Runs Creek (at Martin) and on the shore of the Savannah River below its confluence with Lower Three Runs Creek. The family boated on, and ate fish from, the Savannah River at this same exposure location. The family also ate fish that were caught in Lower Three Runs Creek.
• Outdoors Person Family. This family lived in Jackson, South Carolina, where the family also attended church and the children went to grade and high school. Much of the food eaten by the family was grown in Jackson. The father worked and hunted on the SRS site (as did the children when they grew up). The same location on the SRS site, near the K-Reactor, was assumed for the work exposure location and the hunting exposure location. The father boated on the Savannah River while working and with his family for recreation. The family swam and spent time along the shoreline at the Jackson Boat Ramp, which is upstream of the SRS discharge to the Savannah River. All family members ate fish that were caught in the Savannah River below its confluence with Lower Three Runs Creek.
• Near River Family. This family lived in Martin, South Carolina. The Martin exposure location was assumed for all activities (home, schools, church, work, recreation, source of milk, and the source of locally grown vegetables). In addition, the family boated in, and ate fish from, the Savannah River below its confluence with Lower Three Runs Creek.
2 Conclusions
Primary conclusions address the main objective of the study – estimates of doses and risks. Secondary conclusions relate to how the doses arose, including the important radionuclides, pathways, and years of release.
2.1 Primary Conclusions
Calculated doses and risks to the hypothetical receptors summed over the 39-year period studied appear to be small. The largest point estimate dose was 9.4 mSv (0.94 rem) for the Outdoor Family Child born in 1955; the corresponding risk of cancer incidence is 0.10% and the corresponding risk of cancer fatality is 0.024%. By way of comparison, the annual average radiation exposure for a member of the U.S. population is about 3.6 mSv (5), mainly from naturally occurring sources of radiation and medical sources (e.g., x rays). An annual background dose of 3.6 mSv over a period of 39 years would produce a dose of 140 mSv (14 rem).
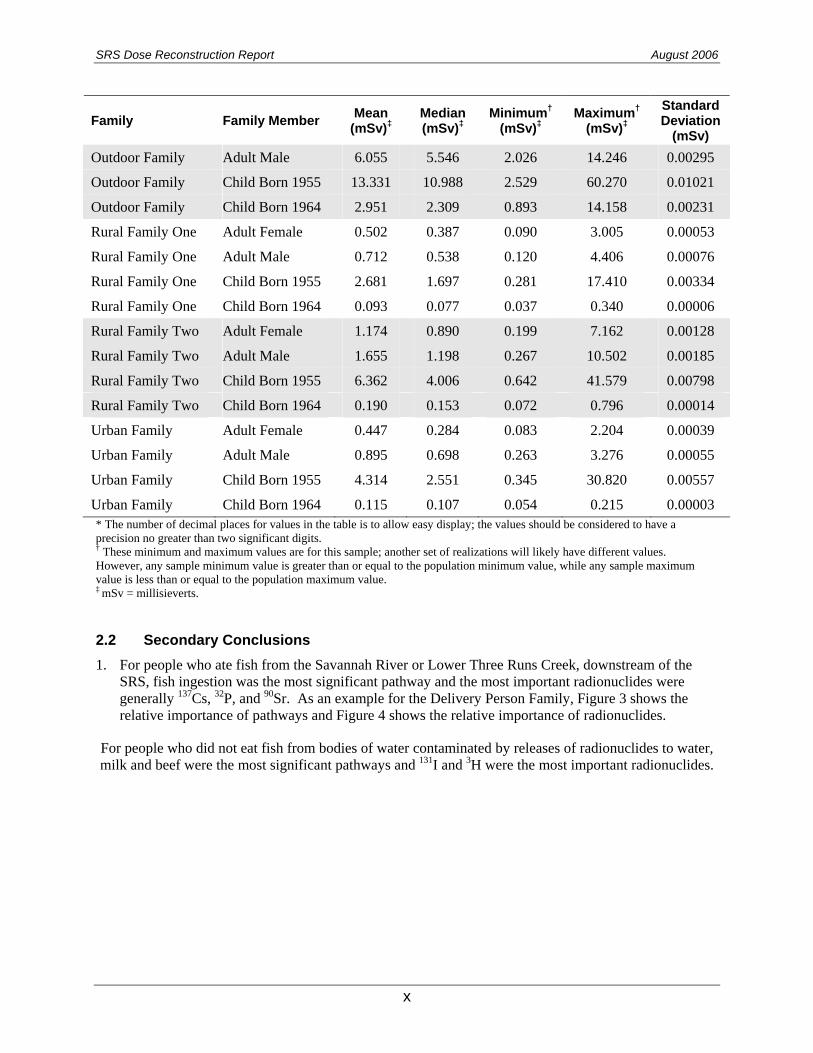
Although estimated doses (and the risks of cancer incidence) could be higher or lower when uncertainties in variables were considered, these differences are not sufficient to change this conclusion. For example, when uncertainties were considered, the Outdoor Family Child born in 1955 received the largest mean dose of 13 mSv (1.3 rem) and the largest median dose of 11 mSv (1.1 rem). Observation of extreme values of dose, in this case representing the highest and lowest 2.5% of doses, illustrates the variation in estimated doses; for the same receptor the maximum dose was 60.3 mSv (6 rem) and the minimum dose was 2.53 mSv (0.25 rem). XTable 4 X summarizes point estimate doses for all 28 hypothetical receptors modeled. Note that the first four scenarios listed were exposed only to air releases of radionuclides, while the last three scenarios were exposed to both air and water releases. XTable 5 X summarizes the uncertainty analysis results, which includes the mean, median, minimum, and maximum doses estimated. Note that the means and medians of the dose are generally larger than the corresponding point estimate dose. The confidence intervals calculated around the mean values of doses were relatively small; although these
viii

SRS Dose Reconstruction Report August 2006
intervals are not displayed, the relative small size of the standard deviations shown in XTable 5 X indicates that the confidence intervals are narrow.
Rural Family One Air 0.30 0.42 1.6 0.072
Rural Family Two Air 0.70 0.97 3.8 0.14
Urban/Suburban Family Air 0.33 0.73 2.7 0.11
Near Water Family
Water 1.8 1.8 1.4 1.7 All 2.1 2.2 3.1 1.8
Migrant Worker Family
Water 5.7 5.7 3.1 2.0
Outdoors Person Family Air 1.6 2.5 8.3 0.36
Air 0.45 0.62 2.2 0.083
Delivery Person Family Air
All
0.40
6.1
0.57
6.3
2.1
5.2
0.12
2.1
Water All
1.5 3.0
1.7 4.2
1.2 9.4
1.5 1.8
Air 0.31 0.42 1.7 0.088
Table 4 39-Year Point Estimate Effective Dose (mSv) for Each Member of Each Scenario
Adult Child Born Child BornScenario Pathways Female Adult Male in 1955 in 1964
T T
T T
T T
T T
T T
T T
T T
T T
T T
T T
T T
T T
Family Family Member Mean (mSv) P
‡ P
Median (mSv) P
‡ P
MinimumP
† P
(mSv) P
‡ P
MaximumP
† P
(mSv) P
‡ P
Standard Deviation
(mSv) 2 9.072 1.813 60.911 0.01223
1 9.281 1.737 61.183 0.01226
4 7.993 1.767 35.010 0.00776
3.159 0.712 15.146 0.00373
Delivery Family T Adult FemaleT 12.81
Delivery Family T Adult MaleT 13.00
Delivery Family T Child Born 1955 T 10.16
Delivery Family T Child Born 1964 T 4.498
Migrant Family T Adult FemaleT 0.793
Migrant Family T Adult MaleT 1.117
Migrant Family T Child Born 1955 T 3.676
Migrant Family T Child Born 1964 T 0.127
Near Water FamilyT Adult FemaleT 3.431
Near Water FamilyT Adult MaleT 3.574
Near Water FamilyT Child Born 1955 T 4.815
Near Water FamilyT Child Born 1964 T 2.850
Outdoor Family T Adult FemaleT 4.687
0.562 0.138 4.615 0.00090
0.756 0.184 6.770 0.00129
2.489 0.417 24.269 0.00445
0.093 0.043 0.732 0.00013
2.738 1.138 9.896 0.00204
2.929 1.183 10.084 0.00206
4.311 1.293 18.333 0.00303
2.290 0.867 14.090 0.00231
4.263 1.272 11.751 0.00246
Table 5 Statistics on Total Effective Dose Equivalent for Different Receptors* -
T T
ix
† † Standard Mean Median MinimumP MaximumP
P P
Family Family Member (mSv)‡ P (mSv)‡
P (mSv)‡ P (mSv)‡
P
Deviation (mSv)
Outdoor Family T Adult MaleT 6.055 5.546 2.026 14.246 0.00295
Outdoor Family T Child Born 1955 T 13.331 10.988 2.529 60.270 0.01021
Outdoor Family T Child Born 1964 T 2.951 2.309 0.893 14.158 0.00231
Rural Family One T Adult FemaleT 0.502 0.387 0.090 3.005 0.00053
Rural Family One T Adult MaleT 0.712 0.538 0.120 4.406 0.00076
Rural Family One T Child Born 1955 T 2.681 1.697 0.281 17.410 0.00334
Rural Family One T Child Born 1964 T 0.093 0.077 0.037 0.340 0.00006
Rural Family Two T Adult FemaleT 1.174 0.890 0.199 7.162 0.00128
Rural Family Two T Adult MaleT 1.655 1.198 0.267 10.502 0.00185
Rural Family Two T Child Born 1955 T 6.362 4.006 0.642 41.579 0.00798
Rural Family Two T Child Born 1964 T 0.190 0.153 0.072 0.796 0.00014
Urban Family T Adult FemaleT 0.447 0.284 0.083 2.204 0.00039
Urban Family T Adult MaleT 0.895 0.698 0.263 3.276 0.00055
Urban Family T Child Born 1955 T 4.314 2.551 0.345 30.820 0.00557
Urban Family T Child Born 1964 T 0.115 0.107 0.054 0.215 0.00003 * The number of decimal places for values in the table is to allow easy display; the values should be considered to have a precision no greater than two significant digits. † These minimum and maximum values are for this sample; another set of realizations will likely have different values. However, any sample minimum value is greater than or equal to the population minimum value, while any sample maximum value is less than or equal to the population maximum value. ‡ mSv = millisieverts.
SRS Dose Reconstruction Report August 2006
P P
P P
T T
T T
T T
T T
T T
T T
T T
T T
T T
T T
T T
T T
T T
T T
T T
T
PT P
PT P
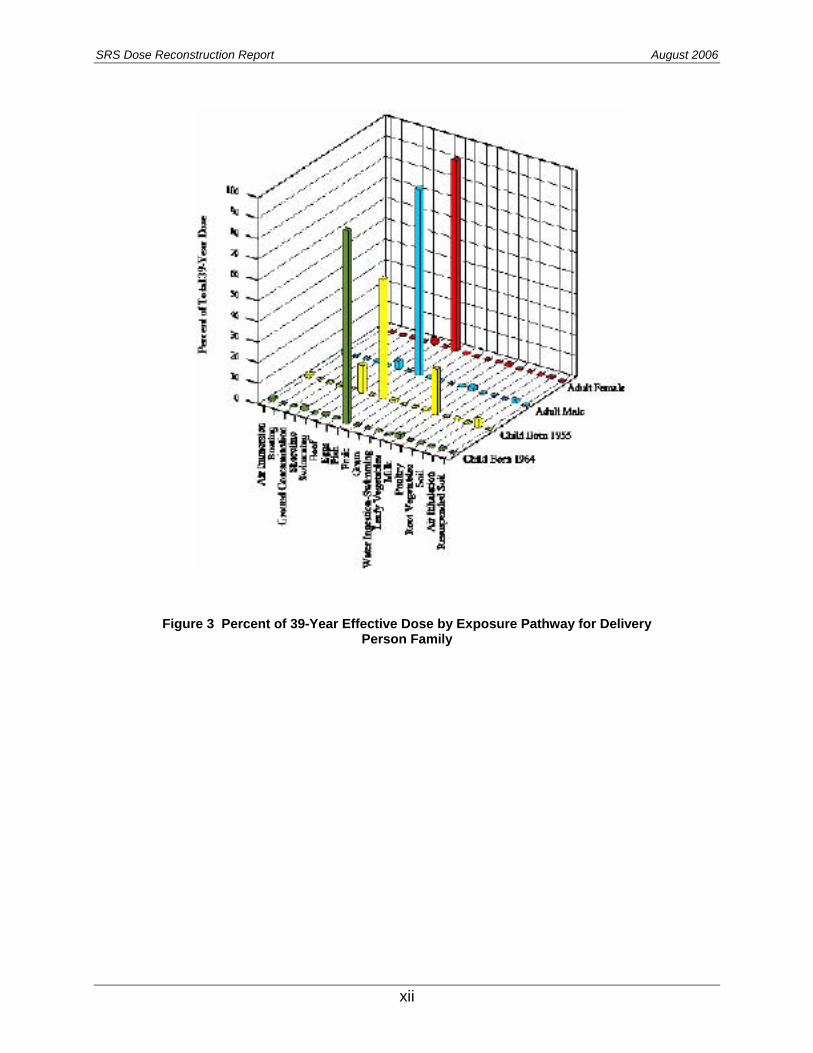
2.2 Secondary Conclusions 1. For people who ate fish from the Savannah River or Lower Three Runs Creek, downstream of the
SRS, fish ingestion was the most significant pathway and the most important radionuclides were137 32 90
P P Pgenerally P Cs, P P, and P Sr. As an example for the Delivery Person Family, XFigure 3X shows the relative importance of pathways and XFigure 4 X shows the relative importance of radionuclides.
For people who did not eat fish from bodies of water contaminated by releases of radionuclides to water, 131 3
P Pmilk and beef were the most significant pathways and P I and P H were the most important radionuclides.
x

SRS Dose Reconstruction Report August 2006
As an example for Rural Family One,
X
2. Figure 5 shows the relative importance of pathways and Figure 6 shows the relative importance of radionuclides.
3. Immersion in 41 P Ar was a generally small, but constant contributor to dose.
4. Larger doses occurred in years corresponding to larger releases from the SRS, especially releases of 131 P I; for the Adult Male, Adult Female, and Child born in 1955 a large fraction of the total dose was received during the years 1955-1961. As an example for Rural Family One, Figure 7 shows the relative importance of year of release.
5. There were significant differences in doses, pathway significance, and radionuclide significance between children born in 1955 and those born in 1964, because the children born in 1955 experienced the large iodine releases early in the site history while those born in 1964 did not.
6. Doses caused by ingesting fish from Lower Three Runs Creek were significantly higher than doses caused by ingesting fish from the Savannah River.
7. For air releases, the variations in air dispersion of radionuclides from the site generally produced a significant, but not overriding, variation in estimated doses; other factors in the analysis caused bigger dose impacts.
8. Consideration of uncertainty in the variables used to estimate doses could cause an estimated dose to be higher or lower than the corresponding point estimate result. The mean of the distribution of total dose for any receptor ranged between 2.15 to 1.07 times the corresponding point estimate dose; thus, the means of the uncertain doses were close to the corresponding point estimate values.
9. The use of hypothetical scenarios to demonstrate the interactions of a range of receptor behaviors
X X X X
P
P
X X
with the site and release characteristics was an effective analytical tool.
xi
SRS Dose Reconstruction Report August 2006
Figure 3 Percent of 39-Year Effective Dose by Exposure Pathway for DeliveryPerson Family
xii

SRS Dose Reconstruction Report August 2006
Figure 4 Percent of 39-Year Effective Dose by Dominant Isotopes for DeliveryPerson Family
Figure 5 Percent of 39-Year Effective Dose by Exposure Pathway for Rural FamilyOne
xiii

SRS Dose Reconstruction Report August 2006
Figure 6 Percent of 39-Year Effective Dose by Dominant Isotopes for Rural FamilyOne
Figure 7 Percent of 39-Year Effective Dose by Year for Rural Family One
xiv
3
SRS Dose Reconstruction Report August 2006
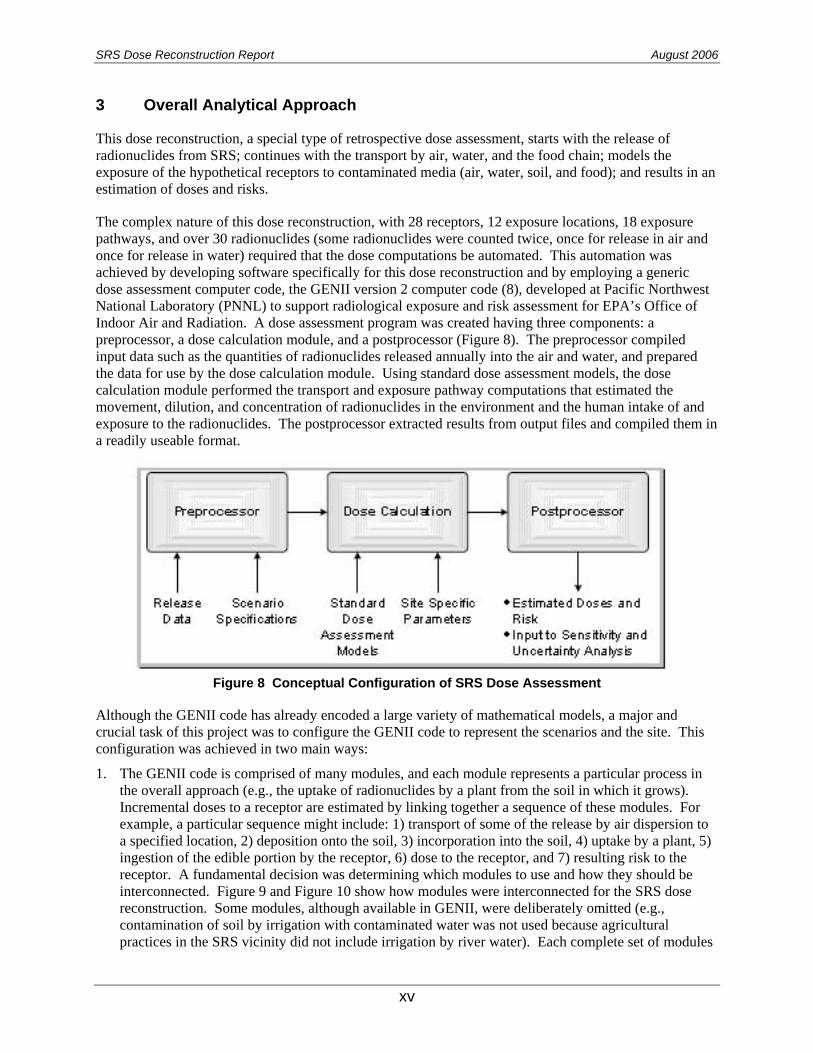
Overall Analytical Approach
This dose reconstruction, a special type of retrospective dose assessment, starts with the release of radionuclides from SRS; continues with the transport by air, water, and the food chain; models the exposure of the hypothetical receptors to contaminated media (air, water, soil, and food); and results in an estimation of doses and risks.
The complex nature of this dose reconstruction, with 28 receptors, 12 exposure locations, 18 exposure pathways, and over 30 radionuclides (some radionuclides were counted twice, once for release in air and once for release in water) required that the dose computations be automated. This automation was achieved by developing software specifically for this dose reconstruction and by employing a generic dose assessment computer code, the GENII version 2 computer code (8), developed at Pacific Northwest National Laboratory (PNNL) to support radiological exposure and risk assessment for EPA’s Office of Indoor Air and Radiation. A dose assessment program was created having three components: a preprocessor, a dose calculation module, and a postprocessor ( XFigure 8 X). The preprocessor compiled input data such as the quantities of radionuclides released annually into the air and water, and prepared the data for use by the dose calculation module. Using standard dose assessment models, the dose calculation module performed the transport and exposure pathway computations that estimated the movement, dilution, and concentration of radionuclides in the environment and the human intake of and exposure to the radionuclides. The postprocessor extracted results from output files and compiled them in a readily useable format.
Figure 8 Conceptual Configuration of SRS Dose Assessment
Although the GENII code has already encoded a large variety of mathematical models, a major and crucial task of this project was to configure the GENII code to represent the scenarios and the site. This configuration was achieved in two main ways:
1. The GENII code is comprised of many modules, and each module represents a particular process in the overall approach (e.g., the uptake of radionuclides by a plant from the soil in which it grows). Incremental doses to a receptor are estimated by linking together a sequence of these modules. For example, a particular sequence might include: 1) transport of some of the release by air dispersion to a specified location, 2) deposition onto the soil, 3) incorporation into the soil, 4) uptake by a plant, 5) ingestion of the edible portion by the receptor, 6) dose to the receptor, and 7) resulting risk to the receptor. A fundamental decision was determining which modules to use and how they should be interconnected. Figure 9 and Figure 10 show how modules were interconnected for the SRS dose reconstruction. Some modules, although available in GENII, were deliberately omitted (e.g., contamination of soil by irrigation with contaminated water was not used because agricultural practices in the SRS vicinity did not include irrigation by river water). Each complete set of modules
xv

SRS Dose Reconstruction Report August 2006
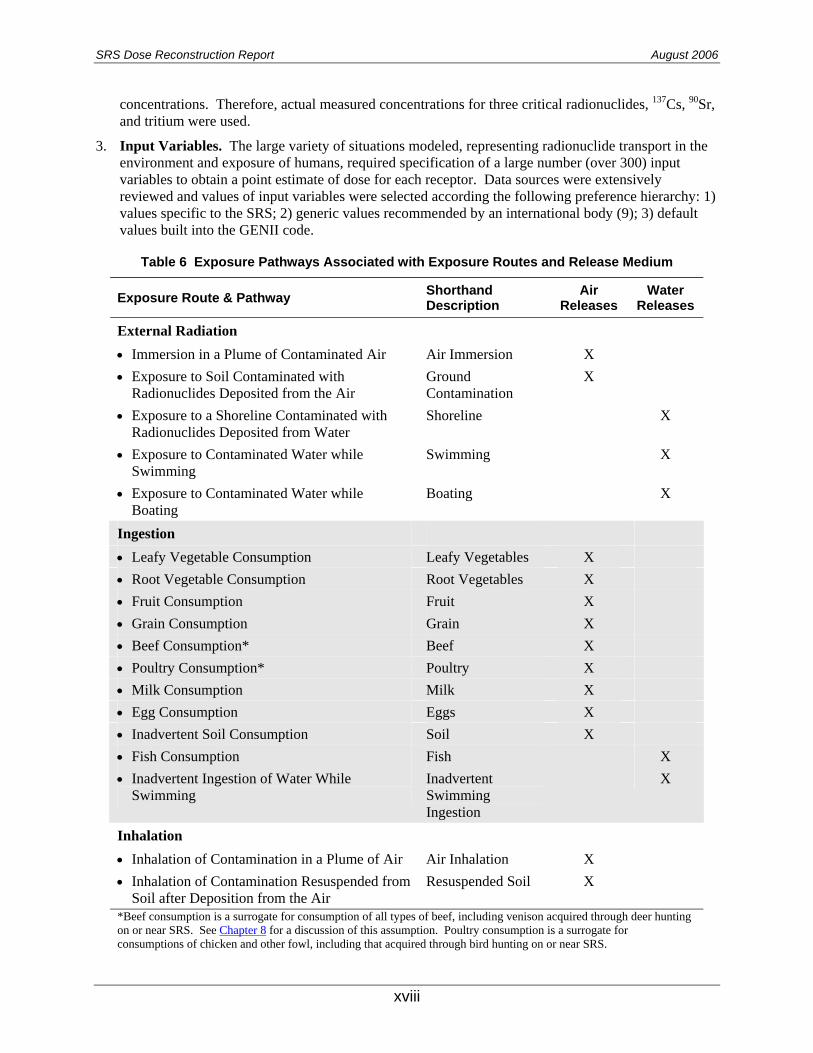
leading to a receptor dose has been termed “an exposure pathway”. A total of 18 different exposure pathways, shown in XTable 6 X, were used in this study: 13 for air releases and 5 for water releases.
2. Providing the number and location of places where radionuclides were released and receptors were exposed was essential in representing the site.
For this study it was necessary to consider: 1) the complex geometrical configuration of sources and receptors, 2) the time-varying characteristics of the releases and receptors, 3) the complex processes governing transport of radionuclides in air and water, and 4) the uncertainties in release data and other information. For this dose reconstruction, determination of the conceptual model required careful research and in some cases extensive analyses. These enabling analyses are incorporated in this report; several were supplied to the CDC and SRSHES as independent white papers for review and comment as the work was in progress.
xvi
SRS Dose Reconstruction Report August 2006
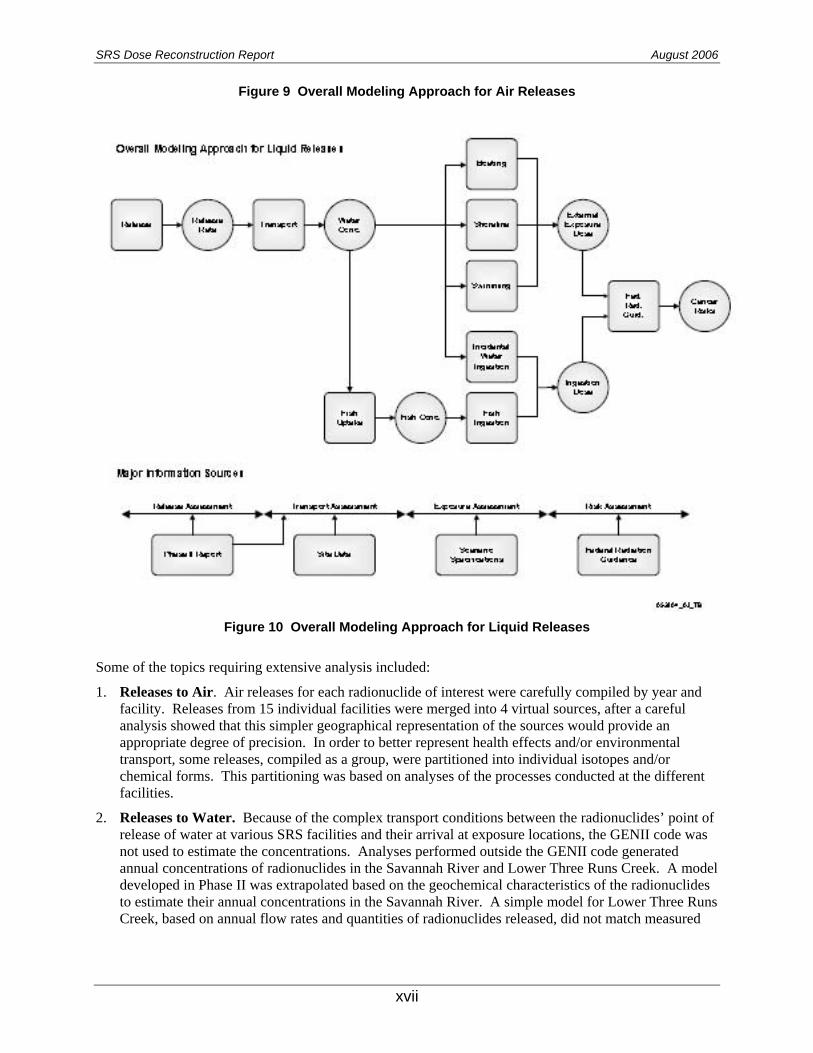
Figure 9 Overall Modeling Approach for Air Releases
Figure 10 Overall Modeling Approach for Liquid Releases
Some of the topics requiring extensive analysis included:
1. Releases to Air. Air releases for each radionuclide of interest were carefully compiled by year and facility. Releases from 15 individual facilities were merged into 4 virtual sources, after a careful analysis showed that this simpler geographical representation of the sources would provide an appropriate degree of precision. In order to better represent health effects and/or environmental transport, some releases, compiled as a group, were partitioned into individual isotopes and/or chemical forms. This partitioning was based on analyses of the processes conducted at the different facilities.
2. Releases to Water. Because of the complex transport conditions between the radionuclides’ point of release of water at various SRS facilities and their arrival at exposure locations, the GENII code was not used to estimate the concentrations. Analyses performed outside the GENII code generated annual concentrations of radionuclides in the Savannah River and Lower Three Runs Creek. A model developed in Phase II was extrapolated based on the geochemical characteristics of the radionuclides to estimate their annual concentrations in the Savannah River. A simple model for Lower Three Runs Creek, based on annual flow rates and quantities of radionuclides released, did not match measured
xvii
SRS Dose Reconstruction Report August 2006
137 90 P Pconcentrations. Therefore, actual measured concentrations for three critical radionuclides, P Cs, P Sr,
and tritium were used.
3. Input Variables. The large variety of situations modeled, representing radionuclide transport in the environment and exposure of humans, required specification of a large number (over 300) input variables to obtain a point estimate of dose for each receptor. Data sources were extensively reviewed and values of input variables were selected according the following preference hierarchy: 1) values specific to the SRS; 2) generic values recommended by an international body (9); 3) default values built into the GENII code.
Table 6 Exposure Pathways Associated with Exposure Routes and Release Medium
Exposure Route & Pathway Shorthand Description
Air Releases
Water Releases
External Radiation • Immersion in a Plume of Contaminated Air Air Immersion X • Exposure to Soil Contaminated with Ground X
Radionuclides Deposited from the Air Contamination • Exposure to a Shoreline Contaminated with Shoreline X
Radionuclides Deposited from Water • Exposure to Contaminated Water while Swimming X
Swimming • Exposure to Contaminated Water while Boating X
Boating
Inhalation • Inhalation of Contamination in a Plume of Air Air Inhalation X • Inhalation of Contamination Resuspended from Resuspended Soil X
Soil after Deposition from the Air
Ingestion • Leafy Vegetable Consumption Leafy Vegetables X • Root Vegetable Consumption Root Vegetables X • Fruit Consumption Fruit X • Grain Consumption Grain X • Beef Consumption* Beef X • Poultry Consumption* Poultry X • Milk Consumption Milk X • Egg Consumption Eggs X • Inadvertent Soil Consumption Soil X • Fish Consumption Fish X • Inadvertent Ingestion of Water While
Swimming Inadvertent Swimming Ingestion
X
*Beef consumption is a surrogate for consumption of all types of beef, including venison acquired through deer hunting on or near SRS. See HTUChapter 8UTH for a discussion of this assumption. Poultry consumption is a surrogate for consumptions of chicken and other fowl, including that acquired through bird hunting on or near SRS.
xviii

SRS Dose Reconstruction Report August 2006
The analysis was conducted in two steps: 1) a deterministic step resulting in a point-estimate of dose for each receptor and 2) an uncertainty step resulting in many estimates of dose (a dose distribution) for each receptor. XTable 7 X summarizes some important differences between the two analysis steps.
Table 7 Comparison of Steps 1 and 2
Attribute Step 1 Step 2
Analysis Type Deterministic. Uncertainty (Probabilistic).
Variables All have a fixed value. Most have a fixed value; 14 uncertain.
End Point Dose and risks. Dose.
Subcategories of All (organs, radionuclides, exposure Only total dose. Dose and Risk pathways, release mode).
Radionuclides All (result of Level 1 screening in Phase II).
Minor contributors to dose screened out.
Exposure All (all potential contributors). Minor contributors to dose screened out. Pathways
Primary Goal Understand how doses arise; Establish confidence intervals around screening for Step 2. mean estimated dose.
Result Single estimate of dose for each Multiple estimates of dose for each receptor. receptor.
Step 1 established a point-estimate value (deterministic value) of dose and risks for each receptor by assigning a single representative value for each variable used in the dose assessment; for this study these representative values were chosen to be realistic (i.e., not intentionally overestimating or underestimating the doses). However, certain aspects of the hypothetical scenarios, by design, tended to increase dose estimates. These point-estimates of dose for each receptor were used to understand the relative importance of radionuclides, transport pathways, exposure pathways, and other factors.
Step 2 of the analysis (a probabilistic or stochastic analysis) evaluated the effect of input variable uncertainty on dose estimates by developing multiple values (a distribution) of dose for each receptor. This uncertainty analysis was simplified to focus the analysis and eliminate some extensive computations likely to yield little benefit. Two methods were used to simplify the analysis: 1) pathways and radionuclides contributing little to the overall dose and risk were not analyzed; and 2) the number of variables considered in the uncertainty analysis was reduced. Variables associated with receptor behavior specified by the scenarios and those associated with health effects (dose and risk coefficients) were considered to be certain and not evaluated in the uncertainty analysis. Then a systematic approach selected, from the remaining large set of variables, 14 variables evaluated to have a dominant effect on uncertainty in the dose estimates. Probability distributions established for these 14 variables were then used to generate 40 random sets of input variables, which generated 40 corresponding estimates of dose for each scenario member. This distribution of doses was the basis for generating the statistics (mean, median, maximum, minimum, confidence interval about the mean) that describe the uncertainty in dose. Although the probability distributions describing the input variables were anchored by the point estimate values for those variables, the mean and median doses calculated in Step 2 were generally higher than the point-estimates of dose calculated in Step 1.
xix
SRS Dose Reconstruction Report August 2006
Although the step 1 (point estimate) analysis provides important information on the radionuclides, pathways, and receptor behaviors determining the numerical results, the step 2 (uncertainty) analysis likely provides a more reliable estimate of dose. When uncertainty in the input variables is considered, the resulting mean and median values of dose (central estimates of dose) are generally higher than the corresponding point estimate values of dose. This does not appear to be an anomaly, but can be attributed to the nonlinear behavior of the dose calculation when uncertainty is considered.
xx
4 References
SRS Dose Reconstruction Report August 2006
1. Till, J.E., et al. (2001, April 30). Savannah River Site environmental dose reconstruction project, Phase II: source term calculation and ingestion pathway data retrieval, evaluation of materials released from the Savannah River Site. RAC Report No. 1-CDC-SRS-1999-Final. Risk Assessment Corporation (RAC).
2. Centers for Disease Control and Prevention (CDC) (1999, February). Phase II of the SRS dose reconstruction project. [cited 7 July 2003] Available from URL: http://www.cdc.gov/nceh/radiation/savannah/summaryphs2.pdf.
3. Center for Disease Controls and Prevention (CDC) (2003, June 25). Savannah River Site Health Effects Subcommittee. [cited 7 July 2003] Available from URL: http://www.cdc.gov/nceh/radiation/savannah/srs_subcommittee.htm.
4. Till, J.E., et al. (2001, April 30). Savannah River Site environmental dose reconstruction project, Phase II: source term calculation and ingestion pathway data retrieval, evaluation of materials released from the Savannah River Site. RAC Report No. 1-CDC-SRS-1999-Final. Risk Assessment Corporation (RAC). Available from URL: http://www.cdc.gov/nceh/radiation/savannah.
5. National Commission on Radiation Protection and Measurements (1987). Report 93. Ionizing Radiation Exposure of the Population of the United States. ISBN 0-913392-91-X.
6. Savannah River Region Health Information System (1999, September). Cancer Incidence Report: 1991-1995. Eds.: John B. Dunbar, Daniel T. Lackland, Jonathan Liff, Ph.D. The Savannah River Region Health Information System, Department of Biometry and Epidemiology, Medical University of South Carolina. Charleston, South Carolina.
7. Lockridge, J., CY (2002, September 6). 2002 Status Report Scenario Working Group presentation.
8. Napier, B.A., et al. (2002, November). GENII Version II Software Design Document.
9. International Atomic Energy Agency (IAEA) (1994). Handbook of Parameter Values for the Prediction of Radionuclide Transfer in Temperate Environments. Technical Reports Series No. 364. Vienna, Austria.
xxi