orau team dose reconstruction project for niosh · 2018-10-02 · orau team dose reconstruction...
TRANSCRIPT

ORAU TEAM Dose Reconstruction Project for NIOSH
Oak Ridge Associated Universities I Dade Moeller I MJW Technical Services
Page 1 of 120
DOE Review Release 02/05/2013
Document Title:
Site Profile for Sandia National Laboratories in Albuquerque, New Mexico, and the Tonopah Test Range, Nevada
Document Number: ORAUT-TKBS-0037
Revision: 01
Effective Date: 01/25/2013
Type of Document: TBD
Supersedes: Revision 00
Subject Expert(s): Rowena S. Argall and Tracy A. Ikenberry
Approval: Signature on File Approval Date:
01/22/2013
Dann C. Smith, Document Owner
Concurrence: Signature on File Concurrence Date:
01/22/2013
John M. Byrne, Objective 1 Manager
Concurrence: Signature on File Concurrence Date:
01/22/2013
Edward F. Maher, Objective 3 Manager
Concurrence: Vickie S. Short Signature on File for Concurrence Date:
01/22/2013
Kate Kimpan, Project Director
Approval: Signature on File Approval Date:
01/25/2013
James W. Neton, Associate Director for Science
New Total Rewrite Revision Page Change
FOR DOCUMENTS MARKED AS A TOTAL REWRITE, REVISION, OR PAGE CHANGE, REPLACE THE PRIOR REVISION AND DISCARD / DESTROY ALL COPIES OF THE PRIOR REVISION.

Document No. ORAUT-TKBS-0037 Revision No. 01 Effective Date: 01/25/2013 Page 2 of 120
PUBLICATION RECORD
EFFECTIVE DATE
REVISION NUMBER DESCRIPTION
06/22/2007 00 New approved site profile for the Sandia National Laboratories in Albuquerque, New Mexico and the Tonopah Test Range, Nevada. Incorporates formal internal and NIOSH review comments. There is a reduction in assigned dose and no PER is required. Training required: As determined by the Task Manager. Initiated by Jack E. Buddenbaum.
01/22/2013 01 Revision initiated to incorporate Special Exposure Cohort (SEC) Petition SEC-00162 and added Section 1.3 to incorporate the SEC class through 1962. Revised Acronyms and Abbreviations list and deleted unused and unnecessary items. Revised Section 1.2 to refer to “Section 7.0” for attributions and annotations. Revised Section 2.3 to address significant use of radioactive materials and external dose monitoring starting in 1949. Table 2-2: relocated “Radionuclides” to that column for line entry “B-884,” edited listed radiation types for consistent terms and case (gamma and neutron), and added “Particle” to “AMAD” in “Radionuclides” column heading. Revised Section 2.6.2 title to describe section better. Updated reference citations throughout the document. Section 3 totally revised for alignment with current ORAUT-OTIB-0006 guidance and methods. Revised described areas of environmental and onsite dose to be outside “radiological” facilities in Section 4.1.1. Revised Section 4.1.2 to describe incorporation of post-2004 environmental data. Revised new Section 4.6 to clarify the use of a geometric standard deviation (GSD) of 3 for environmental intake doses. Table 5-5: revised citations for to references SNL 1998d through 1998l. Clarified language in Section 5.1.2 describing when bioassay was performed. Per review comment, deleted Table 5-7 since little is currently known of site plutonium absorption types. Deleted alternate unit “(MBq),” which was incorrect, listed for Pu-238 1967–1991 in new Table 5-7. Revised reference for tritium dose guidance from OCAS-TIB-002 to ORAUT-OTIB-0022 in Section 5.2.3. Added guidance to Section 5.2.4 to apply natural uranium bioassay results even if source may be nonoccupational. Table 5-15: updated IMBA reference to current version, 1.0.9, and revised specific activity values to those provided by IMBA. Deleted Section 5.3.6, as applicable guidance is provided by ORAUT-OTIB-0060. Deleted Table 5-29 and related text due to insignificant value for dose reconstruction. Revised name of Section 5.4.2 to Incident Intake Information. Revised Section 6.3 title to include electron dose. Added discussion to Section 6.3 to require use of coworker dose of ORAUT-OTIB-0072 as applicable. In Section 6.6, revised photon energy listed as “30 to 2,560” to “30 to 250” and described radiation type for discussion of <30-keV dose as photons. Revised guidance in Section 6.8 for use of neutron-to-photon ratio for missed neutron dose as being applicable to missed photon dose rather than recorded gamma dose. Added “Attribution and Annotation” for the use of a GSD of 3 for environmental intake doses. Deleted term “activity fraction” from Glossary. Incorporates Special Exposure Cohort (SEC) Petition SEC-00188, allow dose reconstruction for site starting

Document No. ORAUT-TKBS-0037 Revision No. 01 Effective Date: 01/25/2013 Page 3 of 120
in 1945, and add updated on-site ambient doses and environmental intake data for 2005 through 2010. Added START Laboratory to Acronyms and Abbreviations list. Revised Sections 1.3 and 5.0 to implement SEC-00188 class. Revised Section 2.3 to better define site activities during 1945 through 1949. Revised text throughout Section 4 to indicate that ambient and environmental dose data are now provided through 2010. Revised Section 4.3 to and Table 4-1 include an additional radionuclide due to Pu-239 release values after 2004. Added maximizing and best estimate ambient dose guidance to Section 4.4 and added reference (ORAUT 2006b) regarding ambient dose. Added references throughout Sections 4.4 and 4.5 and the “References” section to include environmental monitoring reports through 2010. Deleted detailed discussion of environmental TLD uncertainty since it was not relevant to the applied dose reconstruction ambient dose uncertainty and was not supported by citable sources for all years. Added a new Table 4-3 for 2005 – 2010 ambient doses and revised all subsequent Section 4 table numbers. Revised Section 4.4.2 TTR ambient dose text that indicated the ambient dose was zero due to positive ambient doses after 2004. Provided guidance regarding noble gases intakes in Section 4.5.1. Revised Section 4.5.2 to increase the assumed light activity breathing rate to that used for SNL – NM, which is an overestimated value. Revised text in Section 4.6, “Uncertainty” to delete superfluous text that did not address uncertainty and to apply ambient dose uncertainties consistent with ORAUT 2006b guidance. Revised Table 5-8 to correct activity values and ratios. Removed information associating specific radionuclides with specific facilities and building numbers; removed text that was not necessary for SNL dose reconstructions, including associated references, attributions, Figure 5-1, and Tables 5-28 and 5-29; and removed text discussing employees by name in the body of the TBD aside from citing attributions and references. Table 3-1: changed 1957–1966 X-ray frequency to annual. Sections 4.4.1 and 4.4.2 and Tables 4-3 and 4-4: added detailed 2008 and 2009 environmental intake data. Table 5-1: deleted “Manzano” as a TA. Tables 5-7, 5-11, 5-13, 5-16, 5-20, and 5-22: changed table titles to incorporate the term “MDAs,” consistent with text and with internal DR terminology. Changed Sections 5.3.1 and 5.3.4, including deletion of Tables 5-21 and 5-27, to refer to LANL TBD for guidance on internal DR using LANL in vivo measurements. Section 5.4 title changed to reflect that “selected buildings” are no longer addressed. Sections 6-1and 6-2 and Tables 6-1 and 6-7: changed to indicate that LANL dosimetry parameters apply prior to 1949. In Section 6-7, added more detailed guidance to apply a neutron-to-photon dose ratio. In Section 6-8, added more detailed guidance regarding the applicability of neutron missed dose and added the associated reference (ORAUT 2008b). Incorporates formal internal and NIOSH review comments. Constitutes a total rewrite of the document. Training required: As determined by the Objective Manager. Initiated by Dann C. Smith.
Document No. ORAUT-TKBS-0037 Revision No. 01 Effective Date: 01/25/2013 Page 4 of 120
TABLE OF CONTENTS
SECTION TITLE PAGE
Acronyms and Abbreviations ............................................................................................................... 8
1.0 Introduction ............................................................................................................................ 12 1.1 Purpose ...................................................................................................................... 13 1.2 Scope ......................................................................................................................... 13 1.3 Special Exposure Cohort Information for SNL-NM ...................................................... 13
2.0 Site Description ...................................................................................................................... 14 2.1 Purpose and Scope .................................................................................................... 14 2.2 Introduction ................................................................................................................. 14 2.3 Site Activities and Processes ...................................................................................... 14 2.4 Major Facilities and Activities ...................................................................................... 15
2.4.1 TA-I ................................................................................................................. 19 2.4.2 TA-II ................................................................................................................ 20 2.4.3 TA-III ............................................................................................................... 20 2.4.4 TA-IV .............................................................................................................. 20 2.4.5 TA-V ............................................................................................................... 20 2.4.6 Other Areas .................................................................................................... 21
2.5 Major Site Incidents .................................................................................................... 21 2.6 Health Protection Practices ........................................................................................ 21
2.6.1 Personnel Monitoring ...................................................................................... 21 2.6.1.1 Badging ............................................................................................ 21 2.6.1.2 Area Monitoring ................................................................................ 22
2.6.2 Access Control ................................................................................................ 22
3.0 Occupational Medical Dose .................................................................................................... 22 3.1 Introduction ................................................................................................................. 22
3.1.1 Purpose .......................................................................................................... 22 3.1.2 Scope ............................................................................................................. 22
3.2 Examination Types and Frequencies .......................................................................... 22 3.3 Technique Factors and Incident Air Kerma ................................................................. 24
3.3.1 Photofluorography, 1943-1956 (at LANL) ........................................................ 24 3.3.2 Radiography, 1943 Through 1952 (at LANL) ................................................... 24 3.3.3 Radiography, 1953 Through 1977 (at SNL) ..................................................... 24 3.3.4 Radiography, 1978 Through 1995 ................................................................... 25 3.3.5 Radiography, 1996 to Present ......................................................................... 26
3.4 X-Ray Doses to Workers ............................................................................................ 27 3.4.1 Conversion of ESE to Dose............................................................................. 27 3.4.2 Organ Doses from Chest Photofluorography ................................................... 27 3.4.3 Organ Doses from 14- by 17-in. PA Chest Radiography ................................. 27 3.4.4 Organ Doses from Lumbar Spine Radiography ............................................... 27
3.5 Uncertainty Analysis ................................................................................................... 28
4.0 Occupational Environmental Dose ......................................................................................... 37 4.1 Introduction ................................................................................................................. 37
4.1.1 Purpose .......................................................................................................... 37 4.1.2 Scope ............................................................................................................. 38
4.2 Operations Overview .................................................................................................. 38 4.2.1 Sandia National Laboratories – New Mexico ................................................... 38

Document No. ORAUT-TKBS-0037 Revision No. 01 Effective Date: 01/25/2013 Page 5 of 120
4.2.2 Sandia National Laboratories – Nevada .......................................................... 39 4.3 Radionuclide Screening, SNL-New Mexico ................................................................. 41 4.4 Ambient External Radiation ........................................................................................ 42
4.4.1 Sandia National Laboratories – New Mexico ................................................... 42 4.4.2 Sandia National Laboratories – Nevada .......................................................... 44
4.5 Inhalation of Onsite Airborne Radionuclides ............................................................... 45 4.5.1 Sandia National Laboratories – New Mexico ................................................... 45
4.5.1.1 Technical Areas I, II, and IV .............................................................. 46 4.5.1.2 Technical Area III .............................................................................. 47 4.5.1.3 Technical Area V .............................................................................. 48
4.5.2 Sandia National Laboratories – Nevada .......................................................... 49 4.6 Uncertainty ................................................................................................................. 50
5.0 Occupational Internal Dose .................................................................................................... 50 5.1 Introduction ................................................................................................................. 51
5.1.1 Bioassay Results of Individuals ....................................................................... 57 5.1.2 The Bioassay Program .................................................................................... 58
5.2 In Vitro Bioassay......................................................................................................... 61 5.2.1 Plutonium ........................................................................................................ 62 5.2.2 Americium ....................................................................................................... 67 5.2.3 Tritium ............................................................................................................. 68 5.2.4 Uranium .......................................................................................................... 70 5.2.5 Fission and Activation Product Analysis .......................................................... 73 5.2.6 Accelerator Areas ........................................................................................... 74 5.2.7 Indoor Radon .................................................................................................. 74 5.2.8 Other Limited-Exposure Radionuclides ........................................................... 75
5.3 In Vivo Minimum Detectable Activities, Analytical Methods, and Reporting Protocols . 76 5.3.1 Whole-Body Counters–LANL (1955 to 1992) .................................................. 76 5.3.2 Whole-Body Counter–SNL .............................................................................. 76 5.3.3 Cesium-137 Intakes from Fallout .................................................................... 79 5.3.4 Lung Burdens ................................................................................................. 79 5.3.5 Wound Monitoring ........................................................................................... 80
5.4 Air ConcentrationS ..................................................................................................... 80 5.4.1 Respiratory Protection Program ...................................................................... 80 5.4.2 Incident Intake Information .............................................................................. 81
6.0 Occupational External Dose ................................................................................................... 81 6.1 Dosimeters Used ........................................................................................................ 81 6.2 Recorded Dose Practices ........................................................................................... 83 6.3 Unmonitored Photon and electron Dose ..................................................................... 84 6.4 Uncertainty Factors .................................................................................................... 87 6.5 Missed Beta/Photon Dose .......................................................................................... 87 6.6 Partitioning of Beta/Photon Doses to Energy Categories ............................................ 88 6.7 Unmonitored Neutron Dose ........................................................................................ 90 6.8 Missed Neutron Dose ................................................................................................. 90 6.9 Partitioning of Neutron Doses to Energy Categories ................................................... 91 6.10 Recommended Dose Conversion Factors .................................................................. 92

Document No. ORAUT-TKBS-0037 Revision No. 01 Effective Date: 01/25/2013 Page 6 of 120 7.0 Attributions and Annotations .................................................................................................. 92
References ........................................................................................................................................ 98
Glossary .......................................................................................................................................... 119
LIST OF TABLES
TABLE TITLE PAGE
2-1 Chronology of significant SNL programs and events .............................................................. 16 2-2 Area information and parameters ........................................................................................... 16 2-3 Magnitude of activity .............................................................................................................. 18 3-1 Frequency and types of medical radiographs ......................................................................... 23 3-2 Machine settings and incident air kerma for screening radiography, 1953 through 1977 ........ 25 3-3 Machine settings and incident air kerma for screening radiography, 1978 through 1995 ........ 26 3-4 Manual settings and incident air kerma for screening medical radiography, 1997 to
present ................................................................................................................................... 26 3-5 Organ dose equivalents for chest projections for all periods ................................................... 29 3-6 Skin dose guidance and skin dose equivalents for chest projections, 1953 through
1977 ....................................................................................................................................... 30 3-7 Skin dose guidance and skin dose equivalents for chest projections, 1978 through
1995 ....................................................................................................................................... 32 3-8 Skin dose guidance and skin dose equivalents for chest projections, 1996 through
present ................................................................................................................................... 33 3-9 Organ dose equivalents for lumbar spine projections for all periods ....................................... 35 3-10 Skin dose guidance and skin dose equivalents for lumbar spine projections, 1953
through 1977 .......................................................................................................................... 35 3-11 Skin dose guidance and skin dose equivalents for lumbar spine projections, 1978
through 1985 .......................................................................................................................... 36 4-1 Radionuclides meeting screening criteria and the principal worker exposure pathway ........... 42 4-2 External radiation dose for workers in SNL-NM TAs ............................................................... 43 4-3 External radiation dose for workers in SNL-NM TAs, 2005 through 2010 ............................... 44 4-4 External radiation dose for workers at TTR ............................................................................ 45 4-5 TAs-I, -II, and -IV maximum annual intakes via inhalation ...................................................... 47 4-6 TA-III maximum annual intakes via inhalation ........................................................................ 47 4-7 TA-V maximum annual intakes via inhalation ......................................................................... 48 4-8 TTR maximum annual intakes via inhalation .......................................................................... 50 5-1 Internal exposure potential by area ........................................................................................ 53 5-2 Facilities in TAs-III and -IV and the Explosive Component Facility ......................................... 53 5-3 Nuclear weapons and nosetip tests ........................................................................................ 55 5-4 1991 Tiger Team assessment key findings related to the internal dosimetry program ............ 59 5-5 Internal dosimetry requirements ............................................................................................. 61 5-6 Action levels for airborne radioactivity .................................................................................... 61 5-7 Plutonium bioassay MDAs as listed in LANL procedures and reports..................................... 64 5-8 Pure 238Pu isotopic mixture ..................................................................................................... 65 5-9 Activity composition of reference weapons-grade (6%) plutonium mixture ............................. 66 5-10 Activity composition of reference fuel-grade (12%) plutonium mixture .................................... 67 5-11 Americium-241 LANL bioassay techniques and MDAs ........................................................... 68 5-12 Other sources of potential tritium intakes ............................................................................... 69 5-13 Tritium urine bioassay MDAs from LANL ................................................................................ 70 5-14 Uranium conversion factors .................................................................................................... 71

Document No. ORAUT-TKBS-0037 Revision No. 01 Effective Date: 01/25/2013 Page 7 of 120 5-15 Natural uranium ..................................................................................................................... 71 5-16 Routine uranium urinalysis MDAs .......................................................................................... 72 5-17 Fission and activation product nuclides .................................................................................. 73 5-18 Specific activity of thorium isotopes ........................................................................................ 75 5-19 Routine 210Po urinalysis MDAs ............................................................................................... 75 5-20 MDAs for whole-body counting, 2005 ..................................................................................... 76 5-21 MDAs for whole-body counting .............................................................................................. 77 5-22 Nuclides that produce the highest dose to organ of interest ................................................... 78 5-23 Accelerator nuclides in whole-body count library .................................................................... 78 5-24 Mean United States 137Cs body burdens from fallout ............................................................ 79 5-25 Reported exposure incidents and results ............................................................................... 81 6-1 Beta/photon dosimeters ......................................................................................................... 82 6-2 Neutron dosimeters ................................................................................................................ 82 6-3 Recorded dose practices........................................................................................................ 83 6-4 SNL-NM worker penetrating dose statistics, 1949 to 2005 ..................................................... 85 6-5 SNL-NM worker nonpenetrating dose statistics, 1987 to 2005 ............................................... 86 6-6 SNL beta/photon dosimeter period of use, type, MDL, exchange frequency, and
potential annual missed dose ................................................................................................. 87 6-7 Recommended beta and photon radiation energies and percentages for SNL-NM
facilities .................................................................................................................................. 89 6-8 Recommended distributions for neutron-to-photon ratio ......................................................... 90 6-9 Neutron dosimeter period of use, type, MDL, exchange frequency, and potential
annual missed dose ............................................................................................................... 91 6-10 Recommended dose fractions and ICRP Publication 60 correction factors for SNL
neutron sources ..................................................................................................................... 92 6-11 Recommended DCFs for SNL dose assessments.................................................................. 92
LIST OF FIGURES
FIGURE TITLE PAGE
4-1 SNL-NM site south of Albuquerque, New Mexico, in 2005 ..................................................... 38 4-2 Layout and location of facilities operated by SNL-NV at TTR in 2004 ..................................... 40

Document No. ORAUT-TKBS-0037 Revision No. 01 Effective Date: 01/25/2013 Page 8 of 120 ACRONYMS AND ABBREVIATIONS
ABS acrylonitrile-butadienestyrene ACPR Annular Core Pulse Reactor (later Annular Core Research Reactor) ACRR Annular Core Research Reactor AEC U.S. Atomic Energy Commission AFB Air Force Base ALARA as low as reasonably achievable AMAD activity median aerodynamic diameter ANSI American National Standards Institute ANT Advanced Nosetip Test AP anterior-posterior AT&T American Telephone and Telegraph
BB bronchial region BBbas bronchial region, basal cells bbsec bronchiolar region, secretory cells Bq becquerel (1 disintegration per second) BZA breathing-zone air
C coulomb CAM continuous air monitor CEDE Committed Effective Dose Equivalent CEP Controls for Environmental Pollution CFR Code of Federal Regulations cGy centigray CHP Certified Health Physicist Ci curie cm centimeter cpm counts per minute d day DAC derived air concentration dc direct current DCF dose conversion factor DOE U.S. Department of Energy dpm disintegrations per minute DU depleted uranium
ECF Explosive Component Facility EEOICPA Energy Employees Occupational Illness Compensation Program Act of 2000 ENSD entrance skin dose (from X-ray procedures) EPA U.S. Environmental Protection Agency ES&H Environment, Safety and Health ESE entrance skin exposure ET extrathoracic EXSD exit skin dose (from X-ray procedures)
ft foot FP fission product
g gram GIF Gamma Irradiation Facility GM geometric mean

Document No. ORAUT-TKBS-0037 Revision No. 01 Effective Date: 01/25/2013 Page 9 of 120 GSD geometric standard deviation
HCF Hot Cell Facility HP health physics HPGe hyperpure germanium hr hour HT elemental tritium (tritiated gas) HTO tritium oxide (water or water vapor) HVL half-value layer
ICP-MS inductively coupled plasma mass spectroscopy ICRP International Commission on Radiological Protection IMBA Integrated Modules for Bioassay Analysis in. inch IREP Interactive RadioEpidemiological Program
Ka,i incident air kerma keV kiloelectron-volt, 1,000 electron-volts kg kilogram KPA kinetic phosphorescence analysis kVp kilovolts peak kW kilowatt
L liter LANL Los Alamos National Laboratory LASL Los Alamos Scientific Laboratory LAT lateral LC decision level LICA Low Irradiation Calibrator Apparatus LLI lower large intestine LLNL Lawrence Livermore National Laboratory LN lymph nodes LSC liquid scintillation counter
m meter mA milliampere mAs milliampere-second mCi millicurie MDA minimum detectable activity MDL minimum detection limit MeV megaelectron-volt, 1 million electron-volts mg milligram mL milliliter mm millimeter MOU memorandum of understanding MPC maximum permissible concentration mR milliroentgen mrad millirad mrem millirem MT metal tritide (tritium bound to metallic compounds, such as hafnium) MW megawatt MWL Mixed Waste Landfill

Document No. ORAUT-TKBS-0037 Revision No. 01 Effective Date: 01/25/2013 Page 10 of 120 n neutron nCi nanocurie NCRP National Council on Radiation Protection and Measurements NIOSH National Institute for Occupational Safety and Health NTA nuclear track emulsion, type A NTS Nevada Test Site NTTR Nevada Test and Training Range NU natural uranium
OBT organically bound tritium
PA posterior-anterior PBFA Particle Beam Fusion Accelerator pCi picocurie PER Program Evaluation Report PFG photofluorography PHA pulse height analysis POC probability of causation
R roentgen RAO right anterior oblique (X-ray position) RAS radiometric alpha spectroscopy RBM red bone marrow REBA Relativistic Electron Beam Accelerator RPID Radiation Protection Internal Dosimetry RWP radiological work permit
s second SABRE Sandia Accelerator and Beam Research Experiment SEC Special Exposure Cohort SER Sandia Engineering Reactor SERF Sandia Engineering Reactor Facility SI small intestine SID source-to-image distance SMT stable metal tritide SNL Sandia National Laboratories SNL-NM SNL Albuquerque, New Mexico SNL-NV SNL Tonopah Test Range in Nevada SPHINX Short Pulse High Intensity Nanosecond X-Radiator SPR Sandia Pulse Reactor SRDB Ref ID Site Research Database Reference Identification SSD source-to-skin distance START Sandia Tomography and Radionuclide Transport (Laboratory)
TA Technical Area TBD technical basis document TH thoracic TLD thermoluminescent dosimeter TRIGA Training, Research, Isotopes General Atomics TTR Tonopah Test Range
ULI upper large intestine U.S.C. United States Code

Document No. ORAUT-TKBS-0037 Revision No. 01 Effective Date: 01/25/2013 Page 11 of 120 wk week
yr year
γ gamma particle or ray
µCi microcurie µg microgram µm micrometer
§ section or sections

Document No. ORAUT-TKBS-0037 Revision No. 01 Effective Date: 01/25/2013 Page 12 of 120 1.0 INTRODUCTION
Technical basis documents and site profile documents are not official determinations made by the National Institute for Occupational Safety and Health (NIOSH) but are rather general working documents that provide historical background information and guidance to assist in the preparation of dose reconstructions at particular sites or categories of sites. They will be revised in the event additional relevant information is obtained about the affected site(s). These documents may be used to assist NIOSH staff in the completion of the individual work required for each dose reconstruction.
In this document the word “facility” is used as a general term for an area, building, or group of buildings that served a specific purpose at a site. It does not necessarily connote an “atomic weapons employer facility” or a “Department of Energy [DOE] facility” as defined in the Energy Employees Occupational Illness Compensation Program Act [EEOICPA; 42 U.S.C. § 7384l(5) and (12)]. EEOICPA defines a DOE facility as “any building, structure, or premise, including the grounds upon which such building, structure, or premise is located … in which operations are, or have been, conducted by, or on behalf of, the Department of Energy (except for buildings, structures, premises, grounds, or operations … pertaining to the Naval Nuclear Propulsion Program)” [42 U.S.C. § 7384l(12)]. Accordingly, except for the exclusion for the Naval Nuclear Propulsion Program noted above, any facility that performs or performed DOE operations of any nature whatsoever is a DOE facility encompassed by EEOICPA.
For employees of DOE or its contractors with cancer, the DOE facility definition only determines eligibility for a dose reconstruction, which is a prerequisite to a compensation decision (except for members of the Special Exposure Cohort). The compensation decision for cancer claimants is based on a section of the statute entitled “Exposure in the Performance of Duty.” That provision [42 U.S.C. § 7384n(b)] says that an individual with cancer “shall be determined to have sustained that cancer in the performance of duty for purposes of the compensation program if, and only if, the cancer … was at least as likely as not related to employment at the facility [where the employee worked], as determined in accordance with the POC [probability of causation1] guidelines established under subsection (c) …” [42 U.S.C. § 7384n(b)]. Neither the statute nor the probability of causation guidelines (nor the dose reconstruction regulation, 42 C.F.R. Pt. 82) restrict the “performance of duty” referred to in 42 U.S.C. § 7384n(b) to nuclear weapons work (NIOSH 2010).
The statute also includes a definition of a DOE facility that excludes “buildings, structures, premises, grounds, or operations covered by Executive Order No. 12344, dated February 1, 1982 (42 U.S.C. 7158 note), pertaining to the Naval Nuclear Propulsion Program” [42 U.S.C. § 7384l(12)]. While this definition excludes Naval Nuclear Propulsion Facilities from being covered under the Act, the section of EEOICPA that deals with the compensation decision for covered employees with cancer [i.e., 42 U.S.C. § 7384n(b), entitled “Exposure in the Performance of Duty”] does not contain such an exclusion. Therefore, the statute requires NIOSH to include all occupationally-derived radiation exposures at covered facilities in its dose reconstructions for employees at DOE facilities, including radiation exposures related to the Naval Nuclear Propulsion Program. As a result, all internal and external occupational radiation exposures are considered valid for inclusion in a dose reconstruction. No efforts are made to determine the eligibility of any fraction of total measured exposure for inclusion in dose reconstruction. NIOSH, however, does not consider the following exposures to be occupationally derived (NIOSH 2010):
• Background radiation, including radiation from naturally occurring radon present in conventional structures
• Radiation from X-rays received in the diagnosis of injuries or illnesses or for therapeutic reasons
1 The U.S. Department of Labor is ultimately responsible under the EEOICPA for determining the POC.

Document No. ORAUT-TKBS-0037 Revision No. 01 Effective Date: 01/25/2013 Page 13 of 120 1.1 PURPOSE
This site profile for Sandia National Laboratories (SNL) provides background information in relation to dose reconstruction for SNL workers at the Albuquerque, New Mexico (SNL-NM), site and the Tonopah, Nevada (SNL-NV), site on the Tonopah Test Range (TTR). The site profile also provides details about past and current SNL practices used to assess radiation exposures and environmental radiation levels at the facilities. In this document, SNL refers either to the Laboratories as a whole or to the Albuquerque site; SNL-NV refers to the TTR site.
1.2 SCOPE
Section 2.0 provides an overview of historical operations at SNL-NM and SNL-NV that have involved potential external or internal radiation exposures to workers.
Section 3.0 provides information about the doses that individual workers could have received from medical X-rays that were required for screening and as a condition of employment. These X-rays included preemployment and periodic chest X-rays during required physical exams.
Section 4.0 presents environmental dose information for workers who received doses from inhalation of radioactive materials in the air, direct radiation from plumes (immersion dose from radioactivity in the air), contact with radioactive particles on the skin, and direct exposure to radionuclides in use, stored, and incorporated in the soil when working outside of monitored radiologically controlled areas on site.
Section 5.0 discusses the internal dosimetry program at SNL, including minimum detectable activities (MDAs). Details of the monitoring techniques and programs are also presented.
Section 6.0 discusses the program for measuring shallow and penetrating external doses to the workers. The methods for evaluating external doses to workers have evolved over the years as new techniques and equipment have been developed.
Attributions and annotations, indicated by bracketed callouts and used to identify the source, justification, or clarification of the associated information, are presented in Section 7.0.
1.3 SPECIAL EXPOSURE COHORT INFORMATION FOR SNL-NM
Classes Added to the Special Exposure
• All employees of the Department of Energy, its predecessor agencies, and its contractors and subcontractors who worked in any area at Sandia National Laboratories in Albuquerque, New Mexico, from January 1, 1949, through December 31, 1962, for a number of work days aggregating at least 250 work days, occurring either solely under this employment, or in combination with work days within the parameters established for one or more other classes of employees in the Special Exposure Cohort (NIOSH 2011).
• All employees of the Department of Energy, its predecessor agencies, and its contractors and subcontractors who worked in any area at Sandia National Laboratories in Albuquerque, New Mexico, from January 1, 1963, through December 31, 1994, for a number of work days aggregating at least 250 work days, occurring either solely under this employment, or in combination with work days within the parameters established for one or more other classes of employees in the Special Exposure Cohort (NIOSH 2012).

Document No. ORAUT-TKBS-0037 Revision No. 01 Effective Date: 01/25/2013 Page 14 of 120 NIOSH has determined that monitoring data, process information, and monitoring program information are insufficient to support bounding internal doses for the evaluated classes. Therefore, NIOSH concluded it cannot bound internal doses for the period from January 1, 1949, through December 31, 1994.
Dose reconstruction guidance in this site profile for periods between January 1, 1949 and December 31, 1994 is presented to provide a technical basis for partial dose reconstructions for nonpresumptive cancers not covered in the Special Exposure Cohort (SEC) class.. Although NIOSH found that it is not possible to reconstruct internal radiation doses completely for the proposed class, it intends to use internal and external monitoring data that may be available for an individual claim (and that can be interpreted using existing NIOSH dose reconstruction processes or procedures). Therefore, dose reconstructions for individuals employed at SNL but who do not qualify for inclusion in the SEC, can be performed using these data as appropriate.
The above SEC discussion is not applicable to the reconstruction of TTR occupational radiation dose, as the designated SEC classes do not apply to TTR.
2.0 SITE DESCRIPTION
2.1 PURPOSE AND SCOPE
This section provides a site description that contains technical basis information for the evaluation of the total occupational dose for EEOICPA claimants. It describes SNL facilities and processes and details the historical information related to worker internal and external exposures.
2.2 INTRODUCTION
SNL had its origin as a satellite support site for the Los Alamos Scientific Laboratory [LASL; later renamed Los Alamos National Laboratory (LANL)]. The LASL Z-Division was established in July 1945 to handle weapons development, testing, and bomb assembly for the Manhattan Engineer District (Ullrich 1998). In late fall of 1945, some units of Z-Division moved to the current site near Albuquerque. In 1948, Z-Division became a separate branch of LASL, and a year later it was renamed Sandia Corporation. Its functions included engineering research, development, and mechanical production of specialized and strategic systems components to support U.S. national security. The site became Sandia Laboratories in 1971 and underwent another name change in 1979 to Sandia National Laboratories [1]. The SNL-NM facility includes five technical areas (TAs) south of Albuquerque, New Mexico, on the Kirtland Air Force Base (AFB).
2.3 SITE ACTIVITIES AND PROCESSES
The site mission transitioned from its start in 1945 to performing primary weapons functions by 1949 (Johnson 1997; Ullrich 1998, 1999). Starting in 1945, the site was first occupied by Z-Division with the primary projects being planning, engineering, storage of nonnuclear materials for weapons, and construction. During 1946, 1947, and much of 1948, work activities consisted primarily of engineering, testing, nonnuclear assembly, storage, and support of testing elsewhere. Occuring at the site initially developed, this area became known as Tech Area 1 (TA-1). In 1948, TA-II became operational, supporting assembly work on a larger scale. Design, assembly, and testing functions grew with the Laboratory assuming a more principal national role and, in 1948, occupational radiological exposure started at the site.
From 1948 to 1959, three national laboratories were coordinated in nuclear weapons design and construction activities: LANL, SNL, and Lawrence Livermore National Laboratory (LLNL). The three laboratories were part of the larger network of U.S. Atomic Energy Commission (AEC)-controlled sites

Document No. ORAUT-TKBS-0037 Revision No. 01 Effective Date: 01/25/2013 Page 15 of 120 that completed the manufacture, testing, and storage of nuclear weapons for the national stockpile. As described by Johnson (1997):
Los Alamos and Lawrence Livermore design the high explosive and nuclear system package, while Sandia designs the rest of the nuclear bomb or warhead, including the arming, fusing, and firing systems along with other essential components. In essence, Sandia “weaponizes” the nuclear systems designed at its partner laboratories.
Records of external radiation dose monitoring, along with positive results, began in 1949 (Widner 2008a,b,c). Most radioactive components were handled away from the SNL-NM site in this early era. Activities included extensive field testing of weapons components until 1958, which began again in 1961. The first nuclear reactor at SNL, the Sandia Engineering Reactor Facility (SERF), also referred to as the Sandia Engineering Reactor (SER) in historical records, went on line in 1957 and was used for material testing.
In the early 1960s, several high-energy accelerators were added at SNL to facilitate research on the effects of pulsed radiation on a variety of materials. The interest in the effects of pulses of higher intensity radiation (higher than could be sustained continuously with either the SERF reactor or the accelerators of the era) led to the installation and startup of the Sandia Pulse Reactor (SPR) in 1961. This was a GODIVA-type reactor design that allowed running the core up to relatively high energy levels for very short periods to investigate material damage under controlled conditions (Burnett et al. 1962). Over the succeeding decades, this design was upgraded to increasingly higher energy-level capacities to determine when exposed target materials fail or decompose.
Over the years, the Laboratory mission expanded and new activities included working on technologies to monitor nuclear testing after the treaty of 1963, working with the National Aeronautics and Space Administration to enhance the safety of aerospace nuclear power systems, and developing conventional weapons and intrusion sensors for use in the Vietnam War. National and international events, including the energy crisis and the terrorist acts at the Munich Olympics of the early 1970s, caused SNL to become involved in new areas of energy research and in physical security and safeguards for facilities. However, SNL continued to have responsibilities in developing new nuclear and other weapons as well as maintaining the safety and reliability of the existing nuclear stockpile (Johnson 1997).
Although international arms control efforts increased throughout the 1970s and 1980s, concerns remained about the impact of pulses or bursts of high radiation on both materials and functionality of electromagnetic and electronic systems. The relatively small energy level flash X-ray and heavy ion accelerators of the early 1970s were being rapidly augmented by 1- and 2-MeV machines. The continuing demand in the 1980s and 1990s for larger capacity and higher energy accelerators for testing and stressing electronic components with exposure to pulsed electron and ion accelerators and flash X-ray systems led to continual development changes and additions of higher energy accelerators at SNL during that period.
Table 2-1 provides a chronology of SNL programs and events.
2.4 MAJOR FACILITIES AND ACTIVITIES
Early on, it became apparent that SNL would need to grow to house the increasing staff necessary to meet scientific demands. SNL currently consists of five TAs and several test areas. Each TA has its own distinctive operations, but the operations of some groups at SNL can span more than one TA. A description of each area is given below.

Document No. ORAUT-TKBS-0037 Revision No. 01 Effective Date: 01/25/2013 Page 16 of 120 Table 2-1. Chronology of significant SNL programs and events.
Year Activity 1945 Z-Division created at LANL to assemble stockpile materials. 1946 Z-Division moved to Albuquerque. Building constructed in TA-I for testing weapons components. 1948 TA-II, high-explosive final assembly area for nonnuclear components constructed; assembly
continued for many years. 1949 Name change to Sandia Laboratory, separate from LANL. 1953 Large centrifuge, rocket sled track, vibration facility completed at TA-III. 1959 MWL (1959 to 1988) at TA-III for disposal of low-level mixed waste. Contained uranium (depleted,
natural, and enriched), thorium, tritium beds, liquid scintillation cocktails, plutonium wastes. 1957 SNL given delivery responsibility for all training units (with high explosive), inert training units (no
high explosive), and inert samples of weapons in early design stages until 1959. Assembly moved out of TA-II.
1960 TA-II converted to an explosive devices research and development area. 1960–1980s TTR used to test nonnuclear systems and components and underground nuclear experiments. 1960–1980s Kauai Test Facility, Hawaii, used for nonnuclear weapons testing. No radionuclides used. 1964 Component test facility for neutron generators added to TA-II. Potential radiation exposures
included neutrons and tritium. 1967 Additional building added to TA-II for neutron generator (containing tritium) testing. 1980s Operations commenced in TA-IV with pulsed power accelerators. 1985 Added a TA-V irradiation facility; north and south cells: gamma sources. 1996 ACRR and SPR facilities with highly enriched uranium fuel online in TA-V. 1996 HCF established to handle and examine radioactive materials (activation and fission products)
from the SNL reactors and experiments.
Table 2-2 lists each area and the notable facilities along with major radionuclides and years of operation.
Table 2-2. Area information and parameters.a
Area Process Years of
operation
Radionuclides M = major, L = likely (particle
AMAD = default 5 µm unless givenb) Radiation types B = beam types
TA-I Electron/ion beam accelerators Cockroft-Walton(s)
(electron accelerator) Late 1950s–present
L = target dependent (e.g., H-3) L = target dependent (e.g., H-3, DU, Be)
B = electron, X-ray
Van de Graaff(s) (electron accelerator)
1958–present L = target dependent (e.g., H-3) B = electron, X-ray (400 keV–2 MeV)
Heavy Ion/Proton Accelerators ~(100 kV)
1968+ NA B = protons, ions, and X-rays
Faxitron 1970–1973+ NA B = flash X-ray Nerues 1971+ NA B = X-ray, gamma,
bremsstrahlung TA-I Manufacturing facilities
Chemistry laboratories 1949–present H-3 NA LICA >2003–2005 M = Co-60, Cs-137 Gamma, beta Radiation Standards Calibration Facility
1998–present M = Co-60, Cs-137 Gamma, beta
A machine shop ~1959–1994 M = DU, Pu NA 6-MeV ion generator 1984–1996 B = ion beam,
X-rays Sealed sources in micro-electronics development
Single incident L= wide variety, but sealed. NA
Kaman Neutron Generators Mfg. 1996- Present Various neutron generator radionuclides Neutrons TA-I Medical services
Medical X-ray (Picker GX-325-PX350 tube) 300 mA @ 125 kVp
1949–present (registered in 1978)
NA X-ray

Document No. ORAUT-TKBS-0037 Revision No. 01 Effective Date: 01/25/2013 Page 17 of 120
Area Process Years of
operation
Radionuclides M = major, L = likely (particle
AMAD = default 5 µm unless givenb) Radiation types B = beam types
TA-II Repair/test services TA-III Waste destruction, disposal, transfer
“Leaking Cask” Single incident Sr-90, Cs-137 Classified Destruction Facility 1957–1988 Transuranic elements, others Radiological and mixed waste landfill
1949–1986 Cs-137, DU
TA-IV Electron/ion/X-ray beam accelerators PBFA-I 1987–1995 N-13, O-15 gases B = electrons,
gamma; target/neutrons
Saturn (succeeded PBFA-I, preceded PBFA-II)
1967–1996+ N-13, O-15 gases B = electrons, gamma; target/neutrons
PBFA-II (<30 MeV)
1993–present N-13, O-15 gases (<0.042 Ci/yr N-13, 0.005 Ci/yr O-15)
B = electrons, gamma; target/neutrons
Z-machine (modified from PBFA-II) 1996–present N-13, O-15 gases B = gamma, target/neutrons
Mite pulsed X-ray (6 MeV), 4 units Present NA B = X-ray, gamma Hermes III (higher energy version of Hermes II) (< 20 MeV)
~1988–1998 N-13, O-15 gases (<2.3 & 0.03 Ci/yr)
B = gamma, target/neutrons
SABRE; 6-12 MeV 1998–present N-13, O-15 gases (<0.0058 Ci/yr, N-13.)
B = gamma, target/neutrons
SPEED (1.0 MeV) 1983–1986 N-13, O-15 gases B = gamma, target/neutrons
SPHINX 1992–present N-13, O-15 gases B = gamma, target/neutrons
TESLA 1998– present NA B = X-rays Neutron generator 1959–1997+ Various neutron generator radionuclides B= neutrons
TA-V Electron/ion beam accelerators Febetrons
(Flash X-ray system-< 2 MeV) 1967+ B = Flash X-ray
(~2 MeV) Proto – I (first-generation, high-powered, short-pulse accelerator)
1972–-1976 Target dependent (e.g., H-3) B = electrons, X-rays
Proto – II (second-generation, high-powered, short-pulse accelerator)
1976–1998 Target dependent (e.g., H-3) B = electrons, X-rays
Pelletron Facility – variable-energy, high-stability dc electron beam generator (1 MeV)
1968–1991 Target dependent (e.g., H-3) B = electrons, X-rays
Hermes I, II (field emission electron beam or bremsstrahlung X-ray accelerator)
1968–1988 Target dependent (e.g., H-3) B = electrons, ions, bremsstrahlung X-ray
REBA = Z-machine (3.2 MV) 1994–present Target dependent (e.g., H-3) B = electrons, bremsstrahlung X-ray
Hydramite I & II – dual transmission line for high-energy short-pulse electron, bremsstrahlung X-ray unit (1 MeV)
1977, 1984+ Target dependent (e.g., H-3) B = electrons, ions, bremsstrahlung X-ray
REHYD = Heavy Ion Accelerator variable energy, positive ion combination of REBA and Hydramite (1.3 MeV)
1988–1998+ Target dependent (e.g., H-3) B = electrons, ions, bremsstrahlung X-ray
TA-V Reactors SER (5-MW) Facility (~NPR@INL) 1958–1979 M = Ar-41;
L = All reactor-produced nuclides B = prompt gamma, beta
ACRR (600 kW) also operated as Pulsed Reactor (ACPR) (<15,000 MW) [TRIGA-type]
1968–1998 M = Ar-41 L = All reactor-produced nuclides
B = prompt gamma, beta

Document No. ORAUT-TKBS-0037 Revision No. 01 Effective Date: 01/25/2013 Page 18 of 120
Area Process Years of
operation
Radionuclides M = major, L = likely (particle
AMAD = default 5 µm unless givenb) Radiation types B = beam types
ACRR = Mo-99 production (600 kW)
1998–present M = Ar-41, Tc-Mo-99 L = All reactor-produced nuclides
B = prompt gamma,
SPR-I [GODIVA-type] 1961–1975 M = Ar-41 L = All reactor-produced nuclides
B = prompt gamma, beta
SPR-II [GODIVA-type] (<130,000 MW peak)
>1962–present
M = Ar-41 L = All reactor-produced nuclides
B = prompt gamma, beta
SPR-III [GODIVA-type] (< 170,000 MW peak)
2003–present M = Ar-41 L = All reactor-produced nuclides
B = prompt gamma, beta
TA-V Irradiation and calibration support laboratories HCF 1988–present Target dependent (e.g., metals from
reactor, such as Cs-137, Ce-144, and H-3)
NA
GIF (~ 900 Ci Co-60 and similar Cs-137 high-activity sources for irradiation experiments)
1962–1998 M = Co-60 and Cs-137 NA
NEW GIF – combined with LICA = more flexible sources (Co-60 and Cs-137 high-activity sources for irradiation experiments)
1998?–present
M =Co-60 and Cs-137 NA
Coyote Test
Facility
Thunder Range – source metals after explosion and fire tests of weapons, containers
1969–1994 M = DU NA
a. NA = not available. b. AMAD = activity median aerodynamic diameter.
Table 2-3 lists specific areas of radionuclide use or radiation generation and the activity or power level.
Table 2-3. Magnitude of activitya. Area/facility Radionuclide/beam Activity/power level
TA-I Applicable buildings Po-Be, Am-Be, Pu-Be, Co-60,
DU NA
Cockroft-Walton 100 keV + Van de Graaff 400 keV–2 MeV Heavy Ion Accelerators 100 kV Faxitron X-ray NA Nerues X-ray, gamma, bremsstrahlung NA TA-II Applicable buildings Explosives; nonnuclear NA TA-III Waste Facility NA TA-IV EBFA/PBFA I Prompt gamma, O-15, N-13 NA PBFA II Prompt gamma, O-15, N-13 Maximum of 30 MeV with 5 shots/ wk;
0.000168 Ci N-13 and 0.00002 Ci O-15 per shot (<0.042 Ci/yr N-13, 0.005 Ci/yr O-15).
Repetitive High Energy Pulsed Power I
X-rays
Hermes III Prompt gamma, O-15, N-13 2.32 Ci/yr of N-13 and 0.030 Ci/yr for O-15 based on stack emissions. 20-MeV endpoint voltage
SABRE Prompt gamma, N-13 1.16E-05 Ci Ni-13 per shot/12 MeV maximum
Sub-Systems Test Facility Prompt gamma, O-15, N-13 NA ALIAS Prompt gamma, O-15, N-13 NA

Document No. ORAUT-TKBS-0037 Revision No. 01 Effective Date: 01/25/2013 Page 19 of 120
Area/facility Radionuclide/beam Activity/power level TROLL Prompt gamma, O-15, N-13 NA PI-112 Prompt gamma, O-15, N-13 NA Saturn Prompt gamma, O-15, N-13, H-3 4.75 µCi H-3 between 10/29 and 11/09,
1990. No H-3 between 1990 and 1996. SPHINX Prompt gamma NA Proto II (after late 1980s) NA Mite X-ray, gamma 6 MeV TA-V Reactors Ar-41, Tc-99, Mo-99, reactor-
produced nuclides 600 kW (ACRR); <15,000 MW (ACPR); <130,000 MW (SPR-I); <170,000 MW (SPR-II)
HCF Co-60, Cs-137, mixed fission products
NA
GIF Co-60, Cs-137 NA Hermes I, II Electrons, bremsstrahlung NA REBA Electrons, bremsstrahlung 3.2 MV Febetrons Flash X-ray < 2 MeV Proto I, II Electrons, X-rays NA Pelletron Electrons, X-rays 1 MeV Hydramite Electrons, bremsstrahlung 1 MV Rehyd Electrons, bremsstrahlung 1.3 MV GIF Gamma sources Up to 900 Ci TTR Missile testing Related contamination NA
a. NA = not available or applicable.
2.4.1 TA-I
TA-I operations have been dedicated primarily to three activities: (1) the design, research, and development of weapon systems; (2) limited production of weapon system components; and (3) energy research programs. TA-I facilities include a Cockroft-Walton electron accelerator and a Van de Graaff generator as well as heavy ion/proton accelerators, a fexitron (an early flash X-ray machine), and another higher energy X-ray system with bremsstrahlung beam to irradiate electronic components. These systems often served as pilot versions for larger machines constructed in more remote areas (TAs-IV and -V).
Radiological Locations Because TA-I was the area initially developed, it contains a large number of buildings of which at least 75 have been routinely included in contamination survey programs over the last 20 years. Many of the buildings have laboratories that incidentally use small radionuclide quantities or that have ion beam or X-ray machines that support electronic and mechanical component manufacture. A few buildings have been devoted to neutron source manufacturing over a long period.
A Van de Graaff generator and a Cockroft-Walton electron accelerator have been housed in the area from the late 1950s to the present. These generators were used to expose materials to large exposures of gamma and electron beam radiation during controlled experiments. The area also housed the primary radiation calibration facilities used for primary calibration of all dosimetry meters on the SNL site over the last 50 years. These uses have continued to the present in TA-I. However, as noted above, the need for larger radiation sources such as research reactors, large accelerators, and hot cell facilities to support them for a much larger scale of radiation exposure experiments required the development of facilities in TAs-IV and -V.

Document No. ORAUT-TKBS-0037 Revision No. 01 Effective Date: 01/25/2013 Page 20 of 120 2.4.2 TA-II
TA-II is a 45-acre (180,000 m²) facility south of TA-I, established in 1948 for the assembly of chemical high-explosive main charges for nuclear weapons and later for production-scale assembly of nuclear weapons (Ullrich 1998). Assembly activities continued from 1952 to 1957, when the work shifted to other sites. Test devices and weapon prototypes continued to be assembled in TA-II for many years. In 1960, TA-II was converted to an explosive devices research and development area, which continued until 1995 when all explosive devices were removed from the area.
Radiological Locations In 1964, a component test facility was added to develop and test neutron generators, which continued over the years. In 1967, an explosive device quality laboratory was added. In general and based on review of the historical radiation protection program database, TA-II has had little use of radioactive materials.
2.4.3 TA-III
Remote facilities were built in TA-III 7 miles south of TA-II for full-scale testing of weapons with and without explosives. TA-III contains extensive design-test facilities such as rocket sled tracks, centrifuges, and a radiant heat facility (Fink 1999, pp. 45-46). Other facilities include a paper destructor, the Melting and Solidification Laboratory, the radioactive and low-level waste landfills, and the mixed waste landfill (MWL) that operated from 1959 to 1988 (Peace, Goering, and McVay 1996).
Radiological Locations Other than small buildings housing the operators and screening detectors to manage the waste disposal facilities in TA-III, it does not appear from the reviewed records that any buildings in this area had significant sources of radioactivity present for normal operations.
2.4.4 TA-IV
TA-IV was opened to provide specialized remote research areas for pulsed-power and high-energy experiments (SNL 1998a). It consists of several inertial-confinement fusion research and pulsed-power research facilities, including the High Energy Radiation Megavolt Electron Source (Hemres-III), the Z Facility, the Short Pulsed High Intensity Nanosecond X-Radiator (SPHINX) Facility, and the Saturn Accelerator (Ullrich 1998).
Radiological Locations There are several principal buildings that house the largest and most powerful accelerators at the SNL site. The machines housed in these buildings are identified in Table 2-2.
2.4.5 TA-V
TA-V is a highly secure remote research area housing experimental and engineering nuclear reactors and several electron beam accelerators. It contains the Annular Core Research Reactor (ACRR) and the SPR (in two reactor facilities), an intense Gamma Irradiation Facility (GIF) using gamma sources, and the Hot Cell Facility (HCF) (DOE 1996). The ACRR was built to enable operation in steady-state and pulsed modes; it was designated as the Annular Core Pulsed Reactor (ACPR) during the pulsed-mode operational periods (SL 1979). After two decades of operation as a research reactor, the ACRR was transformed to a molybdenum-technetium radiopharmaceutical production unit for several years; it was idled in 2003.

Document No. ORAUT-TKBS-0037 Revision No. 01 Effective Date: 01/25/2013 Page 21 of 120 Radiological Locations There are more than a dozen buildings in TA-V, which is primarily known for its research reactor and hot cell complex. Buildings housing the reactors, sources, and the HCF are the radiological facilities in this area.
2.4.6 Other Areas
SNL has test areas other than the five TAs listed above. These test areas, including Thunder Range in the canyons on the west side of the Manzanita Mountains, are known collectively as Coyote Test Field, which is southeast of TA-III.
The Nevada Test Site (now the Nevada National Security Site; for convenience, this site profile refers to it as NTS) was used in 1957 for testing nuclear systems and bomb components in a limited series of aboveground tests (DOE 1997). After Russia ended the initial agreement on a nuclear test ban in 1961, the United States reinitiated testing. All further testing occurred underground. A series of underground nuclear tests was conducted between 1962 and 1973. Event-associated services were provided by the Environmental Sciences Department of Reynolds Electrical & Engineering Company. Health physics support was supplied by SNL (REECo 1974).
The TTR in Nevada was established in 1957 for testing nonnuclear systems and bomb components. Many of these tests involved components containing depleted uranium (DU); there is evidence of DU contamination at the site.
SNL conducted nonnuclear weapons testing in Hawaii at the naval facility on Kauai. The facility was used to launch missiles carrying experimental nonnuclear payloads (DOE 1997).
2.5 MAJOR SITE INCIDENTS
A single incident of “serious overexposure” at SNL occurred in 1960. The event involved misuse of one of the new research Van de Graaff accelerators. A single employee received a life-threatening exposure and serious hand injuries when the interlock protocol intended to prevent such situations was contravened. Additional monitoring equipment was installed and revised protocols were created; no similar events have occurred.
No other major site incidents were recorded at SNL.
2.6 HEALTH PROTECTION PRACTICES
2.6.1 Personnel Monitoring
2.6.1.1 Badging
From 1948 to 1958, the exposure monitoring program used simple single-area film badges. Batches of these badges were periodically tested with a gridded table with pegs at specified distances from a central 226Ra source (traceable to the National Bureau of Standards). The data from readings of badges was manually recorded on 5- by 8-in. file cards. The format for recording data was eventually changed to punch cards so the data could be entered into a computerized database. In 1959, Eberline automated the readers and four-spot film badges like those used at Oak Ridge National Laboratory were introduced. About the same time, Victoreen R Chambers were introduced into the calibration process to allow the precision of the calibration exposures to be more readily determined. Before 1949, dosimetry was provided by LASL.

Document No. ORAUT-TKBS-0037 Revision No. 01 Effective Date: 01/25/2013 Page 22 of 120 In May 1971, thermoluminescent dosimeters (TLDs) replaced all film badges. Before then, several radiation field-mapping studies for new source areas continued to use both film badges and TLDs to compare the familiar form of exposure data with data from the more sensitive TLDs.
Section 6.0 provides further discussion of site dosimetry.
2.6.1.2 Area Monitoring
In 1960, area monitors were in use in some areas, but had not yet been fully installed in the work area adjacent to the Van de Graaff generator, where the serious overexposure incident occurred. After that incident, the system was widely expanded to serve as a warning system to supplement the badge program.
2.6.2 Access Control
SNL has changed over time from a laboratory where mostly classified activities took place to a relatively open campus where outside researchers from industry, academia, and other national laboratories can gain access to the site’s facilities. In the early years, the majority of work was classified and access to facilities was strictly controlled by physical barriers.
3.0 OCCUPATIONAL MEDICAL DOSE
3.1 INTRODUCTION
3.1.1 Purpose
This section presents information that can be used by a dose reconstructor to estimate the dose to a worker from occupational medical X-rays administered for screening and as a condition of employment at SNL.
3.1.2 Scope
This section provides specific information on documentation of historical medical X-ray practices at SNL.
3.2 EXAMINATION TYPES AND FREQUENCIES
As already mentioned in section 2.2, SNL had its origin as a satellite support site for the Los Alamos Scientific Laboratory [LASL; later renamed Los Alamos National Laboratory (LANL)] beginning in 1945. It is reasonable to assume that the earliest Sandia workers may have been employed by LANL, and that their X-ray records reside there. Therefore, dose reconstructors should submit a request for additional medical records from LANL when SNL workers have verified employment before about 1953, the earliest known X-ray equipment at SNL. If it appears from the requested records that the early X-rays were taken at LANL (before the worker reported for duty at Sandia), dose reconstructors should use the LANL doses. If it appears that the early X-rays were taken at Sandia (even though the worker was a LANL employee) then dose reconstructors should use the Sandia doses.
Detailed documentation of X-ray examination protocols is not available for SNL. Based on interviews with two former X-ray technologists and on review of employee medical records, a reasonably clear picture of the frequencies and types of radiographs taken at SNL over the years can be constructed (Stout 2005). Table 3-1 summarizes this information.
The table summarizes the current knowledge about the frequencies of the X-ray screening procedures from historical documents, interviews, and claim file records. Dose reconstructors should

Document No. ORAUT-TKBS-0037 Revision No. 01 Effective Date: 01/25/2013 Page 23 of 120 consider the frequencies listed in Table 3-1 to be default values unless other documented data in the energy employee files are available.
From 1953 to 1985, SNL routinely performed preemployment or new-hire chest X-ray examinations, but it appears that not all new hires received these chest X-rays because the individual could choose to forego this portion of the examination. Further, employees transferring to SNL from other government agencies or contract facilities often brought their chest X-rays with them, so SNL did not repeat this procedure as a part of the new-hire examination (KES 2005). If X-ray examinations were performed in non-EEOICPA-covered facilities, the related dose cannot be included in dose reconstructions (ORAUT 2011a).
Table 3-1. Frequency and types of medical radiographs. Period Type Frequency Comments
1943–1953 (from LANL)
Single-projection PFG (Shipman 1955,1958)
Preemployment/new hire All workers.
Semiannual Workers handling uranium, plutonium, polonium, and beryllium oxide, and glass blowers (Hempleman 1944; Grier and Hardy 1949)
Annual Workers exposed to radiation (Hempelmann 1944) Termination All workers.
1953–1956 (KES 2005)
Chest PFG and/or 14- by 17-in. PA chest
Preemployment/new hire + annual
Selected individuals could have received standard 14- by 17-in. PA chest radiographs in addition to PFG. Employee could choose to forego a chest X-ray. Annual 14- by 17-in. chest X-ray was required for respirator users. X-ray records in the claim file should be used in determining the type and frequency of X-ray procedures.
1957–1966 PA chest, 14 by 17 in.
Preemployment/new hire + annual
Employee could choose to forego chest X-ray. Annual 14- by 17-in. chest X-ray for respirator users.
1967–1974 PA chest, 14 by 17 in.
Preemployment/new hire + biennial; some annual
Employee could choose to forego chest X-ray. Annual 14- by 17-in. chest X-ray for respirator users.
1975–present PA chest, 14 by 17 in.
Preemployment/new hire + every 5 years; some annual
Employee could choose to forego chest X-ray. Annual 14- by 17-in. chest X-ray for respirator users.
1953–1985 Lumbar spine
Preemployment/new hire Four projections: AP; LAT; AP angle at S1 level, LAT spot. Performed on small percentage of workers, probably according to job classification.
From a review of employee X-ray folders, the standard procedure through 1956 was to use 4- by 5-in. chest photofluorography (PFG), with some employees receiving 14- by 17-in. posterior-anterior (PA) projections, perhaps in addition to the PFG (KES 2005). However, if an energy employee’s record shows a distance of 72 in., the exam was not a PFG and, therefore, a dose associated with a 14- by 17-in. examination should be assigned. Selected employees also received lumbar spine radiographs. The lumbar spine radiographs are assumed to consist of four projections: an anterior-posterior (AP), a lateral (LAT), an AP angle at the S1 level, and an L5-S1 LAT spot film (KES 2005; ORAUT 2011b).
Employee medical records indicate that SNL took PA chest films for most but not all employees on an annual or biennial frequency through 1966. In 1967, the frequency changed to biennial or triennial; to be favorable to claimants, this analysis assumed a biennial frequency. In 1975, the chest X-ray frequency changed to a 5-year cycle with the exception of a relatively small number of employees in special surveillance programs, and SNL discontinued lumbar spine radiographs for most job classifications. Employees with job classifications with higher risk for back injury, such as maintenance personnel and heavy-equipment operators, received lumbar spine X-rays and

Document No. ORAUT-TKBS-0037 Revision No. 01 Effective Date: 01/25/2013 Page 24 of 120 employees whose job duties required qualification to wear a respirator received chest X-rays on an annual basis.
By about 1983, the number of chest X-rays taken at SNL was reduced by about 50%; they were limited based on medical history and job classification. Screening lumbar spine X-rays were discontinued in the mid-1980s. To be favorable to claimants, this analysis extended the date of this change through 1985 (as indicated in Table 3-1). In 1989, SNL again revised the physical examination protocol. Radiographs were limited to PA projections of the chest requested by a physician based on worker medical history and job classification (Clevenger 1990).
3.3 TECHNIQUE FACTORS AND INCIDENT AIR KERMA
3.3.1 Photofluorography, 1943-1956 (at LANL)
No documentation about PFG apparatus or techniques has been found for SNL. However, this imaging method was extensively used at LANL (ORAUT 2010d). X-ray records for early SNL employment should be requested from LANL. It appears that both the PFG and the 14- by 17-in. chest films consisted of a single posterior-anterior (PA) projection in the earliest period at LANL (Shipman 1948). Dose reconstructors should be able to identify the PFG examinations in the claim file records when the examination occurred between 1943 and 1956, and when a “film number” is recorded, indicating the use of roll rather than sheet film. Dose reconstructors should assume a two-exposure stereo PFG only when the words “serial 1 and 2” appear on the record or radiologist’s interpretation. PFG at LANL ended in 1956 (Shipman 1958, p. 35).
Dose values for PFG at LANL are based on the default values for PFG in Dose Reconstruction from Occupational Medical X-Ray Procedures (ORAUT 2011b), except the doses are calculated for a single-exposure PFG (not stereo exposures) and reproduced in Table 3-5. A default incident air kerma value of 1.14 cGy for the single projection PFG (i.e. non-stereo) is used as the basis for the organ dose in this site profile (ORAUT 2011b).
3.3.2 Radiography, 1943 Through 1952 (at LANL)
Dose values for conventional 14- by 17-in. chest radiography for LANL from 1943 through 1952 are also based on the default values for chest radiography in Dose Reconstruction from Occupational Medical X-Ray Procedures (ORAUT 2011b).
3.3.3 Radiography, 1953 Through 1977 (at SNL)
The type of apparatus used before 1978 is undocumented. The official SNL history indicates that at least one radiographic X-ray machine went into service by 1953 (Johnson 1997). A 1977 radiological protection survey of the unit did not record machine details, referring to it only as “the medical X-ray unit” (Burnett 1977). The survey documented compliance with NCRP Report 33, which recommends a minimum total filter of 2.5 mm Al for operation above 70 kVp (NCRP 1968); the machine was presumably so equipped. The survey report noted a single deficiency (the light field projected by the adjustable collimator was not congruent with the actual X-ray field defined by the collimator) but did not mention the degree of incongruence. The report noted that this condition was found previously and, because “... no lasting remedy has been found,” recommended continued use of the collimator “because replacement of the complete unit is imminent”; the unit was replaced the following year.
Burnett (1977) included a tabulation of entrance skin exposure (ESE) for various types of examinations, including PA chest radiography and AP and LAT lumbar spine. Although stating these values were “... several percent low because no phantom was used in the measurements,” the survey report did not specify measurement technique and instrumentation; therefore, it is not known how the

Document No. ORAUT-TKBS-0037 Revision No. 01 Effective Date: 01/25/2013 Page 25 of 120 measurements were made and it is not possible to determine if there were errors in measurement. However, the reported technique factors can be used to determine the incident air kerma. For a PA chest radiograph, the ESE is given as 5 mR based on a 70-kVp beam and an exposure of 10 mAs. For these technique factors, and assuming a total of 2.5-mm Al equivalent filtration, Table B.3 of NCRP Report 102 indicates an average output of 0.11 cGy/100 mAs for a 70-kVp beam at the source-to-image distance (SID) of 183 cm (NCRP 1997). For a 10-mAs exposure, this equates to 0.011/ 100 mAs at 183 cm. The incident air kerma is given by the equation
2(0.11cGy/100mAs)(10mAs)(183/155) 0.0153cGya,iK = = (3-1)
where Ka,i is the incident air kerma in centigrays and (183/155)2 is the inverse square factor to convert intensity at the SID of 183 cm to intensity at the source-to-skin distance (SSD) of 155 cm (ORAUT 2011b).
The incident air kerma for the LAT chest is 2.5 times that of the PA chest (ORAUT 2011b), or 0.0383 cGy.
For the AP lumbar spine projection, Burnett (1977) reports an ESE of 125 mR for an exposure of 40 mAs at 75 kVp and a total filtration of 2.5 mm Al. The average output from Table B.3 of NCRP Report 102 is estimated at 0.45 cGy/100 mAs at 102 cm (NCRP 1997). Thus, as described above, the incident air kerma for the AP lumbar spine projection, based on a 75-kVp beam and an exposure of 40 mAs, assuming a total of 2.5-mm Al equivalent filtration, is
20.45 cGy/100 mAs 40 mAs 100/74) , or 0.329( )( )( cGy ,
where the SID is 102 cm and the SSD is 74 cm (ORAUT 2011b). For a LAT lumbar spine projection, Burnett (1977) indicated an ESE of 600 mR for an exposure of 150 mAs at 85 kVp. The average output from Table B.3 of NCRP Report 102 is estimated at 0.55 cGy/100 mAs at 100 cm (NCRP 1997). Thus, as described above, the incident air kerma for the LAT lumbar spine projection, based on a 85-kVp beam and an exposure of 150 mAs, assuming a total of 2.5-mm Al equivalent filtration is (0.55 cGy/100 mAs)(150 mAs)(100/63)2, or 2.07 cGy.
AP and LAT lumbar spine spot film data are not available; the calculated incident air kerma values in Table 3-2 are estimates based on the AP and LAT lumbar spine projections (ORAUT 2011b).
Table 3-2. Machine settings and incident air kerma for screening radiography,a 1953 through 1977.
Procedure kVp mAs Calculated incident
air kerma (cGy) PA chest 70 10 0.0153 LAT chest 70 10 0.0383 AP lumbar spine 75 40 0.328 LAT lumbar spine 85 150 2.08
AP angle lumbar spine (b) (b) 0.328
Lumbar spine spot film, LAT (b) (b) 2.08
a. Apply procedures per the guidance of Section 3.2. b. No data are available and the values are estimated according to ORAUT 2011b.
3.3.4 Radiography, 1978 Through 1995
In 1978, the SNL Medical Department installed a new Picker GX 325 X-ray unit. This unit was equipped with a phototimer that was used for most chest X-rays and automatic collimation to limit the beam to the appropriate film size.

Document No. ORAUT-TKBS-0037 Revision No. 01 Effective Date: 01/25/2013 Page 26 of 120 A January 1991 study of skin doses on a phantom for various X-ray procedures reported results for shallow and deep doses (Sanderville 1991). Shallow dose (at 1 cm) was corrected to skin dose at the surface, including backscatter, using depth dose factors from NCRP Report 102 (NCRP 1989, Table B.8). This value was converted to incident air kerma using backscatter factors from NCRP Report 102 (Table B.8). For the mid-PA chest, taken at 120 kVp with an exposure of 3.3 mAs, a shallow dose of 21 mrem was reported. Using a backscatter factor of 1.4 interpolated from NCRP Report 102, assuming 1 mrem = 1 mrad and using units of cGy (1 cGy = 1,000 mrad), results in an incident air kerma of 0.016 cGy. Table 3-3 lists similar values calculated for the LAT chest and lumbar spine projections using a backscatter factor of 1.35 along with the measured shallow dose values.
Table 3-3. Machine settings and incident air kerma for screening radiography,a 1978 through 1995.
Procedure kVp HVL
(mm AL) mAs Measured shallow
doseb (mrem) Calculated incident air
kerma (cGy) PA chest 120 3.5 3.3 21 0.016 LAT chest 120 3.5 10 64 0.048 AP lumbar spine 75 2.5 50 385 0.319 LAT lumbar spine 80 2.5 80 754 0.625c AP lumbar spine spot (d) 2.5 (d) 385 0.319 LAT lumbar spine spot 90 2.5 80 954 0.790c
a. Apply procedures per the guidance of Section 3.2. b. Includes backscatter. c. The average of the LAT and the LAT spot were used in the dose calculations . d. No data are available; same as AP lumbar spine (ORAUT 2011b).
3.3.5 Radiography, 1996 to Present
In 1996, SNL changed the X-ray apparatus and installed a Picker High Frequency (HF) unit. This machine was equipped with automatic exposure at 3 mAs that was used for most chest radiographs and automatic collimation to limit the beam size to that of the film used. Most exposures were made with the phototimer. Table 3-4 lists manual machine settings and corresponding calculated incident air kerma values.
Table 3-4. Manual settings and incident air kerma for screening medical radiography,a 1997 to present.
Procedure KVp HVL
(mm AL) Measured ESE (mR)b
Exposure (mAs)
SID (in.)
Calculated incident air kerma (cGy)
PA chest 80 4 13 3.3 72 0.0114 LAT chestc --- --- --- --- --- 0.0285
a. Apply procedures per the guidance of Section 3.2. b. From Antonsen (1997). c. ORAUT (2011b).
On March 13, 1997, this apparatus was evaluated as part of a comprehensive radiation protection survey performed by a radiation specialist with the U.S. Food and Drug Administration (Antonsen 1997). According to the report, the X-ray unit met all applicable standards and specifications except that the acceptable standard total percent difference (length and width) between the X-ray field and light field alignment for the wall cassette of 4% was slightly exceeded (4.4%) when the automatic collimation was evaluated (Antonsen 1997). Correction was made 11 days after the survey report was received by SNL (Stout 1997). This small deviation should have had no significant impact on organ doses.
An in-depth radiographic unit performance summary by a Board-certified medical physicist, on May 20, 2005, found that the unit was in compliance with the New Mexico Radiation Protection Code and met current performance recommendations of the American Association of Physicists in Medicine (Heintz 2005). Beam quality at 80 kVp was determined and a calculated half-value layer (HVL) of

Document No. ORAUT-TKBS-0037 Revision No. 01 Effective Date: 01/25/2013 Page 27 of 120 3.71 mm Al was obtained. Thus, for dose reconstruction, an HVL of 4 mm Al was assumed in order to account for higher kVp techniques. Table 3-4 summarizes these for radiographic procedures and manual technique factors.
The incident air kerma is calculated from (ORAUT 2011b):
1 1a,iK (R)(2.58E-4C/kg R )(33.97J/C)(100cGy/Gy)(1Gy/1J kg )− −= (3-2)
where
Ka,i is the incident air kerma to be used in organ dose calculations in units of cGy in air; R is the exposure in roentgens at the skin entrance plane (i.e., ESE) 2.58E-4 C/kg R-1 is the conversion factor from R to coulombs per kilogram
3.4 X-RAY DOSES TO WORKERS
3.4.1 Conversion of ESE to Dose
Organ and skin doses were determined according to methods described in ORAUT (2011b).
3.4.2 Organ Doses from Chest Photofluorography
No documentation about PFG apparatus or techniques has been found for SNL. However, this imaging method was extensively used at LANL (ORAUT 2010) where early SNL workers were likely X-rayed. .Because no measurements or other information on PFG apparatus have been found, organ and skin doses were determined according to methods described in ORAUT (2011b). Because LANL primarily used the single (non-stereo) projection for PFG, the incident air kerma value used for PFG in this site profile is half that listed in ORAUT (2011b). Table 3-5 lists calculated organ doses for chest PFG and Table 3-6 lists calculated skin doses for chest PFG.
3.4.3 Organ Doses from 14- by 17-in. PA Chest Radiography
Organ and skin doses were determined according to methods described in ORAUT (2011b). Table 3-5 provides organ dose equivalents for chest projections for all periods. Tables 3-6, 3-7, and 3-8 provide skin dose guidance and skin dose equivalents for chest projections. In addition to PA and LAT projection doses, oblique projection and right anterior oblique (RAO) projection doses are provided. Further detail on the various X-ray projections and derivation of doses is provided in ORAUT (2011b).
Entrance skin dose (ENSD) is determined by multiplying the incident air kerma by the backscatter factors of 1.35 and 1.4 for HVL of 2.5 and 3.5 mm Al, respectively, from NCRP Report 102 (NCRP 1997, Table B.8). Skin doses for all areas of skin are provided in Tables 3-5 through 3-11.
3.4.4 Organ Doses from Lumbar Spine Radiography
Organ and skin doses were determined according to methods described in ORAUT (2011b). Table 3-9 provides organ dose equivalents for lumbar spine projections through 1985. Tables 3-10 and 3-11 provide skin dose guidance and skin dose equivalents for lumbar spine projections. Further detail on the various X-ray projections and derivation of doses is provided in ORAUT (2011b).

Document No. ORAUT-TKBS-0037 Revision No. 01 Effective Date: 01/25/2013 Page 28 of 120 3.5 UNCERTAINTY ANALYSIS
ORAUT-OTIB-0006 (ORAUT 2011b) lists the major sources of uncertainty in X-ray output intensity and subsequent effect on dose to the worker. The five sources of uncertainty are:
1. X-ray beam measurement error (±2%), 2. Variation in peak kilovoltage (±9%), 3. Variation in X-ray beam current (±5%), 4. Variation in exposure time (±25%), and 5. Variation in SSD as a result of worker size (±10%).
The 10% uncertainty in output intensity as a result of worker size was based on an inverse square correction of output intensity changes from differences of standard chest thickness of ±7.5 cm.
These uncertainties are assumed to be random; therefore, the combined statistical uncertainty was calculated as the square root of the sum of the squares of all the uncertainties, which is ±28.9%. Rounding this up to ±30% provides an adequate and suitably conservative indication of uncertainty. Therefore, for a derived dose equivalent to an individual organ, a total combined standard uncertainty of ±30% can be assumed. Dose reconstructors should, therefore, input the organ dose equivalent as the mean of a normal distribution with a standard uncertainty of ±30%.

Document No. ORAUT-TKBS-0037 Revision No. 01 Effective Date: 01/25/2013 Page 29 of 120 Table 3-5. Organ dose equivalents (rem) for chest projections for all periods.
Organ Projection
PFG (at LANL),
1943–1952a
14- by 17-in. (at LANL), 1943–1952
14- by 17-in., 1953–1977
14- by 17-in., 1978–1995
14- by 17-in., 1996–
present Thyroid PA 1.97E–01 3.48E-02 2.66E-03 9.92E-04 8.89E-04
LAT/OBL -- -- 5.25E-03 7.25E-03 4.67E-03 Eye/brain PA 3.63E–02 6.40E-03 4.90E-4 9.92E-04 8.89E-04
LAT/OBL -- -- 5.25E-03 7.25E-03 4.67E-03 Ovaries PA 2.50E–02 2.50E-02 2.57E-03b 5.12E-05 5.93E-05
LAT/OBL -- -- 2.18E-03b 7.68E-05 7.13E-05 Urinary bladder/prostate
PA 2.50E–02 2.50E-02 2.57E-03b 5.12E-05 5.93E-05 LAT/OBL -- -- 2.18E-03b 7.68E-05 7.13E-05
Colon/rectum PA 2.50E–02 2.50E-02 2.57E-03b 5.12E-05 5.93E-05 LAT/OBL -- -- 2.18E-03b 7.68E-05 7.13E-05
Testes PA 5.00E–03 5.00E-03 2.14E-04b 1.60E-07 1.14E-07 LAT/OBL -- -- 1.15E-04b 4.80E-06 2.85E-06
Lungs (male) PA 4.75E–01 8.38E-02 6.41E-03 9.04E-03 7.16E-03 LAT/OBL -- -- 7.39E-03 1.32E-02 8.92E-03
Lungs (female) PA 5.11E-01 9.02E-02 6.90E-03 9.76E-03 7.68E-03 LAT/OBL -- -- 8.43E-03 1.49E-02 1.00E-02
Thymus PA 5.11E-01 9.02E-02 6.90E-03 9.76E-03 7.68E-03 LAT/OBL -- -- 8.43E-03 1.49E-02 1.00E-02
Esophagus PA 5.11E-01 9.02E-02 6.90E-03 9.76E-03 7.68E-03 LAT/OBL -- -- 8.43E-03 1.49E-02 1.00E-02
Stomach PA 5.11E-01 9.02E-02 6.90E-03 9.76E-03 7.68E-03 LAT/OBL -- -- 8.43E-03 1.49E-02 1.00E-02
Bone surface PA 5.11E-01 9.02E-02 6.90E-03 9.76E-03 7.68E-03 LAT/OBL -- -- 8.43E-03 1.49E-02 1.00E-02
Liver/gall bladder/spleen/ pancreas
PA 5.11E-01 9.02E-02 6.90E-03 9.76E-03 7.68E-03 LAT/OBL -- -- 8.43E-03 1.49E-02 1.00E-02
Remainder organs
PA 5.11E-01 9.02E-02 6.90E-03 9.76E-03 7.68E-03 LAT/OBL -- -- 8.43E-03 1.49E-02 1.00E-02
Breast PA 5.56E–02 9.80E-03 7.50E-04 1.46E-03 1.32E-03 LAT/OBL -- -- 9.77E-03 1.52E-02 9.78E-03
Uterus PA 2.50E–02 2.50E-02 2.28E-03b 4.80E-05 5.93E-05 LAT/OBL -- -- 1.65E-03b 6.72E-05 5.99E-05
Bone marrow (male)
PA 1.04E–01 1.84E-02 1.41E-03 2.34E-03 2.03E-03 LAT/OBL -- -- 1.42E-03 2.93E-03 2.17E-03
Bone marrow (female)
PA 9.75E–02 1.72E-02 1.32E-03 2.26E-03 1.96E-03 LAT/OBL -- -- 1.11E-03 2.30E-03 1.68E-03
Entrance skinc PA 1.53E+00 2.70E-01 2.07E-02 2.24E-02 1.60E-02 LAT/OBL -- -- 5.17E-02 6.72E-02 3.99E-02
a. PFG presumed to have been done at LANL. Doses for are from ORAUT-OTIB-0006 (ORAUT 2011b) and are for non-stereo projections.
b. DCF for the PA abdomen was used to determine dose. c. Using method described in ORAUT-OTIB-0006 (ORAUT 2011b).

D
ocument N
o. OR
AU
T-TKS-0037
Revision N
o. 01 Effective D
ate: 01/25/2013 Page 30 of 120
Table 3-6. Skin dose guidance and skin dose equivalents (rem) for chest projections, 1953 through 1977.
Area of skin
PFG 1943–1952 PA chest LAT chest 1953–1977 RAO chest 1953–1977
Guidance Dose Guidance 1943–1952
Dose 1953–1977
Dose Guidance Dose Guidance Dose Right front shoulder EXSD 3.36E–02 EXSD 5.9E-03 5.E-04 ENSD 5.17E-02 EXSD 2.E-04 Right back shoulder ENSD 1.53E+00 ENSD 2.70E-01 2.07E-02 ENSD 5.17E-02 ENSD 5.17E-02 Left front shoulder EXSD 3.36E–02 EXSD 5.9E-03 5.E-04 EXSD 2.E-04 EXSD 2.E-04 Left back shoulder ENSD 1.53E+00 ENSD 2.70E-01 2.07E-02 EXSD 2.E-04 ENSD 5.17E-02 Right upper arm to elbow
10% ENSD 1.53E–01 ENSD 2.70E-01 2.07E-02 ENSD 5.17E-02 ENSD 5.17E-02
Left upper arm to elbow
10% ENSD 1.53E–01 ENSD 2.70E-01 2.07E-02 EXSD 2.E-04 ENSD 5.17E-02
Left hand ENSD 1.53E+00 ENSD 2.70E-01 2.07E-02 10% ENSD 5.2E-03 10% ENSD 5.2E-03 Right hand ENSD 1.53E+00 ENSD 2.70E-01 2.07E-02 10% ENSD 5.2E-03 10% ENSD 5.2E-03 Left elbow, forearm, wrist
10% ENSD 1.53E–01 ENSD 2.70E-01 2.07E-02 10% ENSD 5.2E-03 10% ENSD 5.2E-03
Right elbow, forearm, wrist
10% ENSD 1.53E–01 ENSD 2.70E-01 2.07E-02 10% ENSD 5.2E-03 10% ENSD 5.2E-03
Right side of head (including ear and temple)
10% ENSD 1.53E–01 10% ENSD 2.70E-02 2.1E-03 Eye/brain 5.2E-03 10% EXSD 2.E-05
Left side of head (including ear and temple)
10% ENSD 1.53E–01 10% ENSD 2.70E-02 2.1E-03 Eye/brain 5.2E-03 10% ENSD 5.2E-03
Front left thigh RSD (0.52 m) 4.E–04 RSD (0.52 m) 8.E-05 6.E-06 RSD (0.52 m) 8.E-06 RSD (0.52 m) 8.E-06 Back left thigh RSD (0.52 m) 4.E–04 RSD (0.52 m) 8.E-05 6.E-06 RSD (0.52 m) 8.E-06 RSD (0.52 m) 8.E-06 Front right thigh RSD (0.52 m) 4.E–04 RSD (0.52 m) 8.E-05 6.E-06 RSD (0.52 m) 8.E-06 RSD (0.52 m) 8.E-06 Back right thigh RSD (0.52 m) 4.E–04 RSD (0.52 m) 8.E-05 6.E-06 RSD (0.52 m) 8.E-06 RSD (0.52 m) 8.E-06 Left knee and below RSD (0.86 m) 2.E–04 RSD (0.86 m) 3.E-05 2.E-06 RSD (0.86 m) 3.E-06 RSD (0.86 m) 3.E-06 Right knee and below RSD (0.86 m) 2.E–04 RSD (0.86 m) 3.E-05 2.E-06 RSD (0.86 m) 3.E-06 RSD (0.86 m) 3.E-06 Left side of face Eye/brain 3.63E–02 Eye/brain 6.4E-03 5.E-04 Eye/brain 5.2E-03 ENSD 5.17E-02 Right side of face Eye/brain 3.63E–02 Eye/brain 6.4E-03 5.E-04 Eye/brain 5.2E-03 EXSD 2.E-04 Left side of neck 10% ENSD 1.53E–01 ENSD 2.70E-01 2.07E-02 Eye/brain 5.2E-03 ENSD 5.17E-02 Right side of neck 10% ENSD 1.53E–01 ENSD 2.70E-01 2.07E-02 Eye/brain 5.2E-03 EXSD 2.E-04 Back of head 10% ENSD 1.53E–01 10% ENSD 2.70E-02 2.1E-03 Eye/brain 5.2E-03 10% ENSD 5.2E-03 Front of neck Eye/brain 3.63E–02 Eye/brain 6.4E-03 5.E-04 Eye/brain 5.2E-03 Eye/Brain 5.2E-03 Back of neck 10% ENSD 1.53E–01 ENSD 2.70E-01 2.07E-02 Eye/brain 5.2E-03 ENSD 5.17E-02 Front torso: base of neck to end of sternum
EXSD 3.36E–02 EXSD 5.9E-03 5.E-04 Lung 8.4E-03 EXSD 2.E-04

D
ocument N
o. OR
AU
T-TKS-0037
Revision N
o. 01 Effective D
ate: 01/25/2013 Page 31 of 120
Area of skin
PFG 1943–1952 PA chest LAT chest 1953–1977 RAO chest 1953–1977
Guidance Dose Guidance 1943–1952
Dose 1953–1977
Dose Guidance Dose Guidance Dose Front torso: end of sternum to lowest rib
EXSD 3.36E–02 EXSD 5.9E-03 5.E-04 Lung 8.4E-03 EXSD 2.E-04
Front torso: lowest rib to iliac crest
EXSD 3.36E–02 EXSD 5.9E-03 5.E-04 Lung 8.4E-03 EXSD 2.E-04
Front torso: iliac crest to pubis
10% EXSD 3.4E–03 10% EXSD 6.E-04 5.E-05 10% lung 8.E-04 10% EXSD 2.E-05
Back torso: base of neck to mid-back
ENSD 1.53E+00 ENSD 2.70E-01 2.07E-02 Lung 8.4E-03 ENSD 5.17E-02
Back torso: mid-back to lowest rib
ENSD 1.53E+00 ENSD 2.70E-01 2.07E-02 Lung 8.4E-03 ENSD 5.17E-02
Back torso: lowest rib to iliac crest
ENSD 1.53E+00 ENSD 2.70E-01 2.07E-02 Lung 8.4E-03 ENSD 5.17E-02
Back torso: buttocks (Iliac crest and below)
10% ENSD 1.53E–01 10% ENSD 2.70E-02 2.1E-03 10% Lung 8.E-04 10% ENSD 5.2E-03
Right torso: base of neck to end of sternum
ENSD 1.53E+00 ENSD 2.70E-01 2.07E-02 ENSD 5.17E-02 EXSD 2.E-04
Right torso: end of sternum to lowest rib
ENSD 1.53E+00 ENSD 2.70E-01 2.07E-02 ENSD 5.17E-02 EXSD 2.E-04
Right torso: lowest rib to iliac crest
ENSD 1.53E+00 ENSD 2.70E-01 2.07E-02 ENSD 5.17E-02 EXSD 2.E-04
Right torso: iliac crest to pubis (right hip)
10% ENSD 1.53E–01 10% ENSD 2.70E-02 2.1E-03 10% ENSD 5.2E-03 10% EXSD 2.E-05
Left torso: base of neck to end of sternum
ENSD 1.53E+00 ENSD 2.70E-01 2.07E-02 EXSD 2.E-04 ENSD 5.17E-02
Left torso: end of sternum to lowest rib
ENSD 1.53E+00 ENSD 2.70E-01 2.07E-02 EXSD 2.E-04 ENSD 5.17E-02
Left torso: lowest rib to iliac crest
ENSD 1.53E+00 ENSD 2.70E-01 2.07E-02 EXSD 2.E-04 ENSD 5.17E-02
Left torso: iliac crest to pubis (left hip)
10% ENSD 1.53E–01 10% ENSD 2.70E-02 2.1E-03 10% EXSD 2.E-05 10% ENSD 5.2E-03

D
ocument N
o. OR
AU
T-TKS-0037
Revision N
o. 01 Effective D
ate: 01/25/2013 Page 32 of 120
Table 3-7. Skin dose guidance and skin dose equivalents (rem) for chest projections, 1978 through 1995.
Area of skin PA chest, 1978–1995 LAT chest, 1978–1995 RAO chest, 1978–1995 Guidance Dose Guidance Dose Guidance Dose
Right front shoulder EXSD 6.E-04 ENSD 6.72E-02 EXSD 4.E-04 Right back shoulder ENSD 2.24E-02 ENSD 6.72E-02 ENSD 6.72E-02 Left front shoulder EXSD 6.E-04 EXSD 4.E-04 EXSD 4.E-04 Left back shoulder ENSD 2.24E-02 EXSD 4.E-04 ENSD 6.72E-02 Right upper arm to elbow 10% ENSD 2.2E-03 ENSD 6.72E-02 10% ENSD 6.7E-03 Left upper arm to elbow 10% ENSD 2.2E-03 EXSD 4.E-04 10% ENSD 6.7E-03 Left hand 10% ENSD 2.2E-03 10% ENSD 6.7E-03 10% ENSD 6.7E-03 Right hand 10% ENSD 2.2E-03 10% ENSD 6.7E-03 10% ENSD 6.7E-03 Left elbow, forearm, wrist 10% ENSD 2.2E-03 10% ENSD 6.7E-03 10% ENSD 6.7E-03 Right elbow, forearm, wrist 10% ENSD 2.2E-03 10% ENSD 6.7E-03 10% ENSD 6.7E-03 Right side of head (including ear and temple) 10% ENSD 2.2E-03 10% ENSD 6.7E-03 10% EXSD 4.E-05 Left side of head (including ear and temple) 10% ENSD 2.2E-03 10% ENSD 6.7E-03 10% ENSD 6.7E-03 Front left thigh RSD (0.52 m) 8.E-06 RSD (0.52 m) 1.E-05 RSD (0.52 m) 1.E-05 Back left thigh RSD (0.52 m) 8.E-06 RSD (0.52 m) 1.E-05 RSD (0.52 m) 1.E-05 Front right thigh RSD (0.52 m) 8.E-06 RSD (0.52 m) 1.E-05 RSD (0.52 m) 1.E-05 Back right thigh RSD (0.52 m) 8.E-06 RSD (0.52 m) 1.E-05 RSD (0.52 m) 1.E-05 Left knee and below RSD (0.86 m) 3.E-06 RSD (0.86 m) 4.E-06 RSD (0.86 m) 4.E-06 Right knee and below RSD (0.86 m) 3.E-06 RSD (0.86 m) 4.E-06 RSD (0.86 m) 4.E-06 Left side of face Eye/brain 9.9E-04 10% ENSD 6.7E-03 10% ENSD 6.7E-03 Right side of face Eye/brain 9.9E-04 10% ENSD 6.7E-03 10% EXSD 4.E-05 Left side of neck 10% ENSD 2.2E-03 10% ENSD 6.7E-03 10% ENSD 6.7E-03 Right side of neck 10% ENSD 2.2E-03 10% ENSD 6.7E-03 10% EXSD 4.E-05 Back of head 10% ENSD 2.2E-03 10% ENSD 6.7E-03 10% ENSD 6.7E-03 Front of neck Thyroid 9.9E-04 10% ENSD 6.7E-03 Thyroid 7.25E-03 Back of neck 10% ENSD 2.2E-03 10% ENSD 6.7E-03 10% ENSD 6.7E-03 Front torso: base of neck to end of sternum EXSD 6.E-04 Lung 1.49E-02 EXSD 4.E-04 Front torso: end of sternum to lowest rib EXSD 6.E-04 Lung 1.49E-02 EXSD 4.E-04 Front torso: lowest rib to iliac crest 10% EXSD 6.E-05 10% Lung 1.5E-03 10% EXSD 4.E-05 Front torso: iliac crest to pubis 10% EXSD 6.E-05 10% Lung 1.5E-03 10% EXSD 4.E-05 Back torso: base of neck to mid-back ENSD 2.24E-02 Lung 1.49E-02 ENSD 6.72E-02 Back torso: mid-back to lowest rib ENSD 2.24E-02 Lung 1.49E-02 ENSD 6.72E-02 Back torso: lowest rib to iliac crest 10% ENSD 2.2E-03 10% lung 1.5E-03 10% ENSD 6.7E-03 Back torso: buttocks (Iliac crest and below) 10% ENSD 2.2E-03 10% lung 1.5E-03 10% ENSD 6.7E-03 Right torso: base of neck to end of sternum ENSD 2.24E-02 ENSD 6.72E-02 EXSD 4.E-04 Right torso: end of sternum to lowest rib ENSD 2.24E-02 ENSD 6.72E-02 EXSD 4.E-04 Right torso: lowest rib to iliac crest 10% ENSD 2.2E-03 10% ENSD 6.7E-03 10% EXSD 4.E-05 Right torso: iliac crest to pubis (right hip) 10% ENSD 2.2E-03 10% ENSD 6.7E-03 10% EXSD 4.E-05 Left torso: base of neck to end of sternum ENSD 2.24E-02 EXSD 4.E-04 ENSD 6.72E-02

D
ocument N
o. OR
AU
T-TKS-0037
Revision N
o. 01 Effective D
ate: 01/25/2013 Page 33 of 120
Area of skin PA chest, 1978–1995 LAT chest, 1978–1995 RAO chest, 1978–1995 Guidance Dose Guidance Dose Guidance Dose
Left torso: end of sternum to lowest rib ENSD 2.24E-02 EXSD 4.E-04 ENSD 6.72E-02 Left torso: lowest rib to iliac crest 10% ENSD 2.2E-03 10% EXSD 4.E-05 10% ENSD 6.7E-03 Left torso: iliac crest to pubis (left hip) 10% ENSD 2.2E-03 10% EXSD 4.E-05 10% ENSD 6.7E-03
Table 3-8. Skin dose guidance and skin dose equivalents (rem) for chest projections, 1996 through present.
Area of skin
PA chest, 1996–present LAT chest, 1996–present RAO chest, 1996–present
Guidance Dose Guidance Dose Guidance Dose Right front shoulder EXSD 5.E-04 ENSD 3.99E-02 EXSD 3.E-04 Right back shoulder ENSD 1.60E-02 ENSD 3.99E-02 ENSD 3.99E-02 Left front shoulder EXSD 5.E-04 EXSD 3.E-04 EXSD 3.E-04 Left back shoulder ENSD 1.60E-02 EXSD 3.E-04 ENSD 3.99E-02 Right upper arm to elbow 10% ENSD 1.6E-03 ENSD 3.99E-02 10% ENSD 4.0E-03 Left upper arm to elbow 10% ENSD 1.6E-03 EXSD 3.E-04 10% ENSD 4.0E-03 Left hand 10% ENSD 1.6E-03 10% ENSD 4.0E-03 10% ENSD 4.0E-03 Right hand 10% ENSD 1.6E-03 10% ENSD 4.0E-03 10% ENSD 4.0E-03 Left elbow, forearm, wrist 10% ENSD 1.6E-03 10% ENSD 4.0E-03 10% ENSD 4.0E-03 Right elbow, forearm, wrist 10% ENSD 1.6E-03 10% ENSD 4.0E-03 10% ENSD 4.0E-03 Right side of head (including ear and temple) 10% ENSD 1.6E-03 10% ENSD 4.0E-03 10% EXSD 3.E-05 Left side of head (including ear and temple) 10% ENSD 1.6E-03 10% ENSD 4.0E-03 10% ENSD 4.0E-03 Front left thigh RSD (0.52 m) 6.E-06 RSD (0.52 m) 8.E-06 RSD (0.52 m) 8.E-06 Back left thigh RSD (0.52 m) 6.E-06 RSD (0.52 m) 8.E-06 RSD (0.52 m) 8.E-06 Front right thigh RSD (0.52 m) 6.E-06 RSD (0.52 m) 8.E-06 RSD (0.52 m) 8.E-06 Back right thigh RSD (0.52 m) 6.E-06 RSD (0.52 m) 8.E-06 RSD (0.52 m) 8.E-06 Left knee and below RSD (0.86 m) 2.E-06 RSD (0.86 m) 3.E-06 RSD (0.86 m) 3.E-06 Right knee and below RSD (0.86 m) 2.E-06 RSD (0.86 m) 3.E-06 RSD (0.86 m) 3.E-06 Left side of face Eye/brain 9.E-04 10% ENSD 4.0E-03 10% ENSD 4.0E-03 Right side of face Eye/brain 9.E-04 10% ENSD 4.0E-03 10% EXSD 3.E-05 Left side of neck 10% ENSD 1.6E-03 10% ENSD 4.0E-03 10% ENSD 4.0E-03 Right side of neck 10% ENSD 1.6E-03 10% ENSD 4.0E-03 10% EXSD 3.E-05 Back of head 10% ENSD 1.6E-03 10% ENSD 4.0E-03 10% ENSD 4.0E-03 Front of neck Thyroid 9.E-04 10% ENSD 4.0E-03 Thyroid 4.7E-03 Back of neck 10% ENSD 1.6E-03 10% ENSD 4.0E-03 10% ENSD 4.0E-03 Front torso: base of neck to end of sternum EXSD 5.E-04 Lung 1.00E-02 EXSD 3.E-04 Front torso: end of sternum to lowest rib EXSD 5.E-04 Lung 1.00E-02 EXSD 3.E-04 Front torso: lowest rib to iliac crest 10% EXSD 5.E-05 10% lung 1.0E-03 10% EXSD 3.E-05 Front torso: iliac crest to pubis 10% EXSD 5.E-05 10% lung 1.0E-03 10% EXSD 3.E-05 Back torso: base of neck to mid-back ENSD 1.60E-02 Lung 1.00E-02 ENSD 3.99E-02 Back torso: mid-back to lowest rib ENSD 1.60E-02 Lung 1.00E-02 ENSD 3.99E-02

D
ocument N
o. OR
AU
T-TKS-0037
Revision N
o. 01 Effective D
ate: 01/25/2013 Page 34 of 120
Area of skin
PA chest, 1996–present LAT chest, 1996–present RAO chest, 1996–present
Guidance Dose Guidance Dose Guidance Dose Back torso: lowest rib to iliac crest 10% ENSD 1.6E-03 10% lung 1.0E-03 10% ENSD 4.0E-03 Back torso: buttocks (Iliac crest and below) 10% ENSD 1.6E-03 10% lung 1.0E-03 10% ENSD 4.0E-03 Right torso: base of neck to end of sternum ENSD 1.60E-02 ENSD 3.99E-02 EXSD 3.E-04 Right torso: end of sternum to lowest rib ENSD 1.60E-02 ENSD 3.99E-02 EXSD 3.E-04 Right torso: lowest rib to iliac crest 10% ENSD 1.6E-03 10% ENSD 4.0E-03 10% EXSD 3.E-05 Right torso: iliac crest to pubis (right hip) 10% ENSD 1.6E-03 10% ENSD 4.0E-03 10% EXSD 3.E-05 Left torso: base of neck to end of sternum ENSD 1.60E-02 EXSD 3.E-04 ENSD 3.99E-02 Left torso: end of sternum to lowest rib ENSD 1.60E-02 EXSD 3.E-04 ENSD 3.99E-02 Left torso: lowest rib to iliac crest 10% ENSD 1.6E-03 10% EXSD 3.E-05 10% ENSD 4.0E-03 Left torso: iliac crest to pubis (left hip) 10% ENSD 1.6E-03 10% EXSD 3.E-05 10% ENSD 4.0E-03

Document No. ORAUT-TKBS-0037 Revision No. 01 Effective Date: 01/25/2013 Page 35 of 120 Table 3-9. Organ dose equivalents (rem) for lumbar spine projections for all periods.
Organ
AP and AP spot lumbar spine projections, 1953–1977a
LAT and LAT spot lumbar
spine projections, 1953–1977b
AP and AP spot lumbar spine projections, 1978–1985a
LAT and LAT spot lumbar
spine projections, 1978–1985b
Thyroid 1.97E-04 4.16E-05 1.91E-04 1.42E-05 Eye/brain 1.97E-04 4.16E-05 1.91E-04 1.42E-05 Ovaries 1.42E-01 1.95E-01 1.38E-01 6.66E-02 Urinary/bladder/prostate 1.42E-01 1.95E-01 1.38E-01 6.66E-02 Colon/rectum 1.42E-01 1.95E-01 1.38E-01 6.66E-02 Testes 2.76E-03 3.33E-03 2.68E-03 1.13E-03 Lungs male 5.19E-02 5.82E-02 5.04E-02 1.98E-02 Lungs female 5.19E-02 5.82E-02 5.04E-02 1.98E-02 Thymus 5.19E-02 5.82E-02 5.04E-02 1.98E-02 Esophagus 5.19E-02 5.82E-02 5.04E-02 1.98E-02 Stomach 1.42E-01 1.95E-01 1.38E-01 6.66E-02 Bone surfaces 1.42E-01 1.95E-01 1.38E-01 6.66E-02 Liver/gall bladder/spleen 1.42E-01 1.95E-01 1.38E-01 6.66E-02 Remainder 1.42E-01 1.95E-01 1.38E-01 6.66E-02 Breast 1.11E-03 4.22E-03 5.08E-04 6.38E-04 Uterus 1.89E-01 1.29E-01 1.83E-01 4.39E-02 Bone marrow male 2.43E-02 9.15E-02 2.36E-02 3.12E-02 Bone marrow female 2.43E-02 9.15E-02 2.36E-02 3.12E-02 Entrance skinc 8.87E-01 5.61E+00 8.61E-01 1.71E+00
a. The dose value is for two AP projections, the AP and AP spot for S-1. b. The dose value is for two LAT projections, the LAT and LAT spot for L-4/5. c. Using method described in ORAUT-OTIB-0006 (ORAUT 2011b).
Table 3-10. Skin dose guidance and skin dose equivalents (rem) for lumbar spine projections, 1953 through 1977.
Area of skin
AP and AP spot lumbar spinea, 1953–1977
LAT and LAT spot lumbar spinea, 1953–1977
Guidance Dose Guidance Dose Right front shoulder 10% ENSD 8.87E-02 10% ENSD 5.61E-01 Right back shoulder 10% EXSD 1.9E-03 10% ENSD 5.61E-01 Left front shoulder 10% ENSD 8.87E-02 10% EXSD 2.5E-03 Left back shoulder 10% EXSD 1.9E-03 10% EXSD 2.5E-03 Right upper arm to elbow 10% ENSD 8.87E-02 10% ENSD 5.61E-01 Left upper arm to elbow 10% ENSD 8.87E-02 10% EXSD 2.5E-03 Left hand ENSD 8.87E-01 10% EXSD 2.5E-03 Right hand ENSD 8.87E-01 10% ENSD 5.61E-01 Left elbow, forearm, wrist ENSD 8.87E-01 10% EXSD 2.5E-03 Right elbow, forearm, wrist ENSD 8.87E-01 10% ENSD 5.61E-01 Right side of head (including ear and temple) Eye/brain 2.E-04 Eye/brain 4.E-05 Left side of head (including ear and temple) Eye/brain 2.E-04 Eye/brain 4.E-05 Front left thigh 10% ENSD 8.87E-02 10% EXSD 2.5E-03 Back left thigh 10% EXSD 1.9E-03 10% EXSD 2.5E-03 Front right thigh 10% ENSD 8.87E-02 10% ENSD 5.61E-01 Back right thigh 10% EXSD 1.9E-03 10% ENSD 5.61E-01 Left knee and below RSD (0.60 m) 2.E-04 RSD (0.60 m) 6.E-04 Right knee and below RSD (0.60 m) 2.E-04 RSD (0.60 m) 6.E-04 Left side of face Eye/brain 2.E-04 Eye/brain 4.E-05 Right side of face Eye/brain 2.E-04 Eye/brain 4.E-05 Left side of neck Eye/brain 2.E-04 Eye/brain 4.E-05 Right side of neck Eye/brain 2.E-04 Eye/brain 4.E-05 Back of head Eye/brain 2.E-04 Eye/brain 4.E-05

Document No. ORAUT-TKBS-0037 Revision No. 01 Effective Date: 01/25/2013 Page 36 of 120
Area of skin
AP and AP spot lumbar spinea, 1953–1977
LAT and LAT spot lumbar spinea, 1953–1977
Guidance Dose Guidance Dose Front of neck Eye/brain 2.E-04 Eye/brain 4.E-05 Back of neck Eye/brain 2.E-04 Eye/brain 4.E-05 Front torso: base of neck to end of sternum 10% ENSD 8.87E-02 Lung 5.82E-02 Front torso: end of sternum to lowest rib ENSD 8.87E-01 Lung 5.82E-02 Front torso: lowest rib to iliac crest ENSD 8.87E-01 Lung 5.82E-02 Front torso: iliac crest to pubis ENSD 8.87E-01 Lung 5.82E-02 Back torso: base of neck to mid-back 10% EXSD 1.9E-03 Lung 5.82E-02 Back torso: mid-back to lowest rib EXSD 1.93E-02 Lung 5.82E-02 Back torso: lowest rib to iliac crest EXSD 1.93E-02 Lung 5.82E-02 Back torso: buttocks (Iliac crest and below) EXSD 1.93E-02 Lung 5.82E-02 Right torso: base of neck to end of sternum 10% ENSD 8.87E-02 10% ENSD 5.61E-01 Right torso: end of sternum to lowest rib ENSD 8.87E-01 ENSD 5.61E+00 Right torso: lowest rib to iliac crest ENSD 8.87E-01 ENSD 5.61E+00 Right torso: iliac crest to pubis (right hip) ENSD 8.87E-01 ENSD 5.61E+00 Left torso: base of neck to end of sternum 10% ENSD 8.87E-02 10% EXSD 2.5E-03 Left torso: end of sternum to lowest rib ENSD 8.87E-01 EXSD 2.46E-02 Left torso: lowest rib to iliac crest ENSD 8.87E-01 EXSD 2.46E-02 Left torso: iliac crest to pubis (left hip) ENSD 8.87E-01 EXSD 2.46E-02
a. The organ doses listed are for two projections summed together, the AP and AP spot, and the LAT and LAT spot.
Table 3-11. Skin dose guidance and skin dose equivalents (rem) for lumbar spine projections, 1978 through 1985.
Area of skin
AP and AP spot lumbar spinea, 1978–1985
LAT and LAT spot lumbar spinea, 1978–1985
Guidance Dose Guidance Dose Right front shoulder 10% ENSD 8.61E-02 10% ENSD 1.71E-01 Right back shoulder 10% EXSD 1.9E-03 10% ENSD 1.71E-01 Left front shoulder 10% ENSD 8.61E-02 10% EXSD 8.E-04 Left back shoulder 10% EXSD 1.9E-03 10% EXSD 8.E-04 Right upper arm to elbow 10% ENSD 8.61E-02 10% ENSD 1.71E-01 Left upper arm to elbow 10% ENSD 8.61E-02 10% EXSD 8.E-04 Left hand 10% ENSD 8.61E-02 10% EXSD 8.E-04 Right hand 10% ENSD 8.61E-02 10% ENSD 1.71E-01 Left elbow, forearm, wrist 10% ENSD 8.61E-02 10% EXSD 8.E-04 Right elbow, forearm, wrist 10% ENSD 8.61E-02 10% ENSD 1.71E-01 Right side of head (including ear and temple) Eye/brain 2.E-04 Eye/brain 1.E-05 Left side of head (including ear and temple) Eye/brain 2.E-04 Eye/brain 1.E-05 Front left thigh 10% ENSD 8.61E-02 10% EXSD 8.E-04 Back left thigh 10% EXSD 1.9E-03 10% EXSD 8.E-04 Front right thigh 10% ENSD 8.61E-02 10% ENSD 1.71E-01 Back right thigh 10% EXSD 1.9E-03 10% ENSD 1.71E-01 Left knee and below RSD (0.60 m) 2.E-04 RSD (0.60 m) 2.E-04 Right knee and below RSD (0.60 m) 2.E-04 RSD (0.60 m) 2.E-04 Left side of face Eye/brain 2.E-04 Eye/brain 1.E-05 Right side of face Eye/brain 2.E-04 Eye/brain 1.E-05 Left side of neck Eye/brain 2.E-04 Eye/brain 1.E-05 Right side of neck Eye/brain 2.E-04 Eye/brain 1.E-05 Back of head Eye/brain 2.E-04 Eye/brain 1.E-05 Front of neck Eye/brain 2.E-04 Eye/brain 1.E-05 Back of neck Eye/brain 2.E-04 Eye/brain 1.E-05 Front torso: base of neck to end of sternum 10% ENSD 8.61E-02 Lung 1.98E-02 Front torso: end of sternum to lowest rib ENSD 8.61E-01 Lung 1.98E-02 Front torso: lowest rib to iliac crest ENSD 8.61E-01 Lung 1.98E-02

Document No. ORAUT-TKBS-0037 Revision No. 01 Effective Date: 01/25/2013 Page 37 of 120
Area of skin
AP and AP spot lumbar spinea, 1978–1985
LAT and LAT spot lumbar spinea, 1978–1985
Guidance Dose Guidance Dose Front torso: iliac crest to pubis ENSD 8.61E-01 Lung 1.98E-02 Back torso: base of neck to mid-back 10% EXSD 1.9E-03 Lung 1.98E-02 Back torso: mid-back to lowest rib EXSD 1.88E-02 Lung 1.98E-02 Back torso: lowest rib to iliac crest EXSD 1.88E-02 Lung 1.98E-02 Back torso: buttocks (Iliac crest and below) EXSD 1.88E-02 Lung 1.98E-02 Right torso: base of neck to end of sternum 10% ENSD 8.61E-02 10% ENSD 1.71E-01 Right torso: end of sternum to lowest rib ENSD 8.61E-01 ENSD 1.71E+00 Right torso: lowest rib to iliac crest ENSD 8.61E-01 ENSD 1.71E+00 Right torso: iliac crest to pubis (right hip) ENSD 8.61E-01 ENSD 1.71E+00 Left torso: base of neck to end of sternum 10% ENSD 8.61E-02 10% EXSD 8.E-04 Left torso: end of sternum to lowest rib ENSD 8.61E-01 EXSD 7.5E-03 Left torso: lowest rib to iliac crest ENSD 8.61E-01 EXSD 7.5E-03 Left torso: iliac crest to pubis (left hip) ENSD 8.61E-01 EXSD 7.5E-03
a. The organ doses listed are for two projections summed together, the AP and AP spot, and the LAT and LAT spot.
4.0 OCCUPATIONAL ENVIRONMENTAL DOSE
NIOSH has determined that it is not feasible to reconstruct internal dose from January 1, 1949 through December 31, 1994 for the SNL-NM facility based on insufficient monitoring data, process information, and monitoring program information (NIOSH 2011, 2012).
Dose reconstruction guidance in this site profile for periods included in the SEC is presented to provide a technical basis for partial dose reconstructions for nonpresumptive cancers not covered in the Special Exposure Cohort (SEC) class (January 1, 1949 through December 31, 1994). Although NIOSH found that it is not possible to reconstruct internal radiation doses completely for the proposed class, it intends to use internal and external monitoring data that may become available for an individual claim (and that can be interpreted using existing NIOSH dose reconstruction processes or procedures). Therefore, dose reconstructions for individuals employed at SNL but who do not qualify for inclusion in the SEC, can be performed using these data as appropriate.
Environmental intake information is determined to be insufficient for dose reconstruction of environmental internal doses prior to 1973. Therefore, per the above, such dose reconstruction may not be performed unless information in addition to that available in this document becomes available. Environmental intake information for employment during 1973 and later is sufficient for dose reconstruction of environmental internal doses.
4.1 INTRODUCTION
4.1.1 Purpose
This section provides a technical basis for evaluating the occupational environmental dose for EEOICPA claimants who were employed at SNL-NM and the TTR in Nevada. Occupational environmental dose refers to radiation exposures received by workers while on the site but outside the SNL radiological facilities from facility discharges to the atmosphere, from ambient external radiation originating in the facilities, and from inadvertent inhalation of site-generated radionuclides. The receptors of concern are SNL employees who did not wear external dosimetry or who were not monitored for internal exposures.

Document No. ORAUT-TKBS-0037 Revision No. 01 Effective Date: 01/25/2013 Page 38 of 120 4.1.2 Scope
This section describes environmental occupational exposures at SNL facilities but outside the occupational workplace. It includes estimated annual intakes of radionuclides from inhalation for the period of 1973 to 2010 and the estimated radiation dose from ambient external exposures for the period of 1948 to 2010. Results for 2011 and later will be incorporated if necessary at a later date. Estimates for different facilities vary by year and by type of exposure because sources of radionuclides and radiation did not exist at all facilities for all years during this period.
4.2 OPERATIONS OVERVIEW
4.2.1 Sandia National Laboratories – New Mexico
SNL-NM began as the Albuquerque branch of LASL and operated from 1945 to 1949. Sandia Corporation was formed in 1949; the name changed to Sandia Laboratories in 1971 and to Sandia National Laboratories in 1979. Although a single comprehensive history of Sandia facility radiological operations has not been identified, information on construction and operation of new facilities can be gathered from annual environmental monitoring reports and a few historical summaries (Ulrich 1998; SNL 2006). The layout of the SNL-NM site as of 2005 is shown in Figure 4-1.
Figure 4-1. SNL-NM site south of Albuquerque, New Mexico, in 2005.
TA-I began operations in 1946 with one primary building and several temporary buildings until construction of more permanent buildings for an expanded facility began in 1948. The Albuquerque Laboratory site concentrated primarily on development and testing of nonnuclear components. Activities included the operation of a Cockroft-Walton accelerator and a Van de Graaff generator, as well as chemistry laboratories that used radiochemicals to support research needs. Environmental monitoring reports have noted the potential for release of tritium from TA-I (Millard, Gray, and O’Neal

Document No. ORAUT-TKBS-0037 Revision No. 01 Effective Date: 01/25/2013 Page 39 of 120 1984), but often note that no releases occurred. A Neutron Generator Facility was completed in 1996 and has been the source of larger releases of tritium.
Early manufacturing activities at Sandia Laboratories included the assembly of weapons. This resulted in the development of TA-II about a half mile south of TA-I for the handling and incorporation of explosives into the weapons. Construction of TA-II, which paralleled the development of TA-I, was initiated in 1948. The resultant construction included two identical assembly buildings and a control building completed in 1949. Assembly activities continued at TA-II until 1957. The records note the potential for the release of small amounts of 85Kr vented from the earth by explosive testing during fracture permeation tests (Millard, Gray, and O’Neal 1984).
The increasing use of missiles as delivery vehicles led to the full-scale environmental testing of weapons with and without explosives. As a result, there was a need for complex equipment and specialized engineers to analyze the test results. A decision was made to centralize a group of test devices in TA-III, approximately 7 miles south of TA-I. Planning for this area began in 1952; the first group of facilities, which consisted of a centrifuge, a rocket sled, a vibration testing facility, and an instrument control center, was completed in 1953. The MWL operated at TA-III from 1959 to 1988 as a disposal site for low-level radioactive and mixed waste. The Radioactive and Mixed Waste Management Facility was completed in 1995 for repackaging low-level radioactive and transuranic wastes from current and legacy activities at SNL and its predecessors.
In 1957, a nuclear reactor facility was proposed for what was to become TA-V. TA-V is in the extreme northeast corner of TA-III and is remote from TAs-I, -II, and -IV as well as from most of the facilities in TA-III. The SPR facility was started in May 1961. The SPR is an unreflected, cylindrical, enriched-uranium assembly. Small amounts of fission product gases and air activation products (primarily 41Ar) are produced and released during operations. The SER was a 5-MW heterogeneous reactor fueled with aluminum-clad 235U-enriched U-Al alloy elements. The reactor was cooled and moderated by light water and was operational from October 1962 to June 1969. Air activation products (primarily 41Ar) were released through the stack. The ACPR (now the ACRR) is a modified Training, Research, Isotopes General Atomics (TRIGA) reactor that became operational in June 1967. Air activation products (primarily 41Ar) were released through the stack (Brewer 1973). The HCF began operation in 1979 (Simmons 1980). Other facilities in TA-V have included electron beam accelerators, a GIF, and a neutron irradiation facility. Tritium could have been released from the accelerators during operations and other radionuclides could have been released from HCF operations.
Beginning in 1979, TA-IV was developed as a location for inertial confinement fusion research and pulsed power research. The first facility was the Particle Beam Fusion Accelerator (PBFA)-I (originally to be called the Electron Beam Fusion Facility), which was completed in 1980 with an upgrade to PBFA-II completed in 1985. After additional upgrades, this accelerator is now called the Z Pinch Machine. Gaseous tritium (HT) effluents were generated from TA-IV activities during some years (Millard, Gray, and O’Neal 1984), but not during others. More accelerator facilities were developed in TA-IV, including Hermes and others. These accelerators have or had the potential to generate short-lived activation product radionuclides as well as external radiation.
4.2.2 Sandia National Laboratories – Nevada
The TTR is about 140 miles northwest of Las Vegas, Nevada, and 32 miles southeast of Tonopah, Nevada. It is on approximately 526 square miles at the northern boundary of the Nevada Test and Training Range (NTTR; formerly Nellis Air Force Range), which was established in 1940 by President Roosevelt as the Las Vegas Bombing and Gunnery Range. The topography at TTR is characterized by a broad flat valley bordered by two north- and south-trending mountain ranges: the Cactus Range to the west (occurring mostly within the boundaries of TTR) and the Kawich Range to the east. Cactus Flat is the valley floor where the main operational area of TTR is located. An area of low hills

Document No. ORAUT-TKBS-0037 Revision No. 01 Effective Date: 01/25/2013 Page 40 of 120 outcrops in the south. Elevations within TTR range from 1,630 m (5,347 ft) at the valley floor to 2,279 m (7,482 ft) at Cactus Peak. The elevation in the town of Tonopah is at 1,837 m (6,030 ft) (Sanchez, Hamilton, and Mayeux 2001a). Figure 4-2 shows the layout of SNL-NV at TTR in 2004.
The TTR was eventually selected as a bombing range after similar facilities at the Salton Sea Test Base in California, as well as Yucca Flat on the NTS, became inadequate. The TTR site was well suited because it had immense areas of flat terrain needed for the increasing use of rockets and low-altitude, high-speed aircraft operations (Sanchez, Hamilton, and Mayeux 2001a).
The TTR area was withdrawn in 1956 and Sandia began activities in 1957 to operate and test new weapon systems. In the years following World War II, facilities that were built at TTR were originally designed and equipped to gather data on aircraft-delivered inert test vehicles under AEC (now DOE) cognizance. Over the years, the facilities and capabilities at TTR were expanded to accommodate tests related to the DOE Weapons Ordnance Program (Sanchez, Hamilton, and Mayeux 2001a).
The Main Compound in Area 3 is the heart of the test range activities. The Operations Control Center controls and coordinates all test functions and affords a 360° view of the site. During test operations, the test director, range safety officer, test project engineer, camera controller, and range communicator operate the consoles in the Operations Control Center to control and coordinate all test functions. Another important location at the range is Area 9, which has weapons storage facilities and is used to conduct ground-to-air rocket launching tests (Sanchez, Hamilton, and Mayeux 2001a).
Principal DOE activities at TTR include stockpile reliability testing; research and development testing support of structural development; arming, fusing, and firing systems testing; and testing nuclear weapon delivery systems. However, no nuclear devices are tested at TTR. TTR has a wide array of signal-tracking equipment including video; high-speed cameras; radar tracking devices used to characterize ballistics, aerodynamics, and parachute performance on artillery shells; bomb drops; missiles; and rockets (Sanchez, Hamilton, and Mayeux 2001a).
Figure 4-2. Layout and location of facilities operated by SNL-NV at TTR in 2004.
In recent years, specific test activities at TTR have consisted of the following:

Document No. ORAUT-TKBS-0037 Revision No. 01 Effective Date: 01/25/2013 Page 41 of 120
• Air drops (trajectory studies of simulated weapons) • Gun firings • Ground-launched rockets (study of aeroballistics and material properties) • Air-launched rockets (deployed from aircraft) • Explosive testing (e.g., shipping and storage containers) • Static rocket tests (related to the Trident Submarine Program) • Ground penetrator tests
These activities require a remote range both for public safety and to maintain national security. The majority of test activities at TTR occur in Cactus Flat, a valley with almost no topographical relief flanked by mountains and hills (Sanchez, Hamilton, and Mayeux 2001a).
Clean Slate and Double Tracks Sites In May and June 1963, Project Roller Coaster included a series of four nuclear weapons destruction tests that resulted in plutonium dispersal in the surrounding soils. These tests were conducted to study plutonium dispersal from accidental nonnuclear explosions of plutonium-bearing weapons (Millard and Lathrop 1982). Three of these tests were conducted within the boundaries of TTR; the fourth was conducted on the NTTR just west of TTR. The three Project Roller Coaster test sites at TTR are referred to as Clean Slates 1, 2, and 3 (shown in Figure 4-2). The fourth test site at NTTR is referred to as Double Tracks. In 1996, the Double Tracks was closed after remediation of soil contamination to a level of no more than 200 pCi/g of transuranic radionuclides (Sanchez, Hamilton, and Mayeux 2001a).
The initial cleanup of each Clean Slate site was conducted shortly after each test. Test-related debris was bladed into a hole at ground zero and backfilled. An initial fence was built around each test area where the soil contamination was set at approximately 1,000 µg/m2 of plutonium. The soil survey was conducted on 61-m grids with a hand-held survey meter or field instrument for the detection of low-energy radiation. In 1973, additional outer fences were set at 40 pCi/g of plutonium in soil, also using the hand-held meter method. Soil sampling is conducted periodically at these sites and the areas are visually inspected twice a year to determine if fence repairs are required. Horses that wander inside the fenced areas are promptly removed (Sanchez, Hamilton, and Mayeux 2001a).
The Clean Slate sites are the only known sources of potential occupational environmental radionuclide exposure at TTR.
4.3 RADIONUCLIDE SCREENING, SNL-NEW MEXICO
SNL-NM’s principal research activities have mainly been nonradiological; these activities have never been large producers of radionuclides. Radiation and radionuclides have been used to support research activities; their use has generally increased since the early days. Many of the research activities have been episodic, with durations of several years before being suspended or changed.
Radioactive effluent monitoring information is available for 1973 to 2010 and includes listed airborne emissions of 69 radionuclides. Many of these radionuclides were released in very small quantities that were negligible contributors to worker dose. Therefore, radionuclide screening was conducted to identify those radionuclides that were important contributors to dose. The parameters for the screening were as follows:
• The maximum yearly release for each radionuclide was evaluated.
• The screening threshold was set at 0.01 mrem/yr for the maximum release.

Document No. ORAUT-TKBS-0037 Revision No. 01 Effective Date: 01/25/2013 Page 42 of 120
• The exposure pathways of inhalation and external dose from plume passage were considered, using the air dose screening factors from NCRP Report 123 (NCRP 1996).
• The radionuclides were assumed to be released only during the normal working day (over a period of 2,000 hours rather than continuously over 8,760 hours); workers were assumed to be exposed for 2,000 hr/yr.
• Tritium intakes were applied at 150 percent of the inhalation rate to account for additional dose due to absorption of tritium.
• The atmospheric dispersion factor was assumed to be 0.001 s/m3, a value approximately 3 times higher than the highest atmospheric dispersion factor for a ground-level release at 100 m calculated using Albuquerque-specific meteorology from the CAP88PC Version 3.0 computer program (TEA 2007).
The screening indicated 22 radionuclides with the potential to exceed the 0.01-mrem/yr threshold for the maximum yearly release. These radionuclides and their exposure pathways are listed in Table 4-1.
Table 4-1. Radionuclides meeting screening criteria and the principal worker exposure pathway. Inhalation External plume Both pathways
Am-241, H-3, I-129, I-131, I-133, Pu-239, U-238, Th-232, Co-60, Sr-90
Ar-41, Kr-85m, Kr-87, N-13, O-15, Xe-133, Xe-133m, Xe-135, Xe-135m
I-135, Rb-88, Kr-88
4.4 AMBIENT EXTERNAL RADIATION
In applying the ambient doses described for SNL-NM and the TTR, a maximizing approach can be used when appropriate, assuming the employee worked continuously in the area with the highest external onsite ambient dose rate for 50 hours per week for 52 weeks per year, or 2,600 hours per year (ORAUT 2006a). Thus, the ambient doses in Tables 4-2, 4-3, and 4-4 will be adjusted for 2,600 hours of exposure for the maximizing approach.
If a best estimate of onsite ambient dose is performed, it should be assumed that the energy employee worked 50 hours per week for 50 weeks per year, for a total of 2,500 work-hours per year. The onsite ambient dose for actual work areas, if known, shall be applied for best estimates. If a particular work area with recorded onsite ambient doses cannot be identified, the site maximum value must be applied for a best estimate.
4.4.1 Sandia National Laboratories – New Mexico
Ambient external radiation dose information for SNL-NM is available for 1980 to 2010 (Simmons 1980; Millard et al. 1981, 1982, 1983, 1987, 1988, 1989a; Millard, Gray, and O’Neal 1984; Millard, Gray, and Thompson 1985, 1986; Hwang et al. 1990a, 1991a; Culp et al. 1992, 1993, 1994; Shyr et al. 1995; Shyr, Duncan, and Sanchez 1996; Fink and Duncan 1997; Fink, Duncan, and Sanchez 1998; Fink 1999; Duncan and Sanchez 2001; Sanchez, Hamilton, and Mayeux 2001b; Sanchez et al. 2002a, 2008a, 2009a, 2010a, 2011a; Sneddon et al. 2007a; Wagner et al. 2003a, 2004a, 2005a, 2006a). Sources of ambient external radiation could have been direct external radiation produced by reactors in TA-V and accelerators (principally those in TA-IV) and exposure to external radiation from plumes of short-lived activation products released from accelerator operations. Evaluation of the potential external doses from these plumes showed potential doses to be very low in most cases, on the order of a few microrem per year using the screening criteria in Section 4.3.

Document No. ORAUT-TKBS-0037 Revision No. 01 Effective Date: 01/25/2013 Page 43 of 120 Starting in 1980, TLDs were used to monitor the environmental ionizing radiation background levels in areas surrounding the research facilities at SNL, in areas along the perimeter of Kirtland AFB and within and surrounding the City of Albuquerque. Field TLDs were replaced and measured quarterly. TLDs were prepared and evaluated by the SNL staff. The results of the TLD measurements were reported in annual environmental monitoring reports to the DOE.
The locations of the environmental TLD stations were specified by SNL technical staff and are described in the annual environmental monitoring reports. From 1980 to 1985 and from 1993 to 1999, only the arithmetic mean plus one standard deviation was reported. The TLD data for each station were reported for 1986 to 1992 and for 2000 to 2010.
Examination of TLD results shows little difference between onsite and offsite locations except that, for measurement data before 2005, there are infrequent instances of unusually high quarterly results for TA-V. During these periods, activities in TA-V were likely to have resulted in higher external doses to area workers. An assumption favorable to claimants was made that workers in this area could have received external ambient doses of 10 mrem/yr during the years the area was active. It was assumed that workers in TA-III adjacent to TA-V could have received some lower exposure from TA-V activities. Accelerator activities in TA-IV were assumed to have the potential to result in higher external doses. It was also assumed that workers in TAs-I and -II could have received some lower exposure from TA-IV activities. The estimates of external onsite ambient dose to unmonitored workers in the different TAs were based on a working year of 2,000 hours and are listed in Table 4-2 for 1948 through 2004.
For measurement data of 2005 and later, the actual TA results, including any general site measurements in immediate proximity to a TA, are provided in Table 4-3 as ambient doses with correction for mean offsite background measurements. The maximum onsite ambient dose, which may have been recorded outside of a TA, corrected for mean offsite measurements, is also provided.
Table 4-2. External radiation dose for workers in SNL-NM TAs (mrem/yr).a
Year TA-I TA-II TA-III TA-IV TA-V Year TA-I TA-II TA-III TA-IV TA-V 1948–1952 < 1 < 1 N/A N/A N/A 1979 < 1 < 1 5 N/A 10
1953 < 1 < 1 < 1 N/A N/A 1980 5 5 5 10 10 1954 < 1 < 1 < 1 N/A N/A 1981 5 5 5 10 10 1955 < 1 < 1 < 1 N/A N/A 1982 5 5 5 10 10 1956 < 1 < 1 < 1 N/A N/A 1983 5 5 5 10 10 1957 < 1 < 1 < 1 N/A N/A 1984 5 5 5 10 10 1958 < 1 < 1 < 1 N/A N/A 1985 5 5 5 10 10 1959 < 1 < 1 < 1 N/A N/A 1986 5 5 5 10 10 1960 < 1 < 1 < 1 N/A N/A 1987 5 5 5 10 10 1961 < 1 < 1 5 N/A 10 1988 5 5 5 10 10 1962 < 1 < 1 5 N/A 10 1989 5 5 5 10 10 1963 < 1 < 1 5 N/A 10 1990 5 5 5 10 10 1964 < 1 < 1 5 N/A 10 1991 5 5 5 10 10 1965 < 1 < 1 5 N/A 10 1992 5 5 5 10 10 1966 < 1 < 1 5 N/A 10 1993 5 5 5 10 10 1967 < 1 < 1 5 N/A 10 1994 5 5 5 10 10 1968 < 1 < 1 5 N/A 10 1995 5 5 5 10 10 1969 < 1 < 1 5 N/A 10 1996 5 5 5 10 10 1970 < 1 < 1 5 N/A 10 1997 5 5 5 10 10 1971 < 1 < 1 5 N/A 10 1998 5 5 5 10 10 1972 < 1 < 1 5 N/A 10 1999 5 5 5 10 10 1973 < 1 < 1 5 N/A 10 2000 5 5 5 10 10 1974 < 1 < 1 5 N/A 10 2001 5 5 5 10 10 1975 < 1 < 1 5 N/A 10 2002 5 5 5 10 10
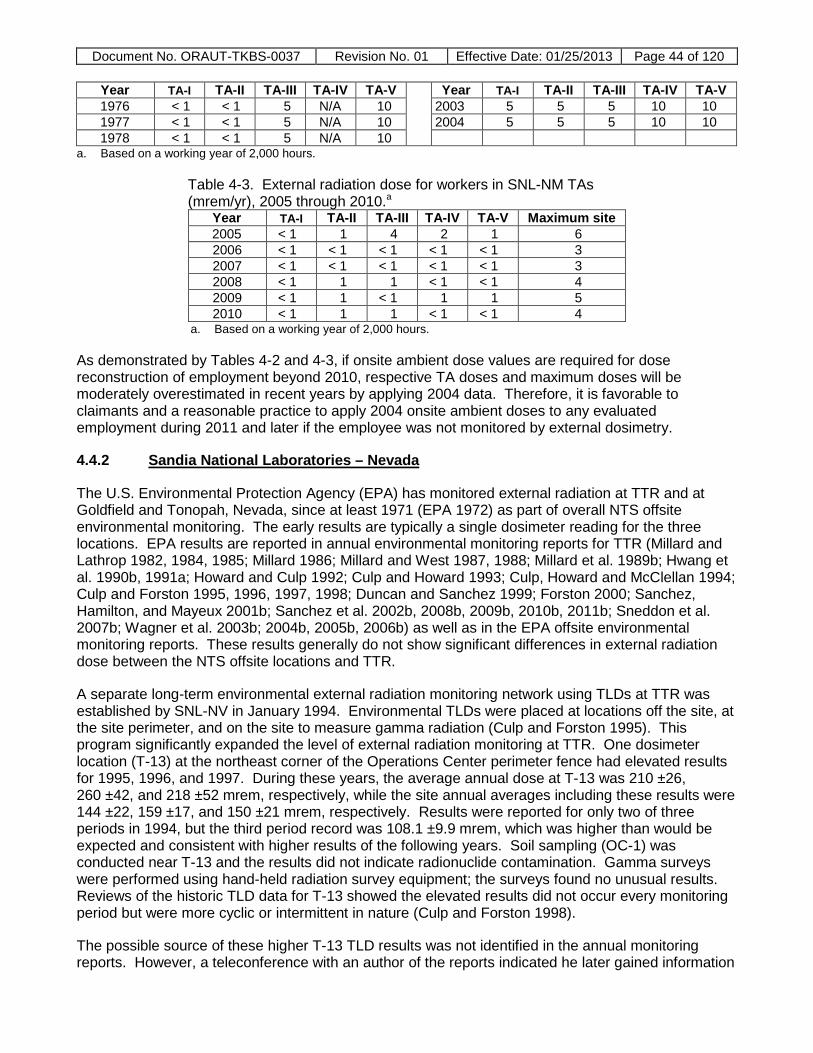
Document No. ORAUT-TKBS-0037 Revision No. 01 Effective Date: 01/25/2013 Page 44 of 120
Year TA-I TA-II TA-III TA-IV TA-V Year TA-I TA-II TA-III TA-IV TA-V 1976 < 1 < 1 5 N/A 10 2003 5 5 5 10 10 1977 < 1 < 1 5 N/A 10 2004 5 5 5 10 10 1978 < 1 < 1 5 N/A 10
a. Based on a working year of 2,000 hours.
Table 4-3. External radiation dose for workers in SNL-NM TAs (mrem/yr), 2005 through 2010.a
Year TA-I TA-II TA-III TA-IV TA-V Maximum site 2005 < 1 1 4 2 1 6 2006 < 1 < 1 < 1 < 1 < 1 3 2007 < 1 < 1 < 1 < 1 < 1 3 2008 < 1 1 1 < 1 < 1 4 2009 < 1 1 < 1 1 1 5 2010 < 1 1 1 < 1 < 1 4
a. Based on a working year of 2,000 hours.
As demonstrated by Tables 4-2 and 4-3, if onsite ambient dose values are required for dose reconstruction of employment beyond 2010, respective TA doses and maximum doses will be moderately overestimated in recent years by applying 2004 data. Therefore, it is favorable to claimants and a reasonable practice to apply 2004 onsite ambient doses to any evaluated employment during 2011 and later if the employee was not monitored by external dosimetry.
4.4.2 Sandia National Laboratories – Nevada
The U.S. Environmental Protection Agency (EPA) has monitored external radiation at TTR and at Goldfield and Tonopah, Nevada, since at least 1971 (EPA 1972) as part of overall NTS offsite environmental monitoring. The early results are typically a single dosimeter reading for the three locations. EPA results are reported in annual environmental monitoring reports for TTR (Millard and Lathrop 1982, 1984, 1985; Millard 1986; Millard and West 1987, 1988; Millard et al. 1989b; Hwang et al. 1990b, 1991a; Howard and Culp 1992; Culp and Howard 1993; Culp, Howard and McClellan 1994; Culp and Forston 1995, 1996, 1997, 1998; Duncan and Sanchez 1999; Forston 2000; Sanchez, Hamilton, and Mayeux 2001b; Sanchez et al. 2002b, 2008b, 2009b, 2010b, 2011b; Sneddon et al. 2007b; Wagner et al. 2003b; 2004b, 2005b, 2006b) as well as in the EPA offsite environmental monitoring reports. These results generally do not show significant differences in external radiation dose between the NTS offsite locations and TTR.
A separate long-term environmental external radiation monitoring network using TLDs at TTR was established by SNL-NV in January 1994. Environmental TLDs were placed at locations off the site, at the site perimeter, and on the site to measure gamma radiation (Culp and Forston 1995). This program significantly expanded the level of external radiation monitoring at TTR. One dosimeter location (T-13) at the northeast corner of the Operations Center perimeter fence had elevated results for 1995, 1996, and 1997. During these years, the average annual dose at T-13 was 210 ±26, 260 ±42, and 218 ±52 mrem, respectively, while the site annual averages including these results were 144 ±22, 159 ±17, and 150 ±21 mrem, respectively. Results were reported for only two of three periods in 1994, but the third period record was 108.1 ±9.9 mrem, which was higher than would be expected and consistent with higher results of the following years. Soil sampling (OC-1) was conducted near T-13 and the results did not indicate radionuclide contamination. Gamma surveys were performed using hand-held radiation survey equipment; the surveys found no unusual results. Reviews of the historic TLD data for T-13 showed the elevated results did not occur every monitoring period but were more cyclic or intermittent in nature (Culp and Forston 1998).
The possible source of these higher T-13 TLD results was not identified in the annual monitoring reports. However, a teleconference with an author of the reports indicated he later gained information

Document No. ORAUT-TKBS-0037 Revision No. 01 Effective Date: 01/25/2013 Page 45 of 120 that these higher results could have related to radiography of test assemblies in the Operations area (Ikenberry 2006a). A teleconference interview with an SNL Radiation Protection Dosimetry employee indicated that all workers had personal TLDs and external dosimetry records were available for all workers since 1990 (Ikenberry 2006b). Therefore, the potential for radiation exposure from radiography operations would be included in the workers’ personal external dosimetry records. Further, the employee interviewed was of the opinion that this trend was established well before 1990, but that only the records for 1990 and later were readily and electronically available from the dosimetry database. Previous radiation doses for each individual were compiled in the database as a total external dose record for each worker, and pre-1990 yearly individual hard-copy records should be available. For measurement data of 2005 and later, the actual environmental monitoring results were determined with correction for mean offsite background measurements.
As noted above, it is unlikely that onsite ambient dose reconstruction will be necessary since external doses would have been monitored. However, the data are provided in the event that reconstruction of such dose is warranted. Table 4-4 provides the estimates of external ambient dose from TTR operations to unmonitored workers.
Table 4-4. External radiation dose for workers at TTR (mrem/yr).
Years Annual external radiation dose 1957–2004 0
2005 20 2006 17 2007 7 2008 12 2009 7 2010 8
Based on contemporary TTR site radiological characteristics, routine site activities (Sanchez et al. 2011b), and data listed in Table 4-4, if onsite ambient dose values are required for dose reconstruction of employment beyond 2010, TTR onsite ambient dose can be estimated as 0.020 rem per year for 2011 and later.
4.5 INHALATION OF ONSITE AIRBORNE RADIONUCLIDES
4.5.1 Sandia National Laboratories – New Mexico
The environmental monitoring program at SNL-NM was initiated in December 1958 to establish background radiation levels before the startup of the reactors in TA-V (Burnett et al. 1961). There is no indication of radionuclide release before TA-V reactor activities; however, assumptions favorable to claimants about earlier releases can be made for the TAs.
Radionuclide air emission data are available in the annual environmental monitoring reports for SNL-NM from 1973 to 2010 (Brewer 1974; Holley 1975; Holley and Simmons 1976; Simmons 1977, 1978, 1980; Millard et al. 1981, 1982, 1983; Millard, Gray, and O’Neal 1984; Millard, Gray, and Thompson 1985, 1986; Millard et al. 1987, 1988, 1989a; Hwang et al. 1990a, 1991b; Culp et al. 1992, 1993, 1994; Shyr et al. 1995; Shyr, Duncan, and Sanchez 1996; Fink and Duncan 1997; Fink, Duncan, and Sanchez 1998; Fink 1999; Duncan and Sanchez 2001; Sanchez, Hamilton, and Mayeux 2001b; Sanchez et al. 2002a, 2008a, 2009a, 2010a, 2011a; Sneddon et al. 2007a; Wagner et al. 2003a, 2004a, 2005a, 2006a). The 1973 report stated that because SNL released only small amounts of 41Ar from TA-V and tritium from TA-I as a result of operations, dose estimates were based on effluent release data rather than environmental monitoring data. X/Q values were calculated for the various distances from the release points to the site boundaries. In 1979, 85Kr was included as an effluent

Document No. ORAUT-TKBS-0037 Revision No. 01 Effective Date: 01/25/2013 Page 46 of 120 from TA-II. In 1989, 133Xe, 13N, 15O, and 238U were added to the list of radioactive air emissions. In 1990, 129I was reported as a release from the HCF at TA-V.
Three findings from the 1991 Tiger Team Assessment of SNL-NM questioned the adequacy of airborne radionuclide emission monitoring. SNL responded (SNL 1995a) that although it did not have any point source with the potential for doses to the public greater than 0.1 mrem/yr that would require continuous monitoring, it had installed stack monitors capable of continuous monitoring at two facilities in TA-V: the ACRR and the HCF. As a result of this assessment, the number of reported effluents from SNL increased in 1991 to 32 radionuclides released from 13 facilities. The practice of reporting radionuclides from more facilities has continued.
Reported facility radionuclide emissions were the basis for estimating potential worker environmental inhalation intakes. Years with data vary by facility, but the most complete information is available for 1991 and later. For years and areas in which there are no emission data, environmental inhalation intakes will not be calculated. Identification of specific radionuclides released from facilities in stack emissions, which are available in data from 1973 to 2010, were used to characterize radionuclide emissions for all years. There are no radionuclide-specific data from earlier years.
Estimates of inhalation intakes were made using the exposure criteria that were included in the initial radionuclide screening. These criteria are:
• The radionuclides were assumed to be released only during the normal working day (over a period of 2,000 hours rather than continuously over 8,760 hours), which maximized potential worker exposure; workers were assumed to be exposed for 2,000 hr/yr.
• Any uranium and thorium detected is assumed to originate from facility activities, even though it could be naturally occurring.
• Tritium intakes were applied at 150 percent of the inhalation rate to account for additional dose due to absorption of tritium.
• The atmospheric dispersion factor was assumed to be 0.001 s/m3, a value approximately 3 times higher than the highest atmospheric dispersion factor for a ground-level release at 100 m calculated using Albuquerque-specific meteorology from the CAP88PC Version 3.0 computer program (TEA 2007). The assumed worker breathing rate for light activity was 1.2 m3/hr (3.3 × 10⁻⁴ m3/s) (ICRP 1994a).
Use of these parameters results in estimated radionuclide inhalation intakes that are favorable to claimants.
4.5.1.1 Technical Areas I, II, and IV
No emission monitoring data were available from before 1973 for TAs-I and -II. TA-IV was not created until 1979. Environmental monitoring data indicate that tritium was the principal radionuclide released; most available data was from 1991 and later. A TA-I radiation laboratory was the source of small releases of 241Am and 238U with data available for a limited number of years.
The only radionuclide released in TA-IV that could contribute to significant inhalation dose was tritium. Inhalation of tritium was assumed to be the same as inhalation in TAs-I and -II from 1979 and later. This is also an assumption favorable to claimants that overestimates inhalation of tritium in TA-IV based on the information contained in the environmental monitoring reports (Sanchez 2001a, 2010a, 2009a, 2008a, Sneddon 2007a and Wagner 2006a). In 2009, it was reported that the annual release from the TA-I Sandia Tomography and Radionuclide Transport (START) Laboratory included

Document No. ORAUT-TKBS-0037 Revision No. 01 Effective Date: 01/25/2013 Page 47 of 120 sufficient 239Pu to warrant dose reconstruction for resulting environmental intakes (Sanchez et al. 2010a). Thus, 239Pu annual intake rates are included for TA-1 for 2009, but are not significant for other TAs or other years. The START Laboratory also contributed to a significantly increased 241Am TA-I environmental intake in 2010 (Sanchez et al. 2011a), as listed in Table 4-5.
The estimated inhalation intakes of radionuclides for TAs-I, -II, and -IV are listed in Table 4-5. The material form and solubility selected for each radionuclide should be the values most favorable to the claimant.
Table 4-5. TAs-I, -II, and -IV maximum annual intakes (Bq/yr) via inhalation.a
Year
Radionuclide
Year
Radionuclide TA-I and TA-II TA-IV TA-I and TA-II TA-IV
H-3 Am-241 U-238 H-3 H-3 Am-241 U-238 Pu-239 H-3 1973 2E+03 2E-07 5E-08 N/A 1992 2E+00 2E-07 5E-08 N/A 2E+00 1974 6E+02 2E-07 5E-08 N/A 1993 2E+00 2E-07 5E-08 N/A 2E+00 1975 6E+02 2E-07 5E-08 N/A 1994 2E+00 2E-07 5E-08 N/A 2E+00 1976 6E+02 2E-07 5E-08 N/A 1995 6E+00 2E-07 5E-08 N/A 6E+00 1977 2E+02 2E-07 5E-08 N/A 1996 2E+03 6E-09 5E-08 N/A 2E+03 1978 5E+04 2E-07 5E-08 N/A 1997 4E+04 6E-09 5E-08 N/A 4E+04 1979 6E+04 2E-07 5E-08 N/A 1998 2E+05 6E-09 5E-08 N/A 2E+05 1980 8E-01 2E-07 5E-08 1E+00 1999 5E+04 6E-09 5E-08 N/A 5E+04 1981 8E-01 2E-07 5E-08 1E+00 2000 6E+04 6E-09 5E-08 N/A 6E+04 1982 8E-01 2E-07 5E-08 8E-01 2001 8E+04 6E-09 5E-08 N/A 8E+04 1983 8E-01 2E-07 5E-08 8E-01 2002 6E+03 6E-09 5E-08 N/A 6E+03 1984 8E-01 2E-07 5E-08 8E-01 2003 8E+03 6E-09 5E-08 N/A 8E+03 1985 8E-01 2E-07 5E-08 8E-01 2004 2E+03 6E-09 5E-08 N/A 2E+03 1986 8E-01 2E-07 5E-08 8E-01 2005 1E+04 6E-09 3E-06 N/A 1E+04 1987 8E-01 2E-07 5E-08 8E-01 2006 6E+03 6E-09 3E-06 N/A 6E+03 1988 8E-01 2E-07 5E-08 8E-01 2007 2E+05 3E-04 2E-08 N/A 2E+05 1989 8E-01 2E-07 5E-08 8E-01 2008 7E+05 4E-04 2E-08 N/A 7E+05 1990 3E+00 2E-07 5E-08 3E+00 2009 1E+05 4E-04 2E-04 8E-03 1E+05 1991 8E-01 2E-07 5E-08 8E-01 2010 1E+05 6E-01 2E-04 N/A 1E+05
a. Radionuclide solubility class should be selected to be favorable to the claimant.
4.5.1.2 Technical Area III
TA-III activities began in 1953; it is unclear if radionuclides were involved during the earliest years. Environmental monitoring data indicate that tritium was the principal radionuclide released, mainly from the diffuse source MWL with data available for 1993 and later. The area has included a landfill that has been a diffuse source of small quantities of 60Co, 232Th, and 238U; a facility that was a small source of 241Am in the mid-1990s; and a mixed waste facility that was a comparatively large source of 241Am and 90Sr from 2002 to 2004. Release and inhalation of 241Am and 90Sr from TA-III was assumed to occur only during the years in which these radionuclides were identified (2002 to 2010). The estimated inhalation intakes of radionuclides for TA-III are listed in Table 4-6. The material form and solubility selected for each radionuclide should be the values most favorable to the claimant.
Table 4-6. TA-III maximum annual intakes (Bq/yr) via inhalation.a
Year Radionuclide
H-3 Am-241 U-238 Th-232 Co-60 Sr-90 1993 3E+04 N/A 6E-02 2E-04 3E+00 N/A 1994 6E+03 N/A 6E-02 2E-04 3E+00 N/A 1995 6E+03 N/A 6E-02 2E-04 3E+00 N/A 1996 8E+04 N/A 6E-02 2E-04 3E+00 N/A 1997 5E+04 N/A 6E-02 2E-04 3E+00 N/A 1998 2E+04 N/A 2E-03 2E-04 3E+00 N/A

Document No. ORAUT-TKBS-0037 Revision No. 01 Effective Date: 01/25/2013 Page 48 of 120
Year Radionuclide
H-3 Am-241 U-238 Th-232 Co-60 Sr-90 1999 2E+04 N/A 6E-02 2E-04 3E+00 N/A 2000 2E+04 N/A 6E-02 2E-04 8E+00 N/A 2001 6E+03 N/A 6E-02 2E-04 2E-04 N/A 2002 8E+03 3E-03 6E-02 2E-04 2E-01 5E-03 2003 3E+05 2E-01 6E-02 2E-04 3E+00 2E-01 2004 2E+04 2E-01 6E-02 2E-04 3E+00 5E-03 2005 2E+05 2E-01 6E-02 2E-04 3E+00 4E-03 2006 2E+05 2E-01 6E-02 2E-04 3E+00 4E-03 2007 2E+05 2E-01 6E-02 2E-04 3E+00 4E-03 2008 1E+06 2E-01 6E-02 2E-04 3E+00 6E-03 2009 5E+04 2E-01 6E-02 2E-04 3E+00 5E-03 2010 2E+05 5E-03 6E-02 2E-04 3E+00 2E-03
a. Radionuclide solubility class should be selected to be favorable to the claimant.
4.5.1.3 Technical Area V
TA-V activities began in 1961 with operation of the SPR. Early environmental monitoring reports indicate that most TA-V releases were noble gases. There is some indication of tritium releases from TA-V in the late 1970s and for small releases of radioiodines and other radionuclides from the ACRR and HCF in the mid-1990s.
The estimated inhalation intakes of radionuclides for TA-V are listed in Table 4-7. The material form and solubility selected for each radionuclide should be the values most favorable to the claimant. The intake data include no results after 2004 because monitoring data from 2005 and later show no TA-V releases that would result in significant internal doses.
Table 4-7. TA-V maximum annual intakes (Bq/yr) via inhalation.a
Year Radionuclide
H-3 I-129 I-131 I-133 I-135 Kr-88 Rb-88 1973 4E+02 2E+00 2E+01 2E+02 8E+02 2E+03 2E+03 1974 4E+02 2E+00 2E+01 2E+02 8E+02 2E+03 2E+03 1975 4E+02 2E+00 2E+01 2E+02 8E+02 2E+03 2E+03 1976 4E+02 2E+00 2E+01 2E+02 8E+02 2E+03 2E+03 1977 4E+02 2E+00 2E+01 2E+02 8E+02 2E+03 2E+03 1978 4E+02 2E+00 2E+01 2E+02 8E+02 2E+03 2E+03 1979 6E+04 2E+00 2E+01 2E+02 8E+02 2E+03 2E+03 1980 2E+05 2E+00 2E+01 2E+02 8E+02 2E+03 2E+03 1981 4E+02 2E+00 2E+01 2E+02 8E+02 2E+03 2E+03 1982 4E+02 2E+00 2E+01 2E+02 8E+02 2E+03 2E+03 1983 4E+02 2E+00 2E+01 2E+02 8E+02 2E+03 2E+03 1984 4E+02 2E+00 2E+01 2E+02 8E+02 2E+03 2E+03 1985 4E+02 2E+00 2E+01 2E+02 8E+02 2E+03 2E+03 1986 4E+02 2E+00 2E+01 2E+02 8E+02 2E+03 2E+03 1987 4E+02 2E+00 2E+01 2E+02 8E+02 2E+03 2E+03 1988 4E+02 2E+00 2E+01 2E+02 8E+02 2E+03 2E+03 1989 4E+02 2E+00 2E+01 2E+02 8E+02 2E+03 2E+03 1990 4E+02 2E-01 2E+01 2E+02 8E+02 2E+03 2E+03 1991 4E+02 2E+00 2E+01 2E+02 8E+02 2E+01 3E+01 1992 4E+02 3E+00 2E+00 3E+02 2E+03 2E+03 3E+03 1993 4E+02 2E+00 2E+01 2E+02 8E+02 5E+03 5E+03 1994 4E+02 2E+00 2E+01 2E+02 8E+02 2E+03 2E+02 1995 4E+02 2E+00 2E+01 2E+02 8E+02 2E+03 5E+00 1996 4E+02 2E+00 2E+01 8E+01 2E+01 6E+03 2E+03

Document No. ORAUT-TKBS-0037 Revision No. 01 Effective Date: 01/25/2013 Page 49 of 120
Year Radionuclide
H-3 I-129 I-131 I-133 I-135 Kr-88 Rb-88 1997 4E+02 2E+00 2E+01 2E+02 8E+02 2E+03 2E+03 1998 4E+02 2E+00 2E+01 2E+02 8E+02 2E+03 2E+03 1999 4E+02 2E+00 2E+01 2E+02 8E+02 2E+03 2E+03 2000 4E+02 2E+00 2E+01 2E+02 8E+02 2E+03 2E+03 2001 4E+02 2E+00 2E+01 2E+02 8E+02 2E+03 2E+03 2002 4E+02 2E+00 2E+01 2E+02 8E+02 2E+03 2E+03 2003 4E+02 2E+00 2E+01 2E+02 8E+02 2E+03 2E+03 2004 4E+02 2E+00 2E+01 2E+02 8E+02 2E+03 2E+03
a. Radionuclide solubility class should be selected to be favorable to the claimant.
4.5.2 Sandia National Laboratories – Nevada
The only identified source of potential radionuclide inhalation at TTR is resuspension of radionuclides from the Clean Slate sites (Millard and Lathrop 1982, 1984, 1985; Millard 1986; Millard and West 1987, 1988; Millard et al. 1989b; Hwang et al. 1990b, 1991a; Howard and Culp 1992; Culp and Howard 1993; Culp, Howard and McClellan 1994; Culp and Forston 1995, 1996, 1997, 1998; Duncan and Sanchez 1999; Forston 2000; Sanchez, Hamilton, and Mayeux 2001b; Sanchez et al. 2002b, 2008b, 2009b, 2010b, 2011b; Sneddon et al. 2007b; Wagner et al. 2003b; 2004b, 2005b, 2006b). No other areas have been determined to be contaminated with site-originated radionuclides.
As noted in Section 4.2.2, the highest areas of contamination at the Clean Slate sites were initially buried and fenced off after the events in 1963 and a second, larger perimeter fence was set 10 years later. Lower levels of transuranic radionuclide contamination have been identified south of the original sites and away from the principal occupied areas of the range. These levels are due to the prevailing winds at the time the events occurred (Ikenberry 2006a). Soil sampling is conducted each year to assess the potential for dispersion of transuranic radionuclide contamination. No contamination has been detected except in the areas south of the Clean Slate sites. These sites are remote from the Operations Center, and the annual site environmental reports emphasize that test activity is planned to avoid disturbing these areas.
SNL instituted continuous air monitoring at the TTR airport for a 1-year period from February 22, 1996, to February 25, 1997, to assess potential radiation dose from resuspension of radionuclides from the Clean Slate sites as part of an investigation in relation to the National Emission Standards for Hazardous Air Pollutants (Duncan and Sanchez 1999). The TTR airport was determined to be the location for the highest calculated dose to an onsite maximally exposed individual and so is likely to be a location favorable to claimants for estimating exposure of unmonitored SNL-NV workers. The average annual air concentrations were measured as follows: 241Am at 4.1 × 10⁻¹⁸ Ci/m3, 238Pu at 1.6 × 10⁻¹⁸ Ci/m3, and 239/240Pu at 9.5 × 10⁻¹⁸ Ci/m3 (Duncan and Sanchez 1999). Based on a 2,000-hr/yr exposure to these concentrations with a light activity breathing rate of 3.3 × 10⁻⁴ m3/s, the activity inhaled annually is 4.6 × 10⁻⁴ Bq 241Am, 1.8 × 10⁻⁴ Bq 238Pu, and 1.0 × 10⁻⁵ Bq 239/240Pu.
Because of the early efforts to bury soil with high contamination levels near ground zero, the fencing of the Clean Slate contaminated areas, and the operational avoidance of the Clean Site areas, the air concentrations at the TTR airport in 1996 and 1997 are an estimate of radionuclide inhalation for unmonitored workers that is favorable to claimants. The estimated inhalation intakes of radionuclides for TTR are listed in Table 4-8. The material form and solubility selected for each radionuclide should be the values most favorable to the claimant.

Document No. ORAUT-TKBS-0037 Revision No. 01 Effective Date: 01/25/2013 Page 50 of 120
Table 4-8. TTR maximum annual intakes (Bq/yr) via inhalation.a
Year Radionuclide
Am-241 Pu-238 Pu-239/240 1957–1962 0 0 0 1963–2010b 4E-04 2E-04 8E-05
a. Radionuclide solubility class should be selected to be favorable to the claimant. b. Potential inhalation after 1963 is estimated on dispersion of contaminants from
the Clean Slate sites (see Section 4.2.2).
4.6 UNCERTAINTY
There are no documents available from which quantitative estimates of uncertainty can be made, so qualitative estimates are provided.
External Dose For maximized onsite ambient dose reconstruction that is favorable to claimants, the dose values should be adjusted by a multiplication factor of 1.3 to account for potential under-response by the ambient radiation measurement dosimetry. The adjusted doses should be assigned in the Interactive RadioEpidemiological Program (IREP) as a constant value.
For best estimate onsite ambient doses, a qualitative estimate of external dose uncertainty is based on a normal distribution with a standard deviation of 30% for all exposure periods and TAs.
Inhalation Intakes There are no available documents with estimates of uncertainty for SNL-NM stack releases. A qualitative estimate of inhalation intakes assumes lognormally distributed chronic intakes, with uncertainty of a geometric standard deviation (GSD) of 2 for all exposure periods. A qualitative estimate of inhalation intake uncertainty at SNL-NV is based on a lognormal distribution with a GSD of 2 for all exposure periods.
The GSDs reported above consider the uncertainty associated with the determination of intake activity but do not include the biological variation associated with the conversion to dose. Therefore, a GSD of 3 should be applied to internal doses based on environmental intakes to account for biological variation and uncertainty in the models (ORAUT 2012).
5.0 OCCUPATIONAL INTERNAL DOSE
NIOSH has determined that it is not feasible to reconstruct internal dose from January 1, 1949 through December 31, 1994 for the SNL-NM facility based on insufficient monitoring data, process information, and monitoring program information (NIOSH 2011, 2012). As such, this time period has been included in the EEOICPA Special Exposure Cohort (SEC). The EEOICPA covered period for SNL- NM is from January 1st, 1945 to present. Dose reconstruction guidance in this site profile for the period between January 1st, 1949 and December 31st, 1994 is presented to provide a technical basis for partial dose reconstructions for nonpresumptive cancers not covered in the Special Exposure Cohort (SEC) class. Although NIOSH found that it is not possible to reconstruct internal radiation doses completely for the proposed class, it intends to use internal monitoring data that may become available for an individual claim (and that can be interpreted using existing NIOSH dose reconstruction processes or procedures). Therefore, dose reconstructions for individuals employed at SNL from January 1, 1949, through December 31, 1994, but who do not qualify for inclusion in the SEC, can be performed using these data as appropriate.
Occupational internal dose is the dose received by an individual from an intake of radioactive material while performing tasks in buildings and structures at SNL or from activities outside the buildings, such as burial of waste and monitoring of tests, where occupational intakes of radioactive material could
Document No. ORAUT-TKBS-0037 Revision No. 01 Effective Date: 01/25/2013 Page 51 of 120 occur. This document contains information for reconstruction of occupational internal doses at SNL facilities throughout its history.
5.1 INTRODUCTION
Operations began at SNL (then Z-Division of LASL, Albuquerque Branch) in July 1945. SNL was originally created to perform ordnance engineering and assembly aspects of LASL design work. In essence, Z-Division was responsible for all nonnuclear components of nuclear weapons, whether through internal assembly or procurement. In late 1945, LASL began transferring its field testing and engineering organization, known as Z-Division, to Sandia Base near Albuquerque. Personnel from the Army Air Corps 509th Composite Group at Wendover Air Base in Utah joined the original group to assemble weapons. This organization formed the nucleus of Sandia Laboratory, created in 1948 as a separate branch of LASL.
The following year, the laboratory formally separated from LASL when the University of California, the Los Alamos managing contractor, asked to be relieved of the responsibility. American Telephone and Telegraph (AT&T), at the request of President Truman, agreed to take over management of the facility, and Sandia Corporation, a wholly owned subsidiary of Western Electric and AT&T’s production arm, was formed to serve as the managing contractor [2].
By 1952, the weapons production complex was in place. SNL focused on weapons development and expanded its engineering staff to accommodate the growing number of weapons projects. In addition to design and production coordination, SNL undertook extensive field testing of components and supported the atmospheric tests sponsored by its partner laboratories. The bulk of the work at SNL and its properties has been related to the nonnuclear aspects of nuclear weapons design. This work includes weapons design and testing, production engineering, stockpile maintenance, and stockpile surveillance (Ullrich 1998).
From 1945 to the present, SNL employees have been involved in operations at a number of Sandia Corporation sites. These sites include Livermore, California; Hattiesburg, Mississippi; NTS; Clarksville, Tennessee; and Salton Bay Station, California. In addition, SNL employees spent time at other DOE facilities. Since 1949, when weapons storage sites were opened, until 1967, SNL stationed personnel at the storage sites to monitor, maintain, and assemble weapons [3]. Dosimetry monitoring records from these offsite activities may or may not be available in the SNL dosimetry records [4].
SNL operates major research nuclear reactors and electron/ion accelerators for the DOE Office of Military Applications. Research and development activities are conducted in relation to nuclear weapons systems, nonnuclear weapons systems, advanced nuclear reactors, simulation source development, and other basic and applied research areas at each facility [5].
The potential for chronic intakes at SNL is far less than at DOE production sites because of the nature of the tasks performed. Certain areas of the site are nonnuclear. In addition, the nature of the research environment at the SNL site results in intake potentials that are often unique and of short duration. Nevertheless, the potential for monitored and unmonitored intakes has existed throughout the history of the site [6].
Assembly Assembly is used in a variety of contexts and conveys a variety of meanings, especially in the early history of SNL (Ullrich 1999). This can make it difficult to determine the exposure potential of a worker associated with statements of “assembly” of weapons in either the telephone interview or the other work histories [7].

Document No. ORAUT-TKBS-0037 Revision No. 01 Effective Date: 01/25/2013 Page 52 of 120 Although the Little Boy gun-type nuclear weapon received some research and development attention after World War II, the majority of the early postwar nuclear weapons were implosion weapons based on the Manhattan Project Fat Man design. In this design, a sphere of high explosive surrounded a central core of nuclear material. Detonation of the high explosive compressed the central core of nuclear material to a supercritical mass. Introduction of neutrons to the highly compressed core initiated the nuclear chain reaction. To use a weapon, it had to be partially disassembled, the nuclear core inserted, and the weapon reassembled. Sealed-pit weapons with their nuclear components installed during assembly did not enter the stockpile until 1957.
Due to the nature of these weapons, individuals using the term assembly for work during the 1940s and 1950s could mean a number of things. Assembly could mean the final assembly before a weapon was used or tested (i.e., inserting the nuclear core into the weapon). The latter use segued into the description of putting together inert mockups or prototypes of weapons (that is, assembling a weapon with neither high-explosive nor nuclear core). The term assembly was also used to refer to putting appropriate pieces together into components, leading up to final assembly of one of the other sorts. Therefore, terms similar to weapons assembly in the telephone interview or work history do not necessarily indicate potential exposure to radionuclides.
Certain TA-I buildings, such as the first permanent facility built on the site, were not used for high-explosive lens assembly or nuclear core insertion; other facilities were available for that purpose. All evidence indicates that the first permanent TA-1 facility was designed and used as a mechanical test laboratory. As such, it represents the core of SNL’s early ordnance design mission (Ulrich 1999).
Nuclides Nuclides with the widest historical and current application throughout the SNL facilities are:
• Tritium (3H) • Uranium (238U, 234U, 235U) • Fission and activation products (e.g., 90Sr, 137Cs, 65Zn, 60Co, 182Ta)
and, to a lesser degree,
• Plutonium (238Pu, 239Pu, 240Pu, 241Pu) • Americium (241Am) [8].
These radionuclides of primary concern are listed in SNL reports from 1945 to the present. The potential for exposure to nuclides existed in TAs and test facilities (Mallon 1995), as listed in Table 5-1. Additional descriptions of the TAs and potential hazards are in Section 2.0. If the specific work areas are known, the dose reconstructor should review Section 2.0, Tables 5-1 and 5-2, and available dose reconstruction references to determine the potential for exposure to internal hazards. Many of the buildings did not have a potential for routine intakes of radioactive material or were completely devoted to nonradioactive functions. Table 5-2 lists the significant potential worker exposure to radioactive materials in TA-III and TA-IV and the Explosive Component Facility (ECF).
Many of the exposure histories and work records are not specific about the work areas to which individuals were assigned. However, if information about the work location is available, Table 5-1 can be used to determine the probable exposures.

Document No. ORAUT-TKBS-0037 Revision No. 01 Effective Date: 01/25/2013 Page 53 of 120 Table 5-1. Internal exposure potential by area (Mallon 1995) [9].
TA Uranium Tritiuma Plutonium Americiumb Other (Sr-90, Th, tracers, etc.) TA-Ic DU Various
buildings; erbium tritided in one building
Sealed Pu-238 heat sources, (nuclear materials receiving)
Environ-mental restoration sites
Environmental releases of accelerator activation products (O-15, N-13, Ar-41), machining of activated stainless-steel and fission products in one shop (VanDevender 1984), induced activity in one building, sealed sources in other buildings.
TA-IIe (1948–1960s)
Decontamination facility, melt facility, and waste facility
HT or HTO FP in a decontamination facility
TA-III DU, entire areaf Entire areaf Pu in contaminated wastesg
FP, Co-60, thoriumg in a mixed waste facility
TA-IVh Accelerator targetsi
Fe-59, Fe-55 activation products, aerosol when targets are machined.
TA-V Reactors and hot cellsj
Reactors and hot cellsj
Reactors and hot cellsj
Reactors and hot cellsj
FP from reactors
Coyote Test Field
DU, entire areaf
TTR DU, entire areaf,k Entire areaf,k Entire areab,f a. Some facilities use tritiated solvents that may require special biokinetics. b. As a portion of the plutonium mixture and as pure Am-241 (Stanley 1993). c. Nonnuclear components were assembled by the Road group in TA-I for shipment to TA-II to complete subassembly.. d. Research suggests that the retention time of metal tritides (MTs) is longer than that of HTO (ORAUT 2007). e. 1948 to 1952 primary site for weapons assembly (subassembly level, no nuclear pits in the weapon). Facilities for small
explosive component research and testing in late 1950s to early 1960s. After 1960, the primary purpose of TA-II was research and testing of high-explosive components. Tritium was contained in test components, although it is unclear if this was the condition during the entire history of the site.
f. Also at environmental restoration sites and a mixed waste management facility. g. From Section 2.0. h. See Table 5-2 for details of specific areas in TA-IV. i. An incident involving a leaking neutron calibration device in April 1991 produced tritium intakes (Burnett 1991). j. Includes the hot cell laboratory, the Glovebox Laboratory (10 high-purity gloveboxes), and the analytical laboratory. k. No bioassay is routinely done for uranium at TTR because workers are not likely to encounter 2 μCi of plutonium or
10 μCi of DU. Baselines may have been performed (Potter 1993a).
Table 5-2. Facilities in TAs-III and -IV and the Explosive Component Facility.
Technical area Facility Radiation Remarks TA-III For available facility
details, see SNL (1998b).
No radioactive material is treated
For available facility details, see SNL (1998c).
Low-level waste, mixed waste 1957–1988
Melt furnace contaminated with uranium (Tucker 1977)
Reactor experiment, activated materials (Tucker 1977)
Building with uranium stored (Tucker 1977) For available facility details, see SNL (1998c).
Low-level waste, transuranic waste, mixed waste, sealed sources (stored or in stack monitors).
1988–present treatment and packaging

Document No. ORAUT-TKBS-0037 Revision No. 01 Effective Date: 01/25/2013 Page 54 of 120
Technical area Facility Radiation Remarks TA-IV For available facility
details, see SNL (1998d).
External and O-15 and N-13 only, short-lived activation products (Zn-65, Co-57, Na-22, Mn-54)
40 wk/yr, 9-week operational setup and maintenance
For available facility details, see SNL (1998d).
External and activation products require a 30-minute delay before entry and handling, maximum a few days for reuse. Sealed source Cm-244, Na-22
Items stored for decay before cleaning and reuse.
For available facility details, see SNL (1998e).
Some activation of Be-Cu materials and external.
For available facility details, see SNL (1998f).
External, no activation products are made.
For available facility details, see SNL (1998g).
External
For available facility details, see SNL (1998h).
External
For available facility details, see Jow (1991).
Ni-63 (<10 µCi each), Am-241 calibration sources,
For available facility details, see Jow (1991).
Mixed activation materials and parts from NTS, storage for units containing <100 µCi Kr-85, <10 µCi Ni-63, and 1,000 µCi H-3.
For available facility details, see SNL (1998i).
Tritium; low level of water concentration. Nuclear targets; tritium, Pu-239, DU Activated hardware, 50,000 kg
Neutron shots 200 mg Pu and DU 1,000 Ci tritium
For available facility details, see SNL (1998j).
No radioactive materials
For available facility details, see VanDevender (1984).
Activated stainless steel Aerosols generated during machining
Outside secured area
For available facility details, see SNL (1998k).
DU, C-14 Sealed sources
Millicurie quantities
ECF ECF See SNL (1998l).
Many SNL workers received exposure and intake monitoring at sites other than SNL. Those attending nuclear tests and, to a lesser degree, nosetip tests may have had a potential for intakes. The names and dates of selected nuclear weapons tests (shots) and nosetip tests are listed in Table 5-3 to assist the dose reconstructor in identifying terms that may be referenced in personnel records or the telephone interview [10]. SNL employees visiting or temporarily assigned to other facilities, such as other laboratories, processing facilities and production facilities may also have had the potential for intakes. Offsite dosimetry records may or may not be in the SNL records, but are supplied directly from the appropriate sites [11]. The dose reconstructor is referred to the technical basis documents for the specific sites when it is necessary to evaluate potential exposure at sites other than SNL-NM or TTR.
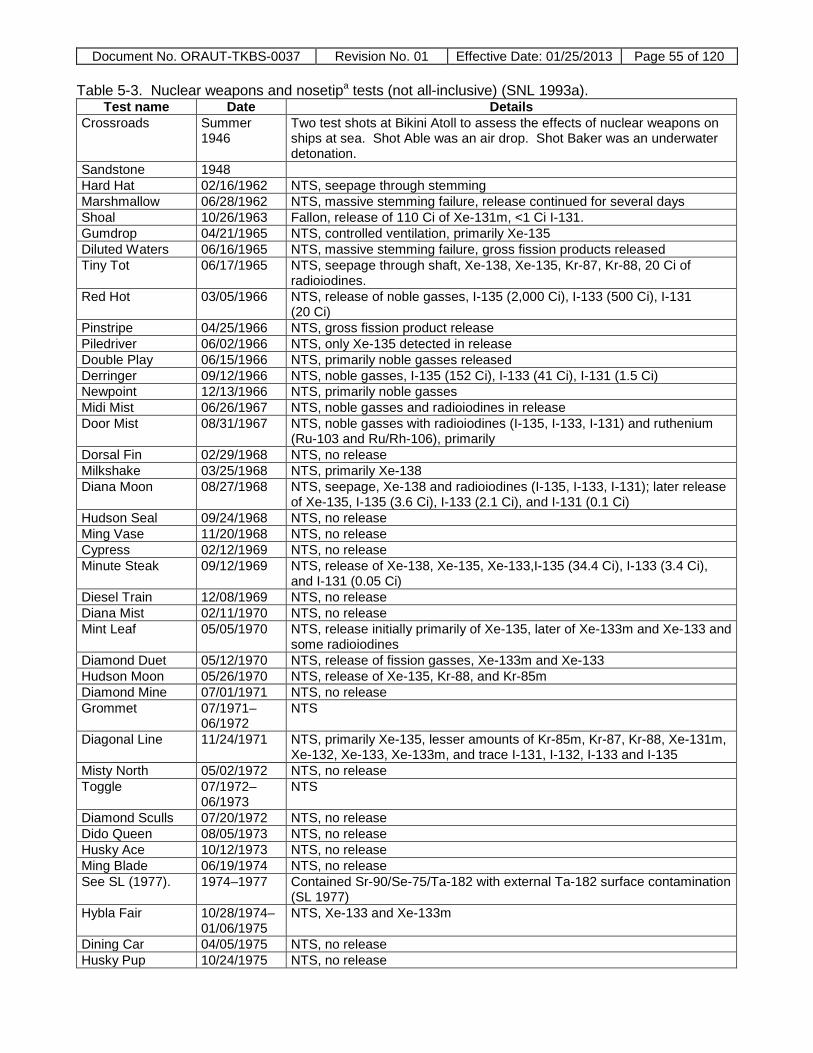
Document No. ORAUT-TKBS-0037 Revision No. 01 Effective Date: 01/25/2013 Page 55 of 120 Table 5-3. Nuclear weapons and nosetipa tests (not all-inclusive) (SNL 1993a).
Test name Date Details Crossroads Summer
1946 Two test shots at Bikini Atoll to assess the effects of nuclear weapons on ships at sea. Shot Able was an air drop. Shot Baker was an underwater detonation.
Sandstone 1948 Hard Hat 02/16/1962 NTS, seepage through stemming Marshmallow 06/28/1962 NTS, massive stemming failure, release continued for several days Shoal 10/26/1963 Fallon, release of 110 Ci of Xe-131m, <1 Ci I-131. Gumdrop 04/21/1965 NTS, controlled ventilation, primarily Xe-135 Diluted Waters 06/16/1965 NTS, massive stemming failure, gross fission products released Tiny Tot 06/17/1965 NTS, seepage through shaft, Xe-138, Xe-135, Kr-87, Kr-88, 20 Ci of
radioiodines. Red Hot 03/05/1966 NTS, release of noble gasses, I-135 (2,000 Ci), I-133 (500 Ci), I-131
(20 Ci) Pinstripe 04/25/1966 NTS, gross fission product release Piledriver 06/02/1966 NTS, only Xe-135 detected in release Double Play 06/15/1966 NTS, primarily noble gasses released Derringer 09/12/1966 NTS, noble gasses, I-135 (152 Ci), I-133 (41 Ci), I-131 (1.5 Ci) Newpoint 12/13/1966 NTS, primarily noble gasses Midi Mist 06/26/1967 NTS, noble gasses and radioiodines in release Door Mist 08/31/1967 NTS, noble gasses with radioiodines (I-135, I-133, I-131) and ruthenium
(Ru-103 and Ru/Rh-106), primarily Dorsal Fin 02/29/1968 NTS, no release Milkshake 03/25/1968 NTS, primarily Xe-138 Diana Moon 08/27/1968 NTS, seepage, Xe-138 and radioiodines (I-135, I-133, I-131); later release
of Xe-135, I-135 (3.6 Ci), I-133 (2.1 Ci), and I-131 (0.1 Ci) Hudson Seal 09/24/1968 NTS, no release Ming Vase 11/20/1968 NTS, no release Cypress 02/12/1969 NTS, no release Minute Steak 09/12/1969 NTS, release of Xe-138, Xe-135, Xe-133,I-135 (34.4 Ci), I-133 (3.4 Ci),
and I-131 (0.05 Ci) Diesel Train 12/08/1969 NTS, no release Diana Mist 02/11/1970 NTS, no release Mint Leaf 05/05/1970 NTS, release initially primarily of Xe-135, later of Xe-133m and Xe-133 and
some radioiodines Diamond Duet 05/12/1970 NTS, release of fission gasses, Xe-133m and Xe-133 Hudson Moon 05/26/1970 NTS, release of Xe-135, Kr-88, and Kr-85m Diamond Mine 07/01/1971 NTS, no release Grommet 07/1971–
06/1972 NTS
Diagonal Line 11/24/1971 NTS, primarily Xe-135, lesser amounts of Kr-85m, Kr-87, Kr-88, Xe-131m, Xe-132, Xe-133, Xe-133m, and trace I-131, I-132, I-133 and I-135
Misty North 05/02/1972 NTS, no release Toggle 07/1972–
06/1973 NTS
Diamond Sculls 07/20/1972 NTS, no release Dido Queen 08/05/1973 NTS, no release Husky Ace 10/12/1973 NTS, no release Ming Blade 06/19/1974 NTS, no release See SL (1977). 1974–1977 Contained Sr-90/Se-75/Ta-182 with external Ta-182 surface contamination
(SL 1977) Hybla Fair 10/28/1974–
01/06/1975 NTS, Xe-133 and Xe-133m
Dining Car 04/05/1975 NTS, no release Husky Pup 10/24/1975 NTS, no release

Document No. ORAUT-TKBS-0037 Revision No. 01 Effective Date: 01/25/2013 Page 56 of 120
Test name Date Details Mighty Epic 05/12/1976 NTS, no release See SL (1975b) 1976 Contained Se-75, sealed Co-57 sources, and DU (ballast). Hybla Gold 11/01/1977 NTS, no release See Miller (1978) 1977–1980 External Ta-182 surface contamination (Miller 1978) Diablo Hawk 09/13/1978 NTS, no release Huron King 06/24/1980 NTS, no release Miners Iron 10/31/1980 NTS, no release Huron Landing 09/23/1982 NTS, Xe-133, Xe-133m, Xe-135, Kr-85m, Kr-88 Mini Jade 05/26/1983 NTS, Xe-133 and Xe-133m Tomme/Midnight Zephyr
09/21/1983 NTS, no release
Midas Myth 02/15/1984 NTS, no release Midas Rain 04/06/1985 NTS, Xe-133, Xe-133m, Xe-135 Mill Yard 10/09/1985 NTS, Xe-133, Xe-133m, Xe-135 Diamond Beach 10/09/1985 NTS, Xe-133, Xe-133m, Xe-135 Mighty Oak 04/10/1986 NTS, Xe-133 and 2.4 Ci I-131 Middle Note 06/20/1987 NTS, no release Mission Ghost 06/20/1987 NTS, Kr-85 Mission Cyber 12/02/1987 NTS, no release Misty Echo 12/10/1988 NTS, no release Disko Elm 09/14/1989 NTS, Xe-133, Xe-133m, Xe-135 Mineral Quarry 07/25/1990 NTS, no release Distant Zenith 09/19/1991 NTS, no release Diamond Fortune 04/20/1992 NTS, Xe-133 and traces of I-131 Hunters Trophy 09/19/1992 NTS, no release
Nosetip tests had an intake potential different from that of weapons tests. Nosetips containing TaC rods were irradiated to produce 182Ta. The most significant hazard in these tests was external radiation, although there was some potential for intakes from surface contamination caused by tramp elements on surfaces before irradiation. Some instances of surface contamination caused by the irradiation of materials on the nosetip or heat shield have occurred during tests. The intake potential would be to a limited number of nuclides (182Ta is the most significant with the possibility of 75Se). The nosetips in these tests were typically prepared at SNL and shipped to Vandenberg AFB. A health physicist from SNL would travel to Vandenberg to perform the surveys on the shipment when it arrived and during the time the shipment was prepared for the test. The health physicist would take contamination surveys and external dose readings (Miller 1978).
General Internal Dosimetry History The SNL mission was primarily research, mostly focused on the effects of environmental factors and external radiation exposure on weapons materials and components. No potential for internal exposure was anticipated in many of the areas on the site [12].
The routine bioassay program was not formalized at SNL until after 1992. There is very little documentation about the internal dosimetry program or formal information about bioassay techniques or frequency before 1992. Some bioassay for tritium and uranium was performed beginning in 1949 [13] and some air-sampling limits were found from as early as 1964. The Industrial Hygiene Department was responsible for bioassay from at least 1959 through 1991 (Potter 1993b), and possibly as early as November 1949 (Rarrick 2007; Thompson 2007). Tritium and possibly some uranium and plutonium bioassays were performed [14]. Fewer than 100 workers participated in the bioassay program each year from the beginning of the program through 1991. The bioassay records were transferred to the corporate archives as microfilm or microfiche and dose summary results were entered into an electronic database beginning in 1967 (Thompson 2007). Much of the in vivo

Document No. ORAUT-TKBS-0037 Revision No. 01 Effective Date: 01/25/2013 Page 57 of 120 bioassay was outsourced until the SNL whole-body counter became operational in 1993. Although the number of individuals monitored has increased, not all individuals working at SNL are currently monitored.
Air sampling occurred infrequently, although health physics technician logs mention continuous air monitor (CAM) alarms and malfunctions. Records indicate that CAMs were in the Glovebox Laboratory of the SER facility (Author unknown, date unknown).
In 1991, a DOE Tiger Team assessment team identified several issues with the internal dosimetry program at SNL (SNL 1995a,b). The results of bioassay samples analyzed between August 1992 and April 1994 by Controls for Environmental Pollution (CEP, an offsite commercial laboratory) were invalidated based on the results of spike samples and the integrity of the data (DOE 1994; Hartman 2007). Records were found for uranium lung counting performed for workers in 1989 and 1990 by Helgeson Scientific Services. A positive bias, based on results of unexposed workers, is indicated for these counts (Brake 1989) [15].
Tritium, gamma isotopic, and uranium in vitro bioassays are currently being performed on site, as is whole-body counting. Monitored work areas include the plutonium areas (239Pu and heat source 238Pu), uranium areas, tritium facilities, laboratory facilities, reactors, accelerators, and environmental restoration sites.
Section 5.2 discusses in vitro methods for specific radionuclides. Section 5.3 discusses in vivo bioassay methods used currently and historically at SNL.
5.1.1 Bioassay Results of Individuals
There are few pre-1989 results of bioassay of individual SNL workers in the electronic records. An interview with a retiree who was involved in the archiving of early dosimetry records indicated that records of bioassay beginning in 1949 were entered into an electronic database when the bioassay results were being microfilmed [16]. Of the claimant records reviewed, most of the bioassay results in the records are from temporary assignments at sites other than SNL. Bioassay records before 1989 have been found in paper and microfiche format in the SNL archives, but retrieval is labor-intensive. These records contain uranium, plutonium, and tritium bioassay results. In addition, it is likely the bioassay records for workers employed by SNL before November 1, 1949 [17], when the Z-Division officially separated from LANL, may only be in the LANL bioassay database. If employment dates before November 1, 1949, are listed for a claimant, dosimetry records should be requested from LANL if none are in the worker’s file.
A 1989 appraisal of the Health Physics and Industrial Hygiene Departments indicates that there were no procedures for the Internal Dosimetry Program detailing employees on bioassay, frequency of sampling, and responsibility for results (Hyde 1989). The report indicated that there was good radiochemistry support to the bioassay analysis using documented procedures for nonquantitative uranium and possibly tritium (Preston 2005; Buvinghausen 2005; SNL 2005a,b). There is evidence that some workers may have been monitored by the Industrial Hygiene Department using breathing-zone air (BZA) samples (Pigg 1993). However, it is not known if the results of the BZA samples are included with the individual dosimetry records provided by the DOE.
In vivo monitoring for uranium was performed by Helgeson Scientific Services at SNL as subsequently addressed (HSS 1989). Brake (1989) suggests that a large number of positive 238U and 235U positive lung counts reported by Helgeson Scientific Services could have been attributed to the acknowledged positive bias exhibited by the Helgeson system.

Document No. ORAUT-TKBS-0037 Revision No. 01 Effective Date: 01/25/2013 Page 58 of 120 CEP provided bioassay services for SNL; however, CEP bioassay results shall not be used to assess reconstructed doses based on the following discussion. Bioassay samples were sent to CEP from August 1992 to April 1994. Poor performance on blank and spike samples was noted early in that contract. An investigation in 1995 invalidated all these results (Hartman 2007). Approximately 500 bioassay results were suspect (DOE 1994). Bioassay results and exposures were evaluated and a small number of individuals were resampled (Jones and Schwoebel 1995a,b). However, because the follow-up occurred as much as 2 years after the potential exposures, the results for analytes such as tritium and fission products would not have been representative of potential intakes. Some bioassay analyses for tritium were performed by SNL Industrial Hygiene or NTS during that period. Those results are valid. Before the contract was awarded to CEP, samples were outsourced to Atlan-Tech. That contract was dropped in favor of CEP because of poor performance. Therefore, results from Atlan-Tech should be suspect (Hallman and Potter 1992).
Tritium results for SNL personnel on assignment at LLNL could be reported in whole-body dose rather than as in vitro bioassay results [18]. The bioassay results from LLNL are available for dose reconstruction on request. Assignment of tritium dose for these individuals should follow the protocol established for workers permanently assigned to LLNL. This protocol for tritium dose is discussed in Section 5.2.3 and in Lawrence Livermore National Laboratory – Occupational Internal Dose (ORAUT 2010a).
5.1.2 The Bioassay Program
Before 1992, the Industrial Hygiene Department was “in charge” of the bioassay (Potter 1993b) and administered the respiratory protection program. Individuals were monitored following suspected intakes prompted by incidents, high results of general air samples, CAM alarms, or nasal swipes (Hasenkamp 1961). The assumption was that the potential for intakes was low (Gonzales 1985) and that the particle sizes of dispersed radioactive materials were generally accepted as larger than respirable, as described in a conference call with a retiree (Martin 2005) and discussed in a uranium briefing (Jow undated). Administrative limits were based on the prevailing AEC/DOE guidance [e.g., ICRP Publications 2 (ICRP 1959) and 30 (ICRP 1979)]. Discussions with a retiree indicate that bioassays were performed for uranium, plutonium, and tritium as early as 1949 (Rarrick 2007; Thompson 2007). Bioassay samples may have been sent offsite for analysis.
The Final Headquarters Report on the Nuclear Safety Program Appraisal of the DOE Albuquerque Operations Office in June 1985 described the internal dosimetry program as follows (Gonzales 1985):
The SNLA has minimal need for an internal Dosimetry program and thus the program is virtually nonexistent. No whole body or lung counting is routinely being done, however urine sampling is scheduled for a few employees. The following findings are provided:
Finding #15: The most recent Internal Dosimetry procedure available was dated 1977. Some substantive changes had since been written in but the procedure had not been updated.
Finding #16: The quarterly collection of urine samples which are processed for tritium is ineffective. If workers are to be routinely monitored for possible tritium exposure most facilities would collect samples for tritium analysis at least weekly.
Finding #17: The quality assurance audit program is not documented and extremely limited in scope.
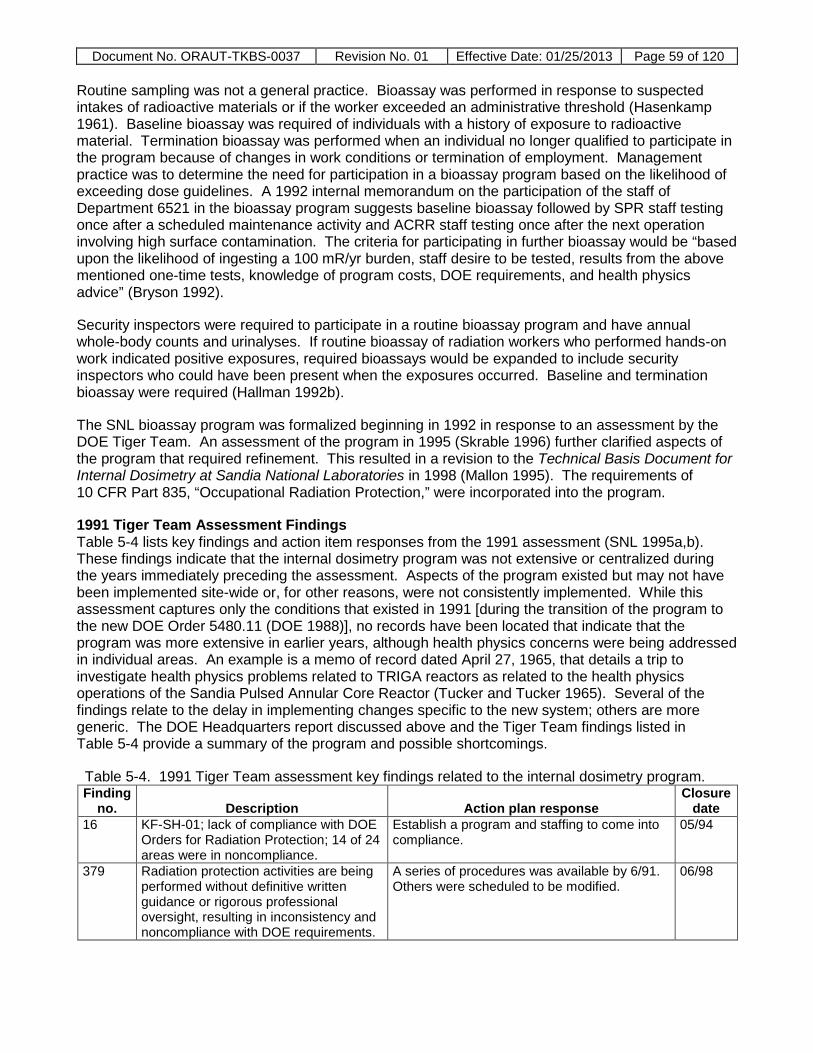
Document No. ORAUT-TKBS-0037 Revision No. 01 Effective Date: 01/25/2013 Page 59 of 120 Routine sampling was not a general practice. Bioassay was performed in response to suspected intakes of radioactive materials or if the worker exceeded an administrative threshold (Hasenkamp 1961). Baseline bioassay was required of individuals with a history of exposure to radioactive material. Termination bioassay was performed when an individual no longer qualified to participate in the program because of changes in work conditions or termination of employment. Management practice was to determine the need for participation in a bioassay program based on the likelihood of exceeding dose guidelines. A 1992 internal memorandum on the participation of the staff of Department 6521 in the bioassay program suggests baseline bioassay followed by SPR staff testing once after a scheduled maintenance activity and ACRR staff testing once after the next operation involving high surface contamination. The criteria for participating in further bioassay would be “based upon the likelihood of ingesting a 100 mR/yr burden, staff desire to be tested, results from the above mentioned one-time tests, knowledge of program costs, DOE requirements, and health physics advice” (Bryson 1992).
Security inspectors were required to participate in a routine bioassay program and have annual whole-body counts and urinalyses. If routine bioassay of radiation workers who performed hands-on work indicated positive exposures, required bioassays would be expanded to include security inspectors who could have been present when the exposures occurred. Baseline and termination bioassay were required (Hallman 1992b).
The SNL bioassay program was formalized beginning in 1992 in response to an assessment by the DOE Tiger Team. An assessment of the program in 1995 (Skrable 1996) further clarified aspects of the program that required refinement. This resulted in a revision to the Technical Basis Document for Internal Dosimetry at Sandia National Laboratories in 1998 (Mallon 1995). The requirements of 10 CFR Part 835, “Occupational Radiation Protection,” were incorporated into the program.
1991 Tiger Team Assessment Findings Table 5-4 lists key findings and action item responses from the 1991 assessment (SNL 1995a,b). These findings indicate that the internal dosimetry program was not extensive or centralized during the years immediately preceding the assessment. Aspects of the program existed but may not have been implemented site-wide or, for other reasons, were not consistently implemented. While this assessment captures only the conditions that existed in 1991 [during the transition of the program to the new DOE Order 5480.11 (DOE 1988)], no records have been located that indicate that the program was more extensive in earlier years, although health physics concerns were being addressed in individual areas. An example is a memo of record dated April 27, 1965, that details a trip to investigate health physics problems related to TRIGA reactors as related to the health physics operations of the Sandia Pulsed Annular Core Reactor (Tucker and Tucker 1965). Several of the findings relate to the delay in implementing changes specific to the new system; others are more generic. The DOE Headquarters report discussed above and the Tiger Team findings listed in Table 5-4 provide a summary of the program and possible shortcomings.
Table 5-4. 1991 Tiger Team assessment key findings related to the internal dosimetry program. Finding
no. Description Action plan response Closure
date 16 KF-SH-01; lack of compliance with DOE
Orders for Radiation Protection; 14 of 24 areas were in noncompliance.
Establish a program and staffing to come into compliance.
05/94
379 Radiation protection activities are being performed without definitive written guidance or rigorous professional oversight, resulting in inconsistency and noncompliance with DOE requirements.
A series of procedures was available by 6/91. Others were scheduled to be modified.
06/98

Document No. ORAUT-TKBS-0037 Revision No. 01 Effective Date: 01/25/2013 Page 60 of 120 Finding
no. Description Action plan response Closure
date 387 A formal permit system for control of
radiation work has not been implemented.
Five new radiation protection programs developed. The programs include procedures specifying protective clothing requirements, respiratory protection requirements, completing RWPs, HP document control, use and approval of RWPs, and engineering design in the workplace.
06/93
393 Personnel are permitted to enter and work in areas with a potential for airborne radioactive contaminants that have not been monitored, as required by DOE O 5480.11 (DOE 1988).
A new program for monitoring workplace air was developed. Equipment was to be installed in 1996.
01/96
397 Glovebox gloves are frequently patched rather than replaced as industry practice dictates.
Modified procedure to survey for contamination and replace gloves if damaged.
09/92
400 ALARA program does not fully meet the requirements of DOE O 5480.11 (DOE 1988) and other DOE guidance.
Procedure was being rewritten. 12/94
401 Personnel exposure files do not contain all the radiological information related to personal exposures and radiological working conditions as required by DOE O 5480.11 (1988).
The files will be expanded to include relevant data.
04/96
402 Internal dosimetry records are not generated and maintained as required by ANSI N13.6 (ANSI 1972) and DOE O 5480.11 (DOE 1988).
The Personnel Internal Radiation Dosimetry program was under development. A commitment was made to comply. [Noncompliance with ANSI 13.6 (ANSI 1972) was cited in an assessment in 1985 (Gonzales 1985).]
08/96
405 Management has not implemented a system to ensure ES&H Department review, approval, and control of all radiation protection activities.
Implement process to ensure ES&H Department review of activities and RWPs.
12/91
452 Respiratory Protection Program does not comply with ANSI Z88.2-1980 (ANSI 1980), DOE O 5480.11 (DOE 1988), and 29 CFR 1910.134.
Approved new program and began quantitative testing for all negative pressure respirators in 4/1991. However full implementation was not scheduled until 1995.
10/95
535 Surveillance of work area conditions during respirator use was not adequate. Sufficient documentation to support respirator selection and use did not exist.
All planned items to be addressed. 08/95
536 The breathing air garment developed for the Tritium Research Laboratory had not been approved by DOE.
Ceased use until approval of the garment could be completed.
08/90
Current Internal Dosimetry Program SNL relies on engineering controls to prevent intakes. Bioassay is used as a confirmation that the engineering controls are functioning properly. An example is the annual whole-body counts received by radiological control technicians and waste handlers. Waste handlers also receive routine bioassay for tritium. No other routine programs are in place [19].
Beginning in 1994, workers were required to participate in the bioassay program related to their entry into posted areas. Table 5-5 lists the current requirements. Table 5-6 lists historical requirements found in the records. Baseline bioassay is not specifically defined, but is assumed to include either
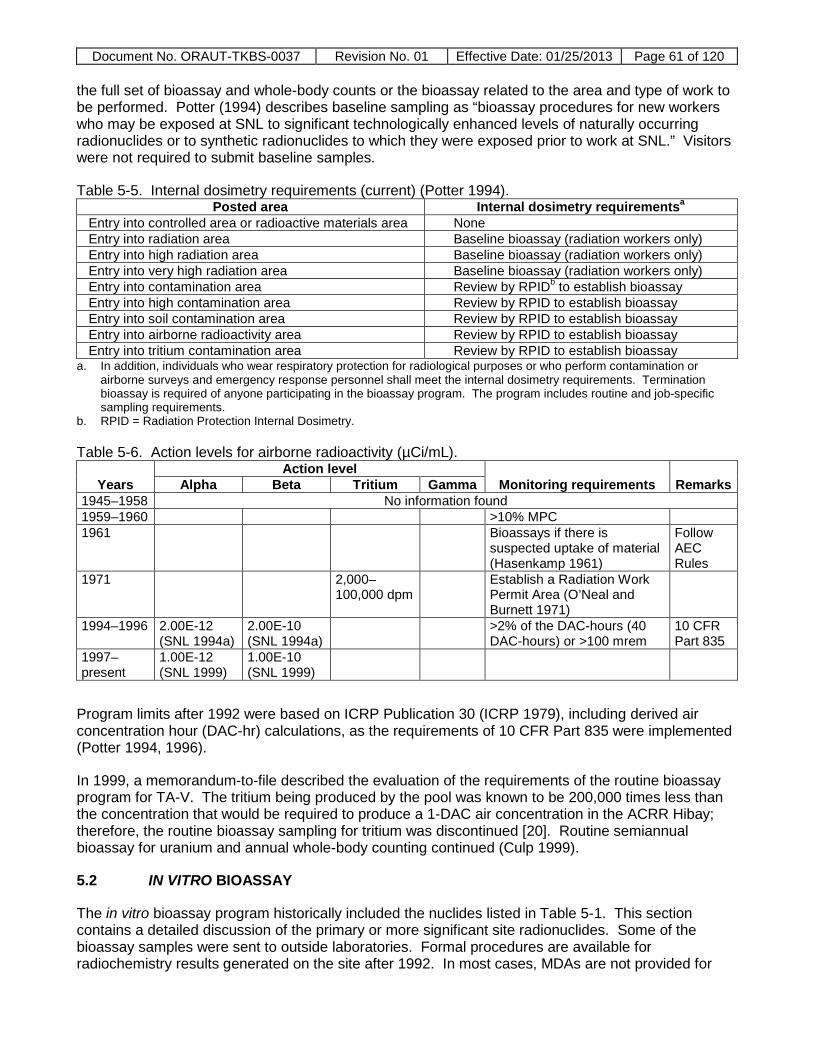
Document No. ORAUT-TKBS-0037 Revision No. 01 Effective Date: 01/25/2013 Page 61 of 120 the full set of bioassay and whole-body counts or the bioassay related to the area and type of work to be performed. Potter (1994) describes baseline sampling as “bioassay procedures for new workers who may be exposed at SNL to significant technologically enhanced levels of naturally occurring radionuclides or to synthetic radionuclides to which they were exposed prior to work at SNL.” Visitors were not required to submit baseline samples.
Table 5-5. Internal dosimetry requirements (current) (Potter 1994). Posted area Internal dosimetry requirementsa
Entry into controlled area or radioactive materials area None Entry into radiation area Baseline bioassay (radiation workers only) Entry into high radiation area Baseline bioassay (radiation workers only) Entry into very high radiation area Baseline bioassay (radiation workers only) Entry into contamination area Review by RPIDb to establish bioassay Entry into high contamination area Review by RPID to establish bioassay Entry into soil contamination area Review by RPID to establish bioassay Entry into airborne radioactivity area Review by RPID to establish bioassay Entry into tritium contamination area Review by RPID to establish bioassay
a. In addition, individuals who wear respiratory protection for radiological purposes or who perform contamination or airborne surveys and emergency response personnel shall meet the internal dosimetry requirements. Termination bioassay is required of anyone participating in the bioassay program. The program includes routine and job-specific sampling requirements.
b. RPID = Radiation Protection Internal Dosimetry.
Table 5-6. Action levels for airborne radioactivity (µCi/mL).
Years Action level
Monitoring requirements Remarks Alpha Beta Tritium Gamma 1945–1958 No information found 1959–1960 >10% MPC 1961 Bioassays if there is
suspected uptake of material (Hasenkamp 1961)
Follow AEC Rules
1971 2,000–100,000 dpm
Establish a Radiation Work Permit Area (O’Neal and Burnett 1971)
1994–1996 2.00E-12 (SNL 1994a)
2.00E-10 (SNL 1994a)
>2% of the DAC-hours (40 DAC-hours) or >100 mrem
10 CFR Part 835
1997–present
1.00E-12 (SNL 1999)
1.00E-10 (SNL 1999)
Program limits after 1992 were based on ICRP Publication 30 (ICRP 1979), including derived air concentration hour (DAC-hr) calculations, as the requirements of 10 CFR Part 835 were implemented (Potter 1994, 1996).
In 1999, a memorandum-to-file described the evaluation of the requirements of the routine bioassay program for TA-V. The tritium being produced by the pool was known to be 200,000 times less than the concentration that would be required to produce a 1-DAC air concentration in the ACRR Hibay; therefore, the routine bioassay sampling for tritium was discontinued [20]. Routine semiannual bioassay for uranium and annual whole-body counting continued (Culp 1999).
5.2 IN VITRO BIOASSAY
The in vitro bioassay program historically included the nuclides listed in Table 5-1. This section contains a detailed discussion of the primary or more significant site radionuclides. Some of the bioassay samples were sent to outside laboratories. Formal procedures are available for radiochemistry results generated on the site after 1992. In most cases, MDAs are not provided for

Document No. ORAUT-TKBS-0037 Revision No. 01 Effective Date: 01/25/2013 Page 62 of 120 any of the results in the early years. MDAs can occasionally be inferred from the results, but these are inferences only [21]. A Statement of Work for the contract laboratories and a review of the program in 1994 list the desired radionuclides and the requested MDAs (Vosburg 1993a).
Current MDAs are available. These MDAs can be used for the program from 1992 to the present, but are not necessarily applicable to the 1945-to-1991 period. Because the Z-Division was attached to LANL before November 1, 1949, the LANL MDAs apply to bioassay results before that date. Because of the bioassay agreement with LANL in the early years, LANL MDAs could be applicable for missed dose calculations. In addition, because techniques used in the early years of operation were similar to those used at LANL and in the nuclear industry in general for uranium, tritium, and plutonium, MDAs from LANL techniques can be assumed [22].
5.2.1 Plutonium
Because of the nature of the operations at SNL, plutonium was not a major component of the potential intakes. Potential chronic missed intakes of plutonium should not be assumed unless there is evidence, through bioassay results or work history, that the individual was exposed to plutonium in a workplace or field situations [23]. Work with plutonium was done in gloveboxes or hoods [24].
Plutonium bioassay using alpha spectroscopy for the determination of 238Pu and 239+240Pu (alpha spectroscopy cannot differentiate 239Pu and 240Pu) was requested from the contract laboratory. Sample results from CEP between 1992 and 1994 are considered to be invalid and these results should not be used for determination of intake (Hartman 2007). However, if results of samples analyzed by CEP are in a worker’s record, the worker should be considered as monitored for the applicable period.
Respiratory Tract Absorption Type The absorption type assigned for plutonium isotopes is dependent on the chemical process used to produce the plutonium mixture. However, no information is available about the potential respiratory tract absorption type or age of mixtures encountered at SNL. Because the lung class W (Type M) of 239Pu and 241Am was considered to result in limiting exposures to unknown mixtures, Class W (Type M) has historically been considered the default absorption at SNL for dose assessment (Mallon 1995).
In practice, much of the plutonium would be considered Type S because of the nature of the material. Material actually dispersed as a consequence of an explosion would have been subjected to high heat and, therefore, would be in the oxide form. The particle size of the dispersed material was typically a larger size than respirable particles (Martin 2005). Plutonium-238 could have been encountered as a high-fired oxide in the heat source technologies (Holley 1967). Excretion rates could differ from typical Type S compounds (Hammond, Lagerquist, and Mann 1968).
No other information about absorption types assigned to specific operations has been found. Therefore, the dose reconstructor should apply the absorption type most favorable to the claimant (ICRP 1994b). When applicable, internal dose due to potential exposure to plutonium strongly retained in the lung (Type Super S plutonium) must be evaluated (ORAUT 2010b).
Sample Collection Procedures Routine bioassay sample collection procedures were not well established at SNL before 1992. Most samples were collected on a protocol similar to the early LANL protocol that used three 1-L bottles for a 24-hour or simulated 24-hour sample. Spot samples may also have been taken [25]. Routine or special bioassay performed before 1992 was handled by the Industrial Hygiene Department rather than the Health Physics Department. Much of the bioassay monitoring was for nonradiological compounds associated with the processes at SNL; radiological bioassay was performed as part of the set of analyses of the routine bioassay samples submitted by workers [26]. Archives of radiological
Document No. ORAUT-TKBS-0037 Revision No. 01 Effective Date: 01/25/2013 Page 63 of 120 bioassay have been found dating back to the early years of operations (Rarrick 2007; Thompson 2007). The Technical Basis Document for Internal Dosimetry at Sandia National Laboratories (Mallon 1995) stated that urine bioassay was to be used to monitor routine intakes, but details about the frequencies and protocols associated with sample collection were not provided. Because exposure to plutonium at SNL was limited, extensive routine plutonium bioassay is not likely for most workers.
Missed Intakes Intakes of plutonium could occur from both acute and short-term chronic exposures. Chronic exposures may not be identified as incidents but can still result in a measurable burden of plutonium. However, long-term chronic exposures are not likely because of the nature of the tasks at SNL. If chronic intakes favorable to the claimant are assigned in the absence of positive bioassay results, these intakes should be assigned only for workers in TA-V or for those participating in waste-handling activities specifically involving plutonium [27].
Routine Sample Frequencies In general, the need for air sampling, BZA samples, or bioassay appears to have been based on the amount of material in the process at the time and the perceived possibility of an intake [28]. The Technical Basis Document for Internal Dosimetry at Sandia National Laboratories (Mallon 1995) addresses the use of bioassay to evaluate and demonstrate compliance with NRC guidance on internal dose and monitoring requirements. While these exact criteria were not in place early in the history of SNL, the philosophy of monitoring only when there was a potential for exceeding the current guidelines appears to have been consistent throughout the history of the program [29].
According to a memorandum in 1993, individuals working with 2 µCi or more of plutonium would be required to participate in a bioassay program as directed by Internal Dosimetry (Potter 1993b).
A special sampling program would be initiated when a radiological incident occurred or a positive routine bioassay sample result was obtained that indicated the possibility of an unexpected dose of 100 mrem Committed Effective Dose Equivalent (CEDE) or more (Bryson 1992).
Sample Analysis Procedures Nondestructive analyses are currently performed on the SNL site. However, analyses requiring radiochemistry (e.g., plutonium) have been sent off site since 1992 (Vosburg 1993b). However, according to conversations with a retiree and records in the SNL archives, beginning in 1949 samples were analyzed at SNL for total plutonium alpha (Rarrick 2007; Thompson 2007). These samples were prepared as deposited or electroplated samples in the Industrial Hygiene chemistry laboratories and transferred to the counting laboratory for proportional counting and, in later years, nuclear track emulsion, type A (NTA) or alpha spectrometry counting. In addition, arrangements were made with LANL and commercial laboratories to process samples (Hallman 1992c). The responsibility for bioassay was transferred to the Radiation Protection Department in 1992. From 1992 on, plutonium bioassay was performed off site. All sample results analyzed by CEP from 1992 to 1994 are considered invalid as discussed above. Most in vitro bioassay samples are urine. Fecal and tissue samples are performed only if requested in special circumstances.
If plutonium bioassay results are found in dosimetry records, these results could be labeled either as total plutonium or as 239Pu (which contains 240Pu) or 238Pu. Results labeled as 239Pu before 1967, the year when alpha spectroscopy was readily available in the industry, should be treated as total plutonium alpha unless accompanied by 238Pu results [30].
Detection Sensitivities and Reporting Limits MDAs are not available for older bioassay results. MDAs in the “picocurie range” were achieved beginning in 1960 when the electroplated disks were counted using NTA counting (Rarrick 2007). From 1992 to the present, the MDA has been 0.05 pCi/L for isotopic plutonium offsite analysis (Potter

Document No. ORAUT-TKBS-0037 Revision No. 01 Effective Date: 01/25/2013 Page 64 of 120 2006a). A 1993 Statement of Work for analytical services listed the required isotopic plutonium MDA as 0.0017 Bq/L (0.05 pCi/L) (Vosburg 1993b). Results are currently reported as the calculated value, positive or negative. When not specified, the MDA is considered to be two times the detection level (or uncertainty of the blank). MDAs may be reported with sample results before 1992. After 1992, a decision level (DC) equal to one-half the MDA may be reported with the sample results.
Because there was a Memorandum of Understanding (MOU) with LANL in the early years, after Z-Division was no longer directly controlled by LANL, the MDAs for plutonium analysis are included in Table 5-7, which lists the MDAs with reporting limits from LANL (Hallman 1992c). Bioassay performed for employees of the Z-Division during the period that the Z-Division was part of LANL would have used the applicable LANL procedures (Rarrick 2007). MDA levels for bioassay performed at SNL before 1992 are not generally available unless listed with specific sample results. However, analytical techniques and instrumentation similar to those used at LANL were used at SNL; therefore, the MDAs would probably have been similar (Rarrick 2007).
Table 5-7. Plutonium bioassay MDAs as listed in LANL procedures and reports.
Nuclide Year(s) Sample
typea Technique (“era”) MDA level Reporting limit
Unit/24-hr sampleb Unit/24-hr sampleb Pu-Total alpha
1944 U Cupferronc 0.7 pCi (Clark 2005)d >0.8 pCie
1945–1949 U Cupferronc 0.16 pCi to 0.05 pCif 1 dpm (0.45 pCi) DL (Moss 1990)
>0.8 pCie
1949–1/1957 U Bi-phosphate/alpha counting
0.20 pCi to 0.07 pCif 2 dpm or 0.9 pCi 0.4 pCie
1/1957–1965 U Aluminum nitrate/NTA 0.03 pCig 0.2 dpm or 0.09 pCi 1966 U ZnS 0.03 pCih (0.07 dpm) Pu-239 1967–1991 U RAS or PHA only starting
in 1971 0.03 pCii
1977–1981 F RAS (PHA) 1 nCi/sample (less if Am-241 ratio known)
1981–1983 F Phoswich detector, 4-cm sample thickness
0.4 nCi /sample or 400 pCi/ sample (17-keV X-rays)
Pu-238 1967–1971 U RAS (alpha PHA) 0.03 pCii 0.2 dpm/24-hr investigate
1971–1976 U RAS (alpha PHA) 0.03 pCii 1977–1991 U RAS (PHA) 0.03 pCii 1977–1981 F RAS (PHA) 0.4 nCi/sample 1981–1983 F Phoswich detector, 4-cm
sample thickness 0.2 nCi/sample, (17-keV X-rays)
a. U=urine, F=fecal. b. Unless otherwise noted. c. “A successful method of analyzing urine was developed in Jan. 1945 but could not be used as a routine test until a
contamination-free laboratory (ML Building) was ready for use in Feb. 1945” (Hempelmann 1945). d. Not adjusted for potential chemical recovery. e. Results above these values were considered “high” (i.e., positive) and subject to statistical investigation. Source:
Lawrence (1978). f. Background count rate 1 cpm (changed to 0.1 cpm at some unknown time before 1957), 1,000-minute count time, 50%
efficiency, average recovery 82.3% ±19.4% (1945 to 1949) and 67% ±21% (Nov. 1949 to Jan. 1957). g. Sources: Campbell et al. (1972); McInroy et al. (1991). h. Source: Moss et al. (1969). i. Source: UC (1978).
Plutonium results from LANL will most likely be reported in activity per 24-hour sample. However, results provided by commercial laboratories are expected to be reported as picocuries per liter.

Document No. ORAUT-TKBS-0037 Revision No. 01 Effective Date: 01/25/2013 Page 65 of 120 Therefore, if volume units are not provided with the sample results and the results are not indicated as provided by LANL or SNL, the dose reconstructor should assume the per-liter concentration.
Plutonium Isotopic Ratios (Mixtures) There is no definitive historical information on the 240Pu:239Pu atom ratios of SNL sources with the exception of a pure 238Pu [31] source term (Holley 1967), and there is no information on how the ratios vary with time and location.
Exposure to heat source technology pure 238Pu (238PuO2) may be suspected if positive 238Pu results are encountered when the associated 239Pu results are below the level of detection. A plutonium mixture that can be used when pure 238Pu from heat source technology is encountered is 238Pu (81%), 239Pu (15%), 240Pu (2.9%), 241Pu (0.8%), and 242Pu (0.1%) (Holley 1967). The disassembly of a 238Pu heat source in a glovebox was discussed in a SER logbook in 1972 (SL 1974). Table 5-8 lists the activity and weight ratios for heat technology plutonium mixture [32]. It is likely that pure 238Pu would be fresh during processing in the heat source technologies. However, intakes of aged pure 238Pu may be possible during decontamination or decommissioning activities in areas where pure 238Pu was processed. Table 5-8 includes the activity ratios necessary to calculate the appropriate mixture for aged pure 238Pu. Potential ingrowth of 241Am can be determined from the ratios in Table 5-8 (Holley 1967). Weapons-grade (6%) and fuel-grade (12%) aged mixtures are listed in Tables 5-9 and 5-10.
Table 5-8. Pure 238Pu isotopic mixture (Holley 1967).
Mixture designation Fresh 5 yr 10 yr 15 yr 20 yr 30 yr
Years of aginga 0 5 10 15 20 30
Component Weight fraction
(fresh) Specific activity (µCi/g of mixture) Pu-238 0.81 1.39E+07 1.33E+07 1.28E+07 1.23E+07 1.18E+07 1.09E+07 Pu-239 0.15 9.30E+03 9.30E+03 9.30E+03 9.30E+03 9.29E+03 9.29E+03 Pu-240 0.029 6.58E+03 6.58E+03 6.58E+03 6.57E+03 6.57E+03 6.56E+03 Pu-241 0.008 8.31E+05 6.53E+05 5.14E+05 4.04E+05 3.17E+05 1.96E+05 Pu-242 0.001 3.93E+00 3.93E+00 3.93E+00 3.93E+00 3.93E+00 3.93E+00 Am-241 NA 0 5.90E+03 1.05E+04 1.40E+04 1.68E+04 2.05E+04 Pu-239+ Pu-240
0.179 1.59E+03 1.59E+03 1.59E+03 1.59E+03 1.59E+03 1.59E+03
Activity ratiosb,c Pu-238/ Pu-239
1,490 1,430 1,380 1,320 1,270 1,180
Pu-238/ Pu-240
2,100 2,020 1,950 1,870 1,800 1,670
Pu-238/ Pu-241
16.7 20.4 24.9 30.5 37.3 55.7
Pu-238/ Pu-242
3.52E+06 3.38E+06 3.25E+06 3.13E+06 3.01E+06 2.78E+06
Pu-238/ Am-241
NA 2,230 1,220 876 704 532
Pu-238/ Pu-239+Pu-240
8,710 8,370 8,050 7,740 7,440 6,870
a. Time since separation of Am-241 from the plutonium mix. b. Calculate dose for Pu-239 and Pu-240 separately using these ratios. c. Pure Pu-238 was not on site at SNL until after the introduction of radiometric alpha spectroscopy (RAS) for analysis of
bioassay samples. Therefore, the activity ratios from total alpha plutonium are not applicable.
Table 5-9 lists activity and weight ratios as referenced for DOE sites for 6% weapons-grade plutonium. These ratios are based on the presumed age of the material for DOE sites. Table 5-10

Document No. ORAUT-TKBS-0037 Revision No. 01 Effective Date: 01/25/2013 Page 66 of 120 lists the relative activities of plutonium isotopes and 241Am, which grows in from 241Pu (Gallaher and Efurd 2002), in 12% 240Pu mixtures (Carbaugh 2003). In these tables, aging refers to the time since the 241Am was separated from the plutonium.
Table 5-9. Activity composition of reference weapons-grade (6%) plutonium mixture.
Isotope
Mixture designation Fresh 5-yr 10-yr 15-yr 20-yr 25-yr 30-yr
Years of aginga 0 5 10 15 20 25 30
Specific activity in mixture (Ci/g)
Pu-238 8.56E-03 8.23E-03 7.91E-03 7.60E-03 7.31E-03 7.03E-03 6.75E-03 Pu-239 5.77E-02 5.77E-02 5.77E-02 5.77E-02 5.77E-02 5.77E-02 5.77E-02 Pu-240 1.36E-02 1.36E-02 1.36E-02 1.36E-02 1.36E-02 1.36E-02 1.36E-02 Pu-241 8.24E-01 6.48E-01 5.09E-01 4.00E-01 3.15E-01 2.48E-01 1.95E-01 Pu-242 1.97E-06 1.97E-06 1.97E-06 1.97E-06 1.97E-06 1.97E-06 1.97E-06 Am-241 0 5.83E-03 1.04E-02 1.39E-02 1.66E-02 1.87E-02 2.03E-02 Pu-239+240 7.13E-02 7.13E-02 7.13E-02 7.13E-02 7.12E-02 7.12E-02 7.12E-02 Pu-alpha 7.99E-02 7.95E-02 7.92E-02 7.89E-02 7.85E-02 7.83E-02 7.80E-02 Total alpha 7.99E-02 8.53E-02 8.96E-02 9.28E-02 9.52E-02 9.70E-02 9.83E-02 Activity ratios Pu-239+240:Am-241 N/A 12.2 6.87 5.13 4.28 3.80 3.50 Pu-239+240:Pu-238 8.33 8.67 9.01 9.38 9.74 10.1 10.5 Pu-239:Pu-240 4.24 4.24 4.24 4.24 4.24 4.24 4.24 Pu-241:Pu-239+240 11.6 9.09 7.15 5.62 4.42 3.48 2.73 Pu alpha:Pu-239+240 1.12 1.12 1.11 1.11 1.10 1.10 1.10 Pu alpha:Pu-238 9.33 9.66 10.0 10.4 10.7 11.1 11.6 Pu alpha:Am-241 NA 13.6 7.62 5.68 4.73 4.19 3.84 Pu-241:Pu alpha 10.3 8.15 6.43 5.07 4.01 3.17 2.50
a. Time since separation of Am-241 from the plutonium mix.
The nature of the process work at SNL, however, involved research-grade plutonium mixtures usually considered to be fresh. While the plutonium mixture encountered in these processes should be assumed to be fresh, aged plutonium could have been encountered during building decommissioning and environmental restoration and in other areas where plutonium or plutonium contamination could have been in place for many years. Any 241Am observed in lung counts performed years after the intake can be assumed to be the result of the in-growth of 241Am from the 241Pu in the mixture over time or the 241Am in the initial plutonium mixture unless the incident report specifically indicates potential exposure to pure 241Am or urine bioassay for 241Am is found for the intake period. The most probable type of mixture encountered by the worker should be assumed to be a 6% plutonium mixture unless other information is available in the dosimetry records [33].

Document No. ORAUT-TKBS-0037 Revision No. 01 Effective Date: 01/25/2013 Page 67 of 120 Table 5-10. Activity composition of reference fuel-grade (12%) plutonium mixture.
Isotope
Mixture designation Fresh 5-yr 10-yr 15-yr 20-yr 25-yr 30-yr
Years of aginga 0 5 10 15 20 25 30
Specific activity in mixture (Ci/g) Pu-238 1.71E-02 1.64E-02 1.58E-02 1.52E-02 1.46E-02 1.40E-02 1.35E-02 Pu-239 5.26E-02 5.26E-02 5.26E-02 5.26E-02 5.26E-02 5.26E-02 5.25E-02 Pu-240 2.72E-02 2.72E-02 2.72E-02 2.72E-02 2.72E-02 2.71E-02 2.71E-02 Pu-241 3.09E+00 2.43E+00 1.91E+00 1.50E+00 1.18E+00 9.29E-01 7.30E-01 Pu-242 3.93E-06 3.93E-06 3.93E-06 3.93E-06 3.93E-06 3.93E-06 3.93E-06 Am-241 0 2.19E-02 3.89E-02 5.22E-02 6.24E-02 7.03E-02 7.63E-02 Pu-239+240 7.98E-02 7.98E-02 7.98E-02 7.97E-02 7.97E-02 7.97E-02 7.97E-02 Pu-alpha 9.69E-02 9.62E-02 9.56E-02 9.49E-02 9.43E-02 9.37E-02 9.32E-02 Total alpha 9.69E-02 1.18E-01 1.35E-01 1.47E-01 1.57E-01 1.64E-01 1.69E-01 Activity ratios Pu-239+240:Am-241 NA 3.64 2.05 1.53 1.28 1.13 1.04 Pu-239+240:Pu-238 4.67 4.86 5.05 5.24 5.46 5.69 5.90 Pu-239:Pu-240 1.93 1.93 1.93 1.93 1.93 1.93 1.93 Pu-241:Pu-239+240 38.7 30.5 24.0 18.8 14.8 11.7 9.16 Pu alpha:Pu-239+240 1.21 1.21 1.20 1.19 1.18 1.18 1.17 Pu alpha:Pu-238 5.67 5.87 6.05 6.24 6.46 6.69 6.90 Pu alpha:Am-241 NA 4.39 2.46 1.82 1.51 1.33 1.22 Pu-241:Pu alpha 31.9 25.3 20.0 15.8 12.5 9.91 7.83
a. Time since separation of the Am-241 from the plutonium mix.
5.2.2 Americium
At SNL, 241Am is usually encountered as a trace contaminant in plutonium. However, there is a potential for exposure to pure 241Am.
Americium-241 has always been included in the bioassay profile at SNL, but the specific source term driving the inclusion is not known [34]. However, documents have been found indicating that a pure 241Am source term does exist and has existed at SNL [e.g., a spill of 241Am was reported to have occurred on or about March 26, 1992 (SNL 1993b)]. There is an indication that workers submitted samples for the americium bioassay program only if there was a potential for exposure to pure americium. Therefore, plutonium mixtures should not be inferred from americium bioassay results if no plutonium results are associated with the americium bioassay. Conversely, if the selected plutonium mixture, based on plutonium bioassay results, indicates the presence of americium, the absence of americium bioassay should not preclude the calculation of the dose from the americium contribution to the plutonium mixture.
Encounters with 241Am could have occurred in relation to certain experiments or the handling of leaking calibration sources.
The potential for chronic exposure to pure 241Am or 241Am in a plutonium mixture at SNL is not routine. Potential missed chronic intakes of pure 241Am should not be assigned unless there is evidence that the worker was at least intermittently exposed to 241Am at SNL. This evidence would be from bioassay results or work histories [35].
Sample Frequencies At present, no routine sampling programs are in place for 241Am. A special sampling program would be initiated if a radiological incident occurred or a positive routine bioassay sample result indicated the possibility of an unexpected dose of 100-mrem CEDE or more (Bryson 1992).

Document No. ORAUT-TKBS-0037 Revision No. 01 Effective Date: 01/25/2013 Page 68 of 120 Minimum Detectable Activities Since 1992, bioassay for 241Am has been sent to offsite laboratories. All reported results have been listed as actual values, positive or negative. If not specified, 2 times the detection level is considered the MDA. The current MDA requested from offsite laboratories is 0.05 pCi/L (Vosburg 1993b; Potter 2006a). No record of MDAs before 1992 is available but, because of the MOU with LANL to perform bioassay analysis, LANL MDAs can be used if bioassay results without MDAs are found before 1992. Table 5-11 lists LANL MDAs.
Bioassay results listed as having been performed by CEP between 1992 and 1994 should be considered invalid (DOE 1994; Hartman 2007). However, if results of samples analyzed by CEP are in a worker’s record, the worker should be considered as monitored for the applicable period.
Table 5-11. Americium-241 LANL bioassay techniques and MDAs. Sample
type Year Method MDA Urine 1954–1957 Unknown 9.0E-01 pCi/24 hra Urine 1958–1982 Chemical extraction/proportional counting 2.0E-01 pCi/24 hrb Fecal 1977 Phoswich 4.0E-02 nCi/sample Urine 1983c–1991 Coprecipitation/alpha spectroscopyd 1.5E-02 pCi/24 hr Fecal 1983c Am/Pu screening/Phoswich 1.0E-02 nCi/sample a. No MDA available, use derived investigation level; tolerance level 3.1 pCi/sample. b. Source: McClelland (1958); method can carry over thorium, plutonium, curium, actinium, and
neptunium. Exact end date to the start of this MDA is not known. c. Source: Gautier (1983); exact start date of the MDA is not known. d. Source: Inkret et al. (1998).
5.2.3 Tritium
A 1989 review of health physics and industrial hygiene functional areas listed limited tritium handling as one of the main potential source terms at SNL (Hyde 1989). Applying potential missed dose based on chronic intakes of tritium is reasonable if work may have involved tritium exposure.
Tritium was encountered in several forms: tritium oxide (tritiated water; HTO), tritiated gas (HT), organically bound tritium (OBT), and metal tritide (MT). Each form has unique characteristics. If the form is not indicated or the work area is not specific, then, with the exception of MTs, dose reconstructors should assume HTO, which is the form generally encountered (SNL 1990).
Smear surveys of a TA-I accelerator facility in 1972 indicated significant tritium contamination on tools and target area parts. Some smears indicated more than 5 × 10⁶ dpm of tritium on parts and surfaces, especially those related to the target. Contamination was also found on the floors of the area. TA-I includes other potential sources of tritium intakes in areas of neutron generator work or known use and storage of tritium [36]. A smear survey of a TA-V reactor plenum indicated a maximum of 77 dpm/swipe (SNL 1989a). Tritium incidents have been recorded for accelerator areas [37].
The primary method of limiting uptakes of tritium was engineering controls, including proper ventilation. Smearable tritium of 2,000 dpm or less was considered a clean area. Smearable contamination of 2,000 dpm to 100,000 dpm required that contamination control procedures be observed and radiological work permit (RWP) areas established. Above 100,000 dpm, a Radiation Danger Zone was established (O’Neal and Burnett 1971).
Organically Bound Tritium The first approximation of the dose from OBT (labeled) compounds is the tritium in body water dose. However, the absorption, distribution, and excretion of tritium-labeled compounds are specific to the

Document No. ORAUT-TKBS-0037 Revision No. 01 Effective Date: 01/25/2013 Page 69 of 120 chemical and physiological behavior of the particular compound. Specific guidance is available in ORAUT (2007) if the dose records indicate an exposure to tritium-labeled compounds.
Metal Tritides Tritium exposures in the form of stable metal tritides (SMT) aerosols were possible. The compounds include the chemical hydrides and dihydrides of hafnium, erbium, titanium, zirconium, and other metals. In TA-I there was a potential for metal tritide exposure in one building, with the predominant form being erbium tritide. One TA-II facility also presented the potential for exposure to SMTs, which were used in neutron generators, although the potential for intakes from these sources was limited (SNL 1990).
If it is indicated that an energy employee performed work with a potential for exposure to SMTs, such as work with neutron generators or on components in the ECF, SMT exposure should be evaluated in the dose reconstruction. As with other forms of tritium, specific guidance is available in ORAUT (2007) if the dose records indicate an exposure to SMT.
Other Sources of Potential Tritium Intakes Noteworthy isolated tritium exposure incidents have occurred. Tritium swipe surveys have been performed consistently in many of the areas with a potential for tritium contamination. Table 5-12 lists these incidents, including surveys that identified areas of contamination, though other incidents at SNL are likely to have occurred.
Table 5-12. Other sources of potential tritium intakes. Time Description Intake Comments
3/9/71 Tritium survey of TA-I neutron generator manufacturing areas indicated measurable tritium on general surfaces.
Unknown (SL 1975a)
6/22/73 Tritium contamination on work area surfaces in TA-I neutron generator manufacturing areas, up to 7,142,000 dpm/smear on the source and 574,000 dpm/smear on a tray.
(SL 1975a)
5/30/73 Memorandum discusses the potential for intakes while handling the 50 Ci of tritium in a TA-I building.
(SL 1975a)
8/7/73 Tritium contamination on work area surfaces in a TA-I neutron generator manufacturing area.
(SL 1975a)
1/15/76 Swipe surveys in two TA-V accelerator buildings show levels up to 26,000 dpm.
(SL 1974)
1989 Tritium bioassay results annual report indicate several workers with sample results >MDA.
(Hallman 1990)
1991 The front sights of the M-16 rifles carried by SNL security inspectors contained 3 to 6 mCi of tritium. It was discovered that several of these rifles had leaking tritium cartridges. As a result, several security inspectors had positive urine bioassays (Ball 1991).
Because of this incident security officers received tritium bioassay at SNL and TTR.
1994 Thermocouples contaminated with tritium; 17,500 dpm removable.
None Most tritium fixed on surface
Analytical Techniques All results since 1992 are likely to be reported as actual values, positive, negative, or zero (SNL 2005a,b). The reported MDA for onsite tritium bioassay analysis is 1,000 pCi/L (0.001 µCi/L). A Statement of Work for analysis from an outside vendor requested a desired MDA of 9,000 pCi/L (Vosburg 1993b). The MDA before 1992 is unknown, but a report of all tritium results for 1989 indicates values of 0.01 µCi/L as the lowest value reported above 0.0. It appears that the analyses were performed at SNL (Hallman 1990). This agrees with the MDA reported by LANL at that time. LANL could have provided some analytical services to SNL before 1992. Typical MDAs reported by LANL before 1992 are listed in Table 5-13.
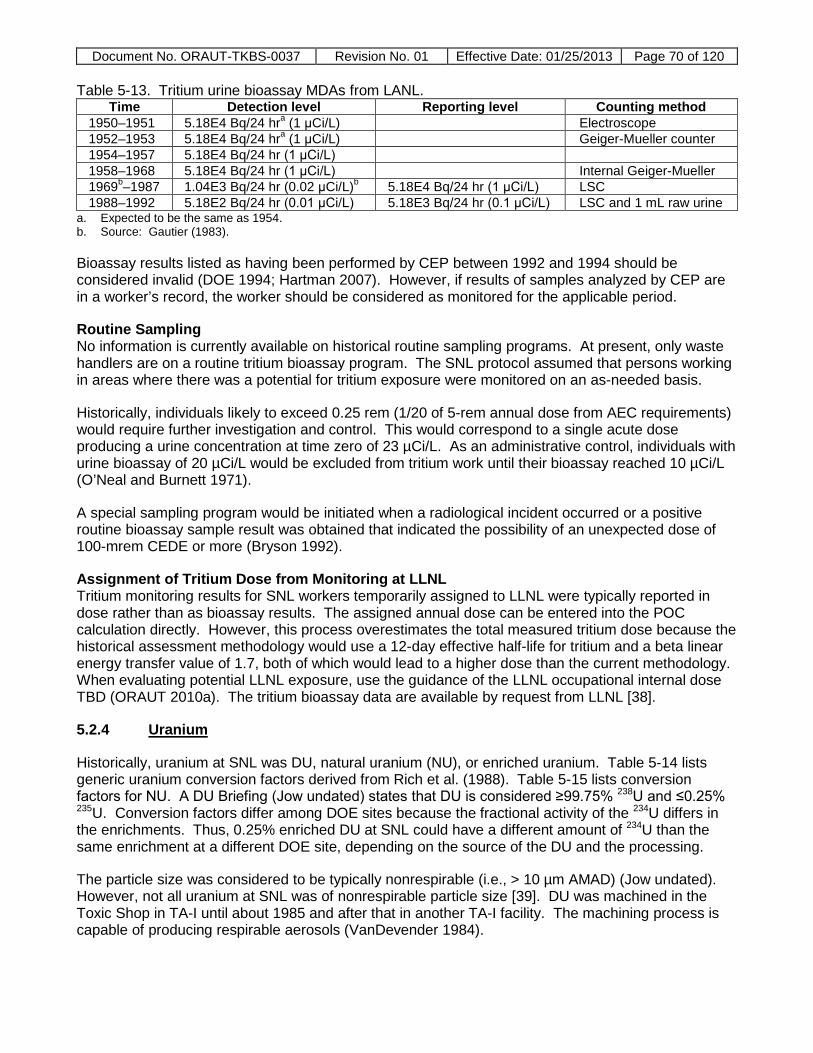
Document No. ORAUT-TKBS-0037 Revision No. 01 Effective Date: 01/25/2013 Page 70 of 120 Table 5-13. Tritium urine bioassay MDAs from LANL.
Time Detection level Reporting level Counting method 1950–1951 5.18E4 Bq/24 hra (1 μCi/L) Electroscope 1952–1953 5.18E4 Bq/24 hra (1 μCi/L) Geiger-Mueller counter 1954–1957 5.18E4 Bq/24 hr (1 μCi/L) 1958–1968 5.18E4 Bq/24 hr (1 μCi/L) Internal Geiger-Mueller 1969b–1987 1.04E3 Bq/24 hr (0.02 μCi/L)b 5.18E4 Bq/24 hr (1 μCi/L) LSC 1988–1992 5.18E2 Bq/24 hr (0.01 μCi/L) 5.18E3 Bq/24 hr (0.1 μCi/L) LSC and 1 mL raw urine
a. Expected to be the same as 1954. b. Source: Gautier (1983).
Bioassay results listed as having been performed by CEP between 1992 and 1994 should be considered invalid (DOE 1994; Hartman 2007). However, if results of samples analyzed by CEP are in a worker’s record, the worker should be considered as monitored for the applicable period.
Routine Sampling No information is currently available on historical routine sampling programs. At present, only waste handlers are on a routine tritium bioassay program. The SNL protocol assumed that persons working in areas where there was a potential for tritium exposure were monitored on an as-needed basis.
Historically, individuals likely to exceed 0.25 rem (1/20 of 5-rem annual dose from AEC requirements) would require further investigation and control. This would correspond to a single acute dose producing a urine concentration at time zero of 23 µCi/L. As an administrative control, individuals with urine bioassay of 20 µCi/L would be excluded from tritium work until their bioassay reached 10 µCi/L (O’Neal and Burnett 1971).
A special sampling program would be initiated when a radiological incident occurred or a positive routine bioassay sample result was obtained that indicated the possibility of an unexpected dose of 100-mrem CEDE or more (Bryson 1992).
Assignment of Tritium Dose from Monitoring at LLNL Tritium monitoring results for SNL workers temporarily assigned to LLNL were typically reported in dose rather than as bioassay results. The assigned annual dose can be entered into the POC calculation directly. However, this process overestimates the total measured tritium dose because the historical assessment methodology would use a 12-day effective half-life for tritium and a beta linear energy transfer value of 1.7, both of which would lead to a higher dose than the current methodology. When evaluating potential LLNL exposure, use the guidance of the LLNL occupational internal dose TBD (ORAUT 2010a). The tritium bioassay data are available by request from LLNL [38].
5.2.4 Uranium
Historically, uranium at SNL was DU, natural uranium (NU), or enriched uranium. Table 5-14 lists generic uranium conversion factors derived from Rich et al. (1988). Table 5-15 lists conversion factors for NU. A DU Briefing (Jow undated) states that DU is considered ≥99.75% 238U and ≤0.25% 235U. Conversion factors differ among DOE sites because the fractional activity of the 234U differs in the enrichments. Thus, 0.25% enriched DU at SNL could have a different amount of 234U than the same enrichment at a different DOE site, depending on the source of the DU and the processing.
The particle size was considered to be typically nonrespirable (i.e., > 10 µm AMAD) (Jow undated). However, not all uranium at SNL was of nonrespirable particle size [39]. DU was machined in the Toxic Shop in TA-I until about 1985 and after that in another TA-I facility. The machining process is capable of producing respirable aerosols (VanDevender 1984).

Document No. ORAUT-TKBS-0037 Revision No. 01 Effective Date: 01/25/2013 Page 71 of 120 According to Hyde (1989), DU machining operations represent one of the main potential source terms at SNL. Most particles are considered to be ≥1 mm, which is much larger than the 10-µm size considered to be respirable (Jow undated). However, oxides produced by high-energy events, such as penetration of hard armor, can produce some fraction of aerosolized (<3 µm) particles. Some explosion and implosion experiments (e.g., Nuclear Engineering Safety Technologies) resulted in approximately 11% aerosolized particles. Reactor experiments resulted in less than 1% aerosolized particles. Areas of known contamination were, and are, posted and require monitoring for contamination before exit or direction by radiation protection before entry into the area.
Table 5-14. Uranium conversion factors. Enrichment
percent Fraction by activity Fraction by mass Total
U-234 U-235 U-238 U-234 U-235 U-238 U pCi/µg 0.1 0.225 0.010 0.765 0.00001597 0.001 0.99898 0.438 0.17 0.260 0.010 0.730 0.00002 0.0017 0.999 0.465 0.2 0.285 0.010 0.705 0.00002178 0.002 0.997978 0.476 0.3 0.340 0.010 0.650 0.00003 0.003 0.997 0.514 0.5 0.410 0.020 0.570 0.00004 0.005 0.995 0.591 0.7 0.480 0.020 0.500 0.00005 0.007 0.993 0.668 0.711 0.486 0.022 0.492 0.00005 0.007 0.993 0.672 0.72 0.486 0.022 0.492 0.00005 0.007 0.993 0.675 3 0.745 0.045 0.210 0.00019 0.030 0.970 1.57 90 0.970 0.029 0.001 0.010 0.900 0.090 62.1 93 0.972 0.027 0.001 0.010 0.930 0.060 65.1 95 0.973 0.026 0.001 0.010 0.950 0.040 67.2
Table 5-15. Natural uranium. Isotope U-234 U-235 U-236 U-238 Total
Weight fraction 0.0000537 0.0072 0 0.99274 Specific activity (pCi/μg) 0.33369 0.01557 0.33369 0.68296a Fraction of total activity 0.4886 0.0228 0 0.4886
a. As listed in the Integrated Modules for Bioassay Analysis (IMBA) computer program, Version 4.0.9.
Fuel-coolant interaction experiments using corium thermite, which contains DU, ended in TA-V in 1983. The corium thermite material used in these experiments was prepared using dust respirators as respiratory protection. While most of the material recovered after the experiments was >10-µm in diameter, preparation of the material involved working with DU in the powdered form (Marshall 1993).
Sampling Protocol Historically and currently, there has been no routine sampling program for uranium. A special sampling program would be initiated if a radiological incident occurred or a positive routine bioassay sample result indicated the possibility of an unexpected dose of 100-mrem CEDE or more [40] (Bryson 1992). Bioassay sampling was initiated immediately after a suspected intake incident and continued for a “few” days [41]. According to a 1993 memorandum, individuals handling 10 µCi or more of DU would be required to participate in the bioassay program (Potter 1993b).
There is no preservative in the sample collection bottle, so an acid wash of the bottle is required to collect uranium that plated out on the surface of the bottle during sample transport and storage [42]. Also, because no workers participate in a routine uranium bioassay program, there is no protocol for routine sampling on a Friday or Monday (Potter 2006b). Friday sampling would include the prompt-removal fraction and Monday sampling (after a weekend away from the site) would typically not.
Uranium Analysis Techniques Techniques performed at SNL include fluorometry, kinetic phosphorescence analysis (KPA), and inductively coupled plasma mass spectroscopy (ICP-MS). Until 2003, uranium was analyzed by

Document No. ORAUT-TKBS-0037 Revision No. 01 Effective Date: 01/25/2013 Page 72 of 120 fluorometry using KPA or other fluorometric methods typical of the available instrumentation of the era. Fluorometry is based on the nonquantitative heavy-metal content in the urine. According to the Health Physics Department appraisal (Hyde 1989), a quantitative analysis was not available to evaluate positive samples. In 2003, KPA was replaced by ICP-MS, which can provide isotopic information as well as total uranium.
Analytical Sensitivity A discussion with a retiree indicated that bioassay for uranium was being performed by the Industrial Hygiene Department as early as 1950 [43]. Results of some of these bioassays have been found in SNL archives. Information on the analytical sensitivities for urine bioassay before 1992 is sporadic. Results identified for workers include blank and standard results. Table 5-16 lists the known MDAs. Because there was an MOU for analysis with LANL in the early years, LANL MDAs before 1975 can be assumed for the calculation of missed dose [44]. Samples could have been analyzed at contract laboratories other than LANL. After 1975, the MDAs in Table 5-14 are derived from analyses performed on site at SNL-NM or by a contract laboratory.
Table 5-16. Routine uranium urinalysis MDAs.
Period Methoda MDA Decision
level Reporting
levelb 1949–1967 Fluorophotometric (DU or NU) None listedc 50 μg/L >100 μg/L 1968–2/1976 Fluorophotometric (DU or NU) 4 μg/Lc,d U 3/1976–1978 Fluorophotometric (DU or NU) 1 μg/Ld U 1949–1954 Anion exchange/gross alpha counting
(possibly used) 25 dpm/L >100 dpm/L
1955–1971 Extraction/alpha proportional counting (U-234 alphas measured)
50 dpm/Lc,e 50 dpm/L >100 dpm/L
3/1971–1974 Extraction/alpha proportional counting 15 dpm/Lc >100 dpm/L 1975–2002 Total uranium–KPA or other fluorometric 0.1 μg/L 2003–present Total uranium–ICP-MS 0.1 μg/L (0.05 μg/L
usually achieved)
1993–present Alpha spectroscopy (U-233, -234, -235, -238) outside vendor
0.0033 Bq/L (0.089 pCi/L)
a. Method listed. b. Exceeding reporting levels required investigation and evaluation (Lawrence 1984). c. Lawrence (1984). d. 50 μg/L considered positive indication of NU material in the body (Dummer and Barker 1958). e. Specific for U-235 and U-233, 50 dpm/24-hr sample considered positive indication of enriched uranium in the body
(Dummer and Barker 1958). Use 50 dpm/L as MDA because no other information is available.
Bioassay results listed as having been performed by CEP between 1992 and 1994 should be considered invalid (Hartman 2007). However, if results of samples analyzed by CEP are in a worker’s record, the worker should be considered as monitored for the applicable period.
Environmental Uranium New Mexico is known for high levels of NU in the soil and groundwater. Some SNL workers could have lived in areas of particularly high NU concentrations ranging from 0 to 4 Bq/L (108 pCi/L) in 1992 and up to 6 Bq/L (162 pCi/L) in 2001 (Little, Miller, and Guilmette 2003a). These areas of high concentration are primarily in the Espanola area.
A 1992 study (Little, Miller, and Guilmette 2003b) listed the average drinking water concentrations for the area of Los Alamos, White Rock, and Santa Fe as 0.015 μg/L (0.01 pCi/L or 0.00037 Bq/L).
A study was conducted by SNL Internal Dosimetry personnel to determine the background range and mean of the background range of urinary excretion for nonradiation workers at SNL (SNL 1993b). That range was determined to be between 0.07 and 0.26 µg/L with a mean of 0.16 µg/L [45].

Document No. ORAUT-TKBS-0037 Revision No. 01 Effective Date: 01/25/2013 Page 73 of 120 The bioassay results reported for individual workers do not have dietary uranium subtracted. However, decisions to classify a sample as positive for occupational exposure were based on the sample exceeding the expected urinary excretion rate of levels in nonradiation workers at SNL (SNL 1993b). Urine samples with results above background are reanalyzed by alpha spectrometry (Potter 1993c). Samples that remain above background are evaluated to determine if the uranium is natural or depleted and resampling is initiated if the results are above 0.3 µg/L (Potter 1993c). Uranium bioassay was performed at SNL-NM as early as 1949 [46]. As of 1993, SNL-NM had not identified any intakes of depleted uranium; only natural uranium had been identified. Natural uranium is not currently considered an occupational intake by the site. Natural uranium was on the SNL-NM site from at least 1967 through the mid-1990s. For the purposes of the dose reconstruction program, all detected uranium is included in the dose reconstruction.
5.2.5 Fission and Activation Product Analysis
SPR (sometimes referred to as Kiva, which was the building housing the reactor), SER, and other reactors have operated in TA-V. Examples of fission and activation products in plant air samples, effluents, and primary coolant have been taken from various reports (SL 1967; SNL 1988, 1989a,b). An incident at the SPR-II reactor in about 1968 necessitated the evacuation of control room personnel when fission products released from the pulse migrated to the control room. The design was later modified to prevent this leakage after the pulse [47]. In addition, activation products were produced from photoactivation of metals in locations such as PBFA-II. Photoactivation of stainless-steel parts produces long and short half-life radionuclides with specific activities that can be microcurie/gram quantities. Handling can be delayed to permit the decay of short half-life products, such as isotopes of aluminum and copper. However, the ferrous isotopes (59Fe, half-life 45 days) and other activation products, such as 54Mn (half-life greater than 300 days), can become an aerosol when these parts are machined. These radionuclides are listed in Table 5-17.
Urine bioassay is currently performed on the site by gamma spectroscopy for fission and activation products (SNL 2004, 2005c). A 1993 Statement of Work for an outside laboratory lists the required MDA for mixed fission products based on 137Cs as 0.83 Bq/L (22.4 pCi/L) (Vosburg 1993b). The current urine bioassay MDA for 137Cs is 11 pCi/L. Bioassay results listed as having been performed by CEP between 1992 and 1994 should be considered invalid (Hartman 2007). However, if results of samples analyzed by CEP are in a worker’s record, the worker should be considered as monitored for the applicable period. Whole-body counting was also performed for fission and activation products as addressed in Section 5.3.
Table 5-17. Fission and activation product nuclides.
Type Radionuclide Limiting
DAC µCi/mL
Type Radionuclide Limiting
DAC µCi/mL Fission gas Kr-85m Sb-124 Xe-133 Activation products W-187 Xe-135 2E-5 Ag-110m Ar-41a Ta-182 Fission products Zr-95 Mn-54 I-131 2E-8 Mn-56b Ru-103 Na-24b Ru-106 Cu-64 b Ba/La-140 5E-7 Cd-115b Y-94 Al-28b Mo-99/Tc-99m 6E-5 Co-56 Zr-97/Nb-97 5E-7/ 3E-5 Co-57 Rb-89 Co-58 I-132 3E-6 Co-60b I-133 1E-7 Zn-65
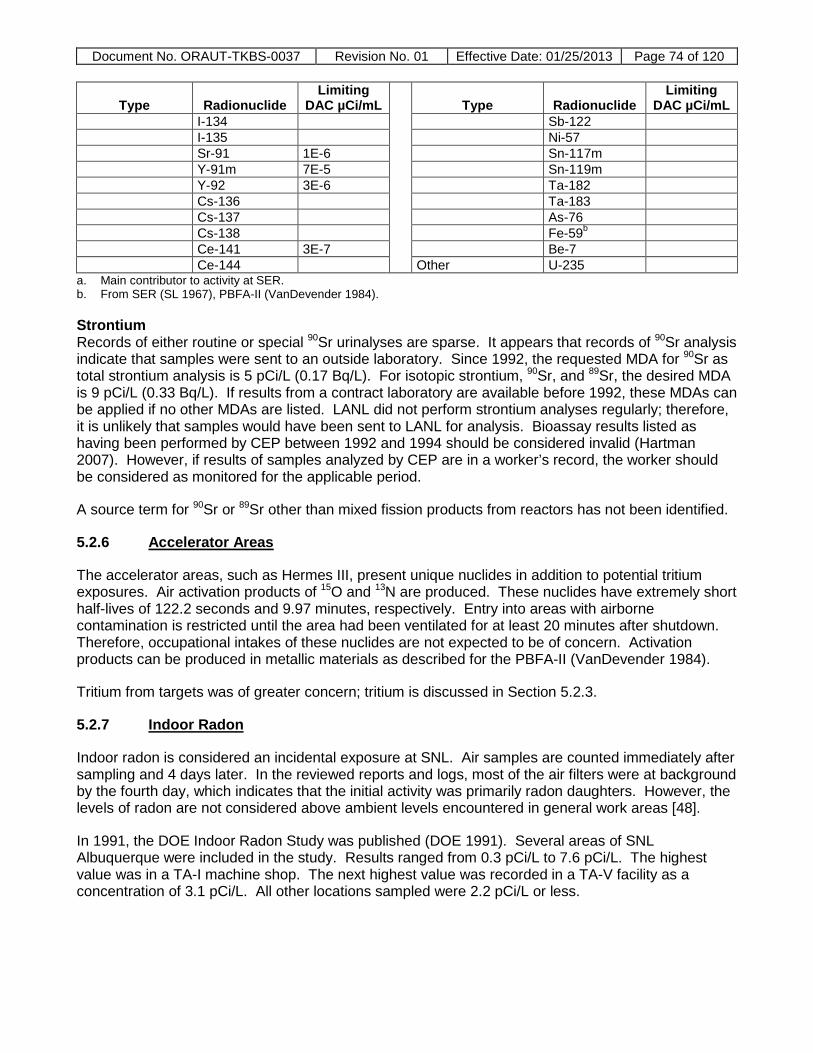
Document No. ORAUT-TKBS-0037 Revision No. 01 Effective Date: 01/25/2013 Page 74 of 120
Type Radionuclide Limiting
DAC µCi/mL
Type Radionuclide Limiting
DAC µCi/mL I-134 Sb-122 I-135 Ni-57 Sr-91 1E-6 Sn-117m Y-91m 7E-5 Sn-119m Y-92 3E-6 Ta-182 Cs-136 Ta-183 Cs-137 As-76 Cs-138 Fe-59b Ce-141 3E-7 Be-7 Ce-144 Other U-235
a. Main contributor to activity at SER. b. From SER (SL 1967), PBFA-II (VanDevender 1984).
Strontium Records of either routine or special 90Sr urinalyses are sparse. It appears that records of 90Sr analysis indicate that samples were sent to an outside laboratory. Since 1992, the requested MDA for 90Sr as total strontium analysis is 5 pCi/L (0.17 Bq/L). For isotopic strontium, 90Sr, and 89Sr, the desired MDA is 9 pCi/L (0.33 Bq/L). If results from a contract laboratory are available before 1992, these MDAs can be applied if no other MDAs are listed. LANL did not perform strontium analyses regularly; therefore, it is unlikely that samples would have been sent to LANL for analysis. Bioassay results listed as having been performed by CEP between 1992 and 1994 should be considered invalid (Hartman 2007). However, if results of samples analyzed by CEP are in a worker’s record, the worker should be considered as monitored for the applicable period.
A source term for 90Sr or 89Sr other than mixed fission products from reactors has not been identified.
5.2.6 Accelerator Areas
The accelerator areas, such as Hermes III, present unique nuclides in addition to potential tritium exposures. Air activation products of 15O and 13N are produced. These nuclides have extremely short half-lives of 122.2 seconds and 9.97 minutes, respectively. Entry into areas with airborne contamination is restricted until the area had been ventilated for at least 20 minutes after shutdown. Therefore, occupational intakes of these nuclides are not expected to be of concern. Activation products can be produced in metallic materials as described for the PBFA-II (VanDevender 1984).
Tritium from targets was of greater concern; tritium is discussed in Section 5.2.3.
5.2.7 Indoor Radon
Indoor radon is considered an incidental exposure at SNL. Air samples are counted immediately after sampling and 4 days later. In the reviewed reports and logs, most of the air filters were at background by the fourth day, which indicates that the initial activity was primarily radon daughters. However, the levels of radon are not considered above ambient levels encountered in general work areas [48].
In 1991, the DOE Indoor Radon Study was published (DOE 1991). Several areas of SNL Albuquerque were included in the study. Results ranged from 0.3 pCi/L to 7.6 pCi/L. The highest value was in a TA-I machine shop. The next highest value was recorded in a TA-V facility as a concentration of 3.1 pCi/L. All other locations sampled were 2.2 pCi/L or less.

Document No. ORAUT-TKBS-0037 Revision No. 01 Effective Date: 01/25/2013 Page 75 of 120 5.2.8 Other Limited-Exposure Radionuclides
SNL has always been a center for research. As such, small-scale use (in terms of either the number of persons involved or the activity of the source) of various radionuclides not addressed in previous sections has occurred throughout the history of SNL. Little or no documentation has been found on bioassay for these nuclides. These nuclides, as discussed below, should be assessed only if there is an indication that the worker had a potential for exposure to the respective nuclide.
Tantalum-182 Tantalum-182 is mentioned in several reports. Tantalum-182 is a gamma emitter and can be detected in gamma spectroscopy of urine samples or in a whole-body count.
Selenium-75 Selenium-75 is mentioned in several reports. Selenium-75 was typically used as a sealed source in payload operations between 1974 and 1980. These sources contained quantities of more than 2 Ci. Intakes were not likely unless there was an encounter with leaking sources. Selenium-75 is a gamma emitter and can be detected in gamma spectroscopy of urine samples or in a whole-body count.
Thorium Bioassay samples are sent off site for thorium isotope analysis. The current requested MDA for alpha spectroscopy analysis is 0.05 pCi/L. In 1993, a Statement of Work to an outside laboratory lists a desired MDA of 0.0033 Bq/L (0.09 pCi/L) (Vosburg 1993b). Results are expected to be reported in units of pCi/L. However, Table 5-18 lists the specific activity of thorium isotopes for use as necessary.
Table 5-18. Specific activity of thorium isotopes. Isotope Specific activity (pCi/μg) Th-228 8.1946E+08 Th-230 2.0184E+04 Th-232 1.0966E-01
Thorium operations at SNL began in 1959. Thorium-232, as an aged oxide, was containerized and sealed in 1996 and 1997.
Neptunium-237 Neptunium-237 was a requested nuclide in the Statement of Work for an outside laboratory in 1993 (Vosburg 1993b). The desired MDA using alpha spectroscopy was listed as 0.0017 Bq/L (0.05 pCi/L). However, 237Np is not a known source term in any of the site areas.
Polonium-210 Incidents of a leaking 210Po source have been reported. A leaking 210Po source was handled by a worker in 1968. A bioassay sample was submitted (O’Neal 1968). Other potential source terms are not known. If 210Po bioassay results (before 1960) are found in a worker’s records, the detection levels from LANL may be applicable because of the MOU for bioassay.
Detection limits for routine 210Po urinalysis are listed in Table 5-19. A procedure is listed for 210Po in urine in Gautier (1983). The 1958 detection levels can be considered to continue through the end of 210Po bioassay.
Table 5-19. Routine 210Po urinalysis MDAs. Period MDA Recheck Tolerance
1943–1952 440 dpm/24 hra 1953 50 dpm/24 hra 1954 10 dpm/L 100 dpm/L 500 dpm/L 1955–1957 0.1 pCi/L

Document No. ORAUT-TKBS-0037 Revision No. 01 Effective Date: 01/25/2013 Page 76 of 120
1958 100 dpm/L 500 dpm/L a. Source: UC (1979).
5.3 IN VIVO MINIMUM DETECTABLE ACTIVITIES, ANALYTICAL METHODS, AND REPORTING PROTOCOLS
In the early years, SNL had an MOU with LANL to perform whole-body and lung counting (Hallman 1992a,b; SNL 1993c). However, it is not known how many workers actually participated in the program. It appears that any whole-body counts that occurred were performed because of suspected intakes and not as part of a routine monitoring program for workers with a potential for intakes of fission and activation products. In vivo counting equipment and techniques were developed in the late 1950s and have been in routine use at LANL since at least 1970 and possibly as early as 1960. There is some indication that some of the counts recorded between the beginning of the program in 1955 and the 1960s were performed for development of the program rather than actual suspected intakes. Counts during this period should be evaluated as closely as possible for validity in the dose reconstruction.
In vivo monitoring for uranium was performed by Helgeson Scientific Services in 1989 and possibly in 1990 and 1991 (HSS 1989). The results of these counts were above the detection level for many of the counted TA-V staff (HSS 1991; SNL 1992, p. 4). A positive bias has been suggested in the Helgeson results (Brake 1989).
The whole-body counter program was established at SNL in 1993. The whole-body counting system is the commercially produced Canberra Accuscan II system with two hyperpure germanium (HPGe) detectors. This is a vertical shadow shield with two scanning germanium detectors. The system is capable of measuring the entire torso or specific areas. Currently, only Radiological Control Technicians and waste handlers receive annual whole-body counts to confirm the adequacy of the personal air sampling program (Mallon 1995, p. 26).
5.3.1 Whole-Body Counters–LANL (1955 to 1992)
When applying LANL bioassay results to SNL exposure, use the guidance of the LANL occupational internal dose TBD (ORAUT 2009a) for measurement and reporting parameters and protocols.
5.3.2 Whole-Body Counter–SNL
The SNL whole-body counter is a Canberra Accuscan II shadow-shield two-detector HPGe whole-body counter. The counting protocol was established for 137Cs, 60Co, and 40K sensitivities. MDAs reported in 2005 are listed in Table 5-20 and did not vary significantly from 2001 to 2005. Results reported in 1994 are approximately half the MDA reported beginning in 2001. The routine count time has remained the same since 1993. During that period, the counting system was relocated and the analytical software was upgraded, but no explanation for the change in MDA was provided [49].
Table 5-20. MDAs for whole-body counting, 2005 (Reese 2006).
Radionuclide MDA (nCi) K-40 140 Co-60 8.5 Cs-137 12
Table 5-21 lists MDAs reported for a typical 10-minute whole-body count. These are averages of MDAs reported for three workers evaluated in 1994 and the results of a single typical individual in 2001, considering the MDA as twice the LC.

Document No. ORAUT-TKBS-0037 Revision No. 01 Effective Date: 01/25/2013 Page 77 of 120 Table 5-21. MDAs (nCi) for whole-body counting (SNL 1994b, 2001).
Radionuclide 1993–2000 2001–present Radionuclide 1993–2000 2001–present Be-7 49.0 107 U-235 Not reported 208a Na-24 4.72 6.86 Gd-153 Not reported 87.4 Mn-54 5.45 11.2 Ir-192 Not reported 13.9 Co-56 5.37 8.84 Tl-201 Not reported 93.6 Co-57 13.2 29.8 Hg-203 Not reported 17.7 Ni-57 5.76 10.5 Tl-207 Not reported 3660a Co-58 4.00 7.98 Tl-208 Not reported 37.0 Co-60 5.54 6.27 Pb-210 Not reported 5940a Zn-65 8.10 19.0 Pb-211 Not reported 320a Zr-95 8.27 15.3 Bi-212 Not reported 139a Mo-99 11.3 57.8 Pb-212 Not reported 36.8 Ru-103 5.48 10.8 Bi-214 14.8 24.6 Ru-106 56.8 82.6 Pb-214 Not reported 32.2 Ag-110m 5.07 8.10 Rn-219 Not reported 140a Cd-115 19.6 24.8 Ra-223 Not reported 127 a In-115m 11.7 24.8 Ra-224 Not reported 414 Sb-122 7.71 11.7 Ra-226 Not reported 546a Sb-124 5.31 8.82 Th-227 Not reported 137a Sb-125 17.9 33.2 Ac-228 Not reported 39.4 I-131 6.75 13.2 Ra-228 Not reported 75.0 Ba-133 9.89 18.3 Th-228 Not reported 356a Cs-134 4.96 9.24 Th-229 Not reported 210a Cs-137 5.78 9.90 Pa-231 Not reported 770a Ba/La-140 20.8 36.8 Th-231 Not reported 1660a Ce-141 19.8 46.0 Th-232 Not reported 116 Pr-143 11.5 18.6 Pa-233 Not reported 28.8 Ce-144 94.3 212 Np-237 Not reported 252a Nd-147 56.9 64.6 U-238 Not reported 554a Eu-154 21.3 37.2 Pu-239 Not reported 36,800a Eu-155 54.7 125a Cm-243 Not reported Not reported Ta-182 15.0 26.8 Na-22 Not reported 5.58 Ta-183 25.3 156a Cr-51 Not reported 121 Am-241 97.5 186a Mn-52 Not reported 7.50 Fe-59 Not reported 14.8 Sr-85 Not reported 12.4 Ce-139 Not reported 24.8 Y-88 Not reported 4.38 Eu-152 Not reported 89.0 Ag-108m Not reported 8.10
a. The Accuscan II is a whole-body counter that is not optimized for low-energy photons or for the geometry typically associated with chest counts. However, these nuclides are reported as MDA (or possibly as positive results) in individual whole-body count reports. The reported MDAs should not be considered the primary method of assessing missed or bounding dose for these radionuclides if other types of bioassay results are available.
The nuclides listed in the MDA section of the whole-body count report do not necessarily indicate that the worker was potentially exposed to the entire list of nuclides. To determine if potential chronic exposure should be assumed, it is necessary to determine if the worker’s tasks resulted in the potential for intake. It is not reasonable to assume that a worker was exposed to all nuclides listed in Table 5-21. In addition, for overestimates, Table 5-22 lists nuclides that produce the highest dose to organs of interest based on the reported MDAs for that period. The organ of interest varies because the reported nuclides and the MDAs have changed over the history of the whole-body counting program. If it is necessary to assess missed dose, the nuclide can be used for the listed organs.

Document No. ORAUT-TKBS-0037 Revision No. 01 Effective Date: 01/25/2013 Page 78 of 120 Table 5-22. Nuclides that produce the highest dose to organ of interest.
Organ Nuclide/type (MDA in nCi)
1971–1984 1985–1992 1993–1999 2001–present Adrenals Co-60/M (1.8) Ce-144/M (24.2) Eu-154/M (24) Eu-154/M (53.2) Urinary bladder Co-60/M (1.8) Ce-144/M (24.2) Ru-106/F (43) Ru-106/F (98.2) Brain Co-60/M (1.8) Ce-144/M (24.2) Ru-106/F (43) Ru-106/F (98.2) Gall bladder Co-60/M (1.8) Ce-144/M (24.2) Eu-154/M (24) Eu-154/M (53.2) Kidneys Co-60/M (1.8) Ce-144/M (24.2) Eu-154/M (24) Eu-154/M (53.2) Liver Co-60/M (1.8) Ce-144/M (24.2) Eu-154/M (24) Eu-154/M (53.2) Muscle Co-60/M (1.8) Ce-144/M (24.2) Eu-154/M (24) Eu-154/M (53.2) Ovaries Co-60/M (1.8) Ce-144/M (24.2) Eu-154/M (24) Eu-154/M (53.2) Pancreas Co-60/M (1.8) Ce-144/M (24.2) Eu-154/M (24) Eu-154/M (53.2) Testes Co-60/M (1.8) Ce-144/M (24.2) Ru-106/F (43) Ru-106/F (98.2) Thyroid Co-60/M (1.8) Ce-144/M (24.2) I-131/F (6) I-131/F (14.8) RBM Co-60/M (1.8) Ce-144/M (24.2) Eu-154/M (24) Eu-154/M (53.2) Bone surface Co-60/M (1.8) Ce-144/M (24.2) Eu-154/M (24) Eu-154/M (53.2) Stomach Co-60/M (1.8) Ce-144/M (24.2) Eu-154/M (24) Eu-154/M (53.2) SI Co-60/M (1.8) Ce-144/S (24.2) La-140/M (21) Eu-154/M (24) ULI Co-60/M (1.8) Ce-144/S (24.2) La-140/M (21) Mo-99/S (71.5) LLI Co-60/M (1.8) Ce-144/S (24.2) Ce-144/S (98) Ce-144/S (201) Skin Co-60/M (1.8) Ce-144/M (24.2) Ru-106/F (43) Ru-106/F (98.2) Spleen Co-60/M (1.8) Ce-144/M (24.2) Eu-154/M (24) Eu-154/M (53.2) Uterus Co-60/M (1.8) Ce-144/M (24.2) Ru-106/F (43) Ru-106/F (98.2) ET Co-60/M (1.8) Ce-144/S (24.2) La-140/M (21) Ce-144/S (201) Lung Co-60/M (1.8) Ce-144/S (24.2) Ce-144/S (98) Ce-144/S (201) Colon Co-60/M (1.8) Ce-144/S (24.2) Ce-144/S (98) Ce-144/S (201) ET1 Co-60/M (1.8) Ce-144/S (24.2) La-140/M (21) Mo-99/S (71.5) ET2 Co-60/M (1.8) Ce-144/S (24.2) La-140/M (21) Ce-144/S (201) LN(ET) Co-60/M (1.8) Ce-144/S (24.2) La-140/M (21) Ce-144/S (201) bbsec Co-60/M (1.8) Ce-144/S (24.2) Ce-144/S (98) Ce-144/S (201) BBbas Co-60/M (1.8) Ce-144/S (24.2) Ce-144/S (98) Ce-144/S (201) Gonads Co-60/M (1.8) Ce-144/M (24.2) Eu-154/M (24) Eu-154/M (53.2) Breast Co-60/S (1.8) Ce-144/M (24.2) Eu-154/M (24) Eu-154/M (53.2) Heart wall Co-60/S (1.8) Ce-144/M (24.2) Eu-154/M (24) Eu-154/M (53.2) Thymus Co-60/S (1.8) Ce-144/M (24.2) Eu-154/M (24) Eu-154/M (53.2) BB Co-60/S (1.8) Ce-144/S (24.2) Ce-144/S (98) Ce-144/S (201) AI Co-60/S (1.8) Ce-144/S (24.2) Ce-144/S (98) Ce-144/S (201) LN(TH) Co-60/S (1.8) Ce-144/S (24.2) Ce-144/S (98) Ce-144/S (201) Esophagus Co-60/S (1.8) Ce-144/M (24.2) Eu-154/M (24) Eu-154/M (53.2)
Table 5-23 lists nuclides that do not represent a significant potential for chronic intakes. These nuclides were included in the whole-body counting analysis library because they can be encountered at the accelerators. However, accelerator workers do not routinely participate in the whole-body counting program.
Table 5-23. Accelerator nuclides in whole-body count library.
Nuclide Half-life Be-7 53.3 d Co-56 78.7 d Ni-57 1.5 d In-115m 4.49 hr Cd-115 2.23 d

Document No. ORAUT-TKBS-0037 Revision No. 01 Effective Date: 01/25/2013 Page 79 of 120
Sb-122 2.7 d Nd-147 11.0 d Ta-183 5.1 d
5.3.3 Cesium-137 Intakes from Fallout
Most workers in the early days of whole-body counting had detectable activities of 137Cs. Most of this was attributed to fallout. Some workers had even higher levels of 137Cs from consumption of wild game. An LC used to establish the difference between occupational and nonoccupational sources of 137Cs and other fallout radionuclide intakes has not been discovered in the records. In lieu of other information, the guidance in Table 5-24 can be used.
Table 5-24. Mean United States 137Cs body burdens from fallout.a Year Body burden (nCi) Year Body burden (nCi) 1953 0.27 1966 9.7 1954 1.1 1967 5.6 1955 2.2 1968 3.5 1956 4.3 1969 2.7 1957 5.1 1970 2.7 1958 6.5 1971 2.7 1959 8.1 1972 2.7 1960 6.8 1973 2.7 1961 4.6 1974 1.6 1962 6.0 1975 1.1 1963 11 1976 1.6 1964 19 1977 1.1 1965 16
a. Source: NCRP (1987).
A 137Cs result should be considered occupational if the same measurement detected other fission or activation products or if a fission or activation product or radiostrontium urinalysis showed detectable activity and the sample was obtained in a reasonable time before or after the whole-body count or within the period between the previous and next whole-body counts. The reasonable time is based on the biological retention pattern of the radionuclide in the body.
NCRP Report 94 provides mean body burdens of 137Cs for the United States for the years most likely to produce interference with occupational whole-body count results (NCRP 1987). Those values are listed in Table 5-24. If no other fission or activation products are detected and the 137Cs result is less than the values in Table 5-24, the 137Cs result can be assumed to be due to fallout. All other fission or activation products identified in the whole-body or lung count should be considered occupational unless specifically stated otherwise in the records provided for the individual.
5.3.4 Lung Burdens
Currently and historically, there is no chest counting system at SNL. With the exception of lung counts for uranium performed by Helgeson in 1989 and 1990, workers requiring lung counts would be sent to LANL. A 1992 memorandum indicates that this was done for at least one 241Am incident (Hallman 1992c). It also indicated that a worker was scheduled for an LANL whole-body count following a suspected plutonium intake (Crites 1967). Therefore, the LANL chest counting system is discussed here. The report from the Helgeson Scientific Services counts is also discussed below.

Document No. ORAUT-TKBS-0037 Revision No. 01 Effective Date: 01/25/2013 Page 80 of 120 Chest Counting at LANL When applying LANL bioassay analysis to SNL dose reconstructions, apply the guidance of the LANL occupational internal dose TBD (ORAUT 2009a) for measurement and reporting parameters and protocols.
Chest Counting by Helgeson Scientific Services Documents indicate that in 1989, 1990, and 1991 a mobile chest-counting system was brought to the SNL site to perform chest counts of workers (HSS 1989, 1991). Ninety-eight whole-body counts, 60 lung counts for DU and 235U, and 18 lung counts for 239Pu were performed in 1989. The positive results were two whole-body counts for 137Cs, 59 lung counts for DU, and 13 lung counts for 235U. No positive counts were recorded for 239Pu. There is no indication of the MDA for these counts or a description of the counting equipment used. Brake (1989) suggests that the Helgeson counting system might have been exhibiting a positive bias during that period.
5.3.5 Wound Monitoring
No procedures for gamma counting of wounds have been found although wound counting is mentioned in the program overview (Potter 1994) and the Sandia National Laboratories Radiation Protection Internal Dosimetry Technical Basis Document (Mallon 1995).
5.4 AIR CONCENTRATIONS
5.4.1 Respiratory Protection Program
Although the SNL Z-Division originated at LANL, the respiratory protection program at SNL is not clearly documented to reflect the LANL program. As late as 1993 (Marshall 1993), the use of “dust respirators” is listed as the protection for mixing powders containing DU. While documents have suggested that respirators were used during certain activities, protection factors should not be applied in the dose reconstruction because their use by specific individuals is uncertain.
Contamination Surveys Records of area contamination surveys have been found. A resuspension factor of 1 × 10⁻⁶ is usually considered when determining the potential air concentration from loose surface contamination [50].
Contamination limit action levels in 1961 were listed as >500 cpm of alpha per 60 cm2 or 1 mR/hr beta-gamma fixed or any removable (Hasenkamp 1961). A counting efficiency of 50% is usually assumed for alpha counting. A technique for taking smears was discussed in the SERF Health Physics Handbook (Devlin 1964) and limits were 100-to-200 cpm/1 ft2. This was equivalent to 3,000 to 6,000 dpm/ft2 given collection and counting efficiencies. Loose contamination was cleaned up promptly because of the adverse impact it could have on experiments.
The Safe Operating Procedure of January 23, 1984, for a TA-I machine shop lists the limits for uncontaminated materials as <10 cpm removable alpha or <200 cpm removable beta-gamma. Materials containing plutonium were not permitted in the shop (VanDevender 1984).
A procedure for contamination surveys was issued in 1993 (Shanks 1993). Result flags on smear survey reports circa 1994 indicate that actions were taken in relation to the critical level (approximately half the MDA) and the 2-sigma error. Action levels in the 1990s are listed as 20 dpm alpha and 1,000 dpm beta-gamma for smearable contamination (SNL 1995c, p. 4).
Continuous Air Monitors Documents indicate that alpha and beta/gamma CAMs were in use in areas where airborne radionuclides were expected (SL 1967). Documents also indicate that standard maximum permissible

Document No. ORAUT-TKBS-0037 Revision No. 01 Effective Date: 01/25/2013 Page 81 of 120 concentrations (MPCs) were observed for appropriate contaminants (SL 1967). In addition, CAMs were placed near the point of release where the air concentration would be at a maximum as a backup detection device. These were in addition to the general area CAMs. For areas involving gloveboxes, other methods of detecting possible breaches of integrity were in place (Gonzales 1985). Gloveboxes are operated with negative pressure and inert atmospheres. Oxygen sensors detect the presence of the smallest leak [51].
CAM alarms were historically used as an indication that room conditions had changed and that respiratory protection was required. The selection of the location of the CAM was critical to the reliability of the response (Whicker et al. 1997). The typical location of general area CAMs at the ventilation exhaust point of a room was not optimal. Results suggest that when a worker caused a release and was at or near the release point, the worker could be exposed for a significant period before the released radioactivity reached the CAM.
The above limitations suggest that, without other interventions, the possibility exists that workers could be exposed to intakes that did not trigger alarms.
5.4.2 Incident Intake Information
Intake parameters can be derived from airborne contamination levels for buildings with the highest exposure potential or highest intakes for various periods. Examples of incidents and intakes are listed in Table 5-25. Average airborne contamination levels either are derived as simple averages or are reported as averages listed in reports. Simple averaging is assumed for SNL reports, but no information on the methods used to obtain these reported averages is available.
Table 5-25. Reported exposure incidents and results.a Date Incident
06/04/1967 Contamination of a laboratory area in TA-I; water leaking on tritium-contaminated equipment, 2,440 dpm/ft2 (SL 1975a).
11/19/1967 Positive bioassay for Pu-239 from TA-I for an individual; 1.5 times maximum permissible body burden (Crites 1967).
3/1968 to 4/1968
Positive bioassay for tritium for workers; maximum 18 µCi/L. No incident discussed (Crites 1968).
3/13/1968 to 3/25/1968
Division 4233 individual with 27-µCi/L tritium urine sample; last sample 11.7 µCi/L (Crites 1968).
3/08/1968 Pu-238 “spill,” particle found on CAM air filter in TA-I (Hudson 1968). 11/22/1968 Leaking Po-210 source transferred between laboratories. No intakes confirmed (O’Neal 1968). 1/14/1970 Pu-238 spill; a leak discovered in a glovebox during cleaning. Contamination of the area in TA-I
(SL 1975a). Employees submitted bioassay samples. 9/21/1983 Be-7, Zn-65, and Ag-110m found on Radeco air filters in accelerator area of TA-V (SNL 1985). 4/12/91 Leaking neutron calibration device containing gaseous tritium in area. Approximately 150
concerned employees requested bioassay. 3/26/1992 Am-241, spill location unknown, urine bioassay 1.38E-1 pCi/sample, listed as false positive. 3/30/1993 Am-241 contamination >10,000 dpm on tray in TA-I; area not posted as Controlled Area. Tray
in use for 10 years (Byers 1993). a. While an attempt has been made to report only incidents with quantitative results, some incidents, for which only
qualitative comments were available in the records, have been included in the list. Information is not available for every year of operation.
6.0 OCCUPATIONAL EXTERNAL DOSE
6.1 DOSIMETERS USED
The external dosimetry records for workers employed by SNL before November 1, 1949, when the Z-Division officially separated from LANL, may be only in the LANL database [52]. If employment dates

Document No. ORAUT-TKBS-0037 Revision No. 01 Effective Date: 01/25/2013 Page 82 of 120 before November 1, 1949, are listed for a claimant, dosimetry records should be requested from LANL if none are in the worker’s file. Beta/gamma and neutron dosimeters used at SNL over the years are listed in Tables 6-1 and 6-2. SNL switched from film to thermoluminescent dosimetry after its supplier of dosimetry film discontinued production in November 1969 (Tucker 1970). Stockpiling of film enabled use of film dosimeters through approximately April 1971.
Table 6-1. Beta/photon dosimeters. Period Dosimeters used
Pre-1949 LANL dosimetry
1949–1958 Film Badge 1: Metal holders were used that had a brass clip that covered one end of the film packets. The brass clip was intended to attenuate beta rays but not stop gamma rays (Kingsley 1953a). This holder was also issued as a wrist badge.
1959–April 1971
Film Badge 2: Plastic holder had four windows: open window, 0.035-in. Al filter for beta/gamma, tungsten/cadmium and tin filters for thermal neutrons. Used DuPont 558 film packets for beta/gamma exposures based on calibrations with Co-60 and 70-keV X-rays. Packets contained DuPont 519 film (stated range 30 mR to 10 R) and 1290 film (stated range 10R to 3000 R) (Drake 1959; Tucker and Drake 1960).
May 1971–~1988 Harshaw Model 2271: The first TL badge had an open window and a 0.035-in. Al filter. The TLD card consisted of two TLD-100 elements, each 0.035-in. thick. (Tucker 1970; Thompson, Tucker, and Armijo 1972; Kingsley 1971; Author unknown 1988).
~1989–~1994
Harshaw Model 8801 (7776-1141) cards in Model 8812 holder (Bradley 1993a,b,c; Friedman 1993; Rhea and Bradley 1991; Ward 1994) 1: 0.015-in. thick TLD-700 under 600 mg/cm2 ABS plastic (deep dose)
2: 0.015-in. thick TLD-700 under 242 mg/cm2 ABS plastic, 0.004-in. Cu (low-energy X-rays) 3: 0.0036-in. thick TLD-700 under open window, 0.0025-in. Mylar (shallow dose)
4: 0.015-in. thick TLD-600 under 600 mg/cm2 ABS plastic (neutron dose)
~1995–present
Harshaw/Bicron EXTRAD put into use 2nd quarter 1997 for extremity dose. Harshaw Model 8802 (7776-1161) or 8801 cards (see above) in Model 8812 holder 1: 0.015-in. thick TLD-700 under 600 mg/cm2 ABS plastic (deep dose)
2: 0.015-in. thick TLD-700 under 242 mg/cm2 ABS plastic, 0.004-in. Cu (low-energy X-rays) 3: 0.006-in. thick TLD-700 under open window, 0.0025-in. Mylar (thicker shallow-
dose chip than in the Model 8801) 4: 0.015-in. thick TLD-600 under 600 mg/cm2 ABS plastic (neutron dose) (Walker 1996, 1997a; Bradley 1993d, 1994, 1995a,b)
Table 6-2. Neutron dosimeters. Period Dosimeters used
1945–1958 No neutron dosimeters were used. 1959–April 1971 Film Badge 2: In a plastic holder with four windows; those with cadmium and tin filters
were used to measure thermal neutrons. Used DuPont film for thermal neutron dose and NTA film for fast neutron dose based on calibrations with a Van de Graaff accelerator at energies of 1, 5, and 14 MeV. (Drake 1959; Tucker and Drake 1960).
May 1971–~1973 The first TL neutron badge consisted of three LiF elements: two LiF-600 that were sensitive to thermal neutrons and one LiF-700 that was insensitive to neutrons but was used to subtract any gamma contribution. The LiF elements were placed behind tin and cadmium filters to support determination of incident and scattered thermal neutrons (Tucker 1970; Kingsley 1971).

Document No. ORAUT-TKBS-0037 Revision No. 01 Effective Date: 01/25/2013 Page 83 of 120
Period Dosimeters used ~1973–~1990 First dedicated neutron dosimeter incorporated two cards, each with a TLD-600 and a
TLD-700 element. One TLD-600 and TLD-700 were enclosed in a borated polyethylene pouch and one TLD-600 and TLD-700 were uncovered. The holder had an open window and three 0.035-in. Al filters. Deep and shallow measurements were made with the TLD-700 elements and bare and boron-filtered measurements of neutrons with the TLD-600 elements to discriminate energies near thermal (Author unknown 1988).
July 1984 An albedo TLD was added for neutron dosimetry (Author unknown 1988). ~1990–1994 Harshaw ”Sandia Beta-Gamma-Neutron Configuration, Model 8812/8801”
1. 0.015-in. TLD-700 under 600 mg/cm2 ABS plastic (0.277-in.) 2. 0.015-in. TLD-700 under 242 mg/cm2 ABS plastic and 0.004-in. copper 3. 0.0015-in. TLD-700 under 0.0025-in. Mylar 4. 0.015-in. TLD-600 under 600 mg/cm2 ABS plastic (neutron dose) (Bradley 1993a,b,c; Friedman 1993; Rhea and Bradley 1991; Ward 1994)
1995–present Harshaw -“Sandia Beta-Gamma-Neutron Configuration, Model 8812/8802” 1. 0.015-in. TLD-700 under 600 mg/cm2 ABS plastic (0.277-in.) 2. 0.015-in. TLD-700 under 242 mg/cm2 ABS plastic and 0.004-in. copper 3. 0.006-in. TLD-700 under 0.0025-in. Mylar 4. 0.015-in. TLD-600 under 600 mg/cm2 ABS plastic (neutron dose) (Bradley 1993d, 1994, 1995a,b)
6.2 RECORDED DOSE PRACTICES
Table 6-3 summarizes the dose-related quantities that have been reported in SNL annual dose summaries from 1949 to the 1990s (Widner 2008a,b,c). LANL TBD parameters (ORAUT 2009b) apply to pre-1949 SNL dosimetry unless the monitoring records indicate that a different site managed the applicable dosimetry.
The following relationships were used starting around 1971 to calculate compliance dose quantities (Ward 1994):
Skin dose = shallow dose + deep dose + neutron dose Whole-body dose = deep dose + neutron dose Extremities dose = shallow dose + deep dose + neutron dose
Electronic files of annual dose records received from SNL for years since 1986 include deep dose, neutron dose, eye dose, shallow dose, extremity dose, CEDE, and Total Effective Dose Equivalent (Widner 2008a,b,c).
Table 6-3. Recorded dose practices.
Data on annual dose reports
1949–
1957 1958
1959 –
1965 1966
1967 –
1969 1970
1971 –
1976
1983 –
1987
1988 –
1991
1992 –
1994 “Total Body” ■ ■ ■ ■ “Total Wrist” ■ Total Dose (“Total”) ■ Total This Period (“TTP”) ■ Total This Quarter (“TTQ”) ■ Year to Date (“YTD”) ■ ■ ■ ■ Cumulative Total (“CT”) ■ ■ ■ ■ Gamma (“GAM” or “YGAM”) ■ ■ ■ ■ ■ ■ Fast Neutron (“FAST” or “YFAS”) ■ ■ ■ ■ ■ Thermal Neutron (“TH” or “THER” or ■ ■ ■ ■ ■

Document No. ORAUT-TKBS-0037 Revision No. 01 Effective Date: 01/25/2013 Page 84 of 120
Data on annual dose reports
1949–
1957 1958
1959 –
1965 1966
1967 –
1969 1970
1971 –
1976
1983 –
1987
1988 –
1991
1992 –
1994 “YTH”) “Beta” ■ ■ Wrist (“WR”) ■ ■ Plutonium (“PLU”) ■ ■ ■ ■ Tritium (“TRIT”) ■ ■ ■ ■ Uranium (“U” or “UR”) ■ ■ ■ ■ Other (“OTH”) ■ ■ ■ ■ Cumulative Beta (“CBETA”) ■ Cumulative Wrist (“CWR”) ■ Cumulative Nonpenetrating (“CNPR” or “CUM NPR”) ■ ■
Cumulative Extremity (“CEX”) ■ ■ ■ Extremity (“EXTR”) ■ ■ ■ ■ ■ Nonpenetrating (“NPR”) ■ ■ ■ ■ Annual Penetrating (“YPEN”) ■ Cumulative Penetrating (“CUM PEN”) ■ Annual Skin (“YSKIN”) ■ ■ ■ Cumulative Skin (“CUM SKIN”) ■ Cumulative Gamma (“CUM GAM”) ■ Cumulative Fast (“CUM FAS”) ■ Cumulative Thermal (“CUM THER”) ■ Annual Internal (“YINT”) ■ ■ ■ ■ Cumulative Internal (“CUM INT”) ■ “Eye” ■ ■ Neutron (“NEUT”) ■ ■ ■ “Deep” ■ ■ “Shallow” ■
6.3 UNMONITORED PHOTON AND ELECTRON DOSE
Detailed dose data from SNL facilities have been obtained for 1949 to 2005 in forms that support calculation of lognormal probability statistical parameters desired for characterization of annual dose distributions for use in assignment of unmonitored photon doses (Widner 2008a,b,c). Tables 6-4 and 6-5 summarize the respective lognormal probability statistical parameters for SNL-NM dosimeter results for penetrating and nonpenetrating dose that are equal to or exceed 50 mrem for years of record between 1949 and 2005 (Widner 2008a,b,c). These data are useful to examine trends in the recorded doses. The reported doses that are the bases of these tables have not been corrected for potential missed doses, which is crucial to estimating potential dose for unmonitored workers.
Tables 6-4 and 6-5 demonstrate the bases for coworker data and can be applied if necessary for external dose reconstruction. However, compiled coworker dosimetry results with adjustments for missed dose provided in External Coworker Dosimetry Data for Sandia National Laboratories in Albuquerque, New Mexico (ORAUT 2008a) shall be used for applicable years when coworker doses are warranted. Coworker doses for years earlier than those addressed by ORAUT (2008a) can be assigned per Tables 6-4 and 6-5 and shall include applicable missed dose. If a worker appears likely to have had occupational external exposure to greater onsite ambient doses at SNL before 1949, the 1949 data can be applied, as the exposure would have been to activities started in TA-II that carried into 1949. In addition, should it be necessary to evaluate unmonitored external shallow dose for years earlier than those addressed by ORAUT (2008a), it can be noted that 50th-percentile coworker nonpenetrating-to-penetrating dose ratios were always less than 1.1 through the 1960s and 95th-

Document No. ORAUT-TKBS-0037 Revision No. 01 Effective Date: 01/25/2013 Page 85 of 120 percentile ratios were always less than 1 for the same period. Therefore, the respective ratios of 1.1 and 1 can be used to assign unmonitored shallow dose when necessary.
Table 6-4. SNL-NM worker penetrating dose statisticsa, 1949 to 2005 (Widner 2008a,b,c).
Year
Recorded gamma dose data Lognormal fit No. of workers reported gamma
dose > 50 mrem Gamma dose (mrem) Gamma dose (mrem)
GSD Mean Maximum Median 95%-ile 1949 10 110 420 Use 159 (b) (b) 1950 41 240 1,850 159 588 2.21 1951 84 200 3,000 134 452 2.09 1952 68 770 5,100 279 3,054 4.29 1953 92 180 3,030 111 399 2.18 1954 77 460 16,000 122 739 2.99 1955 65 260 2,520 131 690 2.74 1956 180 1,030 6,450 451 4,517 4.06 1957 428 610 4,570 238 2,134 3.79 1958 407 520 14,000 238 1,662 3.26 1959 358 250 5,000 148 636 2.43 1960 412 240 4,940 152 588 2.27 1961 598 190 2,370 122 441 2.18 1962 1,088 220 4,420 139 490 2.15 1963 548 180 2,430 117 419 2.17 1964 340 210 2,650 131 514 2.30 1965 248 240 2,080 130 642 2.64 1966 175 450 2,860 212 1,450 3.22 1967 316 280 3,710 133 685 2.72 1968 247 430 4,450 201 1,274 3.07 1969 235 390 3,850 183 1,074 2.93 1970 323 310 3,500 170 884 2.72 1971 485 240 4,090 130 592 2.51 1972 778 240 4,340 134 586 2.45 1973 839 200 4,510 120 476 2.31 1974 535 200 4,220 123 480 2.28 1975 722 180 8,140 114 401 2.15 1976 918 160 4,090 98 325 2.07 1977 757 176 4,260 104 388 2.23 1978 540 212 4,580 106 462 2.45 1979 306 236 3,990 120 553 2.53 1980 252 186 3,070 111 447 2.33 1981 137 274 3,210 151 727 2.59 1982 231 380 4,340 178 1,090 3.01 1983 231 250 4,360 123 570 2.55 1984 116 268 3,560 144 688 2.59 1985 150 263 2980 138 688 3.97 1986 105 292 2630 153 863 4.42 1987 143 320 3,580 143 869 2.99 1988 188 232 2,260 139 602 2.44 1989 111 198 1,194 130 507 2.29 1990 88 205 1,497 120 523 2.45 1991 90 170 1,256 99 395 2.31 1992 43 206 924 147 545 2.21 1993 37 180 521 134 479 2.17 1994 36 192 828 129 508 2.30 1995 38 151 495 119 348 1.92 1996 33 250 844 167 747 2.49
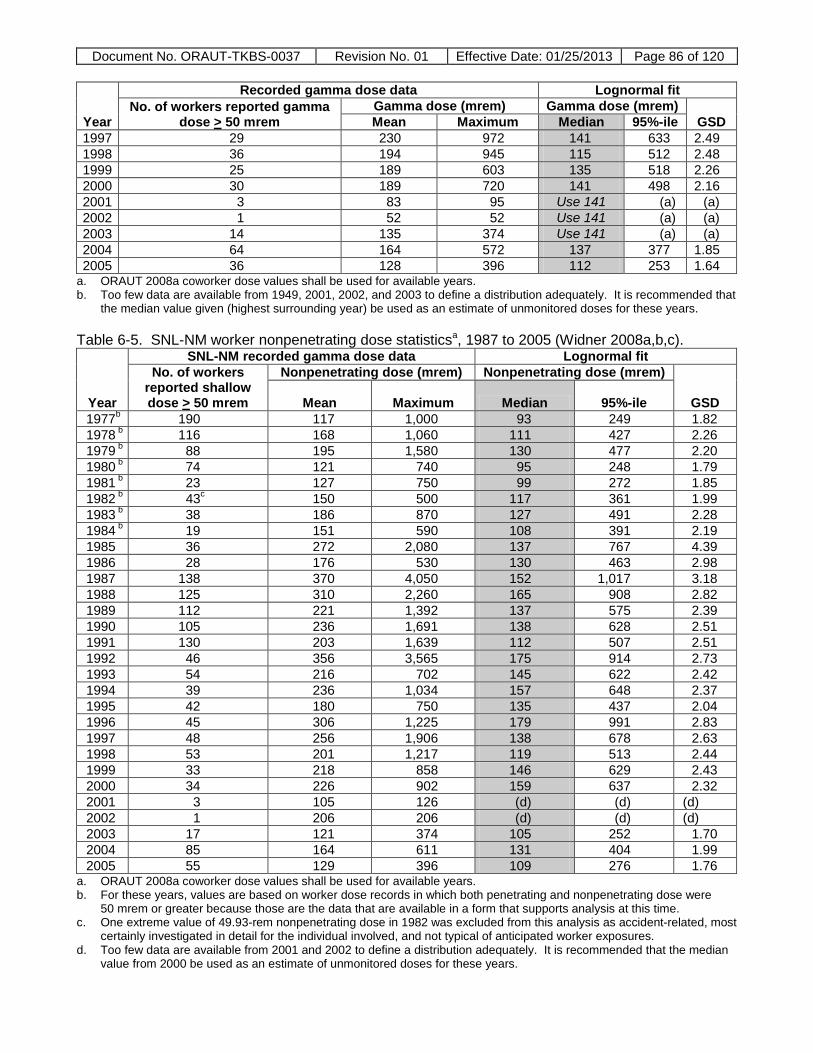
Document No. ORAUT-TKBS-0037 Revision No. 01 Effective Date: 01/25/2013 Page 86 of 120
Year
Recorded gamma dose data Lognormal fit No. of workers reported gamma
dose > 50 mrem Gamma dose (mrem) Gamma dose (mrem)
GSD Mean Maximum Median 95%-ile 1997 29 230 972 141 633 2.49 1998 36 194 945 115 512 2.48 1999 25 189 603 135 518 2.26 2000 30 189 720 141 498 2.16 2001 3 83 95 Use 141 (a) (a) 2002 1 52 52 Use 141 (a) (a) 2003 14 135 374 Use 141 (a) (a) 2004 64 164 572 137 377 1.85 2005 36 128 396 112 253 1.64
a. ORAUT 2008a coworker dose values shall be used for available years. b. Too few data are available from 1949, 2001, 2002, and 2003 to define a distribution adequately. It is recommended that
the median value given (highest surrounding year) be used as an estimate of unmonitored doses for these years.
Table 6-5. SNL-NM worker nonpenetrating dose statisticsa, 1987 to 2005 (Widner 2008a,b,c).
Year
SNL-NM recorded gamma dose data Lognormal fit No. of workers
reported shallow dose > 50 mrem
Nonpenetrating dose (mrem) Nonpenetrating dose (mrem)
GSD Mean Maximum Median 95%-ile 1977b 190 117 1,000 93 249 1.82 1978 b 116 168 1,060 111 427 2.26 1979 b 88 195 1,580 130 477 2.20 1980 b 74 121 740 95 248 1.79 1981 b 23 127 750 99 272 1.85 1982 b 43c 150 500 117 361 1.99 1983 b 38 186 870 127 491 2.28 1984 b 19 151 590 108 391 2.19 1985 36 272 2,080 137 767 4.39 1986 28 176 530 130 463 2.98 1987 138 370 4,050 152 1,017 3.18 1988 125 310 2,260 165 908 2.82 1989 112 221 1,392 137 575 2.39 1990 105 236 1,691 138 628 2.51 1991 130 203 1,639 112 507 2.51 1992 46 356 3,565 175 914 2.73 1993 54 216 702 145 622 2.42 1994 39 236 1,034 157 648 2.37 1995 42 180 750 135 437 2.04 1996 45 306 1,225 179 991 2.83 1997 48 256 1,906 138 678 2.63 1998 53 201 1,217 119 513 2.44 1999 33 218 858 146 629 2.43 2000 34 226 902 159 637 2.32 2001 3 105 126 (d) (d) (d) 2002 1 206 206 (d) (d) (d) 2003 17 121 374 105 252 1.70 2004 85 164 611 131 404 1.99 2005 55 129 396 109 276 1.76
a. ORAUT 2008a coworker dose values shall be used for available years. b. For these years, values are based on worker dose records in which both penetrating and nonpenetrating dose were
50 mrem or greater because those are the data that are available in a form that supports analysis at this time. c. One extreme value of 49.93-rem nonpenetrating dose in 1982 was excluded from this analysis as accident-related, most
certainly investigated in detail for the individual involved, and not typical of anticipated worker exposures. d. Too few data are available from 2001 and 2002 to define a distribution adequately. It is recommended that the median
value from 2000 be used as an estimate of unmonitored doses for these years.

Document No. ORAUT-TKBS-0037 Revision No. 01 Effective Date: 01/25/2013 Page 87 of 120 6.4 UNCERTAINTY FACTORS
For the usual analysis of measured film badge doses, it is possible to read a photon dose of 100 mrem to within ±15 mrem if the exposure involved photons with energies between several keV and several MeV (Morgan 1961). The estimated standard error in recorded film badge doses from photons of any energy is ±30%.
The situation for neutrons was not as favorable as for photons. With NTA films used at SNL before 1971, the estimated standard error was likely to be larger and varied significantly with the energy of the neutrons. Measured neutron doses to workers were very likely to be underestimated. The recommended approach is to estimate the neutron dose with neutron-to-photon dose ratios and the more reliably measured photon doses.
Given the lack of specific technical information for dosimetry systems for much of the SNL history, it is necessary to estimate respective measurement uncertainty based on reported values for contemporary systems in use at other facilities. Given general analogies between the Hanford Site and SNL in terms of dosimetry technologies, the SNL uncertainty is based on the TBD for the Hanford Site (ORAUT 2010c).
6.5 MISSED BETA/PHOTON DOSE
Missed dose is the dose that may not have been accounted for in an individual’s records because of loss of or damage to the applicable dosimeter or because the records indicated zero dose due to the detection limitations of the film or TLD.
For the usual analysis of measured film badge doses, minimum detection limits (MDLs) in the literature range from about 30 to 50 mrem for beta/photon irradiation (Ward 1994; Wilson et al. 1990). The film badge dosimetry at SNL was likely similar to dosimeters used at Hanford during the period 1959 to 1968 (ORAUT 2010c). MDLs for the most recently used TLDs (Models 8801 and 8802) are estimated based on Walker (1997b), Stanley (1980), and Potter (1993b). Because of the lack of site-specific data on MDLs for the early TLDs used from 1971 to 1990, these dosimeters are estimated to have had MDLs between those for the film badges and the more advanced TLDs.
Several exchange frequencies were in use at any one time, so the dose reconstructor needs to determine the exchange frequency that applies to a specific worker from individual records. The values in the last two columns of Table 6-6 can be considered maximum annual missed doses for dose reconstructions. Beginning with 1979, badge exchange frequencies are assumed to be monthly if specific information to the contrary for the worker is not available (NIOSH 2007).
Table 6-6. SNL beta/photon dosimeter period of use, type, MDL, exchange frequency, and potential annual missed dose.
Period of use Dosimeter
Deep MDLa
(mrem)
Nonpenetrating MDLa
(mrad) Exchange frequency
GM annual missed doseb Deep dose
(mrem) Nonpenetrating
dose (mrad) Pre-1949 If employment dates before November 1, 1949, are evaluated, dosimetry records should be
requested from LANL if none are in the provided SNL files. LANL TBDc parameters apply to pre-1949 dosimetry unless the monitoring records indicate a different site managed the dosimetry.
1949–~1958
Film in metal holder with open window and Pb filter
40 Not measured Biweekly (n=26)d
520 Not applicable
Monthly (n=12) 240 Quarterly (n=4) 80
1959–April 1971
Film in plastic holder with open window, Al, Cd,
30e 30e Biweekly (n=26) d
390 390
Monthly (n=12) 180 180

Document No. ORAUT-TKBS-0037 Revision No. 01 Effective Date: 01/25/2013 Page 88 of 120
Period of use Dosimeter
Deep MDLa
(mrem)
Nonpenetrating MDLa
(mrad) Exchange frequency
GM annual missed doseb Deep dose
(mrem) Nonpenetrating
dose (mrad) and Sn filters. Quarterly (n=4) 60 60
May 1971–~1973
2271 TLD 20 38 Monthly (n=12) 120 228 Quarterly (n=4) 40 76
1973–~1990
Two-card neutron TLD
20 38 Monthly (n=12) 120 228 Quarterly (n=4) 40 76
~1990–~1994
8801 TLDf 10 35 Monthly (n=12) 60 210 10 35 Quarterly (n=4) 20 70
~1995–present
8802 TLDf 5 5 Monthly (n=12) 30 30 8 10 Quarterly (n=4) 16 20
a. Estimated MDLs in the workplace for each dosimeter technology. b. Geometric mean (GM) annual missed dose calculated using MDL/2 from NIOSH (2007). c. LANL occupational external dose TBD (ORAUT 2009b). d. Dosimeters in reactor areas (Kingsley 1971) and for organizations handling radioactive materials
consistently were commonly exchanged on a biweekly basis (i.e., every 2 weeks; Kingsley 1953b). e. MDLs for photons and beta during this period are based on Hanford dosimeter values (ORAUT 2010c). f. References for TLD MDLs: Walker (1997b), Stanley (1980), Potter (1993b).
6.6 PARTITIONING OF BETA/PHOTON DOSES TO ENERGY CATEGORIES
Very little spectroscopy data to indicate gamma spectrum in SNL work areas have been found. To estimate the gamma spectrum to which workers were exposed, facilities were grouped into categories.
Reactor facilities have dispersed fields of higher energy photons from fission as well as fission and activation products. Radioactive materials handling and processing facilities included a wide variety of activities. For electron accelerator facilities, bremsstrahlung photons dominate the secondary radiation field. Thick shields of concrete or other materials result in photons in the MeV energy range. For proton or positive ion accelerators, neutrons generally constitute the greatest hazard. Thick shields designed for the neutron hazard eliminate all but the most energetic photons. With shielding and safety interlock systems, exposure to the direct beam of SNL accelerators was rare and the personal exposure records should document them. However, maintenance personnel were exposed to activated accelerator components during repairs, target changes, etc. One reaction of particular importance is the thermal neutron capture of sodium in the concrete of the accelerator shielding (NCRP 2003). This reaction [23Na(n,γ)24Na] produces a radioactive isotope that decays with a 15-hour half-life by emitting gamma rays of 1.4 and 2.8 MeV. Therefore, the gamma energy spectrum for accelerators was judged to consist primarily of photons with energies above 250 keV based on Argonne National Laboratory–East data (ORAUT 2006b). Radiation from X-ray machines and some radioisotopes presented low-energy photon hazards, but these appear to have been generally used in conjunction with higher energy sources rather than in distinct facilities.
Table 6-7 lists the energy ranges for beta and photon exposures at SNL, which has possessed separated plutonium and sources of low-energy X-rays, so nonpenetrating doses could have resulted from exposures to low-energy photons as well as beta particles.
Plutonium facilities have mostly 17-keV photons with some 59-keV photons from 241Am. Plutonium handled at SNL had been separated from fission products. Low-energy photons that would have been received by workers handling plutonium components were not measured by early film badges that had no unfiltered areas. Before 1959, when nonpenetrating radiation was first measured (and reported in terms of beta dose), 100% of the measured photon (gamma) dose should be attributed to the 30-to-250-keV category. An additional dose of 1.86 times the measured dose should be attributed to the low-energy photon category (<30 keV). From 1959 through 1966, nonpenetrating dose (reported as beta dose) should be attributed to the <30-keV photon category for plutonium exposure.

Document No. ORAUT-TKBS-0037 Revision No. 01 Effective Date: 01/25/2013 Page 89 of 120 From 1967 to 1986, nonpenetrating dose (reported as such, “NPR”) should be attributed to the <30-keV photon category. From 1987 to the present, shallow dose should be attributed to the <30-keV photon category.
Table 6-7. Recommended beta and photon radiation energies and percentages for SNL-NM facilities.
Process/ buildings Description
Operations Radiation
type
Energy selection
(keV) Percentage Begin End Plutonium component operations
Weapon component inspection, testing, and assembly:
1949 Present Beta photon
>15 100 <30 65a
30–250 35a Reactors (TA-V)
During Operation: Highly dispersed fields of higher energy photon radiation fields from fission process, activation and fission product nuclides. Potentially narrow beams of higher energy neutron radiation from test ports, etc., into reactor core. Potential for significant airborne nuclides; could be significant higher energy beta radiation.
Beta photon
>15 100 30–250 25
>250 75
Not in Operation: Highly dispersed fields of higher energy photon radiation fields from activation and fission product nuclides. No significant neutron radiation. Possibly higher energy beta radiation during maintenance work resulting from fission products. Various reactors (see Table 2-2 for listing and date ranges)
1958 Present
Uranium component operations
Weapon component inspection, testing, and assembly: depleted and enriched uranium.
1949 Present Beta photon
>15 100 30–250 100
Thorium component operations
Weapon component inspection, testing, and assembly:
1959? Present Beta photon
>15 100 30–250 50
>250 50 Accelerator operations (in TA-IV)
Simulation of weapon environments, material and component testing, fusion and particle beam research:
Beta photon
>15 100 30–250 10
>250 90 Various accelerators (see Table 2-2 for listing and date ranges)
1958 Present
Calibrations and irradiations
Onsite irradiation of instruments, dosimeters, components:
Beta photon
>15 100 30–250 5
>250 95 HCF Isotope production for medical
use. 1998 2003? Beta
photon >15 100
30–250 40 >250 60
Waste handling
Radiation characteristics highly dependent on source of waste.
1949 Present Beta photon
>15 100 30–250 50
>250 50 a. Low-energy photons were not measured by early SNL-NM film badges that had no unfiltered areas. For years before
1959, 100% of the measured photon (gamma) dose should be attributed to the 30-to-250-keV category. An additional dose of 1.876 times the measured dose should be attributed to the low-energy photon category (<30-keV) based on Traub, Scherpelz, and Taulbee (2005).

Document No. ORAUT-TKBS-0037 Revision No. 01 Effective Date: 01/25/2013 Page 90 of 120 6.7 UNMONITORED NEUTRON DOSE
There should not typically be significant neutron exposure of unmonitored workers. However, if estimation of neutron dose is called for, apply the neutron-to-photon distribution data from Table 6-8 to measured and estimated missed or unmonitored photon doses. This process of calculating a neutron dose is based on the assumption that the distribution of neutron doses to unmonitored workers is equivalent to the distribution of neutron doses measured for monitored workers.
Table 6-8. Recommended distributions for neutron-to-photon ratio.
Neutron source type Neutron-to-photon dose ratio
GM GSD 95%-tile General operations 1987 to present (based on 16 annual records between 1987 and 2005a)
0.36 2.55 1.70
General operations in earlier years (based on 38 annual records from 1977 through 1984a)
0.39 4.97 5.43
a. Source: Widner (2008a,b,c).
The distributions of neutron-to-photon ratios should not be used to estimate neutron doses if neutron measurements are available after 1971, when thermoluminescent dosimeters replaced NTA film at SNL for neutron dosimetry.
The application of the data from Table 6-8 to measured or estimated photon doses can be accomplished through Monte Carlo simulation. As an alternative, the geometric mean value of the ratio can be applied in a lognormal distribution with a geometric standard deviation as listed in Table 6-8 or, to obtain an overestimate of unmonitored neutron dose, the appropriate 95th-percentile value from Table 6-8 can be applied to the measured or estimated photon dose for each period of interest. The “general operations” values from Table 6-8 are based on the reported annual doses for 1987 through 2005 and for 1977 through 1984 for individuals who had both gamma and neutron dose results of 100 mrem or greater (Widner 2008a,b,c). This assessment was based on 16 cases for 1987 through 2005 and 38 cases for 1977 through 1984.
6.8 MISSED NEUTRON DOSE
Neutron radiation has been present at SNL in association with various weapons components, reactors, and accelerators. For other locations, missed neutron dose is very unlikely because of the very low potential for neutron exposure. To calculate the missed neutron dose, the dose reconstructor must first determine if the person worked in an area with potential neutron radiation and the category of neutrons. This can best be determined by examining the work location records and if a worker met any of the following conditions:
• Positive neutron dosimetry results were recorded.
• A specific neutron dosimeter was issued to the worker. This would be indicated for SNL-NM dosimeters by a recorded neutron zero or by the use of multiple dosimeters, aside from extremity dosimeters, for a given monitoring period. For certain periods, such as 1990 and later, recorded neutron zeros will often be simply a recording practice due to a neutron element in the issued TLD. In such a case, the conditions of exposure and likelihood of significant neutron radiation must be considered in determining if missed neutron dose is warranted (ORAUT 2008b).
• Summary dose records contain recorded neutron dose results, zero or otherwise. As with the example above, summary records for 1990 and later may contain recorded neutron zeros simply as a recording practice due to a neutron element in the issued TLD(s). In such a case,
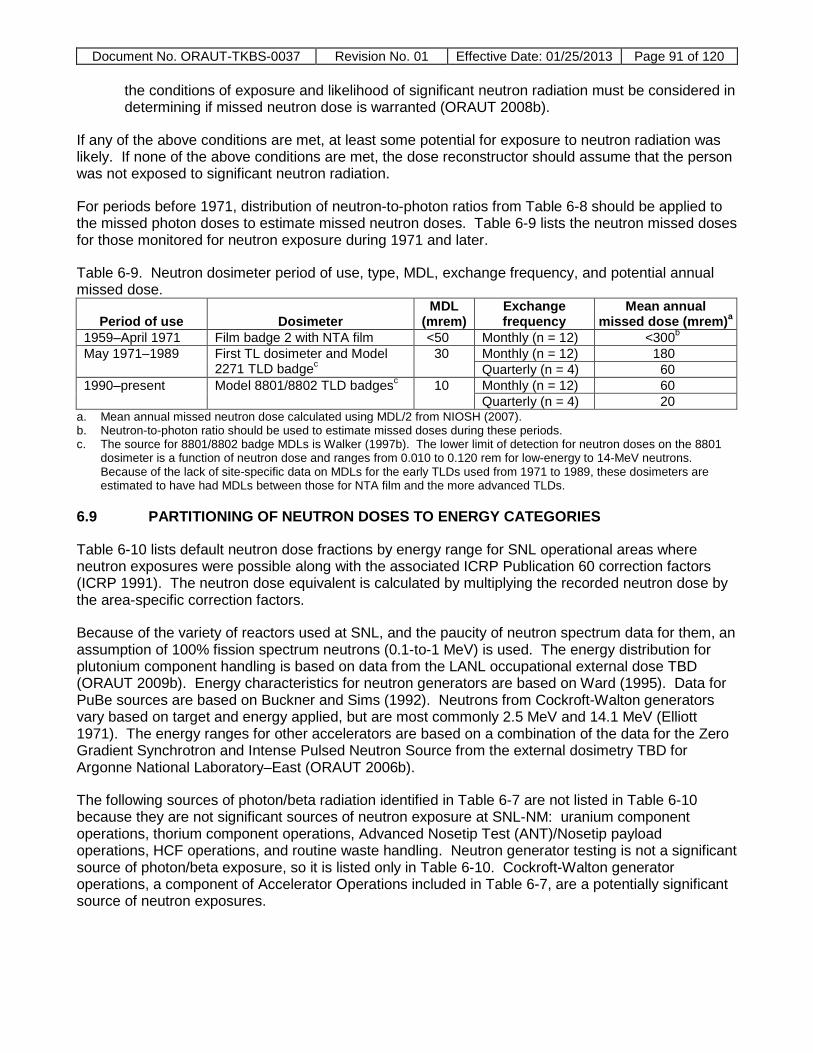
Document No. ORAUT-TKBS-0037 Revision No. 01 Effective Date: 01/25/2013 Page 91 of 120
the conditions of exposure and likelihood of significant neutron radiation must be considered in determining if missed neutron dose is warranted (ORAUT 2008b).
If any of the above conditions are met, at least some potential for exposure to neutron radiation was likely. If none of the above conditions are met, the dose reconstructor should assume that the person was not exposed to significant neutron radiation.
For periods before 1971, distribution of neutron-to-photon ratios from Table 6-8 should be applied to the missed photon doses to estimate missed neutron doses. Table 6-9 lists the neutron missed doses for those monitored for neutron exposure during 1971 and later.
Table 6-9. Neutron dosimeter period of use, type, MDL, exchange frequency, and potential annual missed dose.
Period of use Dosimeter MDL
(mrem) Exchange frequency
Mean annual missed dose (mrem)a
1959–April 1971 Film badge 2 with NTA film <50 Monthly (n = 12) <300b May 1971–1989 First TL dosimeter and Model
2271 TLD badgec 30 Monthly (n = 12) 180
Quarterly (n = 4) 60 1990–present Model 8801/8802 TLD badgesc 10 Monthly (n = 12) 60
Quarterly (n = 4) 20 a. Mean annual missed neutron dose calculated using MDL/2 from NIOSH (2007). b. Neutron-to-photon ratio should be used to estimate missed doses during these periods. c. The source for 8801/8802 badge MDLs is Walker (1997b). The lower limit of detection for neutron doses on the 8801
dosimeter is a function of neutron dose and ranges from 0.010 to 0.120 rem for low-energy to 14-MeV neutrons. Because of the lack of site-specific data on MDLs for the early TLDs used from 1971 to 1989, these dosimeters are estimated to have had MDLs between those for NTA film and the more advanced TLDs.
6.9 PARTITIONING OF NEUTRON DOSES TO ENERGY CATEGORIES
Table 6-10 lists default neutron dose fractions by energy range for SNL operational areas where neutron exposures were possible along with the associated ICRP Publication 60 correction factors (ICRP 1991). The neutron dose equivalent is calculated by multiplying the recorded neutron dose by the area-specific correction factors.
Because of the variety of reactors used at SNL, and the paucity of neutron spectrum data for them, an assumption of 100% fission spectrum neutrons (0.1-to-1 MeV) is used. The energy distribution for plutonium component handling is based on data from the LANL occupational external dose TBD (ORAUT 2009b). Energy characteristics for neutron generators are based on Ward (1995). Data for PuBe sources are based on Buckner and Sims (1992). Neutrons from Cockroft-Walton generators vary based on target and energy applied, but are most commonly 2.5 MeV and 14.1 MeV (Elliott 1971). The energy ranges for other accelerators are based on a combination of the data for the Zero Gradient Synchrotron and Intense Pulsed Neutron Source from the external dosimetry TBD for Argonne National Laboratory–East (ORAUT 2006b).
The following sources of photon/beta radiation identified in Table 6-7 are not listed in Table 6-10 because they are not significant sources of neutron exposure at SNL-NM: uranium component operations, thorium component operations, Advanced Nosetip Test (ANT)/Nosetip payload operations, HCF operations, and routine waste handling. Neutron generator testing is not a significant source of photon/beta exposure, so it is listed only in Table 6-10. Cockroft-Walton generator operations, a component of Accelerator Operations included in Table 6-7, are a potentially significant source of neutron exposures.

Document No. ORAUT-TKBS-0037 Revision No. 01 Effective Date: 01/25/2013 Page 92 of 120 Table 6-10. Recommended dose fractions and ICRP Publication 60 correction factors for SNL neutron sources.
Process Facility description Operations Neutron
energy Default dose fraction (%)
ICRP 60 correction
factor Begin End Plutonium component operations
Weapon component inspection, testing, and assembly: Plutonium handled at SNL had been separated from fission products.
1949 Present <10-100 keV 0.1-2 MeV 2-20 MeV
11 56 33
0.23 1.1 0.44
Reactor operations
Neutrons of varying energies from reactor operations: Various reactors (see Table 2-2 for a listing and date ranges)
1958 Present <10-100 keV 0.1-2 MeV 2-20 MeV
0 100
0
─ 1.9 ─
Neutron generators
Testing of neutron sources for weapons applications (typically 14 MeV).
1959 1997+ <10-100 keV 0.1-2 MeV 2-20 MeV
0 0
100
─ ─ 1.3
Calibration and irradiation
Onsite irradiation of instruments, dosimeters, components: Neutron source range 1950? Present <10-100 keV
0.1-2 MeV 2-20 MeV
0 20 80
─ 0.38 1.1
PuBe neutron sources 1950? Present
Cockroft-Walton Generator
Simulation of weapon environments, material and component testing: Sandia Cockroft-Walton accelerator facility
Late 1950s
Present <10-100 keV 0.1-2 MeV 2-20 MeV
5 5
90
0.11 0.095 1.2
Other accelerators
Various accelerators (see Table 2-2 for a listing and date ranges)
1958 Present <10-100 keV 0.1-2 MeV 2-20 MeV >20 MeV
5 14 46 35
0.11 0.27 0.61 0.35
6.10 RECOMMENDED DOSE CONVERSION FACTORS
Dose Conversion factors (DCFs) should be selected from NIOSH (2007) for the dose quantities specified in Table 6-11 for the periods of interest.
Table 6-11. Recommended DCFs for SNL dose assessments. Period Recommended photon DCFs Recommended neutron DCFs
1949–1971 Exposure (R) to organ dose equivalent (HT) Deep dose equivalent (Hp,slab(10)) to organ dose equivalent (HT) 1972–present Deep dose equivalent (Hp(10)) to organ dose
equivalent (HT)
7.0 ATTRIBUTIONS AND ANNOTATIONS
Where appropriate in the preceding text, bracketed callouts indicate information, conclusions, and recommendations to assist in the process of worker dose reconstruction. These callouts are listed in this section with information that identifies the source and justification for each item. Conventional references are provided in the next section that link data, quotations, and other information to documents available for review on the Oak Ridge Associated Universities Team servers.
[1] Buddenbaum, Jack E., Certified Health Physicist (CHP). ENSR. Health Physicist. 2007. Statements about name changes to the site are based on discussions in February 2006 that were confirmed with Tracy Ikenberry on February 9, 2007.
Document No. ORAUT-TKBS-0037 Revision No. 01 Effective Date: 01/25/2013 Page 93 of 120 [2] Argall, Rowena S., CHP. ENSR. Health Physicist. 2007.
A summary of the history of SNL from information in previous sections of the site profile is included here for completeness.
[3] Argall, Rowena S., CHP. ENSR. Health Physicist. 2007. This statement is taken from documented discussions from 2005 through February 2007 with an SNL retiree about his activities at nuclear storage sites and SNL general activities at storage sites and from information in previous sections of the site profile.
[4] Argall, Rowena S., CHP. ENSR. Health Physicist. 2007. This information is included to alert the dose reconstructor that additional dosimetry records might need to be requested if there is indication that the worker could have visited other SNL sites during the employment period and there is no indication of dosimetry records in the file or requests to those facilities. This statement is included here for completeness.
[5] Argall, Rowena S., CHP. ENSR. Health Physicist. 2007. A summary of the activities of SNL from information in previous sections of the site profile is included here for completeness.
[6] Argall, Rowena S., CHP. ENSR. Health Physicist. 2007. This summary statement is taken from discussions during 2005 through February 2007 with SNL retirees and current staff members about the types of activities at SNL and the perceived intake potentials from those activities.
[7] Argall, Rowena S., CHP. ENSR. Health Physicist. 2007. The discussion in this section is included to assist the dose reconstructor to determine the potential for exposure for a worker based on activities that might have been described as “assembly” of weapons. The information is from the cited document.
[8] Argall, Rowena S., CHP. ENSR. Health Physicist. 2007. The nuclides of primary concern are based on those nuclides listed in documents and reports and discussions with SNL retirees and current staff.
[9] Argall, Rowena S., CHP. ENSR. Health Physicist. 2007. Tables 5-1 and 5-2 are provided based on the cited reference and information in other sections of the document. These locations are summarized here for completeness and to provide the dose reconstructor a source of information on the intake potential of various areas on the site.
[10] Argall, Rowena S., CHP. ENSR. Health Physicist. 2007. The table of nuclear weapons tests is included to assist the dose reconstructor in recognizing the names of these tests in the event these names are mentioned in the telephone interview or other records. While these tests are included in other documents, they are included here for completeness.
[11] Argall, Rowena S., CHP. ENSR. Health Physicist. 2007. This statement is based on review of worker dosimetry records and conversations with SNL retirees and current staff members between 2005 and February 2007.
[12] Argall, Rowena S., CHP. ENSR. Health Physicist. 2007. This statement is based on review of documents that are cited throughout Section 5.0 and conversations with SNL retirees and current staff members between 2005 and February 2007.

Document No. ORAUT-TKBS-0037 Revision No. 01 Effective Date: 01/25/2013 Page 94 of 120 [13] Argall, Rowena S., CHP. ENSR. Health Physicist. 2007.
Conversations with SNL retirees between 2005 and February 2007 indicated that bioassay was being conducted and analyzed on site as early as 1949. The program was not formalized because there was a perception that there was little need for a routine bioassay program. Fewer than 100 workers participated annually in bioassay in the pre-1992 era. This is contrary to the perception of current SNL personnel. Conversations with current personnel indicated that bioassay was extremely rare and, if it was conducted, the samples were sent off site.
[14] Argall, Rowena S., CHP. ENSR. Health Physicist. 2007. This paragraph is based on review of documents that are cited throughout Section 5.0 and conversations with SNL retirees and current SNL personnel between 2005 and February 2007. The retirees participated in the bioassay programs. One retiree was involved in the analysis of the samples, and another was involved in the archiving of the data. Research is currently being done to retrieve the bioassay results that were archived during that period. Because of statements made during interviews with individuals currently involved with the bioassay program, outsourced bioassay and an MOU with LANL were considered to be the prime source of bioassay results for years before 1991. However, information is contradictory to the outsourcing of in vitro samples. Because the methods of that time were similar to those used at LANL for uranium and tritium, MDAs listed for LANL are most likely to be applicable to the analyses at SNL if no other information is available.
[15] Argall, Rowena S., CHP. ENSR. Health Physicist. 2007. The reference cited lists a number of sites that reported positive results in control subjects counted with the Helgeson system during that period. Because the majority of counted workers in 1989 and 1990 at SNL had positive results, Sam Glover, NIOSH Health Physicist, suggested inclusion of this reference. However, it is favorable to the claimant to include the positive results in the dose reconstruction.
[16] Argall, Rowena S., CHP. ENSR. Health Physicist. 2007. This statement is based on conversations with an SNL retiree in February 2007. The retiree participated in the archiving of the dosimetry records beginning in 1967.
[17] Argall, Rowena S., CHP. ENSR. Health Physicist. 2007. This statement is based on review of records supplied by LLNL.
[18] Argall, Rowena S., CHP. ENSR. Health Physicist. 2007. This statement is based on review of records supplied by LLNL.
[19] Argall, Rowena S., CHP. ENSR. Health Physicist. 2007. This statement is based on conversations with active SNL personnel between 2005 and February 2007.
[20] Argall, Rowena S., CHP. ENSR. Health Physicist. 2007. This statement is included in the discussion to show that SNL reviewed the requirements for bioassay and made decisions accordingly.
[21] Argall, Rowena S., CHP. ENSR. Health Physicist. 2007. The bioassay results that have been reviewed have been accompanied by background and standard calibration results. According to conversations with retirees, the procedures used to analyze these samples were standard protocol similar to the protocol used by LANL. Therefore, the MDAs reported by LANL are generally applicable.

Document No. ORAUT-TKBS-0037 Revision No. 01 Effective Date: 01/25/2013 Page 95 of 120 [22] Argall, Rowena S., CHP. ENSR. Health Physicist. 2007.
Although the actual procedures used by the Industrial Hygiene Department have not been found, conversations in February 2007 with retirees indicated that the analytical protocol for analysis of bioassay was basically the same as that used at LANL during that time. Therefore, the assumption of MDAs in the same range can be made if no other information is available.
[23] Argall, Rowena S., CHP. ENSR. Health Physicist. 2007. Review of the radionuclides associated with the locations on site and at offsite locations and conversations with SNL retirees and current staff members indicated that plutonium was not a consistent source term across the site.
[24] Argall, Rowena S., CHP. ENSR. Health Physicist. 2007. This statement is based on review of documents that are cited throughout Section 5.0 and conversations with SNL retirees and current staff members between 2005 and February 2007.
[25] Argall, Rowena S., CHP. ENSR. Health Physicist. 2007. This statement is based on conversations in February 2007 with an SNL retiree .
[26] Argall, Rowena S., CHP. ENSR. Health Physicist. 2007. This statement is based on conversations in February 2007 with an SNL retiree .
[27] Argall, Rowena S., CHP. ENSR. Health Physicist. 2007. This statement is based on review of documents that are cited throughout Section 5.0 and conversations with SNL retirees and current staff between 2005 and February 2007.
[28] Argall, Rowena S., CHP. ENSR. Health Physicist. 2007. This statement is based on review of documents that are cited throughout Section 5.0 and conversations with an SNL retiree and current SNL personnel between 2005 and February 2007.
[29] Argall, Rowena S., CHP. ENSR. Health Physicist. 2007. This statement is based on review of documents that are cited throughout Section 5.0 and conversations with SNL retirees and current staff between 2005 and February 2007.
[30] Argall, Rowena S., CHP. ENSR. Health Physicist. 2007. Until alpha spectroscopy was available to analyze the electroplated samples, only gross alpha was counted on either a proportional counter or NTA film. However, the label on the results might have been 239Pu. Analysis involving alpha spectroscopy would include results for both 239Pu and 238Pu. It is not possible to distinguish between 239Pu and 240Pu using alpha spectroscopy techniques; therefore, the activity of 240Pu is included in the activity listed for 239Pu.
[31] Argall, Rowena S., CHP. ENSR. Health Physicist. 2007. The term pure 238Pu was typically used in reference to a mixture of 238Pu that is actually predominantly 238Pu, as shown by the ratios of the mixtures listed in the cited references. The pure 238Pu mixture is found in heat source technology work.
[32] Bihl, Donald. Hanford. Health Physicist. 2006. Calculations were performed to determine ratios using the Pu.ex software (Rittmann 1984).
[33] Argall, Rowena S., CHP. ENSR. Health Physicist. 2007. This statement is based on review of documents that are cited throughout Section 5.0 and conversations with SNL retirees and current staff between 2005 and February 2007.
Document No. ORAUT-TKBS-0037 Revision No. 01 Effective Date: 01/25/2013 Page 96 of 120 [34] Argall, Rowena S., CHP. ENSR. Health Physicist. 2007.
This statement is based on a conversation with an Internal Dosimetry Department employee in 2006.
[35] Argall, Rowena S., CHP. ENSR. Health Physicist. 2007. This statement is based on review of documents that are cited throughout Section 5.0 and conversations with SNL retirees and current staff between 2005 and February 2007.
[36] Argall, Rowena S., CHP. ENSR. Health Physicist. 2007. Records of tritium surveys with positive results are found throughout the archives for various locations on the site, including the locations given as examples in this section.
[37] Argall, Rowena S., CHP. ENSR. Health Physicist. 2007. Records of tritium surveys with positive results are found throughout the archives for various locations on the site, including the locations given as examples in this section.
[38] Argall, Rowena S., CHP. ENSR. Health Physicist. 2007. This protocol was established for LLNL tritium doses as an overestimate.
[39] Argall, Rowena S., CHP. ENSR. Health Physicist. 2007. This statement is based on review of documents that are cited throughout Section 5.0 and conversations with SNL retirees and current staff between 2005 and February 2007. While the general internal dosimetry program was based on the concept that the majority, if not all, of the airborne radioactivity comprised nonrespirable particles, the examples of operations in this paragraph indicated that there were situations that could produce respirable particles of uranium and other radionuclides.
[40] Argall, Rowena S., CHP. ENSR. Health Physicist. 2007. This statement is from the Internal Dosimetry Program procedures. Special bioassay sampling would only be initiated by a routine sample that exceeded the limits when a routine sampling program was actually in place.
[41] Argall, Rowena S., CHP. ENSR. Health Physicist. 2007. This statement is based on conversations with SNL staff in 2006.
[42] Argall, Rowena S., CHP. ENSR. Health Physicist. 2007. This statement is based on conversations with SNL staff in 2006.
[43] Argall, Rowena S., CHP. ENSR. Health Physicist. 2007. This statement is based on conversations with SNL staff in 2006 and SNL retirees in 2007.
[44] Argall, Rowena S., CHP. ENSR. Health Physicist. 2007. This statement is based on conversations with an SNL retiree in 2006 and 2007. The retiree stated that the protocol and analytical technique in the early days were based in general on standard techniques in use in the industry at the time. Protocol similar to that used at LANL was used at SNL, therefore the analytical sensitivities can be considered to be similar.
[45] Argall, Rowena S., CHP. ENSR. Health Physicist. 2007. This decision to classify an intake as occupational based on whether the concentration was within the expected range from dietary uranium intakes is known to be the practice since 1993. Whether any similar decisions to classify positive results were made before that time is not known.

Document No. ORAUT-TKBS-0037 Revision No. 01 Effective Date: 01/25/2013 Page 97 of 120 [46] Argall, Rowena S., CHP. ENSR. Health Physicist. 2007.
Conversations with SNL retirees indicated that uranium bioassay was performed and recorded at SNL as early as 1949.
[47] Argall, Rowena S., CHP. ENSR. Health Physicist. 2007. This statement is included as an example of a contamination incident and the SNL response to such incidents, in which engineering controls were used prevent a reoccurrence. This type of response was frequently indicated in documents that were reviewed.
[48] Argall, Rowena S., CHP. ENSR. Health Physicist. 2007. This statement is based on the review of numerous log sheets that contain air sample results. These log sheets span many years of the history of SNL.
[49] Argall, Rowena S., CHP. ENSR. Health Physicist. 2007. This statement is based on conversations with SNL staff in 2006.
[50] Argall, Rowena S., CHP. ENSR. Health Physicist. 2007. This statement is based on conversations with SNL staff in 2006.
[51] Argall, Rowena S., CHP. ENSR. Health Physicist. 2007. This statement is based on conversations with an SNL retiree in 2006.
[52] Argall, Rowena S., CHP. ENSR. Health Physicist. 2007. This statement is based on conversations with an SNL retiree in February 2007. The retiree participated in the archiving of the dosimetry records beginning in 1967.

Document No. ORAUT-TKBS-0037 Revision No. 01 Effective Date: 01/25/2013 Page 98 of 120 REFERENCES
ANSI (American National Standards Institute), 1972, American National Standard: Practice for Occupational Radiation Exposure Records Systems, ANSI N13.6-1966 (R1972), New York, New York. [SRDB Ref ID: 21974]
ANSI (American National Standards Institute), 1980, American National Standard: Practices for Respiratory Protection, ANSI Z88.2-1980, New York, New York.
Antonsen, R. G. Jr., 1997, Radiation Protection Survey of the Sandia National Laboratory, U.S. Department of Health and Human Services, Food and Drug Administration, March (unpublished). [SRDB Ref ID: 27228, pp. 2, 4-6]
Author unknown, 1988, Operational Procedures of the Sandia Personnel Radiation Dosimetry Program 1979, Sandia Corporation, Sandia National Laboratories, Albuquerque, New Mexico, July 18. [SRDB Ref ID: 23883]
Author unknown, date unknown, “Layout of Glovebox Laboratory,” Figure 2.1-1 from unknown document. [SRDB Ref ID: 22281, p. 6]
Ball, S., 1991, “Possible Exposure to Tritium,” memorandum to TTR Security Personnel, Sandia Corporation, Sandia National Laboratories, Albuquerque, New Mexico, April 30. [SRDB Ref ID: 19273]
Bradley, E. W., 1993a, Trip Control Data Review, Sandia Corporation, Sandia National Laboratories, Albuquerque, New Mexico, January 12. [SRDB Ref ID: 23578, p. 204]
Bradley, E. W., 1993b, Trip Control Dosimeters Test Criteria Determination, Sandia Corporation, Sandia National Laboratories, Albuquerque, New Mexico, January 13. [SRDB Ref ID: 23578]
Bradley, E. W., 1993c, Harshaw 8800 TLD Card Readers System Background Data Review, Sandia Corporation, Sandia National Laboratories, Albuquerque, New Mexico, March 18. [SRDB Ref ID: 23578]
Bradley, E. W., 1993d, Source Normalization and Traceability of the HF-870 90Sr/90Y Source for the Harshaw Model 8800 TLD Reader System, Sandia Corporation, Sandia National Laboratories, Albuquerque, New Mexico, September 3. [SRDB Ref ID: 23577, p. 5]
Bradley, E. W., 1994, Harshaw Dose Calculation Algorithm, Sandia Corporation, Sandia National Laboratories, Albuquerque, New Mexico, April 6. [SRDB Ref ID: 23577, p. 429]
Bradley, E. W., 1995a, Technical Basis for the Determination of the Environmental Background Accumulation Rate, Sandia Corporation, Sandia National Laboratories, Albuquerque, New Mexico, August 11. [SRDB Ref ID: 23580, p. 428]
Bradley, E. W., 1995b, Room Light Sensitivity Studies on Harshaw Model 8801 (7776-1141) and 8802 (7776-1161) TLD Cards, Sandia Corporation, Sandia National Laboratories, Albuquerque, New Mexico, March 31. [SRDB Ref ID: 23580, p. 4]
Brake, R., 1989, untitled letter to G. Runkle (U.S. Department of Energy, Albuquerque Operations Office), University of California, Los Alamos National Laboratory, Los Alamos, New Mexico, November 9. [SRDB Ref ID: 11091]

Document No. ORAUT-TKBS-0037 Revision No. 01 Effective Date: 01/25/2013 Page 99 of 120 Brewer, L. W., 1973, Environmental Monitoring Report for Sandia Laboratories from 1964 through
1972, SLA-73-0339, Sandia Corporation, Sandia Laboratories, Albuquerque, New Mexico. [SRDB Ref ID: 31329]
Brewer, L. W., 1974, Environmental Monitoring Report for Sandia Laboratories for 1973, SLA-74-0167, Sandia Corporation, Sandia Laboratories, Albuquerque, New Mexico, April. [SRDB Ref ID: 71598]
Bryson, J. W., 1992, “Personnel Internal Radiation Dosimetry Program,”, memorandum to A. K. Hallman, Sandia Corporation, Sandia National Laboratories, Albuquerque, New Mexico, June 25. [SRDB Ref ID: 22321]
Buckner, M. A., and C. S. Sims, 1992, “Neutron Dosimetric Quantities for Several Radioisotopic Neutron Sources,” Health Physics, volume 63, p. 3.
Burnett, W. D., 1977, “Radiological Protection Survey of the Building 831 Medical X-Ray Unit,” memorandum to W. H. Kingsley, Sandia Corporation, Sandia Laboratories, Albuquerque, New Mexico, March 8. [SRDB Ref ID: 26803]
Burnett, W. D., 1991, “Tritium Incident Follow-Up, April 12, 1991,” memorandum to G. T. Cheney, Sandia Corporation, Sandia National Laboratories, Albuquerque, New Mexico, April 12. [SRDB Ref ID: 19274]
Burnett, W. D., D. J. Coleman, R. G. Elsbrock, and R. J. Everett, 1961, Radioactive Environmental Survey at Sandia Corporation, SC-4628 (M), Sandia Corporation, Sandia National Laboratories, Albuquerque, New Mexico. [SRDB Ref ID: 23899]
Burnett, W. D., H. L. Rarrick, G. E. Tucker, and M. W. Tucker, 1962, Health Physics Aspects of the Start-Up and Operation of the Sandia Pulsed Reactor Facility, SC-4680 (M), Sandia Corporation, Sandia National Laboratories, Albuquerque, New Mexico, May. [SRDB Ref ID: 23971]
Buvinghausen, M., 2005, ICP-MS Sample Preparation, RPSD-07-07, Sandia Corporation, Sandia National Laboratories, Albuquerque, New Mexico, March 9. [SRDB Ref ID: 22806]
Byers, K. F., 1993, collection of documents on IH Lab Radiological Contamination Report–Incident Description and Follow-Up, Sandia Corporation, Sandia National Laboratories, Albuquerque, New Mexico. [SRDB Ref ID: 22326]
Campbell, E. E., M. F. Milligan, W. D. Moss, and H. F. Schulte, 1972, History of the Plutonium Bioassay Program at the Los Alamos Scientific Laboratory, 1944 - 1972, LA-5008, Los Alamos Scientific Laboratory, University of California, Los Alamos, New Mexico. [SRDB Ref ID: 941]
Carbaugh, E. H., 2003, Methods and Models of the Hanford Internal Dosimetry Program, PNNL-MA-860, Pacific Northwest National Laboratory, Richland, Washington, January 31. [SRDB Ref ID: 11521]
Clark, J. M., 2005, History of LANL’s Bioassay Program from Inception to 1993, LA-UR-05-1942, University of California, Los Alamos National Laboratory, Los Alamos, New Mexico, April. [SRDB Ref ID: 17157]

Document No. ORAUT-TKBS-0037 Revision No. 01 Effective Date: 01/25/2013 Page 100 of 120 Clevenger, L. R., 1990, untitled letter to M. J. Swint (Hanford Environmental Health Foundation),
Sandia Corporation, Sandia National Laboratories, Albuquerque, New Mexico, April 26. [SRDB Ref ID: 26818]
Crites, T. R., 1967, “Urine Sampling for Plutonium,” memorandum of record, Sandia Corporation, Sandia Laboratories, Albuquerque, New Mexico, December 11. [SRDB Ref ID: 20324]
Crites, T. R., 1968, collection of reports on urine sampling for tritium, Sandia Corporation, Sandia Laboratories, Albuquerque, New Mexico, March 13, 1968, to April 29, 1968. [SRDB Ref ID: 17157]
Culp, T. A., 1999, “TA-V Bioassay Program”, memorandum to File, Sandia Corporation, Sandia National Laboratories, Albuquerque, New Mexico, December 1. [SRDB Ref ID: 23911]
Culp, T. A., C. F. Cheng, W. Cox, N. Durand, M. Irwin, A. Jones, F. Lauffer, M. Lincoln, Y. McClellan, K. Molley, and T. Wolff, 1994, 1993 Site Environmental Report Sandia National Laboratories, Albuquerque, New Mexico, SAND-94-1293, Sandia Corporation, Sandia National Laboratories, Albuquerque, New Mexico, November. [SRDB Ref ID: 6472]
Culp, T., W. Cox, H. Hwang, M. Irwin, A. Jones, B. Matz, K. Molley, W. Rhodes, D. Stermer, and T. Wolff, 1993, 1992 Environmental Monitoring Report, Sandia National Laboratories, Albuquerque New Mexico, SAND-93-1448, Sandia National Laboratories, Albuquerque, New Mexico, September. [SRDB Ref ID: 6469]
Culp, T., W. Cox, S. Hwang, A. Jones, S. Longley, A. Parsons, T. Wolff, J. Fish, and S. Ward, 1992, 1991 Environmental Monitoring Report, Sandia National Laboratories, Albuquerque New Mexico, SAND-92-0939, Sandia Corporation, Sandia National Laboratories, Albuquerque, New Mexico, November. [SRDB Ref ID: 6464]
Culp, T., and W. Forston, 1995, 1994 Site Environmental Report, Tonopah Test Range, Tonopah, Nevada, SAND-95-1954, Sandia Corporation, Sandia National Laboratories, Albuquerque, New Mexico, September. [SRDB Ref ID: 12486]
Culp, T., and W. Forston, 1996, 1995 Site Environmental Report, Tonopah Test Range, Tonopah, Nevada, SAND-96-2269, Sandia Corporation, Sandia National Laboratories, Albuquerque, New Mexico, September. [SRDB Ref ID: 12487]
Culp, T., and W. Forston, 1998, Annual Site Environmental Report, Tonopah Test Range, Tonopah, Nevada, SAND-97-1832, D. Duncan and R. Sanchez, editors, Sandia Corporation, Sandia National Laboratories, Albuquerque, New Mexico, August. [SRDB Ref ID: 12491]
Culp, T., and W. Forston, 1997, 1996 Site Environmental Report, Tonopah Test Range, Tonopah, Nevada, SAND-97-2049, D. Duncan and R. Sanchez, editors, Sandia Corporation, Sandia National Laboratories, Albuquerque, New Mexico, August. [SRDB Ref ID: 12490]
Culp, T., and D. Howard, 1993, 1992 Environmental Monitoring Report, Tonopah Test Range, Tonopah, Nevada, SAND-93-1449, Sandia Corporation, Sandia National Laboratories, Albuquerque, New Mexico, October. [SRDB Ref ID: 12483]
Culp, T., D. Howard, and Y. McClellan, 1994, 1993 Site Environmental Report, Tonopah Test Range, Tonopah, Nevada, SAND-94-1292, Sandia Corporation, Sandia National Laboratories, Albuquerque, New Mexico, November. [SRDB Ref ID: 12485]
Document No. ORAUT-TKBS-0037 Revision No. 01 Effective Date: 01/25/2013 Page 101 of 120 Devlin, T. K., 1964, Sandia Engineering Reactor Facility (SERF) Health Physics Handbook, Sandia
Corporation, Sandia Laboratories, Albuquerque, New Mexico, April. [SRDB Ref ID: 23997]
DOE (U.S. Department of Energy), 1988, Radiation Protection for Occupational Workers, Order 5480.11, Office of Environment, Safety and Health, Washington, D.C., December 21. [SRDB Ref ID: 8073]
DOE (U.S. Department of Energy), 1991, Results of the DOE Indoor Radon Study, Washington, D.C., August 22. [SRDB Ref ID: 11991]
DOE (U.S. Department of Energy), 1994, “Accuracy of Worker Exposure Reports Questioned,” DOE News, Washington, D.C., November 7. [SRDB Ref ID: 19401]
DOE (U.S. Department of Energy), 1996, Environmental Assessment for Operations, Upgrades, and Modifications in SNL/NM Technical Area-IV, DOE/EA-1153, Albuquerque Operations Office, Albuquerque, New Mexico, April. [SRDB Ref ID: 54594]
DOE (U.S. Department of Energy), 1997, Linking Legacies: Connecting the Cold War Nuclear Weapons Production Processes to Their Environmental Consequences, DOE/EM-0319, Office of Environmental Management, Washington, D.C., January. [SRDB Ref ID: 11930]
Drake, R. W., 1959, Film Dosimetry Manual, Sandia Corporation, Sandia Laboratories, Albuquerque, New Mexico, July 15. [SRDB Ref ID: 23827]
Dummer Jr., J. E., and R. F. Barker, editors, 1958, Los Alamos Handbook of Radiation Monitoring, LA-1835 (3rd ed.), University of California, Los Alamos Scientific Laboratory, Los Alamos, New Mexico, November. [SRDB Ref ID: 967]
Duncan, D., and R. Sanchez, editors, 1999, 1998 Annual Site Environmental Report, Tonopah Test Range, Nevada, SAND-99-2279, Sandia Corporation, Sandia National Laboratories, Albuquerque, New Mexico, September. [SRDB Ref ID: 12496]
Duncan, D., and R. Sanchez, editors, 2001, 1999 Annual Site Environmental Report, Sandia National Laboratories, Albuquerque New Mexico, SAND-2000-2228, Sandia Corporation, Sandia National Laboratories, Albuquerque, New Mexico, February. [SRDB Ref ID: 6496]
Elliott, N. J., 1971, Calibration of the Sandia Primary Reference Standard Lead Probe Neutron Detectors, SC-TM-71 0648, Sandia Corporation, Sandia Laboratories, Albuquerque, New Mexico, October. [SRDB Ref ID: 12054]
EPA (U.S. Environmental Protection Agency), 1972, Environmental Monitoring Report for the Nevada Test Site January-December 1971, NERC-LV-539-1, National Environmental Research Center, Las Vegas, Nevada, September. [SRDB Ref ID: 54590]
Fink, C. H., 1999, 1998 Annual Site Environmental Report, Sandia National Laboratories, Albuquerque New Mexico, SAND-99-2278, R. Duncan and R. Sanchez, editors, Sandia Corporation, Sandia National Laboratories, Albuquerque, New Mexico, September. [SRDB Ref ID: 6494]
Fink, C. H., and D. Duncan, editors, 1997, 1996 Site Environmental Report, Sandia National Laboratories, Albuquerque New Mexico, SAND-97-2048, Sandia Corporation, Sandia National Laboratories, Albuquerque, New Mexico, August. [SRDB Ref ID: 6492]

Document No. ORAUT-TKBS-0037 Revision No. 01 Effective Date: 01/25/2013 Page 102 of 120 Fink, C. H., and D. Duncan, and R. Sanchez, editors, 1998, 1997 Annual Site Environmental Report,
Sandia National Laboratories, Albuquerque New Mexico, SAND-98-1833, Sandia Corporation, Sandia National Laboratories, Albuquerque, New Mexico, August. [SRDB Ref ID: 6493]
Forston, W., 2000, 1999 Annual Site Environmental Report, Tonopah Test Range, Nevada, SAND-2000-2229, R. Duncan and R. Sanchez, editors, Sandia Corporation, Sandia National Laboratories, Albuquerque, New Mexico, December. [SRDB Ref ID: 12499]
Friedman, L. F., 1993, Angular Dependence of the Harshaw 8800/8812 TLD System, Sandia Corporation, Sandia National Laboratories, Albuquerque, New Mexico, September 25. [SRDB Ref ID: 23577]
Gallaher, B. M., and D. E. Efurd, 2002, Plutonium and Uranium from Los Alamos National Laboratory in Sediments of the Northern Rio Grande Valley, LA-13974, H. Hinojosa, editor, University of California, Los Alamos National Laboratory, Los Alamos, New Mexico, August. [SRBD Ref ID: 12963]
Gautier, M. A., compiler, 1983, Manual of Analytical Methods for Radiobioassay, LA-9763-M, Los Alamos National Laboratory, Los Alamos, New Mexico, July. [SRDB Ref ID: 12890]
Gonzales, A. L., 1985, “Final Headquarters Report on the Nuclear Safety Program Appraisal of Albuquerque Operations Office, June 1985,” memorandum to R. O. McClellan, U.S. Department of Energy, Albuquerque Operations Office, Albuquerque, New Mexico, January 6. [SRDB Ref ID: 20329]
Grier, R. S., and H. L. Hardy, 1949, Progress Report Occupational Health Group H-2, 1949-1950. [SRDB Ref ID: 28650, p. 5]
Hallman, A. K., 1990, “Tritium Bioassay Data -1989,” memorandum to D. Thompson, Sandia Corporation, Sandia National Laboratories, Livermore, California, February 19. [SRDB Ref ID: 19275]
Hallman, A. K., 1992a, letter to W. C. Inkret (Los Alamos National Laboratory), Sandia Corporation, Sandia National Laboratories, Albuquerque, New Mexico, March 5. [SRDB Ref ID: 31260, p. 2]
Hallman, A. K., 1992b, “Meeting to Discuss Participation in Internal Radiation Dosimetry Program,” memorandum to Distribution, Sandia Corporation, Sandia National Laboratories, Albuquerque, New Mexico, October 12. [SRDB Ref ID: 22321, p. 8]
Hallman, A. K., 1992c, “Change-Over of Internal Dosimetry Responsibilities”, memorandum to A. L. Stanley, Sandia Corporation, Sandia National Laboratories, Albuquerque, New Mexico, October 12. [SRDB Ref ID: 22321]
Hallman, A. K., and C. A. Potter, 1992, “Final Internal Radiation Dosimetry Report on Am-241 Incident,” memorandum to Distribution, Sandia Corporation, Sandia National Laboratories, Albuquerque, New Mexico, October 26. [SRDB Ref ID: 22318, pp. 35–53]
Hammond, S. E., C. R. Lagerquist, and J. R. Mann, 1968, “Americium and Plutonium Urine Excretion Following Acute Inhalation Exposures to High Fired Oxides,” American Industrial Hygiene Association Journal, March-April, pp. 169–172. [SRDB Ref ID: 946]
Document No. ORAUT-TKBS-0037 Revision No. 01 Effective Date: 01/25/2013 Page 103 of 120 Hartman, J. R., 2007, “Records Request – Controls for Environmental Pollution, Inc (OIG Case
Number I94AL019),” memorandum to R. Griego-Campo, U.S. Department of Energy, Office of the Inspector General, Washington, D.C. [SRDB Ref ID: 32087]
Hasenkamp, A., 1961, Final Hazards Summary for the Sandia Engineering Reactor Facility (SERF), SC-4522(RR), Sandia Corporation, Sandia Laboratories, Albuquerque, New Mexico, September. [SRDB Ref ID: 22280]
Heintz, P. H., 2005, Radiographic Unit Performance Survey Report, Sandia Corporation, Sandia National Laboratories, Albuquerque, New Mexico, May 20. [SRDB Ref ID: 27229]
Hempelmann, L., 1944, Health Report, LA-0081, Los Alamos, New Mexico, April 14. [SRDB Ref ID: 994]
Hempelmann, L. H., 1945, History of the Health Group (A-6) (March 1943 - November 1945), April 6. [SRDB Ref ID: 12894]
HSS (Helgeson Scientific Services), 1989, Report of In Vivo Counting for Sandia National Laboratories, 1515 Eubank Blvd S.E., Bldg 957, for 54-9399 P.O. Box 5800, Albuquerque, New Mexico 87133, Work Performed on September 14 through September 20, 1989, Pleasanton, California, November 10. [SRDB Ref ID: 19222]
HSS (Helgeson Scientific Services, Inc.), 1991, Report of In Vivo Counting for Sandia National Laboratories, Mail Stop 3212, P.O. Box 5800, Albuquerque, New Mexico 87185, Work Performed on September 3 through September 13, 1991, Pleasanton, California, December 17. [SRDB Ref ID: 31019]
Holley, W. L., 1967, Methods of Assessing the Lung Dose from Inhaled 238PuO2, SC-TM-67-594, Sandia Corporation, Sandia Laboratories, Albuquerque, New Mexico, July. [SRDB Ref ID: 24022]
Holley, W. L., 1975, Environmental Monitoring Report, Sandia Laboratories 1974, SAND-75-0257, Sandia Corporation, Sandia Laboratories, Albuquerque, New Mexico, May. [SRDB Ref ID: 71590]
Holley, W. L., and T. N. Simmons, 1976, Environmental Monitoring Report, Sandia Laboratories 1975, SAND-76-0209, Sandia Corporation, Sandia Laboratories, Albuquerque, New Mexico, April. [SRDB Ref ID: 71591]
Howard, D., and T. Culp, 1992, 1991 Environmental Monitoring Report, Tonopah Test Range, Tonopah, Nevada, SAND-92-0938, Sandia Corporation, Sandia National Laboratories, Albuquerque, New Mexico, November. [SRDB Ref ID: 12482]
Hudson, J. F., 1968, “Examination of the 238PuO2 Containing Filter from the Continuous Air Monitor in Tr B-60 ‘Hot Lab’”, memorandum to H. E. Hansen, Sandia Corporation, Sandia Laboratories, Albuquerque, New Mexico, March 29. [SRDB Ref ID: 20324, p. 9]
Hwang, S., G. Chavez, J. Phelan, A. Parsons, G. Yeager, D. Dionne, B. Schwartz, T. Wolff, J. Fish, C. E. Gray, and D. J. Thompson, 1990a, 1989 Environmental Monitoring Report, Sandia National Laboratories, Albuquerque New Mexico, SAND-90-0301, Sandia Corporation, Sandia National Laboratories, Albuquerque, New Mexico, May. [SRDB Ref ID: 54596]

Document No. ORAUT-TKBS-0037 Revision No. 01 Effective Date: 01/25/2013 Page 104 of 120 Hwang, S., J. Phelan, T. Wolff, G. Yeager, D. Dionne, and G. West, 1990b, 1989 Environmental
Monitoring Report, Tonopah Test Range, Tonopah, Nevada, SAND-90-0302, Sandia Corporation, Sandia National Laboratories, Albuquerque, New Mexico, May. [SRDB Ref ID: 12475]
Hwang, S., J. Phelan, T. Wolff, G. Yeager, D. Dionne, G. West, and C. Girard, 1991a, 1990 Environmental Monitoring Report, Tonopah Test Range, Tonopah, Nevada, SAND-91-0593, Sandia Corporation, Sandia National Laboratories, Albuquerque, New Mexico, May. [SRDB Ref ID: 12477]
Hwang, S., G. Yeager, T. Wolff, A. Parsons, M. Goodrich, D. Dionne, C. Massey, B. Schwartz, J. Fish, and D. J. Thompson, 1991b, 1990 Environmental Monitoring Report, Sandia National Laboratories, Albuquerque New Mexico, SAND-91-0592, Sandia Corporation, Sandia National Laboratories, Albuquerque New Mexico, May. [SRDB Ref ID: 71589]
Hyde, T. B., 1989, “Health Protection Branch-Health Physics and Industrial Hygiene Appraisal Reports, Sandia National Laboratories (SNL), Albuquerque, August 28-September 1, 1989,” memorandum with attachments to P.M. Stanford, U.S. Department of Energy, Albuquerque Operations Office, Albuquerque, New Mexico. [SRDB Ref ID: 19591]
ICRP (International Commission on Radiological Protection), 1959, Report of Committee II, International Commission on Radiological Protection, on Permissible Dose for Internal Radiation, Publication 2, Pergamon Press, Oxford, England.
ICRP (International Commission on Radiological Protection), 1979, Limits for the Intake of Radionuclides by Workers, Part 1, Publication 30, Part 1, Pergamon Press, Oxford, England.
ICRP (International Commission on Radiological Protection), 1991, 1990 Recommendations of the International Commission on Radiological Protection, Publication 60, Pergamon Press, Oxford, England.
ICRP (International Commission on Radiological Protection), 1994a, Human Respiratory Tract Model for Radiological Protection, Publication 66, Pergamon Press, Oxford, England.
ICRP (International Commission on Radiological Protection), 1994b, Dose Coefficients for Intakes of Radionuclides for Workers, Publication 68, Pergamon Press, Oxford, England.
Ikenberry, T. A., 2006a, “Teleconference with Sandia National Laboratories staff on July 26, 2006,” documented communication, Oak Ridge Associated Universities Team, Oak Ridge, Tennessee, July 26. [SRDB Ref ID: 100360]
Ikenberry, T. A., 2006b, ”Teleconference with Sandia National Laboratories staff on July 26, 2006,” documented communication, Oak Ridge Associated Universities Team, Oak Ridge, Tennessee, July 26. [SRDB Ref ID: 100361]
Inkret, W. C., D. Lewis, G. Miller, T. T. Little, and M. E. Schillaci, 1998, Los Alamos National Laboratory Radiological Dose Assessment – Americium Internal Dosimetry and Bioassay Programs, LA-UR-99-836, University of California, Los Alamos National Laboratory, Los Alamos, New Mexico, October 30. [SRDB Ref ID: 13488]
Johnson, L., 1997, Sandia National Laboratories, A History of Exceptional Service in the National Interest, SAND97-1029, Sandia Corporation, Sandia National Laboratories, Albuquerque, New Mexico. [SRDB Ref ID: 84961]

Document No. ORAUT-TKBS-0037 Revision No. 01 Effective Date: 01/25/2013 Page 105 of 120 Jones, M. L., and R. L. Schwoebel, 1995a, “Bioassay Samples – Final Recommendation,” form
memorandum to Sandia National Laboratories employees (Repeat Bioassay Not Recommended), Sandia Corporation, Sandia National Laboratories, Albuquerque, New Mexico, April 25. [SRDB Ref ID: 35174]
Jones, M. L., and R. L. Schwoebel, 1995b, “Bioassay Samples – Final Recommendation,” form memorandum to Sandia National Laboratories employees (Repeat Bioassay Recommended), Sandia Corporation, Sandia National Laboratories, Albuquerque, New Mexico, May 4. [SRDB Ref ID: 35173]
Jow, H. N., undated, Depleted Uranium Briefing, Sandia Corporation, Sandia National Laboratories, Albuquerque, New Mexico. [SRDB Ref ID: 19269]
Jow, H. N., 1991, “Radiological Hazard Identifications in Tech Area IV,” memorandum to C. E. Pasterczyk, Sandia Corporation, Sandia National Laboratories, Albuquerque, New Mexico, March 8. [SRDB Ref ID: 35209]
KES [author’s initials], 2005, Pre-Employment/New Hire X-ray Summary, revision, Sandia Corporation, Sandia National Laboratories, Albuquerque, New Mexico, March 21. [SRDB Ref ID: 17104]
Kingsley, W. H., 1953a, “Film Badges,” memorandum to C. H. Goddard and R. L. Birdsall, April 30. [SRDB Ref ID: 23754, p. 3]
Kingsley, W. H., 1953b, untitled memorandum to J. L. Rowe, May 25. [SRDB Ref ID: 23659, p. 25]
Kingsley, W. H., 1971, “Status of the Sandia Personnel Dosimetry System,” memorandum to B. F. Murphy, Sandia Corporation, Sandia Laboratories, Albuquerque, New Mexico, August 5. [SRDB Ref ID: 23830, p. 10]
Lawrence, J. N. P., 1978, A History of PUQFUA, LA-7403-H, Los Alamos Scientific Laboratory, Los Alamos, New Mexico. [SRDB Ref ID: 12920]
Lawrence, J. N. P., 1984, Uranium Internal Exposure Evaluation Based on Urine Assay Data, LA-10246-MS, University of California, Los Alamos National Laboratory, Los Alamos, New Mexico, September. [SRDB Ref ID: 7971]
Little, T. T., G. Miller, and R. Guilmette, 2003a, “Internal Dosimetry of Uranium Isotopes Using Bayesian Inference Methods,” Radiation Protection Dosimetry, volume 105, number 1-4, pp. 413–416. [SRDB Ref ID: 12938]
Little, T. T., G. Miller, and R. Guilmette, 2003b, Identifying Uranium Intakes from Bioassay Data in the Presence of Environmental Background, University of California, Los Alamos National Laboratory, Los Alamos, New Mexico, October 29. [SRDB Ref ID: 12939]
Mallon, J., 1995, Technical Basis Document for Internal Dosimetry at Sandia National Laboratories, Sandia Corporation, Sandia National Laboratories, Albuquerque, New Mexico. [SRDB Ref ID: 74075]
Marshall Jr., B. W., 1993, “Use of Depleted Uranium at the 9940 Test Facility,” memorandum to Record, Sandia Corporation, Sandia National Laboratories, Albuquerque, New Mexico, June 24. [SRDB Ref ID: 19263]

Document No. ORAUT-TKBS-0037 Revision No. 01 Effective Date: 01/25/2013 Page 106 of 120 Martin, J. B., 2005, “Interview with SNL staff Concerning Operation and Worker Exposures at
Clarksville,” memorandum to file, Oak Ridge Associated Universities Team, Oak Ridge, Tennessee, December 29. [SRDB Ref ID: 46684]
McClelland, J., 1958, Analytical Procedures of the Industrial Hygiene Group, LA-1858 (2nd Edition), University of California, Los Alamos Scientific Laboratory, Los Alamos, New Mexico, September 1. [SRDB Ref ID: 12948]
McInroy, J. F., R. L. Kathren, G. L. Voelz, and M. J. Swint, 1991, “U.S. Transuranium Registry Report on the 239Pu Distribution in a Human Body,” Health Physics, volume 60, number 3, pp. 307–333. [SRDB Ref ID: 13077]
Millard, G. C., 1986, 1985 Environmental Report, Sandia National Laboratories, Tonopah Test Range, Tonopah, Nevada, SAND86-0751, Sandia Corporation, Sandia National Laboratories, Albuquerque, New Mexico, April. [SRDB Ref ID: 12460]
Millard, G. C., C. E. Gray, and B. L. O’Neal, 1984, 1983 Environmental Monitoring Report, Sandia National Laboratories, Albuquerque New Mexico, SAND-84-0429, Sandia Corporation, Sandia National Laboratories, Albuquerque, New Mexico, April. [SRDB Ref ID: 77100]
Millard, G. C., C. E. Gray, T. N. Simmons, and B. L. O’Neal, 1982, 1981 Environmental Monitoring Report, Sandia National Laboratories, Albuquerque NM, SAND-82-0833, Sandia Corporation, Sandia National Laboratories, Albuquerque, New Mexico, April. [SRDB Ref ID: 23889]
Millard, G. C., C. E. Gray, T. N. Simmons, and B. L. O’Neal, 1983, 1982 Environmental Monitoring Report, Sandia National Laboratories, Albuquerque, New Mexico, SAND-83-0789, Sandia Corporation, Sandia National Laboratories, Albuquerque, New Mexico, April. [SRDB Ref ID: 77089]
Millard, G. C., C. E. Gray, and D. J. Thompson, 1985, 1984 Environmental Monitoring Report, Sandia National Laboratories, Albuquerque, New Mexico, SAND-85-0550, Sandia Corporation, Sandia National Laboratories, Albuquerque, New Mexico, April. [SRDB Ref ID: 71594]
Millard, G. C., C. E. Gray, and D. J. Thompson, 1986, 1985 Environmental Monitoring Report, Sandia National Laboratories, Albuquerque, New Mexico, SAND-86-0752, Sandia Corporation, Sandia National Laboratories, Albuquerque, New Mexico, May. [SRDB Ref ID: 23839]
Millard, G. C., and L. W. Lathrop, 1982, 1981 Environmental Summary, Sandia National Laboratories, Tonopah Test Range, Tonopah, Nevada, SAND-82-0901, Sandia Corporation, Sandia National Laboratories, Albuquerque, New Mexico, April. [SRDB Ref ID: 24066]
Millard, G. C., and L. W. Lathrop, 1984, 1983 Environmental Summary, Sandia National Laboratories, Tonopah Test Range, Tonopah, Nevada, SAND-84-0430, Sandia Corporation, Sandia National Laboratories, Albuquerque, New Mexico, April. [SRDB Ref ID: 23885]
Millard, G. C., and L. W. Lathrop, 1985, 1984 Environmental Summary, Sandia National Laboratories, Tonopah Test Range, Tonopah, Nevada, SAND-85-0551, Sandia Corporation, Sandia National Laboratories, Albuquerque, New Mexico, April. [SRDB Ref ID: 12459]
Millard, G., P. Pei, S. Felicetti, C. Gray, D. Thompson, and J. Phelan, 1987, 1986 Environmental Monitoring Report, Sandia National Laboratories, Albuquerque, New Mexico, SAND-87-0606, Sandia Corporation, Sandia National Laboratories, Albuquerque, New Mexico, April. [SRDB Ref ID: 23841]
Document No. ORAUT-TKBS-0037 Revision No. 01 Effective Date: 01/25/2013 Page 107 of 120 Millard, G., P. Pei, S. Felicetti, C. Gray, D. Thompson, and J. Phelan, 1988, 1987 Environmental
Monitoring Report, Sandia National Laboratories, Albuquerque, New Mexico, SAND-88-0697, Sandia Corporation, Sandia National Laboratories, Albuquerque, New Mexico, April. [SRDB Ref ID: 23842]
Millard, G. C., T. N. Simmons, C. E. Gray, and B. L. O’Neal, 1981, 1980 Environmental Monitoring Report, Sandia National Laboratories, Albuquerque, New Mexico, SAND-81-0566, Sandia Corporation, Sandia National Laboratories, Albuquerque, New Mexico, April. [SRDB Ref ID: 77091]
Millard, G. C., and G. L. West, 1987, 1986 Environmental Monitoring Report, Tonopah Test Range, Tonopah, Nevada, SAND-87-0605, Sandia Corporation, Sandia National Laboratories, Albuquerque, New Mexico, April. [SRDB Ref ID: 12461]
Millard, G. C., and G. L. West, 1988, 1987 Environmental Monitoring Report, Tonopah Test Range, Tonopah, Nevada, SAND-88-0698, Sandia Corporation, Sandia National Laboratories, Albuquerque, New Mexico, April. [SRDB Ref ID: 12463]
Millard, G., G. Yeager, J. Phelan, T. Wolff, P. Pei, D. Dionne, C. Gray, D. Thompson, and R. Hamilton, 1989a, 1988 Environmental Monitoring Report, Sandia National Laboratories, Albuquerque, New Mexico, SAND-89-1368, Sandia Corporation, Sandia National Laboratories, Albuquerque, New Mexico, May. [SRDB Ref ID: 23845]
Millard, G. C., R. G. Hamilton, J. Phelan, and G. L. West, 1989b, 1988 Environmental Monitoring Report, Tonopah Test Range, Tonopah, Nevada, SAND-89-1367, Sandia Corporation, Sandia National Laboratories, Albuquerque, New Mexico, May. [SRDB Ref ID: 12474]
Miller, L. F. 1978, Safety Analysis Summary for the Advanced Nosetip Test Payload (A.N.T. IIIA Mission), Sandia Corporation, Sandia Laboratories, Albuquerque, New Mexico, April. [SRDB Ref ID: 20386]
Morgan, K. Z., 1961, “Dosimetry Requirements for Protection from Ionizing Radiation,” Selected Topics in Radiation Dosimetry, International Atomic Energy Agency, Vienna, Austria, pp. 3–23. [SRDB Ref ID: 8345]
Moss, W., 1990, “Evaluation of Plutonium Bioassay Data 1944 - 1977,” memorandum to P. Gautier, Los Alamos National Laboratory, Los Alamos, New Mexico, July 12. [SRDB Ref ID: 12952]
Moss, W. D., E. E. Campbell, H. F. Schulte, and G. L. Teitjen, 1969, “A Study of the Variations Found in Plutonium Urinary Data,” Health Physics, volume 17, pp. 571–578. [SRDB Ref ID: 14529]
NCRP (National Council on Radiation Protection and Measurements), 1968, Medical X-Ray and Gamma-Ray Protection for Energies up to 10 MeV, Report 33, Washington, D.C.
NCRP (National Council on Radiation Protection and Measurements), 1987, Exposure of the Population in the United States and Canada from Natural Background Radiation, Report 94, Bethesda, Maryland. [SRDB Ref ID: 22736]
NCRP (National Council on Radiation Protection and Measurements), 1989, Medical X-Ray, Electron Beam and Gamma-Ray Protection for Energies up to 50 MeV (Equipment Design, Performance and Use), Report 102, Bethesda, Maryland. [SRDB Ref ID: 32467]
Document No. ORAUT-TKBS-0037 Revision No. 01 Effective Date: 01/25/2013 Page 108 of 120 NCRP (National Council on Radiation Protection and Measurements), 1996, Screening Models for
Releases of Radionuclides to Atmosphere, Surface Water, and Ground, Report 123, Bethesda, Maryland. [SRDB Ref ID: 79896]
NCRP (National Council on Radiation Protection and Measurements), 1997, Medical X-Ray, Electron Beam and Gamma-Ray Protection for Energies up to 50 MeV (Equipment Design, Performance and Use), Report 102, third printing, Bethesda, Maryland.
NCRP (National Council on Radiation Protection and Measurements), 2003, Radiation Protection for Particle Accelerator Facilities, Report 144, Bethesda, Maryland.
NIOSH (National Institute for Occupational Safety and Health), 2007, External Dose Reconstruction Implementation Guideline, OCAS-IG-001, Rev 3, Office of Compensation Analysis and Support, Cincinnati, Ohio, November 21.
NIOSH (National Institute for Occupational Safety and Health), 2010, Radiation Exposures Covered for Dose Reconstructions Under Part B of the Energy Employees Occupational Illness Compensation Program Act, DCAS-IG-003, Rev. 01, Division of Compensation Analysis and Support, Cincinnati, Ohio, October 5.
NIOSH (National Institute for Occupational Safety and Health), 2011, SEC Petition Evaluation Report Petition SEC-00162, Rev FINAL, Division of Compensation Analysis and Support, Cincinnati, Ohio, May 6.
NIOSH (National Institute for Occupational Safety and Health), 2012, SEC Petition Evaluation Report Petition SEC-00188, Rev FINAL, Division of Compensation Analysis and Support, Cincinnati, Ohio, February 21.
O’Neal, B. L., 1968, “210Po Source Incident”, memorandum to W. H. Kingsley, Sandia Corporation, Sandia Laboratories, Albuquerque, New Mexico, November 22. [SRDB Ref ID: 20324, p. 10]
O’Neal, B. L., and W. D. Burnett, 1971, Health Physics Aspects of Tritium Work at Sandia Laboratories, SC-TM-71 0245, Sandia Corporation, Sandia Laboratories, Albuquerque, New Mexico. [SRDB Ref ID: 24010]
ORAUT (Oak Ridge Associated Universities Team), 2006a, Occupational Onsite Ambient Dose Reconstruction for DOE Sites, ORAUT-PROC-0060, Rev. 01, Oak Ridge Associated Universities, Oak Ridge, Tennessee, June 28.
ORAUT (Oak Ridge Associated Universities Team), 2006b, Argonne National Laboratory – East – External Dosimetry, ORAUT-TKBS-0036-6, Rev. 00, Oak Ridge Associated Universities, Oak Ridge, Tennessee, February 9.
ORAUT (Oak Ridge Associated Universities Team), 2007, Calculation of Dose from Intakes of Special Tritium Compounds, ORAUT-OTIB-0066, Rev. 00, Oak Ridge Associated Universities, Oak Ridge, Tennessee, April 26.
ORAUT (Oak Ridge Associated Universities Team), 2008a, External Coworker Dosimetry Data for the Sandia National Laboratories in Albuquerque, New Mexico, ORAUT-OTIB-0072, Rev. 00, Oak Ridge Associated Universities, Oak Ridge, Tennessee, September 26.
Document No. ORAUT-TKBS-0037 Revision No. 01 Effective Date: 01/25/2013 Page 109 of 120 ORAUT (Oak Ridge Associated Universities Team), 2008b, Assignment of Missed Neutron Doses
Based on Dosimeter Records, ORAUT-OTIB-0023, Rev. 00, Oak Ridge Associated Universities, Oak Ridge, Tennessee, May 14.
ORAUT (Oak Ridge Associated Universities Team), 2009a, Los Alamos National Laboratory – Occupational Internal Dose, ORAUT-TKBS-0010-5, Rev. 01, Oak Ridge Associated Universities, Oak Ridge, Tennessee, October 15.
ORAUT (Oak Ridge Associated Universities Team), 2009b, Los Alamos National Laboratory – Occupational External Dose, ORAUT-TKBS-0010-6, Rev. 02, Oak Ridge Associated Universities, Oak Ridge, Tennessee, November 23.
ORAUT (Oak Ridge Associated Universities Team), 2010a, Lawrence Livermore National Laboratory – Occupational Internal Dose, ORAUT-TKBS-0035-5, Rev. 02, Oak Ridge Associated Universities, Oak Ridge, Tennessee, December 13.
ORAUT (Oak Ridge Associated Universities Team), 2010b, Estimating Doses for Plutonium Strongly Retained in the Lung, ORAUT-OTIB-0049, Rev. 01 PC-2, Oak Ridge Associated Universities, Oak Ridge, Tennessee, November 29.
ORAUT (Oak Ridge Associated Universities Team), 2010c, Hanford Site – Occupational External Dose, ORAUT-TKBS-0006-6, Rev. 04, Oak Ridge Associated Universities, Oak Ridge, Tennessee, January 7.
ORAUT (Oak Ridge Associated Universities Team), 2010d, Los Alamos National Laboratory – Occupational Medical Dose, ORAUT-TKBS-0010-3, Rev. 01, Oak Ridge Associated Universities, Oak Ridge, Tennessee, September 14.
ORAUT (Oak Ridge Associated Universities Team), 2011a, Guidance on Assigning Occupational X-Ray Dose under EEOICPA for X-Rays Administered Off Site, ORAUT-OTIB-0079, Rev 00, Oak Ridge Associated Universities, Oak Ridge, Tennessee, January 3.
ORAUT (Oak Ridge Associated Universities Team), 2011b, Dose Reconstruction from Occupationally Related Diagnostic X-Ray Procedures, ORAUT-OTIB-0006, Rev. 04, Oak Ridge Associated Universities, Oak Ridge, Tennessee, June 20.
ORAUT (Oak Ridge Associated Universities Team), 2012, Site Profile and Technical Basis Document Development, ORAUT-PROC-0031, Rev 04, Oak Ridge Associated Universities, Oak Ridge, Tennessee, November 5.
Peace, J. L., T. J. Goering, and M. D. McVay, 1996, Tritium in Surface Soils at the Mixed Waste Landfill, Technical Area 3, Sandia National Laboratories, New Mexico, SAND 95-1611, Sandia Corporation, Sandia National Laboratories, Albuquerque, New Mexico, March. [SRDB Ref ID: 54597]
Pigg, J., 1993, “Industrial Hygiene Monitoring for Total Uranium Exposure,” memorandum to K. Reil, Sandia Corporation, Sandia National Laboratories, Albuquerque, New Mexico, June 30. [SRDB Ref ID: 19268]
Potter, C. A., 1993a, “Bioassay Requirements at TTR,” memorandum to K. McCaughey, Sandia Corporation, Sandia National Laboratories, Albuquerque, New Mexico, March 11. [SRDB Ref ID: 19313]

Document No. ORAUT-TKBS-0037 Revision No. 01 Effective Date: 01/25/2013 Page 110 of 120 Potter, C. A., 1993b, “Dosimetry Action Levels,” PRDP-02-06, Sandia Corporation, Sandia National
Laboratories, Albuquerque, New Mexico, November 11. [SRDB Ref ID: 19238]
Potter, C. A., 1993c, “Radiation Protection Measurements, 7715,” Personnel Radiation Protection Measurements on Total and Depleted Uranium Dosimetry Program, Sandia Corporation, Sandia National Laboratories, Albuquerque, New Mexico. [SRDB Ref ID: 22332]
Potter, C. A., 1994, Radiation Protection Internal Dosimetry Program Overview, RPID-00-01, Issue 3, Sandia Corporation, Sandia National Laboratories, Albuquerque, New Mexico, August 10. [SRDB Ref ID: 22093]
Potter, C. A., 1996, Radiation Protection Internal Dosimetry Program Overview, RPID-00-01, Issue 4, Sandia Corporation, Sandia National Laboratories, Albuquerque, New Mexico, August 27. [SRDB Ref ID: 35504]
Potter, C. A., 2006a, “Re: Sandia TBD Questions,” e-mail to R. Argall (Oak Ridge Associated Universities Team), Sandia Corporation, Sandia National Laboratories, Albuquerque, New Mexico, February 13. [SRDB Ref ID: 23584]
Potter, C. A., 2006b, “Re: Uranium Bioassay Samples,” e-mail to R. Argall (Oak Ridge Associated Universities Team), Sandia Corporation, Sandia National Laboratories, Albuquerque, New Mexico, May 8. [SRDB Ref ID: 45057]
Preston, R. T., 2005, ICP/MS Routine QC and Sample Analysis, RPSD-09-07, Sandia Corporation, Sandia National Laboratories, Albuquerque, New Mexico, December 21. [SRDB Ref ID: 22805]
Rarrick, H., 2007, “Re: Discussion,” e-mail to R. S. Argall (Oak Ridge Associated Universities Team), February 9. [SRDB Ref ID: 45055]
REECo (Reynolds Electrical & Engineering Co.), 1974, Operation TOGGLE Onsite Radiological Safety Report, July 1972, through June 1973, NVO-410-26, Las Vegas, Nevada, May. [SRDB Ref ID: 7804]
Reese, R. P., 2006, “Update of Minimum Detectable Activity (MDA) Values,” memorandum to C. A. Potter, Sandia Corporation, Sandia National Laboratories, Albuquerque, New Mexico, February 8. [SRDB Ref ID: 45059]
Rhea, T. A., and E. W. Bradley, 1991, Documentation of the Sandia National Laboratory Dosimetry Algorithm for the Harshaw 8800/8812 System, 1-143-07·722-01, Science Applications International Corporation, Oak Ridge, Tennessee. [SRDB Ref ID: 23575]
Rich, B. L., S. L. Hinnefeld, C. R. Lagerquist, W. G. Mansfield, L. H. Munson, E. R. Wagner, and E. J. Vallario, 1988, Health Physics Manual of Good Practices for Uranium Facilities, EGG-2530, EG&G Idaho, Idaho National Engineering Laboratory, Idaho Falls, Idaho, June. [SRDB Ref ID: 1781]
Rittmann, P. D., 1984, Seven Health Physics Calculator Programs for the HP-41CV, RHO-HS-ST-5 P, Rockwell Hanford Operations, Hanford Site, Richland, Washington, August. [SRDB Ref ID: 77087]

Document No. ORAUT-TKBS-0037 Revision No. 01 Effective Date: 01/25/2013 Page 111 of 120 Sanchez, R., K. Agogino, M. Miller, S. Gorman, and N. White, 2011a, Calendar Year 2010 Annual
Site Environmental Report for Sandia National Laboratories, New Mexico, SAND-2011-5552P, Sandia Corporation, Sandia National Laboratories, Albuquerque, New Mexico, September. [SRDB Ref ID: 110507]
Sanchez, R., K. Agogino, M. Miller, S. Gorman, and N. White, 2011b, Calendar Year 2010 Annual Site Environmental Report for Tonopah Test Range, Nevada and Kauai Test Facility, Hawaii, SAND-2011-5616P, Sandia Corporation, Sandia National Laboratories, Albuquerque, New Mexico, September. [SRDB Ref ID: 110508]
Sanchez, R., K. Agogino, M. Miller, S. Gorman, S. Ricketson, and N. White, 2010a, Calendar Year 2009 Annual Site Environmental Report for Sandia National Laboratories, New Mexico, SAND-2010-5349P, Sandia Corporation, Sandia National Laboratories, Albuquerque, New Mexico, September. [SRDB Ref ID: 110504]
Sanchez, R., K. Agogino, M. Miller, S. Gorman, S. Ricketson, and N. White, 2010b, Calendar Year 2009 Annual Site Environmental Report for Tonopah Test Range, Nevada and Kauai Test Facility, Hawaii, SAND-2010-5350P, Sandia Corporation, Sandia National Laboratories, Albuquerque, New Mexico, September. [SRDB Ref ID: 110506]
Sanchez, R., K. Agogino, M. Miller, S. Gorman, S. Ricketson, T. Goering, and J. Orozco, 2009a, Calendar Year 2008 Annual Site Environmental Report for Sandia National Laboratories, New Mexico, SAND-2009-4738P, Sandia Corporation, Sandia National Laboratories, Albuquerque, New Mexico, September. [SRDB Ref ID: 80339]
Sanchez, R., K. Agogino, M. Miller, S. Gorman, S. Ricketson, T. Goering, and J. Orozco, 2009b, Calendar Year 2008 Annual Site Environmental Report for Tonopah Test Range, Nevada and Kauai Test Facility, Hawaii, SAND-2009-4774P, Sandia Corporation, Sandia National Laboratories, Albuquerque, New Mexico, September. [SRDB Ref ID: 110501]
Sanchez, R., K. Agogino, S. Koss, E. Otto, and J. Orozco, 2008a, Calendar Year 2007 Annual Site Environmental Report for Sandia National Laboratories, New Mexico, SAND-2008-5069P, Sandia Corporation, Sandia National Laboratories, Albuquerque, New Mexico, September. [SRDB Ref ID: 80335]
Sanchez, R., K. Agogino, S. Koss, E. Otto, and J. Orozco, 2008b, Calendar Year 2007 Annual Site Environmental Report for Tonopah Test Range, Nevada and Kauai Test Facility, Hawaii, SAND-2008-5070P, Sandia Corporation, Sandia National Laboratories, Albuquerque, New Mexico, September. [SRDB Ref ID: 110499]
Sanchez, R., K. Hamilton, and L. Mayeux, 2001a, Calendar Year 2000 Annual Site Environmental Report, Tonopah Test Range, Nevada, SAND-2001-2762, Sandia Corporation, Sandia National Laboratories, Albuquerque, New Mexico, October. [SRDB Ref ID: 12502]
Sanchez, R., K. Hamilton, and L. Mayeux, 2001b, Calendar Year 2000 Annual Site Environmental Report, Sandia National Laboratories, Albuquerque New Mexico, SAND-2001-2761, Sandia Corporation, Sandia National Laboratories, Albuquerque, New Mexico, September. [SRDB Ref ID: 6499]
Sanchez, R., K. Wagner, F. Vigil, and L. Mayeux, 2002a, Calendar Year 2001 Annual Site Environmental Report, Sandia National Laboratories, Albuquerque New Mexico, SAND-2002-2415, Sandia Corporation, Sandia National Laboratories, Albuquerque, New Mexico, September. [SRDB Ref ID: 6502]

Document No. ORAUT-TKBS-0037 Revision No. 01 Effective Date: 01/25/2013 Page 112 of 120 Sanchez, R., K. Wagner, F. Vigil, and L. Mayeux, 2002b, Calendar Year 2001 Annual Site
Environmental Report, Tonopah Test Range, Nevada, SAND-2002-2565, Sandia Corporation, Sandia National Laboratories, Albuquerque, New Mexico, September. [SRDB Ref ID: 22365]
Sanderville, K., 1991, “Request for calculations on these badge exposures for estimated skin doses on a phantom,” memorandum to D. Thompson, Sandia Corporation, Sandia National Laboratories, Albuquerque, New Mexico, January 29. [SRDB Ref ID: 27227]
Shanks Jr., A., 1993, Baseline Radiation and Contamination Survey Procedure, RPOP-841, Issue A, Sandia Corporation, Sandia National Laboratories, Albuquerque, New Mexico. [SRDB Ref ID: 19232]
Shipman, T. L. 1948, H Division Progress Reports, 1948-1950, Los Alamos Scientific Laboratory, Los Alamos, New Mexico. [SRDB Ref ID: 28619, p. 11]
Shipman, T. L. 1955, Annual Report of the Health Division, 1954, University of California, Los Alamos Scientific Laboratory, Los Alamos, New Mexico, January. [SRDB Ref ID: 27939]
Shipman, T. L. 1958, Annual Report of the Health Division 1957, LA-2216, University of California, Los Alamos, New Mexico, October 17. [SRDB Ref ID: 27935]
Shyr, L. J., D. Duncan, and R. Sanchez, 1996, 1995 Site Environmental Report, Sandia National Laboratories, Albuquerque New Mexico, SAND-96-2270, Sandia Corporation, Sandia National Laboratories, Albuquerque, New Mexico, September. [SRDB Ref ID: 6491]
Shyr, L. J., T. Wiggins, B. B. White, and R. Sanchez, 1995, 1994 Site Environmental Report, Sandia National Laboratories, Albuquerque New Mexico, SAND-95-1953, Sandia Corporation, Sandia National Laboratories, Albuquerque, New Mexico, September. [SRDB Ref ID: 6482]
Simmons, T. N., 1977, Environmental Monitoring Report, Sandia Laboratories 1976, SAND-77-0616, Sandia Corporation, Sandia Laboratories, Albuquerque, New Mexico, April. [SRDB Ref ID: 71592]
Simmons, T. N., 1978, Environmental Monitoring Report, Sandia Laboratories 1977, SAND-78-0620, Sandia Corporation, Sandia Laboratories, Albuquerque, New Mexico, April. [SRDB Ref ID: 77102]
Simmons, T. N., 1980, Sandia National Laboratories 1979 Environmental Monitoring Report, SAND-80-0342, Sandia Corporation, Sandia National Laboratories, Albuquerque, New Mexico, April. [SRDB Ref ID: 71593]
Skrable, K. W., 1996, Evaluation of Radiation Protection Internal Dosimetry (RPID) Program Manual and Procedures for Sandia National Laboratories, Draft, Chelmsford, Massachusetts, February 12. [SRDB Ref ID: 35471]
SL (Sandia Laboratories), 1967, SER Stack Monitor, Sandia Corporation, Albuquerque, New Mexico. [SRDB Ref ID: 22281]
SL (Sandia Laboratories), 1974, SER Log # 34 9/28/72-6/20/74, Sandia Corporation, Albuquerque, New Mexico. [SRDB Ref ID: 22296, pp. 2–6]
SL (Sandia Laboratories), 1975a, Health Physics Records from 1966 to 1975, Sandia Corporation, Albuquerque, New Mexico. [SRDB Ref ID: 20324, pp. 60-65]

Document No. ORAUT-TKBS-0037 Revision No. 01 Effective Date: 01/25/2013 Page 113 of 120 SL (Sandia Laboratories), 1975b, Nuclear Safety Repot/Safety Analysis Summary for the Advanced
SAMAST 3/MINT 2 Payload, Sandia Corporation, Albuquerque, New Mexico. [SRDB Ref ID: 20337]
SL (Sandia Laboratories), 1977, Safety Analysis Summary for the Advanced Nosetip Test Payloads/ANT-I, Sandia Corporation, Albuquerque, New Mexico. [SRDB Ref ID: 20356]
SL (Sandia Laboratories), 1979, Sandia Laboratories Radiation Facilities, Second Edition, Sandia Corporation, Albuquerque, New Mexico. [SRDB Ref ID: 80380]
Sneddon, M., S. Koss, R. Sanchez, and C. Cunningham, 2007a, Calendar Year 2006 Annual Site Environmental Report for Sandia National Laboratories, New Mexico, SAND-2007-4352P, Sandia Corporation, Sandia National Laboratories, Albuquerque, New Mexico, September. [SRDB Ref ID: 110496]
Sneddon, M., S. Koss, R. Sanchez, and C. Cunningham, 2007b, Calendar Year 2006 Annual Site Environmental Report for Tonopah Test Range, Nevada and Kauai Test Facility, Hawaii, SAND-2007-4407P, Sandia Corporation, Sandia National Laboratories, Albuquerque, New Mexico, September. [SRDB Ref ID: 110497]
SNL (Sandia National Laboratories), 1985, Surveys Radiological for HCF/Area 5 Various CAM & Radeco Air Filter Analysis 1985, Sandia Corporation, Albuquerque, New Mexico. [SRDB Ref ID: 19080]
SNL (Sandia National Laboratories), 1988, Survey Radiological SPR, KIVA/Area 5 Air Sample Results 1988, Sandia Corporation, Albuquerque, New Mexico. [SRDB Ref ID: 20318]
SNL (Sandia National Laboratories), 1989a, Survey Radiological for SER/Area 5 Various Surveys 1989-1971, Sandia Corporation, Albuquerque, New Mexico. [SRDB Ref ID: 20327]
SNL (Sandia National Laboratories), 1989b, Surveys Radiological for KIVA/Area 5 Routine Unfiltered Exhaust Analysis 1989-1988, Sandia Corporation, Albuquerque, New Mexico. [SRDB Ref ID: 20317]
SNL (Sandia National Laboratories), 1990, Surveys Radiological ACRR/ Area 5 Air Sample Study 1990, Sandia Corporation, Albuquerque, New Mexico. [SRDB Ref ID: 22361]
SNL (Sandia National Laboratories), 1992, Collection of Internal Dosimetry Memoranda, 1992, Sandia Corporation, Albuquerque, New Mexico. [SRDB Ref ID: 22321]
SNL (Sandia National Laboratories), 1993a, Event Occurrence Table, Sandia Corporation, Albuquerque, New Mexico. [SRDB Ref ID: 20399]
SNL (Sandia National Laboratories), 1993b, Bioassay Results and Report Methods Summary Memoranda, Sandia Corporation, Albuquerque, New Mexico. [SRDB Ref ID: 19303]
SNL (Sandia National Laboratories), 1993c, Purchase Orders to Los Alamos National Laboratory and related information, Sandia Corporation, Albuquerque, New Mexico. [SRDB Ref ID: 35225]
SNL (Sandia National Laboratories), 1994a, Low Background Counting System – Air Analysis, Sandia Corporation, Albuquerque, New Mexico, June 20. [SRDB Ref ID: 22312, p. 10]

Document No. ORAUT-TKBS-0037 Revision No. 01 Effective Date: 01/25/2013 Page 114 of 120 SNL (Sandia National Laboratories), 1994b, Whole Body Count Reports with MDAs, Sandia
Corporation, Albuquerque, New Mexico, February 7-16. [SRDB Ref ID: 35226, pp. 25-40]
SNL (Sandia National Laboratories), 1995a, Consolidated Final Action Plan to Tiger Team, Vol. I, SAND 92-2035, Change 6, Sandia Corporation, Albuquerque, New Mexico, October 1. [SRDB Ref ID: 22088, pp. 2-705]
SNL (Sandia National Laboratories), 1995b, Consolidated Final Action Plan to Tiger Team, Vol. II, SAND 92-2035, Change 6, Sandia Corporation, Albuquerque, New Mexico, October 1. [SRDB Ref ID: 22088, pp. 706-2111]
SNL (Sandia National Laboratories), 1995c, Radiological Survey Form for Building 887 Cubicle 64, Alpha, Beta, Tritium Survey, Albuquerque, New Mexico, May 5. [SRDB Ref ID: 22061]
SNL (Sandia National Laboratories), 1998b, Thermal Treatment Facility Source Document, Draft, Sandia Corporation, Albuquerque, New Mexico, April 9. [SRDB Ref ID: 20500]
SNL (Sandia National Laboratories), 1998c, Radioactive and Mixed Waste Management Facility Source Document, Draft, Sandia Corporation, Albuquerque, New Mexico, April 9. [SRDB Ref ID: 20476]
SNL (Sandia National Laboratories), 1998d, Sandia Accelerator & Beam Research Experiment Source Document, Sandia Corporation, Albuquerque, New Mexico, April 2. [SRDB Ref ID: 20480]
SNL (Sandia National Laboratories), 1998e, SATURN Source Document, Draft, Sandia Corporation, Albuquerque, New Mexico, April 2. [SRDB Ref ID: 20481]
SNL (Sandia National Laboratories), 1998f, Short-Pulse High Intensity Nanosecond X-Radiator Source Document, Sandia Corporation, Albuquerque, New Mexico, April 2. [SRDB Ref ID: 20478]
SNL (Sandia National Laboratories), 1998g, TESLA Source Document, Draft, Sandia Corporation, Albuquerque, New Mexico, April 2. [SRDB Ref ID: 20467]
SNL (Sandia National Laboratories), 1998h, Advanced Pulsed Power Research Module Source Document, Sandia Corporation, Albuquerque, New Mexico, April 2. [SRDB Ref ID: 20440]
SNL (Sandia National Laboratories), 1998i, Z Machine Source Document, Sandia Corporation, Albuquerque, New Mexico, April 2. [SRDB Ref ID: 20492]
SNL (Sandia National Laboratories), 1998j, Hazardous Waste Management Facility Source Document, Draft, Sandia Corporation, Albuquerque, New Mexico, April 9. [SRDB Ref ID: 20465]
SNL (Sandia National Laboratories), 1998k, Integrated Materials Research Laboratory Source Document, Sandia Corporation, Albuquerque, New Mexico, April 9. [SRDB Ref ID: 20496]
SNL (Sandia National Laboratories), 1998l, Explosive Components Facility Source Document, Draft, Sandia Corporation, Albuquerque, New Mexico, April 2. [SRDB Ref ID: 20498]
Document No. ORAUT-TKBS-0037 Revision No. 01 Effective Date: 01/25/2013 Page 115 of 120 SNL (Sandia National Laboratories), 1999, Airborne Radiological Survey Form, “6591 Rm 5/6592 Inst
Building,” Survey # 17956, Sandia Corporation, Albuquerque, New Mexico, March 18. [SRDB Ref ID: 22135]
SNL (Sandia National Laboratories), 2001, Whole Body Count Report with MDAs, Sandia Corporation, Albuquerque, New Mexico, January 4. [SRDB Ref ID: 35725, pp. 4-5]
SNL (Sandia National Laboratories), 2004, Gamma Spectrometer Sample Analysis, RPSD-09-01, Issue No. 6, Sandia Corporation, Albuquerque, New Mexico, July 8. [SRDB Ref ID: 22800]
SNL (Sandia National Laboratories), 2005a, Liquid Scintillation Counter Sample Analysis, RSPD-09-03, Sandia Corporation, Albuquerque, New Mexico, August 18. [SRDB Ref ID: 22810]
SNL (Sandia National Laboratories), 2005b, Liquid Scintillation Counter Sample Preparation, RSPD-07-03, Sandia Corporation, Albuquerque, New Mexico, April 11. [SRDB Ref ID: 22811]
SNL (Sandia National Laboratories), 2005c, Gamma Spectrometer Sample Preparation, RSPD-07-04, Sandia Corporation, Albuquerque, New Mexico. June 13. [SRDB Ref ID: 22804]
SNL (Sandia National Laboratories), 2006, Long Term Environmental Stewardship/New Mexico History, www.sandia.gov/ltes/snl_history.htm, accessed November 19, 2008. [SRDB Ref ID: 54595]
Stanley, A. L., 1980, “Personnel Dosimetry Records,” memorandum to W. C. Colborne, Sandia Corporation, Sandia Laboratories, Albuquerque, New Mexico, May 1. [SRDB Ref ID: 23918]
Stanley, A. L., 1993, “Americium Bioassay Results,” memorandum to W. A. Stygar, Sandia Corporation, Sandia National Laboratories, Albuquerque, New Mexico, March 16. [SRDB Ref ID: 19303, p. 8]
Stout, K., 1997, letter to R. G. Antonsen, Jr. (Department of Health & Human Services, Food and Drug Administration), Sandia Corporation, Sandia National Laboratories, Albuquerque, New Mexico, May 30. [SRDB Ref ID: 27228, p. 3]
Stout, K., 2005, “SNL Xray History,” e-mail to R. L. Kathren (Oak Ridge Associated Universities Team), Sandia Corporation, Sandia National Laboratories, Albuquerque, New Mexico, December 14. [SRDB Ref ID: 26800]
TEA (Trinity Engineering Associates), 2007, CAP88-PC Version 3.0 User Guide, Cincinnati, Ohio, December 9. [SRDB Ref ID: 100356]
Thompson, D., 2007, “2/15/07 discussion on Sandia records,” excerpted e-mail to R. S. Argall (Oak Ridge Associated Universities Team), February. [SRDB Ref ID: 45054]
Thompson, D. J., G. E. Tucker Jr., and B. R. Armijo, 1972, “Characteristics of the Harshaw TLD Cards as Used at Sandia Laboratories,” Abstract SC-DC-72 1430A, Sandia Corporation, Sandia Laboratories, Albuquerque, New Mexico. [SRDB Ref ID: 24007]
Traub, R. J., R. I. Scherpelz, and T. D. Taulbee, 2005, Personal Dose Equivalent Rates from Three Plutonium Objects, PNWD-3544, Rev. 00, Pacific Northwest National Laboratory, Richland, Washington, March. [SRDB Ref ID: 24747]

Document No. ORAUT-TKBS-0037 Revision No. 01 Effective Date: 01/25/2013 Page 116 of 120 Tucker Jr., G. E., 1970, “Request for RADEX Program Modifications,” memorandum to W. A.
Gardner, Sandia Corporation, Sandia Laboratories, Albuquerque, New Mexico, July 28. [SRDB Ref ID: 23830, pp. 2-7]
Tucker Jr., G. E., 1977, “Division 3313 Progress Report - Second Quarter 1977,” memorandum to W. H. Kingsley, Sandia Corporation, Sandia Laboratories, Livermore, California, July 6. [SRDB Ref ID: 23710]
Tucker, G.E., and R.W. Drake, 1960, Industrial Hygiene Division Film Dosimetry Manual, Sandia Corporation, Sandia Base, Albuquerque, New Mexico, July 15. [SRDB Ref ID: 23869]
Tucker Jr., G. E., and M. W. Tucker, 1965, “Washington, D. C. Trip Report, March 24 – 26, 1965,” memo of record, Sandia Corporation, Sandia Laboratories, Albuquerque, New Mexico, April 27. [SRDB Ref ID: 19622]
Ullrich, R. A., 1998, Tech Area II: A History, SAND98-1617, Ktech Corporation, Sandia National Laboratories, Albuquerque, New Mexico, July. [SRDB Ref ID: 6505]
Ullrich, R., 1999, A History of Building 828, Sandia National Laboratories, SAND99-1941, Sandia Corporation, Sandia National Laboratories, Albuquerque, New Mexico, August. [SRDB Ref ID: 6507]
UC (University of California), 1978, Quarterly Progress Report, April – June 1978, Los Alamos Scientific Laboratory, Los Alamos, New Mexico. [SRDB Ref ID: 13472]
UC (University of California), 1979, Evaluation of Polonium-210 Exposures for Termination Reports, Los Alamos, New Mexico, August 1. [SRDB Ref ID: 14519]
VanDevender, J. P., 1984, “Clarification of Org. 1200’s Toxic and Radioactive Machining Support,” memorandum to J. C. King, Sandia Corporation, Sandia National Laboratories, Albuquerque, New Mexico, December 19. [SRDB Ref ID: 19606, pp. 3-5]
Vosburg, S. K., 1993a, “Bioassay Results,” memorandum to M. R. Overstreet, Sandia Corporation, Sandia National Laboratories, Albuquerque, New Mexico, July 8. [SRDB Ref ID: 19303, p. 3]
Vosburg, S. K., 1993b, “Statement of Work for Bioassay Radiochemical Analysis Laboratory,” letter to S. Bakhtiar (Reynolds Electrical & Engineering Company, Inc.), Sandia Corporation, Sandia National Laboratories, Albuquerque, New Mexico, July 16. [SRDB Ref ID: 22864]
Wagner, K., S. Koss, S. Salinas, R. Sanchez, and L. Mayeux, 2003a, Calendar Year 2002 Annual Site Environmental Report, Sandia National Laboratories, New Mexico, SAND-2003-2549, Sandia Corporation, Sandia National Laboratories, Albuquerque, New Mexico, September. [SRDB Ref ID: 71595]
Wagner, K., S. Koss, S. Salinas, R. Sanchez, and L. Mayeux, 2003b, Calendar Year 2002 Annual Site Environmental Report for Tonopah Test Range, Nevada and Kauai Test Facility, Hawaii, SAND-2003-2550, Sandia Corporation, Sandia National Laboratories, Albuquerque, New Mexico, September. [SRDB Ref ID: 12511]
Wagner, K., S. Koss, S. Salinas, R. Sanchez, and L. Mayeux, 2004a, Calendar Year 2003 Annual Site Environmental Report, Sandia National Laboratories, New Mexico, SAND-2004-2813, Sandia Corporation, Sandia National Laboratories, Albuquerque, New Mexico, September. [SRDB Ref ID: 71596]

Document No. ORAUT-TKBS-0037 Revision No. 01 Effective Date: 01/25/2013 Page 117 of 120 Wagner, K., S. Koss, S. Salinas, R. Sanchez, and L. Mayeux, 2004b, Calendar Year 2003 Annual Site
Environmental Report for Tonopah Test Range, Nevada and Kauai Test Facility, Hawaii, SAND-2004-2812, Sandia Corporation, Sandia National Laboratories, Albuquerque, New Mexico, September. [SRDB Ref ID: 22378]
Wagner, K., S. Koss, S. Salinas, and T. Goering, 2006a, Calendar Year 2005 Annual Site Environmental Report for Sandia National Laboratories, New Mexico, SAND-2006-4506P, Sandia Corporation, Sandia National Laboratories, Albuquerque, New Mexico, September. [SRDB Ref ID: 44866]
Wagner, K., S. Koss, S. Salinas, and T. Goering, 2006b, Calendar Year 2005 Annual Site Environmental Report for Tonopah Test Range, Nevada and Kauai Test Facility, Hawaii, SAND-2006-4648P, Sandia Corporation, Sandia National Laboratories, Albuquerque, New Mexico, September. [SRDB Ref ID: 110493]
Wagner, K., S. Koss, S. Salinas, T. Goering, and A. Montoya, 2005a, Calendar Year 2004 Annual Site Environmental Report, Sandia National Laboratories, New Mexico, SAND-2005-4594, Sandia Corporation, Sandia National Laboratories, Albuquerque, New Mexico, September. [SRDB Ref ID: 71597]
Wagner, K., S. Koss, S. Salinas, T. Goering, and A. Montoya, 2005b, Calendar Year 2004 Annual Site Environmental Report for Tonopah Test Range, Nevada and Kauai Test Facility, Hawaii, SAND-2005-4628, Sandia Corporation, Sandia National Laboratories, Albuquerque, New Mexico, September. [SRDB Ref ID: 22364]
Walker, S. W., 1996, “Metrics report for the Period February 1, 1997 to February 28, 1997,” memorandum to D. Thompson, Sandia Corporation, Sandia National Laboratories, Albuquerque, New Mexico, March 11. [SRDB Ref ID: 19540]
Walker, S. W., 1997a. “Interim Processing Steps for EXTRAD and Model 8807 Dosimeters.” memorandum to L. Garcia-Larkin and J. Zamora, Sandia Corporation, Sandia National Laboratories, Albuquerque, New Mexico, August 11. [SRDB Ref ID: 19247]
Walker, S. W., 1997b, Lower Limit of Detection (LLD) for the Harshaw 8802 TLD, Sandia Corporation, Sandia National Laboratories, Albuquerque, New Mexico, February 10. [SRDB Ref ID: 23577, p. 194]
Ward, D.C., 1994, Inherent Radioactivity Study of Harshaw Model 8801 Style TLD Cards, Sandia Corporation, Sandia National Laboratories, Albuquerque, New Mexico, November 21. [SRDB Ref ID: 23578, p. 416]
Ward, D.C., 1995, Technical Basis Document for the Determination of Neutron Dose Conversion Factors, Sandia Corporation, Sandia National Laboratories, Albuquerque, New Mexico, October 18. [SRDB Ref ID: 23578, p. E-1]
Whicker, J. J., J. C. Rodgers, C. I. Fairchild, R. C. Scripsick, and R. C. Lopez, 1997, “Evaluation of Continuous Air Monitor Placement in a Plutonium Facility”, Health Physics, volume 72, pp. 734–743. [SRDB Ref ID: 13095]
Widner, T. E., 2008a, Analyses of Annual Dose Results for Sandia National Laboratories New Mexico Workers for 1949 through 2005 – Annual Dose Records 1959-84 Crystal Ball Spreadsheet, Oak Ridge Associated Universities Team, Oak Ridge, Tennessee. [SRDB Ref ID: 40080]]

Document No. ORAUT-TKBS-0037 Revision No. 01 Effective Date: 01/25/2013 Page 118 of 120 Widner, T. E., 2008b, Analyses of Annual Dose Results for Sandia National Laboratories New Mexico
Workers for 1949 through 2005 – Dose Data 1987-2005 Crystal Ball Spreadsheet, Oak Ridge Associated Universities Team, Oak Ridge, Tennessee. [SRDB Ref ID: 40091]
Widner, T. E., 2008c, Analyses of Annual Dose Results for Sandia National Laboratories New Mexico Workers for 1949 through 2005 – NonPen Dose 1977-1984 for Crystal Ball Spreadsheet, Oak Ridge Associated Universities Team, Oak Ridge, Tennessee. [SRDB Ref ID: 40100]
Wilson, R. H., J. J. Fix, W. V. Baumgartner, and L. L. Nichols, 1990, Description and Evaluation of the Hanford Personnel Dosimeter Program From 1944 Through 1989, PNL-7447, Pacific Northwest Laboratory, Richland, Washington, September. [SRDB Ref ID: 4793]
Document No. ORAUT-TKBS-0037 Revision No. 01 Effective Date: 01/25/2013 Page 119 of 120 GLOSSARY
aging In relation to reactor fuel and mixtures of plutonium isotopes, time since the step in the refinement process that separates americium from the mixture.
ALIAS A particle accelerator facility.
cohort Group of individuals selected for inclusion in a study.
depleted uranium (DU) Uranium with a percentage of 235U lower than the 0.7% found in natural uranium.
fabrication Manufacturing.
glovebox Enclosure with special rubber gloves through which an operator can handle radioactive or toxic material without risk of injury or contamination normally operated at a slightly reduced pressure so that air leakage, if any, is inward.
Hermes II High-energy, pulsed, field-emission, electron-beam or bremsstrahlung gamma ray generator.
hot cell Shielded laboratory for handling of radioactive materials with the aid of remotely operated manipulators. The walls and windows are made of materials that protect workers from radiation.
Hydramite II Dual-line, high-energy, short-pulse source for electron-beam or bremsstrahlung X-ray
Kiva One of the remotely controlled critical assembly buildings associated with the Critical Experiment Facility at LANL. From Hopi, ki- means house, but the meaning of -va is unknown.
particle accelerator Device that accelerates ions using magnetic and/or electrostatic fields for focusing and redirecting ion beams. The main purposes of accelerators are the investigation of high-energy particle behavior and production of synthetic isotopes.
reactor Device in which a fission chain reaction occurs under controlled conditions to produce heat or useful radiation for experimental purposes or to generate electrical power or nuclear fuel.
simulated 24-hour urine sample Collection of all urine samples beginning with the void before retiring for the evening and ending with the first void after rising the next morning, for two consecutive nights, to simulate a 24-hour urine sample.

Document No. ORAUT-TKBS-0037 Revision No. 01 Effective Date: 01/25/2013 Page 120 of 120 SPEED
High-energy, very-short-pulse bremsstrahlung X-ray accelerator.
TROLL A particle accelerator facility.