saurashtra universityetheses.saurashtrauniversity.edu/862/1/thaker_cm_thesis_physics.pdf · shri...
TRANSCRIPT

Saurashtra University Re – Accredited Grade ‘B’ by NAAC (CGPA 2.93)
Thaker, Chetan M., 2005, “Studies on the Magneto-transport properties of perovskite based Colossal Magneto Resistance (CMR)”, thesis PhD, Saurashtra University
http://etheses.saurashtrauniversity.edu/id/862 Copyright and moral rights for this thesis are retained by the author A copy can be downloaded for personal non-commercial research or study, without prior permission or charge. This thesis cannot be reproduced or quoted extensively from without first obtaining permission in writing from the Author. The content must not be changed in any way or sold commercially in any format or medium without the formal permission of the Author When referring to this work, full bibliographic details including the author, title, awarding institution and date of the thesis must be given.
Saurashtra University Theses Service http://etheses.saurashtrauniversity.edu
© The Author
Studies on the MagnetoStudies on the MagnetoStudies on the MagnetoStudies on the Magneto----transport properties of transport properties of transport properties of transport properties of perovskite based Colossal Magneto Resistance (CMR) perovskite based Colossal Magneto Resistance (CMR) perovskite based Colossal Magneto Resistance (CMR) perovskite based Colossal Magneto Resistance (CMR)
materialsmaterialsmaterialsmaterials
THESIS THESIS THESIS THESIS
Submitted to
Saurashtra University, Rajkot, IndiaSaurashtra University, Rajkot, IndiaSaurashtra University, Rajkot, IndiaSaurashtra University, Rajkot, India
For the Degree of
Doctor of Philosophy
in Science
in the subject of Physics
By
Chetan M. ThakerChetan M. ThakerChetan M. ThakerChetan M. Thaker
Under the supervision of
Dr. D. G. Kuberkar Associate Professor
Department of Physics Saurashtra University
Rajkot, India
October 2005

STATEMENT UNDER O. Ph. D. 7 OF THE SAURASHTRA UNIVERSITY
This is certified that the work presented in the thesis is my own work,
carried out under the supervision of Dr. D. G. Kuberkar and leads to some
important contributions in Physics supported by necessary references.
Chetan M. Thaker (Research Student)
This is to certify that the work submitted for Ph.D. degree in Physics
to Saurashtra University, Rajkot by Mr. Chetan M. Thaker has been the
result of more than three years of work under my supervision and is a good
contribution in the field of Solid State Physics and Materials Science.
Dr. D. G. Kuberkar (Research Guide)
Associate Professor Department of Physics Saurashtra University
Rajkot

Dedicated to
My Family
consisting of broad spectrum of teachers, friends consisting of broad spectrum of teachers, friends consisting of broad spectrum of teachers, friends consisting of broad spectrum of teachers, friends
& well& well& well& well----wisherswisherswisherswishers

Acknowledgements
“Right knowledge is the supreme purifier, the greatest secret of all the Vedas and gods”
Shri Adi Sankaracharya
It gives me immense pleasure to express my deep sense of regards to my research
guide Dr. D. G. KUBERKAR for his valuable guidance throughout the path of my research.
Working with him, has indeed helped me to mature, both, as a student and a humanbeing.
It also gives me a great pleasure to express my bottomless regards to Prof. S. I. Patil,
Department of Physics, Pune and his group members Dr. K. P. Adhi, Dr. Arun Banporkar,
Dr. Limaye and research students Mr. Mandar Sahastrabudhe, Mr. Pankaj Sagdeo and
Mr. S. Sadakale. I shall never forget their humbleness during the time of earthquake crisis by
providing me research facilities and academic guidance.
My sincere regards to present and past Heads of the Department of Physics,
Saurashtra University for providing me the departmental facilities. I also wish to extend my
acknowledgements to all the faculty members of the Department for their moral support.
Specially, I am thankful to Dr. J. A. Bhalodia and Dr. N. A. Shah of this department
for providing me moral support during this work.
I am sincerely thankful to Prof. S. K. Malik, DCMP & MS, T I F R, Mumbai for
extending PPMS experimental facility and to Prof. S. K. Date, NCL, Pune for the
experimental help and giving his valuable time for technical discussions during my visit to his
laboratory.
I am thankful to Principal and staff members of M. D. Science College, Porbandar
and Principal, Dr. A.V. Doshi and the staff members of M. V. M. Sc. &H. Sc. College, Rajkot.
I specially extend my deep regards to the trustees of my college.
Now, it is time to remember my research colleagues, Dr. Sudhindra Rayprol,
Dr. Krushna Mavani and especially Dr. D. S. Rana for the enjoyable moments like a family
during my research. I could gain subject knowledge by the way of fruitful interactions with
them. I also express my deep feelings for Mr. Jaysukh Markna, Ms. Rohini Parmar who have
taken care of painstaking computational work. Also I thank Prashant, Piyush, Rujuta and
Jayesh for providing me friendly atmosphere during the time of work. I would like to
remember my friends Bharat Kataria, Suresh Dalsania and Dhiren Pandya. I remember all
the Ph.D. students of the Department of Chemistry especially my student friends Niral Mehta
(Pappu), Bhavin Thanki (Tom) and Dushyant Purohit who have helped me for the iodometric
titration measurements.
My acknowledgements are also due for Mrs. Preeti D. Kuberkar and Ms. Madhura
Kuberkar for the homely reception and hospitality given to me during my stay at Rajkot..

I feel short of words when I put on record the efforts of my family members in
supporting me throughout these years with all the hardships they have faced for me. My
heartfelt regards to my parents Mr. M. K.Thaker, Mrs. Bhagulata M.Thaker, G. K. Thaker
and Mrs. Rekha G. Thaker. I pay tribute to my beloved late grandfather and late
grandmother. I wish to thank my brother in law Mr. Yashawant and Mr. Milan. I also thank to
my mother in law Ms. Vijyaben Jani for the hospitality during the time of research.
Last but not least, I have no words to express my feelings for my wife MEERA and my
beloved son UTSAV at the time of this submission who understood me through out my
research career.
Chetan M. Thaker

I thankfully acknowledge University Grants Commission (UGC), New
Delhi, India for providing me Teacher fellowship during April 2000 - March
2002 under the UGC - FIP IX plan program.
October, 2005October, 2005October, 2005October, 2005 Chetan M. ThakerChetan M. ThakerChetan M. ThakerChetan M. Thaker

Abstract
The discovery of phenomenon of magneto resistance (MR) which is measure of
resistivity drop when subjected to magnetic field and its potentiality in application in
magnetic memory devices has spurred an interest in scientific community to synthesize
new materials exhibiting large magneto resistance. The studies on property of MR in
metals, semiconductors and alloys became field of interest. The discovery of “giant
magneto resistance” observed in artificially grown alternate ferromagnetic and non-
magnetic metallic layers such as Fe/Cr, Cu/Cr as high as 75% under larger fields triggered
the new era of research for still better materials. The next breakthrough in MR materials
came with the observance of MR effect in rare earth manganite oxides. In 1993, R. Von
Helmolt et. al discovered that La2/3Ba1/3MnO3 exhibit huge magneto resistance around
room temperature with many interesting inter related phenomena. The strength of MR in
many similar polycrystalline compounds as high as 90% under a few Tesla led the
scientists to coin a new term called “colossal magneto resistance (CMR)”. The strength of
CMR effect in the metallic oxides induced interest in researchers to exploit these
compounds for the possible application. Unlike artificially grown metallic multilayers
where extrinsic factors such as the interface between the two layers, roughness and grain
structure govern the magneto resistance, these compounds have ionic size dependent
intrinsic property responsible for colossal magneto resistance. This intrinsic factor in this
ABO3 type of perovskite, with limits on the size of A and B site cations for occurrence of
CMR effect, can be controlled by the compositional changes in the compound. The
interplay with size of the cations to alter the MR properties of the manganite perovskites
evolved plenty of scope in further research in related materials.
The basic manganite oxide ReMnO3 where Re = La, Pr, Nd is a paramagnetic
insulator at all the temperatures. It, however, exhibits paramagnetic to antiferromagnetic
transition around 150 K. The optimum divalent cation doping at A site drives the
resulting material to exhibit properties such as coincident insulator – metal (I-M)
transition and paramagnetic – ferromagnetic (PM-FM) transition. The maximum CMR
effect occurs around this coincident transition temperature. Re and Mn ions exist in +3
oxidation state in ReMnO3 perovskite. The divalent Ca2+, Sr2+, Ba2+ and Pb2+ cations
substitution at A site drives Mn at B site to exist in mixed valent (Mn3+/Mn4+) state which
is responsible for most of the transport and magnetic properties of the perovskite. Due this
mixed valent state of Mn, these compounds are also called as mixed valent manganite
oxides. The conduction in these oxides is explained by a phenomenon discovered by C.
Zener in 1951 called as “Zener-Double Exchange (ZDE)”. All the transport mechanisms
such as ZDE occur through Mn – O – Mn network, where as A cation is not directly
involved in any conduction mechanism. The Mn4+ valence state is formed due to
substitution of same amount divalent cation at A-site. The 3d shell of Mn has non-
degenerate spin up and spin down states. Four of the 5d spin up orbitals is filled while all
the spin down orbitals are vacant in Mn3+ ion. The crystal field of oxygen lifts the
degeneracy of the 5d orbitals and results in splitting into lower energy 3 t2g and higher
energy 2 eg orbitals. The 2 eg orbitals are further split into two energy levels called Jahn –
Teller splitting that cause orbital ordering of MnO6 octahedra along the planes where last
filled electron lies just at the fermi level. The hole doping removes Jahn – Teller distortion
along the planes. At Mn3+ - O2- – Mn4+ coupling, the last eg electron in Mn3+ feels a net
energy difference and it becomes delocalized via O2- to Mn4+. This process of Zener
Double exchange accounts for both the metallic and ferromagnetic character of the
material below a certain temperature called transition temperature. The phenomenon of
ZDE is possible only if the spins of the alternate manganese ions are aligned parallel.
The electrical and magnetic transitions start appearing only after a certain amount
of Mn4+ has been created and disappears at excess doping of divalent cation. The best
transport and magnetic properties appear for Re1-xAxMnO3; x = 0.33 substituted system.
The maximum magnetic disorder occurs at transition temperature, so the application of
magnetic field forces the parallel alignment of spins causing huge drop in resistivity to
favor ZDE and hence maximum CMR effect. The lattice electron coupling or the polaron
formation localizes the eg electron to show insulating behavior above Tc. The A site cation

radius distorts the structure of the perovskite that controls the buckling of the Mn-O
bonds. The smaller size cation buckles Mn-O-Mn bond angle from its ideal 180-degree
geometry. The various inter-related phenomena can be summarized as follows. The
divalent doping in orbital ordered ReMnO3 perovskite removes the distortion of the MnO6
octahedra, the lattice electron coupling above transition temperature makes the manganite
system paramagnetic insulator, competition between ZDE and super-exchange results in
peak resistivity, ZDE below Tc explains the ferromagnetic metallic character, the charge
ordering at half doped system makes the system antiferromagnetic insulator at second
order transition and the maximum CMR effect at magnetically disordered region near the
transition temperature.
As stated earlier, A site cation does not involve in any conduction mechanism but
has its ionic size effect on the transport and magnetic properties. A parameter called as
“Goldschimdt tolerance factor” relates the different site ionic radii to the transition
temperature. It is given as
t = (<rA> + rO) / √2(<rB>+rO)
Where,
<rA> = average A site cation radius
<rB> = average B site cation radius
rO = radius of oxygen anion
t is 1 for ideal cubic structure perovskites. Electrical and magnetic transition occur
for 0.90<t<1, where structural transitions from cubic to rhombohedral to monoclinic to
orthorhombic occur as t approaches from 1 to 0.90. Since doping at B site directly
impedes the conduction process, it is very sensitive to unlike cation and only a small
amount of substitution is sufficient to alter the transport properties of manganites.
Comparatively, the doping at A site can be done more flexibly in large range of doping
concentrations. The isovalent light rare earth substitutional studies have been done by
various researchers to study the effect of cation size mismatch and average A site cation
radius effect on the electronic and magnetic transitions. Only some light rare earth like La,
Pr, Nd and Sm based manganite systems show the CMR properties whereas heavy rare

earth like Gd, Ho, Dy etc. due to smaller ionic radii results in the buckling of Mn – O
bonds significantly such that eg band itinerant electron gets localized permanently to their
parent atoms. However, these heavy rare earth metals have been replaced partially with A
site cation with a fixed carrier density.
Depending upon the transition temperatures and related CMR effect, the manganite
systems have been classified as low bandwidth, intermediate bandwidth and large
bandwidth manganite systems. The system such as Pr1-xCaxMnO3 in which ferromagnetic
metallic state is not stabilized and a ferromagnetic insulating state exists in the range
between x = 0.15 – 0.30 are classified as low bandwidth manganite systems. This system
represents a stable charge-ordered state in a broad density region between x = 0.30 – 0.75.
These manganites exhibit I-M transition when subjected to magnetic field, pressure and
when exposed to X-rays. Since there is large buckling at Mn-O bond due to smaller size
of Pr, the application of even weaker magnetic field results in significant amount of CMR
effect. The manganite like La0.7Sr0.3MnO3 shows the transition temperature well above the
room temperature around 370 K, so labeled as large bandwidth manganite system. It is
believed that, in this compound the hopping amplitude for electrons in eg band is larger
than in other manganites as a consequence of the sizes of the ions involved in chemical
compositions. Large bandwidth systems have spins almost parallel at the Mn-O couplings,
so the application of magnetic field does not produce any significant change in resistivity
in already magnetically ordered region. The drawback of large bandwidth system is that,
the large transition temperature is coupled to small CMR effect that has restricted these
materials from application point of view. The third type of manganite system that has
characteristics of both the low and large bandwidth systems and in which the research is
being carried out by a sizeable fraction of researchers is called as intermediate bandwidth
manganite system. La1-xCaxMnO3 is a typical example of such a system. This compound
represents the presence of robust ferromagnetic metallic state. It has also features that
represent deviation from double-exchange behavior, including the existence of charge
ordered and orbital ordered state. Recently the work is also being focused on intermediate

to low bandwidth materials since these are the ones that exhibit the largest CMR effect,
which is associated with the presence of charge ordering tendencies.
Along with the hole-doped manganite systems, efforts have been put to investigate
the possibility of obtaining colossal magneto resistance in electron-doped manganites. The
compounds like La0.7Ce0.3MnO3 have been found to exhibit several interesting transport
and magnetic properties that made the scientific community to synthesize and characterize
more electron doped systems. In hole doped systems when average charge on A site is
reduced the manganese ions go in a mixture of Mn3+/Mn4+ valence states. On the other
hand, in electron-doped systems the average charge on A site is increased by aliovalent
cation doping at rare earth site. The increased charge on A site will be able to drive the
manganese ions in a mixture of Mn3+/Mn2+ states. Mn 2+ valence state of manganese is,
like Mn4+ valence state, a non Jahn – Teller ion. The process of Zener Double Exchange
should operate between two adjacent Mn3+ and Mn2+ ions in the same way as it operates
between Mn3+ and Mn4+ ions. One would, therefore, expect electron-doped manganites to
exhibit metal – insulator transition and ferromagnetism associated with colossal magneto
resistance.
Keeping in mind the role of A-site cation doping in modifying the structural,
transport and magnetic properties of intermediate bandwidth system like L1-
2xPrxCaxMnO3, an attempt is made to investigate above mentioned properties of this
system in the context of variation in magnetic and electrical transition temperatures and
magneto resistance using X-ray diffraction, resistivity, magnetization, and magneto
resistance studies. Also, during the course of present work, the effect of substitution of
divalent cations like Ca, Sr and Ba at A site is studied in the light of change in structural,
transport, magneto transport and magnetic behavior of the system under investigation.
Present work also comprise of research efforts carried out on the possible role of electron
doping at A site due to higher valence cations like Ce4+, Th4+ and Mo6+ etc. in modifying
and observing the CMR effect in Re1-xAxMnO3; A = Th and Mo.

Contents of the thesis – An overview
The first chapter of the thesis deals with the introduction to the subject, historical
development of the manganite oxides, the definition of colossal magneto resistance,
various phenomena and mechanisms governing mixed valent manganite oxides. Second
chapter comprise of the synthesis, characterization techniques and tool used to study CMR
materials. Chapter 3 is focused on the study of simultaneous doping of Pr and Ca in
LaMnO3 perovskite. The simultaneous doping of Pr and Ca are interesting to study the
effect of carrier density and cation size on the transport, magneto transport and magnetic
properties of the system. Chapter 4 deals with effect of larger size divalent cation like Sr
and Ba doping on transition temperatures and CMR effect in carrier concentration
optimized compositions. Chapter 5 describes the results pf the studies on the different
electron doped systems. More than +1 aliovalent cation substitution induces the transport
and magnetic properties of the CMR materials in the resulting system. It also includes a
section that deals with the doping of Th4+ at Re3+ site that makes it an electron-doped
system in LaMnO3 perovskite. In nutshell, this chapter focuses on our effort to establish
an electron-doped system exhibiting CMR properties.
Following is a brief discussion of the different manganite systems studied
during the course of present doctoral work.
Chapter 1-2 Introduces to manganite and synthesis and characterization techniques,
experimental tools used in the present work.
Chapter 3 is devoted to the Pr-Ca doped La1-2xPrxCaxMnO3 (x = 0.00 – 0.30) manganite
system.
The effect of divalent cations like Ca2+, Sr2+, Ba2+ etc is well studied, as different
concentrations of divalent cation are responsible for the amount of charge carrier density.
It is established that 33% percent hole doped system shows the best transport and
magnetic properties. The cation sizes of Ca2+ and La3+ are comparable, so the different
amount of divalent cation, Ca2+, doping shows only the effect of carrier density. The
simultaneous substitution of Pr – Ca is aimed to elucidate simultaneously the effect of
cation size and carrier density on the transport and magnetic properties of the resulting
system. Pr being smaller cation reduces the average size of the A site cation and has
inherent property of mixed phase formation. Due to reduced average ionic size, the system
lies between intermediate and low bandwidth manganites. The CMR effect will be
interesting factor as nearly low bandwidth manganite category shows maximum MR% at
relatively weaker fields.
Chapter 4 Devoted to the bandwidth modification by Sr2+ and Ba2+ substitution in
La0.5Pr0.2Ca0.3MnO3 manganite.
Sr2+ and Ba2+ being larger size cations, modify the bandwidth of the parent
manganite. The substitution of these cations increase the eg band electron hopping
amplitude and hence enhance the transition temperatures along with structural
transformations. The substitution of these cations is aimed at reviving the transition
temperature up to room temperature. The La0.5Pr0.2Ca0.3MnO3 manganite exhibits
transition temperature around 135K with large CMR effect under relatively weaker fields.
This composition shows 47% of CMR effect under just 1 Tesla field. This huge CMR
effect prompted us to modify the bandwidth by larger size cation substitution and its
possible effect on the electronic transitions and magnetic properties. Since only a small
amount of Sr2+ doping may increase the transition temperature significantly, it becomes
imperative to observe the relation between the Tc, CMR effect and magnetization in the
applied fields. Similar to the effect of Sr2+ substitution, substitution of Ba2+ at A site will
help us to under stand whether the average A site cation radius plays a prominent role or
the individual effect of cations dominate in defining the electrical and magnetic transition
temperatures.
Chapter 5 is devoted to electron doped manganite systems.
There have been lots of efforts to establish electron-doped systems, exhibiting the
properties similar to hole doped systems but the success is partially achieved. La1-
xCexMnO3 electron doped system is the one, which has been widely studied to exhibit
most of the inter-related properties, like that in hole doped systems. We synthesized
Y0.8Mo0.2MnO3 and investigated the effect of more than +1 aliovalent cation substitution
on the structural and electronic behavior. The synthesis of thorium-doped manganite with

stoichiometric compositions Re1-xThxMnO3; Re = La, Nd further reflects our efforts to still
find a scope to establish the electron doped systems. The drawback in all the electron-
doped systems is limitation in purity of structural phase formation. Still these systems
have exhibited some interesting properties to be discussed in detail in thesis.

SCOPE FOR THE FUTURE WORK
The structural, transport and magnetotransport measurements on Pr-Ca doped LPCMO
and Pr-Ca/Ba/Sr doped LPCMO, LPCSMO and LPCBMO systems of manganites have
revealed several interesting properties of these compounds from the fundamental
understanding of the cause of CMR behavior, structure-property correlation and the
application potentiality of some of them based on the observation of pronounced MR behavior
in relatively low applied magnetic fields. Also, the results of the studies on obtaining single
phase electron doped manganite system have lead to explore the possibility of synthesizing
them using Chemical Solution Deposition (CSD) technique.
From the point of view of future scope of fundamental work on the similar manganite
systems, it would be interesting to perform temperature dependant Neutron Diffraction (ND)
measurements and its magnetic refinement for understanding the nature and cause of
magnetic phase transitions exhibited by these materials. In addition, one should try to study
the effect of Swift Heavy Ion (SHI) irradiation on the modifications in microstructural and
magnetotransport behavior of doped manganites.
From application point of view, it would be interesting to grow the multilayered thin
film structures of the type LPSMO/Al2O3/LPSMO, to increase the MR, TCR and FCR
property of these compounds.
At the end, it can be mentioned that, the interesting results obtained during the course
of present work will lead to further useful investigations in the manganite research.


Index
Contents Page Nos.
Chapter Chapter Chapter Chapter –––– 1 1 1 1
Introduction to Magneto resistance materials
1.1 Magnetism based technology I-1
1.1.1 Magnetic recording technology I-1
1.1.2 Materials exhibiting magneto resistance I-1
1.1.3 Giant Magneto resistance (GMR) and Colossal I-3
Magneto resistance (CMR).
1.2 Origin of magneto resistance in manganite perovskites I-6
1.2.1 The structural and magnetic properties of I-6
Re1-xAxMnO3 perovskite
1.2.2 Zener-Double Exchange mechanism I-7
1.2.3 Various mechanisms and properties of manganite I-8
perovskites
1.2.4 Phase diagrams of LCMO and LSMO systems I-13
1.2.5 Literature survey I-15
1.3 Application of CMR materials I-19
1.4 Motivation of the present work I-21
References I-25
ChaChaChaChapter pter pter pter ---- 2 2 2 2
Experimental methods and techniques for characterization of mixed
valent manganites.
2.1 Synthesis techniques II-1
2.1.1 Solid-state reaction route II-1
2.1.2 Sol-gel method II-3
2.2 Structural determination methods II-4
2.2.1 X-ray diffraction method II-4
2.2.2 Neutron diffraction method II-7

2.2.3 Scanning Electron Microscopy (SEM) II-8
2.3 Transport and magneto transport measurements II-11
2.3.1 Standard four probe resistance measurements II-11
2.3.2 Magneto resistance measurements II-12
2.4 Magnetic property measurements II-12
2.4.1 a.c. susceptibility measurements II-12
2.4.2 d.c magnetization measurements II-12
2.4.3 Hysteresis effects using Vibrating Sample II-12
Magnetometer and SQUID
References II-17
Chapter Chapter Chapter Chapter ---- 3 3 3 3
Transport and magnetic properties of nearly low bandwidth
La1-2xPrxCaxMnO3 manganites.
3.1 Studies on nearly low bandwidth La1-2xPrxCaxMnO3
manganites. III-1
3.1.1 Structural Studies III-3
3.2 Transport and magnetotransport measurements III-6
3.2.1 Transport property III-6
3.2.2 Magneto resistance under different fields III-11
3.3 Magnetization measurements III-14
3.3.1 a.c. susceptibility measurements III-14
3.3.2 FC and ZFC magnetization measurements III-16
3.3.3 Hysteresis effects III-16
3.4 Results and discussion III-18
3.5 Conclusion III-19
References III-20
Chapter Chapter Chapter Chapter ---- 4 4 4 4
Effect of bandwidth modification by Sr and Ba substitution in
La0.5Pr0.2Ca0.3MnO3 manganite system

4.1 Studies on LPCSMO IV-2
4.1.1 Experimental details & Structural studies IV-2
4.1.2 Electronic transport and magnetoresistance IV-4
4.1.3 Magnetization IV-8
4.2 Studies on LPCBMO IV-9
4.2.1 Experimental details IV-10
4.2.2 Structural studies IV-11
4.2.3 Electrical resistivity IV-14
4.2.4 Magnetization measurements IV-16
4.2.5 Magnetoresistance measurements IV-21
4.3 Comparative study of LPCSMO and LPCBMO IV-24
4.4 Conclusions IV-28
References IV-29
Chapter Chapter Chapter Chapter ---- 5 5 5 5
Investigations on transport and magnetic properties of electron
doped systems
5.1 Anomalous behavior in Y0.8Mo0.2MnO3 manganite. V-1
5.1.1 XRD measurements V-1
5.1.2 R – T and magneto R – T measurements V-3
5.1.3 F.C and Z.F.C. Magnetization measurements V-3
5.1.4 Results and discussion V-4
5.2 Studies on Re1-xThxMnO3 manganite system V-5
5.2.1 XRD measurements V-6
5.2.2 R – T measurements V-9
5.2.3 Magnetization measurements V-11
5.3 Results and discussion V-13
5.4 Conclusion V-15
References V-17
Scope for the future work


Chapter Chapter Chapter Chapter –––– I I I I

I - 1
Introduction to Magneto resistance materials
Introduction to Magneto resistance materials
1.1 Magnetism based technology
The most promising MRAM consist of memory cells based on magnetic tunnel
junctions (MTJ). The underlying physical principle differs from that of GMR. In an MTJ,
two ferromagnetic layers are separated by an insulating tunnel barrier. Under a small-
applied voltage, electronic current can pass perpendicularly through the device by
tunneling across the insulating barrier (in contrast with all other devices mentioned above
for which the current flow is horizontal). The ease with which the current can tunnel
depends on the relative magnetization of the two ferromagnetic layers. When the
magnetizations in the two layers point in the same direction, there is a high probability that
electrons can tunnel and the resistance of the memory is low while in the case of opposite
directions, the resistance of the memory is high.
1.1.1 Magnetic recording technology
However the GMR head works in a nutshell (without getting into quantum physics
that would make your brain melt-and mine. ) When the head passes over a magnetic field
of one polarity (say, a "0" on the disk), the free layer has its electrons turn to be aligned
with those of the pinned layer; this creates a lower resistance in the entire head structure.
When the head passes over a magnetic field of the opposite polarity ("1"), the electrons in
the free layer rotate so that they are not aligned with those of the pinned layer. This causes
an increase in the resistance of the overall structure. The resistance changes are caused by
changes to the spin characteristics of electrons in the free layer, and for this reason, IBM
has named these structures spin valves. If you imagine a plumbing pipe with a rotatable
shut-off valve, that's the general concept behind the name.
1.1.2 Materials exhibiting magnetoresistance
The discovery of phenomenon of magnetoresistance (MR), a measure of
resistivity drop when subjected to the magnetic field and its potentiality in applications in
magnetic memory devices, has spurred an interest in the scientific community to
synthesize new materials exhibiting large magnetoresistance, under low fields at room
temperature.

I - 2
Introduction to Magneto resistance materials
The colossal magnetoresistance (CMR), as the name implies, is the phenomenon
of dramatic changes in resistance attained upon application of a magnetic field. Although
it was discovered nearly half a century ago [1], there has been heightened interest in the
past few years, not only from a fundamental point of view but also from applications point
of view.
The MR phenomenon was first reported in 1879 by Edwin Hall, known as
Hall – effect [2] in which it was found that, when a conductor is placed in magnetic field
(Hx) perpendicular to the direction of current flow (Jy), voltage (Ez) develops across the
conductor. The field along the conductor Ey is proportional to the current density Jy so
that, ρ(H) = Ey / Hx. This expression gives the magnetoresistance MR often called as the
Hall Effect (HE) which describes the magnetotransport phenomenon.
a. Magnetoresistance in metals and alloys
Free electron theory assumed that the resistance of a conductor perpendicular to
the uniform magnetic field should not depend upon the strength of the field. However it
does not show any magnetoresistance due to asymmetric nature of Fermi surface. But in
certain cases like copper, silver and gold a small transverse magnetoresistance can be
observed, normally less than 1% under few Tesla magnetic fields.
In fact, no single feature of the material or theory can explain the entire MR
phenomenon. In normal metals, the Lorentz force is the cause of deviation of electrons
trajectories.
The situation is drastically different in magnetic metals and alloys. Here the effect
of Lorentz force is too small with respect of the additional effects that contribute to MR.
b. Magnetoresistance in semiconductors
The large MR has been observed in doped magnetic semiconductors, such as
Cd1-xMnxSe. In these types of materials, MR is maximum when the carrier concentration is
critical across the metal-insulator boundary because of spin-dependent scattering.

I - 3
Introduction to Magneto resistance materials
c. Magnetoresistance in alloys
The mixture of gold and gadolinium such as Au0.05Gd alloy exhibits isotropic
negative magnetoresistance due to the exchange scattering. But in the case of Au0.98Tb
alloy, magnetoresistance predominantly arise from quadrupole scattering giving positive
and negative values for longitudinal and transverse fields, respectively.
d. Magnetoresistance in magnetic multilayers and oxides
The giant magnetoresistance (GMR) was discovered in 1988 by Baibich et al [3]
in which, the resistance of certain ferromagnetic metals such as Fe and Co drops
dramatically as a magnetic field is applied. It is described as a giant since it is much larger
effect than had ever been previously seen in metals. The effect is most usually seen in
magnetic-nonmagnetic multilayered structures [4].
The colossal magnetoresistance (CMR) is exhibited by manganite oxides and is
caused by the suppression of spin fluctuation in strong magnetic field, near a magnetic
transition temperature [5, 6]. Around ordering temperature, negative magnetoresistance
can reach value much larger even than GMR type materials which is correlated with
ferromagnetic ordering. An insulator to metal transition is found usually in the manganese
based perovskites type structure having general formula R1-xAxMnO3 (R: La, Pr, Sm, Nd,
Rare Earth metal: A= Sr, Ca, Ba, Pb). Magnetism and metallic behavior is based on double
exchange mechanism will be discussed in detail later in this chapter.
1.1.3. Giant magnetoresistance (GMR) and Colossal magnetoresistance (CMR)
a. GMR
The effect is mostly seen in magnetic multilayered structured, where two magnetic
layers are closely separated by a thin spacer layer a few nanometer thick [3,4]. It is
analogous to a polarization experiment. Suppose the first magnetic layer allows electrons
in only one spin state to pass through it easily and if second magnetic layer is aligned then
that spin channel can easily pass through the structure and the resistance is low enough. If
the second magnetic layer is misaligned then spin channel cannot get through the structure
easily and the electrical resistance is high [7].

I - 4
Introduction to Magneto resistance materials
The band structure in a ferromagnet is exchange split, so that the density of the
states is not the same for spin up and down electrons at Fermi level and hence the
scattering rates are different for electrons with different spins. Actually, these ideas were
used earlier in 1936 by Sir Nevill Mott to explain the sudden decrease in resistivity of
ferromagnetic metal as it was cooled through the Curie point.
b. CMR
In 1993, R. Von Helmolt et al [5] discovered that La2/3Ba1/3MnO3 exhibit huge
magnetoresistance around room temperature with many interesting inter related
phenomena. The strength of MR observed in many similar polycrystalline compounds as
high as 90% under a few Tesla led the scientists to coin a new term called “colossal
magneto resistance (CMR)” [5-8]. The observation of CMR effect in the metallic oxides
induced interest in researchers to exploit these compounds for the possible applications.
Unlike artificially grown metallic multilayers where extrinsic factors such as the interface
between the two layers, roughness and grain structure govern the magnetoresistance, these
compounds have ionic size dependent intrinsic properties responsible for colossal
magnetoresistance. These intrinsic factors in this ABO3 type of perovskite, with limits on
the size of A and B site cations for occurrence of CMR effect, can be controlled by the
compositional changes in the compound [7]. The interplay with size of the cations to alter
the MR properties of the manganite perovskites evolved plenty of scope in further research
in related materials.
The basic manganite oxide ReMnO3 where Re = La, Pr, Nd is a paramagnetic
insulator at all the temperatures, however, exhibits paramagnetic to antiferromagnetic
transition around 150 K. The optimum divalent cation doping at A site drives the resulting
material to exhibit properties such as coincident insulator – metal (I-M) transition and
paramagnetic – ferromagnetic (PM-FM) transition. The maximum CMR effect occurs
around this coincident transition temperature. Re and Mn ions exist in +3 oxidation state in
ReMnO3 perovskite. The divalent Ca2+
, Sr2+
, Ba2+
and Pb2+
cations substitution at A site
drives Mn at B site to exist in mixed valent (Mn3+
/Mn4+
) state which is responsible for
most of the transport and magnetic properties of the perovskite. Due this mixed valent
state of Mn, these compounds are also called as mixed valent manganite oxides. The
conduction in these oxides is explained by a phenomenon discovered by C. Zener in 1951

I - 5
Introduction to Magneto resistance materials
[9] called as “Zener-Double Exchange (ZDE)”. All the transport mechanisms such as ZDE
occur through Mn – O – Mn network, where as A cation is not directly involved in any
conduction mechanism. The Mn4+
valence state is formed due to substitution of same
amount of divalent cation at A-site. The octahedral crystal field of oxygen octahedra
(MnO6) lifts the five fold degenerate Mn 3d orbitals into three lower energy t2g (dxy, dyz &
dzx) and two higher energy eg (dx2
-y2, dz
2) orbitals. Further, the octahedral crystal field split
the two eg orbitals into two energy levels which is called Jahn – Teller splitting that cause
orbital ordering of MnO6 octahedra along the planes where last filled electron lies just at
the fermi level. The hole doping removes Jahn – Teller distortion along the planes. At
Mn3+
- O2-
- Mn4+
coupling, the last eg electron in Mn3+
feels a net energy difference and it
becomes delocalized via O2-
to Mn4+
. This process of Zener Double exchange accounts for
both the metallic and ferromagnetic character of the material below a certain temperature
called transition temperature [10]. The phenomenon of ZDE is possible only if the spins of
the alternate manganese ions are aligned parallel.
The A site cation in ABO3 type perovskite manganite does not involve in any
conduction mechanism but has its ionic size effect on the transport and magnetic
properties. A parameter called as “Goldschimdt tolerance factor” relates the different site
ionic radii to the transition temperature [7, 11]. It is given as
t = (<rA> + rO) / √2(<rB> + rO)
where, <rA> = average A site cation radius
<rB> = average B site cation radius
<rO> = radius of oxygen anion
The value of tolerance factor (t) is 1 for ideal cubic structure perovskites.
Electrical and magnetic transition occur for 0.90 < t < 1, where structural transitions from
cubic to rhombohedral to monoclinic to orthorhombic occur as t approaches from 1 to
0.90.

I - 6
Introduction to Magneto resistance materials
1.2 Origin of magnetoresistance in manganite perovskite
1.2.1 The structural and magnetic properties of Re(1-x)AxMnO3 perovskite
The physics of manganites is very rich. Manganites exhibit a variety of phases
such as paramagnetic state, ferromagnetic metal or insulator, antiferromagnetism, canted
antiferromagnetism and charge ordering. Several interesting phenomena including the
colossal MR are related to the metal-insulator and magnetic transitions between these
phases. Many properties of CMR materials can be tuned by external parameters such as
Figure 1.1 (a) The cubic perovskite structure. A – larger rare earth cations like La. B
– smaller cations like Mn, Co. O – Oxygen anion.
(b) The orthorhombic, rhombohedral and cubic unit cell of perovskite
structure. Ref [10].
temperature T, Magnetic field H or by the Chemical Pressure. Many striking electronic
properties of these systems are due to strong coupling of electrons to the dynamical lattice
distortions. The lattice is the crystal cell of the perovskite type.
The manganese oxides forms in the so-called perovskite crystal lattice (Fig. 1.1). It
is a body centered cubic (bcc) structure with a rare earth atom (for example La) at the
center (A-site), 8 Mn atoms at the corners (B-site) of the cubic cell and one atom oxygen
midway between each pair of Mn atoms. Each cubic cell comprises one La atom, One Mn
The valence of La (and other members of La family such as Pr) is +3, the valance of O in
I - 7
Introduction to Magneto resistance materials
atom (because only 1/8th
of each of 8 Mn atoms belongs to the cubic cell) and three O
atoms (because only 1/4th
of each of 12 oxygen atom belongs to the cell).
This composition is -2 so the valance of Mn should be +3 to fulfill the charge
neutrality. In other words, an undoped lanthanum manganite (LaMnO3) compound
corresponds to the ionic composition is La+3
,Mn+3
,O3-2
. The electronic configuration of
Mn atom is 3d5 4s
2, which means that the ionized Mn
+3 has 4d-electrons, which are
responsible for its electronic properties. The Jahn-Teller distortion is taking place at Mn+3
ion and plays significant role in the Metal-Insulator transition and ferromagnetic to
paramagnetic transition. Jahn-Teller (J-T) effect has been described later in this chapter. If
we substitute all trivalent rare earth La atoms by a divalent metal such as Ca, we will
obtain compound such as Ca+2
Mn+4
O3 with Mn valence +4. Thus, the Mn ion in the
CaMnO3 compound will have 3-d electrons. This compound also has the perovskite
structure. Both the perovskites, LaMnO3 and CaMnO3, are AFM insulator with
ferromagnetic (FM) n-planes of alternating spin direction [10,11]. For partial substitutions
of La system such as La1-xAxMnO3 (0<x<1), Mn ions are mixed valent and average
number of d-electrons at the Mn-site is 4-x. An exciting thing is that, although pure La and
pure Ca manganites are AFM insulators, the intermediate composition La1-xAxMnO3
exhibits strong magnetism over a broad range of carrier concentrations and temperatures
[7,10].
1.2.2 Zener double-exchange mechanism
It has reported that the lattice distortion brings down Tc by use of hole doping at
Ln-site (A-site). Hence Tc can be tuned by changing hole doping concentration and size of
ionic radius of divalent cation. Below Tc, the manganites exhibit metal-type conductivity,
and ferromagnetism around Tc. These behaviors are explained by Zener’s double exchange
mechanism [9]. The basic mechanism in this process is, the doping of a d-hole from Mn+4
or electron doping from d-shell of Mn+3
to Mn+4
like Mn+3
(d4,t2g
3,eg
1,S=2) to Mn
+4 (d
3,
t2g3,s=3/2) via the oxygen, so that the Mn
+3 and Mn
+4 ions change places [9,11].

I - 8
Introduction to Magneto resistance materials
Mn+3
O+2
Mn+4
----- Mn+4
O+2
Mn+3
Figure: 1.2 Schematic diagram of Zener Double Exchange mechanism
This creates the transfer of an electron from the Mn+3
site to the Central Oxide ion
and simultaneously the transfer of an electron from the oxide ion to the Mn+4
site. Such a
transfer is referred to as double-exchange (DE) [7].
1.2.3 Various mechanisms and properties of manganite perovskites
(a) Jahn-Teller (JT) effect
The rare-earth manganites such as LaMnO3, PrMnO3 and NdMnO3, without hole
doping are insulators at all temperatures as a consequence of crystal field at the cation sites
in the perovskite structure. In the ideal structure, both A and B sites have cubic point
symmetry m 3 m [11]. However, in the real distorted structure, the point symmetry is
much lower. These oxides undergo an antiferromagnetic (AFM) transition with TN ~ 150
K. The AFM ordering is of A-Type [7,10]. The Jahn-Teller distortion around Mn+3
ions is
related to the insulating nature of the compounds and anisotropic magnetic interaction in
the structure.
Figure: 1.3 Schematic diagram of band structure of J-T distortion

I - 9
Introduction to Magneto resistance materials
The structure plays a crucial role in determining the electric transport and magnetic
transport properties of these oxides. Because when these parent systems are partly
substituted by divalent ions at Ln site they became hole-doped. The Mn+4
content increase
resulting into decreasing (JT) distortion.
Figure 1.3 shows band diagram of LaMnO3, shows (JT) distortion splits the
conduction band and makes the material insulating.
In the energy level diagram for LaMnO3, the values of Eex, Ecf and EJT from
density functional calculation are around 1.5 – 2 eV and Fermi energy level lies between
JT split orbitals. [12,13]. The hole doping reduces JT distortion and makes the material
metallic for hole doping ≥ 0.18 [14]. The perovskite structure has an orthorhombic
distortion (b>a>c/√2) and unit cell consisting of 4-formula units can be mapped into Pbnm
or Pnma Symmetry.
(b) Tolerance factor
It has been clearly shown experimentally that for a fixed hole concentration, the
properties of manganites strongly depends on a geometrical quantity known as “tolerance
factor” [14,15], defined by t=dA-o/(√2dMn-o) here A-0 is the distance between A site,
where the trivalent or divalent non-Mn ions are located, to the nearest oxygen. A ion is at
the center of a cube with Mn in the vertices and O in between the Mn ions. dMn-o is the
Mn-O shortest distance. Since for an undistorted cube with a straight Mn-O-Mn link,
dA-o = √2 and dMn-o=1 in units of the Mn-O distance, the t=1 for the perfect system.
However, sometimes the A ions are too small to fill the space in the cube centers and for
this reason the oxygen tend to move toward the center, reducing dA-O. In general dMn-O also
changes at the same time. For this reason, the tolerance factor becomes less than unity t<1,
[7, 10] and Mn-O-Mn angle θ becomes smaller than 180o. The hopping amplitude for
carriers to move from Mn to Mn naturally decreases as θ < 180o. As the tolerance factor
decrease, the charge localization increases due to the reduction in the mobility of the
carriers. If the tolerance factor is reduced (t<1) then Mn-Mn distance is also reduced.
Therefore, it would be expected that having closer Mn-ions result into an increase the
electron hopping between them.

I - 10
Introduction to Magneto resistance materials
A detailed study on different Ln0.7A0.3MnO3 compounds for a variety of Ln and A
ions for the dependence of Tc on tolerance factor (t) shows the presence of three dominant
regimes (1) a paramagnetic insulator at high-temperature, (2) a low temperature
Figure: 1.4 Variation of Tc with tolerance factor (t) and average cation radius <rA>
ferromagnetic metal at large tolerance factor, and (3) low –temperature charge-ordered
ferromagnetic insulator at small tolerance factor fig. 1.4 [16]. The properties of doped
manganites are highly dependent on the tolerance factor (t).
(c) Electron-Lattice coupling
The structural and electronic properties of the perovskite crystal clearly have an
important effect on Curie temperature and magnetoresistance. However, interaction
between the charge carriers and vibrations of the crystal lattice say “phonons” also play a
crucial and fundamental role in changing the resistance as the temperature falls towards
the Curie temperature, of particular importance are the vibrations of lighter oxygen ions,
which push electron towards vacant states in the manganese ion. This strengthens the
Jahn-Teller effect and induces a local distortion of the lattice. Such a distortion is known
as a “polaron” and leads to self-trapping of the (it can be a source of the high resistivity)
charge carriers above the Curie temperature. Below the Curie temperature the self-
trapping disappears because the bandwidth broadens and the electrons are much more

I - 11
Introduction to Magneto resistance materials
mobile [15]. CMR effect is observed over a wide range of compositions of
La1-xCaxMnO3(x<0.5), but the when x∼0.2, a local structural distortion occurs from the
strong electron-lattice polarons which arises from the strong electron-lattice coupling
[7,11]. But the significant changes in the local structure in the x∼0.3 composition in the
80-300k range are observed which are attributed to the formation of small polarons due to
the John-Teller distortion when T>Tc, [17,18] these studies have shown that small
polarons delocalized as the magnetization increases in the manganite which induces the I-
M transition.
(d) Insulator - Metal (I-M) and paramagnetic – ferromagnetic (PM-FM) transition
Figure:1.5(a) & (b) Metal-insulator transition and Paramagnetic-Ferromagnetic transition,
in La 1-xCaxMnO3.
In addition to various phenomenon described above, (M-I) the metal-insulator and
paramagnetic to ferromagnetic transition (PM-FM) take place in LaMnO3 perovskite with
an orthorhombic structure (b>a>c1/2, Pbnm) with small proportion of Mn+4
(< 5%),
becoming antiferromagnetically ordered below TN ~150 K. In LaMnO3 if La+3
is
progressively substituted by a divalent cation, the formula becomes
Ln1-xAxMnO3 (Ln=La,Nd,Sm,Pr and A=Ca,Sr,Ba, Pb..). Systematic investigations show
that an empirical relationship exists between electrical conductivity and magnetism [9].
With increase in x (Mn+4
Content), the manganites become ferromagnetic, with well-
defined curie temperatures Tc and around Tc, it exhibits metal-like conductivity as shown
in fig. 1.5(a) & 1.5(b). The simultaneous observations of I-M and PM-FM transitions are

I - 12
Introduction to Magneto resistance materials
explained by the Zener double exchange mechanism. A metal is in the ferromagnetic
phase, whose resistivity decreases as the magnetization increases below Tc. So the
ferromagnetism is always coupled with metallic phase in the system.
(e) Role of ionic radii at A-site
The ionic radii at A-site play an important role in modifying the electrical and
magnetic transport properties of manganite.
Figure: 1.6 Ionic radius at A-site <rA> vs. Tc/Tim
As divalent cation is introduced at A-site, the ionic radii becomes mixture of
Ln= rare earth trivalent and A= divalent cation which is named as average A-site ionic
radius (<rA>). The modification in the tolerance factor ‘t’ alters the transition temperature
and desired transport properties of manganites can be achieved. The fig. 1.6 shows the
variation in transition temperature with average ionic radius <rA> of A-site [19,20]. The
transition temperature is highest when <rA> ∼1.23Å which corresponds to a tolerance
factor of 0.93. It may be also noticed that increase in <rA> the eg band with increases and
MR% decreases [21, 22].
(f) Charge and Orbital Ordering
The charge order, also known as Wigner Crystallization, is driven by inter atomic
coulomb interaction. The mobile d electrons can be localized on certain manganese ions to
form a regular lattice for particular occupancies of the d band, provided that inter

I - 13
Introduction to Magneto resistance materials
electronic coulomb interaction is comparable with the conduction-electron bandwidth W
[23]. The effect is accentuated by small displacements of the oxygen atoms to
accommodate the ordered cation lattice. Charge ordering most likely occurs when the
temperature is low and x is a rational fraction especially x= 1/8 or 3/4. The extra fourth d
electron may then be delocalized on alternate manganese site in a plane, as shown in
fig. 1.7 (a). The carriers in mixed-valent manganites may be strongly coupled to local
lattice distortion [24]. Orbital ordering can occur at certain carrier density when the d
electrons occupy an asymmetric orbital as shown in fig. 1.7 (b). The driving source is
partly direct electrostatic repulsion of the charge. Adjacent octahedra stabilize the effect.
Figure 1.7(c) displays the combined effect of charge and orbital order in mixed valent
manganites when the doping concentration is x=1/2 .
Figure 1.7 (a) charge ordering (b) orbital ordering (c) charge and orbital ordering.
1.2.4 Phase diagrams of LCMO and LSMO
(a) Phase diagram of La1-xCaxMnO3 manganite
The compound La1-xCaxMnO3 exhibits a variety of phases when the carrier
concentration (x) and temperature (T) are varied [25-27]. These phases are characterized
by different magnetic and transport properties. Figure 1.8 shows the phase diagram of

I - 14
Introduction to Magneto resistance materials
La1-xCaxMnO3 manganites. At x=0.0, LaMnO3 is an insulator. The material exhibits a
magnetic transition from paramagnetic to AFM insulating state at TN = 141 K. For 0.0 < x
< 0.2, the material remains in an insulating state, but the magnetic order changes in a
complicated way showing the crossover from canted antiferromagnetism (CAF) to
ferromagnetic insulator (FI). At x ~ 0.2, the ground state becomes the FM metal.
In the region of 0.2 < x < 0.5, the compound is FM metal at T<Tc, where Tc is the
Curie temperature shown by the solid line. For x>0.5 the material first undergoes
paramagnetic-to-charge ordered (CO) insulator transition when temperature is lowered,
end the structure becomes AFM and charge-ordered with further cooling. Finally, at x ~1.0
Figure: 1.8 Phase diagram of La1-xCaxMnO3 manganite
the compound becomes a pure CaMnO3, which exhibits an insulating behavior with the
AFM ordering at T < TN = 131 K with a different type of AFM ordering than in the pure
La-manganite [14].
(b) Phase diagram La1-xSrxMnO3 manganite
The phase diagram and low-temperature behavior of La1-xSrxMnO3 (LSMO) shows
that there are some differences in its phase diagram than that of LCMO (Fig. 1.9) mainly
due to the size difference between Ca and Sr ions, Sr being quite larger in size as
compared to Ca [28, 29]. As shown in fig. 1.9, there are three distinct ground states, the
spin-canted insulator, the FM insulator and the FM metal. At high temperatures there
appears to be two distinct phases, paramagnetic insulator (PI) and paramagnetic metal

I - 15
Introduction to Magneto resistance materials
Figure: 1.9 Phase diagram of La1-xSrxMnO3
(PM). The vertical lines demarcating these phases are determined by ρ(T) between
semiconducting (insulating) and metallic behaviour, as shown in figure. The insulator-
metal transition at low temperature is an orthorhombic (x ≤ 0.175) to rhombohedral (x >
0.175) transition. An important aspect of Sr Substitution is, the inability to obtain single-
phase material for x>0.6. Within the range of phase stability (x < 0.6), however, there is a
remarkably large variation in transport from good metal for x > 0.3 to insulator for x ≤
0.15. It should be noted that, the crossover from metallic to insulating behaviour occurs in
a very narrow concentration region. At the low end of the substitution a remarkable field-
induced structural transition is observed.
1.2.5 Literature survey
During the last decade, majority of the studies are devoted to understand the
origin, properties and applications of pure and doped manganites. The parent system
LaMnO3 is cation deficient compound [30,31]. The defective chemistry creates wide range
of doping possibilities on both the cationic sites. It has been reported that, the doping
studies in manganites are not only important from the application point of view but helps
to understand rich physics underlying them.
The studies of doping phenomena in manganites can be divided in to the following
general types -
I - 16
Introduction to Magneto resistance materials
a. Self doping
(1) A-site deficient: Ln1-δMnO3
(2) B-site deficient : LnMn1-δO3
(3) A-site, B-site deficient : Ln1-δMn1-δO3
b. Divalent substitutions at A-site
Ln1-xAxMnO3 : A- divalent cation
c. Transition metal substitutions at B-site
Ln1-xAxMn1-yTyMnO3 : A-divalent cation, T – transition metal ion
a. Self doped Systems
A-site and B-site deficient systems are referred as self doped systems or cation
deficient systems. The La1-δMnO3 (0.0 ≤ δ ≤ 0.1) compositions are all ferromagnetic and
show insulator metal (I-M) transition, with the resistivity decreasing with increasing δ.
LaMn1-δO3 compositions show ferromagnetism and the I-M transition only up to δ =0.005,
having the resistivity increase with δ [32]. The investigations on La0.90MnO3 compound
shows CMR properties near room temperature. This phase exhibit ferromagnetic transition
at TC ~ 230 – 260 K depending on hole density (0.05-0.06). This phase can be indexed in
rhombohedral structure but powder X-ray and electron diffractions studies show that, it
exhibits monoclinic symmetry [33].
Several studies on the self-doped systems indicate that, there exist four forms of
La1-δMnO3 system, namely, two orthorhombic, one rhombohedral and one cubic form
which depends on the oxygen stoichiometry [34-36]. J. Topfer et al showed that, LaMnO3
system has orthorhombic phase stable over 0.0 ≤ δ ≤ 0.06 and rhombohedral phase, which
is stable in the range 0.10 ≤ δ ≤ 0.18 [37, 38].

I - 17
Introduction to Magneto resistance materials
b. Divalent substitution at A-site
The Mn based mixed oxide based compounds with divalent substitutions at
crystallographically distinct A site with stoichiometric formula ABO3 were first studied by
Jonker and Van Santen [1], who coined the name manganites to this systems. Later on
Wollan and Koehler [39], investigated La1-xCaxMnO3 compounds using neutron scattering.
In their study, the antiferomagnetic (AF) and ferromagnetic (FM) phases where
characterized and reported to have C- and E- type magnetic unit cells in the structure with
x = 0.5 .
The renewed surge of interest in manganites, in the 1990, started with the
experimental observation of large magnetoresistance (MR) effect in Nd0.5Pb0.5MnO3 [40]
and in La2/3Ba1/3MnO3 [5]. The MR effect in the thin films was found to be as high as 60
%. The discovery of the so called “Colossal Magnetoresistance” (CMR) effect in the thin
films of La0.67Ca0.33MnOx [41], showed that, the MR effect was three orders of magnitude
larger than the typical “giant” MR of superlattice films observed. The report of Xiong et al
[42] on the studies of Nd0.7Sr0.3MnOδ thin films showed that, the MR effect was as high
as 106 %, a truly “Colossal”. Triggered by such numbers, several experimental and
theoretical studies were carried out on these compounds with x = 0.3 doping due to its
large TC. However, more recently attention has shifted towards other doping
concentrations such as x < 0.2 or x > 0.5 where interesting feature of competition between
various states and phase in manganites have been reported.
Ca and Sr doping
Most of the recent work has been focused on Ca+2
and Sr+2
substitutions at A-site
since the CMR behavior in these compounds varies as a function of divalent cation size
and concentration, which is reflected in the difference between the phase diagrams of
La1-xCaxMnO3 (LCMO) and La1-xSrxMnO3 (LSMO) systems [43-45]. At high
temperatures, in LCMO, only paramagnetic insulator (PI) phase has been reported while,
in LSMO, two distinct phases (PI) and paramagnetic metal (PM) have been observed. It
has been also reported that substitution at Ln-site modifies the phase behavior through size
effect in (Nd1-ySmy)0.5Sr0.5MnO3 [46,47]. This compound exhibits instability at FM ground
state. Similar behavior has also been observed in Pr0.5Sr0.5MnO3 and Pr0.7(Sr Ca)0.3MnO3-δ

I - 18
Introduction to Magneto resistance materials
systems [48-50]. The detailed study of low bandwidth Pr1-xCaxMnO3 (PCMO) and other
properties of the system have been explained by several groups [51-54].
Ba doping
The literature survey reveals that there exists less amount of work related to
Ba+2
substitution at A-site, probably due to larger size of Ba+2
as compared to Sr+2
. Thin
films of La0.67Ba0.33MnO3 were studied by [5]. Von Helmolt et al [55] also studied the
series La(2-x)/3Ba(1+x)/3Mn1-xCuxOz having the end members (x = 0.0 and 1.0) as
ferromagnetic La2/3Ba1\3MnOz and La1/3Ba2\3CuOz superconductor. In the Mn rich region,
the perovskite phase is found for x < 0.4. Ju et al [56] studied La 0.67Ba0.33MnOz as a
function of oxygen content z. It was found that on lowering z from 2.99 to 2.85, ρ
increased by almost six orders of magnitude uniformly over the temperature range
0 – 350 K.
Bi- based Compounds
The series of compounds with Bi1-xCaxMnOz stoichiometry have been studied by
several groups [57,58]. Due to stable trivalent state of Bismuth, one would expect similar
properties as that of La- based compounds. Interestingly, however, no evidence for
metallicity has been found in polycrystalline samples for 0.3 < x < 0.9 for H = 0. The
absence of metallic behavior has been ascribed to the high polarizability of Bi+3
ion. Bao
et al [59], reported neutron diffraction on single crystal with x = 0.82 and showed that,
both, Charge Order (CO) and antiferomagnetic (AF) transition occurs at ~ 7 T field.
Bismuth doping also has been studied in (Sm, Sr) MnO3 [60].
Electron doping
The electronic and magnetic properties of perovskite manganites depend on several
correlated factors, inducing mixed valence of Mn in to Mn+3
/Mn+4
.In order to create
valence fluctuations at Mn site in to Mn+3
/Mn+2
, several groups have studied the
substitution of the tetravalent elements at A-site. Recently, number of reports have been
published which describes the studies on the magnetic, electrical and structural behavior of
the samples with nominal composition La1-xCexMnO3 [61-66].

I - 19
Introduction to Magneto resistance materials
c. B-site doping
In order to obtain more information of Zener Double Exchange (ZDE) mechanism,
which is responsible for the FM and I-M transition in CMR manganites, large amount of
work has been carried out on studying the effect of doping at B-site in these materials [67-
73]. It is reported that, magnetotransport properties of these materials are sensitive to the
doping at Mn site. Several groups have studied substitution of bivalent, trivalent or
tetravalent elements such as Al, Ga, In, Ti, Fe, Sn, Mg,Ga, Co, Ni…doped at Mn site. Xin
chem. et al reports the doping at B-site in La0.67Ba0.33Mn0.90B0.10O3 (B = Ga, Ni, Fe)
system. It is seen that there is decrease in ferromagnetism and metallic conductivity
because of the destruction of the double-exchange interaction. But the MR values are
higher in the samples [73,74]. It is also reported that, the doping of Cr and Ru at Mn site in
PCMO system results into high magnetization values and I-M transition which is not
limited for a narrow composition range in La0.6Ca0.4Mn1-y(Cr/Ru)yO3 system [67].
S.B.Ogale et al [75] showed that, partial replacement of Mn by Fe in
La0.75Ca0.25Mn1-xFexO3 results into small changes in chemical composition, which leads to
dramatic changes in transport properties and an instability of the low-temperature
ferromagnetic metallic phase.
1.3 Applications
The CMR materials have good potential for device applications. Several groups
have attempted to explore the transport properties, specially half metallicity and transition
from insulating to metallic region in the CMR materials for their applications in various
devices [76-78]. In brief, the general applications of the CMR materials have been
discussed as follows.
1.3.1 CMR materials as Sensor & devices
(a) Magnetic Sensor
Using the CMR effect in thin films, numbers of efforts have been made to fabricate
magnetic sensors. For magnetic field sensing applications, low field response at or above
the room temperature, the researchers have used the defects or grain boundary effects in
microstructure of the manganites [77,78]. The low field sensitivity is due to spin polarized

I - 20
Introduction to Magneto resistance materials
tunneling between two grains [79-81]. The idea of development of heterostructure is more
prominent, which show low field sensitivity at room temperature [82].
The industrial requirements of magnetic sensors using CMR materials should
follow the following properties.
1) Operating at or above room temperature.
2) At least 20% response at a field of ≤ 100 Oe
3) Temperature independent MR value over 300 ± 50 K.
4) Acceptable noise values.
5) The dimensions of film approaching 1000°A or less than that.
(b) Microwave CMR Sensor
At microwave frequencies, significant CMR effect has been observed as compared
to at low frequency [83]. For the microwave cavity in the anti resonant mode, a very large
CMR effect is seen ~ 50 % at very low field which suggests the possible microwave
devices.
(c) Spin valve devices.
The spin valve device consists of two ferromagnetic electrodes separated by a
nonmagnetic conducting layer [84]. In general, the lower electrode has a large coercive
field than the upper electrode. The entire device structure consists of epitaxial multilayer
of CMR ferromagnetic electrodes separated by an epitaxial layer of conducting materials.
However, devices made using this concept have large series resistance, which can not be
explained on the basis of the resistivity of individual layers and this reduces the observed
MR. An alternate approach is the trilayer spin tunneling device, where the intermediate
layer is an epitaxial insulator. This type of device shows large low-field MR, about factor
of two to five, in a field around 100 Oe at 4.2 K.
(d) Electric field effect devices
The field effect transistor (FET) device structure consists of epitaxial multilayer of
CMR ferromagnetic layers at the bottom and dielectric layers on the top. This device
I - 21
Introduction to Magneto resistance materials
structure shows some interesting characteristics depending on the dielectric layer on top as
to whether it is a para-electric layer such as STO, or a ferroelectric PZT [85].
(e) Bolometric Sensor
Due to the large temperature co-efficient of resistance (TCR) in CMR materials,
their application as bolometer device is possible [86,87]. The CMR materials exhibits I-M
transition at Tc and sharp drop of the resistance at transition temperature gives large TCR.
The merit of the bolometric device is the TCR and noise volume. The commercial
bolometer is based on VOx, having TCR values around 2.5 to 4%. As compared to VOx,
the TCR values increases from 8 to 18 % in CMR materials. Ravi bathe et al showed 23%
TCR in LCMO thin film with silver ion implantation [88].
(f) Spin Polarized injection devices
At low temperatures <100 K, CMR materials show some interesting properties
and is found to be advantageous to integrate them with HTSC. A heterostructure
consisting of HTSC/CMR has been used for magnetic flux focused devices [89]. The
Meissner effect of the superconductor can be used as magnetic lens to enhance the flux
coupling to a CMR detector thereby enhancing its sensitivity. And spin polarized electrons
are injected from CMR layer into the superconducting channel [90,91].
Motivation for the present work
The doping at A - site can be done more flexibly in large range of concentrations.
The isovalent light rare earth substitutional studies have been done by various researchers
to study the effect of cation size mismatch and average A site cation radius effect on the
electronic and magnetic transitions. Only some light rare earths like La, Pr, Nd and Sm
based manganite systems show the CMR properties whereas heavy rare earth like Gd, Ho,
Dy etc. due to smaller ionic radii results in the buckling of Mn – O bonds significantly
such that eg band itinerant electron gets localized permanently to their parent atoms.
Depending upon the transition temperatures and related CMR effect, the manganite
systems have been classified as low bandwidth, intermediate bandwidth and large
bandwidth manganite systems. The system such as Pr1-xCaxMnO3 in which ferromagnetic
metallic state is not stabilized and a ferromagnetic insulating state exists in the range

I - 22
Introduction to Magneto resistance materials
between x = 0.15 – 0.4 is classified as low bandwidth manganite system. This system
represents a stable charge-ordered state in a broad density region between x = 0.30 – 0.75.
Such manganites exhibit I-M transition when subjected to magnetic field, pressure and
when exposed to X-rays. Since there is large buckling at Mn-O bond due to smaller size of
Pr, the application of even weaker magnetic field results in significant amount of CMR
effect. The manganite like La0.7Sr0.3MnO3 shows the transition temperature well above the
room temperature around 370K and labeled as large bandwidth manganite system. It is
believed that, in this compound the hopping amplitude for electrons in eg band is larger
than in other manganites as a consequence of the sizes of the ions involved in chemical
compositions. Large bandwidth systems have spins almost parallel at the Mn-O couplings,
so the application of magnetic field does not produce any significant change in resistivity
in already magnetically ordered region. The drawback of large bandwidth system is that,
the large transition temperature is coupled to small CMR effect that has restricted these
materials from application point of view. The third type of manganite system that has
characteristics of both, the low and large bandwidth systems and in which the research is
being carried out by a sizeable fraction of researchers is called as intermediate bandwidth
manganite system. La1-xCaxMnO3 is a typical example of such a system. This compound
represents the presence of robust ferromagnetic metallic state. It has also features that
represent deviation from double-exchange behavior, including the existence of charge
ordered and orbital ordered state. Recently the work is also being focused on intermediate
to low bandwidth materials since these are the ones that exhibit the largest CMR effect,
which is associated with the presence of charge ordering tendencies.
Keeping in mind the role of average A-site cation radius (<rA>) and the amount of
divalent cation doping in modifying the structural, transport and magnetic properties of
various manganite systems, we have made an attempt to study the simultaneous effect of
<rA> and carrier density in an intermediate bandwidth system La1-2xPrxCaxMnO3
(0≤x≤0.3). Also, an optimally doped systems (La0.5Pr0.2)Ca0.3MnO3 has been studied and
found to exhibit properties of a nearly low-bandwidth systems. We have separately studied
the effect of modification in bandwidth of this system when Ca2+
is replaced by with larger
cations Sr2+
and Ba2+
. This results in the interesting properties arising as a result of
increase in <rA> and size-disorder at A-site. Particularly, the Ba2+
substitution induces a

I - 23
Introduction to Magneto resistance materials
local structural distortion and hence, results in phase-segregation. The effect of phase-
segregation in inducing the transport and magnetic anomalies has been discussed in
subsequent chapters.
In the course of present work, along with the hole-doped manganite systems,
efforts have been made to investigate the possibility of obtaining related effects in
electron-doped manganites. The compounds like La0.7Ce0.3MnO3 have been found to
exhibit several interesting transport and magnetic properties. In hole-doped systems when
average charge on A site is reduced, the manganese ions go in a mixture of Mn3+
/Mn4+
valence states. On the other hand, in electron-doped systems <rA> is increased by
aliovalent cation doping at rare earth site. The increased charge on A-site will be able to
drive the manganese ions in a mixture of Mn3+
/Mn2+
states. Mn2+
valence state of
manganese, like Mn4+
valence state, is a non Jahn–Teller ion. The Zener Double Exchange
should occur between two adjacent Mn3+
and Mn2+
ions in the same way as it occurs
between Mn3+
and Mn4+
ions. One would, therefore, expect electron-doped manganites to
exhibit ferromagnetic-metallic behavior coupled with a large magnetoresistance.
The chapter-wise detail of all the subsequent chapters is given below
Chapter 1 describes the phenomenon of magnetoresistance observed in different
types of materials with a detailed description about various mechanisms, properties and
phases present in the perovskite type manganite materials exhibiting large
magnetoresistance.
Chapter 2 of the thesis deals with the various experimental techniques and methods
such as X-ray diffraction (XRD), scanning electron microscopy (SEM), d.c. four-probe
method for resistivity and magnetoresistance measurements and d.c. and a.c.
magnetization measurements. Their need and importance as a characterization tool has
also been discussed.
Chapter 3 is based on our investigations of effect of simultaneous increase in <rA>
and carrier density in Pr and Ca substituted antiferromagnetic insulating compound
LaMnO3. For this purpose, we have studied the structural, transport, magnetic and
magnetotransport properties of La1-2xPrxCaxMnO3 (0≤x≤0.3) manganite system.
I - 24
Introduction to Magneto resistance materials
Chapter 4 deals with effect of bandwidth modification of La0.5Pr0.2Ca0.3MnO3
compound by substitution of larger size cations Sr2+
and Ba2+
for smaller cation Ca2+
. In
this chapter, a detailed investigation of structural, transport, magnetic and
magnetotransport properties of (La0.5Pr0.2)(Ca0.3-xAx)MnO3 (A=Sr2+
and Ba2+
) (0≤x≤0.3)
has been made.
Chapter 5 is devoted to the study of the possible role of electron doping at A site
due to higher valence cations like Ce4+
, Th4+
and Mo6+
etc. For this purpose we have
studied the electron-doped system Re1-xAxMnO3; A = Th and Mo for structural, transport,
magnetic and magnetotransport properties.

I - 25
Introduction to Magneto resistance materials
References
1. G.H. Jonker and J.H. Van santen, Physica XVI, (3 Mart 1950)
2. Edwin Hall (1879)
3. M.N. Baibich, J.M. Broto, A. Fert, F. Van Dau. Nguyen, F. Petroff, P. Etienme, G.
Creuzet, A. Friederich, J. Chazeless Phy. Rev. Lett. 61, 2472 (1988)
4. R.M. Levy, J. Solid State Phys. 47, 367 (1994)
5. R. Von Helmolt, J. Wecker, B. Holzapfel, L. Schultz and K. Samwer et al,
Phys. Rev. Lett. 71, 2331 (1993)
6. A. Urushibara et al, Phys. Rev. B 51, 14103 (1995)
7. Colossol Magnetoresistance, Charge Ordering and related properties of Manganese
Oxides Ed. By. C.N.R. Rao, B. Raveau. World Scientific Publishing Co. Pte. Ltd.
(1998)
8. R. Mahesh, R. Mahendiran, A. K. Raychaudhuri and C.N.R. Rao, J. Solid State
Chem. 114, 297 (1995)
9. C. Zener, Phys. Rev. 82, 403 (1951)
10. J.B. Goodenough, Rep. Prog. Phys. 67, 1915-1993 (2004)
11. J.M.D. Coey, M. Viret., Advances in Physics 48, 2, 167 (1999)
12. S. Satpathy, Z.S. Popovic, F.R. Vukajlovic, J. Appl. Phys. 79, 4555 (1996)
13. I. Solovyev, N. Hamada, K. Terakura, Phys. Rev. Lett. 76, 4825 (1996)
14. A. P. Remirez, J. Phys. Conds. Matter 9, 8171 (1997)
15. E. Dagotto, T. Hotta, A. Moreo, Physics Report 344, 1-153 (2001)
16. H.Y. Hwang, S.W. Cheong, P.G. Radaelli, M. Marezio and B. Batlogg, Phys. Rev.
Lett. 75, 914 (1995)
17. S.J.L. Billinge, R.G. Difrancesco, G.H. Kwei, J.J. Neumeier and J.D. Thompson,
Phys. Rev. Lett. 77, 715 (1996)
I - 26
Introduction to Magneto resistance materials
18. T. A. Tyson, J. Mustere de leon, S.D. Conradson, A.R. Bishop, J.J. Neumeier,
H. Roder and Junzang, Phys. Rev. B. 53, 13985 (1996)
19. B. Reveau, J. Solid State Chem. 117, 424 (1995)
20. J. Fontcuberta, B. Martinez, A. Setfar, S. Pinol, J.L. Garcia-Munoz and X.
Ofraders, Phys. Rev. Lett. 76, 1122 (1996)
21. M.R. Ibarra, P.A. Algarabel, C. Marquina, J. Blasco and J. Garcia, Phys. Rev.
Lett.75, 3541 (1995)
22. R. Mahendiran, R. Mahesh, A.K. Raychaudhury, C. N. R. Rao, Phys. Rev. B. 53,
12160 (1996)
23. J. R. Cullen and E. Callan, Phys. Rev. 7, 397 (1973)
24. J. Kanamori, J. Phys. Chem. Solids. 10, 87 (1959)
25. P. Schiffer, A. P. Ramirez, W. Bao and S.W. Cheong, Phys. Rev. Lett. 75, 3336
(1995)
26. G. Q. Gong, C. Canedy, G. Xiao, J.Z. Sun, A. Gupta and Gallagher., J. Appl. Phys.
Lett. 67, 1783 (1995)
27. R. Mahesh, R. Mahendiran, A. K. Raychaudhury and C. N. R. Rao, Appl. Phys.
Lett. 68, 2291 (1996)
28. Y. Tokura, A. Urushibara, Y. Moritomo, T. Arima, A. Asimitsu, G. Kido and
N. Furukawa., J. Phys. Soc. Japan 63, 3931 (1994)
29. R. Mahendiran, A. K. Raychaudhury, A. Chainani, D. D. Sharma and S.B. Roy.
Appl. Phys. Lett. 66, 233 (1995)
30. C. N. R. Rao, A. K. Cheetham and R. Mahesh, Chem. Mater. 8, 2421 (1996)
31. C. N. R. Rao, Phil. Trans. R. Soc. Lond. A, 356, 23 (1998)
32. Anthony Arulraj, R. Mahesh, G. N. Subbanna, R. Mahendiran, A. K. Raychaudhuri
and C. N. R. Rao., J. Solid State Chem. 127, 87, (1996)
33. A. Maignan, C. Michel, M. Hervieu and B. Raveau, J. Solid State Commun. 101,
4(1997)

I - 27
Introduction to Magneto resistance materials
34. R. Mahendiran, S. K Tiwary, A. K. Raychaudhuri , T. V. Ramkrishnan,
R. Mahesh, N. Rangavittal and C. N. R. Rao, Phys. Rev., B. 53, 3348, (1996)
35. B. C. Hauback, H. Fjellvag and N. Sakai, J. Solid State Chem.124, (1996)
36. M. Hervieu, R. Mahesh, N. Rangavittal, C. N. R. Rao, Eur. J. Solid State Inorg.
Chem. 32, 79 (1995)
37. J. Topfer and J.B. Goodenough, J. Solid State Chem. 130, 117, (1997)
38. M. Verelst, N. Rangavittal, C. N. R. Rao and A. Rousset, J. Solid State Chem. 104,
74, (1993)
39. E. O. Wollan and W. C. Koehler, Phys. Rev. 100, 545 (1955)
40. R. M. Kusters. J. Singleton, D. A. Keen, R. McGreevy, W. Hayes, Physica B 155,
362 (1989)
41. S. Jin, T. H. Tiefel, M. McCormack, R. A. Fastnacht, R. Ramesh, L. H. Chen,
Science. 264, 413 (1994)
42. Xiong G. C., Li Q., Ju H., L. Mao, S. N. Senapati, Xi X. X., Greene R. L. and
T. Venkatesan, Appl. Phys. Lett. 66,1427 (1995)
43. A. Urushibara, Y. Moritomo. T. Arima, A. Asamitsu, G. Kido. And Y. Tokura
Phys. Rev B 51, 14103 (1995)
44. A. Asamitsu, Y. Moritomo, Y. Tomioka, T. Arima, and Y. Tokura, Nature 373,
407 (1995)
45. H. Kawahara, Y. Tomioka, Q. Asamitsu, Y. Moritomo, and Y. Tokura, Science,
270, 961 (1995)
46. Y. Tomioka, A. Asamitsu, Y. Moritomo, H. Kawahara and Y. Tokuree, Phys. Lett.
74, 5108 (1995)
47. Y. Tokura, H. Kuwarha, Y. Moritomo, Y. Tomioka and A. Asamitsu, Phys. Rev.
Lett. 76, 3184 (1996)
48. V. Caignaert, A. Maignan and B. Raveau, Solid State Conmun. 95, 357 (1995)
49. B. Raveau, A. Maignan and V. Caignaert, J. Solid State Chem. 117, 4243 (1996)

I - 28
Introduction to Magneto resistance materials
50. A. Maignan, Ch Simon, V. Caignaert and B. Raveau, J. Magn. Magn. Mater. 152,
25 (1996)
51. Y. Tomioka, A. Asamitsu, H. Kuwahara, Y. Moritomo and Y. Tokura, Phys. Rev.
B 53 R, 1689 (1996)
52. J. Barrart, M. R. Lees, G. Balakrishnan and D. McK. Paul, Appl. Phys. Lett. 68,
424 (1996)
53. H. Yoshizawa, H. Kawano, V. Tomioka and Y. Tokura, Phys. Rev. B 52, R13145
(1995)
54. H. Yoshizawa, H. Kawano, Y. Tomioka and Y. Tokura, J. Phys. Soc. Japan 65,
1043 (1996)
55. R. Von Hewlmolt, L. Haupt, K. Bamer and U. Sondermann, Solid State Commu.
82, 641 (1992)
56. H. L. Ju, J. Gopalkrishnan, J.L. Peng, Q. Li. Xiong G. C. T. Venkatensan and
R. L. Greene, Phys. Rev. B 51 (1995)
57. V. A. Bokov, N. A, Grigoryan and M. F. Bryzhina, Phys. Status Solid. 20, 745
(1967)
58. H. Chiba, M. Kikuchi, Y. Muraoka, and Y. Syono, Solid State Commun. 99, 499
(1996)
59. W. Bao, J. D. Axe, C. H. Chen, and S. W, Cheong. Phys. Rev. Lett. 78, 543 (1997)
60. F. Damay, A. Maignan, M. Hervieu, N. Nguyen and B. Raveau, C. R. Acad. Paris
322, 573 (1996)
61. S. Das and P Mandal, Indian J. phys. 71, 231 (1997)
62. S. Das and P. Mandal Z phys.B Condens.Matter 7, 104 (1997)
63. P. Mandal and S. Das, Phys. Rev. B. 56, 15073 (1997)
64. J. R. Gebhadt, S. Roy and N. S. Ali, J. Appl. Phys. 85, 5390 (1999)
65. P. Raychaudhuri, S. Mukharji, A. K. Nigam, J. John, U. D. Vaisnav, and R, Pinto,
J. Appl. Phys. Lett. 67, 3494 (1999)

I - 29
Introduction to Magneto resistance materials
66. J. Philip and T. R. N. Kutty, J. Phys.: Condens. Mater. 11, 8537 (1999)
67. B. Reveau, C. Maignan, A. Maignan. M. Hervieu and R. Mahendiran, Physica C,
341-348, 711 (2000)
68. A. Maiganan et al. z. Phys. B. 102, 19 (1997)
69. C Martin et al., J. Mater. Chem. 6, 209 (1997)
70. F. Damay et al., J. Solid State Chem. 124, 385 (1996)
71. A. Maignan et. al., Phil Trans, Roy. Soc. Lond. 356, 1635 (1998)
72. Xin Chen, Zhinong Wang, Jianwang Cai, Baogen Shen, and Wenshan Zhan,
Jinsong Chen, J. Appl. Phys. 86, 8, 4535 (1999)
73. K. H. Ahn, X. W. Wu, K. Liu, and C. L. Chien, Phys. Rev. B. 54, 21, 15299
(1996)
74. L. Ridhi and P. Gorria, J. Appl. Phys. 81, 8 (1997)
75. S. B. Ogale, Shreekala, R., Bathe. R., Bathe. R., Date, S. K. Patil, S. I. Hannoyer,
B, Petit, F., Marest, G. Phys. Rev. B. 57, 7841(1998).
76. J. Z. Sun and A. Gupta, Annu. Rev. Mater. Sci. 28, 45 (1998)
77. T. Venkatesan, M. Rajeswari, Zi-Wen Dong, S.B, Ogale, and R. Ramesh, Phil,
Trans, R. Soc. Lond. A. 356, 1693 (1998)
78. N. D. Mathur, G. Burnell, S.P. Isaac, T.J. Jackson, B.S. Teo, J.L. MacManus-
Dricoll, L.F. Cohen, I. E. Evetts, and M.G. Blamire, Nature 387, 266 (1997)
79. J. Z. Sun, L. Krusin - Elbaum, P. R. Duncombe, A. Gupta, and R. B.
Laibowitwitzpal., Phys. Lett. 70, 1769 (1997)
80. H. Y. Hwang, S. W. Cheong, N.P. Ong and B. Batlog Phys. Rev. Lett. 77, 2041
(1996)
81. A. Gupta, G. Q. Gong, G. Xiao, P. R. Duncombe, P. Leoeur, P. Trouilloud, Y. Y.
Wang, V. P. Dravid, and J. Z. Sun, Phys. Rev. B. 54, 15629 (1998)
82. Colossal Magnetoresistive Oxides Ed. By Y. Tokura, Gordon and Breach Science
Publishers (2000)

I - 30
Introduction to Magneto resistance materials
83. M. Dominguez, S. M. Bhagat, S.E. Lofland, J. S. Ramchandran, G. C. Xiong, H. L.
Ju, T. Venkatesan and R. L. Greene, Euophys. Lett. 32, 349 (1995)
84. B. Diney, V.S. Sperious, S. Metin, S. S. Parkin, B.A. Gurney, P. Baumgart, and D.
R. Wilhoit, Appl. Phys. Lett. 69, 4774 (1991)
85. S. Mathews, R. Ramesh, T. Venkatesan and J. Benedeho, Science 276, 238 (1997)
86. A. Goyal, M. Reijeswari, R. Shrakala, S. E. Lofland, S. M. Bhagat, T. Boettcher,
C. Kwon, R. Ramesh, and T. Venkatesan, Appl. Phys. Lett. 71, 2535 (1997)
87. M. Rajeswari, C. H. Chen, A. Goyal, C. Kwo, M. C. Robson, R. Ramesh,
T. Venkatesan, and S. Lakeou, Appl. Phys. Lett. 68, 3555 (1996)
88. Ravi Bathe, K.P. Adhi, S. I. Patil, G. Marest, B. Honneyer and S. B. Ogale, Appl.
Phys. Lett. 76, 2104 (2000)
89. Z. W. Dong. T. Boehcher, C. H. Chen. Takeuchi, M. Rajeswari and
T. Venkatesan, Appl. Phys. Lett. 69, 3432 (1996)
90. Z. W. Dong, R. Ramesh, T. Venkatesan, M. Jackson, Z. Y. chen, S. P. Pai, R.
Shreekala, R. P. Sharma C. J. Lobb. And R. L. Grceen, Appl. Phys. Lett. 71, 1718
(1997)
91. V. A. Vasko. V. A. Larkin, P. A. Kraus. K. R. Nikolaev, D. E. Grupp. C. A.
Nordman, and A. M. Goldman, Phys. Rev. Lett. 78, 1134 (1997)

Chapter Chapter Chapter Chapter –––– II II II II

II - 1
Experimental methods and techniques for characterization
2.1 Synthesis Methods
The synthesis of good quality material is a key to obtain the desired physical
properties and single-phase structure. Hence the selection of sample preparation method
plays an important role. High purity starting materials should be used to avoid the
introduction of defects into the structure. It is very important to have single-phase
compound of CMR material for detailed investigations. In order to prepare a single-phase
sample, the synthesis conditions are also equally important. During synthesis, the
parameters like temperature, pressure, gas flow and time for the reaction are needed to be
varied according to the requirements in the sample. The selection of all the parameters has
to be made to find the conditions, which are best for each sample, and to obtain desired
phase. Generally, solid state reaction route or ceramic method is preferred for the synthesis
of mixed valent manganite CMR materials.
2.1.1 Solid state reaction method
All the bulk polycrystalline samples under study are synthesized with solid state
reaction method [1]. The general steps involved in solid-state reaction method for
synthesizing CMR materials are described below.
1. All starting materials are high purity powders of carbonates, oxides, nitrides, etc.
They are preheated for appropriate time and temperature in order to remove
moisture in them. Powders are weighed for desired composition.
2. In the solid state reaction, for the reaction to take place homogeneously, it is very
important to mix and grind the powders thoroughly for long duration to obtain
homogeneous distribution in required proportions of the desired stoichiometric
compound.
3. The proper grinding of mixed powders using pestle-mortar reduces the particle
size as much as possible. This is necessary for obtaining close contact among the
atoms.
4. This powdered mixture is then heated in air for the first time. This first
calcination helps to remove the CO2 present in the mixture.

II - 2
Experimental methods and techniques for characterization
5. After the first heating, further number of heatings in atmosphere, are required to
obtain phase purity and remove any traces of CO2 present, if any. It is always
better to increase temperature gradually during the series of heating.
6. Before final sintering of samples, fine black powder obtained is pressed into
cylindrical pellets.
7. The pellets are sintered in a furnace in air at elevated temperatures to obtain the
desired structural phase. The samples are allowed to furnace cool.
8. Annealing: After sintering, the samples may have oxygen content slightly less
than the required stoichiometry in oxide systems. To reach the optimum oxygen
content, the samples have to be annealed, preferably in flowing oxygen. Since
most of physical properties of oxides are rather sensitive to oxygen content and
ordering, the conditions set during the oxygen annealing are important. For
appropriate oxygen content, the sintered pellets are usually kept for oxygen
annealing at a desired temperature for a long period of time and then cooled
down slowly to ambient temperature.
The solid-state reaction method has proved to be the most suitable to synthesizing
the reproducible samples of oxide systems. These steps can be followed for synthesis of
manganites by solid-state reaction route. Oxygen annealing is not required in some cases
for manganite as these materials posses good stability of oxygen stoichiometry.
Preparation of CMR materials by solid state reaction
Weigh and mix starting material
Oxides, carbonates, nitrates etc. decompose by heat ~ 900 °C
Grinding and presintering at 1000 °C & 1100 °C
Grinding and long presintering at 1200 °C to 1300 °C
Grinding, add binder if necessary
Final sintering between 1350 °C to 1400 °C

II - 3
Experimental methods and techniques for characterization
2.2.2 Sol-gel method
The sol-gel method is known to produce materials from solutions either in bulk,
films, fibers or powder forms [2]. Concerning the microstructures, the sol-gel method is
yields mainly porous materials, dense materials like glasses and ceramics, organic-
inorganic hybrids and nanocomposites.
Key points of the sol-gel method
1. Gelatinous materials as a precursor play a role of an anticoagulant of growing
particles. The preparation of monodispersed particles systematically controlled in
mean size and shape have been difficult by conventional methods. In this method,
under the conditions of high ionic strength, growing particles are easily aggregated
and thus uncontrolled in size and shape. On the other hand, by the sol-gel method,
network of a gelatinous precursor prevents the particle aggregation.
2. The supersaturation of the system can be kept at a low level by gradual dissolution
of the precursor and the separation of the nucleation and growth stage is
performed. The essential conditions to form monodispersed particles are thus
achieved.
3. The solid precursor plays an important role as a reservoir of metal ions and/or
anions of the product, which makes it possible to produce monodispersed particles
in large quantities.
A typical example of the sol-gel method, gel as a precursor, is exemplified below.
The main steps follwed during this method are given.
1. Powders, alcohol, required acid and water are taken to prepare solutions.
Precursors are made with water in one of them and they are mixed radiply.
Generally, these solutions are made at room temperature.
2. Finally, the precursors are mixed in molecular ratio and kept for gelation for some
period of time (generally in days).
3. This gel is dried at certain temperature for some period of time in air.
4. This dried powder is ground thoroughly by pestle-mortar and finally heat treatment
is given to form the compound in a particular shape.
II - 4
Experimental methods and techniques for characterization
2.2 Structural and morphological studies
It is very essential to study structural properties of any material in order to
determine the structural phase of the sample before carrying out any other studies on the
material. Structural properties are closely related to the chemical characteristics of the
atoms in the material and thus form the basics on which detailed physical understanding is
built. Similarly, morphological studies are important for understanding the growth and
packing density of grains in thin films or polycrystalline bulk materials. There are various
techniques known to explore the structure and morphology of a material. These are used to
ascertain single phase samples and detect deviations from the main structure as well as
extracting the actual structure. The different techniques have different advantages and
disadvantages and thus complement each other. To study the crystalline nature of a
material, two techniques are widely used: 1) X-Ray diffraction (XRD) measurements and
2) Neutron diffraction (ND) measurements.
To study morphology of the samples, generally, Atomic Force Microscopy (AFM)
or Scanning Electron Microscopy (SEM) are widely used experimental techniques.
Transmission Electron Microscopy (TEM) is a useful tool to obtain cross sectional view of
the thin films, especially when thin films are irradiated or exhibit defects in the inner
structure. Thermo Gravimetric Analysis (TGA) and Iodometric titration are generally used
to determine the oxygen stoichiometry in the materials.
2.2.1 X-Ray Diffraction (XRD)
X-Rays are having very small wavelength so that they can pass through most of the
solid materials. The wavelength of X-rays is of the same order of magnitude as the
distances between atoms or ions in a molecule or crystal. While passing through a crystal,
X-rays are diffracted by atoms at specific angles depending on the X-ray wavelength, the
crystal orientation, and the structure of the crystal. X-rays are predominantly diffracted by
electrons and analysis of the diffraction angles produces an electron density map of the
crystal. Crystalline materials can be described by their unit cell. This is the smallest unit
describing the material. In the material the unit cell is then repeated throughout in all
directions. This will result in planes of atoms at certain intervals. The diffraction method is
based on this aspect of repetition and on Bragg’s law which gives a relation between the
distance from one atomic plane to the next ‘d’ and the angle, θ, at which constructive

II - 5
Experimental methods and techniques for characterization
interference of a reflected monochromatic beam is seen. The Bragg’s law follows the
equation given below.
2dsin(θθθθ) = nλλλλ [2.1][2.1][2.1][2.1]
where, d = interplanar distance, n = order of reflection (Integer value), λλλλ = wavelength of
X-rays, θ = angle between incident/ reflected beam and particular crystal planes
under consideration.
We can see from eqn 2.1 (Bragg’s law) that, we need a beam with single well
defined wavelength (monochromatic) in order to avoid interference in more than one
direction for each planar distance. To obtain angles, the detector can be rotated. The
wavelength of X-rays should be ~ d. Sintered CMR manganite samples contain grains
with planes distributed in all directions. Scanning in 2θ, the angle between the incident
beam and the diffracted beam, gives a diffraction pattern with peaks corresponding to the
different planar distances. Figure 2.1 represents the X-ray diffraction mechanism in
crystalline solids.
Figure 2.1: Diffraction of X-rays by a crystal planes (Bragg’s law).
According to fig. 2.1, two noteworthy things are: a) Incident beam, the normal to
the reflecting plane, and the diffracted beam are always coplanar. b) The angle between
the diffracted beam and the transmitted beam is always 2θ, which is usually measured
experimentally. The detailed description of XRD is given in references [3,4].
The structural studies for the samples under present study were performed by XRD
and Rietveld refinement of XRD data. The Rietveld analysis is described below.

II - 6
Experimental methods and techniques for characterization
Rietveld Analysis
The Rietveld analysis [5,6] is a refinement method for powder diffraction patterns
to study the nuclear and magnetic structures. To study the magnetic structure, polarized
neutrons are needed. Once the structure is known, the analysis starts with an
approximation of the lattice parameters and calculates the diffraction pattern for the
structure. The structure is described with a large number of parameters, as is the
experimental set-up. There are nine parameters for the experimental equipment: the
wavelength, the scale factor, the zero point for 2θ and six parameters for a polynomial
background. For the typical LaMnO3 (ABO3) type perovskite structure, most of the
parameters have to be refined. The gradient for the weighted sum of squared difference
between the calculated intensities and the measured intensities, Rp, can be determined
relative to these parameters. The gradient is then used to change the parameters and this is
repeated until a minimum in the Mp function is reached. The definition of Rp and the
profile factors have been taken from the FULLPROF manual.
Intensity profile factor Rp is defined as,
[2.2]
where yi is the observed intensity at angular step i, yci is the corresponding
calculated intensity. To control the quality of the refinement, several agreement factors
were calculated. The weighted profile factor Rwp is given by,
[2.3]
and the expectation profile factor,
[2.4]

II - 7
Experimental methods and techniques for characterization
The Bragg R- factor,
[2.5]
and crystallographic Rf – factor
[2.6]
and the goodness of fit,
2
exp
wp2
R
R
=χ [2.7]
Here, Iobs and Icalc are the observed and calculated integrated intensities for the
different Bragg peaks j and (n - p) is the number of degrees of freedom. n - is the number
of points in the pattern observed and p- is the number of refined parameters.
The refinements of the XRD of the samples in the present work were carried out
using FULLPROF program. The order of refining the parameters was: the scale factor, the
zero point for 2θ, five of the background parameters, the cell parameters, three of the peak
shape parameters, the z co-ordinates, the isotropic displacement parameters, the
occupation numbers, the fourth peak shape parameter, the anisotropic displacement
parameters and the last background parameter. A few different routes to convergence were
tried to confirm an optimal result. The R factors are good indicators if a route is not
converging to a reliable result. Anisotropic displacement parameters at the Mn-O sites led
to better refinements.
2.2.2 Neutron diffraction (ND)
Neutron diffraction has long been of importance for detecting light atoms, like
hydrogen and oxygen, in the presence of heavy atoms like those of metals. There is a basic
difference in diffraction of X-rays and neutrons by different materials, which makes

II - 8
Experimental methods and techniques for characterization
neutron diffraction as an essential tool for structural investigations. As discussed in earlier
section, X-rays are scattered by electrons, and more the electrons present, the stronger is
the scattering. Neutrons carry no electric charge. They are scattered by the atomic nucleus
and the scattering amplitude depends therefore on the energy levels in the nuclei, atomic
number and on properties of individual nuclei, which vary rapidly across the periodic table
and from one isotope to another. Light atoms can therefore have scattering amplitudes as
large as or larger than the heavy ones. This makes it possible to detect reflections from all
the atoms in the materials. One complication is that some atoms absorb neutrons to a high
degree and therefore give low scattering amplitude. Samarium is one example and hence
Sm-123 superconductor cannot be studied by neutron diffraction. Since, while leaving the
reactor, the neutrons posses too much high energies and short wavelengths for diffraction,
their energy is lowered with a moderator consisting of water. After this process, the
thermal neutrons have a wavelength of approximately 1 Å, of the order of the plane
spacing, which can be used for experimental purpose.
2.2.3 Scanning Electron Microscopy (SEM)
SEM uses electrons as probes to form an image of the specimen. It is one of the most
powerful and productive methods of microscopy yet invented [i, ii]. The SEM has allowed
researchers to examine a large variety of specimens. The scanning electron microscope has
many advantages over traditional microscopes. The SEM has a large depth of field, which
allows more of a specimen to be in focus at one time. The SEM also has much higher
resolution; so closely spaced specimens can be magnified at much higher levels. As the
SEM uses electromagnets rather than lenses, it is much more controlled in the degree of
magnification. All of these advantages, as well as the actual strikingly clear images, make
the scanning electron microscope one of the most useful instruments in research today.
Scanning Electron Microscope (SEM) has become a valuable tool for examination and
evaluation of materials, both metallic and non-metallic, as well as assemblies and surfaces.
This is a non-destructive technique in a way that sample can be extracted as such after
scanning. The sample to be investigated is placed on a specimen stage inside a vacuum
enclosure of the SEM station and is incident with a finely focused electron beam that can
be static or swept in a cyclic fashion over the specimen's surface. The resulting signals that
are produced when the scanning electron beam impinges on the surface of the sample

II - 9
Experimental methods and techniques for characterization
include both secondary emission electrons as well as backscattered electrons. These
signals vary as the result of differences in the surface topography as the scanning electron
beam is swept across the sample surface.
Working of SEM
The SEM produces a largely magnified image by using electrons instead of light to
form an image. A beam of electrons is produced at the top of the microscope by an
electron gun. The electron beam follows a vertical path through the microscope, which is
held within vacuum. The beam travels through electromagnetic fields and lenses, which
focus the beam down toward the sample. Once the beam hits the sample, electrons and X-
rays are ejected from the sample.
Detectors collect these X-rays, backscattered electrons and secondary electrons and
convert them into a signal that is sent to a screen similar to a television screen. This
produces the final image. The secondary emission of electrons (figs. 2.2 and 2.3) from the
specimen surface is usually confined to an area near the beam impact zone that permits
images to be obtained at a relatively high resolution. These images as seen on a Cathode
Ray Tube provide a three dimensional appearance due to the large depth of field of the
Scanning Electron Microscope (SEM) and the shadow relief effect of the secondary
electrons contrast. Figure 2.2 represents the schematic diagram of SEM explaining the
experimental set up.
A typical SEM has a working magnification range of from 10 to 100,000
diameters. A resolution can be attainable ~ 100 Angstroms and a focus of 300 times that of
an optical microscope. The large depth of field available with a SEM makes it possible to
observe three-dimensional objects. The three-dimensional images produced allow different
morphological features to be correctly interrelated and correctly analyzed.
The unique advantage of Scanning Electron Microscopy is that it does not need
much samples loading activity and also, the thickness of the specimen is not a
consideration. The surface of the sample may clean and smoothened before it is scanned.
This helps in achieving better surface morphological and grain size information.

II - 10
Experimental methods and techniques for characterization
Figure 2.2: A diagram showing the working of scanning electron microscope (SEM)
(Diagram courtesy of Iowa State University SEM Homepage).
Figure 2.3: The outcomes of incident electron beam in a SEM

II - 11
Experimental methods and techniques for characterization
2.3 Electrical and Magnetotransport studies
The samples under present studies were characterized for their electrical and
magnetotransport properties using the experimental techniques described below.
2.3.1 Standard four probe resistivity measurements
Electrical resistance measurements are rather easy and straightforward to make and
provide much useful information about the sample. The normal state of the material is
probed and the transition in the CMR material gives us an easily accessible and accurate
value of the critical temperature as well as information about the quality of the sample.
A low contact resistance is desirable due to the small resistance of the samples.
Hence a standard four-probe technique is used to measure resistance of the samples [9].
The samples were cut in a rectangular bar shape using a diamond saw. For the
electrical contacts silver paste was used. The silver paste is applied at the ends for current
contacts. Thin copper wires were connected with silver paint as shown in fig. 2.3 and the
whole assembly was put onto a sample holder where the wires were connected with leads
to the measuring instruments.
Figure 2.4: Four probe contacts of current and voltage supplies to the sample during the
resistivity measurements.
The Kiethley instruments were used for the measurements. Thermal effects are
automatically compensated during the measurements.
The samples were cooled down using suitable coolant liquid. The vacuum in the
sample chamber was created by using rotary vacuum system. The samples were then
heated in a controlled way by using a heater and the resistance was measured with slowly
increasing temperature.

II - 12
Experimental methods and techniques for characterization
2.3.2 Magnetoresistive measurements
To study magneto resistive characteristics of the samples, resistance was measured
by using the standard four probe method as explained in the previous section, in the
presence of an external magnetic field in a Quantum Design Physical Properties
Measurements System (PPMS). At a constant applied field, resistance was measured as a
function of temperature (magneto R-T) in the range of RT to ~ 5 K. Most of the manganite
samples studied in the present work were characterized using this technique.
2.4 Magnetic property measurements
2.4.1 A. c. susceptibility measurements
As described earlier, if a material exhibits superconductivity then it expels out the
magnetic flux lines and shows negative of susceptibility (χ), which is defined as ratio of
magnetization (M) to the applied magnetic field (H). Even very small amount of
superconductor can display this effect, which can be measured []. Susceptibility is
measured as a function of temperature for the materials. The samples under present
investigations were also characterized by this technique to determine the magnetic
transition temperature. A rectangular bar piece of sample was used for measurements of
the samples. The piece of sample was weighed and loaded in the sample holder. Then it
was cooled by using liquid He below its Tc (in the same set up which is used for R-T
measurements). The sample was then heated in a controlled way and χ was measured by
using a lock-in-amplifier.
2.4.2 D.C. magnetization and M-H measurements
For d. c. magnetization measurements of the samples, SQUID magnetometer or
Vibrating Sample Magnetometer (VSM) was used. The measurement technique is
described below along with the principle and working of the magnetometers used.
2.4.3 SQUID magnetometer
SQUID magnetometer is the most widely used instrument for magnetic
characterization in material science. It has been proved as a boon to elucidate many
interesting results in superconductors, manganites and ferrites [10]. The superconducting
quantum interference device (SQUID) consists of two superconductors separated by thin
insulating layers to form two parallel Josephson junctions. The device may be called as a
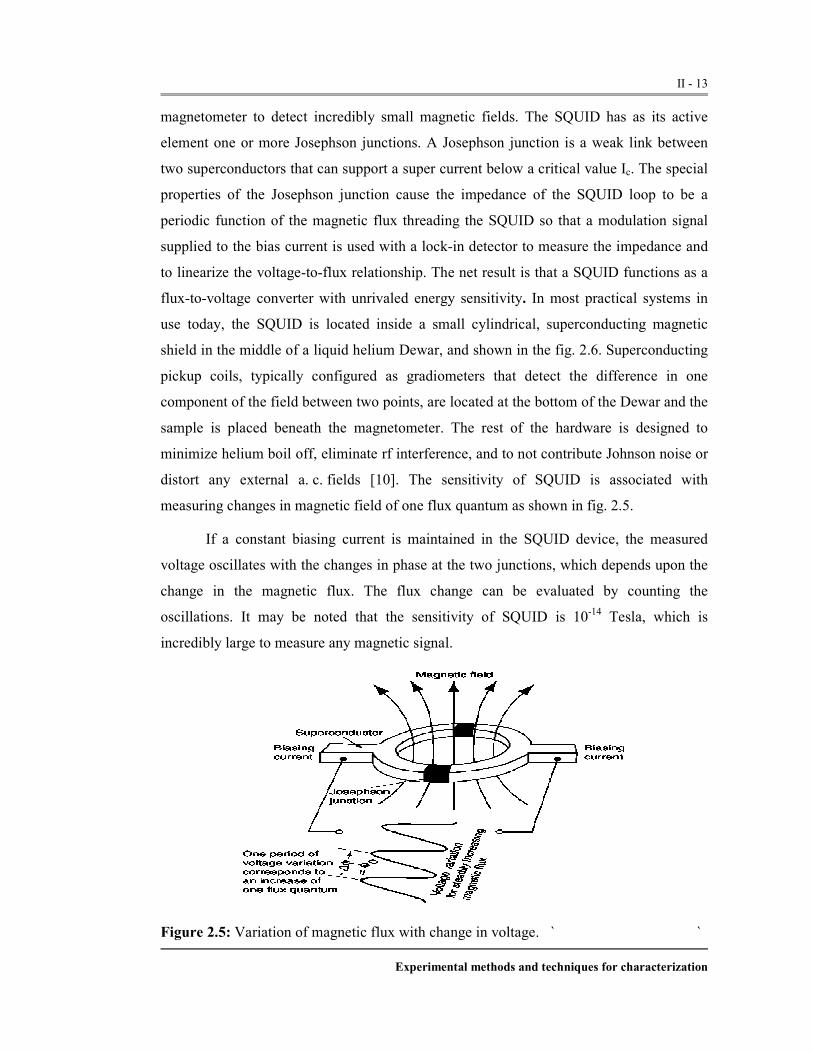
II - 13
Experimental methods and techniques for characterization
magnetometer to detect incredibly small magnetic fields. The SQUID has as its active
element one or more Josephson junctions. A Josephson junction is a weak link between
two superconductors that can support a super current below a critical value Ic. The special
properties of the Josephson junction cause the impedance of the SQUID loop to be a
periodic function of the magnetic flux threading the SQUID so that a modulation signal
supplied to the bias current is used with a lock-in detector to measure the impedance and
to linearize the voltage-to-flux relationship. The net result is that a SQUID functions as a
flux-to-voltage converter with unrivaled energy sensitivity. In most practical systems in
use today, the SQUID is located inside a small cylindrical, superconducting magnetic
shield in the middle of a liquid helium Dewar, and shown in the fig. 2.6. Superconducting
pickup coils, typically configured as gradiometers that detect the difference in one
component of the field between two points, are located at the bottom of the Dewar and the
sample is placed beneath the magnetometer. The rest of the hardware is designed to
minimize helium boil off, eliminate rf interference, and to not contribute Johnson noise or
distort any external a. c. fields [10]. The sensitivity of SQUID is associated with
measuring changes in magnetic field of one flux quantum as shown in fig. 2.5.
If a constant biasing current is maintained in the SQUID device, the measured
voltage oscillates with the changes in phase at the two junctions, which depends upon the
change in the magnetic flux. The flux change can be evaluated by counting the
oscillations. It may be noted that the sensitivity of SQUID is 10-14 Tesla, which is
incredibly large to measure any magnetic signal.
Figure 2.5: Variation of magnetic flux with change in voltage. ` `

II - 14
Experimental methods and techniques for characterization
Figure 2.6: A schematic diagram of SQUID magnetometer.
Vibrating Sample Magnetometer
Vibrating sample magnetometer (VSM) is used to measure the magnetic moment
of a material [11,12]. A VSM operates on Faraday's Law of Induction. According to
Faraday’s laws of magnetic induction, an ac voltage is induced which is proportional to
the rate of change of magnetic flux associated with the circuit and thus to the amount of
magnetic moment within the sample due to the applied magnetic field. A VSM operates by
first placing the sample to be studied in a constant magnetic field. If the sample is
magnetic, this constant magnetic field will magnetize the sample by aligning the magnetic
domains or the individual magnetic spins, with the field. If the constant field is larger, the
magnetization will also be larger. The magnetic dipole moment of the sample will create a
magnetic field around the sample, sometimes called the magnetic stray field. The sample
is vibrated with a certain frequency in the vertical direction near the detection coil. As the
sample is moved up and down, this magnetic stray field changes as a function of time and
can be sensed by a set of pick-up coils. An ac signal is generated at a frequency
determined by the sample oscillation. This electric field can be measured and can give us

II - 15
Experimental methods and techniques for characterization
information about the changing magnetic field. This current will be proportional to the
magnetization of the sample. The greater the magnetization, the greater will be induced
current.
Oxford instruments design VSM [13] is used for these measurements with a few
Tesla superconducting magnet. The material under investigation is mounted in a sample
holder at the end of a carbon fiber rod and inserted in VSM continuous flow Helium
Cryostat. The tail of the cryostat lies inside a conventional NbSn superconducting magnet
capable of sustained fields up to 12 Tesla.
Once a DC field is applied, the sample is vibrated at a constant frequency of 66 Hz
with amplitude of about 1.5mm along the vertical axis of the uniform applied field. Two
pickup coils, placed above and below the sample, experience a change of the magnetic
flux due to the motion of the sample and, according to Faraday's law, an emf induced is
proportional to the rate of that change of flux. This signal, proportional to the
magnetization of the sample, passes through a two-stage amplification process and is
monitored by the VSM electronics and recorded on a computer via a standard RS232
connection. The sample temperature is measured by a AuFe/Chromel thermocouple in
direct contact with a copper heat exchanger situated below the sample.
Figure 2.7: A Schematic diagram of VSM.
The temperature control (temperature range: 3.6 - 320 K) is achieved by an Oxford
Instruments ITC4 temperature controller. A schematic diagram is shown in fig. 2.7.

II - 16
Experimental methods and techniques for characterization
The above mentioned measurement systems are used for d. c. magnetization and
M versus H measurements of the samples. For d. c. magnetization, a small external field is
applied and χ is measured as a function of temperature at constant applied field. For M-H
measurements, magnetization (M in emu /gm) is measured at a constant temperature while
magnetic filed is varied up to a certain value of positive and negative applied field.

II - 17
Experimental methods and techniques for characterization
References
1. E. M. Engler, Chem. Tecnol. 17, 542 (1987).
2. G. Piccaluga, A. Corrias, G. Ennas, A. Musinu, Sol-gel preparation and
characterization of Metal-Silica and Metal-Oxide silica nanocomposites (journal)
13, 4 (2000).
3. A. Taylor, X-ray Metallography, Wiley (1961).
4. A. R. West, Solid State Chemistry and its Application, John Wiley & Sons,
Chichester (1984).
5. H. M. Rietveld, J. Appl. Cryst. 2, 65 (1969).
6. R.A. Young, The Rietveld Method, Oxford University Press Inc, New York, 1993.
7. Encyclopedia.Com (http://www.encyclopedia.com/printable/04033-a.html) and
references therein.
8. Iowa State SEM Homepage (http://surf.eng.iastate.edu/~karie/Documentation) and
references therein.
9. L. J. Van der pauw, Philips Res. Repts. 16, 187 (1961).
10. SQUID Manual by Quantum Design
11. E. O. Samwel, T. Bolhuis, J. C. Lodder, Rev Sci Instrum. 69, 3204 (1998).
12. E. O. Samwel, T. Bolhuis, D. Speliotis, J. C. Lodder, J Mag Magn Mater 193, 337
(1999).
13. VSM manual by Oxford Instruments.

II - 18
Experimental methods and techniques for characterization
4. Encyclopedia.Com (http://www.encyclopedia.com/printable/04033-a.html) and
references therein.
5. Iowa State SEM Homepage (http://surf.eng.iastate.edu/~karie/Documentation) and
references therein.

Chapter Chapter Chapter Chapter –––– III III III III
Transport and magnetic properties of nearly low bandwidth manganites.
III -1
3.1 Studies on nearly low bandwidth La1-2xPrxCaxMnO3 manganites.
The LaMnO3 is the best suitable composition of the material, with the divalent
doping normally alkaline earths like Ca+2, Sr
+2, Ba
+2 inducing remarkable electrical and
magnetic transport properties like, metal-insulator (M-I) transition, paramagnetic to
ferromagnetic (PM-FM) transition and charge ordering (CO) state with one more magnetic
FM - AFM transition. The renewed Interest in these materials is due to the observation of
huge amount of negative resistance exhibited by them under the application of magnetic
field. They show remarkably half metallic behavior or spin polarized conduction and other
remarkable features, which opened up the door of fascinating world, named as a
mixed valent manganites. In nature, the mixed valent manganites means, the material
containing Mn+3 and Mn
+4, which promotes the occurrence of the above mentioned
phenomena [1]. Especially, creation of the Mn+4 in the material can be achieved by the
way of several routes of the doping. Interestingly, reports exit on the creation of Mn+4
without doping at the divalent A-site due to the defect structure of perovskite block has
attracted the attention of many working in this field [2,3].
The interesting feature of undoped LaMnO3 is that, LaMnO3+δ can be prepared
under oxidizing condition. Although such a LaMnO3+δ perovskite structure cannot accept
excess oxygen in an interstitial site [3], non-stoichiometric excess oxygen fraction can be
accommodated as cation vacancy. It may be either at A-site or B-site or at both the sites
[4]. This has been described by the defect chemistry of these compounds using either TGA
measurements or diffraction experiments [4-6]. Accordingly, the composition of
LaMnO3+δ is generally expressed as La1+δMn1-δO3 or LaMn+3
1-2δ Mn+4
2δO3+δ [4]. The
oxygen defect amount δ produced in proportion of Mn+4 in sufficient amount, promotes
M-I transition and other CMR properties. Several attempts have been made with defect
structure of LaMnO3 to obtain transition temperature in wide range of temperature
between RT to low temperature.
The defect structure is mainly distinguished by orthorhombic, rhombohedral and
cubic phase [7, 8]. The orthorhombic phase is stable over 0.10 ≤ δ ≥ 0.18 [4]. There is an
anomaly with the δ value corresponding to amount of Mn+4 showing Mn
+4 does not
directly depend on δ [8, 9]. Hence, it can be argued that, the structural behavior of the

Transport and magnetic properties of nearly low bandwidth manganites.
III -2
compound is the most prominent way to explain different CMR properties. Oxidation
creates small polaron holes that become increasingly trapped at cation vacancies. The
orthorhombic structure sustains the co-operative J-T distortion while the rhombohedral
phase suppresses the co-operative J-T distortion so that the hole-pour matrix becomes
ferromagnetic [9]. With highest δ having appropriate tolerance factor t creates delocalized
state and introduces double-exchange mechanism. This ferromagnetic coupling competes
with antiferromagnetic superexchange. [10, 11]
All the reports are found in favor of use of wet chemical methods to synthesize
defect structure of LaMnO3 [12]. Earlier report suggests that, conventional solid state
reaction route does not create sufficient long range ferromagnetic order and insulator -
metal (I-M) transition in undoped LaMnO3 samples [13-15].
With an aim to create sufficient long range ferromagnetic order in the undoped LaMnO3
sample by varying the Mn+4 content through Solid state reaction route, in this course of
present work, we have attempted to synthesize the slightly cation deficient system such as
La1-2xPrxCaxMnO3 (LPCMO) (x = 0.00, 0.10 & 0.15). The results of the structural,
transport, magnetotransport and magnetic property measurements on the doped LPCMO
system have been described in detail in this chapter. The presence of Pr substitution plays
a crucial role to achieve high negative MR. The results obtained on this system has
prompted us to carry out more studies on the simultaneous doping of Pr, Ca (x = 0.20,
0.30) in LPCMO. The cation size plays a vital role to suppress and revive the transition
temperature. The sensitivity of the material to the cation size is understood to have direct
impact on Mn-O-Mn bond length that controls the carrier hopping amplitude. Some low
bandwidth magnetic system like Pr1-xCaxMnO3 (PCMO) are charge ordered at all the
compositions, but shows ferromagnetism from x = 0.2 - 0.3 [16, 17]. The system shows
coexisting inhomogeneous metal-insulator (M-I), ferromagnetic (FM) and
antiferromagnetic (AFM) phases around 100 K. However it exhibits M-I transition under
magnetic field and when exposed to X- rays [18-21]. The smaller size of Pr reduces the
Mn-O-Mn bond angle making super-exchange competitive with Zener double exchange.
The other manganite system La1-xCaxMnO3 (LCMO) shows prominent transport
and magnetic transitions for x = 0.18 - 0.50 [22]. Hence, it would be interesting to
investigate the structural, transport, magnetic and magnetotransport properties of the

Transport and magnetic properties of nearly low bandwidth manganites.
III -3
simultaneous Pr-Ca doped for La in LaMnO3 perovskite. Average A-site cation radius
<rA> decrases by the simultaneous substitution of smaller cation Pr and Ca, which leads to
nearly a low bandwidth system.
Sample Preparation
The series of samples with stoichiometric compositions La1-2xPrxCaxMnO3
(x = 0.0, 0.10, 0.15, 0.20 & 0.30) and La0.5Pr0.2Ca0.3MnO3 were synthesized using standard
solid-state reaction method. The appropriate amounts of pure La2O3, Pr6O11, MnO2, and
CaCO3 chemicals were thoroughly ground and mixed. The calcinations and sintering, with
intermittent grindings were done in the temperature range of 900 ºC – 1100 ºC. Samples
were annealed under the flow of nitrogen for 12 hrs. followed by oxygen annealing for 24
hrs followed by slow cooling down to room temperature (RT).
3.1.1 Structural studies
The structural studies on all the La1-2xPrxCaxMnO3 (x = 0.0, 0.10, 0.15, 0.20, 0.30)
samples have been carried out using XRD facility at Department of Physics, University of
Pune and IUC-DAEF, Indore. The measurement parameters were 2θ ranges 20 º - 80º,
step size - 0.02º and step time 1.00 sec.
Figs. 3.1, 3.2 and 3.3 shows the XRD patterns for pure LaMnO3 (x = 0.0),
La1-2xPrxCaxMnO3 (x = 0.10 & 0.15) respectively.
Figure: 3.1 XRD pattern of undoped LaMnO3 (x = 0.0).
The structural study on x = 0.0, i.e. LaMnO3 sample has been carried out in the
light of variation in Mn+4 content due to the defect structure resulting from the synthesis
technique used in sample preparation. It is reported that, the structure of LaMnO3 changes
from orthorhombic to rhombohedral as a function of Mn+4 [7, 8]. Fig. (3.1) clearly shows

Transport and magnetic properties of nearly low bandwidth manganites.
III -4
that, the sample x = 0.0 possess a mixed phase orthorhombic and rhombohedral behavior.
The doublet peaks indicate the presence of both the phases. The 100 % intensity peak can
be indexed in rhombohedral structure with a0 = 5.523 A, b0 and c0 = 13.324 A. The 84 %
intensity peak just before 100 % peak in the form of doublet is indexable in orthorhombic
structure with space group = Pnma (62). The XRD pattern of x = 0.0 also can be indexed
in the similar pattern in which the intensity of rhombohedral structured peaks dominates
over the orthorhombic phase peaks [23].
Figure: 3.2 XRD pattern of La1-2xPrxCaxMnO3 (x = 0.10).
Figure: 3.3 XRD pattern of La1-2xPrxCaxMnO3 (x = 0.15).
The progressive simultaneous substitution of Pr-Ca at La in LaMnO3 results into
the conversion of doublet peaks into singlet, as evident from figs. 3.2 and 3.3. For x =
0.10, the three doublets are seen to be dissolved and becomes singlet with 100% maximum
peak indexable in rhombohedral reflection. For x = 0.15 (fig. 3.3), the system is
structurally converted to orthorhombic phase with the possibility that x = 0.18-0.20 as the

Transport and magnetic properties of nearly low bandwidth manganites.
III -5
concentration of doping for the occurrence of pure orthorhombic structure exhibiting M-I
transition and CMR behavior.
Figure: 3.4 XRD pattern of La1-2xPrxCaxMnO3 (x = 0.20).
Fig. 3.4 shows the observed XRD pattern for x = 0.20 sample showing that almost
all the peaks can be indexed in an orthorhombic structure with space group Pbnm (62).
The presence of a low intensity peak before 100 % peak in this sample has been discussed
at the end of this section.
20 40 60 80
-200
-100
0
100
200
300
400
500
600
700 La0.4Pr
0.3Ca
0.3MnO
3
Intensity (arb. Unit)
2 θ
Experimental
Refined
Difference
Bragg peak
Figure: 3.5 Rietveld fitted XRD pattern of La1-2xPrxCaxMnO3 (x = 0.30).

Transport and magnetic properties of nearly low bandwidth manganites.
III -6
Figure: 3.5 Rietveld fitted XRD pattern of La0.5Pr0.2Ca0.3MnO3 system.
Figs. 3.5 and 3.6 depicts the rietveld fitted XRD patterns for La1-2xPrxCaxMnO3
x = 0.30 and La0.5Pr0.2Ca0.3MnO3 sample respectively. It can be seen from the patterns that
samples possess single phase orthorhombic structure.
The weak intensity peak before the 100 % maximum peak in the XRD patterns of
all the samples studied cannot be indexed in the rietveld fitting. Moreover, it does not
match with the unreacted 100 % La2O3 peak. Also, there is an absence of Mn2O3 peak in
the XRD patterns, which suggest that this peak is indexable under JCPDS LaMnO3
structural data as (0 2 0) symmetry reflection. Earlier work reported by B. Reveau et al,
J. B. Goodenough et al and C. N. R. Rao et al have shown that this weak intensity
reflection can be indexed under distorted orthorhombic structure as (0 2 0) plane.
3.2 Transport and magnetotransport measurements
LaMnO3
The results of the transport and magnetotransport measurements on LaMnO3 and
La1-2xPrxCaxMnO3 (x = 0.10, 0.15, 0.20 & 0.30) samples carried out using standard four
probe resistance technique with and without applied magnetic field have been given in this
section.
Fig. 3.7 shows the variation of resistance as a function of temperature for pure

Transport and magnetic properties of nearly low bandwidth manganites.
III -7
LaMnO3 with and without application of magnetic field. The inset figure shows the R-T
behavior of LaMnO3 at low temperature up to 5 K.
Figure: 3.7 R – T and Magneto R – T plots under 1T field of undoped LaMnO3.
It is clear from the figure that the application of 1T field suppresses the peak
resistance by an appreciable value, which can be quantified as negative peak
magnetoresistance at I-M transition. The observation of I-M transition in pure LaMnO3
under 0 T can be ascribed to the possible defect structure, which creates sufficient Mn4+
(~ 24 %) [7, 8, 23] responsible for FMM state in the sample which break the AFM
interactions between Mn3+ ion. The observation of slight up turn in the metallic R-T
behavior at low temperature (around 50 K), as shown in the inset figure, indicates the
development of insulating phase in the FMM matrix. This is an evidence of the presence
of orthorhombic distortion in the structure of the sample at low temperature.
La1-2xPrxCaxMnO3 for x = 0.10, 0.15, 0.20, 0.30
In this section, the results of the studies on transport and magnetotransport
behavior of Pr-Ca doped LCMO system have been given followed by the discussion on
these results.

Transport and magnetic properties of nearly low bandwidth manganites.
III -8
Figure: 3.8 R – T and Magneto R – T plots of La1-2xPrxCaxMnO3 (x = 0.1).
Figure: 3.9 R – T and Magneto R – T plots of La1-2xPrxCaxMnO3 (x = 0.15).
Figures 3.8 and 3.9 show the R-T and magneto R-T behavior of x = 0.10 and 0.15
samples of LPCMO respectively. The values of the I-M transition temperatures for these
samples have been tabulated in table 3.1. The increase in Pr concentration results into an
increase in peak resistance and narrowing of I-M transition region. As it is difficult to
control the cation deficiency in the lower doping regime of Pr-Ca substitution in the solid
state reaction method of sample synthesis, the variation in I-M transition temperature (Tp)
with doping concentration does not follow any systematic [9].
Figure: 3.10 R – T and Magneto R – T plots of La1-2xPrxCaxMnO3 (x = 0.2).
Figure: 3.11 R – T and Magneto R – T plot of La1-2xPrxCaxMnO3 (x = 0.3).

Transport and magnetic properties of nearly low bandwidth manganites.
III -9
It is evident from figs. 3.10 and 3.11 that, the peak resistance at Tp becomes
highest (~ 38 K) for x = 0.30 sample with no change in the Tp value. The samples with
x = 0.20 and 0.30 Pr-Ca doping concentrations are well above the minimum limit of 18 %
Mn4+ content sufficient for long range ferromagnetic material throughout the sample. This
is accompanied by structural phase transition from rhombohedral to orthorhombic phase
for x = 0.20 and 0.30 samples [5]. In addition, with the increase in Pr-Ca concentration
results into sharpening of the I-M transition and enhance suppression of peak resistance at
Tp in an applied field of 1 T.
La0.5Pr0.2Ca0.3MnO3
The R-T and magneto R-T measurements on the optimally Ca doped LaMnO3 with
Pr doping of 20 % at La site were carried out under an applied fields of 1 T, 2 T and 5 T.
From the fig. 3.12, it can be seen that the Tp increases from 122 K to 150 K with the
decrease in Pr content from x = 0.30 to 0.20 with Ca content remaining x = 0.30.
0 50 100 150 200 250 300
0
1000
2000
3000
4000
5000
6000
7000 La0.5Pr
0.2Ca
0.3MnO
3 0 T
1 T
2 T
5 T
Resistance(Ω)
Temperature(K)
Figure: 3.12 R – T and Magneto R – T plots of La0.5Pr0.2Ca0.3MnO3.
Also, The peak resistance decreases from 38 K (Pr, Ca = 0.30) to 6.8 K (Pr = 0.20, Ca =
0.30) sample. In this sample it is observed that the amount of suppression of peak
resistance under 1 T applied magnetic field is reduced as compared to La1-2xPrxCaxMnO3
for x = 0.30 sample.

Transport and magnetic properties of nearly low bandwidth manganites.
III -10
Conduction in Paramagnetic Insulator (PI) state or Paramagnetic Semiconductor
(PS) mode
In this section we have attempted to understand the mechanism of charge
conduction in PI state. Although, this state has been explored less effectively for
understanding the conduction mechanism due to its insulating nature, but is interesting
because it also exhibits negative MR. It is reported that there is a need to investigate the
nature of electrical transport for the region T > Tp. In an attempt to know whether the
nature of conduction above transition temperature in the La1-2xPrxCaxMnO3 for x = 0.30
and La0.5Pr0.2Ca0.3MnO3 systems is governed by variable range hopping (VRH) or small
polaron formation, we have fitted the R-T data above Tp in both the models [24, 25].
Figs. 3.13 and 3.14 show the VRH and small polaron fitting plots of La1-2xPrxCaxMnO3;
x = 0.30 and La0.5Pr0.2Ca0.3MnO3 samples.
Figure: 3.13 VRH and small polaron model fitting of R-T of La0.4Pr0.3Ca0.3MnO3.
Figure: 3.14 VRH and small polaron model fitting of R-T of La0.5Pr0.2Ca0.3MnO3.
It can be seen from the fitted plots that, Motts type variable range hopping (VRH)
model holds good throughout the temperature region above TC corresponding to the
expression in the ρ = ρ0 exp(T0/T)1/4 while the fitting of R-T data into nearest neighbor
small polaron hopping model corresponding to ρ = AT exp(E0/kT) is non-linear in the
higher temperature regime. This suggests that the charge carrier conduction in the PI state
obeys the Motts VRH model. T0 in the equation is related to localization length by
equation,
KT0 = 18/L2 N(E)

Transport and magnetic properties of nearly low bandwidth manganites.
III -11
where L is the localization length of the carriers and N(E) is the density of the states.
3.2.2 Magnetoresistance studies
The values of the magnetoresistance (MR) calculated from the magneto R-T
measurements carried out under 1 T for LaMnO3 and La1-2xPrxCaxMnO3 (x = 0.10, 0.15 &
0.20) samples under different fields 1 T, 2 T & 5 T for La0.4Pr0.3Ca0.3MnO3 and
La0.5Pr0.2Ca0.3MnO3 samples have been given in Table 3.1.
100 200 3000
5
10
15
20
25
30
LaMnO3
MR %
T (K)
H = 1 T
Figure: 3.15 MR % Vs Temperature plot of LaMnO3 under 1T field.
It can be seen from the figure that the presently studied pure LaMnO3 sample
exhibits high MR effect under the application of 1 T field having an appreciable rise in its
value at 225 K indicative of a reasonable MR% in PI or PS state also. The MR % becomes
maximum around Tp.
La1-2xPrxCaxMnO3 (x = 0.10, 0.15, 0.20) system
100 200 3000
20
40
60
80 H = 1 T
MR %
T (K)
x= 0.10
x= 0.15
x= 0.20
Figure: 3.16 MR % Vs Temperature plot of La1-2 xPrxCaxMnO3 under 1T field.

Transport and magnetic properties of nearly low bandwidth manganites.
III -12
Fig. 3.16 depicts the variation of MR % with T (K) for different Pr-Ca (x) doping
concentrations in La1-2xPrxCaxMnO3 (x = 0.10, 0.15 & 0.20) systems under 1 T field. The
values of the MR % obtained from magneto R-T data at Tp are tabulated in Table 3.1. It
can be seen from the figure that, for x = 0.10 and 0.15 samples the MR behavior is almost
similar with maximum MR ~ 57 % for x = 0.10 and ~ 70 % for x = 0.15. Both systems are
slightly cation deficient systems. The sample x = 0.20 shows high MR% at low
temperature up to 200 K having a maximum of ~ 80 % near Tp. In a relatively weak
applied field of 1 T, the observation of such a high MR at 125 K is an interesting result.
50 100 150 2000
20
40
60
80
100
120La
0.5Pr
0.3Ca
0.3MnO
3
H = 2T
H = 5T
H = 1T
MR %
T (K)
Figure: 3.17 MR % Vs Temperature plot of La0.4Pr0.3Ca0.3MnO3 under 1 T, 2 T and 5 T.
It can be mentioned that, the observation of such an appreciable MR effect (80 %
& 85 %) under 1 T for LPCMO (x = 0.20, 0.30), is a result, which should attract the
application potential of this sample well above the LN2 temperature. The origin of this
large CMR effect at relatively weaker fields lies in the magnetic disorder at Mn-O
couplings and grain boundary effects [27]. The TC depends upon the transfer integral of eg
electron, which further depends upon the spin arrangements on the adjacent Mn ions. If
the Mn-O-Mn bond angle is towards 180º then the spin arrangement on Mn ions is
ferromagnetic which favors the transfer of eg electron easily but deviation from this angle
obstructs the conduction of eg electron and hence TC occurs at low temperatures. The
application of magnetic field forces parallel alignment of the spins and eg electron transfer
increases to show a drop in resistivity and hence CMR effect occurs when spins order
ferromagnetically on Mn-O couplings [28]. The grain boundaries also contribute to
resistivity by the spin dependent scattering of carriers. The application of magnetic field

Transport and magnetic properties of nearly low bandwidth manganites.
III -13
reduces the spin dependent scattering of carriers and contributes to CMR effect [27]. The
large sensitivity of the LPCMO system at weak fields prompted us to modify the system to
a larger bandwidth by the substitution of larger size cation, which will be described in next
chapter.
The similar behavior of pronounced MR effect has been observed in sample with
x = 0.30 ( fig. 3.17 ). It can be seen from the figure that the peak resistance is ~ 38 K (with
a huge suppression in its value under the application of 1 T field resulting into MR ~ 85%.
Fig. 3.18 shows the variation of MR% with the temperature for La0.5Pr0.2Ca0.3MnO3
system under 1 T, 2 T and 5 T applied field. The sample exhibiting a peak resistance of
~ 6.8 K exhibit MR ~ 40 % near Tp (140 K) under 1 T while the maximum MR ~ 85 %
has been observed in 5 T field.
50 100 150 200 2500
20
40
60
80
100
120
La0.5Pr
0.2Ca
0.3MnO
3
H = 1T
H = 2T
H = 5T
MR %
T (K)
Figure: 3.18 MR % Vs Temperature plot of La0.5Pr0.2Ca0.3MnO3.
0 1 2 3 4 50
25
50
75
100
0 2 40
40
80
La0.5Pr
0.2Ca
0.3MnO
3
Maxim
um M
R %
H (T)
La0.4Pr
0.3Ca
0.3MnO
3
Maxim
um M
R %
H (T)
Figure: 3.19 Maximum MR% Vs field for La0.4Pr0.3Ca0.3MnO3 and La0.5Pr0.2Ca0.3MnO3.

Transport and magnetic properties of nearly low bandwidth manganites.
III -14
Fig. 3.19 and its inset, shows the dependence of maximum MR % observed for
x = 0.3 sample and La0.5Pr0.2Ca0.3MnO3 sample at different applied fields. It can be
observed from these figures that, in both the samples the MR behavior is sensitive in the
fields up to 2 T with the x = 0.30 samples showing an appreciable rise in MR at 1 T field.
3.3 Magnetization measurements
This section describes the results of the magnetic measurements carried out using
a.c. susceptibility and D.C. magnetization measurements using VSM facility. The a.c.
susceptibility measurements were performed on undoped LaMnO3 and x = 0.10, 0.20
samples while the D.C. magnetization measurements carried out for x = 0.10, 0.15, 0.20 &
0.30 samples.
3.3.1 A. C. susceptibility
Figure: 3.20 A.C. susceptibility plot of LaMnO3.
Fig. 3.20 shows the temperature dependence of a.c. susceptibility of LaMnO3
sample showing strong ferromagnetic transition at TC ~ 225 K. In this sample the I-M
transition temperature (Tp ~ 140K) does not coincide with magnetic transition
(TC ~ 225 K), which has been often observed in the cation deficient system [8]. The
disparity between Tp and TC shows that there is a possibility of electronic phase separation
in the sample. Figs. 3.21 and 3.22 depicts the a.c. susceptibility curves for x = 0.10, 0.20
100 200 3000
40
80
LaMnO3
x = 0.0
χ (arb. unit)
T (K)

Transport and magnetic properties of nearly low bandwidth manganites.
III -15
samples (H = 6 Oe) and x = 0.30 (H = 50 Oe) showing the strong ferromagnetic transition
varying with the dopant concentration x.
La1-2xPrxCaxMnO3 (x = 0.10, 0.15, 0.20)
100 150 200 2500.000
0.002
0.004
0.006
0.008
x = 0.20
x = 0.10
emu / gm
T (K)
100 150 200 2500.00
0.02
0.04
0.06
0.08
0.10
emu / gm
T (K)
x = 0.30
H = 50 Oe
Figure: 3.21 a.c. susceptibility plot of La1-2xPrxCaxMnO3 for x = 0.10, 0.20.
Figure: 3.22 a.c. susceptibility plot of La1-2xPrxCaxMnO3 for x = 0.30.
Fig. 3.23 (a, b, c, d) shows the hysterics curves obtained under 1 T for all the
LPCMO (x = 0.10, 0.15, 0.20, 0.30) samples. We have measured hysteresis behavior
under 1T because the large MR% has been observed under the same field in these
samples. It can be seen from the figures that with the increase in Pr-Ca (x) concentration
the emu/gm value increases up to x = 0.20 with an increase in MR% (Table 3.1). In the
case of x = 0.30 there is an anomaly showing that the magnetization does not saturate up
to 1 T and the emu/gm value is lower in this sample.
3.3.2 D.C. Magnetization
Fig. 3.23 (a, b, c, d) shows the hysterisis curves obtained under 1T for all the
LPCMO (x = 0.10, 0.15, 0.20, 0.30) samples. We have measured hysteresis behavior
under 1T because the large MR% has been observed under the same field in these
samples. It can be seen from the figures that with the increase in Pr-Ca (x) concentration
the emu/gm value increases up to x = 0.20 with an increase in MR % (Table 3.1). In the
case of x = 0.30 there is an anomaly showing that the magnetization does not saturate up
to 1 T and the emu/gm value is lower in this sample.

Transport and magnetic properties of nearly low bandwidth manganites.
III -16
-10000 -5000 0 5000 10000-3
-2
-1
0
1
2
3
La0.8Pr
0.1Ca
0.1MnO
3
x = 0.10
(a)
emu / gm
H (Oe)
-10000 -5000 0 5000 10000-3
-2
-1
0
1
2
3
La0.7Pr
0.15Ca
0.15MnO
3
x = 0.15
(b)
emu / gm
H (Oe)
-10000 -5000 0 5000 10000
-3
-2
-1
0
1
2
3
La0.6Pr
0.2Ca
0.2MnO
3
x = 0.20
(c)
emu /gm
H (Oe)
-10000 -5000 0 5000 10000-3
-2
-1
0
1
2
3
La0.4Pr
0.3Ca
0.3MnO
3
x = 0.30
(d)
emu / gm
H (Oe)
Figure: 3.23 Hysterisis loops of La1-2xPrxCaxMnO3 (x = 0.10, 0.15, 0.20, 0.30) under 1 T.

Transport and magnetic properties of nearly low bandwidth manganites.
III -17
Table: 3.1 Values of Tp and TC, MR % (1 T) and emu/gm determined for
La1-2xPrxCaxMnO3 (x = 0.10, 0.15, 0.20 and 0.30) and La0.5Pr0.2Ca0.3MnO3
samples.
La1-2xPrxCaxMnO3 ~ Tp (K) ~ TC (K) ~ MR % (1 T) emu/g
x = 0.10 120 175 57 2.25
x = 0.15 122 72 2.40
x = 0.20 122 184 80 2.78
x = 0.30 122 150 89 2.21
La0.5Pr0.2Ca0.3MnO3 150 160 45
100 150 2000.00
0.03
0.06
0.09
H = 50 Oe
La0.4Pr
0.3Ca
0.3MnO
3
FC
ZFC
emu /gm
T (K)
100 150 2000.00
0.02
0.04
0.06
0.08
0.10
La0.50Pr
0.20Ca
0.30MnO
3
ZFC
FC
H = 50 Oe
emu /gm
T (K)
Figure: 3.24 ZFC and FC curves of La0.4Pr0.3Ca0.3MnO3 under 50 Oe.
Figure: 3.25 ZFC and FC curves of La0.5Pr0.2Ca0.3MnO3 under 50 Oe.
Figs. 3.24 and 3.25 shows ZFC and FC curves for La0.4Pr0.3Ca0.3MnO3 (x = 0.30)
and La0.5Pr0.2Ca0.3MnO3 samples under 50 Oe fields. The curves for x = 0.30 sample
shows the presence of anisotropic nature in the magnetization more pronounced as
compared to La0.5Pr0.2Ca0.3MnO3 (fig. 3.25) [29].

Transport and magnetic properties of nearly low bandwidth manganites.
III -18
3.4 Results and discussion
The observation of large CMR effect at low temperatures at and below Tp in the
samples studied in the present work can be attributed to the inter-grain tunneling
magnetoresistance. This observation can be explained on the basis of scattering of charge
carriers at the interfaces of grain boundaries due to the application of magnetic field. It can
be explained as an electron moving from initial grain to the next magnetic grain crosses
two interfaces in its journey, each of which may behave as the scattering center [30]. This
acts as an insulating barrier to the conduction of the carriers through the grains. Since
A-site is occupied by different size cations, so unlike cations may occupy the positions at
the faces of the adjacent grains [30, 31]. Hence, due to decrease in <rA> with Pr-Ca (x)
concentration, the Mn environment changes at the interfaces of the connecting grains,
which results in equal probability of weak and strong scattering of electrons at the
interfaces. The strong scattering can be suppressed by the application of larger magnetic
fields, to account for the larger drop in resistance as size disorder increases with x content
[32].
The presently studied LPCMO system exhibits strong ferromagnetic behavior. The
observation of magnetic anisotropy in higher (x) concentration is possibly due to the
coexisting FM and AFM clusters. This coexistence of the mixed phases near the first order
transition, results into the non-coincident Tp and TC behavior [33]. The increasing Pr and
Ca content increases the coexisting metal insulator phases and the carrier concentration. It
can be interpreted from the magnetization measurements that, in the region where FM part
prevails over the metallic one, separate FM droplets exist. The Zener double exchange is
operative in these individual FM droplets but not across droplets, thus showing a small FM
insulating region. The inhomogeneous cluster formation for different compositions shows
lower Tp. At a certain temperature the individual ferromagnetic clusters coalesce into large
aggregates resulting into I-M transition [31, 34]. The magnetotransport behavior is
observed under 1 T field showing large CMR effect for all the Pr-Ca compositions. The
low Curie temperature puts the presently studied system in the category of nearly low
bandwidth system, which exhibits non-coincident electric and magnetic transitions [34].

Transport and magnetic properties of nearly low bandwidth manganites.
III -19
3.5 Conclusion
In the present work, we have synthesized using solid state reaction route, the pure
LaMnO3 cation deficient sample and less cation deficient system like
La1-2xPrxCaxMnO3 (x = 0.10, 0.15) which have been optimized for long range
ferromagnetic order in it, exhibiting I-M transition and appreciable MR behavior under
low applied field.
The La1-2xPrxCaxMnO3 (x = 0.20, 0.30) system of simultaneous doping of Pr and
Ca showing high MR % under relatively low field 1 T.

Transport and magnetic properties of nearly low bandwidth manganites.
III -20
References
1. J. M. D. Coey, M. Viret, Advances in Physics 48, 2, 167 (1999)
2. J. Topfer, Jean-Pierre Doumerc and Jean-Claude Grenier, J. Mater. Chem. 6(9),
1511 (1996)
3. J. A. M. van Roosmalen and E.H. P. Cordfunke, J. Solid State Chem. 110, 100
(1994)
4. J. Topfer and J. B. Goodenough, J. Solid State Chem. 130, 117 (1997)
5. J. H. Kuo, H.U. Anderson and D.M. Sparlin, J. Solid State Chem. 52 (1989)
6. B. C. Toffield and W. R. Scott, J. Solid State Chem. 10, 183 (1974)
7. R. Mahendiran, R. Mahesh, A.K. Raychaudhury and C.N.R. Rao, Pramana 44,
L393 (1995)
8. Anthony Arulraj, R. Mahesh, G.N. Subbanna, R. Mahendiran, A.K. Raychaudhury
and C.N.R. Rao, J. Solid State Chem. 127, 87 (1996)
9. C. Zener, Phys. Rev. 82, 403 (1951)
10. E. O. Wollan and W. C. Kohler, Phys. Rev. 100, 545 (1955)
11. M. Hervieu, R. Mahesh, N. Rangavittal and C.N.R. Rao, Eur. J. Solid State Inorg.
Chem. 32, 79 (1995)
12. G. H. Jonker and J. H. Van Santen, Physica 16, 337 (1950)
13. V. I. Pavlov, A.K. Bogush, I.V. Balyko, Crystal Res & Technol 19, 237 (1984)
14. Thesis R. Mahendiran, Department of Physics, IISC, Bangalore (1996)
16. Y. Tomioka, A. Azamitru, H. Kuwahona, Y. Morimoto and Y. Tokura, Phys.
Rev. B, 53, R1689 (1996)
17. Elbio Dagoito, Takashi Holta, Adrita Moreo, Physics Reports 344, 1-153 (2001)
18. H Y Hwang, S-W Cheong, P G Radaelli, M Marezio and B Batlogg, Phys. Rev.
Lett., 77, 2041 (1996)
19. K Knizek, Z Jirak, E. Pollert, and F Zounova, J. Solid-state Chem. 100, 292 (1992)
20. V. Kiryukhin, D. Caga, J. P. Hill, B. Kiemer, A. Vigliante, Y. Tomioka,
Y. Tokura, Nature 586, 813 (1997)
21. D. E. Cox, P. G. Radaelli, M. Marezio, Phys. Rev B 57, 3305 (1998)

Transport and magnetic properties of nearly low bandwidth manganites.
III -21
22. A P Ramirez, J. Phys: Condens. Matter 9, 5171, (1997)
23. A. Maignan, C. Michel, M. Hervieu and B. Raveau, Solid State Comm. 101 (4),
277-281 (1997)
24. Ziese Michael, Srinitiwarawong Chatchai, Phys. Rev. B, 58, 11519 (1998)
25. Coey J M D, Viret M, Ranno L, Ounadjela K, Phys. Rev. Lett., 75, 3910 (1995)
26. Viret M, Ranno L, Coey J M D, J. Appl. Phys., 81, 4964 (1997)
27. A. Gupta, Gong G. Q., Xiao Gang, Duncombe P. R., Lecoeur P., Trouilloud P.,
Wang Y. Y., Dravid V. P., & and Sun J. Z., Phys. Rev. B., 54, 629 (1996)
28. Colossol Magnetoresistance, Charge Ordering and related properties of Manganese
Oxides Ed. By. C.N.R. Rao, B. Raveau. World Scientific Publishing Co. Pte. Ltd.
(1998)
29. Q. G. Gong, A. Gupta, Lecoeur P., Trouilloud P., Phys. Rev. B., 54, R3742 (1996)
30. Hielman A K, Xue Y Y, Lorenz B, Campbell B J, Cmaidalka J, Wang R L, Chu C
W, Phys. Rev.B, 65, 214423 (2002)
31. X. W. Li, A. Gupta, G. Xiao, and G. Q. Gong, Appl. Phys. Lett. 71, 1124 (1997)
32. Rodriguez-Martinez L M and Attfield J P, Phys. Rev. B, 54, R15622 (1996)
33. R. Mahendiran, R. Mahesh, A. K. Raychaudhuri, C. N. R. Rao, Solid State
Commun. 99, 149 (1996)
34. J. M. D. Coey, Philos. Trans. R. Soc. London, Ser. A, 356, 1539 (1998)

Chapter Chapter Chapter Chapter –––– IV IV IV IV

IV - 1
Introduction
The simultaneous substitution of Pr-Ca induces interesting properties in the
resulting manganite system. The La1-2xPrxCaxMnO3 in the previous chapter has been
identified as a low bandwidth system exhibiting transition temperature below 120 K with
significant CMR effect at relatively weaker fields [1, 2]. However, we have optimized this
series with a sample to show that an optimal density La0.5Pr0.2Ca0.3MnO3 composition
exhibit low Tp and TC with a large MR%. In this chapter we have taken this sample as
basis for the study of bandwidth modifications and cation size variance effect by Sr2+ and
Ba2+ substitution on the electronic, magnetic and magnetotransport properties of the
resulting system. In this endeavor, we have synthesized two series as
La0.5Pr0.2Ca0.3-xSrxMnO3 (LPCSMO); x = 0.0-0.20 (0.05) and La0.5Pr0.2Ca0.3-xBaxMnO3
(LPCBMO); x = 0.0-0.30 (0.05). Lastly, we show that, increasing the cation size variance
above a certain limit in La0.4Pr0.3Ba0.3MnO3 results in the phase-segregation indicative
from the extra peaks of BaMnO3 in the XRD spectrum. The conductivity in the
semiconducting region is dominated by Mott’s Variable Range Hopping type of
conduction of polarons [3]. The structural, electrical, magnetic and magnetotransport
properties have been studied using XRD, magnetoresistance and magnetic susceptibility
measurements in the light of bandwidth modification and cation size disorder effects.
As mentioned earlier I-M & PM-FM transition temperatures, which are due to
spin-polarized conduction of carriers through Zener-Double exchange depends upon the eg
electron bandwidth and carrier density [4]. La0.7Ca0.3MnO3 (LCMO) and Pr0.7Ca0.3MnO3
(PCMO) are intermediate and low bandwidth systems respectively. The dependence of
transition temperature is ascribed to the amount of divalent cation doping and average A-
site cation radius which is quantified by a tolerance factor, t = <A-O>/(√2<Mn-O>).

IV - 2
L.M. Rodriguez-Martinez et al [5] defined a quantitative factor called size variance,
σ 2=∑xiri2-<rA>
2 - - - - (1), where xi is the fractional occupancy of the cation with
ionic radius ri and <rA> is the average A-site cation radius; characteristic of the mismatch
of size of the different cations occupying A-site and studied its effect on the structural and
transport behavior [5]. It is an established fact that, the optimal divalent cation doping of
33% in the absence of any cation size mismatch induces the largest possible concomitant
electrical and magnetic transition temperatures. The effect of substitution of larger cation
Sr2+ is interesting to observe the bandwidth modification and cation size mismatch effects.
We have studied the La0.5Pr0.2Ca0.3-xSrxMnO3 (LPCSMO); x = 0.0-0.20 (0.05) and
La0.5Pr0.2Ca0.3-xBaxMnO3 (LPCBMO); x = 0.0-0.30 (0.05) systems with an aim to
investigate the modifications in the transport and MR behavior with increasing bandwidth
and size disorder.
4.1 Studies on (La0.5Pr0.2)(Ca0.3-xSrx)MnO3 (LPCSMO)
x = 0.0-0.20 (0.05) series
4.1.1 Experimental details & structural studies
High purity La2O3, Pr6O11, CaCO3, SrCO3, BaCO3 and MnO2 powders were taken
for synthesizing the thoroughly mixed and calcinated at 950ºC. All the samples were
pelletized and sintered in the range of 1100-1400ºC with several intermittent grindings.
A.c and d.c. susceptibility measurements were carried out for the magnetic susceptibility
studies.
XRD measurements using Cu-Kα radiation were performed for the structural
determination and phase purity. The Rietveld refinement program using FULLPROF
program was employed. The refined XRD patterns of all the samples are given in
figure 4.1, while figure 4.2 shows a typical Rietveld fitted pattern of x=0.15 sample.

IV - 3
2 0 4 0 6 0 8 00
5
1 0x = 0 .3 0
x = 0 .1 0
x = 0 .1 5
x = 0 .1 0
(L a0 .5P r
0 .2C a
0 .3 - xS r
xM nO
3)
Intensity (a.u)
2 θ (D e g r e e )
Figure 4.1: XRD pattern of the La0.5Pr0.2Ca0.3-xSrxMnO3 (x = 0.0 - 0.20)
2 0 3 0 4 0 5 0 6 0 7 0 8 0-2 0 0
0
2 0 0
4 0 0
(L a0 .5P r
0 .2C a
0 .1 5S r
0 .1 5M nO
3)
Iintensity (a.u)
2 θ (D e g re e )
E x p e r im e n ta l R e f in e d D if f e r e n c e B ra g g p e a k
Figure 4.2: Rietveld fitted XRD pattern of the La0.5Pr0.2Ca0.3-xSrxMnO3 (x=0.15)
Rietveld refinement using FULPROOF program of all the samples for phase purity and
structural investigations reveals a good phase formation with an impurity ~1-2% of mother

IV - 4
compounds for some of the samples. In this series all the samples fit to a distorted
orthorhombic structure. The cell parameters and hence the volume increases with
increasing Sr concentration, which can be attributed to larger size cation substitution
effect. Table – 4.2 shows the variation of cell parameters, cell volume <rA> and σ2 wih
increasing x.
Table 4.1 : Structure, cell parameters and cell volume of La0.5Pr0.2Ca0.3-xSrxMnO3 (0≤x≤0.20) samples.
x Structure a (Å) b (Å) c (Å) Volume(Å3)
0 Orthorhombic (Pnma) 5.4576(1) 7.7224(2) 5.4436(2) 229.426
0.05 Orthorhombic (Pnma) 5.4482(1) 7.7295(1) 5.4633(1) 230.078
0.10 Orthorhombic (Pnma) 5.4559(2) 7.7145(1) 5.4774(2) 230.532
0.15 Orthorhombic (Pnma) 5.4859(1) 7.7145(2) 5.4592(1) 231.045
0.20 Orthorhombic (Pnma) 5.4995(2) 7.7165(1) 5.4613(2) 231.764
4.1.2 Electronic transport and magnetoresistance
Fig. 4.3 depicts the R-T and magneto R-T behaviour of LPCSMO samples in
absence of magnetic field and in applied magnetic fields of 1 Tesla, 2 Tesla and 5 Tesla.
The electrical transport behavior of the LPCSMO system, reveals that, as Sr2+
concentration increases, the transition temperature increases with a subsequent fall in
resistivity, which has its origin in the modification of eg electron bandwidth as the average
A-site cation radius increases by Sr2+ substitution.

IV - 5
100 200 3000
50
100
x = 0.2
Resistance ( Ω )
T (K)
0T1T2T5T
0
30
600T1T2T5T
x = 0.15
0
40
80
0T1T2T5T
x = 0.1
0
300
6000T1T2T5T
x = 0.05
0
2000
4000
6000(La
0.5Pr0.2)(Ca
0.3-xSrx)MnO
3
0T1T2T5T
x = 0
Figure: 4.3 R-T and magneto R-T plots for La0.5Pr0.2Ca0.3-xSrxMnO3; x = 0.0 - 0.20 (0.05)
series.
In order to understand the conduction mechanism of polarons created as a result of
electron-phonon coupling in the semiconducting region, we fitted the R-T data LPCSMO
samples in figure 4.4, to nearest neighbor small polaron hopping model [6, 7]
corresponding to ρ = ρ0 exp(Ea/kT) and the Mott’s type Variable Range Hopping model
[8, 9] (VRH) corresponding ρ = ρo exp(To/T)1/4.

IV - 6
As shown in figures 3&4, the data fits linearly in lnρ vs. T -0.25 plot, suggesting
that, the conduction of the carriers in the semiconducting region obeys the Mott’s Variable
Range Hopping model. To in this equation is related to localization length by a relation,
kTo = 18/L2 N(E) - - - - (2)
where L is the localization length of the carriers and N(E) is the density of states.
It is observed from the magneto R-T measurements on Sr2+ substituted
La0.5Pr0.2Ca0.3-xSrxMnO3 system (fig.2) that, Tp increases with increasing Sr content and a
subsequent fall in MR%. The transition temperature is revived from 140 K to 247 K and
CMR effect falls from 46% to 7% at a field of 1T with the 20% substitution of Sr2+. Since
the larger cation increases the Mn-O-Mn bond angle towards 180º and the fall in the
magnetic disorder at the Mn-O couplings accounts for the low CMR effect [10].
Interestingly the CMR effect increases consistently at low temperature below transition
temperature with increasing Sr content. This low temperature large CMR effect is due to
the intergrain tunneling magnetoresistance [11]. The drop in the resistance in the higher
magnetic field also increases with doping concentrations.
The magnetoresistance also occurs as result of the reduction of the scattering of the
carriers at the interfaces due to application of magnetic field. The scattering of the carriers
at the interfaces can be understood in the following way [12]. An electron moving from
initial grain to the next magnetic grain crosses two interfaces in its journey, each of which
may scatter the electron. This acts as an insulating barrier to the conduction of the carriers
through the grains. Since A-site is occupied by different size cations, so unlike cations may
occupy the positions at the faces of the adjacent grains. Hence, due to increasing size
variance, the Mn environment varies at the interfaces of the connecting grains, which
results in equal probability of weak and strong scattering of electrons at the interfaces. The

IV - 7
strong scattering can be suppressed by the application of larger magnetic fields, to account
for the larger drop in resistance as size disorder increases with Sr content. Another notable
factor is that, the trend in the increase in TC is not linear with Sr concentration, being
larger for lower compositions and smaller for higher Sr content. This leads to deviation in
the ideal relationship of Tc and tolerance factor [4].
It can be explained by the mismatch of the cations at A-site, which increases with
Sr content. The large size variance, as calculated from equation, 222 ><−∑=Aiirrxσ ,
induces the strain in the lattice by random displacement of oxygen ions and hence
obstructs the Zener-Double exchange.

IV - 8
0.24 0.26 0.28 0.303
4
5
6
7
8
9
0.004 0.006 0.008 0.010
-2
0
2
4
0.002 0.003 0.004 0.005 0.006
-3
-2
-1
0
1
2
0.0030 0.0035 0.0040 0.0045 0.0050
-3
-2
-1
0.0036 0.0045
-2
-1
ln (R/T)
T -0.25
x = 0
ln (R/T)
T -1
0.24 0.26 0.282
4
6
x = 0.05
ln (R/T)
ln R
T -0.25T
-1
0.24 0.25 0.26 0.272.5
3.0
3.5
4.0
4.5
5.0
x = 0.10
ln R
ln R
T -0.25
0.240 0.245 0.250 0.255 0.260 0.265 0.270
3
4
x = 0.15
ln R
T -0.25
ln (R/T)
T -1T
-1
Figure 4.4: Mott’s VRH model (ln R vs T -0.25) and small polaron model (ln (R/T) vs T -1)
fits for La0.5Pr0.2Ca0.3-xSrxMnO3; x = 0.0 - 0.15 (0.05) series.
The fitting of the electrical transport data in the semiconducting region reveals that
conduction in this region occurs through the Mott’s Variable Range hopping of polarons.
CMR effect is found to have an inverse relationship with the transition temperature. The
A-site disorder increases with Sr concentration and leads to microscopic inhomogenieties
in the samples through the random displacement of oxygen anion and showing its
influence on the electrical, magnetic and magnetotransport properties.

IV - 9
4.1.3 Magnetization
The magnetic susceptibility plots for LPCSMO samples (fig. 4.5) shows an
increasing trend in Curie temperature with increasing Sr content. It is inferred that the
magnetic irreversibility decreases with increasing transition temperature.
50 100 150 200 2500
1
2
3
4
5
M (10-3emu/g)
T (K )
Sr = 0% Sr = 5% Sr = 10%
Figure 4.5: Magnetic susceptibility vs Temperature plots for La0.5Pr0.2Ca0.3-xSrxMnO3
series.
4.2. Studies on (La0.5Pr0.2)(Ca0.3-xBax)MnO3 (LPCBMO) (0.05≤x≤0.3)
In addition to Sr2+, Ba2+ is another divalent cation which is interesting for
substitution at A-site due to two reasons, namely, 1) due to its larger size (~1.47Å) it
enhances the tolerance factor significantly and 2) due to large mismatch with size of the
other cations at A-site, it increases the A-site size-disorder. As mentioned earlier, the
increasing size disorder increasing the intrinsic inhomogenieties, which may affect the
transport, magnetic and magnetotransport properties of the resulting compounds. As
shown in the previous section, the La0.5Pr0.2Ca0.3MnO3 is a suitable system for

IV - 10
substitutional studies aiming to elucidate the effect of tolerance factor and size-variance.
Keeping this in mind, we have replaced the smaller size divalent cation, Ca2+, by a larger
size cation, Ba2+, in the system (La0.5Pr0.2)(Ca0.3-xBax)MnO3 (0.05≤x≤0.3) and studied the
ionic size and size disorder effect on the structural, transport and magnetic properties. In
this series, the size-disorder increases from 0.0001Å2 for x=0 to 0.016 Å2. Such a large
variation of size-disorder across the series makes all these compounds, an interesting
subject of investigations. Other than this series of compounds, we have also tried to
synthesize the compound, La0.4Pr0.3Ba0.3MnO3, which possesses the largest size-disorder
among all the compounds studied in this section. In the La0.4Pr0.3Ba0.3MnO3 manganite
sample, we find the chemical phase-segregation, resulting in secondary phase [14]. The
various structural, transport, magnetotransport and magnetic properties are collated in the
following sections.
4.2.1 Experimental details
All the (La0.5Pr0.2)(Ca0.3-xBax)MnO3 (0.05≤x≤0.3) and La0.4Pr0.3Ba0.3MnO3
compounds were synthesized using conventional solid-state reaction route. Constituent
oxides (La2O3, Pr6O11, and MnO2) and carbonates (SrCO3 and CaCO3) were mixed
thoroughly in stoichiometric proportions and calcined at 950°C for 24 hours. These were
ground, pelletized and sintered in the temperature range of 1100°C - 1200°C for 100 hours
with many intermediate grindings. The final sintering was carried out at 1300°C for 24
hours. X-ray diffraction (XRD) patterns were recorded in the 2θ range of 20o – 80o on a
Siemens diffractometer. Magnetization measurements were performed using a SQUID
magnetometer (MPMS XL, Quantum Design). The resistivity and magnetoresistance
measurements were carried using d.c. four probe method on a physical property
measurement system (PPMS, Quantum Design).

IV - 11
4.2.2 Structural Studies
The XRD patterns of all the (La0.5Pr0.2)(Ca0.3-xBax)MnO3 (0.05≤x≤0.3) (to be
referred as LPCBMO) samples were indexed to be single phase compounds crystallizing in
a distorted orthorhombic structure. Rietveld refinement technique using FULLPROF
software was employed to obtain to refined cell parameters. Figure 4.6 shows the XRD
patterns of all the samples while figure 4.7 displays a typical Rietveld refined XRD pattern
of x=0.2 and La0.4Pr0.3Ba0.3MnO3 (LPBMO) samples. It is seen that there is an excellent
agreement of experimental and fitted patterns of x=0.20 sample and is, therefore, single-
phase compound. However, when LPBMO fitted to orthorhombic structure shows some
additional peaks in the structure indicated by (*), presumably of BaMnO3 [6]. This sample
has maximum A-site size-disorder and may be the cause of the structural phase
segregation. This shows that, above a certain critical limit of A-site size-disorder, it exert a
structural strain and results in phase-segregation. Table – 4.2 shows the variation of cell
parameters, cell volume <rA> and σ2 with increasing x.
Table 4.2: Structure, cell parameters and cell volume of (La0.5Pr0.2)(Ca0.3-xBax)MnO3
(0.05≤ x ≤0.3) samples.
(La0.5Pr0.2)(Ca0.3-xBax)MnO3
(0.05≤ x ≤0.3) a (Å) b (Å) c (Å) Cell Volume
X=0.05 5.46603(2) 7.72868(2) 5.47161(2) 231.149
X=0.10 5.47066(2) 7.73082(2) 5.49513(2) 232.404
X=0.15 5.47913(2) 7.7416(2) 5.51209(2) 233.808
X=0.20 5.48911(2) 7.75494(2) 5.52533(2) 235.201
X=0.25 5.49859(2) 7.76887(2) 5.48911(2) 236.439
X=0.3 5.51182(2) 7.79095(2) 5.54783(2) 238.237

IV - 12
2 0 3 0 4 0 5 0 6 0 7 0 8 0
0
8 0
1 6 0 x = 0 .3 0x = 0 .2 5
x = 0 .0 5x = 0 .1 0
x = 0 .1 5
x = 0 .2 0
(L a0 .5P r
0 .2C a
0 .3 -xB a
xM nO
3)
Intensity (a.u)
2 θ (D e g re e )
Figure 4.7: XRD patterns of the (La0.5Pr0.2)(Ca0.3-xBax)MnO3 (0.05≤x≤0.3) sample

IV - 13
Figure 4.8: Rietveld fitted patterns of (La0.5Pr0.2)(Ca0.3-xBax)MnO3 (x=0.20) and
La0.4Pr0.3Ba0.3MnO3 samples. The asterisks in the fitted patterns of LPBMO
sample (Lower panel) depict the secondary phase of BaMnO3.

IV - 14
4.2.3 Electrical Resistivity
The plots of electrical resistivity as a function of temperature for all the
(La0.5Pr0.2)(Ca0.3-xBax)MnO3 (0.05≤x≤0.3) in zero field and in a fields of 5T and 9T over a
temperature range of 5 K-320 K. The plots are shown in figs. 4.9 and 4.10.
0
10
20
T (K)
x = 0.05 H = 0T H = 5T H = 9T
0
5
10
15 x = 0.1 H = 0T H = 5T H = 9T
R (k Ω)
0 100 200 3000
0.4
0.8
1.2
x = 0.15
(La0.5Pr0.2)(Ca
0.3-xBa
x)MnO
3
H = 0T H = 5T H = 9T
Figure 4.9: Resistivity as a function of temperature in 0T, 5T and 9T in a temperature
range of 5 K-320 K for (La0.5Pr0.2)(Ca0.3-xBax)MnO3 (0.05≤x≤0.15) samples.
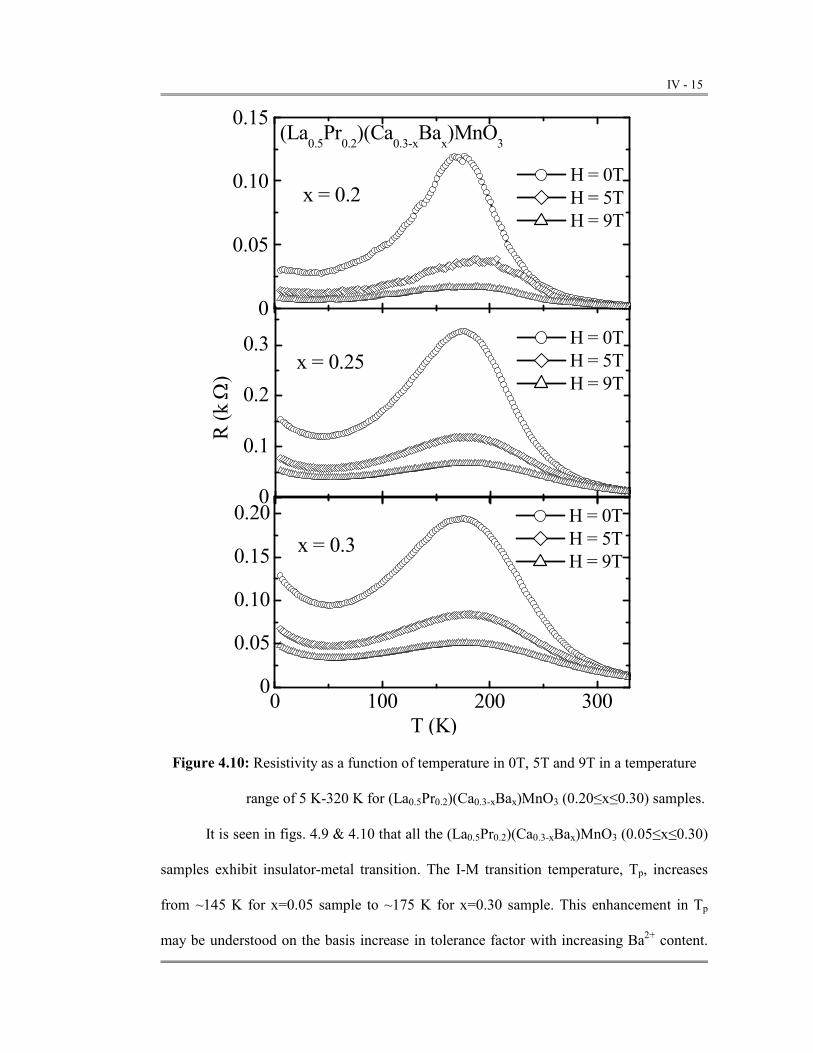
IV - 15
0
0.05
0.10
0.15
T (K)
x = 0.2 H = 0T H = 5T H = 9T
0
0.1
0.2
0.3x = 0.25
H = 0T H = 5T H = 9T
R (k Ω)
0 100 200 3000
0.05
0.10
0.15
0.20
x = 0.3
(La0.5Pr0.2)(Ca
0.3-xBa
x)MnO
3
H = 0T H = 5T H = 9T
Figure 4.10: Resistivity as a function of temperature in 0T, 5T and 9T in a temperature
range of 5 K-320 K for (La0.5Pr0.2)(Ca0.3-xBax)MnO3 (0.20≤x≤0.30) samples.
It is seen in figs. 4.9 & 4.10 that all the (La0.5Pr0.2)(Ca0.3-xBax)MnO3 (0.05≤x≤0.30)
samples exhibit insulator-metal transition. The I-M transition temperature, Tp, increases
from ~145 K for x=0.05 sample to ~175 K for x=0.30 sample. This enhancement in Tp
may be understood on the basis increase in tolerance factor with increasing Ba2+ content.

IV - 16
Progressive substitution of Ba2+ (1.47Å) at Ca2+ (1.18Å) induces a large increase in
average A-site cation radius and hence the tolerance factor increases to a larger extent.
4.2.4 Magnetization measurements
The temperature dependence of magnetization measurements for all the samples
were performed in zero-field-cooled (ZFC) and field-cooled (FC) manner. This implies
that sample is cooled in zero-field (ZFC) to the lowest temperature and then a certain field
is applied for measuring the magnetization of the sample in warming direction. After this
temperature of magnetization, the sample is cooled in the same magnetic field (FC) to the
lowest temperature and then measured the magnetization while warming. The ZFC and FC
magnetization versus temperature for all the (La0.5Pr0.2)(Ca0.3-xBax)MnO3 (0.05≤x≤0.30)
samples is shown in fig. 4.11.

IV - 17
0 100 200 3000
2
4
6
8
(ZFC - FC)
x = 0.15
x = 0.10x = 0.05
M (emu/g)
T(K)
0
2
4
6
8
10
H=50 Oe
La0.5Pr0.2Ca
0.3-xBa
xMnO
3
x = 30
x = 0.25
x = 0.20
Figure 4.11: Zero-field-cooled (ZFC) and field-cooled (FC) magnetization (M) as a
function of temperature for (La0.5Pr0.2)(Ca0.3-xBax)MnO3 samples in a field of
50 Oe.
The Curie temperature (TC) increases from 150K for x=0.05 to 220K for x=0.30.
With increasing Ba-substitution, the increasing trend of TC is similar to increasing trend of
the insulator-metal transition temperature (Tp). However, it is seen that the TC and Tp of

IV - 18
these samples do not match with each other and this disparity increases with increasing
Ba-concentration. This disparity is not in accordance with the Zener-Double-Exchange
interactions and can be explained on the purview of possible grain boundary localization
or phase separation. It is needless to mention that the polycrystalline samples of various
micron sized grains, in which properties may vary inside the grain and on the grain
boundaries. As the ZDE come into play, the bulk part of the grain become ferromagnetic
and metallic while the grain boundaries are still insulating. The grain boundaries may be
insulating because of the grain boundary pinning of Mn-ion spins, poor connectivity and
grain boundary contamination [15]. This creates the insulating channels at the grain
boundaries and does not allow the percolation of the charge carriers and results in
insulating behavior even after the onset of TC. Once the grain boundaries become
conducting at lower temperatures, the I-M transitions appear. Other factor that can cause a
disparity between Tp and TC is the phase-separation as explained in [16]. Due to the
granular mixture of different electronic densities, the TC of different grains could be
different. For instance, we assume that majority of the grains have large electronic density
so that they exhibit TC at higher temperatures, while the remaining minor fraction have
lower TC. Now, at the onset of the TC of majority of grains (with higher TC), the systems
tends to be ferromagnetic even as a minority of grain are still paramagnetic-insulating. In
such as a situation, though the system will be ferromagnetic, it will continue to exhibit
semiconducting/insulating behavior unless all the grains become ferromagnetic. At a
certain temperature when the whole system attains ferromagnetism, percolation is possible
and the system exhibits I-M transition. The disparity in TC and Tp in the present system
may be because of either or both of the above stated causes. We get an evidence of the
phase separation from the d.c. magnetic susceptibility.

IV - 19
0 100 200 3000
2000
4000
6000
La0.5Pr0.2Ca
0.3-xBa
xMnO
3
x=0.20
x=0.15
x=0.10x=0.25
x=0.05
H = 5000 Oe
H/M
T(K)
Figure 4.12: Inverse susceptibility (H/M at H = 5 kOe) as a function of temperature for
(La0.5Pr0.2)(Ca0.3-xBax)MnO3 samples.
Fig. 4.12 shows the inverse susceptibility as a function of temperature for the
(La0.5Pr0.2)(Ca0.3-xBax)MnO3 (0.05≤x≤0.25) samples when magnetization is acquired in a
field of 5kOe. It is seen that there exists a deviation of Curie-Weiss law from the
paramagnetic susceptibility of all the samples. This indicates towards the magnetic
inhomogeneities or possible existence of ferromagnetic clusters in the paramagnetic
region. Such inhomogeneities, which may be present both in paramagnetic and

IV - 20
ferromagnetic regions, suggesting that phase separation could be one cause of disparity of
TC and Tp in these samples.
0.0 0.2 0.4 0.6 0.8 1.00.0
0.4
0.8
1.2
1.6
La0.5Pr0.2Ca
0.3-xBa
xMnO
3(FC-ZFC)/ZFC
T/Tc
x = 0.05 x = 0.10 x = 0.15 x = 0.20 x = 0.25 x = 0.30
Figure 4.13: Fractional change of magnetization (MFC-MZFC/MZFC) versus
temperature (T) for all the (La0.5Pr0.2)(Ca0.3-xBax)MnO3 samples.
On the other hand, we evidence a large bifurcation of ZFC and FC magnetization
curves for all the samples. To quantify this separation, we have plotted a quantity called
fraction change in magnetization (MFC-MZFC/MZFC) as a function of normalized
temperature (T/TC) in figure 4.13. As seen in this figure that (MFC-MZFC/MZFC) decreases
as function of increasing Ba2+ concentration. The x=0.30 sample does not follow this trend
because this sample was prepared in a different batch with a slightly different synthesis
route. Also, it is mentioned that generally a bifurcation of MZFC and MFC arises from grain
boundary pinning. In the samples under present study, the a large bifurcation of the two
curves in all these Ba2+ substituted samples suggests enhanced grain boundary pinning

IV - 21
and, thus, the grain boundary localization [13]. Therefore, this factor is also likely to play a
role in the disparity of Tp and TC of these samples. Thus, by providing experimental
evidence of phase-separation and grain boundary localization, we show that these factors
cause the I-M transition to occur at lower temperatures than TC.
4.2.5 Magnetoresistance measurements
The resistance was measured as a function of applied magnetic field at various
temperatures for all (La0.5Pr0.2)(Ca0.3-xBax)MnO3 (0.05≤x≤0.30) samples. From these data
magnetoresistance was calculated using the formula MR(%)=(ρ0-ρH)/ρ0×100 and the
plots of magnetoresistance versus magnetic field isotherms are shown in figs. 4.14 & 4.15.
It may be seen that all the samples exhibit maximum MR in the vicinity of their respective
I-M transition temperatures. Maximum MR in the vicinity of Tp may be explained on the
basis of field induced suppression of spin fluctuation. At the I-M transition, there exists
maximum magnetic disorder and magnetic field enhances the ferromagnetic spin ordering.
On the other hand, at low temperature we observe two features in MR. One, a large MR of
nearly 20% in a low field of 0.5-1 Tesla and other, a low MR at higher fields. Here, a large
low-field MR arises from the inter-grain spin-polarized tunneling while a low high-field
MR is also because of almost complete spin-polarization at low temperatures.

IV - 22
0
30
60
90
5K 50K 100K 140K 160K
x = 0.05
(La0.5Pr0.2)(Ca
0.3-xBa
x)MnO
3
H (kOe)
0
30
60
90
5K 50K 100K 140K 160K
x = 0.1
MR%
0 30 60 900
30
60
90
5K 50K 100K 140K 160K
x = 0.15
Figure 4.14: Magnetoresistance (MR%) as a function of magnetic field (H) at various
temperatures for (La0.5Pr0.2)(Ca0.3-xBax)MnO3 (0.05≤x≤0.15) samples.

IV - 23
0
20
40
60
80
5K 50K 100K 160K 180K
x = 0.2
(La0.5Pr0.2)(Ca
0.3-xBa
x)MnO
3
H (kOe)
0
20
40
60
80
5K 50K 100K 160K 180K
x = 0.25
MR%
0 30 60 900
20
40
60
80
5K 50K 100K 160K 180K
x = 0.3
Figure: 4.15 Magnetoresistance (MR%) as a function of magnetic field (H) at various
temperatures for (La0.5Pr0.2)(Ca0.3-xBax)MnO3 (0.20≤x≤0.30) samples.
In figs. 4.14 & 4.15, we observe that at lower Ba2+ substitution, the maximum MR
of ~95% for x=0.05 decreases to a maximum of ~75% for x=0.30 sample in the vicinity of
their respective I-M transition temperatures. As the temperature decreases below the I-M

IV - 24
transition temperature, the MR starts decreasing. Interestingly, we see two clear trends in
MR with decreasing temperature and increasing Ba2+ concentration. As the temperature
goes below 50K [17], we observe an enhancement in MR in low-fields while the MR in
high-fields decreases. Also, it is seen that the low field MR at low temperatures increases
with increasing Ba2+ content. This trend may be explained as follows [17, 18, 19]. As Ba2+
content increases, the increase in TC suggests that the spin polarization will increase at low
temperatures. The enhanced spin polarization will result in larger spin-polarized inter-
grain tunneling on the application of small fields. Hence, we observe increasing low-field
MR as the TC increases with increasing Ba2+ concentration. The high field MR at low
temperatures occurs due to magnetic disorder at Mn-O-Mn bonds (due to Zener-Double-
Exchange) and pinning of Mn-ion spins at the grain boundaries. As stated above the spin
polarization increases and, hence, the spin magnetic disorder decreases at the Mn-O-Mn
bonds, which results in a low high-field MR as the TC increases.
4.3 Comparative study of La0.5Pr0.2Ca0.3-xSrxMnO3 (LPCSMO); x = 0.0-0.30 (0.05)
and La0.5Pr0.2Ca0.3-xBaxMnO3 (LPCBMO); x = 0.0-0.30 (0.05)
The substitution of Sr2+(~1.31 Å) and Ba2+(~1.47 Å) in La0.5Pr0.2Ca0.3MnO3 results
in the LPCSMO and LPCBMO series, which have mixed impact of tolerance factor and
size-disorder on the transport and magnetic and magnetotransport properties. Here we
compare some of the properties of these two series. In both LPCSMO and LPBMO series,
the tolerance factor and size-disorder increases with increasing substitution of Sr2+ and
Ba2+ respectively. The respective increase in average A-site cation radius (<rA>, which
represents the tolerance factor) and A-site cation disorder in both the series is depicted in
Fig. 4.16.

IV - 25
1.20 1.22 1.24 1.26 1.280.000
0.004
0.008
0.012
0.016
A=Sr A=Baσ
2 (Å2 )
rA (Å)
Figure 4.16: Variation of A-site cation size-disorder as a function of <rA> for both the
LPCSMO and LPCBMO series.
It is seen from Fig. 4.16 that the increase in σ2 with increasing <rA> is too large in
LPCBMO as compared to that in LPCSMO series. However, in spite of large <rA> (and,
therefore, the tolerance factor) of LPBMO series, its electronic and magnetic transition
temperatures are lower as compared to LPCSMO series. Table-4.3 lists, for comparison,
values of various structural parameters and electronic transition temperatures of these two
series.

IV - 26
Table – 4.3: Average A-site cation radius (<rA>), size-disorder (σ2) and insulator-metal
transition temperature (Tp) for (La0.5Pr0.2)(Ca0.3-xAx)MnO3 (A=Sr and Ba).
x <rA> (Å)
A= Ba(Sr)
σ2 (Å2)
A=Ba(Sr)
Tp (K)
A=Ba(Sr)
0.0 1.196(1.196) 0.00039(0.00039) 140(140)
0.05 1.211(1.203) 0.00391(0.00098) 145(170)
0.10 1.225(1.209) 0.00701(0.00149) 150(205)
0.15 1.239(1.216) 0.00969(0.00191) 164(230)
0.20 1.254(1.222) 0.01195(0.00224) 171(260)
0.25 1.269(1.228) 0.01378(0.00249) 172(----)
0.30 1.284(1.235) 0.0152(0.00266) 175(313)
Similarly, we find a variation in I-M transition temperatures (Tp) as a function of
varying size variance (σ2) for pair of samples of the two series with constant <rA>. Figure
4.17 shows the Tc vs size variance plots for a fixed average A-site ionic radius for
La0.5Pr0.2Ca0.3-xAxMnO3, A = Ba & Sr. For <rA> =1.21 Å, Ba = 0.05 and Sr = 0.10; for
<rA> = 1.22Å, Ba = 0.10, Sr = 0.20 and for <rA> = 1.23Å, Ba = 0.15, Sr = 0.30.

IV - 27
0.002 0.004 0.006 0.008 0.010100
200
300
400
<rA> = 1.21
<rA> = 1.22
<rA> = 1.23
Tc (K)
σ2 (Å
2)
Figure 4.17: Variation of I-M transition temperature (Tp) as a function of varying size-
disorder of a pair of samples having constant <rA> from both the LPCSMO
and LPCBMO series.
It is observed from the fig. 4.17 that, the fall in Tc for the set of Sr-Ba doped
samples with < rA> = 1.23 is maximum as compared to samples with < rA> = 1.22 and
1.21. The samples with maximum drop in Tc possess large variation in the size variance.
The values given in Table-3.1 and figs 4.16 and 4.17 reveal that the LPCSMO has more
impact of increasing <rA> on the large enhancement of Tp as the Sr2+ concentration
increases. In LPCBMO series, though <rA> increases significantly and should enhance the
Tp more than that in LPCSMO series with increasing substitution. However, it is not the

IV - 28
case as the Tp enhancement is slow in LPCBMO series and this may be attributed to the
detrimental effect of increasing size-disorder on the Tp.
The Ba being a larger cation puts a strain on the lattice, which is evident from the
low rate of rise in Tc and broader nature of transition. The size mismatch at A-site due to
larger Ba cation results in the random displacement of oxygen ions and hence influences
the Mn-O hybridization [20]. This induces the local spin and position dependent
fluctuations in the lattice. The increasing Ba concentration increases the size variance at A
site and this affects the motion of electrons significantly. If the size variance at A site
increases beyond a limit then structural deformation leads to phase segregation which is
evident from the structural studies on La0.4Pr0.3Ba0.3MnO3 sample in which the Pr
concentration was increased to enhance the variance for a constant carrier density.
4.4 Conclusions
Effects of competing tolerance factor and size-disorder at A-site on the structural
and transport properties have been studied in Sr2+ and Ba2+ substituted nearly low-
bandwidth La0.5Pr0.2Ca0.3MnO3 systems, resulting in the two series as
La0.5Pr0.2Ca0.3-xSrxMnO3 (0 ≤ x ≤ 0.30) and La0.5Pr0.2Ca0.3-xBaxMnO3 (0 ≤ x ≤ 0.30) An
increase in substitution of larger cation Ba at Ca site as compared to Sr, results in an
enhanced size mismatch, thereby increasing the strain on the lattice and affecting the
motion of electrons significantly. This decreases the rate of Tc enhancement due to Ba
substitution and results in broader resistive transitions.

IV - 29
References
1. Ramirez A P, J. Phys: Condens. Mater, 9, 5171 (1997)
2. Coey J M D, Viret M and Von Molnar S, Advances in Phys., 48, 2, 167 (1999)
3. Von Helmolt R, Wecker J, Holzapsfel B, Schultz L and Samwar K, Phys. Rev.
Lett., 71, 2331 (1993)
4. Gooenough J B, Aust. J. of Phys., 52, 155 (1999)
5. Rodriguez-Martinez L M and Attfield J P, Phys. Rev. B, 54, R15622 (1996)
6. Emin D and Holstein T, Phys. Rev. B, 13, 647 (1976)
7. Ziese Michael, Srinitiwarawong Chatchai, Phys. Rev. B, 58, 11519 (1998)
8. Coey J M D, Viret M, Ranno L, Ounadjela K, Phys. Rev. Lett., 75, 3910 (1995)
9. Viret M, Ranno L, Coey J M D, J. Appl. Phys., 81, 4964 (1997)
10. Gupta A, Gong G Q, Xiao Gang, Duncombe P R, Lecoeur P, Trouilloud P, Wang
YY, Dravid V P and Sun J Z, Phys. Rev. B, 54, 629 (1996)
11. Hwang H Y, Cheong S-W, Ong N P and Batlogg B, Phys. Rev. Lett., 77, 2041
(1996)
12. Ju Sheng, Sun H, Li Zhen-Ya, Phys Letts A, 300, 666 (2002)
13. Hielman A K, Xue Y Y, Lorenz B, Campbell B J, Cmaidalka J, Wang R L, Chu C
W, Phys. Rev.B, 65, 214423 (2002)
14. I. E. Dzyaloshinskii, Zh. Eksp. Teor. Fiz. 72, 1930 (1977) [Sov. Phys. JETP 45,
1014 (1977)]
15. A. de Andrés, M. García-Hernández, and J. L. Martínez, Phys. Rev. B, 60, 7328
(1999)
16. E. Dagotto, Takashi Hotta and Adriana Moreo Physics Reports 344, 1-153, (2003)

IV - 30
17. H. Y. Hwang, S. W. Cheong, N. P. Ong, and B. Batlogg,
Phys. Rev. Lett. 77, 2041 (1996)
18. X. W. Li, A. Gupta, G. Xiao, and G. Q. Gong, Appl. Phys. Lett. 71, 1124 (1997)
19. J. M. D. Coey, Philos. Trans. R. Soc. London, Ser. A, 356, 1539 (1998)
20. H. L. Ju, J. Gopalakrishnan, J. L. Peng, Qi Li, G. C. Xiong, T. Venkatesan, and R.
L. Greene, Phys. Rev. B 51, 6143 (1995)

Chapter Chapter Chapter Chapter –––– V V V V

Effect of bandwidth modification by Sr and Ba substitution in manganites
IV - 1
Introduction
The simultaneous substitution of Pr-Ca induces interesting properties in the
resulting manganite system. The La1-2xPrxCaxMnO3 in the previous chapter has been
identified as a low bandwidth system exhibiting transition temperature below 120 K with
significant CMR effect at relatively weaker fields [1, 2]. However, we have optimized this
series with a sample to show that an optimal density La0.5Pr0.2Ca0.3MnO3 composition
exhibit low Tp and TC with a large MR%. In this chapter we have taken this sample as
basis for the study of bandwidth modifications and cation size variance effect by Sr2+ and
Ba2+ substitution on the electronic, magnetic and magnetotransport properties of the
resulting system. In this endeavor, we have synthesized two series as
La0.5Pr0.2Ca0.3-xSrxMnO3 (LPCSMO); x = 0.0-0.20 (0.05) and La0.5Pr0.2Ca0.3-xBaxMnO3
(LPCBMO); x = 0.0-0.30 (0.05). Lastly, we show that, increasing the cation size variance
above a certain limit in La0.4Pr0.3Ba0.3MnO3 results in the phase-segregation indicative
from the extra peaks of BaMnO3 in the XRD spectrum. The conductivity in the
semiconducting region is dominated by Mott’s Variable Range Hopping type of
conduction of polarons [3]. The structural, electrical, magnetic and magnetotransport
properties have been studied using XRD, magnetoresistance and magnetic susceptibility
measurements in the light of bandwidth modification and cation size disorder effects.
As mentioned earlier I-M & PM-FM transition temperatures, which are due to
spin-polarized conduction of carriers through Zener-Double exchange depends upon the eg
electron bandwidth and carrier density [4]. La0.7Ca0.3MnO3 (LCMO) and Pr0.7Ca0.3MnO3
(PCMO) are intermediate and low bandwidth systems respectively. The dependence of
transition temperature is ascribed to the amount of divalent cation doping and average A-
site cation radius which is quantified by a tolerance factor, t = <A-O>/(√2<Mn-O>).
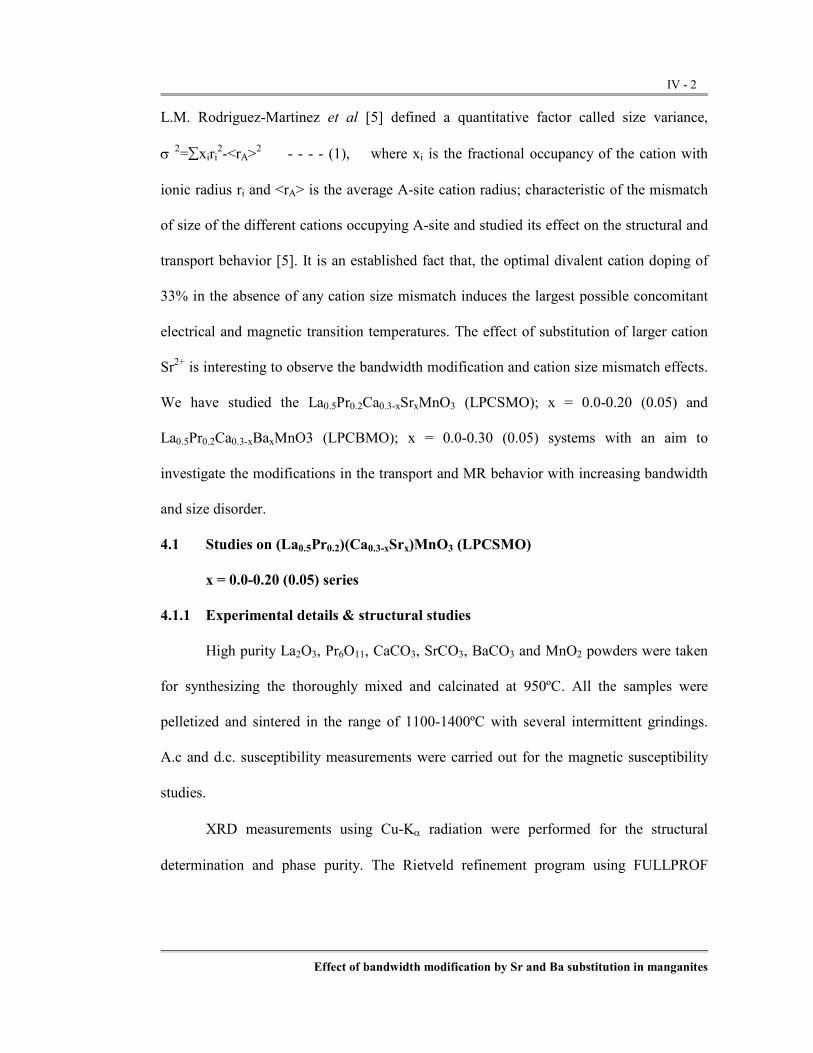
Effect of bandwidth modification by Sr and Ba substitution in manganites
IV - 2
L.M. Rodriguez-Martinez et al [5] defined a quantitative factor called size variance,
σ 2=∑xiri2-<rA>
2 - - - - (1), where xi is the fractional occupancy of the cation with
ionic radius ri and <rA> is the average A-site cation radius; characteristic of the mismatch
of size of the different cations occupying A-site and studied its effect on the structural and
transport behavior [5]. It is an established fact that, the optimal divalent cation doping of
33% in the absence of any cation size mismatch induces the largest possible concomitant
electrical and magnetic transition temperatures. The effect of substitution of larger cation
Sr2+ is interesting to observe the bandwidth modification and cation size mismatch effects.
We have studied the La0.5Pr0.2Ca0.3-xSrxMnO3 (LPCSMO); x = 0.0-0.20 (0.05) and
La0.5Pr0.2Ca0.3-xBaxMnO3 (LPCBMO); x = 0.0-0.30 (0.05) systems with an aim to
investigate the modifications in the transport and MR behavior with increasing bandwidth
and size disorder.
4.1 Studies on (La0.5Pr0.2)(Ca0.3-xSrx)MnO3 (LPCSMO)
x = 0.0-0.20 (0.05) series
4.1.1 Experimental details & structural studies
High purity La2O3, Pr6O11, CaCO3, SrCO3, BaCO3 and MnO2 powders were taken
for synthesizing the thoroughly mixed and calcinated at 950ºC. All the samples were
pelletized and sintered in the range of 1100-1400ºC with several intermittent grindings.
A.c and d.c. susceptibility measurements were carried out for the magnetic susceptibility
studies.
XRD measurements using Cu-Kα radiation were performed for the structural
determination and phase purity. The Rietveld refinement program using FULLPROF

Effect of bandwidth modification by Sr and Ba substitution in manganites
IV - 3
program was employed. The refined XRD patterns of all the samples are given in
figure 4.1, while figure 4.2 shows a typical Rietveld fitted pattern of x=0.15 sample.
2 0 4 0 6 0 8 00
5
1 0x = 0 .3 0
x = 0 .1 0
x = 0 .1 5
x = 0 .1 0
(L a0 .5P r
0 .2C a
0 .3 - xS r
xM nO
3)
Intensity (a.u)
2 θ (D e g r e e )
Figure 4.1: XRD pattern of the La0.5Pr0.2Ca0.3-xSrxMnO3 (x = 0.0 - 0.20)
2 0 3 0 4 0 5 0 6 0 7 0 8 0-2 0 0
0
2 0 0
4 0 0
(L a0 .5P r
0 .2C a
0 .1 5S r
0 .1 5M nO
3)
Iintensity (a.u)
2 θ (D e g re e )
E x p e r im e n ta l R e f in e d D if f e r e n c e B ra g g p e a k

Effect of bandwidth modification by Sr and Ba substitution in manganites
IV - 4
Figure 4.2: Rietveld fitted XRD pattern of the La0.5Pr0.2Ca0.3-xSrxMnO3 (x=0.15)
Rietveld refinement using FULPROOF program of all the samples for phase purity and
structural investigations reveals a good phase formation with an impurity ~1-2% of mother
compounds for some of the samples. In this series all the samples fit to a distorted
orthorhombic structure. The cell parameters and hence the volume increases with
increasing Sr concentration, which can be attributed to larger size cation substitution
effect. Table – 4.2 shows the variation of cell parameters, cell volume <rA> and σ2 wih
increasing x.
Table 4.1 : Structure, cell parameters and cell volume of La0.5Pr0.2Ca0.3-xSrxMnO3 (0≤x≤0.20) samples.
x Structure a (Å) b (Å) c (Å) Volume(Å3)
0 Orthorhombic (Pnma) 5.4576(1) 7.7224(2) 5.4436(2) 229.426
0.05 Orthorhombic (Pnma) 5.4482(1) 7.7295(1) 5.4633(1) 230.078
0.10 Orthorhombic (Pnma) 5.4559(2) 7.7145(1) 5.4774(2) 230.532
0.15 Orthorhombic (Pnma) 5.4859(1) 7.7145(2) 5.4592(1) 231.045
0.20 Orthorhombic (Pnma) 5.4995(2) 7.7165(1) 5.4613(2) 231.764
4.1.2 Electronic transport and magnetoresistance
Fig. 4.3 depicts the R-T and magneto R-T behaviour of LPCSMO samples in
absence of magnetic field and in applied magnetic fields of 1 Tesla, 2 Tesla and 5 Tesla.
The electrical transport behavior of the LPCSMO system, reveals that, as Sr2+
concentration increases, the transition temperature increases with a subsequent fall in
resistivity, which has its origin in the modification of eg electron bandwidth as the average
A-site cation radius increases by Sr2+ substitution.

Effect of bandwidth modification by Sr and Ba substitution in manganites
IV - 5
100 200 3000
50
100
x = 0.2
Resistance ( Ω )
T (K)
0T1T2T5T
0
30
600T1T2T5T
x = 0.15
0
40
80
0T1T2T5T
x = 0.1
0
300
6000T1T2T5T
x = 0.05
0
2000
4000
6000(La
0.5Pr0.2)(Ca
0.3-xSrx)MnO
3
0T1T2T5T
x = 0
Figure: 4.3 R-T and magneto R-T plots for La0.5Pr0.2Ca0.3-xSrxMnO3; x = 0.0 - 0.20 (0.05)
series.
In order to understand the conduction mechanism of polarons created as a result of
electron-phonon coupling in the semiconducting region, we fitted the R-T data LPCSMO
samples in figure 4.4, to nearest neighbor small polaron hopping model [6, 7]
corresponding to ρ = ρ0 exp(Ea/kT) and the Mott’s type Variable Range Hopping model
[8, 9] (VRH) corresponding ρ = ρo exp(To/T)1/4.

Effect of bandwidth modification by Sr and Ba substitution in manganites
IV - 6
As shown in figures 3 & 4, the data fits linearly in ln ρ vs. T -0.25 plot, suggesting
that, the conduction of the carriers in the semiconducting region obeys the Mott’s Variable
Range Hopping model. To in this equation is related to localization length by a relation,
kTo = 18/L2 N(E) - - - - (2)
where L is the localization length of the carriers and N(E) is the density of states.
It is observed from the magneto R-T measurements on Sr2+ substituted
La0.5Pr0.2Ca0.3-xSrxMnO3 system (fig.2) that, Tp increases with increasing Sr content and a
subsequent fall in MR%. The transition temperature is revived from 140 K to 247 K and
CMR effect falls from 46% to 7% at a field of 1T with the 20% substitution of Sr2+. Since
the larger cation increases the Mn-O-Mn bond angle towards 180º and the fall in the
magnetic disorder at the Mn-O couplings accounts for the low CMR effect [10].
Interestingly the CMR effect increases consistently at low temperature below transition
temperature with increasing Sr content. This low temperature large CMR effect is due to
the intergrain tunneling magnetoresistance [11]. The drop in the resistance in the higher
magnetic field also increases with doping concentrations.
The magnetoresistance also occurs as result of the reduction of the scattering of the
carriers at the interfaces due to application of magnetic field. The scattering of the carriers
at the interfaces can be understood in the following way [12]. An electron moving from
initial grain to the next magnetic grain crosses two interfaces in its journey, each of which
may scatter the electron. This acts as an insulating barrier to the conduction of the carriers
through the grains. Since A-site is occupied by different size cations, so unlike cations may
occupy the positions at the faces of the adjacent grains. Hence, due to increasing size
variance, the Mn environment varies at the interfaces of the connecting grains, which
results in equal probability of weak and strong scattering of electrons at the interfaces. The

Effect of bandwidth modification by Sr and Ba substitution in manganites
IV - 7
strong scattering can be suppressed by the application of larger magnetic fields, to account
for the larger drop in resistance as size disorder increases with Sr content. Another notable
factor is that, the trend in the increase in TC is not linear with Sr concentration, being
larger for lower compositions and smaller for higher Sr content. This leads to deviation in
the ideal relationship of Tc and tolerance factor [4].
It can be explained by the mismatch of the cations at A-site, which increases with
Sr content. The large size variance, as calculated from equation, 222 ><−∑=Aiirrxσ ,
induces the strain in the lattice by random displacement of oxygen ions and hence
obstructs the Zener-Double exchange.

Effect of bandwidth modification by Sr and Ba substitution in manganites
IV - 8
0.24 0.26 0.28 0.303
4
5
6
7
8
9
0.004 0.006 0.008 0.010
-2
0
2
4
0.002 0.003 0.004 0.005 0.006
-3
-2
-1
0
1
2
0.0030 0.0035 0.0040 0.0045 0.0050
-3
-2
-1
0.0036 0.0045
-2
-1
ln (R/T)
T -0.25
x = 0
ln (R/T)
T -1
0.24 0.26 0.282
4
6
x = 0.05
ln (R/T)
ln R
T -0.25T
-1
0.24 0.25 0.26 0.272.5
3.0
3.5
4.0
4.5
5.0
x = 0.10
ln R
ln R
T -0.25
0.240 0.245 0.250 0.255 0.260 0.265 0.270
3
4
x = 0.15
ln R
T -0.25
ln (R/T)
T -1T
-1
Figure 4.4: Mott’s VRH model (ln R vs T -0.25) and small polaron model (ln (R/T) vs T -1)
fits for La0.5Pr0.2Ca0.3-xSrxMnO3; x = 0.0 - 0.15 (0.05) series.
The fitting of the electrical transport data in the semiconducting region reveals that
conduction in this region occurs through the Mott’s Variable Range hopping of polarons.
CMR effect is found to have an inverse relationship with the transition temperature. The
A-site disorder increases with Sr concentration and leads to microscopic inhomogenieties
in the samples through the random displacement of oxygen anion and showing its
influence on the electrical, magnetic and magnetotransport properties.
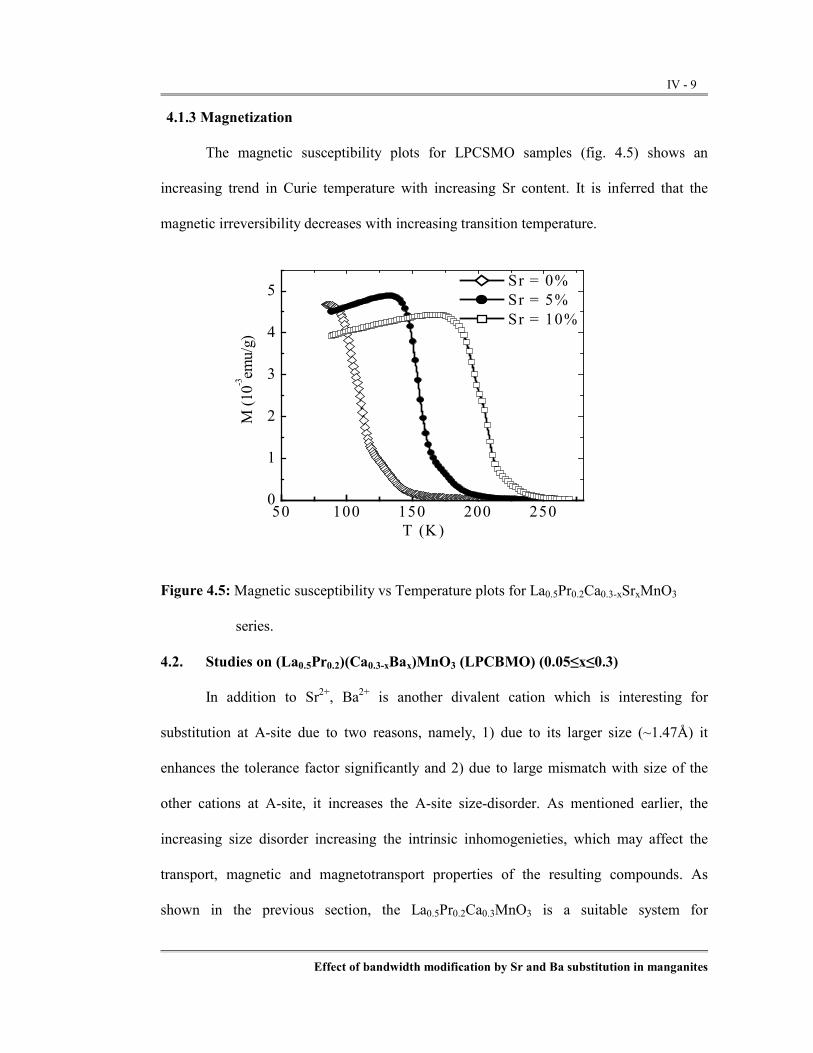
Effect of bandwidth modification by Sr and Ba substitution in manganites
IV - 9
4.1.3 Magnetization
The magnetic susceptibility plots for LPCSMO samples (fig. 4.5) shows an
increasing trend in Curie temperature with increasing Sr content. It is inferred that the
magnetic irreversibility decreases with increasing transition temperature.
50 100 150 200 2500
1
2
3
4
5
M (10-3emu/g)
T (K )
Sr = 0% Sr = 5% Sr = 10%
Figure 4.5: Magnetic susceptibility vs Temperature plots for La0.5Pr0.2Ca0.3-xSrxMnO3
series.
4.2. Studies on (La0.5Pr0.2)(Ca0.3-xBax)MnO3 (LPCBMO) (0.05≤x≤0.3)
In addition to Sr2+, Ba2+ is another divalent cation which is interesting for
substitution at A-site due to two reasons, namely, 1) due to its larger size (~1.47Å) it
enhances the tolerance factor significantly and 2) due to large mismatch with size of the
other cations at A-site, it increases the A-site size-disorder. As mentioned earlier, the
increasing size disorder increasing the intrinsic inhomogenieties, which may affect the
transport, magnetic and magnetotransport properties of the resulting compounds. As
shown in the previous section, the La0.5Pr0.2Ca0.3MnO3 is a suitable system for

Effect of bandwidth modification by Sr and Ba substitution in manganites
IV - 10
substitutional studies aiming to elucidate the effect of tolerance factor and size-variance.
Keeping this in mind, we have replaced the smaller size divalent cation, Ca2+, by a larger
size cation, Ba2+, in the system (La0.5Pr0.2)(Ca0.3-xBax)MnO3 (0.05≤x≤0.3) and studied the
ionic size and size disorder effect on the structural, transport and magnetic properties. In
this series, the size-disorder increases from 0.0001Å2 for x=0 to 0.016 Å2. Such a large
variation of size-disorder across the series makes all these compounds, an interesting
subject of investigations. Other than this series of compounds, we have also tried to
synthesize the compound, La0.4Pr0.3Ba0.3MnO3, which possesses the largest size-disorder
among all the compounds studied in this section. In the La0.4Pr0.3Ba0.3MnO3 manganite
sample, we find the chemical phase-segregation, resulting in secondary phase [14]. The
various structural, transport, magnetotransport and magnetic properties are collated in the
following sections.
4.2.1 Experimental details
All the (La0.5Pr0.2)(Ca0.3-xBax)MnO3 (0.05≤x≤0.3) and La0.4Pr0.3Ba0.3MnO3
compounds were synthesized using conventional solid-state reaction route. Constituent
oxides (La2O3, Pr6O11, and MnO2) and carbonates (SrCO3 and CaCO3) were mixed
thoroughly in stoichiometric proportions and calcined at 950°C for 24 hours. These were
ground, pelletized and sintered in the temperature range of 1100°C - 1200°C for 100 hours
with many intermediate grindings. The final sintering was carried out at 1300°C for 24
hours. X-ray diffraction (XRD) patterns were recorded in the 2θ range of 20o – 80o on a
Siemens diffractometer. Magnetization measurements were performed using a SQUID
magnetometer (MPMS XL, Quantum Design). The resistivity and magnetoresistance

Effect of bandwidth modification by Sr and Ba substitution in manganites
IV - 11
measurements were carried using d.c. four probe method on a physical property
measurement system (PPMS, Quantum Design).
4.2.2 Structural Studies
The XRD patterns of all the (La0.5Pr0.2)(Ca0.3-xBax)MnO3 (0.05≤x≤0.3) (to be
referred as LPCBMO) samples were indexed to be single phase compounds crystallizing in
a distorted orthorhombic structure. Rietveld refinement technique using FULLPROF
software was employed to obtain to refined cell parameters. Figure 4.6 shows the XRD
patterns of all the samples while figure 4.7 displays a typical Rietveld refined XRD pattern
of x=0.2 and La0.4Pr0.3Ba0.3MnO3 (LPBMO) samples. It is seen that there is an excellent
agreement of experimental and fitted patterns of x=0.20 sample and is, therefore, single-
phase compound. However, when LPBMO fitted to orthorhombic structure shows some
additional peaks in the structure indicated by (*), presumably of BaMnO3 [6]. This sample
has maximum A-site size-disorder and may be the cause of the structural phase
segregation. This shows that, above a certain critical limit of A-site size-disorder, it exert a
structural strain and results in phase-segregation. Table – 4.2 shows the variation of cell
parameters, cell volume <rA> and σ2 with increasing x.
Table 4.2: Structure, cell parameters and cell volume of (La0.5Pr0.2)(Ca0.3-xBax)MnO3
(0.05≤ x ≤0.3) samples.
(La0.5Pr0.2)(Ca0.3-xBax)MnO3
(0.05≤ x ≤0.3) a (Å) b (Å) c (Å) Cell Volume
X=0.05 5.46603(2) 7.72868(2) 5.47161(2) 231.149
X=0.10 5.47066(2) 7.73082(2) 5.49513(2) 232.404
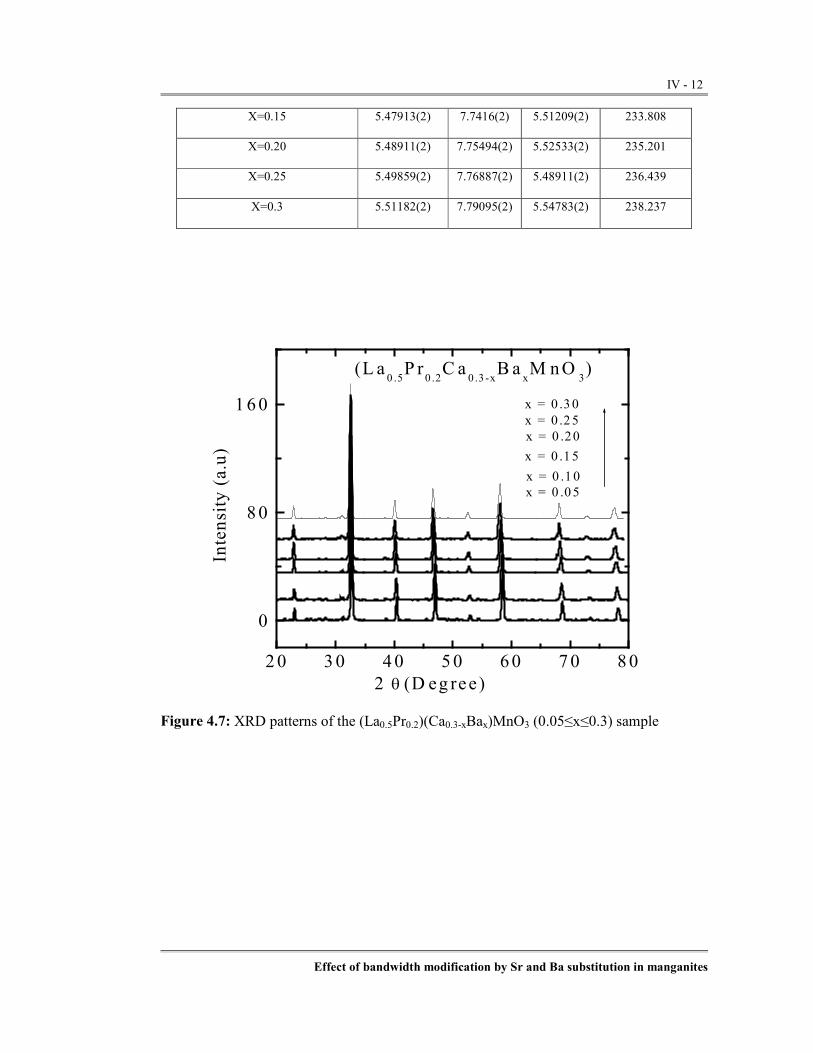
Effect of bandwidth modification by Sr and Ba substitution in manganites
IV - 12
X=0.15 5.47913(2) 7.7416(2) 5.51209(2) 233.808
X=0.20 5.48911(2) 7.75494(2) 5.52533(2) 235.201
X=0.25 5.49859(2) 7.76887(2) 5.48911(2) 236.439
X=0.3 5.51182(2) 7.79095(2) 5.54783(2) 238.237
20 30 40 50 60 70 80
0
80
160 x = 0 .30x = 0 .25
x = 0 .05x = 0 .10
x = 0 .15
x = 0 .20
(L a0 .5P r
0 .2C a
0 .3 -xBa
xM nO
3)
Intensity (a.u)
2 θ (D eg ree)
Figure 4.7: XRD patterns of the (La0.5Pr0.2)(Ca0.3-xBax)MnO3 (0.05≤x≤0.3) sample

Effect of bandwidth modification by Sr and Ba substitution in manganites
IV - 13
Figure 4.8: Rietveld fitted patterns of (La0.5Pr0.2)(Ca0.3-xBax)MnO3 (x=0.20) and
La0.4Pr0.3Ba0.3MnO3 samples. The asterisks in the fitted patterns of LPBMO
sample (Lower panel) depict the secondary phase of BaMnO3.

Effect of bandwidth modification by Sr and Ba substitution in manganites
IV - 14
4.2.3 Electrical Resistivity
The plots of electrical resistivity as a function of temperature for all the
(La0.5Pr0.2)(Ca0.3-xBax)MnO3 (0.05≤x≤0.3) in zero field and in a fields of 5T and 9T over a
temperature range of 5 K-320 K. The plots are shown in figs. 4.9 and 4.10.
0
10
20
T (K)
x = 0.05 H = 0T H = 5T H = 9T
0
5
10
15 x = 0.1 H = 0T H = 5T H = 9T
R (k Ω)
0 100 200 3000
0.4
0.8
1.2
x = 0.15
(La0.5Pr0.2)(Ca
0.3-xBa
x)MnO
3
H = 0T H = 5T H = 9T

Effect of bandwidth modification by Sr and Ba substitution in manganites
IV - 15
Figure 4.9: Resistivity as a function of temperature in 0T, 5T and 9T in a temperature
range of 5 K-320 K for (La0.5Pr0.2)(Ca0.3-xBax)MnO3 (0.05≤x≤0.15) samples.
0
0.05
0.10
0.15
T (K)
x = 0.2 H = 0T H = 5T H = 9T
0
0.1
0.2
0.3x = 0.25
H = 0T H = 5T H = 9T
R (k Ω)
0 100 200 3000
0.05
0.10
0.15
0.20
x = 0.3
(La0.5Pr0.2)(Ca
0.3-xBa
x)MnO
3
H = 0T H = 5T H = 9T
Figure 4.10: Resistivity as a function of temperature in 0T, 5T and 9T in a temperature
range of 5 K-320 K for (La0.5Pr0.2)(Ca0.3-xBax)MnO3 (0.20≤x≤0.30) samples.

Effect of bandwidth modification by Sr and Ba substitution in manganites
IV - 16
It is seen in figs. 4.9 & 4.10 that all the (La0.5Pr0.2)(Ca0.3-xBax)MnO3 (0.05≤x≤0.30)
samples exhibit insulator-metal transition. The I-M transition temperature, Tp, increases
from ~145 K for x=0.05 sample to ~175 K for x=0.30 sample. This enhancement in Tp
may be understood on the basis increase in tolerance factor with increasing Ba2+ content.
Progressive substitution of Ba2+ (1.47Å) at Ca2+ (1.18Å) induces a large increase in
average A-site cation radius and hence the tolerance factor increases to a larger extent.
4.2.4 Magnetization measurements
The temperature dependence of magnetization measurements for all the samples
were performed in zero-field-cooled (ZFC) and field-cooled (FC) manner. This implies
that sample is cooled in zero-field (ZFC) to the lowest temperature and then a certain field
is applied for measuring the magnetization of the sample in warming direction. After this
temperature of magnetization, the sample is cooled in the same magnetic field (FC) to the
lowest temperature and then measured the magnetization while warming. The ZFC and FC
magnetization versus temperature for all the (La0.5Pr0.2)(Ca0.3-xBax)MnO3 (0.05≤x≤0.30)
samples is shown in fig. 4.11.

Effect of bandwidth modification by Sr and Ba substitution in manganites
IV - 17
0 100 200 3000
2
4
6
8
(ZFC - FC)
x = 0.15
x = 0.10x = 0.05
M (emu/g)
T(K)
0
2
4
6
8
10
H=50 Oe
La0.5Pr0.2Ca
0.3-xBa
xMnO
3
x = 30
x = 0.25
x = 0.20
Figure 4.11: Zero-field-cooled (ZFC) and field-cooled (FC) magnetization (M) as a
function of temperature for (La0.5Pr0.2)(Ca0.3-xBax)MnO3 samples in a field of
50 Oe.
The Curie temperature (TC) increases from 150K for x=0.05 to 220K for x=0.30.
With increasing Ba-substitution, the increasing trend of TC is similar to increasing trend of
the insulator-metal transition temperature (Tp). However, it is seen that the TC and Tp of

Effect of bandwidth modification by Sr and Ba substitution in manganites
IV - 18
these samples do not match with each other and this disparity increases with increasing
Ba-concentration. This disparity is not in accordance with the Zener-Double-Exchange
interactions and can be explained on the purview of possible grain boundary localization
or phase separation. It is needless to mention that the polycrystalline samples of various
micron sized grains, in which properties may vary inside the grain and on the grain
boundaries. As the ZDE come into play, the bulk part of the grain become ferromagnetic
and metallic while the grain boundaries are still insulating. The grain boundaries may be
insulating because of the grain boundary pinning of Mn-ion spins, poor connectivity and
grain boundary contamination [15]. This creates the insulating channels at the grain
boundaries and does not allow the percolation of the charge carriers and results in
insulating behavior even after the onset of TC. Once the grain boundaries become
conducting at lower temperatures, the I-M transitions appear. Other factor that can cause a
disparity between Tp and TC is the phase-separation as explained in [16]. Due to the
granular mixture of different electronic densities, the TC of different grains could be
different. For instance, we assume that majority of the grains have large electronic density
so that they exhibit TC at higher temperatures, while the remaining minor fraction have
lower TC. Now, at the onset of the TC of majority of grains (with higher TC), the systems
tends to be ferromagnetic even as a minority of grain are still paramagnetic-insulating. In
such as a situation, though the system will be ferromagnetic, it will continue to exhibit
semiconducting/insulating behavior unless all the grains become ferromagnetic. At a
certain temperature when the whole system attains ferromagnetism, percolation is possible
and the system exhibits I-M transition. The disparity in TC and Tp in the present system
may be because of either or both of the above stated causes. We get an evidence of the
phase separation from the d.c. magnetic susceptibility.

Effect of bandwidth modification by Sr and Ba substitution in manganites
IV - 19
0 100 200 3000
2000
4000
6000
La0.5Pr0.2Ca
0.3-xBa
xMnO
3
x=0.20
x=0.15
x=0.10x=0.25
x=0.05
H = 5000 Oe
H/M
T(K)
Figure 4.12: Inverse susceptibility (H/M at H = 5 kOe) as a function of temperature for
(La0.5Pr0.2)(Ca0.3-xBax)MnO3 samples.
Fig. 4.12 shows the inverse susceptibility as a function of temperature for the
(La0.5Pr0.2)(Ca0.3-xBax)MnO3 (0.05≤x≤0.25) samples when magnetization is acquired in a
field of 5kOe. It is seen that there exists a deviation of Curie-Weiss law from the
paramagnetic susceptibility of all the samples. This indicates towards the magnetic
inhomogeneities or possible existence of ferromagnetic clusters in the paramagnetic
region. Such inhomogeneities, which may be present both in paramagnetic and
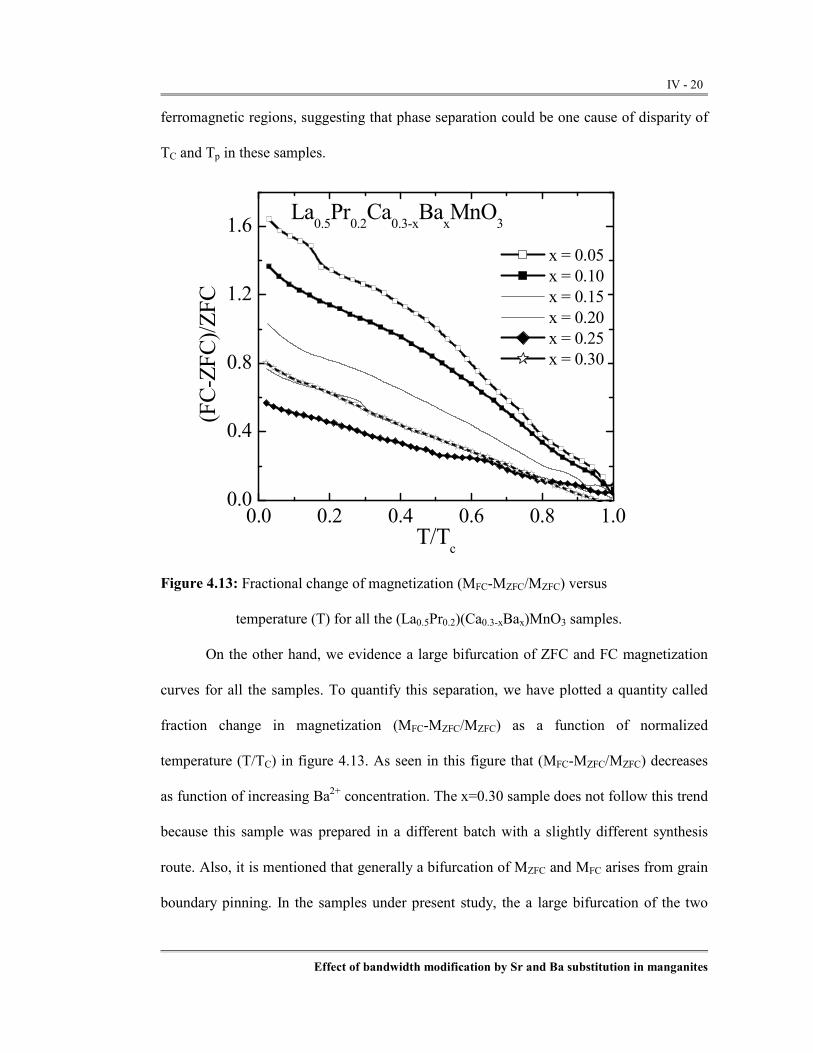
Effect of bandwidth modification by Sr and Ba substitution in manganites
IV - 20
ferromagnetic regions, suggesting that phase separation could be one cause of disparity of
TC and Tp in these samples.
0.0 0.2 0.4 0.6 0.8 1.00.0
0.4
0.8
1.2
1.6
La0.5Pr0.2Ca
0.3-xBa
xMnO
3(FC-ZFC)/ZFC
T/Tc
x = 0.05 x = 0.10 x = 0.15 x = 0.20 x = 0.25 x = 0.30
Figure 4.13: Fractional change of magnetization (MFC-MZFC/MZFC) versus
temperature (T) for all the (La0.5Pr0.2)(Ca0.3-xBax)MnO3 samples.
On the other hand, we evidence a large bifurcation of ZFC and FC magnetization
curves for all the samples. To quantify this separation, we have plotted a quantity called
fraction change in magnetization (MFC-MZFC/MZFC) as a function of normalized
temperature (T/TC) in figure 4.13. As seen in this figure that (MFC-MZFC/MZFC) decreases
as function of increasing Ba2+ concentration. The x=0.30 sample does not follow this trend
because this sample was prepared in a different batch with a slightly different synthesis
route. Also, it is mentioned that generally a bifurcation of MZFC and MFC arises from grain
boundary pinning. In the samples under present study, the a large bifurcation of the two

Effect of bandwidth modification by Sr and Ba substitution in manganites
IV - 21
curves in all these Ba2+ substituted samples suggests enhanced grain boundary pinning
and, thus, the grain boundary localization [13]. Therefore, this factor is also likely to play a
role in the disparity of Tp and TC of these samples. Thus, by providing experimental
evidence of phase-separation and grain boundary localization, we show that these factors
cause the I-M transition to occur at lower temperatures than TC.
4.2.5 Magnetoresistance measurements
The resistance was measured as a function of applied magnetic field at various
temperatures for all (La0.5Pr0.2)(Ca0.3-xBax)MnO3 (0.05≤x≤0.30) samples. From these data
magnetoresistance was calculated using the formula MR(%)=(ρ0-ρH)/ρ0×100 and the
plots of magnetoresistance versus magnetic field isotherms are shown in figs. 4.14 & 4.15.
It may be seen that all the samples exhibit maximum MR in the vicinity of their respective
I-M transition temperatures. Maximum MR in the vicinity of Tp may be explained on the
basis of field induced suppression of spin fluctuation. At the I-M transition, there exists
maximum magnetic disorder and magnetic field enhances the ferromagnetic spin ordering.
On the other hand, at low temperature we observe two features in MR. One, a large MR of
nearly 20% in a low field of 0.5-1 Tesla and other, a low MR at higher fields. Here, a large
low-field MR arises from the inter-grain spin-polarized tunneling while a low high-field
MR is also because of almost complete spin-polarization at low temperatures.

Effect of bandwidth modification by Sr and Ba substitution in manganites
IV - 22
0
30
60
90
5K 50K 100K 140K 160K
x = 0.05
(La0.5Pr0.2)(Ca
0.3-xBa
x)MnO
3
H (kOe)
0
30
60
90
5K 50K 100K 140K 160K
x = 0.1
MR%
0 30 60 900
30
60
90
5K 50K 100K 140K 160K
x = 0.15
Figure 4.14: Magnetoresistance (MR%) as a function of magnetic field (H) at various
temperatures for (La0.5Pr0.2)(Ca0.3-xBax)MnO3 (0.05≤x≤0.15) samples.

Effect of bandwidth modification by Sr and Ba substitution in manganites
IV - 23
0
20
40
60
80
5K 50K 100K 160K 180K
x = 0.2
(La0.5Pr0.2)(Ca
0.3-xBa
x)MnO
3
H (kOe)
0
20
40
60
80
5K 50K 100K 160K 180K
x = 0.25
MR%
0 30 60 900
20
40
60
80
5K 50K 100K 160K 180K
x = 0.3
Figure: 4.15 Magnetoresistance (MR%) as a function of magnetic field (H) at various
temperatures for (La0.5Pr0.2)(Ca0.3-xBax)MnO3 (0.20≤x≤0.30) samples.

Effect of bandwidth modification by Sr and Ba substitution in manganites
IV - 24
In figs. 4.14 & 4.15, we observe that at lower Ba2+ substitution, the maximum MR
of ~95% for x=0.05 decreases to a maximum of ~75 % for x=0.30 sample in the vicinity of
their respective I-M transition temperatures. As the temperature decreases below the I-M
transition temperature, the MR starts decreasing. Interestingly, we see two clear trends in
MR with decreasing temperature and increasing Ba2+ concentration. As the temperature
goes below 50 K [17], we observe an enhancement in MR in low-fields while the MR in
high-fields decreases. Also, it is seen that the low field MR at low temperatures increases
with increasing Ba2+ content. This trend may be explained as follows [17, 18, 19]. As Ba2+
content increases, the increase in TC suggests that the spin polarization will increase at low
temperatures. The enhanced spin polarization will result in larger spin-polarized inter-
grain tunneling on the application of small fields. Hence, we observe increasing low-field
MR as the TC increases with increasing Ba2+ concentration. The high field MR at low
temperatures occurs due to magnetic disorder at Mn-O-Mn bonds (due to Zener-Double-
Exchange) and pinning of Mn-ion spins at the grain boundaries. As stated above the spin
polarization increases and, hence, the spin magnetic disorder decreases at the Mn-O-Mn
bonds, which results in a low high-field MR as the TC increases.
4.3 Comparative study of La0.5Pr0.2Ca0.3-xSrxMnO3 (LPCSMO); x = 0.0-0.30 (0.05)
and La0.5Pr0.2Ca0.3-xBaxMnO3 (LPCBMO); x = 0.0-0.30 (0.05)
The substitution of Sr2+(~1.31 Å) and Ba2+(~1.47 Å) in La0.5Pr0.2Ca0.3MnO3 results
in the LPCSMO and LPCBMO series, which have mixed impact of tolerance factor and
size-disorder on the transport and magnetic and magnetotransport properties. Here we
compare some of the properties of these two series. In both LPCSMO and LPBMO series,
the tolerance factor and size-disorder increases with increasing substitution of Sr2+ and
Ba2+ respectively. The respective increase in average A-site cation radius (<rA>, which

Effect of bandwidth modification by Sr and Ba substitution in manganites
IV - 25
represents the tolerance factor) and A-site cation disorder in both the series is depicted in
Fig. 4.16.
1.20 1.22 1.24 1.26 1.280.000
0.004
0.008
0.012
0.016
A=Sr A=Baσ
2 (Å2 )
rA (Å)
Figure 4.16: Variation of A-site cation size-disorder as a function of <rA> for both the
LPCSMO and LPCBMO series.
It is seen from Fig. 4.16 that the increase in σ2 with increasing <rA> is too large in
LPCBMO as compared to that in LPCSMO series. However, in spite of large <rA> (and,
therefore, the tolerance factor) of LPBMO series, its electronic and magnetic transition
temperatures are lower as compared to LPCSMO series. Table-4.3 lists, for comparison,
values of various structural parameters and electronic transition temperatures of these two
series.
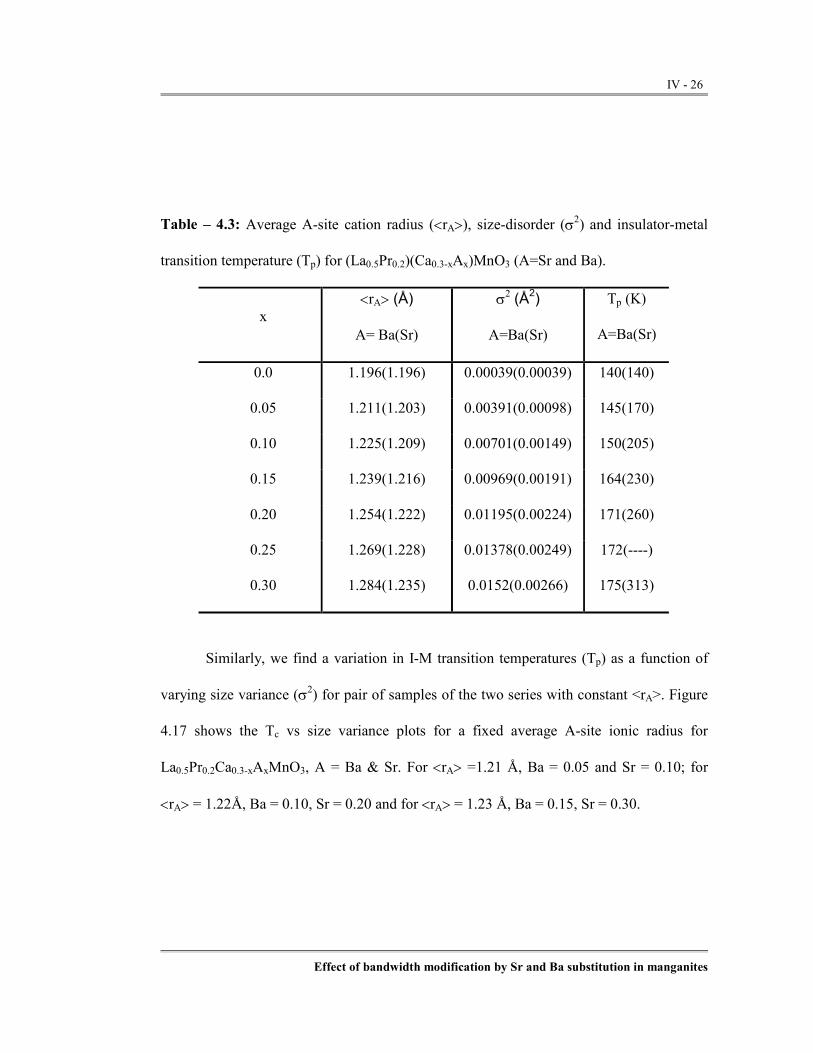
Effect of bandwidth modification by Sr and Ba substitution in manganites
IV - 26
Table – 4.3: Average A-site cation radius (<rA>), size-disorder (σ2) and insulator-metal
transition temperature (Tp) for (La0.5Pr0.2)(Ca0.3-xAx)MnO3 (A=Sr and Ba).
x <rA> (Å)
A= Ba(Sr)
σ2 (Å2)
A=Ba(Sr)
Tp (K)
A=Ba(Sr)
0.0 1.196(1.196) 0.00039(0.00039) 140(140)
0.05 1.211(1.203) 0.00391(0.00098) 145(170)
0.10 1.225(1.209) 0.00701(0.00149) 150(205)
0.15 1.239(1.216) 0.00969(0.00191) 164(230)
0.20 1.254(1.222) 0.01195(0.00224) 171(260)
0.25 1.269(1.228) 0.01378(0.00249) 172(----)
0.30 1.284(1.235) 0.0152(0.00266) 175(313)
Similarly, we find a variation in I-M transition temperatures (Tp) as a function of
varying size variance (σ2) for pair of samples of the two series with constant <rA>. Figure
4.17 shows the Tc vs size variance plots for a fixed average A-site ionic radius for
La0.5Pr0.2Ca0.3-xAxMnO3, A = Ba & Sr. For <rA> =1.21 Å, Ba = 0.05 and Sr = 0.10; for
<rA> = 1.22Å, Ba = 0.10, Sr = 0.20 and for <rA> = 1.23 Å, Ba = 0.15, Sr = 0.30.

Effect of bandwidth modification by Sr and Ba substitution in manganites
IV - 27
0.002 0.004 0.006 0.008 0.010100
200
300
400
<rA> = 1.21
<rA> = 1.22
<rA> = 1.23
Tc (K)
σ2 (Å
2)
Figure 4.17: Variation of I-M transition temperature (Tp) as a function of varying size-
disorder of a pair of samples having constant <rA> from both the LPCSMO
and LPCBMO series.
It is observed from the fig. 4.17 that, the fall in Tc for the set of Sr-Ba doped
samples with < rA> = 1.23 is maximum as compared to samples with < rA> = 1.22 and
1.21. The samples with maximum drop in Tc possess large variation in the size variance.
The values given in Table-3.1 and figs 4.16 and 4.17 reveal that the LPCSMO has more
impact of increasing <rA> on the large enhancement of Tp as the Sr2+ concentration
increases. In LPCBMO series, though <rA> increases significantly and should enhance the
Tp more than that in LPCSMO series with increasing substitution. However, it is not the

Effect of bandwidth modification by Sr and Ba substitution in manganites
IV - 28
case as the Tp enhancement is slow in LPCBMO series and this may be attributed to the
detrimental effect of increasing size-disorder on the Tp.
The Ba being a larger cation puts a strain on the lattice, which is evident from the
low rate of rise in Tc and broader nature of transition. The size mismatch at A-site due to
larger Ba cation results in the random displacement of oxygen ions and hence influences
the Mn-O hybridization [20]. This induces the local spin and position dependent
fluctuations in the lattice. The increasing Ba concentration increases the size variance at A
site and this affects the motion of electrons significantly. If the size variance at A site
increases beyond a limit then structural deformation leads to phase segregation which is
evident from the structural studies on La0.4Pr0.3Ba0.3MnO3 sample in which the Pr
concentration was increased to enhance the variance for a constant carrier density.
4.4 Conclusions
Effects of competing tolerance factor and size-disorder at A-site on the structural
and transport properties have been studied in Sr2+ and Ba2+ substituted nearly low-
bandwidth La0.5Pr0.2Ca0.3MnO3 systems, resulting in the two series as
La0.5Pr0.2Ca0.3-xSrxMnO3 (0 ≤ x ≤ 0.30) and La0.5Pr0.2Ca0.3-xBaxMnO3 (0 ≤ x ≤ 0.30). An
increase in substitution of larger cation Ba at Ca site as compared to Sr, results in an
enhanced size mismatch, thereby increasing the strain on the lattice and affecting the
motion of electrons significantly. This decreases the rate of TC enhancement due to Ba
substitution and results in broader resistive transitions.

Effect of bandwidth modification by Sr and Ba substitution in manganites
IV - 29
References
1. Ramirez A P, J. Phys: Condens. Mater, 9, 5171 (1997)
2. Coey J M D, Viret M and Von Molnar S, Advances in Phys., 48, 2, 167 (1999)
3. Von Helmolt R, Wecker J, Holzapsfel B, Schultz L and Samwar K, Phys. Rev.
Lett., 71, 2331 (1993)
4. Gooenough J B, Aust. J. of Phys., 52, 155 (1999)
5. Rodriguez-Martinez L M and Attfield J P, Phys. Rev. B, 54, R15622 (1996)
6. Emin D and Holstein T, Phys. Rev. B, 13, 647 (1976)
7. Ziese Michael, Srinitiwarawong Chatchai, Phys. Rev. B, 58, 11519 (1998)
8. Coey J M D, Viret M, Ranno L, Ounadjela K, Phys. Rev. Lett., 75, 3910 (1995)
9. Viret M, Ranno L, Coey J M D, J. Appl. Phys., 81, 4964 (1997)
10. Gupta A, Gong G Q, Xiao Gang, Duncombe P R, Lecoeur P, Trouilloud P, Wang
YY, Dravid V P and Sun J Z, Phys. Rev. B, 54, 629 (1996)
11. Hwang H Y, Cheong S-W, Ong N P and Batlogg B, Phys. Rev. Lett., 77, 2041
(1996)
12. Ju Sheng, Sun H, Li Zhen-Ya, Phys Letts A, 300, 666 (2002)
13. Hielman A K, Xue Y Y, Lorenz B, Campbell B J, Cmaidalka J, Wang R L, Chu C
W, Phys. Rev.B, 65, 214423 (2002)
14. I. E. Dzyaloshinskii, Zh. Eksp. Teor. Fiz. 72, 1930 (1977) [Sov. Phys. JETP 45,
1014 (1977)]
15. A. de Andrés, M. García-Hernández, and J. L. Martínez, Phys. Rev. B, 60, 7328
(1999)
16. E. Dagotto, Takashi Hotta and Adriana Moreo Physics Reports 344, 1-153, (2003)

Effect of bandwidth modification by Sr and Ba substitution in manganites
IV - 30
17. H. Y. Hwang, S. W. Cheong, N. P. Ong, and B. Batlogg,
Phys. Rev. Lett. 77, 2041 (1996)
18. X. W. Li, A. Gupta, G. Xiao, and G. Q. Gong, Appl. Phys. Lett. 71, 1124 (1997)
19. J. M. D. Coey, Philos. Trans. R. Soc. London, Ser. A, 356, 1539 (1998)
20. H. L. Ju, J. Gopalakrishnan, J. L. Peng, Qi Li, G. C. Xiong, T. Venkatesan, and R.
L. Greene, Phys. Rev. B 51, 6143 (1995)

List of Publications in published in International Journals
1. Size disorder effect in La0.5Pr0.2(Ca0.3-XBaX)MnO3 manganite.
Thaker C. M, Markna J. H., Parmar R.N., Rana D. S., Bhalodia J.A. , Kulkarni
N.A., Kuberkar D.G.and Malik S.K Thin Solid Film (In Press 2005)
2. IV behavior of superconductor manganite Y-123/LaAlO3/La0.7Sr0.3MnO3 of hetrostructure. Sanghamitra Khatua, C. M. Thaker, J. John, D.G. Kuberkar, R. Pinto and S. K. Malik.
Journal of Solid State Phenomena (communicated 2005)
3. Half Metallic Nature up to 200 K with High MR % at Room Temperature in LPSMO Epitaxial
Thin Films Grown By Pulsed Laser Deposition.
J. H. Markna, D. S. Rana, R. N. Parmar, C. M. Thaker, J. A. Bhalodia , D. G. Kuberkar,
P. K. Misra, L. M. Kukreja and S. K. Malik
Journal of Electro Ceramics (communicated 2005)
4. Large magnetoresistance in low temperature metallic region of manganites compounds
(La0.7-2xEux)(Ca0.3Srx)MnO3 (0.05≤ x ≤ 0.15) compounds.
D. S. Rana, C. M. Thaker, K. R. Mavani, D. G. Kuberkar and S. K. Malik.
Solid State Communications 133, 505, 2005
5. Electrical and magnetic properties of Eu and Sr substituted La0.7Ca0.3MnO3.
D. S. Rana, C. M. Thaker, K. R. Mavani, D. G. Kuberkar and S. K. Malik.
Hyperfine Interaction (In Press 2005)
6. Low temperature Bond Valence Sum study of La2-xDyxCa2xBa2Cu4+2xOz oxide superconductors.
Rohini Parmar, J. H. Markna, D. S. Rana, C. M. Thaker, N. A. Shah, J. A. Bhalodia,
D. G. Kuberkar, S. Rayaprol, Keka R. Chakraborty, P. S. R. Krishna
and M.Ramnadham.
Journal of Solid State Phenomena (In press 2005)
7. Magnetism and electronic transport of (La0.7-2xEux)(Ca0.3Srx)MnO3: Effect of simultaneous size
disorder and carrier density.
D.S. Rana, C. M. Thaker, K.R. Mavani, D.G. Kuberkar, Darshan C. Kundaliya and S.K. Malik,
Journal of Applied Physics 95, 4934 (2004)
8. Disorder effects in (LaTb)0.5(CaSr)0.5MnO3 compounds.
D.S. Rana, K.R. Mavani, C. M. Thaker, D.G. Kuberkar, D.C. Kundaliya and S.K. Malik.
Journal of Applied Physics 95 (2004)
9. Electronic transport, magnetism and magnetoresistance of (La0.7-3xTbx)(Ca0.3Sr2x)MnO3
(0.025 ≤ x ≤ 0.125) compounds.
D. S. Rana, K.R. Mavani, C. M. Thaker, D.G. Kuberkar, D.C. Kundaliya, S.K. Malik.
Journal of Magnetism and Magnetic Materials 271, 215 (2004)
10. Ferromagnetism and charge-ordering in (LaR)0.50(CaSr)0.50MnO3 (R=Nd,Eu,Tb) compounds.
D. G. Kuberkar, D. S. Rana, K.R. Mavani, C. M. Thaker, Darshan C. Kundaliya and S.K. Malik.
Journal of Magnetism and Magnetic Materials 272, 1823 (2004)
11. Study of 200 MeV Ag ion irradiation effects on oxygen stoichiometry of La-2125 type
superconducting thin films using ERDA.
K. R. Mavani, S. Rayaprol, D. S. Rana, C. M. Thaker, D.G. Kuberkar, J. John, R. Pinto,
S.V.S. Nageswara Rao, S.A. Khan, S.K. Srivastava, Anjana Dogra, Ravi Kumar, D.K. Avasthi.
Radiation Measurements 36, 733 (2003)

12. Studies on La2-xPrxCayBa2Cu4+yOz (x = 0.1-0.5, y=2x) type mixed oxide superconductors.
S. Rayaprol, K. R. Mavani, D. S. Rana, C. M. Thaker, Manglesh Dixit, Shovit Bhattacharya and
D.G. Kuberkar.
Solid State Communications 128, 97 (2003)
13. Effect of Mo substitution on the superconductivity, flux pinning and critical currents of
La1.5Nd0.5Ca1Ba2Cu5Oz.
S. Rayaprol, Krushna Mavani, C. M. Thaker, D. S. Rana, R.G. Kulkarni, D.G. Kuberkar,
Darshan C. Kundaliya and S. K. Mailk.
Physica C 391, 237 (2003)
14. Effect of bandwidth and size disorder on the electronic and magnetic properties of LaMnO3
perovskite.
C. M. Thaker, D. S. Rana, Krushna Mavani, S. Rayaprol, M. Shasrabudhe, S. I. Patil,
N. A. Kulakarni and D.G. Kuberkar.
Indian Journal of Engineering and Materials Sciences 10, 324 (2003)
15. Structural Investigations of La-2125 mixed oxide superconducting system.
S. Rayaprol, Krushna Mavani, D. S. Rana, C.M. Thaker, R. S. Thampi, D. G. Kuberkar,
R.G. Kulkarni and S. K. Malik.
Journal of Superconductivity 15, 211(2002)
16. Effect of Pr-Ca substitution on the transport and magnetic behavior of LaMnO3 perovskite.
C. M. Thaker, S. Rayaprol, Krushna Mavani, D. S. Rana, M. Sahasrabudhe, S.I. Patil,
D.G. Kuberkar.
Pramana - Journal of Physics, 58, 1035 (2002)
17. Structural studies and Tc dependence in La2-xDyxBa2CayCu4+yOz type mixed oxide
8superconductors.
S. Rayaprol, Krushna Mavani, C. M. Thaker, D. S. Rana, Nilesh A. Kulkarni, Keka Chakravorty,
S. K. Paranjape, M. Ramanadham and D.G. Kuberkar.
Pramana - Journal of Physics, 58, 877 (2002)