saufley hc 7.31.07 release - florida department of … fire burned at saufley landfill ... they were...
TRANSCRIPT
Health Consultation AIR QUALITY
HYDROGEN SULFIDE IN AMBIENT AIR NEAR SAUFLEY FIELD CONSTRUCTION AND DEMOLITION DEBRIS LANDFILL
BELLVIEW, ESCAMBIA COUNTY, FLORIDA
EPA FACILITY ID: FLN000409867
AUGUST 1, 2007
U.S. DEPARTMENT OF HEALTH AND HUMAN SERVICES Public Health Service
Agency for Toxic Substances and Disease Registry Division of Health Assessment and Consultation
Atlanta, Georgia 30333

Health Consultation: A Note of Explanation
An ATSDR health consultation is a verbal or written response from ATSDR to a specific request for information about health risks related to a specific site, a chemical release, or the presence of hazardous material. In order to prevent or mitigate exposures, a consultation may lead to specific actions, such as restricting use of or replacing water supplies; intensifying environmental sampling; restricting site access; or removing the contaminated material.
In addition, consultations may recommend additional public health actions, such as conducting health surveillance activities to evaluate exposure or trends in adverse health outcomes; conducting biological indicators of exposure studies to assess exposure; and providing health education for health care providers and community members. This concludes the health consultation process for this site, unless additional information is obtained by ATSDR which, in the Agency’s opinion, indicates a need to revise or append the conclusions previously issued.
You May Contact ATSDR TOLL FREE at 1-800-CDC-INFO
or Visit our Home Page at: http://www.atsdr.cdc.gov
HEALTH CONSULTATION
AIR QUALITY
HYDROGEN SULFIDE IN AMBIENT AIR NEAR SAUFLEY FIELD CONSTRUCTION AND DEMOLITION DEBRIS LANDFILL
BELLVIEW, ESCAMBIA COUNTY, FLORIDA
EPA FACILITY ID: FLN000409867
Prepared By:
Florida Department of Health, Bureau of community Environmental Health
Under Cooperative Agreement with the U.S. Department of Health and Human Services
Agency for Toxic Substances and Disease Registry
Saufley Field Road, C&DD Landfill Health Consultation
CONTENTS
Summary ...................................................................................................................................... 2
Purpose......................................................................................................................................... 3
Background ................................................................................................................................. 3
Community Health Concerns.................................................................................................. 5
Discussion ................................................................................................................................. 11
Child Health Considerations ................................................................................................. 15
Conclusions............................................................................................................................... 15
Recommendations................................................................................................................... 16
Public Health Action Plan ...................................................................................................... 16
Authors, Technical Advisors ................................................................................................ 17
References ................................................................................................................................. 18
Figures ........................................................................................................................................ 22
Appendices ................................................................................................................................ 38
Saufley Field Landfill Health Consultation
Summary In this report, the Florida Department of Health (FDOH) reviewed November and December 2006 hydrogen sulfide air monitoring results from four residential properties near the Saufley Field Landfill, in Bellview, Escambia County, Florida. We reviewed these data at the request of the Escambia County Health Department and the Agency for Toxic Substances Disease Registry (ATSDR). Ambient air was tested in response to nearby residents’ complaints as part of a health study conducted by the Escambia County Health Department with technical support from ATSDR and the FDOH. Since the 2004 and 2005 hurricanes, the Saufley Field Landfill in Escambia County accepted large volumes of construction and demolition debris including large amounts of drywall that is also known as wall board or sheetrock. As the waste decomposes, landfill-related odors, gases, fires and particulate matter occur if appropriate engineering controls are not in place. Decomposing drywall is of particular concern because of its breakdown byproduct: hydrogen sulfide gas. Anaerobic bacteria convert the sulfate in the drywall into hydrogen sulfide gas, which has a characteristic “rotten egg” smell. Because some of the decomposition processes of landfill waste are exothermic, gases produced can reach combustible concentrations resulting in the frequent occurrence of surface and sub-surface fires. When these fires ignite, particulate matter from the landfill may be emitted into the environment. Environmental emissions of particulate matter, odors, gases, and fire from the landfill may affect the health and safety of surrounding residents. A fire burned at Saufley Landfill between November 2005 and February 2006, and it is unclear from the available records if these fires were ever completely extinguished after that time. The Escambia County Health Department received numerous health complaints from residents living near the landfill. They were concerned about smoke and rotten egg and other gas odors. They complained of respiratory problems, mucous membrane irritation, headaches, and nausea. Several area physicians also contacted the health department about their patients. The Escambia County Health Department advised residents with respiratory symptoms to seek medical care. They also advised residents to remain indoors or leave the area if their symptoms became intolerable. In January 2006, the United States Environmental Protection Agency (EPA) tested the air surrounding the Saufley Field Landfill. The FDOH found the January 2006 air monitoring data were insufficient to evaluate the public health threat (ATSDR 2006). Between November 3, 2006 and January 2, 2007, the Escambia County Health Department, in cooperation with the ATSDR tested the air at four residential locations around the landfill for hydrogen sulfide and particulates. In February 2007, levels of hydrogen sulfide on the landfill required workers to cease closure operations and attend training for the use of respiratory protection equipment. The owner has since hired B&B Fire Safety and Service Inc., from Lafayette Louisiana to complete the landfill closure. Workers for this firm have the equipment and training necessary to carry out the re-grading and covering operations for closure of the landfill and assure worker protection. DEP inspectors visit the site weekly checking on closure progress.
The FDOH and ATSDR classify the levels of hydrogen sulfide in residential air around the Saufley Field Landfill as a Public Health Hazard. All four residential monitors around the landfill detected hydrogen sulfide. Measured episodes of hydrogen sulfide air concentrations
2
Saufley Field Landfill Health Consultation
(greater than 30 ppb for 30 minutes) could have affected children with asthma. The concentrations of hydrogen sulfide found in the air are associated with eye and respiratory irritation. The exposure pathway is outside air; people can contact outside air out-of-doors, through open windows, or indoors if their heating or cooling systems draw outside air inside. Although levels of airborne particulates did not exceed regulatory standards, smoke from landfill fires may have aggravated symptoms in nearby residents with preexisting respiratory health conditions.
Residential exposures to hydrogen sulfide from the Saufley Field Landfill should be reduced as soon as possible. The levels of hydrogen sulfide in residential areas around the landfill should continue to be monitored daily. Nearby residents should be advised to stay inside or leave the area based on daily hydrogen sulfide monitoring. The threat of landfill fire should be reduced and landfill access restricted.
Purpose The Florida Department of Health (FDOH) evaluates the public health significance of environmental contamination through a cooperative agreement with the federal Agency for Toxic Substances and Disease Registry (ATSDR) in Atlanta, Georgia. Working with ATSDR and the Escambia County Health Department, FDOH evaluated the potential health threat to residents near the Saufley Field Landfill based on hydrogen sulfide and particulate air monitoring results. This data was collected as part of an Escambia County health study in the community surrounding the landfill. ATSDR, and the Escambia County Health Department are in the process of analyzing the additional data including daily health diaries and personal hydrogen sulfide monitors (badges). When this analysis is completed, it will be published in a separate report.
Background The Saufley Field Landfill is located at 6001 Saufley Field Road, northeast of the intersection of Saufley Field Road and East Fence Road in Belleview, Escambia County, Florida (Figure 1). The Florida Department of Environmental Protection (DEP) permitted this construction and demolition debris landfill beginning in 1990. Construction and demolition debris includes concrete, asphalt, wood, metal, sheetrock (also known as wallboard or drywall) and roofing material from construction, renovation or demolition of structures. Since 1990, the Saufley Field Landfill has grown from 5 to 23 acres. In 2000, over 2,000 people lived within a 1-mile radius of the landfill. Approximately 91% were white, 3% percent were black, and 6% were American Indians, Hispanics or Latinos, and others. In 2000, over 11,000 people lived within a 2-mile radius of the landfill. Approximately 81% were white, 10% percent were black, and 9% were American Indians, Hispanics or Latinos, and others (Census 2000). Some live in single-family dwellings built prior to the landfill (1990). Others live in developments permitted since 1990. There are also several small farms and a community consisting of manufactured homes. Since the 2000 census, more people have built homes in this area. The landfill is adjacent to the Saufley Field Naval airport. Saufley Field has 2 4000-foot runways, 3 aircraft hangars, and 600,000 square-feet of building space. Its 63 buildings house government contractors and a low-security federal prison. Saufley Field has 657 developed acres and 209 undeveloped acres, primarily wetlands.
3
Saufley Field Landfill Health Consultation
The Saufley Field Landfill received a large volume of debris following hurricanes in 2004 and 2005. The debris included water-damaged sheet rock (drywall) from homes and businesses. After rains saturated the lower levels of this landfill, anaerobic bacteria converted the sulfate in the sheet rock into hydrogen sulfide gas.† Rain also displaced hydrogen sulfide gases produced in the landfill causing it to escape into the air around the landfill. Hydrogen sulfide gas has a characteristic “rotten egg” smell. Conversion of sulfates into hydrogen sulfide gas also generated heat.
Saufley Field Landfill management practices and conditions may have intensified the production of reduced sulfide gases on the site. Specific site practices and conditions that may have led to excess reduced sulfide gas production include the following: lack of covering of the wastes; lack of rain and surface water diversion and collection; pH of the waste; height of stacked wastes; and fire history (based on studies of other landfills, Durno et al. 2006, Appendix 7). Studies have shown that decomposition in construction and demolition landfills can also generate sulfur gases other than hydrogen sulfide. Many of these other sulfur gases have a strong smell. In addition to hydrogen sulfide in soil gas (6,000-3,020,000 parts per billion) and in outdoor air (3-50,000 parts per billion), the University of Florida researchers found the following sulfur gases in the soil gas at 10 different Florida construction and demolition landfills (Lee et al. 2006).
Table 1. Sulfur Gases in Soil Gas at 10 Florida Construction and Demolition Landfills
Sulfur Gases Range Detected (ppb)
carbonyl sulfide BDL to 61,000
methyl mercaptan BDL to 164,000 dimethyl sulfide BDL to 2,100 ethyl mercaptan BDL to 200 carbon disulfide BDL to 91,000 isopropyl mercaptan BDL to 2,800 butyl mercaptans BDL to 200 Thiophene BDL to 100 2- and 3-methylthiophene BDL to 400
ppb = parts per billion BDL = below detection limit
Hydrogen sulfide is a flammable gas and depending on its concentration in air, it can help sustain a landfill fire. The lower flammable limits to hydrogen sulfide by percent volume of air are 4.0 to 4.3%, and the upper limit is 46%. Methane (another flammable gas) is produced as a byproduct of organic material degradation in the landfill. A fire burned the Saufley Field Landfill in June
† Sulfate-reducing bacteria need sulfate, carbon, anaerobic conditions (no oxygen), moisture, a pH between 6 and 9 (slightly alkaline), and temperatures between 68 to 102 degrees Fahrenheit to produce hydrogen sulfide. Either one of the following processes reduces sulfate into hydrogen sulfide, depending on the kind of bacteria involved:
x 2(CH2O-R) + SO42- → 2(HCO3
-) + H2S + 2R, x S04
2- → S032- → S3062- → S2032- → S2-. S2- + H + ↔ HS
HS- + H+ ↔ H2S
4
Saufley Field Landfill Health Consultation
2000. Another fire burned this landfill between November 2005 and February 2006, and it is unclear from the available records whether fires were ever completely extinguished.
In the fall of 2005, the Escambia County Health Department received numerous health complaints from residents living near the landfill. They were concerned about smoke and rotten egg and other odors coming from the landfill. They complained of respiratory problems, mucous membrane irritation, headaches, and nausea. Several area physicians also contacted the health department with concerns that their patient’s health was adversely affected by landfill emissions.
In January 2006, while the landfill fire was still smoldering, the US Environmental Protection Agency (EPA) tested the surrounding air. EPA staff tested for carbon monoxide, hydrogen sulfide, particulate matter, volatile organic compounds, sulfur dioxide, and asbestos.
FDOH staff who reviewed these test results were unable to determine if the air quality around the landfill was a public health hazard. Our earlier report found that smoke from the landfill was likely worse before the two-day monitoring period. We also found the detection limits for the sulfur dioxide and hydrogen sulfide tests were higher than levels that could affect public health. Our reviewer did find that the concentrations of carbon monoxide and asbestos were not likely to cause illness (ATSDR 2006).
Community Health Concerns Between January and mid-June 2006, the Escambia County Health Department received 34 calls complaining that the Saufley Field Landfill was causing symptoms and illnesses in a total of 80 individuals. Twelve area physicians also reported symptoms and illness in eleven patients. Individuals reporting symptoms and illnesses raged from 3 to 80 years old. Thirty percent (30%) complained of sinus and allergy problems, 14% complained of chest tightness, cough, headache, and “other” health problems, 9% complained of burning eyes, 5% complained of nausea, and 1% complained of pneumonia (Escambia CHD 2006).
In May 2006, the Escambia County Health Director requested technical assistance from ATSDR to conduct a health study (Lanza 2006). In November 2006, the State Epidemiologist requested an Epi Aid from ATSDR for further on-site support during the study (Middaugh 2006). In November, 2006, the Escambia County Health Department began a community health study that included ambient and personal hydrogen sulfide air monitoring, administering a respiratory health questionnaire and daily health diaries (Appendices 1, 2, and 4). The EPA provided particulate air-sampling equipment, which was maintained and analyzed by the Florida Department of Environmental Protection (FDEP). The study was conducted under the authority of Florida Statute 381, Chapter 64D-3, Control of Communicable Diseases and Conditions, which may Significantly Affect Public Health. The study was similar to the approach taken by the federal ATSDR at two other sites with hydrogen sulfide (ATSDR 1997, 2003).
In November 2006, when the first air-monitoring results were gathered, the Escambia County Health Department issued the following news release:
Air quality monitors near the Saufley Landfill Construction and Demolition Debris Disposal Facility indicate increased levels of hydrogen sulfide in the air. Exposure to hydrogen sulfide may cause symptoms such as eye, nose and throat irritation in some individuals. People experiencing respiratory symptoms, including those with severe or chronic respiratory conditions such as asthma or chronic lung disease, should consult their
5

Saufley Field Landfill Health Consultation
physicians for treatment. They also should remain indoors. While indoors, residents should close windows, run their heating or cooling system and change the system’s filter as needed. If symptoms persist while inside a heated or cooled home, residents may choose to leave the area until their symptoms are tolerable.”
(Payne-Hardin 2006)
After ATSDR and FDOH completed their initial evaluation of the complete set of air-monitoring data, the Escambia County Health Department issued a second news release with conclusions that parallel those of this report. The news release included the next steps and links for additional information:
Next Steps The health department will assist federal, state, and local agencies -- including the U.S. Department of Environmental Protection, the Occupational Safety and Health Administration, the Florida Department of Environmental Protection, and county officials in implementing the report recommendations.
For More Information � To read the report, log onto the health department’s website at
www.EscambiaHealth.com. � �
For health concerns, contact your physician. If you have questions about the report, contact the health department at 595-6683.
(Payne-Hardin 2007)
ATSDR provided on-site support for community interaction. ATSDR also provided the hydrogen sulfide meters and the personal monitoring badges. ATSDR installed the meters at nearby homes, trained Escambia CHD staff, and provided technical assistance. Escambia CHD coordinated the investigation with federal, state, and local governmental agencies, as well as elected officials and community leaders. ATSDR coordinated with the U.S. Environmental Protection Agency (EPA), the FLDEP and the Escambia County Health Department to install and maintain particulate monitors. The Escambia CHD recorded hydrogen sulfide levels and collected personal monitoring badges/health diaries. FDOH headquarters staff translated the hydrogen sulfide levels into time-weighted averages.
On February 5, 2007, while site-workers were using heavy equipment to reduce the landfill height, hydrogen sulfide was measured in the air on top of the landfill at a concentration of 140 parts per million (ppm) (Metzler 2007g). Two on-site ground level measurements (100 and 140 ppm, northeast and southeast, respectively) exceeded the National Institute for Occupational Safety and Health guideline 10-minute Short Term Exposure Level (10 ppm) for workers and met or exceeded the immediately dangerous to life and health guideline of 100 ppm (NIOSH
g The landfill owner hired Analytical Chemical Testing Laboratory to measure the hydrogen sulfide concentrations at four locations in response to an order by OSHA to evaluate potential worker exposures. The intent of the sampling was to assess whether concentrations at the surface of the landfill exceeded the OSHA ceiling concentration of 20 ppm for hydrogen sulfide. Therefore, the instrument used to monitor had a lower detection limit of 10 ppm. Of the four measurements taken, the northwest and southwest measurements were below the instrument’s 10-ppm detection level.
6
Saufley Field Landfill Health Consultation
2006). These values also exceeded the Occupational Safety and Health Administration’s (OSHA) short term exposure level (10 ppm). Based on these findings, OSHA stopped work at the site and required workers to take a two-week respirator-training program.
Analytical Chemical Testing Laboratory personnel provided testimony on March 21, 2007 that included the results of additional hydrogen sulfide screening they performed on February 14, 2007, to evaluate hydrogen sulfide concentrations at breathing level at the perimeter of the site. They also sampled inside and outside operating excavation equipment:
x Landfill perimeter (breathing level), 1 of 9 samples was 10 ppm, x Debris east-side—120 ppm outside the excavation equipment, 20 ppm inside,
and x Debris west side—100 ppm outside the excavation equipment, 10 ppm inside.
This report analyzes the residential hydrogen sulfide and particulate air monitoring. In a separate report, ATSDR and the Escambia CHD will analyze the results of health diaries and personal hydrogen sulfide monitors (badges) for 40 nearby residents.
Air Monitoring Methods For residential air testing, the Escambia CHD selected four nearby homes, one on each side of the landfill, where residents had complained of symptoms or illnesses (Figures 2-4). Escambia CHD obtained consent from each household (Appendix 3).
To test for hydrogen sulfide in the air, the Escambia CHD used four Zellweger Analytics single point, real-time, continuous hydrogen sulfide monitors equipped with the ChemKey® and Chemcassette® detection systems (Appendix 6). These devices are commonly referred to as a tape meters. The Chemcassettes® are chemically treated tapes used to detect specific compounds of interest. The ChemKey® is an electronic chip that provides the monitor with compound specific information relating to the detection range, sample time, and alarm levels. Depending on which cassette was used, these monitors were capable of detecting hydrogen sulfide in three ranges:
x Low range: 2 to 90 parts per billion (ppb), x Mid range: 50 to 1,500 ppb, and x High range: 1,100 to 15,000 ppb.
The Escambia CHD recorded the results from each monitor every weekday for two months between November 3, 2006 and January 2, 2007. The specific monitoring periods for each residential location follow:
x Location #001: 11/3/06 - 11/21/06 x Location #002: 11/3/06 - 12/29/06 x Location #003: 11/3/06 - 11/21/06 (low range), 11/21/06 - 11/29/06 (high range),
11/29/06 - 12/16/06 (medium range) x Location #004: 11/3/06 to 1/2/07
Because of technical problems with the meter at location #003, on November 29 it was replaced with the meter from location #001.
The Escambia CHD placed the air monitors inside a residence or shed with the air intake through a window 4 to 5 feet above the ground. Logic Beach Moduloggers,TM recorded hydrogen sulfide
7

Saufley Field Landfill Health Consultation
concentrations every 5 minutes (low range cassettes) or every 2 minutes (mid range cassettes). The Escambia CHD checked the meters every day and installed new cassettes when necessary.
The Zellweger hydrogen sulfide meters are calibrated by the manufacturer and have an accuracy of about 20-25% and a precision of about 10% (Zellweger Analytics 1993). ATSDR and EPA have used these instruments to monitor hydrogen sulfide in other communities (Inserra et al. 2002). These instruments give results comparable to those of other test instruments (ATSDR 1997).
Tests for hydrogen sulfide near this landfill did not include tests for other sulfur gases known to occur at construction and demolition landfills in Florida (Yang, et al. 1995). These other sulfur gases have odor thresholds similar to hydrogen sulfide and may cause similar health effects.
Air was monitored for fine particulate matter (particles 2.5 micrometers in diameter and smaller) at four locations (Figure 5). A Davis Instruments Weather Wizard III recorded wind speed, wind direction, and temperature every 15 minutes at location #001 (Figure 7). Wind speed, wind direction, and temperature were also obtained from the Pensacola Regional Airport.
Results Hydrogen sulfide air levels
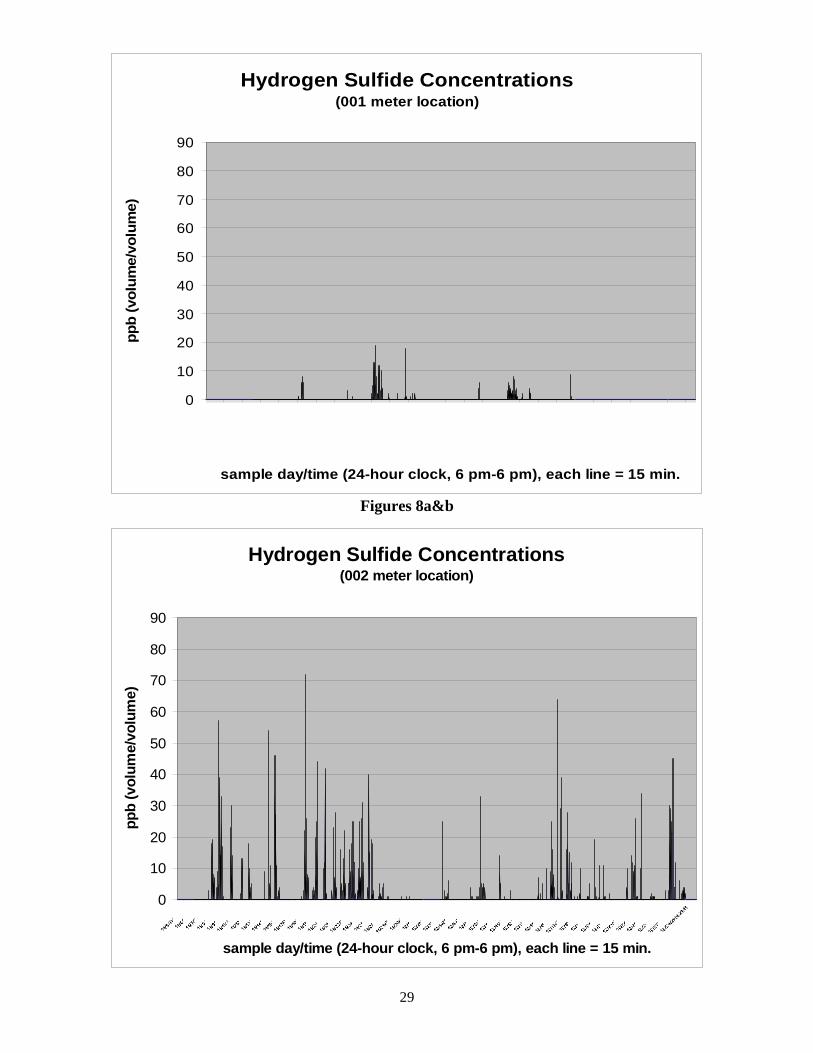
The meters detected hydrogen sulfide in the air at all four monitoring locations (Figures 2-4).
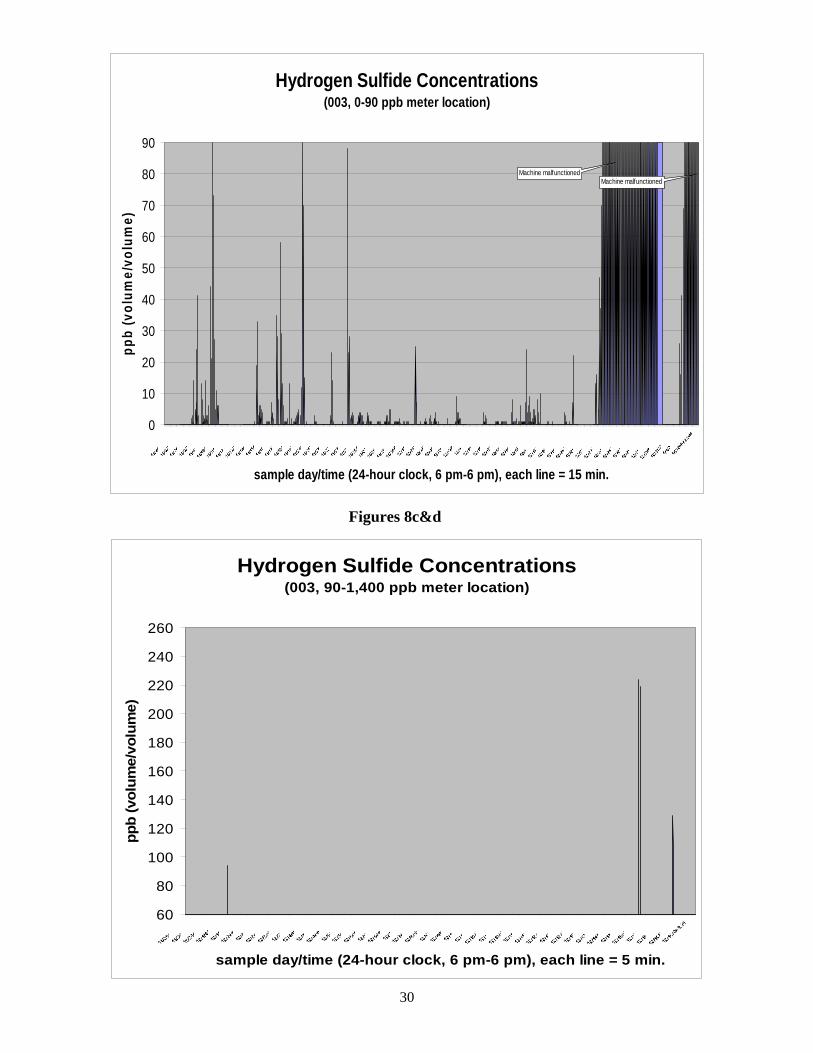
An instrument that could read mid-level concentrations (50-2,000 parts per billion) was present at location #003 for 17 days (from 11/30/06 to 12/16/06). The mid-level instrument recorded 11 5-minute intervals (55 minutes total) with hydrogen sulfide in the air at concentrations above 70 ppb (the acute Minimum Risk Level or MRL, which is explained in the following section):
Table 2. Sample Location #003, hydrogen sulfide data summary
Date Maximum H2S
Level (ppb) Average H2S Level (ppb)
Time (minutes)
11/30/06 94* 94 5 12/01/06 94* 94 5 12/14/06 224 192.7 15 12/15/06 219 126.7 15 12/16/06 129 114 15 *Note: the maximum and average results are equivalent as these samples both represent a five-minute sampling interval
Table 3 summarizes the number of hours that hydrogen sulfide was detected above various levels at the four residential locations. The amount of time indicated for hydrogen sulfide detection above these levels was summarized for the entire sampling period. Zero or “non-detection” values are not included in this table. The “high” range cassettes at location #003 did not record any hydrogen sulfide.
8
Saufley Field Landfill Health Consultation
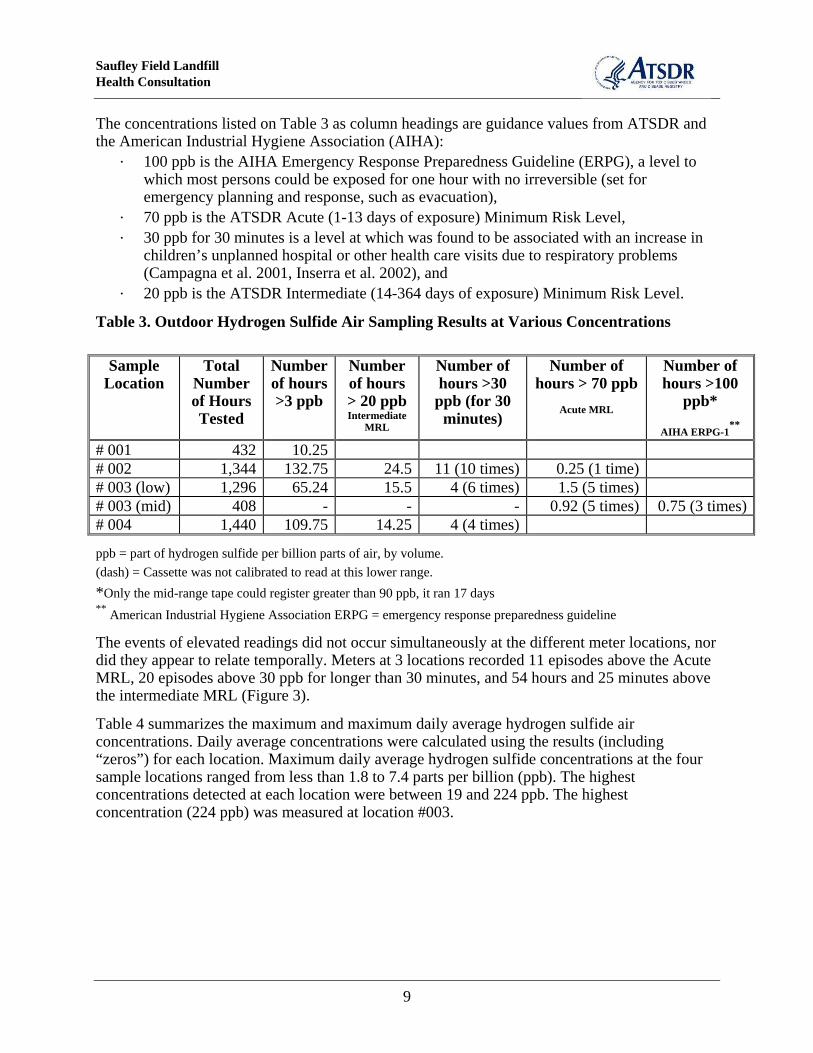
The concentrations listed on Table 3 as column headings are guidance values from ATSDR and the American Industrial Hygiene Association (AIHA): x 100 ppb is the AIHA Emergency Response Preparedness Guideline (ERPG), a level to
which most persons could be exposed for one hour with no irreversible (set for emergency planning and response, such as evacuation),
x 70 ppb is the ATSDR Acute (1-13 days of exposure) Minimum Risk Level, x 30 ppb for 30 minutes is a level at which was found to be associated with an increase in
children’s unplanned hospital or other health care visits due to respiratory problems (Campagna et al. 2001, Inserra et al. 2002), and
x 20 ppb is the ATSDR Intermediate (14-364 days of exposure) Minimum Risk Level.
Table 3. Outdoor Hydrogen Sulfide Air Sampling Results at Various Concentrations
Sample Location
Total Number of Hours Tested
Number of hours >3 ppb
Number of hours > 20 ppbIntermediate
MRL
Number of hours >30
ppb (for 30 minutes)
Number of hours > 70 ppb
Acute MRL
Number of hours >100
ppb*
AIHA ERPG-1 **
# 001 432 10.25 # 002 1,344 132.75 24.5 11 (10 times) 0.25 (1 time) # 003 (low) 1,296 65.24 15.5 4 (6 times) 1.5 (5 times) # 003 (mid) 408 - - - 0.92 (5 times) 0.75 (3 times) # 004 1,440 109.75 14.25 4 (4 times)
ppb = part of hydrogen sulfide per billion parts of air, by volume. (dash) = Cassette was not calibrated to read at this lower range. *Only the mid-range tape could register greater than 90 ppb, it ran 17 days ** American Industrial Hygiene Association ERPG = emergency response preparedness guideline
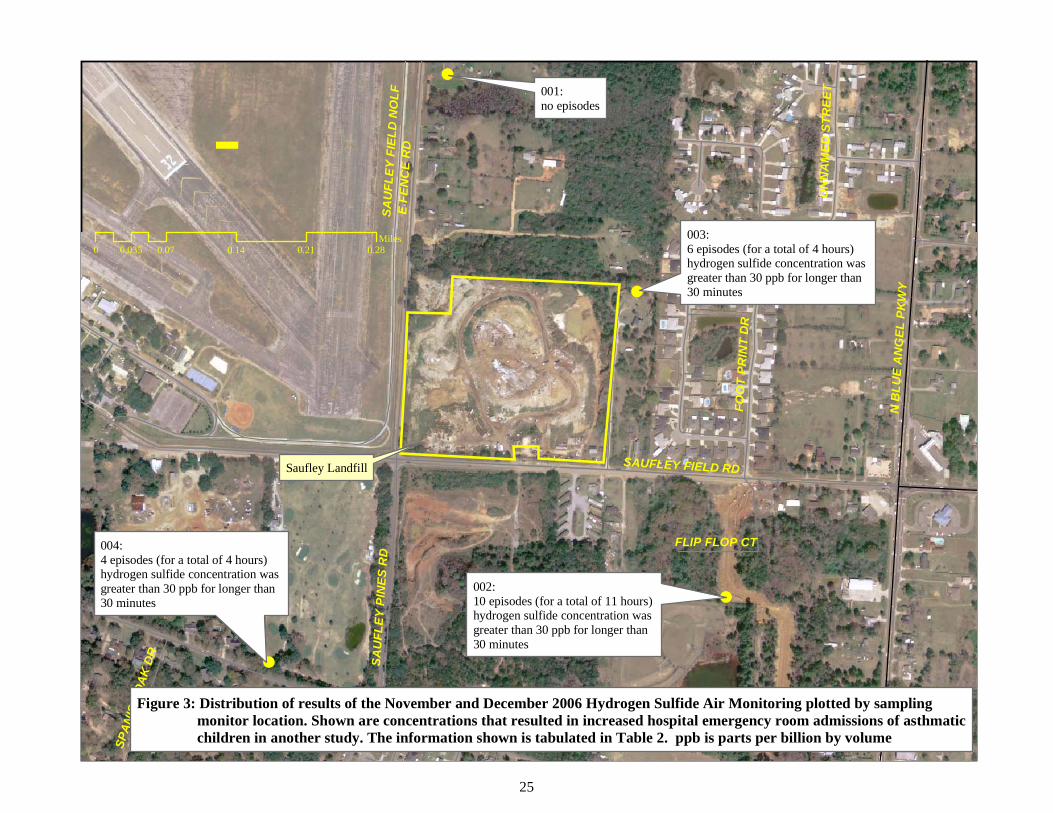
The events of elevated readings did not occur simultaneously at the different meter locations, nor did they appear to relate temporally. Meters at 3 locations recorded 11 episodes above the Acute MRL, 20 episodes above 30 ppb for longer than 30 minutes, and 54 hours and 25 minutes above the intermediate MRL (Figure 3).
Table 4 summarizes the maximum and maximum daily average hydrogen sulfide air concentrations. Daily average concentrations were calculated using the results (including “zeros”) for each location. Maximum daily average hydrogen sulfide concentrations at the four sample locations ranged from less than 1.8 to 7.4 parts per billion (ppb). The highest concentrations detected at each location were between 19 and 224 ppb. The highest concentration (224 ppb) was measured at location #003.
9

Saufley Field Landfill Health Consultation
Table 4. Maximum and Maximum Daily Average Hydrogen Sulfide Air Concentration
Sample Location Maximum Daily Average Hydrogen Sulfide Air Concentration (ppb)
Maximum Hydrogen Sulfide Air Concentration (ppb)
#001 1.8 (11/10/2006) 19 #002++ 7.4 (11/8/2006) 72 #003 (low) 5.6 (11/16/2006) 90 (11/9/2006 & 11/19/2006)*
#003 (mid) Not applicable 224 #004 5.8 (12/16/2006) 49 ppb = parts hydrogen sulfide per billion parts of air, by volume *Note: upper detection limit for this meter was 90 ppb; therefore, hydrogen sulfide concentrations were likely higher.
A level of 4.3 ppb was the average daily level in a community near a paper mill in which people experienced eye and respiratory irritation (Kilburn 1997, Kilburn & Warshaw 1995). The meters around the Saufley Field Landfill recorded 10 days when the average hydrogen sulfide concentration was above 4.3 parts per billion (Figure 4). Those days were: 11/8, 11/14, 11/16, 11/17, 11/19, 11/23, 11/25, 12/15, 12/16, and 12/28.
Particulate air levels
The US Environmental Protection Agency (EPA) has two National Ambient Air Quality Standards for fine particles known as particulate matter 2.5 or PM2.5:
x The annual standard is 15 micrograms per cubic meter (μg/m3) based on the 3year average of annual average of fine particle concentrations.
x The 24-hour standard is 35 micrograms per cubic meter (μg/m3), based on the 3year average of the 98th percentile of 24-hour concentrations.
Particulate monitoring started on November 1, 2006 and ended on February 28, 2007. The air monitors detected fine particle concentrations above 15 micrograms per cubic meter (μg/m3) seven times at the four monitoring locations around the Saufley Field Landfill (Figure 6). The maximum particulate concentration, duration above 15 μg/m3, and the dates follow:
x 17.1 micrograms per cubic meter (μg/m3) for 32 hours, November 18-19 x 23.4 μg/m3 for 88 hours, November 23-26 x 20.4 μg/m3 for 72 hours, December 5-6 x 19.1 μg/m3 for 120 hours, December 14-19 x 16.1 μg/m3 for 20 hours, January 2-3 x 16.5 μg/m3 for 84 hours, February 7-9 x 21.5 μg/m3 for 42 hours, February 14-17
The particulate concentrations around the Saufley Field Landfill did not exceed EPA’s 24-hour standard of 35 μg/m3 and were generally lower than EPA’s annual standard of 15 μg/m3. These particulate concentrations were also similar to levels at another PM air monitoring station in Ellyson (#A0000004), about 7 miles to the northeast (Figure 5). Therefore, the levels of airborne particulates measured around the Saufley Landfill for this period may be indicative of regional air quality and unrelated to the landfill.
10
Saufley Field Landfill Health Consultation
Discussion FDOH compared the measured hydrogen sulfide air concentrations with concentrations known to cause symptoms or illness. Medical reports and human and animal studies show that breathing hydrogen sulfide can cause symptoms and illness, depending on the concentrations and length of exposure. Acute or short-term exposures last less than14 days. Intermediate exposures last between 14 and 364 days. Chronic exposures last for more than a year.
Pathways analysis
FDOH determines exposure to environmental contamination by identifying exposure pathways. An exposure pathway is generally classified by environmental medium (e.g., water, soil, air, food). A completed exposure pathway consists of five elements: a source of contamination; transport through an environmental medium, a point of exposure, a route of exposure, and a receptor population. A completed exposure pathway exists when people are actually exposed through ingestion or inhalation of, or by skin contact with a contaminated medium.
In completed exposure pathways, all five elements exist, and exposure to a contaminant has occurred in the past, is occurring, or will occur in the future. In potential exposure pathways, at least one of the five elements is not clearly defined, but could exist. Therefore, exposure seems possible. Potential pathways indicate that exposure to a contaminant could have occurred in the past, could be occurring, or could occur in the future. However, key information regarding a potential pathway may not be available. It should be noted that the identification of a completed or potential exposure pathway does not necessarily result in human health effects. An exposure pathway can be eliminated if at least one of the five elements is missing and will never be present.
FDOH reviewed the site history, community concerns, and available environmental sampling data. We identified exposure to hydrogen sulfide in outdoor (ambient) air as a completed exposure pathway. Nearby residents likely breathed hydrogen sulfide and other sulfur gases from the Saufley Landfill. Periods when the air is still tend to result in the highest levels in breathing zone air. Often such periods occur in the evening, overnight, and in the early morning. During the day, ultra-violet light from the sun degrades hydrogen sulfide. When sunlight heats the air, the mixing caused by warm air rising dilutes hydrogen sulfide concentrations. Because hydrogen sulfide is denser than air, it tends to follow streambeds and other low topographic areas as it migrates away from the source area. It may also move along underground conduits such as buried water, sewer, and electric lines.
Although this report primarily addresses the air exposure pathway, FDOH and DEP staff also checked on the groundwater exposure pathway. Escambia County Health Department staff have recently sampled the only potable well near the site (results are not yet available). Monitoring wells installed and tested for the preparation of the Saufley Landfill Site Assessment Report found off-site shallow groundwater has intermittently exceeded primary drinking water standards for arsenic and sodium, and secondary drinking water standards for aluminum, iron, manganese, sulfate and total dissolved solids.
In June 2007, the DEP Northwest District staff conducted a well inventory. Two irrigation wells are within ¼-mile down gradient from the site. Down gradient groundwater is equivalent to surface water flowing down stream. Thirty-three irrigation wells are between ¼- and ½-mile down gradient of the site. Should the groundwater plume reach the irrigation wells, some
11
Saufley Field Landfill Health Consultation
characteristics of chemicals found above the secondary standards may deter its use as irrigation water.
Comparison of results to guidelines
FDOH uses ATSDR Minimum risk levels (MRLs) to screen test data for further evaluation. MRLs are contaminant concentrations at which exposures are unlikely to cause non-cancer health effects over a specified duration of exposure. MRLs include ample safety factors to ensure protection of sensitive human populations. Therefore, levels below an MRL are unlikely to cause illness. Levels above an MRL warrant further evaluation. Because of built-in safety factors, exposure to a concentration above an MRL does not necessarily cause symptoms or illness.
Uncertainties with the derivation of MRLs are associated with their application over a less than lifetime duration or for health effects that are delayed in development or are acquired following repeated acute insults, such as hypersensitivity reactions, asthma, or chronic bronchitis. As these kinds of health effects data become available and methods to assess levels of significant human exposure improve, ATSDR revises their MRLs.
The ATSDR Minimum Risk Level (MRL) for hydrogen sulfide is 70 parts per billion (ppb) for short term (acute) exposures (less than 14 days). This short-term (acute) MRL is based on a study in which 2 of 10 asthmatics exposed to 2,000 ppb hydrogen sulfide for 30 minutes experienced apparent bronchial obstruction (Jappinen et al. 1990). This MRL includes a safety factor of 27 (3 for the use of a minimum Lowest Observed Adverse Effect Level, 3 for human variability, and 3 for database deficiencies). Hydrogen sulfide levels exceeded the short-term MRL of 70 ppb 17 times at locations #2 and #3 around Saufley Landfill during the sampling period.
The ATSDR MRL for hydrogen sulfide is 20 ppb for intermediate length (14-364 days) exposures. The intermediate hydrogen sulfide MRLs is based on a no observable adverse effect level (NOAEL) in an animal study that showed olfactory neuron loss and basal cell hyperplasia (Brenneman et al. 2000). Hydrogen sulfide levels frequently exceeded the intermediate length MRL of 20 ppb during the sampling period (#002-27 times, #003-41 times, and #004-28 times).
Health effects from breathing hydrogen sulfide
Depending on the concentration in the air, hydrogen sulfide can effect the eyes, nose, throat, lungs, and nervous system (Ahlborg 1951, Arnold et al. 1985, Bhambini et al. 1994, 1996a, 1996b; Bhambini & Singh 2001, CIIT 1983a, b, c; Curtis et al. 1975, Haider et al. 1990, Lopez et al. 1988, Luck & Kaye 1989, Jappinen et al. 1990, Reiffenstein et al. 1992, and Spoylar 1951). Hydrogen sulfide irritates the eyes, nose, and throat by forming sodium sulfide (a compound that has an alkaline or basic pH). Once inhaled, hydrogen sulfide can enter the blood stream by diffusion through the lungs. Most of the hydrogen sulfide in the blood is oxidized to sulfates (primarily thiosulfate) by the liver and excreted in the urine. People with cardiac or nervous system disorders, people with pre-existing respiratory problems (asthma, restrictive lung disease, etc.), the very young, and the elderly are more sensitive to hydrogen sulfide (ATSDR 2006).
12

Saufley Field Landfill Health Consultation
Peak hydrogen sulfide air concentrations
Meters at 2 locations recorded 17 episodes (2.67 hours) when hydrogen sulfide concentrations were above the Acute MRL of 70 ppb. Based on studies of asthmatics, people breathing these concentrations could experience headaches and bronchial constriction (ATSDR 2006).
30-minute periods when hydrogen sulfide air concentrations exceeded 30 ppb
A recent study found an association between asthma-related hospital visits by children and hydrogen sulfide concentrations above 30 parts per billion (ppb) for longer than 30 minutes in Dakota City and South Sioux City, Nebraska (Campagna et al. 2001). Meters at three locations around the Saufley Field Landfill recorded 20 instances where the hydrogen sulfide concentrations were above 30 ppb for longer than 30 minutes (Figure 3). Therefore, the concentrations of hydrogen sulfide measured in the outdoor air near the Saufley Field Landfill could affect children with asthma.
In addition to the Dakota and South Sioux Cities study, the following states have set up regulations or guidelines for hydrogen sulfide exposure in the low parts per billion range.
State Exposure Length Description Concentration Source
Arizona 1 hour (Ambient Air Quality Guideline) 45 ppb Arizona DEQ 2005 24 hours (Ambient Air Quality Guideline) 27 ppb Arizona DEQ 2005
California 1-hour average (Ambient Air Quality Standard) 30 ppb CalEPA 2005
Delaware 3-min. average (Ambient Air Quality Standard) 60 ppb Delaware DNREC 2005 1-hour average (Ambient Air Quality Standard) 30 ppb Delaware DNREC 2005
Minnesota 30-min. average (Ambient Air Quality Standard) not to be exceeded over two times a year
50 ppb Minnesota PCA 2004
30-min. average (Ambient Air Quality Standard) not to be exceeded over two times in any
five consecutive days
30 ppb Minnesota PCA 2004
Missouri 30-min. average (Ambient Air Quality Monitoring Yearly Standard)
50 ppb Missouri DNR 2004
Montana 1-hour average (Ambient Air Quality Standard) not to be exceeded over once a year
50 ppb Montana DEQ 2004
Nevada 1-hour average (Ambient Air Quality Standard) 80 ppb Nevada DEP 2005
New York 1-hour average (Ambient Air Quality Standard) 10 ppb New York DEC 2005 (Source: ATSDR 2006, Section 8, Regulation and Advisories, page 154)
Average hydrogen sulfide air concentrations
A study of people living around a paper mill exposed to an annual average hydrogen sulfide concentration of 4.3 parts per billion (ppb) and daily maximum concentrations of up to 70 ppb, reported a 12-fold increase in eye and respiratory irritation (Kilburn 1997, Kilburn & Warshaw 1995). These community members were exposed to other chemicals in addition to hydrogen
13

Saufley Field Landfill Health Consultation
sulfide. The meters around the Saufley Field Landfill recorded 10 days when the average hydrogen sulfide concentration was greater than 4.3 ppb, and had daily maximum concentrations up to 224 ppb. Therefore, the concentrations of hydrogen sulfide in the outdoor air near the Saufley Field Landfill could have caused eye and respiratory irritation.
Health effects from breathing particulate matter
The particulate concentrations measured in the air around the Saufley Field Landfill were generally lower than the US Environmental Protection Agency’s annual standard and none exceeded their 24-hour standard. Therefore, the measured concentrations are unlikely to affect healthy persons. However, for people with respiratory disease, lung disease, asthma attacks, and certain cardiovascular problems, particulates in the air might aggravate these conditions at levels below the EPA standards.
Other hazards
Other sulfur gases typically found at construction and demolition landfills may also be present at this landfill. These other sulfur gases have odor thresholds and toxicities similar to that of hydrogen sulfide. The meters used to monitor the air near the landfill were unable to detect or measure these other sulfur gases.
Because hydrogen sulfide is flammable; heavy equipment, smoking, or other ignition sources could reignite fires at this landfill.
Although the Saufley Field Landfill is gated to control vehicle entry,, access by foot is not restricted. Injury from falling, tripping, or being cut by debris are hazards for trespassers.
Limitations
Air quality data evaluated for this report reflect only a short, two-month duration (November 3, 2006 to January 2, 2007) at four locations around the Saufley Landfill. The results cannot be used to determine “worst case” exposures, the frequency of worst-case exposures, or representative or “typical” ambient air hydrogen sulfide concentrations. People who feel ill, especially those with persistent symptoms, should see their doctors. They should tell their doctors about any concerns they might have about environmental exposures.
14
Saufley Field Landfill Health Consultation
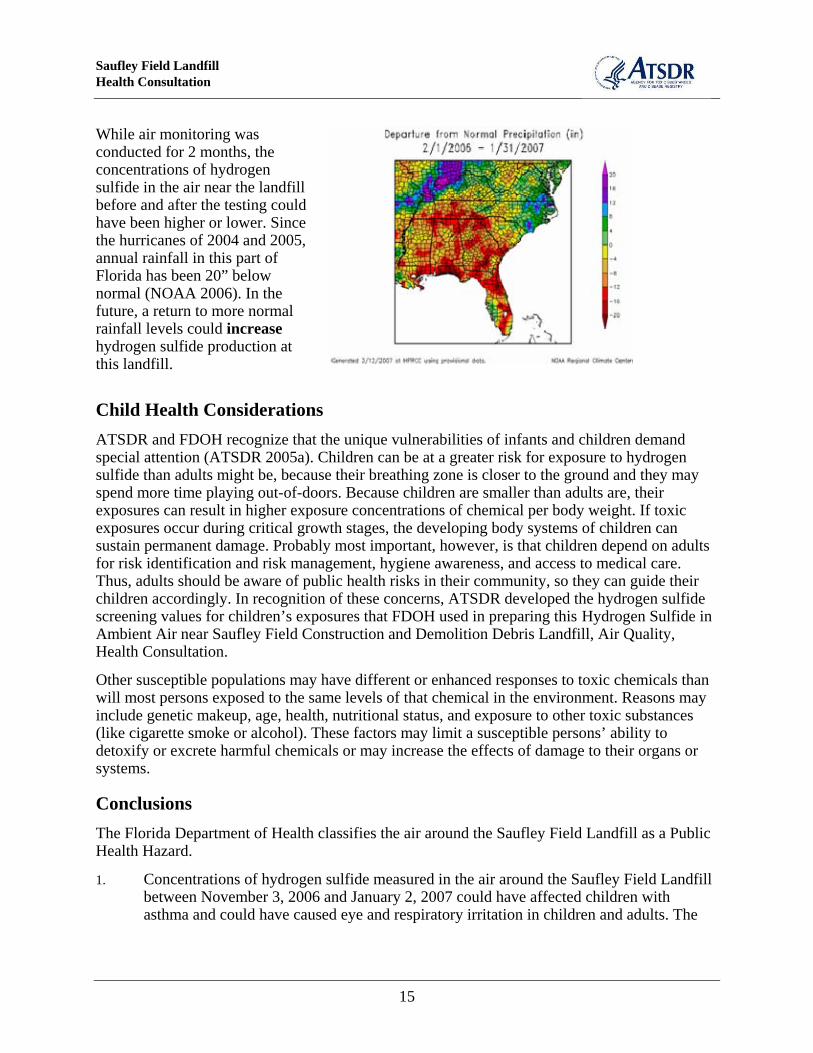
While air monitoring was conducted for 2 months, the concentrations of hydrogen sulfide in the air near the landfill before and after the testing could have been higher or lower. Since the hurricanes of 2004 and 2005, annual rainfall in this part of Florida has been 20” below normal (NOAA 2006). In the future, a return to more normal rainfall levels could increase hydrogen sulfide production at this landfill.
Child Health Considerations ATSDR and FDOH recognize that the unique vulnerabilities of infants and children demand special attention (ATSDR 2005a). Children can be at a greater risk for exposure to hydrogen sulfide than adults might be, because their breathing zone is closer to the ground and they may spend more time playing out-of-doors. Because children are smaller than adults are, their exposures can result in higher exposure concentrations of chemical per body weight. If toxic exposures occur during critical growth stages, the developing body systems of children can sustain permanent damage. Probably most important, however, is that children depend on adults for risk identification and risk management, hygiene awareness, and access to medical care. Thus, adults should be aware of public health risks in their community, so they can guide their children accordingly. In recognition of these concerns, ATSDR developed the hydrogen sulfide screening values for children’s exposures that FDOH used in preparing this Hydrogen Sulfide in Ambient Air near Saufley Field Construction and Demolition Debris Landfill, Air Quality, Health Consultation.
Other susceptible populations may have different or enhanced responses to toxic chemicals than will most persons exposed to the same levels of that chemical in the environment. Reasons may include genetic makeup, age, health, nutritional status, and exposure to other toxic substances (like cigarette smoke or alcohol). These factors may limit a susceptible persons’ ability to detoxify or excrete harmful chemicals or may increase the effects of damage to their organs or systems.
Conclusions The Florida Department of Health classifies the air around the Saufley Field Landfill as a Public Health Hazard.
1. Concentrations of hydrogen sulfide measured in the air around the Saufley Field Landfill between November 3, 2006 and January 2, 2007 could have affected children with asthma and could have caused eye and respiratory irritation in children and adults. The
15
Saufley Field Landfill Health Consultation
Saufley Field Landfill continues to emit hydrogen sulfide gas. A return to normal rainfall amounts may increase hydrogen sulfide production at the Saufley Field Landfill.
2. Although levels of air-borne particulate matter did not exceed federal standards, smoke from landfill fires can aggravate symptoms in nearby residents with preexisting respiratory conditions.
3. Injury from falling, tripping, or being cut by debris are hazards for trespassers on the Saufley Field Landfill. Other hazards from the landfill include the potential for re-ignition of flammable gases and exposures to other gases, which were not measured for this study.
Recommendations 1. Reduce residential exposures to hydrogen sulfide from the Saufley Field Landfill as soon
as possible.
2. Continue to monitor levels of hydrogen sulfide daily in residential areas around the Saufley Field landfill. Advise nearby residents to stay inside or leave the area based on daily hydrogen sulfide monitoring. People who feel ill, especially those with persistent symptoms, should see their doctors. They should tell their doctors about any concerns they might have about environmental exposures.
3. Reduce the threat of landfill fire.
4. Restrict access to the landfill.
Public Health Action Plan 1. Escambia CHD and ATSDR staff are evaluating the relationship between hydrogen sulfide
concentrations (both outdoor air and personal badges) and self-reported health effects (daily diaries) for 100 nearby residents. They will document their findings in a separate report.
2. ATSDR is arranging for a six-month loan of hydrogen sulfide meters from EPA for additional monitoring. FDOH will purchase hydrogen sulfide meters when funding becomes available in August 2007.
3. The Escambia County Health Department has a portable Jerome meter that they have used to respond to citizens complaints, even after ambient monitoring equipment was no longer available.
4. The FLDOH, FLDEP, EPA, and ATSDR are meeting to determine proactive steps to ensure residents are protected during the landfill closure period and to ensure that this health hazard is avoided at other construction and demolition debris landfills in Florida.
16

Saufley Field Landfill Health Consultation
Authors, Technical Advisors Florida Department of Health Author Connie Garrett Bureau of Community Environmental Health Division of Environmental Health (850) 245-4299
ATSDR Author Lynn C. Wilder, MSHyg, CIH Environmental Health Scientist, Division of Health Studies Health Investigation Branch
Florida Department of Health Designated Reviewer Randy Merchant Bureau of Community Environmental Health Division of Environmental Health (850) 245-4249
ATSDR Reviewer Jennifer Freed Technical Project Officer Division of Health Assessment and Consultation
17
Saufley Field Landfill Health Consultation
References [ATSDR] Agency for Toxic Substances and Disease Registry. Hydrogen Sulfide (H2S) CAS 7783-0604; UN 1053. Available at: http://www.atsdr.cdc.gov/MHMI/mmg114.pdf. Accessed on December 17, 2006.
[ATSDR] Agency for Toxic Substances and Disease Registry. landfill gas primer an overview for environmental health professionals. Chapter 3 landfill gas basics. Available at: http://www.atsdr.cdc.gov/HAC/landfill/PDFs/Landfill_2001_ch3.pdf Accessed on December 17, 2006.
[ATSDR] Agency for Toxic Substances and Disease Registry. 2006. Toxicological Profile for hydrogen sulfide: U.S. Department of Health and Human Services, U.S. Public Health Service. July 2006.
[ATSDR] Agency for Toxic Substance and Disease Registry. 2006. Health Consultation: Evaluation of Ambient Air Sampling, Saufley Field Landfill, Pensacola, Escambia County, FL. July 20, 2006.
[ATSDR] Agency for Toxic Substances and Disease Registry. 2002. Agency for Toxic Substances and Disease Registry Health Consultation: Hydrogen Sulfide Exposure, Warren Township, Trumball County, OH. September 12, 2002.
[ATSDR] Agency for Toxic Substance and Disease Registry. 1999. Toxicological Profile for hydrogen sulfide: U.S. Department of Health and Human Services, U.S. Public Health Service. July 1999.
[ATSDR] Agency for Toxic Substance and Disease Registry. 1997. Exposure Investigation: Dakota City/South Sioux City Hydrogen Sulfide in Ambient Air. Dakota City/South Sioux City, NE. December 16, 1997.
Ahlborg G. 1951. Hydrogen sulfide poisoning in shale oil industry. Arch Ind Hyg Occup Med 3:247266.
[AIHA] American Industrial Hygiene Association.1991. Emergency response planning guidelines: Hydrogen sulfide. Fairfax, VA.
Arnold IMF, Dufresne RM, Alleyne BC, et al. 1985. Health implication of occupational exposures to hydrogen sulfide. J Occup Med 27(5):373-376.
Bhambhani Y, Singh M. 2001. Physiological effects of hydrogen sulfide inhalation during exercise in healthy men. Journal of Applied Physiology. 2001:71(5)1872-1877.
Bhambhani Y, Burnham R, Snydmiller G, et al. 1994. Comparative physiological responses of exercising men and women to 5 ppm hydrogen sulfide exposure. American Industrial Hygiene Association Journal. 1994:55(1030-1035).
Bhambhani Y, Burnham R, Snydmiller G, et al. 1996a. Effects of 10 ppm hydrogen sulfide inhalation on pulmonary function in healthy men and women. Journal of Occupational and Environmental Medicine. 38(1012-1017).
18
Saufley Field Landfill Health Consultation
Bhambhani Y, Burnham R, Snydmiller G, et al. 1996b. Effects of 5 ppm hydrogen sulfide inhalation on biochemical properties of skeletal muscle in exercising men and women. American Industrial Hygiene Association Journal. 57(464-468).
Brenneman KA, James RA, Gross EA, et al. 2000. Olfactory neuron loss in adult male CD rats following acute inhalation exposure to hydrogen sulfide: Reversibility and the possible role of regional metabolism. Toxicol Pathol 30(2):200-208
Bureau of the Census. 2000. LandView 5 Software on DVD, A Viewer for EPA, Census and USGS Data and Maps. U.S. Department of Commerce.
Campagna D, Kathman S, Pierson R., et al. 2001. Impact of ambient hydrogen sulfide and total reduced sulfur levels on hospital visits for respiratory diseases among children and adults in Dakota City and South Sioux City, Nebraska. American Thoracic Society, 97th International Conference, San Francisco, California, USA.
[CIIT] Chemical Industry Institute of Technology. 1983a. 90-Day vapor inhalation toxicity study of hydrogen sulfide in B6C3F1 mice. Research Triangle Park, NC: Chemical Industry Institute of Toxicology. CIIT docket #42063.
[CIIT] Chemical Industry Institute of Technology. 1983b. 90-Day vapor inhalation toxicity study of hydrogen sulfide in Fischer 344 rats. Research Triangle Park, NC: Chemical Industry Institute of Toxicology. CIIT docket #22063.
[CIIT] Chemical Industry Institute of Technology. 1983c. 90-Day vapor inhalation toxicity study of hydrogen sulfide in Sprague-Dawley rats. Research Triangle Park, NC: Chemical Industry Institute of Toxicology. CIIT docket #32063.
Curtis SE, Anderson CR, Simon J, et al. 1975. Effects of aerial ammonia, hydrogen sulfide and swine house dust on rate of gain and respiratory-tract structure in swine. J Animal Sci 41:735739.
Durno M. Mendoza, RC, Tolaymat T. 2006. Management practices to prevent and control hydrogen sulfide gas emissions at C&D debris landfills, which dispose of pulverized gypsum debris in Ohio. Letter from USEPA Region 5 Superfund Division to Ohio State Environmental Protection Agency.
[EPA] Environmental Protection Agency Acute Exposure Guideline Levels. http://www.epa.gov/oppt/aegl/
[EPA] United States Environmental Protection Agency. 1994b. Methods for derivation of inhalation reference concentrations and application of inhalation dosimetry. U.S. Environmental Protection Agency. EPA600890066F.
[EPA] United States Environmental Protection Agency. 2007. Fine particle air monitoring standards and fine particulate health effects accessed at: http://www.epa.gov/pmdesignations/faq.htm#0 on 2/7/07
Escambia County Health Department, 2006. Protocol for Evaluation of the Public Health Significance of Hydrogen Sulfide in Ambient Air near a Landfill in Bellview, Escambia County, Florida. October 2006.
19

Saufley Field Landfill Health Consultation
Haider SS, Hasan M, Islam F. 1980. Effect of air pollutant hydrogen sulfide on the levels of total lipids, phospholipids & cholesterol in different regions of the guinea pig brain. Indian J Exp Biol 18:418-420.
Kilburn KH. 1997. Exposure to reduced sulfur gases impairs neurobehavioral function. South Med J 90:997-1006.
Kilburn KH, Warshaw RH. 1995. Hydrogen sulfide and reduced-sulfur gases adversely affect neurophysiological functions. Toxicol Ind Health 11:185-197.
Inserra S, Phifer B, Pierson R, Campagna D. 2002. Community-based exposure estimate for hydrogen sulfide. Journal of Exposure Analysis and Environmental Epidemiology. 12 (124-129).
Jappinen P, Vilkka V, Marttila O, Haahtela T. 1990. Exposure to hydrogen sulfide and respiratory function. British Journal of Industrial Medicine. 47(824-828).
Lanza JJ. 2006. May 2, 2006 Letter to Dr. Williamson, Director of ATSDR Division of Health Studies, from the Escambia County Health Director–asking the ATSDR to perform additional air monitoring.
Lee S, Xu Q, Booth M, Townsend T, Chadik P, Bitton G. 2006. Reduced sulfur compounds in gas from construction and demolition debris landfills. Waste Management. 26(526-533).
Lewis JA. 2007. DEP memo from Julie Ann Lewis to Michael Kennedy, Well Survey within ½ mile down gradient of the Saufley Field C&D Debris Disposal Facility, June 15, 2007.
Lopez A., Prior M., Yong S., et al. 1988. Nasal lesions in rats exposed to hydrogen sulfide for four hours. Am J Vet Res 49:1107-1111.
Luck J, Kaye SB. 1989. An unrecognized form of hydrogen sulphide keratoconjunctivitis. Br J Ind Med 46:748-749.
Metzler 2007. Personal communication between Steve Metzler, Escambia County Health Department and Saufley Field Landfill consultant.
Middaugh JP. 2006. September 15, 2006 email from the Florida State Epidemiologist to ATSDR Director, Division of Health Studies, accepting technical assistance from ATSDR to assist Escambia County with their ongoing investigation for the duration of the project to determine if hydrogen sulfide levels in the community’s air are associated with changes in self-reported health effects.
NOAA 2006. National Oceanographic and Atmospheric Administration maps at http://www.hprcc.unl.edu/acis/program/acis_maps
National Institute for Occupational Safety and Health. 2005. Hydrogen sulfide. National Institute for Occupational Safety and Health pocket guide to chemical hazards. Washington, DC: National Institute for Occupational Safety and Health. http://www.cdc.gov/niosh/npg/npgd0337.html accessed April 9, 2007.
Payne-Hardin M. 2007. NoveFebruary 12, 2007 News Release from Public Information Officer. Florida Department of Health Region 1 based at the Escambia County Health Department on Technical Assist for Air Quality near the Saufley Landfill.
20

Saufley Field Landfill Health Consultation
Payne-Hardin M. 2006. November 22, 2006 News Release from Public Information Officer. Florida Department of Health Region 1 based at the Escambia County Health Department on Saufley Landfill hydrogen sulfide gas emissions.
Reiffenstein RJ, Hulbert WC, Roth SH. 1992. Toxicology of hydrogen sulfide. Annu Rev Pharmacol Toxicol 32:109-134.
Reinhart D, Townsend T. 2003. State University System of Florida, Florida Center for Solid and Hazardous Waste Management. Gypsum drywall impacts on odor production at landfills: Science and control strategies. December 2000 (updated August 2003). Report #00-09.
Spolyar LW. 1951. Three men overcome by hydrogen sulfide in starch plant. Industrial Health Monthly 11:116-117.
Zellweger Analytics, Inc., MDA Technical Note. Instrument accuracy and precision. Tech Note Number 97113 1/93.
21

Figures
Aerial Photographs included in the maps are from 2004.
22

STA
TE H
WY
173
US HWY 90
STATE HWY 727
STA
TE H
WY
295
USHWY
98
STA
TE H
WY
295
US HWY 98
RAM
P
Figure 1: Location of Saufley Landfill, in Bellview,
-1 inch equals 0.776722 miles
Saufley Landfill
City of Bellview
Perdido Bay
Site location
western Escambia County, near the Florida/Alabama border.
23

Saufley Landfill S A U F L E Y F I E L D R D E
FEN
CE
RD
SAUFLEY PINES RD
S A U F L E Y F I E L D N O L F
FOO
TPR
I NT
DR
R A B Y A V E
UN
NA
MED
STR
EET
SPA
NISH
OA
KDR
F L I P F L O P C T
- 0 0.06 0.12 0.18 0.24 0.03 Miles
001: no concentrations above the intermediate MRL were measured
004: -one 15-minute episode above the acute MRL,
for about 0.02% of the monitoring time -24.5 hours above the intermediate MRL,
for about 2% of the monitoring time
003: Low tape monitor: -5 episodes (1.5 hrs.) above the acute MRL,
for about 0.1% of the monitoring time -15.5 hours above the intermediate MRL,
for about 1.2% of the monitoring time Mid tape monitor: -5 episodes (0.9 hrs.) above the acute MRL,
for about 0.1% of the monitoring time -3 episodes (0.75 hrs.) above 100 ppb,
for about 0.2% of the monitoring time
004: -14.25 hours above the intermediate MRL,
for about 1% of the monitoring time
The Acute Minimum Risk Level (MRL), 70 ppb, is the concentration to which persons exposed once, or for less than two weeks should not experience adverse non-cancer health effects. The acute MRL is calculated from a study in which 2 of 10 asthmatics suffered implied bronchial obstruction after being exposed to 2 ppm of hydrogen sulfide for 30 minutes.
The Intermediate MRL, 20 ppb, is the concentration to which persons exposed from 14 to 364 days should not experience adverse non-cancer health effects. The intermediate MRL is calcuated from studies of rats that showed olfactory neuron loss and basal cell hyperplasia, in an equivalent expsure-length study.
Figure 2: Results of the November and December 2006 Hydrogen Sulfide Air Monitoring plotted by sampling monitor location. The information shown is tabulated in Table 2. ppb means parts per billion by volume
24
SAU F L E Y F I E L D R D
NB
LUE
AN
GEL
PK
WY
EFE
NC
ER
D
SAU
FLEY
F I EL
DN
OLF
FOO
TPR
I NT
DR
SAU
FLEY
P I N
ESR
D
UN
NA
MED
STR
EET
SPAN
ISH
OA
KD
R
F L I P F L O P C T
BI G T O E C I R
-0 0.07 0.14 0.21 0.28 0.035
Miles
001: no episodes
002: 10 episodes (for a total of 11 hours) hydrogen sulfide concentration was greater than 30 ppb for longer than 30 minutes
003: 6 episodes (for a total of 4 hours) hydrogen sulfide concentration was greater than 30 ppb for longer than 30 minutes
004: 4 episodes (for a total of 4 hours) hydrogen sulfide concentration was greater than 30 ppb for longer than 30 minutes
Figure 3: Distribution of results of the November and December 2006 Hydrogen Sulfide Air Monitoring plotted by sampling monitor location. Shown are concentrations that resulted in increased hospital emergency room admissions of asthmatic children in another study. The information shown is tabulated in Table 2. ppb is parts per billion by volume
Saufley Landfill
25

SAUFLEY FIELD RD
EFE
NC
ER
D
NB
LUE
AN
GEL
PKW
Y
SAU
FLEY
FIEL
DN
OLF
FOO
TPR
INT
DR
SAU
FLEY
PIN
ESR
D
UN
NA
MED
STR
EET
FLIP FLOP CT
BIG TOE CIR
BAREFOOT BLVD
-0 0.07 0.14 0.21 0.28 0.035
Miles
001: max. conc. (peak) 19 ppb (11/10/2006) max. daily avg. conc. 1.8 ppb (11/10/2006)
002: max. conc. (peak) 72 ppb (11/17/2006) max. daily avg. conc. 7.4 ppb (11/8/2006)
003: max. conc. (peak) 224 ppb (12/14/2006) max. daily avg. conc. 5.6 ppb (11/16/2006) A tape was available to measure the highest concentration for only 17 of the sampling days. The max. daily average concentration was calculated from the monitor that measured concentrations less than 90 ppb, therefore the actual max. avg. for this period could have been higher
004: max. conc. (peak) 49 ppb (11/26/2006) max. daily avg. conc. 5.8 ppb (12/16/2006)
Figure 4: Results of the November and December 2006 Hydrogen Sulfide Air Monitoring plotted by sampling monitor location. The information shown is tabulated in Table 3. ppb is parts per billion by volume
Saufley Landfill
26

Figure 5: Locations for the Fine Particulate Monitoring Stations(fine particulates are also known as PM2.5).
These locations were near, but not co-located with, the air monitoring instruments.
The background PM2.5 station was about 7 miles away.
-Miles
0 0.35 0.7 1.4 2.1 2.8
A0330027PM25M
A0330028PM25M
Saufley Landfill A0330029PM25M
A0330030PM25M
City of Bellview
Perdido Bay
0 0.45 0.9
A0000004PM25M Ellyson Industrial Park 3311 Copter Road #1 Pensacola Florida 32514
Pensacola Bay
Miles 1.8 2.7 3.6
-27

Figure 6: Graph of PM2.5 data (from Brian Kerckhoff, DEP). Greenline (background) shows good agreement with other station’s data.
Figure 7: Wind speed and direction (from Brian Kerckhoff, DEP). “Petals” in wind rose align with compass direction from which the wind was blowing, concentric circles are measures of percentages of time the wind was coming from that direction and colors correspond to the wind speed.
28
Date
11/4/
2006
3:42
11/5/
2006
19:57
11/5/
2006
12:12
11/6/
2006
4:27
11/7/
2006
20:42
11/7/
2006
12:57
11/8/
2006
5:12
11/9/
2006
21:27
11/9/
2006
13:42
11/10
/2006
5:57
11/11
/2006
22:12
11/11
/2006
14:27
11/12
/2006
6:42
11/13
/2006
22:57
11/13
/2006
15:12
11/14
/2006
7:27
11/15
/2006
23:42
11/15
/2006
15:57
11/16
/2006
8:12
11/17
/2006
0:27
11/17
/2006
17:43
11/18
/2006
9:58
11/19
/2006
2:13
11/20
/2006
18:28
11/20
/2006
10:43
11/21
/2006
2:58
Hydrogen Sulfide Concentrations
(001 meter location)
90
80
70
60
50
40
30
20
10
0
ppb
(vol
ume/
volu
me)
ppb
(vol
ume/
volu
me)
sample day/time (24-hour clock, 6 pm-6 pm), each line = 15 min.
Figures 8a&b
Hydrogen Sulfide Concentrations (002 meter location)
90
80
70
60
50
40
30
20
10
0
sample day/time (24-hour clock, 6 pm-6 pm), each line = 15 min.
29
ppb
(vol
ume/
volu
me)
ppb
(vol
ume/
volu
me)
Hydrogen Sulfide Concentrations (003, 0-90 ppb meter location)
90
Machine malfunctioned80 Machine malfunctioned
70
60
50
40
30
20
10
0
sample day/time (24-hour clock, 6 pm-6 pm), each line = 15 min.
Figures 8c&d
Hydrogen Sulfide Concentrations (003, 90-1,400 ppb meter location)
260
240
220
200
180
160
140
120
100
80
60
sample day/time (24-hour clock, 6 pm-6 pm), each line = 5 min.
30

ppb
(vol
ume/
volu
me)
Hydrogen Sulfide Concentrations (004 meter location)
90
80
70
60
50
40
30
20
10
0
sample day/time (24-hour clock, 6 pm-6 pm), each line = 15 min.
Figure 8e
31

Site Photos
32
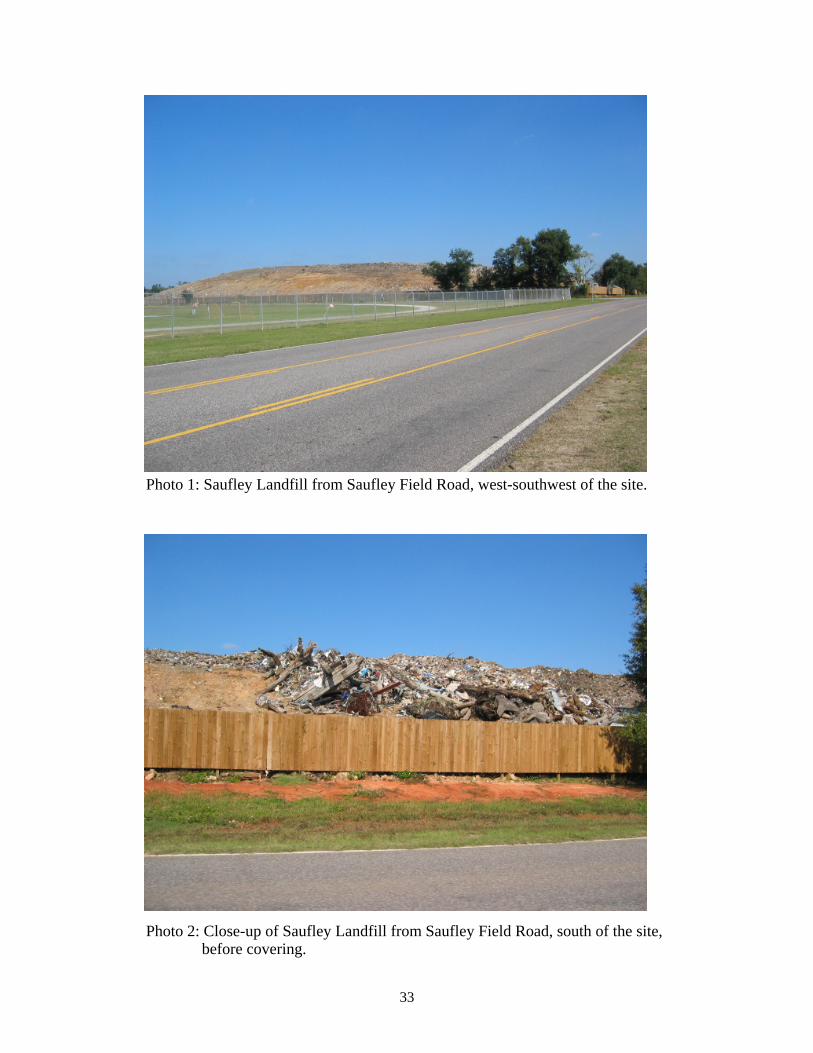
Photo 1: Saufley Landfill from Saufley Field Road, west-southwest of the site.
Photo 2: Close-up of Saufley Landfill from Saufley Field Road, south of the site, before covering.
33

Photo 3: Southeast corner of Saufley Landfill from Saufley Field Road, before covering.
Photo 4: East of photo 3, (same trailer in both photos), before covering.
34

Photo 5: View of the Saufley Landfill from Saufley Field Road, southeast of the site, before covering.
Photo 6: Breach in the chain-link fence west of the site (from East Fence Road).
35

Photo 7: Debris visible through fence behind homes on the south side of the landfill.
Photo 8: Air monitor at station 004, southwest of the site (golf course).
36

Photo 9: Close-up of air monitor at station 004, southwest of the site (golf course).
Photo 10: East of the landfill, debris visible behind home at sampling location 003.
37

Appendices
38

Appendix 2 Daily Diary NAME: ______________________________________________ Participant ID # __________________________ Date: ____/_____/___________
In the chart below, please place a check mark beside the symptom you experienced today. If you know what caused your symptom, please indicate. Also, list any medications you took today for your symptoms and the time when it was taken. Please use the back side of the paper for additional information on symptoms and/or medications.
1. About how long were you in the Saufley area today (within 1 mile of the landfill)?
____ hours
2. About how much time did you spend outdoors in the Saufleyarea today (within 1 mile of the landfill)?
____ hours
3. Did you smell any of the following odors today?Check all that apply: □ cat urine □ garbage □ rotten eggs □ sewage □ burning or smoke □ cigarette or cigar smoke □ any other unpleasant smell (please specify the type of smell)
3 Symptom Cause (if known)
Medication Time Taken Did you go to the doctor for this symptom today?
Were you hospitalized for this symptom today?
tightness in the chest am/pm Y
N Y
N confusion or trouble concentrating
am/pm Y
N Y
N
coughing
am/pm Y
N Y
N
diarrhea
am/pm Y
N Y
N dizziness am/pm
Y N
Y N
eye irritation am/pm Y
N Y
N
headache
am/pm Y
N Y
N loss of appetite am/pm
Y N
Y N
memory problems am/pm Y
N Y
N moody or irritable am/pm
Y N
Y N
nausea
am/pm Y
N Y
N runny or stuffy nose am/pm
Y N
Y N
short of breath am/pm Y
N Y
N sore throat am/pm
Y N
Y N
tired or fatigue am/pm Y
N Y
N head cold am/pm
Y N
Y N
vomiting
am/pm Y
N Y
N
wheezing
am/pm Y
N Y
N
39

Appendix 3-- Informed Consent for Area Exposure Monitoring Consent Form for Environmental Hydrogen Sulfide Monitoring
We would like to invite you to participate in an exposure investigation to learn what levels of hydrogen sulfide gas are in your community. You were picked because you expressed health concerns because of possible hydrogen sulfide in the air. We are monitoring the air outside residences for hydrogen sulfide 24 hours a day, 7 days a week, for up to 6 months. The Escambia County Health Department along with the help of the Agency for Toxic Substances and Disease Registry (ATSDR) is offering free voluntary air monitoring to residents who participate in this monitoring effort. Participation in this investigation will help us determine if levels of hydrogen sulfide gas may pose a health problem to you or other persons living in your home.
What we will do?
If you choose to be in this here’s what we will ask you to do:
• Answer questions about your health and your job
• Fill out a daily diary for 30-60 days
• Wear an hydrogen sulfide badge on your shirt each day for 30-60 days
• House an environmental hydrogen sulfide monitor on your property
We will keep this meter in your yard for a minimum of 30 days and/or a maximum of 180 days. It needs to be plugged into a power supply at your home. If there is no outside outlet at your home, we may run a power cord through a small opening in a window. We will seal the window. It will take about 30 minutes to set up the meter. It is about the size of a briefcase and it has a small pump that draws in air for monitoring. The pump sounds like a fish tank air pump.
Each week, we will schedule a time to come visit your home (usually on a weekend) to check the meter to make sure it is working properly. These visits will take about 10 minutes. You will also be given a phone number to call if the air monitors stop working or if you would like to stop participating in this project. If high levels of hydrogen sulfide are found during the monitoring period, a person from the health department will contact you.
Are there any risks?
We do not expect there to be any risks. It may not be possible to keep your participation in the project private because people might notice the meter outside your house.
Will I get anything from this study?
Your benefit from the study will be that you will know what the hydrogen sulfide levels are outside your residence. Also by being in this study, you will help us better understand substances in the air that can cause respiratory and other health problems. We will write a report and have a community meeting that sums up what we find in this investigation. If you want a copy of this report, we will send you one.
40
What about my privacy?
We will protect your privacy as much as the law allows. Any reports produced from this investigation will not identify any specific individuals. We will keep papers with your name on them in a locked file cabinet and in a computer that is password-protected. It may not be possible to keep your participation in the project private because people might notice the meter at your house.
Are there any costs?
You do not have to pay to be in this study. We will not pay you for the power used from your home. The power used is about the same as running a 15 watt fluorescent light bulb.
Participation
Participation in this investigation is voluntary. Your participation can stop at any time without penalty. You must sign this form to participate.
How can I find out more?
You may have questions about this project. If so, you can contact the Escambia County Health Department at 850.595.6683. If you have questions later about this or think you may have been harmed by this study, please call the above number.
If you have questions about your rights as a person in a study, please call the Department of Health Institutional Review Board (DOH IRB) at (866) 433-2775 (toll free in Florida) or (850) 245-4585.
41

_________________________________________________ _________________________________________________
Consent Statement
I have read this form or it has been read to me. I have had a chance to ask questions about this study and my questions have been answered. I agree to be part of this study. I have marked below the parts I will do.
Yes No Have a hydrogen sulfide meter on my property for up to three months
Yes No Allow ECHD to check on the meter about once every week
Signature: Date:
Print name:
Address: _________________________________________
Witness: I observed the process of consent. The prospective participant read this form, was given the chance to ask questions, appeared to accept the answers, and signed to enroll in the investigation.
Witness signature: Date:
Print name:
Participant ID Number:
42

Appendix 4-- Informed Consent for Personal Badge Exposure Monitoring
Consent Form for Personal Badge Exposure Monitoring We would like to invite you to participate in an Exposure Investigation to learn what levels of hydrogen sulfide gas may be present in your community. You were picked because you expressed health concerns of possible hydrogen sulfide in the air. We are monitoring the air outside residences for hydrogen sulfide 24 hours a day, 7 days a week, for up to 6 months. The Escambia County Health Department along with the Agency for Toxic Substances and Disease Registry (ATSDR), is offering free voluntary air monitoring to residents who participate in this monitoring effort. Participation in this investigation will help us determine if levels of hydrogen sulfide gas may pose a health problem to you or other persons living in your home.
What we will do?
If you choose to be in this study here’s what we will ask you to do:
• Answer questions about your health and your job
• Fill out a daily diary for 30-60 days
Wear a hydrogen sulfide badge on your shirt each day for 30-60 days
Are there any risks?
We do not expect there to be any risks. It may not be possible to keep your participation in the project private because people might notice the badge that you are wearing.
Will I get anything from this study? Your benefit from this study is that you will know the levels of hydrogen sulfide that you are exposed to at your home. We will write a report and have a community meeting that sums up what we find in this study. If you want a copy of this report, we will send you one.
What about my privacy? We will protect your privacy as much as the law allows. Any reports produced from this investigation will not identify any specific individuals. We will keep papers with your name on them in a locked file cabinet and in a computer that is password-protected.
Are there any costs? You do not have to pay to be in this study. We will not pay you for being in this study. Based on your responses to the survey, we might recommend that you consult your doctor.
Participation Participation in this investigation is voluntary. Your participation can stop at any time without penalty. You must sign this form to participate.
43

How can I find out more?
You may have questions about this project. If so, you can contact the Escambia County Health Department at 850.595.6683. If you have questions later about this or think you may have been harmed by this study please call the above number.
If you have questions about your rights as a person in a study, please call the Department of Health Institutional Review Board (DOH IRB) at (866) 433-2775 (toll free in Florida) or (850) 245-4585.
44

_________________________________________________ _________________________________________________
Consent Statement
I have read this form or it has been read to me. I have had a chance to ask questions about this study and myquestions have been answered. I agree to be part of this study. I have marked below the parts I will do.
Yes No Have a hydrogen sulfide meter on my property for up to three months.
Yes No Allow ECHD to check on the personal badge about once every week.
Signature: Date:
Print name:
Address: _________________________________________
Witness: I observed the process of consent. The prospective participant read this form, was given the chance to ask questions, appeared to accept the answers, and signed to enroll in the investigation.
Witness signature: Date:
Print name:
Participant ID Number:
45

Appendix 5 Existing Levels of Health Concern
The following exposure guidelines have been derived for hydrogen sulfide exposures by ATSDR and other government agencies and organizations. Note that occupational exposure values are not used for community exposure/health outcome assessments. Occupational values are provided for informational purposes and for short-term (10 to 15-minute ceiling values) comparisons that do not exist for environmental exposure scenarios.
Agency/Organization* Exposure Value** Exposure Period/Intent
EPA 1.4 ppb RfC—an estimate of a daily exposure to the human population (including sensitive subgroups) that is likely to be without an appreciable risk of deleterious effects during a lifetime
WHO 14 ppb Medium-term tolerable concentration—level at which exposure could occur for up to 90 days without appreciable risk of adverse health effects
ATSDR 0.07 ppm (70 ppb)
Acute Minimal Risk Level—value for up to 14 days of continuous exposure. Exposures below this value are not expected to result in non-cancerous adverse health effects
0.02 ppm (20 ppb)
Intermediate Minimal Risk Level— value for longer than 14 to 364 days of exposure. Exposures below this value are not expected to result in non- cancerous adverse health effects.
NIOSH 100 ppm IDLH –Based on the ability of a worker to escape an area w/out loss of life or irreversible health effects.
10 ppm Worker exposure- 40 hour work week; is also the 10 minute ceiling value
AIHA 0.1 ppm ERPG-1—The maximum airborne concentration below which it is believed that nearly all individuals could be exposed for up to 1 hour without perceiving a clearly defined objectionable odor.
30 ppm ERPG-2-The maximum airborne concentration below which it is believed nearly all individuals could be exposed for up to 1 hour without developing irreversible or other serious health effects that could impair ability to take protective action
ACGIH 10 ppm/ to 1 ppm
15 ppm/ to 5 ppm
Worker exposure-40 hour work week, this guideline is currently on the ACGIH “notice of intended changes list” the new value will be 1 ppm Worker exposure-15 minute ceiling, this guideline is currently on the ACGIH “notice of intended changes list” the new value will be 5 ppm
* EPA is the U.S. Environmental Protection Agency, ATSDR is the Agency for Toxic Substances and Disease Registry; NIOSH is the National Institute for Occupational Safety and Health; AIHA is the American Industrial Hygiene Association; ACGIH is the American Conference of Industrial Hygienists
**ppm is parts per million (part hydrogen sulfide per million parts air, by volume); ppb is parts per billion (part hydrogen sulfide per million parts air, by volume).
46

Appendix 6- SPM Tape meter with Chemcassete detection monitor (SPM= single point monitor)
Home Hydrogen Sulfide Monitoring Fact Sheet
The Tapemeter, at your home, is considered to be the “state of the art” in testing the air for certain chemicals. This meter should work with no trouble for weeks and weeks. However the meter does have problems once in a while such as the tape breaking. If for any reason the meter does not look like it is working properly or it says "FAULT" on its screen, PLEASE let us know.
How to reach us: Phone: 850-595-6683……….Time: Weekdays 9-5
Cell Phone: #############………….Time: Weekend + Nights
Email: ############
Important information: There are a few things that you should know about the meter.
The black box on the back of the tape meter is the "Data logger" (See Figure 1A). It stores all the measurements the tape meter collects in-between times when we come to your home. On the front of the data logger (See Figure 1B) there are several tiny lights. The one that says "STATUS" should be blinking once every second. If it is not blinking, please contact us immediately.
47

At times the alarm light located on the front of the tapemeter (See Figure 2A) may flash on and off. This will happen when the meter has detected hydrogen sulfide and is reporting it (See Figure 2C). Pressing the "Alarm Reset" will stop the light from flashing. The only other time the alarm light will flash is if there is a problem with tapemeter. If there is a problem the display screen will report a "Fault Message" (See Figure 2B). If you ever see the word “Fault” on the meter,
please contact us immediately.
48
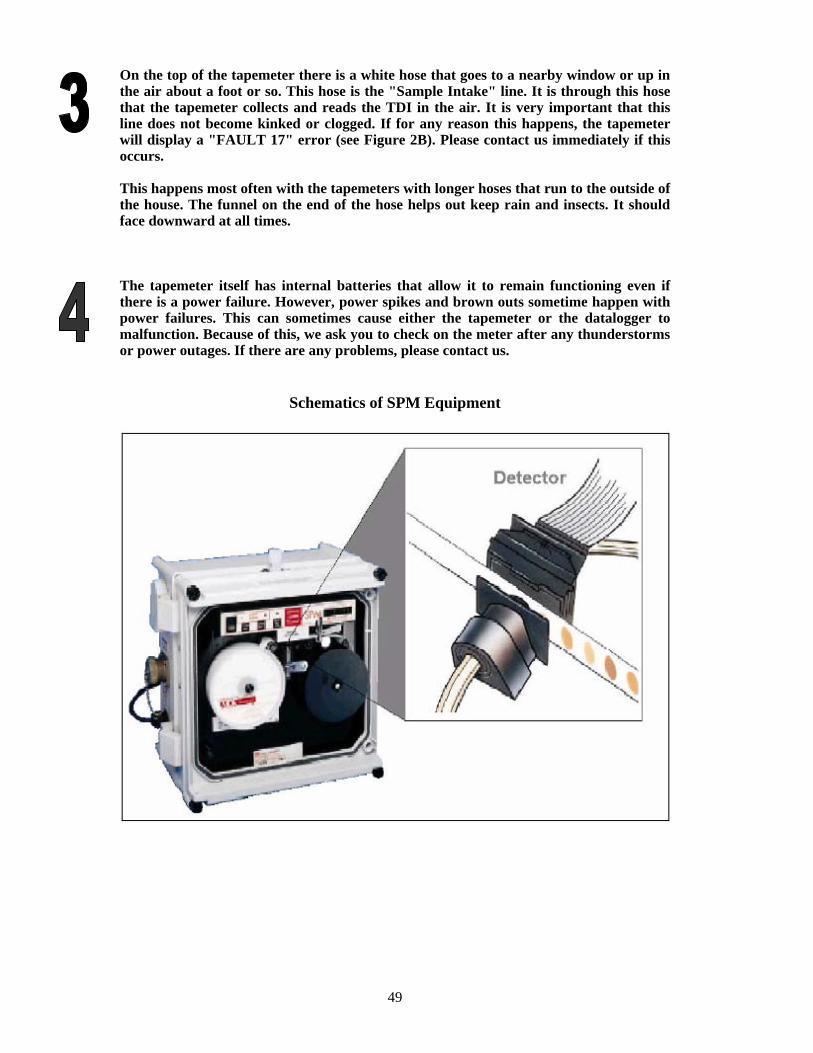
On the top of the tapemeter there is a white hose that goes to a nearby window or up in the air about a foot or so. This hose is the "Sample Intake" line. It is through this hose that the tapemeter collects and reads the TDI in the air. It is very important that this line does not become kinked or clogged. If for any reason this happens, the tapemeter will display a "FAULT 17" error (see Figure 2B). Please contact us immediately if this occurs.
This happens most often with the tapemeters with longer hoses that run to the outside of the house. The funnel on the end of the hose helps out keep rain and insects. It should face downward at all times.
The tapemeter itself has internal batteries that allow it to remain functioning even if there is a power failure. However, power spikes and brown outs sometime happen with power failures. This can sometimes cause either the tapemeter or the datalogger to malfunction. Because of this, we ask you to check on the meter after any thunderstorms or power outages. If there are any problems, please contact us.
Schematics of SPM Equipment
49

Appendix 7 EPA Region 5 Recommended Management Practices based on the Removal Action at the Warren Recycling/Warren Hills Construction and Demolition
Debris Landfill site
Excerpted best management practices from a letter to Solid and Infectious Waste Chiefs at the Ohio Environmental Protection Agency from the EPA Region 5 on-scene coordinators:
Mark Durno, On-Scene Coordinator Emergency Response Branch USEPA Region 5 25089 Center Ridge Road Mail Code ME-W Westlake, Ohio 44145
440- 250-1743
Ramon C. Mendoza, Environmental Engineer Waste Management Branch (DW-8J) Waste, Pesticides, and Toxics Division USEPA Region 5 77 W. Jackson Blvd, Chicago, Ill. 60604 Tel: 312-886-4314, Fax: 312-353-4788, Email: [email protected]
Thabet Tolaymat PhD., Environmental Engineer National Risk Management Laboratory Office of Research and Development 26 West Martin Luther King Drive, Cincinnati, Ohio 45268 Tel: 513-487-2860, Fax: 513-569-7879, Email: [email protected]
50
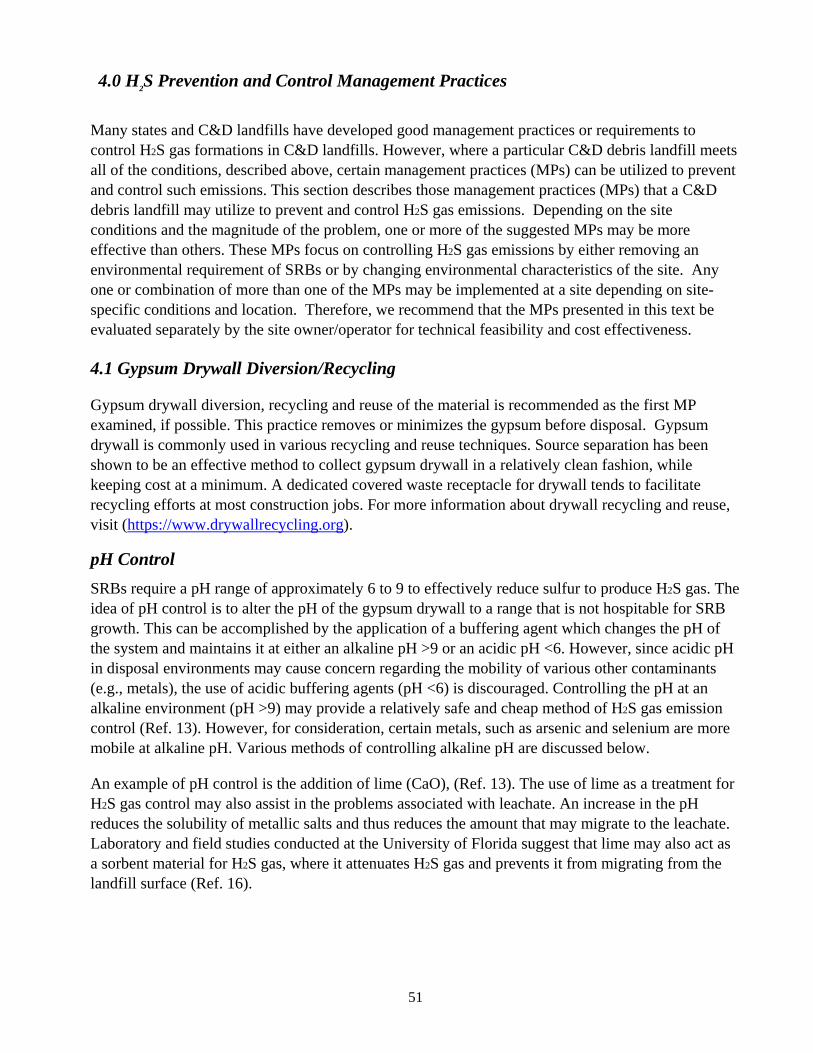
4.0 H2S Prevention and Control Management Practices
Many states and C&D landfills have developed good management practices or requirements to control H2S gas formations in C&D landfills. However, where a particular C&D debris landfill meets all of the conditions, described above, certain management practices (MPs) can be utilized to prevent and control such emissions. This section describes those management practices (MPs) that a C&D debris landfill may utilize to prevent and control H2S gas emissions. Depending on the site conditions and the magnitude of the problem, one or more of the suggested MPs may be more effective than others. These MPs focus on controlling H2S gas emissions by either removing an environmental requirement of SRBs or by changing environmental characteristics of the site. Any one or combination of more than one of the MPs may be implemented at a site depending on site-specific conditions and location. Therefore, we recommend that the MPs presented in this text be evaluated separately by the site owner/operator for technical feasibility and cost effectiveness.
4.1 Gypsum Drywall Diversion/Recycling
Gypsum drywall diversion, recycling and reuse of the material is recommended as the first MP examined, if possible. This practice removes or minimizes the gypsum before disposal. Gypsum drywall is commonly used in various recycling and reuse techniques. Source separation has been shown to be an effective method to collect gypsum drywall in a relatively clean fashion, while keeping cost at a minimum. A dedicated covered waste receptacle for drywall tends to facilitate recycling efforts at most construction jobs. For more information about drywall recycling and reuse, visit (https://www.drywallrecycling.org).
pH Control SRBs require a pH range of approximately 6 to 9 to effectively reduce sulfur to produce H2S gas. The idea of pH control is to alter the pH of the gypsum drywall to a range that is not hospitable for SRB growth. This can be accomplished by the application of a buffering agent which changes the pH of the system and maintains it at either an alkaline pH >9 or an acidic pH <6. However, since acidic pH in disposal environments may cause concern regarding the mobility of various other contaminants (e.g., metals), the use of acidic buffering agents (pH <6) is discouraged. Controlling the pH at an alkaline environment (pH >9) may provide a relatively safe and cheap method of H2S gas emission control (Ref. 13). However, for consideration, certain metals, such as arsenic and selenium are more mobile at alkaline pH. Various methods of controlling alkaline pH are discussed below.
An example of pH control is the addition of lime (CaO), (Ref. 13). The use of lime as a treatment for H2S gas control may also assist in the problems associated with leachate. An increase in the pH reduces the solubility of metallic salts and thus reduces the amount that may migrate to the leachate. Laboratory and field studies conducted at the University of Florida suggest that lime may also act as a sorbent material for H2S gas, where it attenuates H2S gas and prevents it from migrating from the landfill surface (Ref. 16).
51
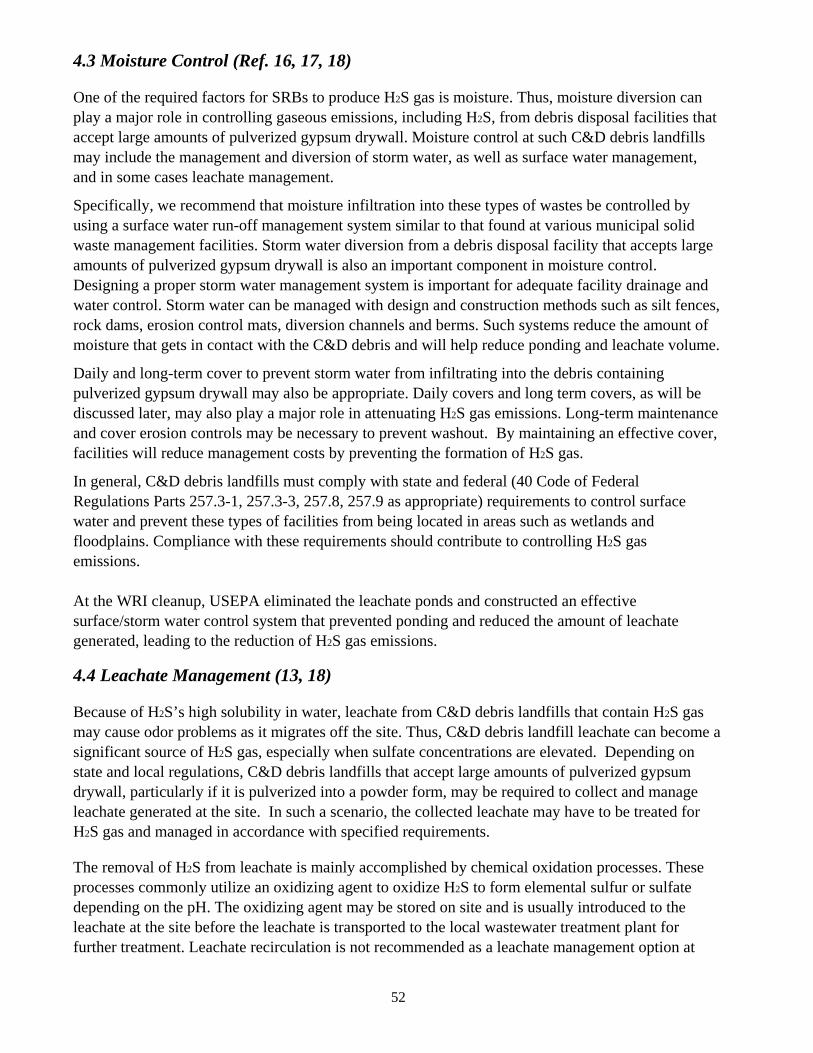
4.3 Moisture Control (Ref. 16, 17, 18)
One of the required factors for SRBs to produce H2S gas is moisture. Thus, moisture diversion can play a major role in controlling gaseous emissions, including H2S, from debris disposal facilities that accept large amounts of pulverized gypsum drywall. Moisture control at such C&D debris landfills may include the management and diversion of storm water, as well as surface water management, and in some cases leachate management.
Specifically, we recommend that moisture infiltration into these types of wastes be controlled by using a surface water run-off management system similar to that found at various municipal solid waste management facilities. Storm water diversion from a debris disposal facility that accepts large amounts of pulverized gypsum drywall is also an important component in moisture control. Designing a proper storm water management system is important for adequate facility drainage and water control. Storm water can be managed with design and construction methods such as silt fences, rock dams, erosion control mats, diversion channels and berms. Such systems reduce the amount of moisture that gets in contact with the C&D debris and will help reduce ponding and leachate volume.
Daily and long-term cover to prevent storm water from infiltrating into the debris containing pulverized gypsum drywall may also be appropriate. Daily covers and long term covers, as will be discussed later, may also play a major role in attenuating H2S gas emissions. Long-term maintenance and cover erosion controls may be necessary to prevent washout. By maintaining an effective cover, facilities will reduce management costs by preventing the formation of H2S gas.
In general, C&D debris landfills must comply with state and federal (40 Code of Federal Regulations Parts 257.3-1, 257.3-3, 257.8, 257.9 as appropriate) requirements to control surface water and prevent these types of facilities from being located in areas such as wetlands and floodplains. Compliance with these requirements should contribute to controlling H2S gas emissions.
At the WRI cleanup, USEPA eliminated the leachate ponds and constructed an effective surface/storm water control system that prevented ponding and reduced the amount of leachate generated, leading to the reduction of H2S gas emissions.
4.4 Leachate Management (13, 18)
Because of H2S’s high solubility in water, leachate from C&D debris landfills that contain H2S gas may cause odor problems as it migrates off the site. Thus, C&D debris landfill leachate can become a significant source of H2S gas, especially when sulfate concentrations are elevated. Depending on state and local regulations, C&D debris landfills that accept large amounts of pulverized gypsum drywall, particularly if it is pulverized into a powder form, may be required to collect and manage leachate generated at the site. In such a scenario, the collected leachate may have to be treated for H2S gas and managed in accordance with specified requirements.
The removal of H2S from leachate is mainly accomplished by chemical oxidation processes. These processes commonly utilize an oxidizing agent to oxidize H2S to form elemental sulfur or sulfate depending on the pH. The oxidizing agent may be stored on site and is usually introduced to the leachate at the site before the leachate is transported to the local wastewater treatment plant for further treatment. Leachate recirculation is not recommended as a leachate management option at
52

C&D debris landfills with significant amounts of pulverized gypsum. The recirculated leachate provides both the moisture and microbial seed, thus promoting further H2S gas generation.
At the WRI cleanup, USEPA dewatered and filled in the leachate ponds and installed an effective leachate treatment and disposal system to effectively control H2S gas emissions (Ref. 18).
4.5 Capping/Cover/Alternative Cover Materials (Ref. 16, 17, 18,19) Temporary and permanent covers are effective in reducing H2S gas emissions from C&D debris landfills by controlling and reducing the moisture and attenuation of H2S gas emissions. Section 4.3 discussed the use of cover material to control moisture. This section will address issues regarding the use of various cover materials as passive treatment systems for H2S gas emissions from C&D debris landfills. Research conducted at the University of Florida concluded that cover materials can effectively reduce H2S gas emissions from C&D debris landfills. Apart from its thickness, cover effectiveness largely depends on the physical and chemical characteristics of the cover material. These studies concluded that lime and fine concrete are the most effective (99% reduction of H2S gas) cover materials for reducing H2S gas emissions, while sandy and clayey materials showed average reduction efficiencies (77% to 98% effective) and coarse concrete was the least effective (23%). Cover materials that contain a mixture of soil, ash, and compost have also been shown to be effective in controlling H2S gas emissions.
To achieve the most effective H2S gas control, it is generally recommended that permanent covers be installed as soon as the final grade of C&D debris is reached. In areas that are inactive, but have not yet met final grade, temporary covers can be used. We encourage that cover materials be inspected frequently to check that no damage has occurred. It may also be effective to apply cover materials prior to large rain events, in order to prevent the gypsum waste from getting wet.
Capping/cover materials are effective when combined with other management practices, such as gas collection. Several states have reported success with this remedy for C&D debris landfills (Ref. 19).
At the WRI cleanup, USEPA used a clay cover combined with surface/stormwater control and leachate control & treatment to effectively control H2S gas emissions (Ref. 18). As previously noted, maximum detectable concentration of hydrogen sulfide gas was reduced from 165 ppm to 0.043 ppm at the surface of the landfill.
4.6 Education and Training Recyclers, transfer station operators, and landfill operators should understand how H2S gas is produced in C&D debris landfills, particularly at those C&D debris landfills that meet the criteria identified in Section 3. Awareness of the mechanisms behind the formation of H2S gas and methods that effectively prevent or restrict the formation of H2S gas will support knowledgeable decision-making when working with C&D debris (Ref. 11).
Specifically, it is recommended that landfill operator training at a C&D debris landfill managing
53
large amounts of pulverized gypsum include: 1) how to identify and/or segregate C&D debris containing pulverized gypsum drywall; 2) cover application and maintenance; 3) moisture control methods such as surface water and stormwater control procedures (e.g. ponding prevention) and proper leachate management, 4) H2S gas identification; 5) onsite/perimeter inspections and H2S gas monitoring methods (Note: This includes recognition of H2S gas odors and to report the time, location, weather conditions, and any unusual site conditions); and 6) health and safety/emergency procedures involving H2S gas (Ref. 18).
4.7 Active Gas Collection Active gas collection and recovery systems, if properly designed, can collect and treat the effluent gas and effectively reduce H2S gas emissions at C&D debris landfills. According to a USEPA Region 5 preliminary survey in May 2005, several states, which have had serious H2S gas odor problems, reported success in controlling H2S gas odors by requiring C&D debris landfills to install these systems in combination with covers (Ref. 19).
However, due to the high capital, operations, and maintenance costs, we believe that active gas collection systems be considered as one of the last control options to be implemented at a given site. (Note: If such a system is put into place, the owner and operator may want to consult a qualified professional engineer to design and construct the system.)
4.8 An Integrated Approach for the Identification and Remediation of H2S Emissions
In some cases, owners and operators may find it appropriate to establish site-specific H2S gas monitoring and response plans. Various state and/or local regulations may already require some type of monitoring at these facilities, however, H2S gas specific monitoring systems discussed in this document can also be incorporated to provide additional assurance when needed.
Like all environmental monitoring plans, the main goal of an H2S gas monitoring plan is to protect human health and the environment. Specifically, the goal of an H2S gas monitoring and response plan is to prevent the inhalation of objectionable or unsafe concentrations of H2S gas by onsite personnel and anyone who works or resides near a C&D debris landfill that disposed of C&D debris containing large amounts of pulverized gypsum drywall. A site owner’s and/or operator’s implementation of an early detection and response system for monitoring H2S gas emissions may greatly reduce or eliminate potential need for future mitigation.
In order to create an effective monitoring plan, the owner operator may consider the following factors:
4.8.1 Site Location (Ref. 18) It is recommended that the location of debris disposal facilities that contain large amounts of pulverized gypsum drywall avoid areas where the debris may become wet or saturated. These locations include wetlands, flood plains or areas prone to flooding, or areas that have a high ground water table. By keeping the gypsum dry, H2S gas generation would likely not occur and the
54
potential problems associated with it.
States and local governments limit the siting of new C&D debris landfills near residential areas. This would reduce potential concerns in the case of H2S gas problems. The greater distance (that separates these facilities from near-by communities) provides more time for natural dispersion and dilution of H2S gas emissions, which ultimately leads to a lower exposure rate. Specifically, the owner or operator should consider the site-specific potential for debris saturation and the distance to human receptors for any new or pre-existing site.
The aforementioned location factors were present at the WRI Site. USEPA noted that the site was located in an area where residents were within 100 feet of the facility. In addition, the WRI site is situated in a low, poorly drained, former wetlands area with soils rich in clay, which facilitated stormwater ponding and exposed the C&D debris to wet/saturated conditions.
4.8.2 Site Conditions For C&D debris disposal facilities that handle large amounts of pulverized gypsum drywall, it is a good practice for a facility operator to acquire documentation for the following:
Site topography. Since H2S gas is heavier than air, it tends to settle and concentrate in low-lying areas. Understanding the topography will help in identifying areas where H2S gas may linger and would lead to more effective management of such emissions. On-site and off-site structures. Structures where leachate may migrate and subsequently emit H2S gas causing some exposures to workers and nearby residents are important to identify. Understanding of the water table and its seasonal fluctuation. One of the main factors in H2S gas generation from pulverized drywall is wetting of it. Understanding where the groundwater table is and keeping the pulverized debris containing gypsum drywall away from it helps in preventing H2S gas generation. Knowing this also would help evaluate the maximum depth of any excavation to separation from groundwater. • Location of other potential sources of H2S gas in the area. Debris disposal facilities that handle large amounts of pulverized gypsum drywall are not the only facilities that can be a potential source of H2S gas. A poorly managed wastewater treatment plant may emit H2S gas. Identifying the source of H2S gas is very important in addressing any potential problems that may arise. Property boundaries and ownership adjacent to the facility. The owner or operator may wish to gather information beyond the immediately adjacent properties based on site-specific knowledge in order to identify potential receptors. Different gas monitoring techniques or instruments may be appropriate on-site and off-site. Such information is helpful in the rare event where offsite H2S gas emissions become a concern.
The owner or operator may also find it useful to assemble the following site-specific information:
Records or information regarding the type of waste/debris disposed at the site. Facility construction details, including any liners or final cover. Details of any existing and/or operating gas extraction or venting system. Details of any existing gas monitoring system. Facility gas generation potential. Historical records regarding gas investigations and monitoring, visual or olfactory observations, inspections or complaints, odor problems.
55
4.8.3 Self Inspection Strategy Because of the high sensitivity humans have to H2S gas odor (Humans can smell 0.0005 to 0.3 parts per million of H2S gas), the initial warning of potential problems may be by smell. This would most likely be in the form of complaints from neighbors or onsite workers about a rotten egg smell. Therefore, we encourage that periodic site inspections be conducted, by the facility operator, mainly to identify signs of potential H2S gas emissions and to ensure implementation of management practices, if any. The inspections can also serve to identify areas of high temperatures that may indicate a higher rate of degradation. The inspections might include a general screening for H2S gas odors along the facility perimeter and are best conducted during the early morning or late evening hours since odors are most likely to occur at these times. Emissions may vary depending on temperature changes, as well as wind speed and direction.
(Note: As mentioned earlier, inspectors should be aware that at higher concentrations, at or above 100 ppm, individuals may not detect H2S gas due to olfactory fatigue. For this reason, odor is not a reliable indicator of H2S’s presence at higher concentrations and may not provide adequate warning of hazardous concentrations)
If an H2S gas meter is available, the owner or operator may wish to include sampling along the perimeter and over a grid pattern across the areas of waste or debris placement during daily inspections. Such sampling, conducted on a regular basis, could alert the owner or operator to the generation of H2S gas. Gases could be released from the facility through fissures, cracks, uncovered areas, leachate ponds, or erosion gullies. Such areas may easily be repaired to reduce or eliminate off site migration. Early detection of potential off site migration may also allow the operator to improve operational practices and employ additional MPs, thereby reducing the need for more costly solutions in the future.
If H2S gas odors are detected, the owner or operator can use a portable H2S gas analyzer to quantify the extent and concentration of the H2S gas emissions and compare them to applicable health standards.
If the problem persists, we suggest that the owner and/or operator should consider a monitoring plan to quantify on-site and off-site H2S gas levels. The plan would be site specific and could be modified as site-specific data becomes available. Initially, for example, monitoring can be conducted in downwind and low lying areas, especially if those areas are near potential receptors. Once sufficient data have been collected to determine the origin and extent of emissions, the monitoring plan can be updated to examine specific areas of concern.
The location of monitoring points is mainly a function of site-specific factors such as topography and atmospheric conditions. Understanding the site topography, as mentioned above, is helpful in identifying likely gas migration and accumulation locations and establishing monitoring points beyond the facility boundary. In addition, if on-site monitoring is considered appropriate, we believe that it be conducted in a manner that would facilitate delineation of areas with higher
56

concentrations.
When H2S gas monitoring is conducted, different gas monitoring instruments may be used for on-site workers and nearby residents, depending on the objective. For example, an instrument that is capable of detecting H2S levels as low as 0.001 ppm (1.0 ppb) may be appropriate for perimeter monitoring to detect off-site migration. On the other hand, on-site monitoring to ensure personnel protection may only require an instrument that is capable of detecting H2S gas levels at or above 1.0 ppm (1000 ppb). Instruments should be designed and calibrated specifically for H2S. For maximum protection of the facility personnel, as well as the general public, proper sampling techniques and calibration should be followed. In addition, we encourage that trained personnel operate the monitors who understand the operating procedures and limitations of the instrument being used. For instance, monitors calibrated to detect H2S gas may show interference from other sulfur gases.
If H2S gas odor problems persist, meteorological data (i.e., temperature, wind speed and direction, precipitation and barometric pressure) may be collected and analyzed. For additional information on this topic, refer to EPA-454/R-99-005 and/or EPA-450/4-87-007.
Once the owner or operator has established the source, concentration and extent of the H2S gas emissions, decisions concerning appropriate remedial action can be made. A few examples of the management practices outlined in this text include applying cover material, removing leachate, and diverting surface/stormwater from areas of debris placement.
4.9 Other Practices to be Considered
4.9.1 Community Outreach (Ref. 18)
Good community relations are part of every successful odor control program. Humans can detect the odor of H2S gas at very low concentrations (as low as 0.0005 ppm). Even at low concentrations, H2S gas can be offensive and complaints may occur, especially during unfavorable weather conditions. Therefore, we recommend that the owner or operator maintain effective communication with the surrounding community and encourage involvement.
At the WRI site, USEPA conducted regular meetings with the community and local government to ensure that they were aware of the removal activities and had a forum to express their concerns.
4.9.2 Local Fire Department Involvement
We recommend that the owner or operator establish action levels or be aware of required action levels that trigger notification to health officials, regulators, and local emergency response personnel.
5.0 H2S Gas Off-Site Migration (WRI Site Case Study)
This section provides an example of monitoring and response (through a case study) in the event that H2S gas migrates off-site into surrounding communities. These guidelines were used by USEPA, as
57
part of its contingency plan, at the WRI site in Ohio, where a time critical removal action was initiated at a former C&D debris landfill to address H2S gas releases to the surrounding community (visit www.epaosc.org/warrenrecycling). The contingency plan specifically focused on releases occurring as a result of on-site activities during USEPA’s time-critical removal action. The following table summarizes actions required at the WRI site if certain H2S gas conditions at the fenceline are achieved:
H2S gas Concentration
Length of Time of Sustained Readings
Actions Required
.200 ppm 30 minutes at the fence line
1. Federal on-scene coordinator may advise residents to close windows and stay inside. 2. If resident gives permission, conduct air monitoring inside home. 3. If concentrations inside home are up to 200 ppb, FOSC should notify Warren City Fire Department and defer to their authority for community action.
1.0 ppm 10 minutes at the fence line 1. Take immediate action on-site to mitigate the cause of the gas release. 2. Alert the Warren City Fire Department and defer to their authority for community action.
3.0 ppm 5 minutes at the fence line 1. Take immediate action on-site to mitigate the cause of the gas release. 2.Alert the Warren City Fire Department and defer to their authority for community action.
25 ppm sustained for any length of time, at the fence line
1. Take immediate action on-site to mitigate the cause of the gas release. 2. Inform residents to close windows, shut off air conditioners, and stay inside. 3. Alert the Warren City Fire Department and defer to their authority for community action.
This table pertains to releases that occur as a result of on-site work actions.
58

REFERENCES:
1. Agency for Toxic Substances and Disease Registry. Toxicological profile for hydrogen sulfide. Atlanta: US Department of Health and Human Services; 1999
1a. Agency for Toxics Substances & Disease Registry. Sept. 2004. Draft Toxicological Profile for Hydrogen Sulfide, http://www.atsdr.cdc.gov/toxprofiles/tp114.html .
2. Agency for Toxics Substances & Disease Registry, Medical Management Guidelines for Hydrogen Sulfide. http://www.atsdr.cdc.gov/MHMI/mmg114.html, accessed April 27, 2006.
3. EPA Region 9 Preliminary Remediation Goals. http://www.epa.gov/region9/waste/sfund/prg/ . Accessed February 16, 2006.
4. EPA Region 3 Risk Based Concentration Table. http://www.epa.gov/reg3hwmd/risk/human/index.htm . Accessed February 16, 2006.
5. EPA Acute Exposure Guidelines, http://www.epa.gov/oppt/aegl/chemlist.htm. Accessed April 27, 2006.
6. California Environmental Protection Agency, http://www.oehha.ca.gov/air/pdf/acuterel.pdf. Accessed April 27, 2006.
7. Occupational Safety and Health Administration, http://www.osha.gov/dts/chemicalsampling/data/CH_246800.html Accessed April 27, 2006.
8. USEPA , Characterization of Building Related Construction and Demolition Debris in the United States, Construction and Demolition Debris, June 1998.
9. USEPA , Construction and Demolition Debris; http://www.epa.gov/epaoswer/non-hw/debrisnew/basic.htm ; Accessed April 27, 2006.
10. Timothy G. Townsend et al. Dec. 2000(Updated Jan. 2002), Gypsum Drywall Impact on Odor Production at Landfills: Science and Control Strategies, Florida Center for Solid and Hazardous Waste Management, State University System of Florida.
11. New Hampshire Department of Environmental Services, November 22, 2004 Interim Best Management Practices for the Use of C&D Process Fines.
12. Bogner and Heguy, March/April 2004, Hydrogen Sulfide from Landfilled Construction and Demolition Debris: When and How, MSW Management.
13. Hardy Associates (1978) Ltd., December 19, 1984, Gypsum Subcommittee of the Lower Mainland Refuse Project. Investigation of Means to Control Sulphide Production in Drywall Landfill Disposal Operations.
14. Gypsum Association, January 1991, Treatment and Disposal of GypsumBoard Waste Industry Technical Paper.
15. Timothy G. Townsend, et al, January 31, 2001, Recycling of Discarded Gypsum Drywall in Florida, Final report to the Florida Department of Environmental Protection, by University of Florida Department of Environmental Engineering Sciences.
16. Plaza, Townsend, Cover Materials for the Mitigation of Hydrogen Sulfide from C&D Landfill Gas, Department of Environmental Engineering Sciences, University of Florida. SWANA E-Training, July 13, 2005.
17. Shaw Environmental, EMCON/OWT, Inc. June 24, 2004, Final Report on Best Management Practices, Construction & Demolition Fines as Landfill Cover Material.
59

18. USEPA , Pollution Reports 1-16, Warren Recycling, Warren Ohio EPA Region V, http://www.epaosc.org/polrep_profile.asp?site_id=1622 , Accessed April 28, 2006.
19. USEPA Region 5, Letter to Ohio EPA, June 13, 2005, Hydrogen Sulfide Problems at Construction and Demolition Landfills at States Outside of Ohio in the United States.
20. Reinhart, et al, November 2004, Control of Odors from Construction and Demolition (C&D) Debris Landfills, Florida Center for Solid & Hazardous Waste Management, University of Florida.
60