satellite earth observation in operational oceanography · relevance of satellite data in numerical...
TRANSCRIPT

Ž .Coastal Engineering 41 2000 155–176www.elsevier.comrlocatercoastaleng
Satellite earth observation in operationaloceanography
Ola M. Johannessen), Stein Sandven, Alastair D. Jenkins,Dominique Durand, Lasse H. Pettersson, Heidi Espedal,
Geir Evensen, Torill HamreNansen EnÕironmental and Remote, Sensing Center, EdÕ. GriegsÕei 3a, N-5059 Bergen, Norway
Abstract
The role and contribution of satellite data in operational oceanography is reviewed, withemphasis on northern European seas. The possibility to observe various ocean parameters andprocesses by existing satellite sensors, such as optical instruments, infrared radiometers, passive
Ž .microwave radiometers, and active microwave systems altimeter, scatterometer, SAR is dis-cussed. The basic parameters are: sea-surface temperature observed by infrared radiometers, oceancolour by spectrometers, sea-surface elevation by altimeters, and surface roughness by active andpassive microwave systems, which can be used to derive surface wind and waves. A number ofocean processes can be derived from synoptic mapping of the basic parameters of larger sea areas,such as current patterns, fronts, eddies, water mass distribution, and various water quality
Ž .parameters chlorophyll, surface slicks, suspended sediments . The suitability of existing satellitedata to fulfil the operational requirements for temporal and spatial coverage, data delivery innear-real-time, and long-term access to data is discussed in light of the fact that opticalrinfrareddata in northern Europe are severely hampered by frequent cloud cover, while microwavetechniques can provide useful data independent of weather and light conditions. Finally, the use ofdata assimilation in oceanographic models is briefly summarised, indicating that this technique isunder development and will soon be adopted in operational oceanography. q 2000 ElsevierScience B.V. All rights reserved.
Keywords: Chlorophyll; Operational oceanography; Satellite observations; Suspended sediments; Temperature;Waves
) Corresponding author. Fax: q47-55-200-050.Ž .E-mail address: [email protected] O.M. Johannessen .
0378-3839r00r$ - see front matter q2000 Elsevier Science B.V. All rights reserved.Ž .PII: S0378-3839 00 00030-2

( )O.M. Johannessen et al.rCoastal Engineering 41 2000 155–176156
1. Introduction
This paper provides a review of available satellite Earth Observation data, and theirpotential and suitability for use in operational oceanography for northern Europeanwaters. The article reflects the view of the authors and is, therefore, not intended to becomprehensive. We intend to provide a general overview of remote sensing methodsapplicable at high latitudes where cloud cover often restricts use of optical and infrareddata. Sea-ice monitoring, which is essential in polar regions, is not addressed. Therelevance of satellite data in numerical modelling and prediction in shelf seas is brieflyaddressed.
The survey and the protection of coastal waters and shelf seas require comprehensiveknowledge, forecasting capability, and the ability to assess environmental impacts.Terrestrial discharges, oil spills, harmful phytoplankton blooms, and coastal erosion, areexamples of the kinds of processes and incidents that take place, with great conse-quences for human health, economic activities, and the local, regional, and globalenvironment. Considerable economic and social benefits are expected from operationalservices as numerical coupled forecast models improve, partly due to more frequent andhigher quality remote sensing data and advanced assimilation techniques. This willbenefit and increase safety for the merchant fleet, and the fisheries, offshore, andaquaculture industries. It will also assist coastal zone management, provide earlywarning of floods, protect the marine environment, and improve the monitoring oflarge-scale climate change.
Pre-operational models are routinely used to supply information in statistical or timeseries format pertaining to specific locations and time intervals for policy development,management options, engineering designs, and in associated scientific research studies.Fully operational models are required for real-time forecasts of flood levels, oil spilltracks, ship routing, and for the operation of storm-surge barriers in the Thames and near
Žthe mouths of the Rhine. Also, harbour traffic control systems Vessel Traffic Systemsw x.VTS require real-time forecasts of wave heights and tide levels for optimal use ofdredged access channels. In the future, reliable forecast systems will be required forapplications such as the management of ecologically sensitive areas. Validation as wellas assimilation of field measurements and remote sensing observations will be a majorstep in the development of fully operational models. Pre-operational modelling inoceanography shares the analogous need with meteorology for internationally organisedmonitoring and communications networks and for rationalisation of the range of modelsused. Satellite Earth Observation techniques have over the last two decades matured tosuch a stage that quality products of ocean wind, waves, temperature, eddy and frontal
Žlocation, and propagation and water quality chlorophyll concentration, suspended. Žsediment can be produced routinely e.g., Ikeda and Dobson, 1995; Johannessen et al.,
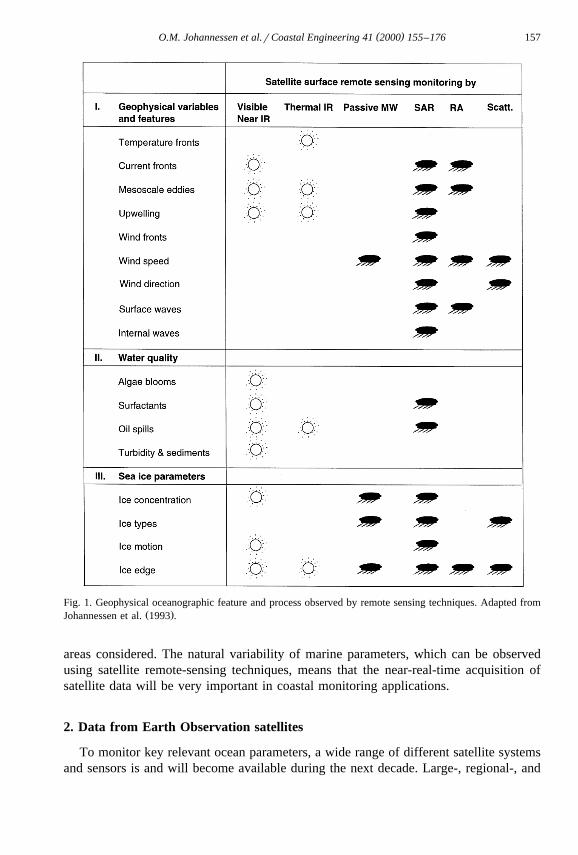
.1997 . However, so far, the most frequent variables retrieved from satellite sensors usedin national and international pre-operational and operational systems are wind, waves,and temperature and ice conditions. Fig. 1 gives a summary of geophysical features andprocesses that can be observed with different remote sensing techniques available today.
Supplementing in-situ observations with remote sensing data will greatly add to theirvalue, particularly in monitoring ocean wave, wind, and current fields in the coastal
( )O.M. Johannessen et al.rCoastal Engineering 41 2000 155–176 157
Fig. 1. Geophysical oceanographic feature and process observed by remote sensing techniques. Adapted fromŽ .Johannessen et al. 1993 .
areas considered. The natural variability of marine parameters, which can be observedusing satellite remote-sensing techniques, means that the near-real-time acquisition ofsatellite data will be very important in coastal monitoring applications.
2. Data from Earth Observation satellites
To monitor key relevant ocean parameters, a wide range of different satellite systemsand sensors is and will become available during the next decade. Large-, regional-, and

( )O.M. Johannessen et al.rCoastal Engineering 41 2000 155–176158
mesoscale weather and ocean features can be monitored by polar orbiting satellites withsensors operating in a wide part of the electromagnetic wave spectrum. Microwavesensors acquire data independent of sunlight and clouds, and are used to monitor wind,
Ž . Žwaves, ocean currents, oil spills, and sea-ice. Visible and infrared IR sensors e.g.,Ž . ŽNOAArAVHRR Advanced Very High-Resolution Radiometer , ERS-ATSR Along
. .Track Scanning Radiometer , IRS-P3-MOS, SeaWiFS monitor sea-surface temperatureŽ .SST , fronts, currents, eddies, and ocean colour. Small-scale features such as oil slicks,near-shore circulation, and wave fields, can, under favourable meteorological conditionsŽ y1 .normally the wind speed must be in the range of 3–11 m s , be monitored withhigh-resolution polar orbiting radar sensors.
2.1. Temperature
The distribution of SST provides significant information related to a wide range ofmarine processes and phenomena such as ocean currents, fronts, mesoscale eddies, andup-welling phenomena. This allows use of satellite derived SST information in the
Ž .mapping of ocean circulation Johannessen et al., 1991, 1993, 1996, 1997 , fisheriesŽ . Ž .Pettersson, 1990 , algal blooms Johannessen et al., 1989 and in assimilation of SST
Ž .data in physical circulation models Stanev, 1994 . SST is observed from space bythermal infrared imagery, during cloud-free conditions, using the thermal infraredchannels of the NOAArAVHRR and from the ERS ATSR sensor systems. Theseinstruments measure the SST distribution at a spatial resolution of 1 km and an accuracy
Ž .of 0.58C or better NOAA, 1995 . The structure of mesoscale ocean circulation featuresin the North Sea tidal front and the Norwegian coastal current were early documented
Žthrough use of this type of Earth observation data Johannessen, 1986; Johannessen et.al., 1989 . An example of an AVHRR scene is shown in Fig. 2.
It is not yet possible to observe sea-surface salinity from space, but techniques usingŽ .passive microwave radiometry are under development Lagerloef et al., 1995 . So far,
Fig. 2. NOAArAVHRR thermal infrared image of southern Norway, 20 September 1995.

( )O.M. Johannessen et al.rCoastal Engineering 41 2000 155–176 159
successful results have been obtained by airborne L-band radiometry in the coastal zoneŽ . ŽMiller et al., 1998 , and satellite systems using this method have been proposed Kerr,
.1998 .
2.2. Sea surface eleÕation
Information on sea-surface elevation is important for predicting tides and stormsurges. This can be obtained from radar altimetry, but detailed information on thesatellite orbit is required. Such information can be obtained for the purposes of tidalanalysis, but is not generally available soon enough in order for near-real-time assimila-tion into storm-surge prediction models. In the absence of a sufficiently accurate geoidmodel, altimetry can, so far, only provide information of the variable part of thetopography due to ocean dynamics, but this variability can be related to the eddy kinetic
Ž .energy of the surface circulation Samuel et al., 1994 . In order to resolve mesoscalefeatures at high latitudes, the altimeter ground track should have a cross-track spacing ofthe order of a few tens of kilometres and a repeat period of a few days. This should bepossible using data from two radar altimeter satellites flying simultaneously such asERS-1r2 and TOPEXrPoseidon. Also, for coastal applications, improvements in theantenna tracking mechanism are necessary to prevent loss of data when the ground trackcrosses over from land to sea.
2.3. Currents
The mechanisms for driving ocean currents in northern European waters are windforcing, density differences, sea-surface gradients and tidal forcing, and current patternsare usually modified by topographic features. Currents can be identified in thermalinfrared images through gradients in SST and ocean pigment distribution due to the
Ž .differences of water masses of different origin. In Synthetic Aperture Radar SARimages current features are mapped due to changes in surface roughness across fronts. Inwaters near the coast, land-based Doppler HF radar has proven to be a suitable system
Žthat can provide quantitative measurements of surface currents Crombie, 1955; Lipa.and Barrick, 1986; Andersen and Smith 1989; Prandle, 1991; Shay et al., 1993 .
Large-scale monitoring studies have suggested that it is possible to observe currentsŽ .using over-the-horizon radar, which utilise ionospheric reflections Georges et al., 1996 .
SAR is able to image the surface expressions of features such as eddies, meanders,fronts, and jets, thereby providing qualitative information on their structure and evolu-
Ž .tion Lyzenga, 1991; Johannessen et al., 1991, 1994 . Products that may be consideredfor operational use include manually interpreted images and geographical coordinates ofthe relevant observed features.
Even though SAR is capable of seeing through clouds and in the absence of daylight,it is unable to image circulation features at very low or high wind speeds, and itscapability can also be degraded in the presence of heavy rain. Reflecting the watermasses of various origin, these circulation features frequently also have an expression inthe surface temperature and ocean colour field. Hence, they may be detectable by visibleand infrared radiometers under cloud-free andror daylight conditions. Thus, products
( )O.M. Johannessen et al.rCoastal Engineering 41 2000 155–176160
combining information from these different types of sensors will be useful under variedenvironmental conditions and, therefore, more suited for operational use.
Although circulation features can be imaged by SAR, it is not generally possible tomake a good quantitative estimate of the magnitudes of the currents involved, although anumber of numerical models exist, which aim to predict the radar backscatter variationsproduced in association with various types of surface current pattern, oceanic fronts,internal waves, etc. Interferometric SAR analysis is able, under suitable circumstances,
Žto give direct quantitative measurements of surface currents Shemer, 1993; Graber et.al., 1996 , but is, at present, only deployed on aircraft for marine applications.
The use of satellite radar altimetry to the determine geostrophic currents by means ofmeasuring sea-surface slope is possible for determination of large-scale time variantcurrent fields. The variance in the elevation gradients can be used to obtain an estimateof the eddy kinetic energy of the circulation, which is a useful parameter to quantify themesoscale eddies.
2.4. Wind
Wind speed and direction over the global ocean can be determined from the radarŽ .scatterometer on the ERS-1r2 satellites Stoffelen and Anderson, 1997a,b,c , and is
used in operational marine weather forecasting. It is also possible to determine detailedpatterns of wind speed, and sometimes direction, from SAR images, and, at a lowerresolution, from real-aperture satellite side-looking radar data. Satellite altimeter data
Žcan also be used to determine wind speed along the orbit Witter and Chelton, 1991;.Carter et al., 1992; Monaldo, 1988 .
Scatterometer observations over the ocean provide direct estimates of the global windvector field at spatial resolution of 50 km, with an accuracy of 2 m sy1 in speed, 158 indirection, but usually with a directional ambiguity of 1808. For some applications suchas in semi-enclosed seas, in straits, in coastal regions, and in estuaries, this resolution is,however, too coarse. In these regions, wind field estimates retrieved from high-resolu-tion SAR images can be very useful. Today, SAR is the only space-borne instrument
Ž .that can provide high spatial resolution images 30 m ground resolution for quantitativemeasurements of mesoscale wind field at a spatial resolution of typical 10=10 km. Thespatial and temporal coverage of ERS data is limited, and not suitable for operationalmonitoring. However, wide swath SAR data from RADARSAT and ENVISAT offerbetter data coverage, which can be important for wind monitoring.
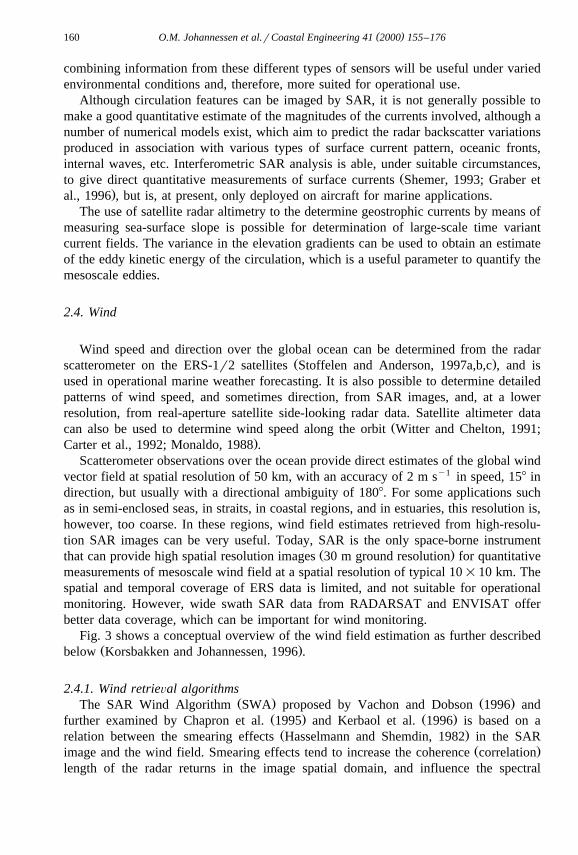
Fig. 3 shows a conceptual overview of the wind field estimation as further describedŽ .below Korsbakken and Johannessen, 1996 .
2.4.1. Wind retrieÕal algorithmsŽ . Ž .The SAR Wind Algorithm SWA proposed by Vachon and Dobson 1996 and
Ž . Ž .further examined by Chapron et al. 1995 and Kerbaol et al. 1996 is based on aŽ .relation between the smearing effects Hasselmann and Shemdin, 1982 in the SAR
Ž .image and the wind field. Smearing effects tend to increase the coherence correlationlength of the radar returns in the image spatial domain, and influence the spectral
( )O.M. Johannessen et al.rCoastal Engineering 41 2000 155–176 161
Ž .Fig. 3. Conceptual overview of wind retrieval models Korsbakken and Johannessen, 1996 .
Ž .properties of the SAR image. In the case of a fully developed sea no fetch limitationthe empirical relation, based on evaluation of 1200 SAR wave-mode ‘imagettes’ with a
Ž .central incidence angle of 20.28 is given by Chapron et al. 1995 as
l y30cU s4.75 1Ž .10 ž /110
where U is the wind speed in m sy1 at 10 m above the surface and l is the azimuth10 c
cut-off wavelength in metres, which can be estimated from the SAR image powerspectrum. An example of a wind field derived by this algorithm is shown in Fig. 4.
2.4.2. The CMOD4 model functionŽ .The CMOD4 wind retrieval model Stoffelen and Anderson, 1993, 1997a,b,c is
developed for the ERS-1 C-band scatterometer, but it is also shown to give goodŽestimates of wind speed when applied to ERS-1 SAR images Johannessen et al., 1994;
.Vachon and Dobson, 1996; Vachon et al., 1995; Wackerman et al., 1996 .0 ŽThe CMOD4 empirical algorithm gives a theoretical s normalised radar backscat-
.ter cross-section value as a function of wind speed and direction. The accuracy in themodel is "208 in relative wind direction and "2 m sy1 in wind speed when applied toscatterometer data. The CMOD4 model is derived for a neutral stratification. In order tocompute the wind speed from the radar backscatter accounting for the stratification in
Ž .the atmospheric boundary layer ABL , the CMOD4 derived wind speed must be

( )O.M. Johannessen et al.rCoastal Engineering 41 2000 155–176162
Fig. 4. Wind field derived from an ERS-1 SAR image on 17 September 1995. Wind speed ranges from 7 to 13m sy1. SAR wind vectors derived from two SAR passes, each 300=100 km, off the coast of southwestNorway. Red arrows indicate the standard meteorological analysis grid points.
modified. A correction for this can be derived from expressions relating unstable andŽ . Ž .stable stratification to neutral stratification as suggested by Wu 1993 and Smith 1988 .
Ž .The saturation of the analogue-to-digital conversion ADC in the satellite must also beŽ . Ž .accounted for, as described by Meadows and Willis 1995 , Laur et al. 1996 , and
Ž .Scoon et al. 1996 . The effect is strongest over the ocean in the near range andŽ .increases with radar backscatter intensity i.e., at high winds and leads to an underesti-
mation of s 0.The wind direction can also be estimated from the CMOD4 model for different
incidence angles provided the wind speed, derived from the SWA method, can beassociated with the corresponding measured radar backscatter. In such cases, foursolutions, i.e. two pairs, each with a 1808 ambiguity can be found, except in the cases
Ž .when the direction is close to upwind the wind blowing towards the radar orŽdownwind, for which only one pair is found. Note that for the three-beam scatterometer
.on ERS-1r2 the number of solutions is reduced to a single pair with a 1808 ambiguity.Ž .It has also been demonstrated by Johannessen et al. 1994 that wind rows manifested in
SAR images can be used to indicate the near surface wind direction during the SAR
( )O.M. Johannessen et al.rCoastal Engineering 41 2000 155–176 163
integration time. In such cases the number of wind direction solution pairs is alsoŽ .reduced to one 1808 ambiguity .
2.5. WaÕes
Ž .Significant wave height H can be determined using satellite altimeter measure-SŽ .ments Rufenach and Alpers, 1978; Bauer et al., 1992; Guillaume and Mognard, 1992 ,
and such measurements have been used to validate numerical wave forecasting modelsŽ .Wu et al., 1994 . The use of ERS and TOPEXrPoseidon altimeter data for significantwave height in conjunction with ERS scatterometer data for wind produces encouraging
Ž .improvements in wave forecast model predictions Le Meur et al., 1996 . Presentoperational products include assimilation of satellite altimeter derived significant wave
Ž .heights into an operational regional wave forecasting model Breivik et al., 1996 , andsignificant improvements in the wave analysis and short-term forecasts for the North Seawere found.
Another significant remote sensing data type for wave observation is radar altimetersŽ .ERS-1r2, TOPEXrPoseidon, Seasat, GEOS-3 , which can provide climatological
Žwave height information as well as wind speed Paci and Campbell, 1996; Lasnier et al.,.1996 . The along-track resolution for the radar altimeters is typically 7 km. These data
can be used for offshore oil industry design and operational planning purposes, as wellas for coastal engineering design, naval architecture, ship routing, etc.
Wave direction and wavelength can be determined using ERS-SAR, both in imagemode and globally in ‘wave mode’, and also in the high-resolution modes ofRADARSAT. The typical resolution of satellite SAR, about 30 m, means that onlywaves with periods of about 5 s or more can be resolved. The wave pattern visible on anSAR image may be very different from the in-situ wave field, as well as having a 1808
directional ambiguity, and a complex post-processing of the image is usually necessaryto extract the directional wave spectrum. It is usually necessary to start from an initial
Ž‘first guess’ spectrum, from, say, a numerical model simulation Hasselmann and.Hasselmann, 1991; Krogstad et al., 1994 . Progress in reducing the directional ambiguity
and in improving the signal-to-noise ratio has recently been made by employing SingleŽ .Look Complex data from ERS-SAR Engen and Johnsen, 1995 .
SAR does appear to give convincing images of swell waves propagating onto coasts,including the effects of depth refraction, shadowing, and diffraction. The ability of SARin image mode to provide rather detailed pictures of wave fields near shorelines, at leastfor the longer swell waves, should be useful in monitoring the coastal environment andits changes, including the locations of rip currents, long-shore drift, and other currents,which impact the transport of sediments. Wave refraction by bottom topography and theresulting change in surface roughness monitored by SAR, may be used to monitor theevolution of sandbanks in shallow-water areas, as well as in charting bathymetry in
Žpoorly-surveyed regions Calkoen, 1996; Calkoen and Wensink, 1993; Calkoen et al.,.1991; Hesselmans, 1996 .
SAR wave mode data are now used to provide corrections to forecast wave directionsin operational wave forecasting models, though assimilation of these data is still at a
Ž .preliminary stage Breivik et al., 1996; Paci and Campbell, 1996 . The impact of thesedata is not very significant at present, mainly because of the sparse data coverage, but
( )O.M. Johannessen et al.rCoastal Engineering 41 2000 155–176164
Ž .new processing techniques e.g., Engen and Johnsen, 1995 are being evaluated and mayimprove the situation.
2.6. Water quality
Water quality is measured through a series of bio-geophysical parameters andprocesses at the sea surface or in the water column. Some of the key parameters aredissolved or suspended substances in the water column, such as chlorophyll concentra-tion, suspended sediment, and dissolved organic matter and biological and chemicalfilms at the sea surface. All these substances have the property to modify the character-istics of the light field that interact with the water body, and thus, have impact on thesignal measured by remote sensor. Other quantities and phenomena can be derived fromthe above parameters, which are also good indicators of water quality, e.g. primaryproduction, algal bloom, sediment transport.
A review of algorithms and domain of applications, as well as an assessment of EarthŽ .observation capability with respect to water quality can be found in Durand et al. 1999 .
2.6.1. Natural films and oil spillsUnder suitable conditions, an oil slick will dampen capillary and short gravity waves,
and appear as a dark slick in an SAR image of the ocean surface. This effect has beenused for decades in aircraft-based oil spill monitoring systems, especially in the NorthSea. Now, the radar satellites ERS-2 and RADARSAT are used in routine satellite-based
.oil spill monitoring services http:rrwww.tss.nor . However, these services rely uponvisual interpretation of SAR images, and a number of oil spills ‘lookalikes’ may
Ž .complicate the analysis Espedal, 1998 .To improve the performance of satellite-based SAR oil spill detection and monitor-
ing, in coastal zone, a combination of model data and SAR data has been developedŽ . Ž .Espedal, 1998 . Such concepts may include oil drift components Furnes, 1994 and
Ž .SAR image models Lyzenga and Bennett, 1988; Tanis et al., 1989 . If a possible oilspill is detected in an SAR image, the models are used to try to reconstruct the spillŽ .given wind, current and wave height history of the area . The discharge rate and type ofoil giving the best possible match to the observed spill, is then searched. Examples ofslick signatures in SAR images are shown in Fig. 5.
2.6.2. Ecological aspectsThe light scattering and absorbing characteristics of the phytoplankton itself and other
water constituents is the basis for the use of ocean colour Earth observation sensors. TheŽ .US Coastal Zone Color Sensor CZCS from 1978 to 1986 proved the usefulness of this
type of Earth observation technique to map the marine chlorophyll distribution.Typically, only 10% of the satellite measured signal origin from the water surface.
ŽHence, appropriate algorithms for atmospheric signal correction must be applied Moore.et al., 1999 . Further, a number of algorithms have been developed for the retrieval of
Žphytoplankton pigment concentration from ocean colour data see Morel and Prieur,1977; Gordon and Morel, 1983; Gordon et al., 1980; Morel 1988; Sathyendranath et al.,1994, for CZCS algorithms; O’Reilley et al., 1998 for SeaWiFS and OCTS algorithms;
.Morel and Antoine, 1997 for MERIS .

( )O.M. Johannessen et al.rCoastal Engineering 41 2000 155–176 165
Fig. 5. This ERS-1 SAR image from 30 October 1994 contains a number of possible oil slicks, release ofproduced water and natural film, connected to or located near oil platforms in the Norwegian and British
Ž .sectors in the North Sea Espedal and Johannessen, 1999, in press .
Phytoplankton biomass and primary production estimation can be derived fromphotosynthetic pigment concentration in the upper water column and Photosynthetic
( )O.M. Johannessen et al.rCoastal Engineering 41 2000 155–176166
Ž .Available Radiation PAR , which can be both estimated from the data acquired byŽradiometers measuring ocean colour Bricaud et al., 1987; Platt and Sathyendranath,
.1988, 1993; Morel, 1991; Antoine and Morel, 1996; Behrenfeld and Falkowski, 1996 .ŽAlmost all the models deal with so-called case I water dominated by phytoplankton as
. Ž .the only coloured substance , as defined by Morel and Prieur 1977 . Empirical orsemi-empirical models relating atmosphere-corrected radiances and water constituent
Žconcentrations are used. They are based on spectral band ratios mainly bluergreen.bands and are thus dependent upon the spectral bands’ characteristics of each sensor.
In the open ocean, the complexity of the ocean optics is not as severe as in the coastalŽ .areas case II waters , where the sediments and coloured dissolved organic matter
Ž .CDOM also significantly contribute to the signal measured by the satellite sensors.Deriving water quality parameters with a sufficient accuracy, in case II waters is one ofthe main challenge of the coming years in marine optics. The current developmentincludes new sensors with improved capability, i.e. more and narrower spectral bands,and new algorithms with improved atmospheric correction scheme andror global
Ž .approach inverse methods . The most advanced work is undertaken in connection withthe development of the next generation of optical ocean colour sensor, i.e. the USMODIS and the European MERIS instruments. The state-of-the-art in chlorophyll
Ž .concentration retrieval in case II waters can be found in, e.g. Moore et al. 1999 andŽ .Schiller and Doerffer 1999 . It concerns, in particular, inverse method, including
artificial neural network techniques, and improved atmospheric correction algorithms.One of the main issues of surveying phytoplankton distribution and concentration is
Žthe operational monitoring of harmful algae blooms, and potential fishery areas Dundas.et al., 1989; Johannessen et al., 1993 . The development of extreme algal bloom
Ž .situations harmful or not generally depends on the following environmental conditions:Ž . Ž . Ž .i hydrodynamics, ii supply of macro-nutrients to the euphotic layer, iii surface solar
Ž . Ž .radiation, and iv the optical properties of the water column Johannessen et al., 1993 .An algal bloom may have its peak activity below the surface, and hence, may not bedetected by remote sensors. The algae themselves have limited mobility, and hence, ameasure of the advection of an identified bloom may be done indirectly throughmonitoring of the currents and ocean circulation pattern.
An example was the extensive bloom of the toxic algae Chrysocromulina polylepis inŽ .the Skagerrak region in spring 1988 Aksnes et al., 1989; Dundas et al., 1989 , where
the advection of the bloom front was consistent with the warm water front. The bloomoriginated in the Skagerrak, and the algal front was subsequently advected with thewarm water out of the Skagerrak region. During this event, the Norwegian aquacultureindustry suffered losses of the order of ECU3.5 million, while caged fish of a value ofECU140 million were towed northward and into the fresher and colder water in thefjords and saved. The monitoring efforts during this event included the combined use offield observations, numerical modelling simulations, and satellite and airborne remotesensing and reconnaissance.
During other bloom events, water discoloration is detectable to the human eye. Anexample of this is the presence of the alga Emiliania huxleyi, which causes a
Žmilky-white water colour during the phase when the coccoliths plates composed of.calcite become detached from the cells. Such blooms are seen annually in coastal and

( )O.M. Johannessen et al.rCoastal Engineering 41 2000 155–176 167
fjord areas as well as in the open ocean all over the world but in particular, atmid-latitudes. The high reflectance of water with coccoliths makes these blooms even
Ž .visible in the optical channel of the AVHRR sensor Holligan et al., 1993 . An exampleof two such blooms in the North Sea is shown in Fig. 6.
On the other hand, the estimation of primary productor biomass and production atregional and global scales are also of great interest for global and regional climatechange forecasting. Such information is needed to improve coupled physical andbiogeochemical models, which are used for studying, e.g. the carbon cycle in theatmosphererocean system and its influence on the climate.
Ž . Ž .Fig. 7 shows a SeaWiFS left and a NOAArAVHRR right image from May 1999,Ž .covering the North Sea and Skagerrak area Pettersson et al., 1999 . The images resolve
the pigment concentration in the water, which is correlated to the phytoplanktonconcentration and other coloured pigments and the SST, respectively. Major circulationand current patterns can be observed in both images. In particular, the cool and
Ž .mesotrophic inflow of Atlantic water in blue in the Skagerrak is well observed, as wellas the outflow from of warm and eutrophic water from the Baltic as well as solar heating
ŽFig. 6. This NOAArAVHRR image from June 1995 shows two cocolithophorid blooms of E. huxleyi A and2 .B, covering 22000 and 7500 km , respectively between Scotland and Norway. The high reflectance caused
by the calcite plates, which characterised this family of algae, is particularly well observed in the visible partŽ . Ž .of the spectrum first channel of AVHRR Pettersson, 1995 .

( )O.M. Johannessen et al.rCoastal Engineering 41 2000 155–176168
Ž .Fig. 7. Circulation patterns as observed by ocean colour and thermal infrared sensors. a Chlorophyll pigmentconcentration product from SeaWFS over the North Sea and the Skagerrak on 19 May 1999. q Orbital
Ž .Imaging and NASA SeaWiFS project. b Sea surface temperature as derived from NOAArAVHRR for 19May 1999 over the same region. Data provided by Steve Groom, Centre for Coastal and Marine Sciences,Plymouth Marine Laboratory.
during the day. We may notice that the inflow is better seen in the SeaWiFS image. Thiscan be explained by the fact that the signal measured by ocean colour sensor integrates
Žthe upper layer of the water column typically to the depth where irradiance equals 10%.of its value just below the surface , whereas SST only concerns the surface micro-layer,
which is affected by warm water from the Baltic. In the same region, the outflow fromthe Oslofjord, characterised by high concentration of pigments, can be observed in theSeaWiFS image, as well as its spreading along the southern coast of Norway andwestern coast of Sweden. High values are also observed in the SeaWiFS image, alongthe coast of Denmark. These originate from the high concentration of suspended matteras well as the sea-floor contribution to the measured signal in this shallow water area.The mesoscale eddy circulation currents along the west coast of Norway is also wellreproduced in both images in which similar circulation patterns are observed.
2.6.3. Suspended sediment and sediment transportIn studies of marine transport of sediments, for applications to coastal erosion,
changes in bathymetry, transport of deposited material, associated adsorbed pollutants,etc., it is possible to obtain a measure of suspended particle concentration frommulti-channel optical and near-infrared radiometer observations.
Remote sensing measurements of suspended sediment have been studied by TassanŽ . Ž . Ž . Ž .1988 , Curran and Novo 1988 , Harwar et al. 1995 , and Althuis et al. 1996 . A

( )O.M. Johannessen et al.rCoastal Engineering 41 2000 155–176 169
synthesis on remote sensing measurements with respect to suspended sediment andŽ .numerical modelling has been performed recently by Xia 1993 . Other work in this
Ž . Ž .field have been performed by, e.g. Puls et al. 1994 and Vos and Schuttelaar 1995 .Monitoring sediment transport requires knowledge of the wave amplitude and
direction, coastal currents, bathymetry, bottom topography, and the distribution ofsuspended sediment. These are all potentially recoverable by remote sensing, e.g. usingSAR data for wave, currents, bottom topography, and optical sensors for bathymetry,bottom topography, and distribution of suspended sediment.
The images obtained using optical and infrared radiometers are potentially capable ofŽretrieving bathymetry Lyzenga, 1978; Bierwirth et al., 1993; Durand et al., 1998; Lee et
. Ž .al., 1999 , bottom type Lyzenga, 1978, 1981; Estep and Holloway, 1992; Estep, 1994 ,Ž .and total water column suspended material content see above in the case of shallow
water not exceeding 30 m depth.Pre-operational services that integrate satellite-based remote sensing for sediment
transport assessment and monitoring are currently available. New capability of the nextŽ .generation of ocean colour sensors MERIS, Orbview-4, etc. , as well as the increase
number of sensors in orbit, should provide the required step forward to achieve a realoperational monitoring of water quality in the near future.
3. Suitability of remote sensing data for operational requirements
3.1. Data coÕerage
There is generally a trade-off between the spatial resolution of satellite data and theiravailable temporal coverage. Continuous, nearly global coverage is afforded by geosta-tionary meteorological satellites, and coverage several times daily is available from thepolar orbiting NOAArAVHRR. Cloud cover significantly reduce the nominal coveragerate of optical and infrared sensor systems. Only regions under cloud-free conditions areavailable — a significant disadvantage for mid-latitude locations, which are subject tofrequent poor weather. High latitude polar regions also suffer from limitations due to thewinter darkness.
Passive microwave and radar sensors can penetrate cloud cover, but the formerŽsensors generally have rather too poor resolution for covering North Sea scales 1 km
.and more . The spatial resolution of SAR images are sufficient for most marineapplications; however, both limitations in swath width and repeat cycles limit theiroperational use. The new era starting with the Canadian RADARSAT satellite hasimproved the SAR sensor coverage, however operational coverage is still difficult.
3.2. AÕailability in near-real-time
Ž .Satellite receiving stations such as Tromsø Satellite Station TSS; in Norway , KNMIŽ . Ž .in The Netherlands and RAIDS in the UK downlink and process SAR and othersatellite sensor data, and distribute them in near-real-time to institutions providing
( )O.M. Johannessen et al.rCoastal Engineering 41 2000 155–176170
value-added products, which are sent out to end-users. The time needed for acquisition,processing, and distribution is typically a few hours for SAR data. The requirement fornear-real-time data is essential in operational oceanography. The time delay, which isacceptable between satellite overpass and access to data depends on application and typeof products. Wind and wave data are needed within 1–2 h, while weekly SST can accepta longer time delay.
An example of near-real-time use of SAR is for operational oil spill monitoring inNorwegian waters. TSS performs screening of SAR images for possible oil spill for the
Ž .Norwegian State Pollution Control Authority SFT . TSS inspects the SAR images innear-real-time and alerts the SFT surveillance aircraft on possible pollution eventsŽ .Pedersen et al., 1996 .
ŽFor specific types of data e.g., significant wave height from altimeter and SAR.Wave Mode data , the data are processed on a routine basis and distributed via the
Global Telecommunications System to national meteorological centres, for use in theirmeteorological analysis, modelling, and forecasting services.
3.3. Programme continuity and long-term data access
Operational users require long-term access to consistent data sets. There is a cleardemand to provide more products from satellite data in near-real-time to improveoperational use of the data. For operational oceanography it is most important to:
Ø continue and improve satellite programmes for altimetry, SAR, scatterometer, as wellas spectrometers and infrared radiometers;
Ø improve spatial and temporal coverage of SAR;Ø establish efficient distribution and processing services, including algorithms to derive
geophysical parameters.
3.4. Data assimilation
When interpreting remote sensing data, it is important to consider that satellites onlyobserve the Earth’s surface. In order to achieve three-dimensional marine informationand forecasts, remote-sensing data together with in situ data must be assimilated innumerical models.
In the last decade, various data assimilation methods have been developed, which canbe used with ocean hydrodynamic and ecosystem models. At present, however, none ofthese methods are used operationally, at least partly because the necessary observationaldata are too inaccurate, have insufficient coverage, or do not provide sufficiently goodcoverage.
In a fully operational system, the access time for the most recent observations alsobecomes important. Real-time analyses and predictions from the European weatherservices must be used to ensure a proper forcing of the model and to make it possible togenerate realistic predictions of the marine system.

( )O.M. Johannessen et al.rCoastal Engineering 41 2000 155–176 171
Operational ocean forecasting systems relies on an integrated use of observations ofphysical, biological, and chemical variables and coupled physical and marine ecosystemmodels. Thus, the true state of the ocean is observed from in-situ and satellite observingsystems, and this information is used to reinitialise the ocean and marine ecosystemmodel, which is then used to compute predictions.
The integration of observations and dynamics is formally made using the so-calleddata assimilation techniques. These are mathematical techniques, which are usuallybased on some prior statistical assumptions about the accuracy of the observations anddynamical models. Essentially, these techniques provide a way for introducing theinformation about the true ocean state into the models, which are then kept ‘on track’and will not drift away from the real state of the ocean. In fact, when properly used, dataassimilation methods will lead to an ocean state estimate, which is better than what canbe obtained when using a model or the observations separately. Further, in a monitoringand prediction system, the use of data assimilation will provide a best possible stateestimate at the current time, which can be used as initial conditions for a forecast.
The new operational data assimilation systems, which is currently being developed atseveral centres, also demand observations that are available in real-time. Thus, anextensive effort must be invested in the development of real-time data analysis andprocessing, e.g. for satellite-derived sea-surface heights, SST, and ocean colour. There isalso a need for real-time analyses and predictions of atmospheric fields, which are usedto force the ocean models.
4. Concluding remarks
The paper provides a review of satellite remote sensing data and derived geophysicaland biological parameters, which can be useful in operational oceanography. The mostimportant data that are available today are as follows:
1. Surface wave data from satellite altimeter and SAR. Altimeter can provide significantwave height, while SAR gives directional wave spectra.
2. Mean geostrophic ocean currents and eddy kinetic energy by radar altimeter.Ž . Ž .3. Surface wind by scatterometer 50 km resolution and SAR f10 km resolution .
Ž .4. Surface slick and circulation patterns eddies, fronts from SAR.5. SST variations, water mass distribution, fronts, and eddies from infrared radiometers.
Ž .6. Ocean colour, chlorophyll, and suspended sediments by spectrometer data SeaWiFS
To fully benefit from remote sensing data in operational oceanography, it is necessary touse the data in synergy with models through data assimilation methods. This has beensuccessfully demonstrated for altimeter data in ocean circulation models and SAR-de-rived wave spectra in wave forecasting models. The challenge is to develop models andassimilation methods further to include spectrometer data and other SAR-derivedparameters.

( )O.M. Johannessen et al.rCoastal Engineering 41 2000 155–176172
Acknowledgements
This study has been supported by the European Commission through the PROMISEŽ . Ž .project MAS3-CT950025 , COASTMON ENV4-CT960360 , Marie Curie Fellowship
Ž .ENV4-CT96-5017, ENV4-CT97-5088 , the Norwegian Space Centre and the Norwe-gian Research Council.
References
Althuis, I.J., Vogelzang, J., Wermand, M.R., Shimwell, S.J., Gieskes, W.W.C., Warnock, R.E., Kromkamp, J.,Wouts, R., Zevenboom, W., 1996. On the colour of case 2 waters particulate North Sea matter: Part I.Results and conclusions. Technical Report 95-21A. Netherlands Remote Sensing Board, Delft.
Aksnes, D.L., Aure, J., Furnes, G.K., Skjoldal, H.R., Sætre, R., 1989. Analysis of the chrysochromulinapolyepis bloom in the Skagerrak, May 1988: environmental conditions, and possible causes. TechnicalReport 89r1. IBM Bergen Scientific Centre, Bergen, Norway.
Andersen, C., Smith, P.C., 1989. Oceanographic observations on the Scotian Shelf during CASP. Atmos.-Oc-Ž .ean 27 1 , 130–156.
Antoine, D., Morel, A., 1996. Oceanic primary production: 1. Adaptation of a spectral light-photosynthesisŽ .model in view of application to satellite chlorophyll observations. Global Biogeochem. Cycles 10 1 ,
43–55.Bauer, E., Hasselmann, S., Hasselmann, K., Graber, H.C., 1992. Validation and assimilation of Seasat
Ž .altimeter wave heights using the WAM wave model. J. Geophys. Res. 97 C8 , 12671–12683.Behrenfeld, M.J., Falkowski, P.G., 1996. A consumers guide to phytoplankton primary productivity models.
Ž .Limnol. Oceanogr. 42 7 , 1479–1491.Bierwirth, N.P., Lee, T.J., Burne, R.V., 1993. Shallow sea-floor reflectance and water depth derived by
Ž .unmixing multispectral imagery. Photogramm. Eng. Remote Sens. 59 3 , 331–338.Breivik, L.A., Reistad, M., Schyberg, H., Sunde, J., 1996. Application of ocean surface wind and wave
information from ERS in atmosphere and ocean monitoring and numerical forecast models. Proceedings ofthe 2nd ERS Applications Workshop, London, 6–8 December, 1995. ESA Publications Division, Noord-wijk, The Netherlands, number ESA SP-383, 61–64.
Bricaud, A., Morel, A., Andre, J.M., 1987. Spatialrtemporal variability of algal biomass and potential´productivity in the Mauritanian upwelling zone, as estimated from CZCS data. Adv. Space 7.
Calkoen, C.J., 1996. ERS-1 survey Plaatgat. Technical Report A013, ARGOSS. The Netherlands.Calkoen, C.J., Wensink, G.J., 1993. Use of ERS-2 SAR to optimize ship-based bathymetric surveys in the
Waddenzee. Technical Report h 1985, Delft Hydraulics, Delft.Calkoen, C., Snoeij, P., van Halsema, D., Vogelzang, J., Oost, W.A., Jahne, B., 1991. Evaluation of a
two-scale model using extensive radar backscatter and wave measurements in a large wind-wave flume.Proceedings of the IGARSS ’91. pp. 885–888.
Carter, D.J.T., Challenor, P.G., Srokosz, M.A., 1992. An assessment of GEOSAT wave height and wind speedŽ .measurements. J. Geophys. Res. 97 C7 , 11383–11392.
Chapron, B., Elfouhaily, T., Kerbaol, V., 1995. Calibration and validation of ERS wave Mode Products.IFREMER Document, DROrOSr95-02.
Crombie, D.D., 1955. Doppler spectrum of sea echo at 13.56 Mcrs. Nature 175, 681–682.Curran, P.J., Novo, E.M.M., 1988. The relationship between suspended sediment concentration and remotely
Ž .sensed spectral radiance: a review. J. Coastal Res. 4 3 , 351–368.Dundas, I., Johannessen, O.M., Berge, G., Heimdal, B.R., 1989. Toxic algal bloom in Scandinavian waters,
Ž .May–June 1988. Oceanography 2 1 , 9–14.Durand, D., Bijaoui, J., Cauneau, F., 1998. Deriving sea-floor reflectance and water attenuation properties
Ž .from hyperspectral remote sensing of shallow-waters: an inverse scheme. In: Erim, A.A.M. Ed. ,Proceedings of the 5th ERIM International Conference on Remote Sensing for Marine and CoastalEnvironments. pp. I369–I376.

( )O.M. Johannessen et al.rCoastal Engineering 41 2000 155–176 173
Durand, D., Pozdnyakov, D., Sandven, S., Cauneau, F., Wald, L., Kloster, K., Miles, M., 1999. Characterisa-tion of inland and coastal waters with space sensors. Final report of CEO study. Technical Report No. 164.NERSC, Norway, 175 pp.
Engen, G., Johnsen, H., 1995. SAR — ocean wave inversion using image cross spectra. IEEE Trans. Geosci.Ž .Remote Sens. 33 4 , 1047–1056.
Espedal, H., 1998. Detection of oil spill and natural film in the marine environment by spaceborne SAR. PhDthesis, University of BergenrNERSC, Norway.
Espedal, H., Johannessen, O.M., 1999. Detection of oil spills near offshore installations using SAR. Int. J.Remote Sens., in press, Cover.
Estep, L., 1994. Bottom influence on the estimation of chlorophyll concentration in water remotely sensedŽ .data. Int. J. Remote Sens. 15 1 , 205–214.
Ž .Estep, L., Holloway, J., 1992. Estimators of bottom reflectance spectra. Int. J. Remote Sens. 13 2 , 393–397.Furnes, G.K., 1994. Discharges of produced water from production platforms in the north Sea. Technical
Report R-064641. Norsk Hydro, Bergen, Norway.Georges, T.M., Harlan, J.A., Lematta, R.A., 1996. Large-scale mapping of ocean surface currents with dual
over-the-horizon radars. Nature 379, 434–436.Gordon, H.R., Morel, A.Y., 1983. Remote assessment of ocean color for interpretation of satellite visible
Ž .imagery: a review. In: Barber, R., Mooers, C., Bowman, M., Zeitzschel, B. Eds. , Lecture Notes onCoastal and Estuarine Studies. Springer Verlag.
Gordon, H.R., Clark, D.K., Mueller, J.L., Hovis, W.A., 1980. Phytoplankton pigments from the Nimbus-7coastal zone color scanner: comparisons with surface measurements. Science 210, 63–66.
Graber, H.C., Thompson, D.R., Carande, R.E., 1996. Ocean surface features and currents measured withŽ .synthetic aperture radar interferometry and H.F. radar. J. Geophys. Res. 101 C11 , 25813–25832.
Guillaume, A., Mognard, M.N., 1992. A new method for the validation of altimeter-derived sea stateŽ .parameters with results from wind and wave models. J. Geophys. Res. 97 C6 , 9705–9717.
Harwar, M.D., Malthus, T.J., Dekker, A.G., Trueman, I.C., 1995. Reflectance from inland waters: modellingthe effects of varied non-living suspended sediment concentration on the spectral features attributed to
Ž .chlorophyll a. In: Curran, P.J., Robertson, C. Eds. , Proceedings of the RSS ’95 — 21st AnnualConference of the Remote Sensing Society, Southampton. pp. 466–473.
Hasselmann, K., Hasselmann, S., 1991. On the nonlinear mapping of an ocean wave spectrum into a SARŽ .image spectrum and its inversion. J. Geophys. Res. 96 C6 , 10713–10729.
Hasselmann, K., Shemdin, O.H., 1982. Remote sensing experiment MARSEN. Int. J. Remote Sens. 3,139–361.
Hesselmans, G.H.F.M., 1996. ERS-1 SAR survey Slijkat, Slijkgeul and Loswal Noord. Technical ReportA011, ARGOSS, The Netherlands.
Holligan, P.M., Fernandez, E., Aiken, J., Balch, W.M., Boyd, P., Burkill, P.H., Finch, M., Groom, S., Malin,G., Muller, K., Purdie, D.A., Robinson, C., Trees, C.C., Turner, S.M., Vanderwall, P., 1993. Abiochemical study of the coccolithophore, Emiliania huxleyi in the North Atlantic. Global Biogeochem.
Ž .Cycles 7 4 , 879–900.Ikeda, M., Dobson, F.W., 1995. Oceanographic Applications of Remote Sensing. CRC Press, Boca Raton.Johannessen, J.A., Svendsen, E., Sandven, S., Johanessen, O.M., Lygre, K., 1989. Three dimensional structure
of mesoscale eddies in the Norwegian Coastal Current. J. Phys. Oceanogr. 19, 3–19.Johannessen, J.A., Shuchmann, R., Johannessen, O.M., Davidson, K.L., Lyzenga, D.R., 1991. Synthetic
aperture radar imaging of upper ocean circulation features and wind fronts. J. Geophys. Res. 96,10411–10422.
Johannessen, J.A., Røed, L.P., Johannessen, O.M., Evensen, G., Hackett, B., Petterson, L.H., Haugan, P.M.,Sandven, S., Shuchman, R., 1993. Monitoring and modeling of the marine coastal environment. Pho-
Ž .togramm. Eng. Remote Sens. 59 3 , 351–361.Johannessen, J.A., Digranes, G., Espedal, H., Johannessen, O.M., Samuel, P., Browne, D., Vachon, P., 1994.
SAR Ocean Feature Catalogue. Publications Division, ESTEC, Noordwijk, The Netherlands, ESA-SP-1174,ISBN 92-9092-133-1.
Johannessen, J.A., Shuchman, R.A., Digranes, G., Wackerman, C., Johannessen, O.M., Lyzenga, D., 1996.Ž .Coastal ocean fronts and eddies imaged with ERS-1 SAR. J. Geophys. Res. 101 C3 , 6651–6667.

( )O.M. Johannessen et al.rCoastal Engineering 41 2000 155–176174
Johannessen, O.M., 1986. Brief overview of the physical oceanography. The Nordic Seas. Springer Verlag,New York, pp. 103–127, Chap. 4.
Johannessen, O.M., Pettersson, L.H., Bjørgo, E., Espedal, H., Evensen, G., Hamre, T., Jenkins, A., Kors-bakken, E., Samuel, P., Sandven, S., 1997. A review of the possible applications of earth observation data
Ž .within EuroGOOS. In: Stel, J., Behrens, H.W.A., Borst, J.C., Droppert, L.J., van der Meulen, J.P. Eds. ,Operational Oceanography — The Challenge for European Co-operation, Proceedings of the 1st Interna-tional Conference on EuroGOOS. Elsevier, pp. 192–205, ISBN 0-444-82892-3.
Kerbaol, V., Chapron, B., Elfouhaily, T., Garello, R., 1996. Fetch and wind dependence of SAR azimuthcutoff and higher order statistics in a Mistral wind case. Proceedings of IGARSS ’96, Lincoln, NE, USA,1996 May 27–31, Pisacataway, NJ.
Kerr, Y.H., 1998. SMOS: Soil Moisture and Ocean Salinity proposal to ESA Earth Opportunity Missions.November.
Korsbakken, E., Johannessen, J.A., 1996. Quantitative wind field retrievals from ERS-SAR images. Proceed-ings of the 3rd ERS Workshop, IFREMERrBREST, 1996 June 18–20.
Krogstad, H.E., Samset, O., Vachon, P.W., 1994. Generalizations of the nonlinear ocean-SAR transformationŽ .and a simplified SAR inversion algorithm. Atmos.-Ocean 32 1 , 61–82.
Lagerloef, G.S.E., Swift, C.T., LeVine, D.M., 1995. Sea surface salinity: the next remote sensing challenge.Oceanography 8, 44–50.
Lasnier, P., Loeul, S., Hajji, H., Bonicel, D., Charriez, P., 1996. Contribution of ERS data to Cliosat project,the Satellite Metocean Atlas. Proceedings of the 2nd ERS Applications Workshop, London, 6–8 Decem-ber, 1995. ESA Publications Division, Noordwijk, The Netherlands, pp. 65–73, number ESA SP-383.
Laur, H, Bally, P., Meadows, P., Sanchez, J., Schaettler, B., Lopinto, E., 1996. Derivation of the backscattercoefficient s 0 in ESA ERS SAR PRI products. Document No. ES-TN-RS-PM-HL09, Issue 2, Rev. 2,ESA ESRIN.
Lee, Z., Carder, K.L., Mobley, C.D., Steward, R.G., Patch, J.S., 1999. Hyperspectral remote sensing forŽ .shallow waters: 2. Deriving bottom depths and water properties by optimization. Appl. Opt. 38 18 ,
3831–3843.Le Meur, D., Roquet, H., Lefevre, J.-M., 1996. Use of ERS wind and wave data for numerical wave modelling
at Meteo-France. Proc. 2nd ERS Applications Workshop, London, 6–8 December, 1995. ESA PublicationsDivision, Noordwijk, The Netherlands, pp. 53–56, number ESA SP-383.
Lipa, B.J., Barrick, D.E., 1986. Tidal and storm-surge measurements with single-site CODAR. J. Oceanic Eng.Ž .OE-11 Special issue 2 , 241–245.
Lyzenga, D.R., 1978. Passive remote sensing techniques for mapping water depth and bottom features. Appl.Ž .Opt. 17 3 , 379–383.
Lyzenga, D.R., 1981. Remote sensing of bottom reflectance and water attenuation parameters in shallow waterŽ .using aircraft and Landsat data. Int. J. Remote Sens. 1 2 , 71–82.
Lyzenga, D.R., 1991. Synthetic aperture radar imaging of ocean circulation features and wind fronts. J.Geophys. Res. 96, 10411–10422.
Lyzenga, D.R., Bennett, J.R., 1988. Full spectrum modeling of SAR internal wave signatures. J. Geophys.Ž .Res. 93 C10 , 12345–12354.
Meadows, P.J., Willis, C.J., 1995. Derivation of radar cross section coefficient in UK-PAF ERS-1.SAR.PRIproducts. Technical Report, GEC-MARCONI Research Centre, UK.
Miller, J.L, Goodberlet, M.A., Zaitzeff, J.B., 1998. Airborne salinity mapper makes debut in coastal zone,EOS, Trans. AGU, 79, 173, and 176–177.
Monaldo, F., 1988. Expected differences between buoy and radar altimeter estimates of wind speed andŽ .significant wave height and their implications on buoy-altimeter comparisons. J. Geophys. Res. 93 C3 ,
2285–2302.Moore, G., Aiken, J., Lavender, S., 1999. The atmospheric correction of water colour and the quantitative
retrieval of suspended particulate matter in Case II waters: application to MERIS. Int. J. Remote Sens. 20Ž .9 , 1713–1733.
ŽMorel, A., 1988. Optical modeling of the upper ocean in relation to its biogenous matter content Case I. Ž .waters . J. Geophys. Res. 93 C9 , 10749–10768.
Morel, A., 1991. Light and marine photosynthesis: a model with geochemical and climatological implications.Prog. Oceanogr. 26, 301–342.

( )O.M. Johannessen et al.rCoastal Engineering 41 2000 155–176 175
Ž .Morel, A., Antoine, D., 1997. Pigment index retrieval in case I waters. Technical report MERIS ATBD 2.9 ,ESA, Frascati, Italy.
Ž .Morel, A., Prieur, L., 1977. Analysis and variations in ocean color. Limnol. Oceanogr. 22 4 , 709–722.NOAA, 1995. NOAA polar orbiter data user’s guide. http:rrwww2.ncdc.noaa.govrpodr.O’Reilley, J.E., Maritorena, S., Mitchell, B.G., Siegel, D.A., Carder, K.L., Garver, S.A., Kahru, M., McClain,
Ž .C., 1998. Ocean color chlorophyll algorithms for SeaWiFS. J. Geophys. Res. 103 C11 , 24937–24953.Paci, G., Campbell, G., 1996. Operational use of ERS-1 products in marine applications. Proc. 2nd ERS
Applications Workshop, London, 6–8 December, 1995. ESA Publications Division, Noordwijk, TheNetherlands, pp. 43–46, number ESA SP-383.
˚Pedersen, J.P., Seljelv, L.G., Strøm, G.D., Follum, O.A., Andersen, J.H., Wahl, T., Skøelv, A., 1996. Oil spilldetection by use of ERS SAR data. Proceedings of the 2nd ERS Application Workshop, London, UK,December 6–8, 1995. ESA SP-383, February.
Pettersson, L.H., 1990. Application of Remote Sensing to Fisheries. Vol. 1. Technical Report EUR 12867 EN,Commission of the European Communities. Joint Research Centre, Ispra, Italy.
Pettersson, L.H., 1995. Remote sensing of Coccolithophorid blooms: the European Emiliania huxleyiprogramme — EHUX. Final Report to CEC under Contract MAST-CT92-0038, CEC. Edited by R.Morris.
Pettersson, L.H., Durand, D., Johannessen, O.M., Svendsen, E., Soiland, H., 1999. Satellite observations andmodel predictions of toxic algae bloom. Proceedings of the 2nd International Conference on EuroGOOS,Rome March 10–13.
Platt, T., Sathyendranath, S., 1988. Oceanic primary production: estimation by remote sensing at local andregional scales. Science 241, 1613–1620.
Prandle, D., 1991. A new view of near-shore dynamics based on H.F. radar. Prog. Oceanogr. 27, 403–438.Puls, W., Doerffer, R., Sundermann, J., 1994. Numerical simulation and satellite observation of suspended
Ž .matter in the North Sea. IEEE J. Oceanic Eng. 19 1 , 3–9.Rufenach, C.L., Alpers, W.R., 1978. Measurement of ocean wave heights using the GEOS 3 altimeter. J.
Geophys. Res. 83, 5011–5018.Samuel, P., Johannessen, J.A., Johannessen, O.M., 1994. A study on the inflow of Atlantic water to the GIN
Sea using GEOSAT altimeter data. The Polar Oceans and Their Role in Shaping the Global Environment.American Geophysical Union, pp. 95–108.
Sathyendranath, S., Hoge, F.E., Platt, T., Swift, R.N., 1994. Detection of phytoplankton pigments from oceanŽ .color: improved algorithms. Appl. Opt. 33 6 , 1081–1089.
Schiller, H., Doerffer, R., 1999. Neural network for emulation of an inverse model — operational derivationŽ .of Case II water properties from MERIS data. Int. J. Remote Sens. 20 9 , 1735–1746.
Scoon, A., Robinson, T.S., Meadows, P.J., 1996. Demonstration of an improved calibration scheme for ERS-1Ž .SAR imagery using a scatterometer wind model. Int. J. Remote Sens. 17 2 , 413–418.
Shay, L.K., Graber, H.C., Ross, D.B., Chemi, L., Peters, N., Hargrove, J., Vakkayil, R., Chamberlain, L.,Ž .1993. Measurement of ocean surface currents using an H.F. Radar during HIRES-2 . Technical Report
93-007, Rosentiel School of Marine and Atmospheric Sciences, University of Miami.Shemer, L., 1993. Interferometric SAR imagery of a monochromatic ocean wave in the presence of the real
Ž .aperture radar modulation. Int. J. Remote Sens. 14 16 , 3005–3019.Smith, S.D., 1988. Coefficients for sea surface wind stress, heat flux and wind profiles as a function of wind
Ž .speed and temperature. J. Geophys. Res. 93 C12 , 15467–15472.Stoffelen, A.C.M., Anderson, D.L.T., 1993. ERS-1 scatterometer data characteristics and wind retrieval skill.
Proceedings of the 1st ERS-1 Symposium, Space at the Service of Our Environment, Cannes, France, 1992November 4–6. ESA SP-359.
Stoffelen, A., Anderson, D., 1997a. Scatterometer data interpretation: measurement space and inversion. J.Ž .Atmos. Oceanic Technol. 14 6 , 1298–1313.
Stoffelen, A., Anderson, D., 1997b. Scatterometer data interpretation: estimation and validation of the transferŽ .function CMOD4. J. Geophys. Res. 102 C3 , 5767–5780.
Stoffelen, A., Anderson, D., 1997c. Ambiguity removal and assimilation of scatterometer data. Q. J. R.Meteorol. Soc. 123, 491–518.
Stanev, E.V., 1994. Assimilation of sea surface temperature data in a numerical ocean circulation model. AŽ .study of the water mass formation. In: Brasseur, P.P., Nihoul, J.C.J. Eds. , Data Assimilation: Tools for

( )O.M. Johannessen et al.rCoastal Engineering 41 2000 155–176176
Modelling the Ocean in a Global Change Perspective vol. I19 Springer Verlag, Berlin, pp. 33–58, NATOASI.
Tanis, F., Bennett, J.R., Lyzenga, D.R., 1989. Physics of EOM. Technical Report. No. 028, ERIM, Ann Arbor,MI, USA.
Tassan, S., 1988. The effect of dissolved yellow substance on the quantitative retrieval of chlorophyll and totalŽ .suspended sediment concentrations from remote measurements of water colour. Int. J. Remote Sens. 9 4 ,
787–797.Vachon, P.W., Dobson, F.W., 1996. Validation of wind vector retrieval from ERS-1 SAR images over the
ocean. Global Atmos. Ocean Syst. 5, 177–187.Vachon, P.W., Johannessen, J.A., Browne, D., 1995. ERS-1 SAR images of atmospheric gravity waves. IEEE
Ž .Trans. Geosci. Remote Sens. 33 4 , 1014–1025.Vos, R.J., Schuttelaar, M., 1995. RESTWAQ, Data assessment, data-model integration and application to the
southern North Sea. Technical Report 95-19, BCRS, Delft, The Netherlands.Wackerman, C., Rufenach, C.L., Shuchman, R.A., Johannessen, J.A., Davidson, K., 1996. Wind vector
retrieval using ERS-1 synthetic aperture radar imagery. IEEE Trans. Geosci. Remote Sens. 34, 1343–1352.Witter, L.D., Chelton, B.D., 1991. A GEOSAT altimeter wind speed algorithm and a method for altimeter
Ž .wind speed algorithm development. J. Geophys. Res. 96 C5 , 8853–8860.Wu, J., 1993. Ripples and oceanic remote sensing. Proceedings of Environment ’93, Hong Kong University of
Science and Technology.Wu, X., Flather, R.A., Wolf, J., 1994. A third generation wave model of European continental shelf seas, with
depth and current refraction due to tides and surges and its validation using GEOSAT and buoymeasurements. Proudman Oceanographic Laboratory, Report No. 33.
Xia, L., 1993. A united model for quantitative remote sensing of suspended sediment concentration. Int. J.Ž .Remote Sens. 14 14 , 2665–2676.