sas profitability management...
TRANSCRIPT
SAS® ProfitabilityManagement 1.2.1Help

The correct bibliographic citation for this manual is as follows: SAS Institute Inc. 2007. SAS® Profitability Management 1.2.1 Help. Cary, NC: SAS Institute Inc.
SAS® Profitability Management 1.2.1 Help
Copyright © 2007, SAS Institute Inc., Cary, NC, USA
All rights reserved. Produced in the United States of America.
For a Web download or e-book: Your use of this publication shall be governed by the terms established by the vendor at the time you acquire this publication.
U.S. Government Restricted Rights Notice: Use, duplication, or disclosure of this software and related documentation by the U.S. government is subject to the Agreement with SAS Institute and the restrictions set forth in FAR 52.227-19, Commercial Computer Software-Restricted Rights (June 1987).
SAS Institute Inc., SAS Campus Drive, Cary, North Carolina 27513.
1st printing, October 2007
SAS® Publishing provides a complete selection of books and electronic products to help customers use SAS software to its fullest potential. For more information about our e-books, e-learning products, CDs, and hard-copy books, visit the SAS Publishing Web site at support.sas.com/pubs or call 1-800-727-3228.
SAS® and all other SAS Institute Inc. product or service names are registered trademarks or trademarks of SAS Institute Inc. in the USA and other countries. ® indicates USA registration.
Other brand and product names are registered trademarks or trademarks of their respective companies.

What's New Data Preview
Whenever you are working with a transaction table, dimensions table, or behavior table, you can view the first one thousand rows of data in the table. This feature enables you to verify the underlying data without leaving SAS Profitability Management.
Export Rules and Associations
You can export all rules and all associations. This feature enables you to easily move the rules and associations between models or between servers.
Audit Log
SAS Profitability Management maintains an audit log of the the changes to a model. The audit log enables you to determine the changes made, who made them, and when they were made.
Detailed Report Filtering
When filtering a detailed report, you can filter on specific dimensions and levels. This feature provides you further flexibility with detailed reports.
Enhanced Rule Matching
You can match fields between columns in a behavior table and a transaction table, instead of matching a single rule to a single row in a behavior table. This feature enables you to to create a single rule for a single type of field matching, which makes modeling much easier.
Table of Contents Quick Start
1. Populate the input directory
2. Set up the environment
3. Create a new profitability model
4. Define transaction table groups
5. Define rules
6. Calculate a model
7. Prepare reports
8. View reports
Tasks
Set Up the Environment
Populate the input directory
Identify input and output directories to SAS Profitability Management
Import tables into the input directory
Add users
Configure the server
View system information
Behaviors

Clear an association
Associate an assignment rule with a behavior
Import a rule association table
Copy an assignment rule to a new name
Cubes
Generate a cube
Edit the properties of a cube
Select the periods whose transaction tables are included in cubes
Define the display format for numbers
View a cube (summary report)
Format displayed numbers
Dimensions
Add a new period to the period dimensions table
Models
Create a new profitability model
Calculate a model
Edit a model
Rules
Add an assignment rule to a transaction table group
Import a rule definition table
Export a rule definition table
Associate an assignment rule with a behavior
Import a rule association table
Export a rule association table
Copy an assignment rule to a new name
Clear an association
Transactions
Define a transaction table group
Select the periods whose transaction tables are included in cubes
Define the display format for numbers
Reports
Define Reports
Define a summary report
Define a detailed report
Add labels to a report
Define the display format for numbers
View Summary Reports
Open a summary report
Drill into a summary report
Suppress the display of blank content
Select specific values to display
Change the number of rows or columns that are displayed
Change heading colors
Format displayed numbers
Insert a graph into a report
Save a view of a report
View Detailed Reports
Open a detailed report
Drill into a detailed report
Suppress the display of blank content
Reference
Index of terms
Menus and toolbars
The TRANASSIGN Procedure

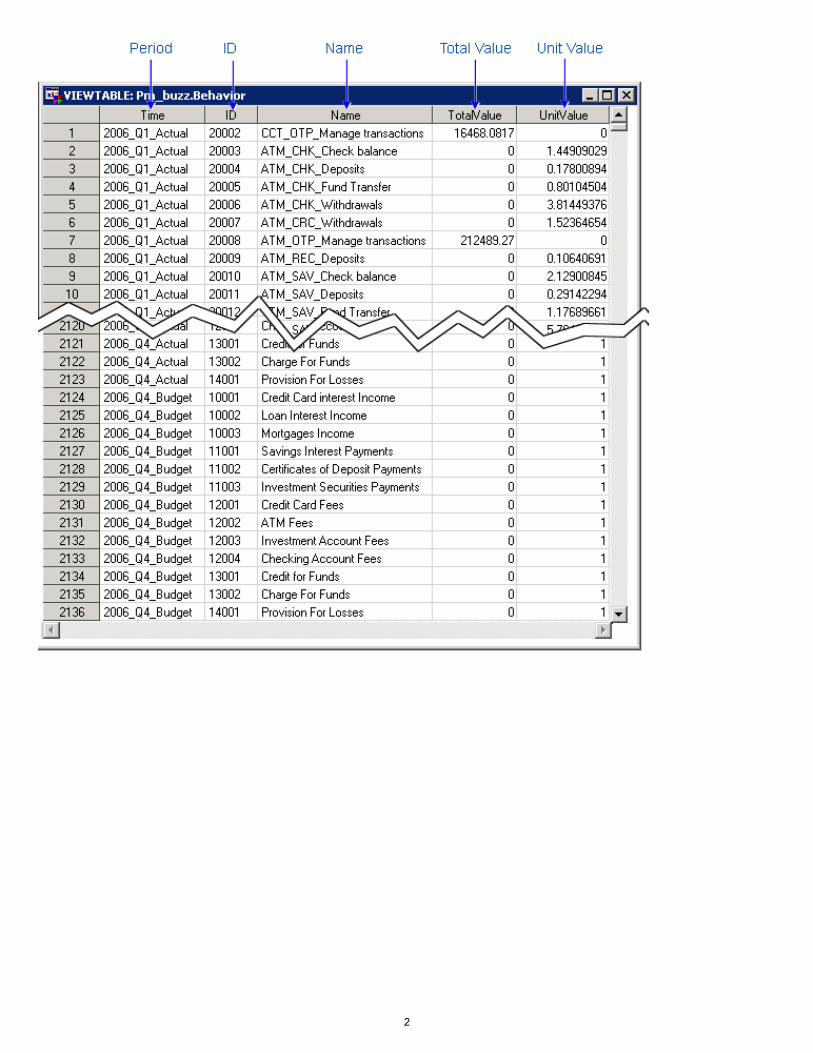
Behavior Table
The behavior table lists each source of a transaction cost with its appropriate values. A behavior table contains the following columns:
Position Name Maximum Length Description1 Time Char 32 The period for the transaction costs2 ID Char 32 The identifying reference for the behavior 3 Name Char 32 The name of the behavior4 Total Value Numeric 8 The total source amount that will be spread5 Unit Value Numeric 8 The unit cost for each transaction with this source
In a behavior table, consider the following rules:
● The columns must appear in the order that is shown.
● Each column must have the length that is shown.
● The name of the column is arbitrary.
Note: Only one of the Unit Value and Total Value columns can contain a non-zero value for any row of the behavior table.
The following picture shows a sample behavior table:
1
2

6. Calculate a Model
Calculating a model takes the transaction tables in your input directory, applies assignment rules in the model to make calculations, and stores the calculation results in columns that are appended to your transaction tables in the output directory.
1. In any workspace, select a model.
2. Select Actions Calculate Model. The Calculate wizard opens.
3. On the Period Information page, select the periods to calculate, and then click Next. Note: Because each transaction table is associated with one period, when you recalculate a model, you do not need to recalculate all of the transaction tables. For example, you can calculate January, and then February as a separate calculation. You do not need to process a single period's transaction table more than once as the months proceed through the year.
4. On the Table Groups page, select the table groups to include in the calculation, and then click Next.
5. On the Cube Generation page, select the cubes to generate, and then click Next.
6. On the Concurrent Sessions page, select the number of concurrent sessions to run, and then click Finish. A progress window appears. Note: The progress window appears only if you have previously generated cubes for this model.
7. When the calculation finishes, click Details to view the message log.
3

Calculate a Model
1. In any workspace, select a model.
2. Select Actions Calculate Model. The Calculate wizard opens.
3. On the Period Information page, select the periods to calculate, and then click Next. Note: Because each transaction table is associated with one and only one period, when you recalculate a model you do not need to recalculate all of the transaction tables. For example, you can calculate January and then February as a separate calculation. You never need to process a single period's transaction table more than once as the months proceed through the year.
4. On the Table Groups page, select the table groups to include in the calculation, and then click Next.
4

5. On the Cube Generation page, select the cubes to generate, and then click Next.
6. On the Concurrent Sessions page, select the number of concurrent sessions to run, and then click Finish. A progress window appears.
5
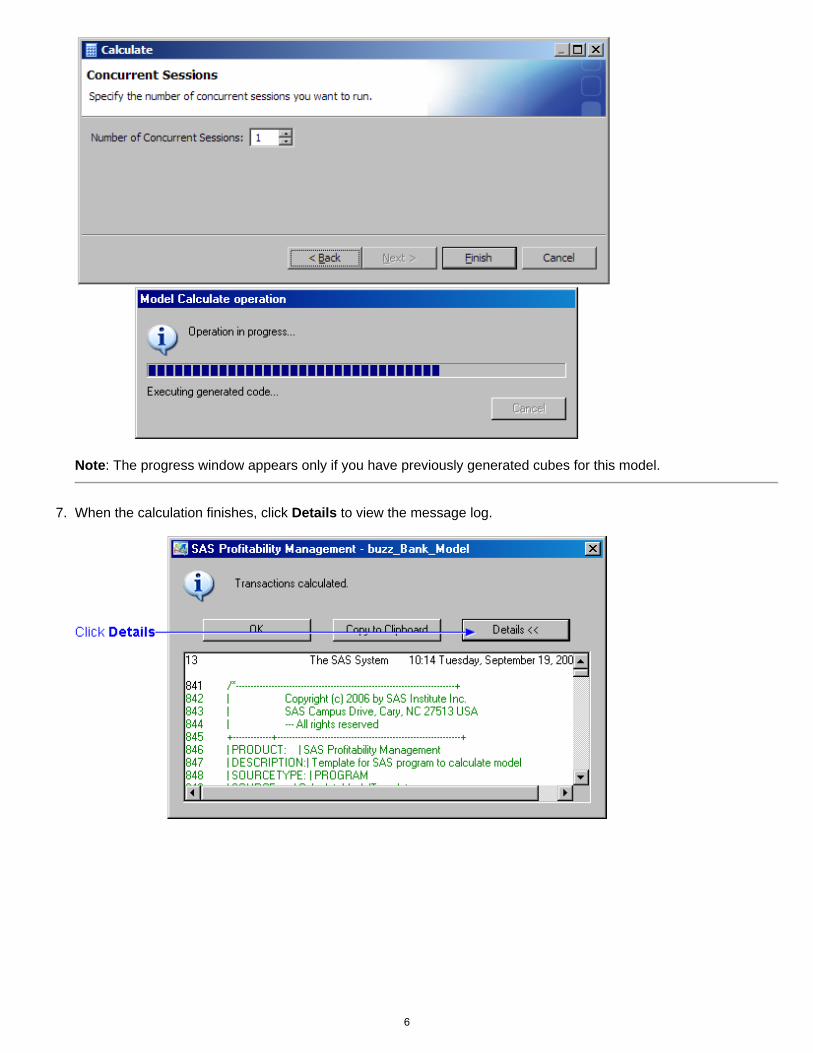
Note: The progress window appears only if you have previously generated cubes for this model.
7. When the calculation finishes, click Details to view the message log.
6
7
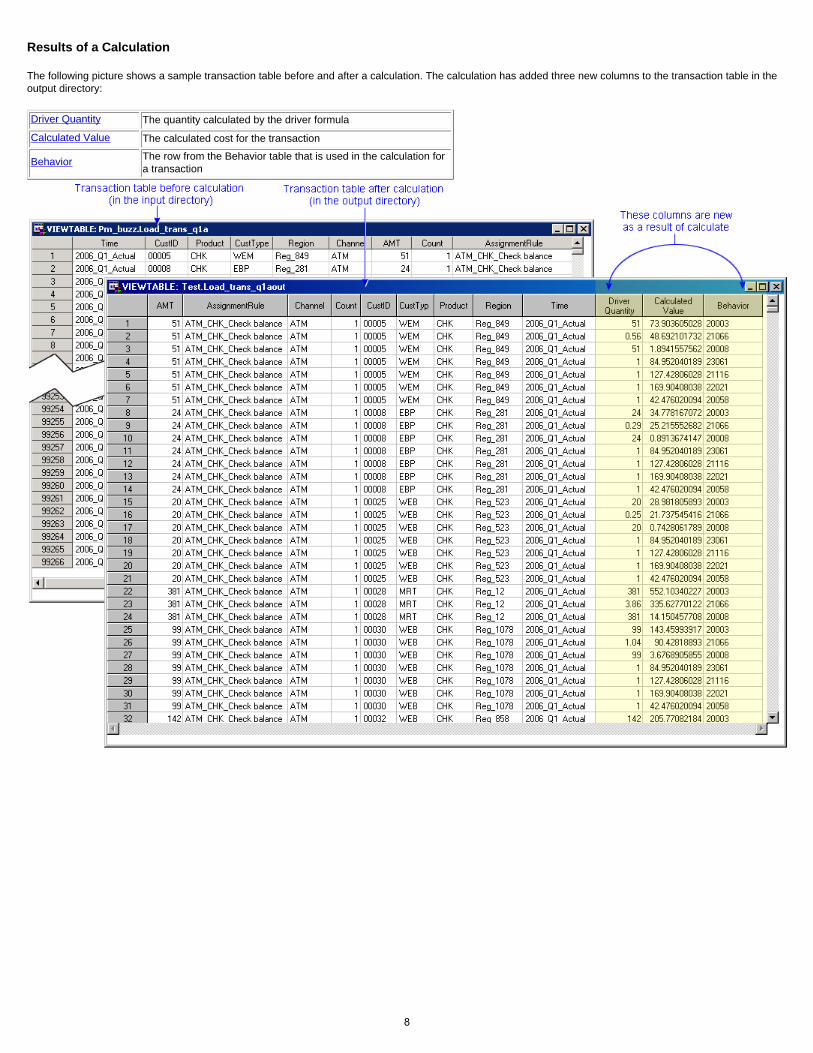
Results of a Calculation
The following picture shows a sample transaction table before and after a calculation. The calculation has added three new columns to the transaction table in the output directory:
Driver Quantity The quantity calculated by the driver formula
Calculated Value The calculated cost for the transaction
Behavior The row from the Behavior table that is used in the calculation for a transaction
8
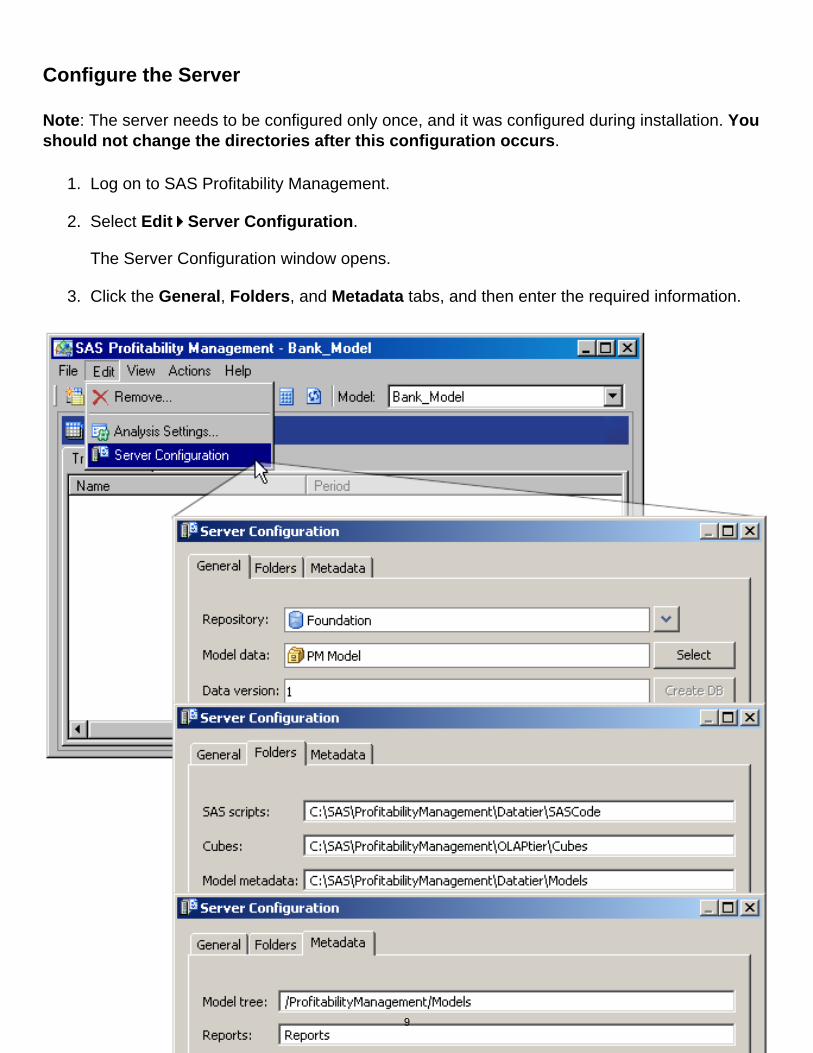
Configure the Server
Note: The server needs to be configured only once, and it was configured during installation. You should not change the directories after this configuration occurs.
1. Log on to SAS Profitability Management.
2. Select Edit Server Configuration. The Server Configuration window opens.
3. Click the General, Folders, and Metadata tabs, and then enter the required information.
9

10
Edit the Properties of a Cube
To edit the properties for a cube, perform the following steps:
1. Activate the Transactions workspace, and then select a model.
2. Click Change analysis settings, or select Edit Analysis Settings. The Analysis Settings windows opens.
3. Click the Periods tab to select which periods to include in the generated cube.
Note: The periods that you select to include in a cube must have been previously selected for calculation when you calculated the model.
4. Click the Measures tab to define the display format for numbers.
Note: You can also change the display format for numbers in the SAS Profitability Management Web Reporting Client.
11

Generate a Cube
To generate a cube, perform one of the following steps:
● Activate the Reports workspace. Select a summary report, and then click Generate cube, or select Actions Generate Cube.
● Follow the process to calculate a model. During that process, you can generate a cube.
12
View a Cube (Summary Report)
● Open a summary report
● Drill into a summary report
● Suppress the display of blank content
● Select specific values to display
● Change the number of rows or columns that are displayed
● Change heading colors
● Format displayed numbers
● Insert a graph
● Save a view of a report
13
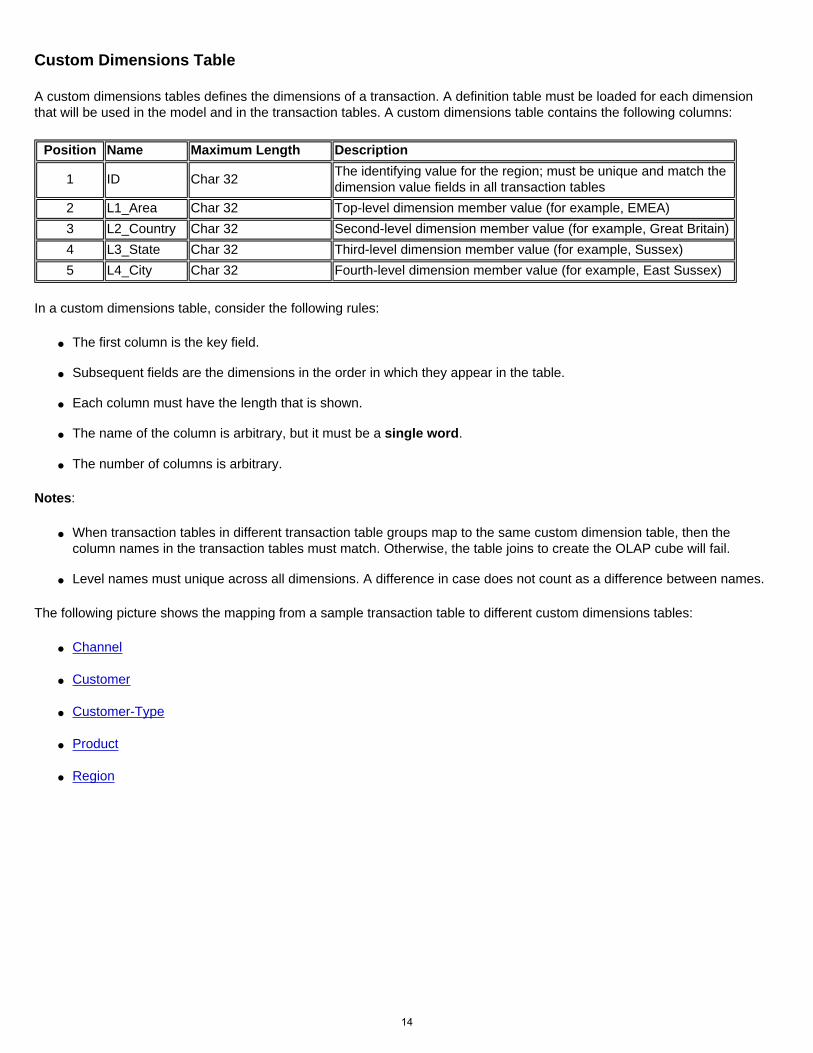
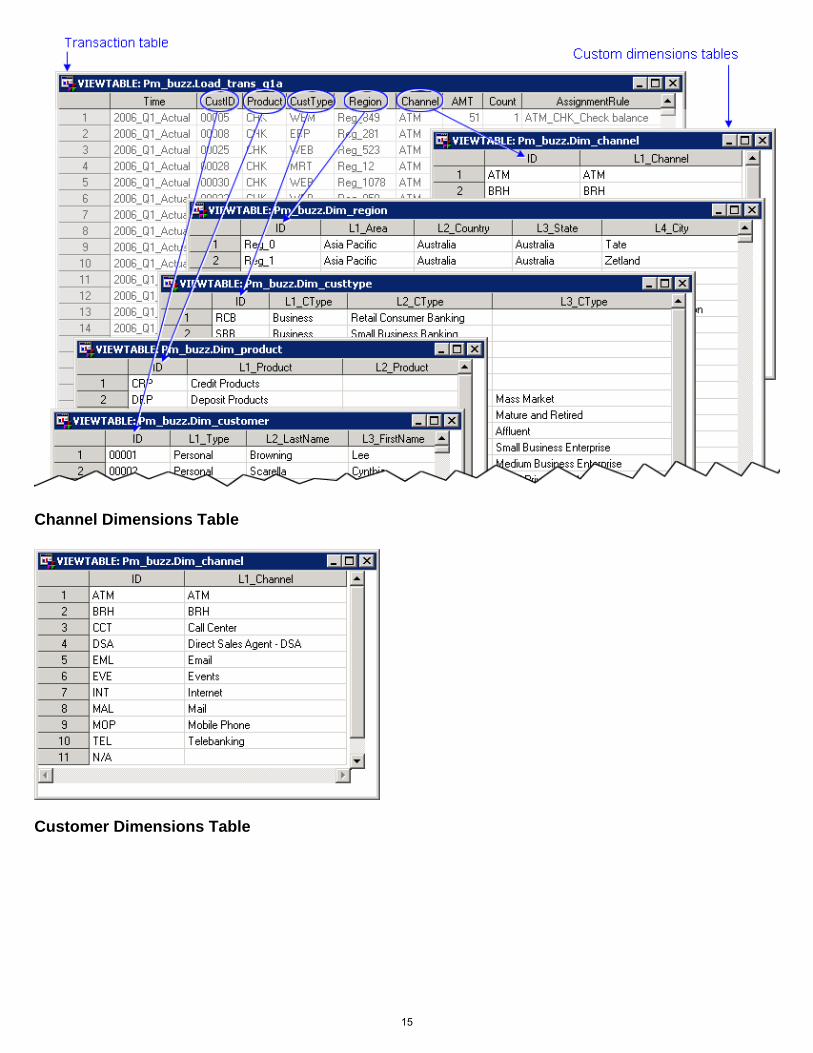
Custom Dimensions Table
A custom dimensions tables defines the dimensions of a transaction. A definition table must be loaded for each dimension that will be used in the model and in the transaction tables. A custom dimensions table contains the following columns:
Position Name Maximum Length Description
1 ID Char 32 The identifying value for the region; must be unique and match the dimension value fields in all transaction tables
2 L1_Area Char 32 Top-level dimension member value (for example, EMEA)3 L2_Country Char 32 Second-level dimension member value (for example, Great Britain) 4 L3_State Char 32 Third-level dimension member value (for example, Sussex) 5 L4_City Char 32 Fourth-level dimension member value (for example, East Sussex)
In a custom dimensions table, consider the following rules:
● The first column is the key field.
● Subsequent fields are the dimensions in the order in which they appear in the table.
● Each column must have the length that is shown.
● The name of the column is arbitrary, but it must be a single word.
● The number of columns is arbitrary.
Notes:
● When transaction tables in different transaction table groups map to the same custom dimension table, then the column names in the transaction tables must match. Otherwise, the table joins to create the OLAP cube will fail.
● Level names must unique across all dimensions. A difference in case does not count as a difference between names.
The following picture shows the mapping from a sample transaction table to different custom dimensions tables:
● Channel
● Customer
● Customer-Type
● Product
● Region
14
Channel Dimensions Table
Customer Dimensions Table
15

Customer-Type Dimensions Table
Product Dimensions Table 16

Region Dimensions Table
17

Drill into a Detail Report
● Drill by columns
● Drill by rows
Drill by Columns
Drill down into the columns to see more detail in the period dimension.
Drill by Rows
Drill down into the rows to see more detail about the contributing costs.
18
19

Open a Detail Report
Use the SAS Profitability Management Web Reporting Client to select a detail report for viewing. The report is viewed with the SAS Web OLAP Viewer. To view a detail report, perform the following steps:
1. Log on to the SAS Profitability Management Web Reporting Client. User IDs and passwords were established during installation. The exact URL to use depends on your server installation. A sample URL is the following:
http://profitmgmt:8080/SASProfitability/LogonCreate.do
2. Click the Detail Reports tab.
3. Select a model.
4. Select the dimension to view.
5. Specify a value of the dimension to search for, and then click View.
Note: The text that is entered into the Search For field is case sensitive.
6. The detail report is displayed in the SAS Web OLAP Viewer.
20

21
Driver Formula
An assignment rule uses its driver formula in a calculation is based on whether the behavior table contains a unit value or a total value.
Unit Value
When a row in a behavior table contains a unit value, the driver formula calculates the number of units that are involved in each transaction that is selected by the selection criteria. Then, the cost per transaction (value) is determined by multiplying the number of units by the unit cost (in the behavior table) of the transaction.
Show an example
Total Value
When a row in a behavior table contains a total value, the driver formula calculates the number of units that are involved in each transaction that is selected by the selection criteria. Then, the cost per transaction is determined in the following way:
1. The total number of units for all transactions (selected by the selection criteria) is calculated by adding the number of units (as determined by the driver formula) for each transaction (selected by the selection criteria).
2. The cost per unit is calculated by dividing the total value (in the row in the behavior table) by the total number of units.
3. The cost for each transaction (value) is calculated by multiplying the cost per unit by the number of units (as determined by the driver formula) for that transaction.
Show an example
22
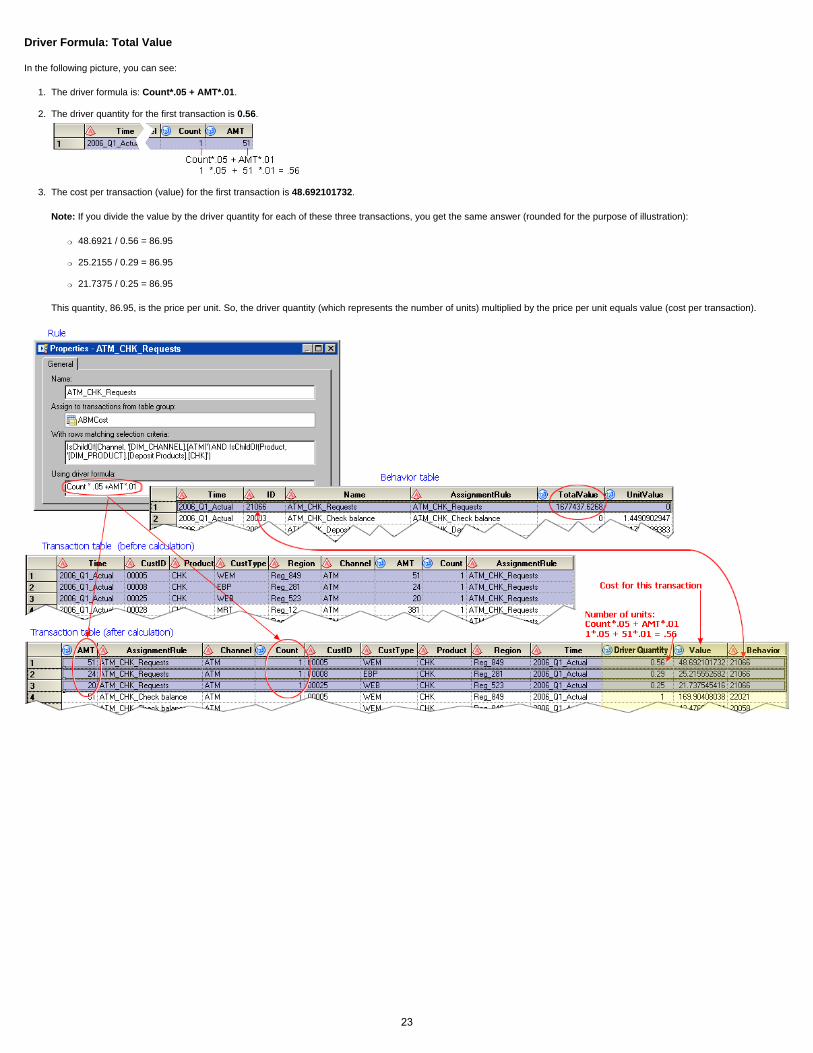
Driver Formula: Total Value
In the following picture, you can see:
1. The driver formula is: Count*.05 + AMT*.01.
2. The driver quantity for the first transaction is 0.56.
3. The cost per transaction (value) for the first transaction is 48.692101732.
Note: If you divide the value by the driver quantity for each of these three transactions, you get the same answer (rounded for the purpose of illustration):
❍ 48.6921 / 0.56 = 86.95
❍ 25.2155 / 0.29 = 86.95
❍ 21.7375 / 0.25 = 86.95
This quantity, 86.95, is the price per unit. So, the driver quantity (which represents the number of units) multiplied by the price per unit equals value (cost per transaction).
23

Driver Formula: Unit Value
In the following picture, you can see:
1. The driver formula isCount.
2. The driver quantity for the first transaction is 51.
3. The cost per transaction (value) for the first transaction is 73.9036050297. This represents the number of units (51) multiplied by the unit value from the behavior table (1.4490902947).
So, the driver quantity (which represents the number of units) multiplied by the price per unit equals value (cost per transaction).
24

Driver Quantity
Driver quantity is the number of units calculated by the driver formula. The calculation is based on whether the behavior table row that is accessed by an assignment rule contains a unit value or a total value.
Unit Value
When a row in a behavior table contains a unit value, the driver formula calculates the number of units that are involved in each transaction that is selected by the selection criteria. The number of units appears in the Driver quantity field. Then, the cost per transaction (value) is determined by multiplying the number of units (driver quantity) by the unit cost (in the behavior table) of the transaction.
Show an example
Total Value
When a row in a behavior table contains a total value, the driver formula calculates the number of units that are involved in each transaction that is selected by the selection criteria. Then, the cost per transaction is determined in the following way:
1. The total number of units for all transactions (selected by the selection criteria) is calculated by adding the number of units (as determined by the driver formula) for each transaction (selected by the selection criteria). The number of units for each transaction appears in the Driver quantity field.
2. The cost per unit is calculated by dividing the total value (in the row in the behavior table) by the total number of units.
3. The cost for each transaction (value) is calculated by multiplying the cost per unit by the number of units (as determined by the driver formula) for that transaction.
Show an example
25
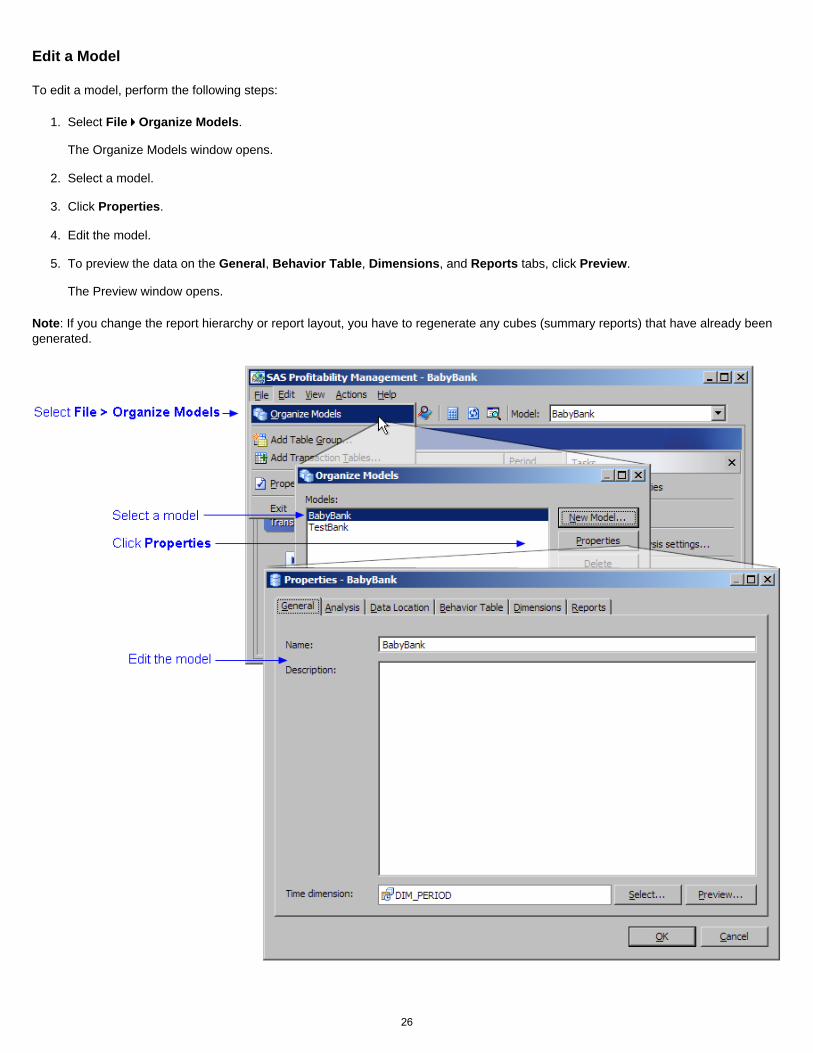
Edit a Model
To edit a model, perform the following steps:
1. Select File Organize Models. The Organize Models window opens.
2. Select a model.
3. Click Properties.
4. Edit the model.
5. To preview the data on the General, Behavior Table, Dimensions, and Reports tabs, click Preview. The Preview window opens.
Note: If you change the report hierarchy or report layout, you have to regenerate any cubes (summary reports) that have already been generated.
26

Export a Rule Association Table
1. Activate the Behaviors workspace, and then select the model from which you want to export the rule associations.
2. Select Actions Export Associations. The Export Associations window opens.
3. Name the export table.
4. Click Select to select a library in which to store the export table. The Select Table window opens. Select a library, and then click OK.
5. Click OK.
Related Topics:
● Import a rule association table
27

Export a Rule Definition Table
1. Activate the Rules workspace, and then select the model from which you want to export the rule definitions.
2. Select Actions Export Assignment Rules. The Export Rules window opens.
3. Name the export table.
4. Click Select to select a library in which to store the export table. The Select Table window opens. Select a library, and then click OK.
5. Click OK.
Related Topics:
● Import a rule definition table
28

Filter by the Value of One or More Dimensions
You can select all rows in a transaction table that have one or more columns whose value matches (or doesn't match) values in dimension tables.
In the following picture, the selection criterion IsChildOf(Channel, '[DIM_CHANNEL].[ATM]') AND IsChildOf(Product, '[DIM_PRODUCT].[Deposit Products].[CHK]') selects the first several rows in the transaction table:
Notice that the IsChildOf property allows you to select from any point in a dimension hierarchy tree, and all children of that hierarchy are filtered as a "Yes" value.
29
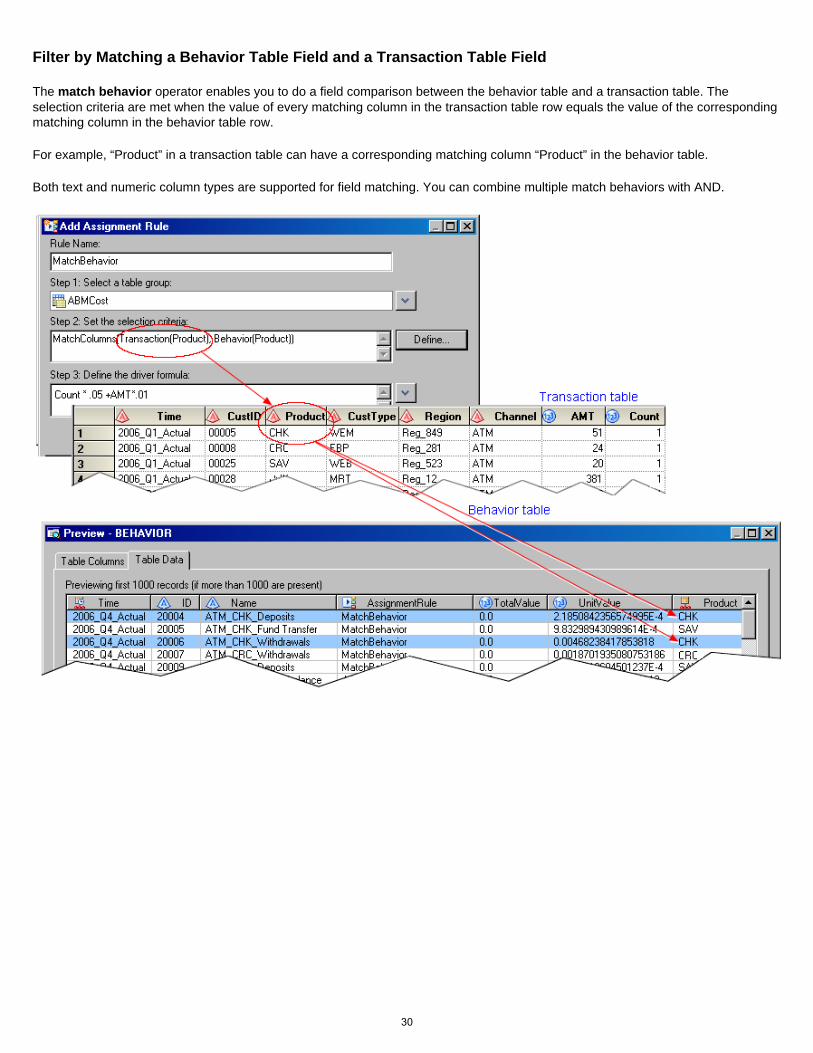
Filter by Matching a Behavior Table Field and a Transaction Table Field
The match behavior operator enables you to do a field comparison between the behavior table and a transaction table. The selection criteria are met when the value of every matching column in the transaction table row equals the value of the corresponding matching column in the behavior table row.
For example, “Product” in a transaction table can have a corresponding matching column “Product” in the behavior table.
Both text and numeric column types are supported for field matching. You can combine multiple match behaviors with AND.
30
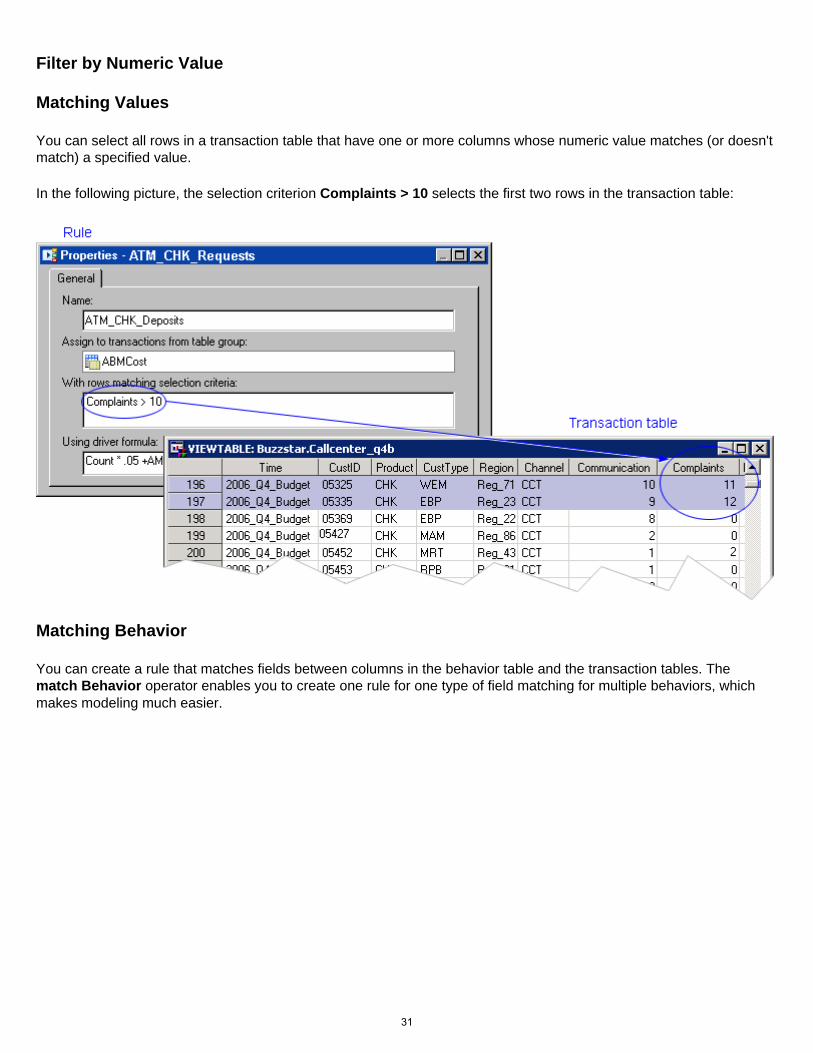
Filter by Numeric Value
Matching Values
You can select all rows in a transaction table that have one or more columns whose numeric value matches (or doesn't match) a specified value.
In the following picture, the selection criterion Complaints > 10 selects the first two rows in the transaction table:
Matching Behavior
You can create a rule that matches fields between columns in the behavior table and the transaction tables. The match Behavior operator enables you to create one rule for one type of field matching for multiple behaviors, which makes modeling much easier.
31
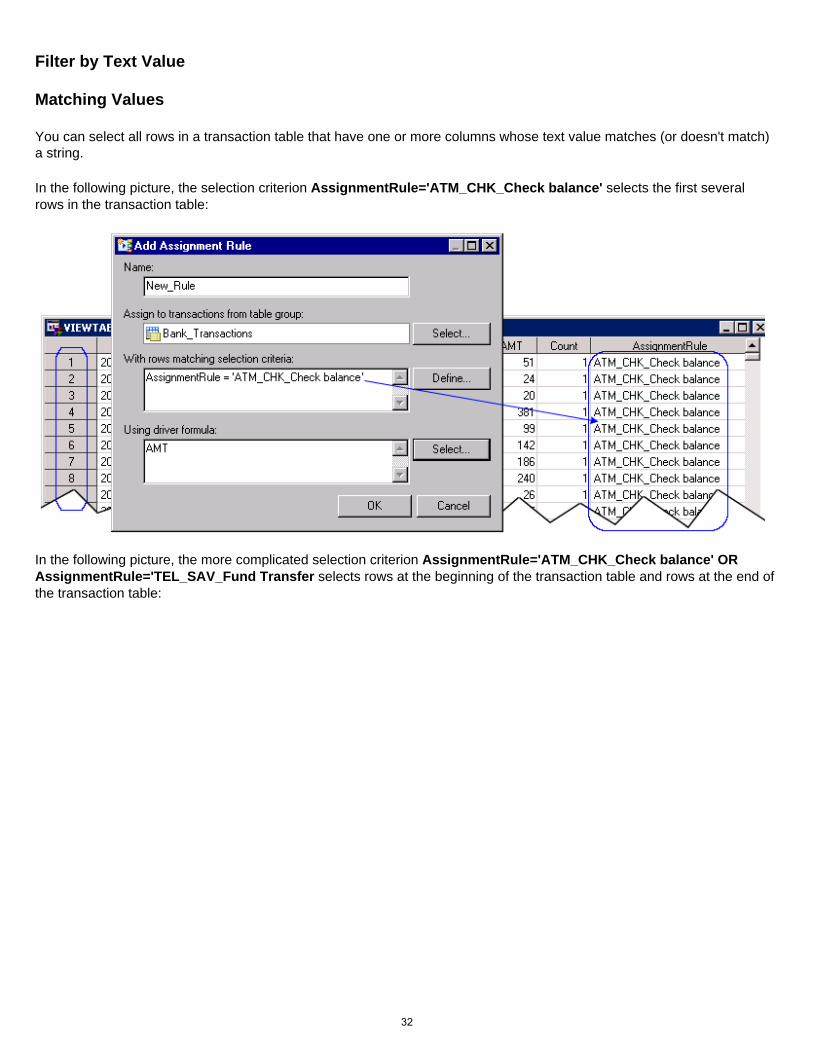
Filter by Text Value
Matching Values
You can select all rows in a transaction table that have one or more columns whose text value matches (or doesn't match) a string.
In the following picture, the selection criterion AssignmentRule='ATM_CHK_Check balance' selects the first several rows in the transaction table:
In the following picture, the more complicated selection criterion AssignmentRule='ATM_CHK_Check balance' OR AssignmentRule='TEL_SAV_Fund Transfer selects rows at the beginning of the transaction table and rows at the end of the transaction table:
32
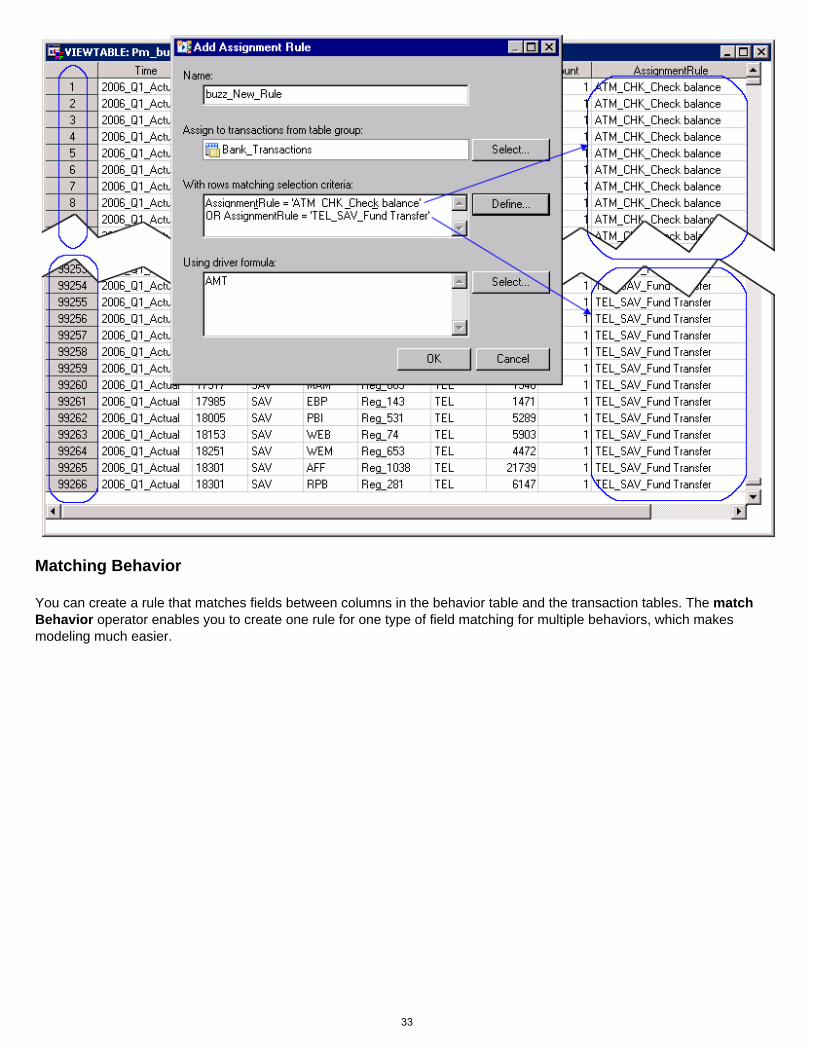
Matching Behavior
You can create a rule that matches fields between columns in the behavior table and the transaction tables. The match Behavior operator enables you to create one rule for one type of field matching for multiple behaviors, which makes modeling much easier.
33

2. Set Up the Environment
● Identify input and output directories to SAS Profitability Management
● Import tables into the input directory
● Add users
● Configure the server
34
Identify Input and Output Directories to SAS Profitability Management
This process needs to be performed for both the input and output directories.
1. Log on to the SAS Management Console. The main window opens.
2. Select the Foundation repository.
3. Expand Data Library Manager.
4. Right-click SAS Libraries.
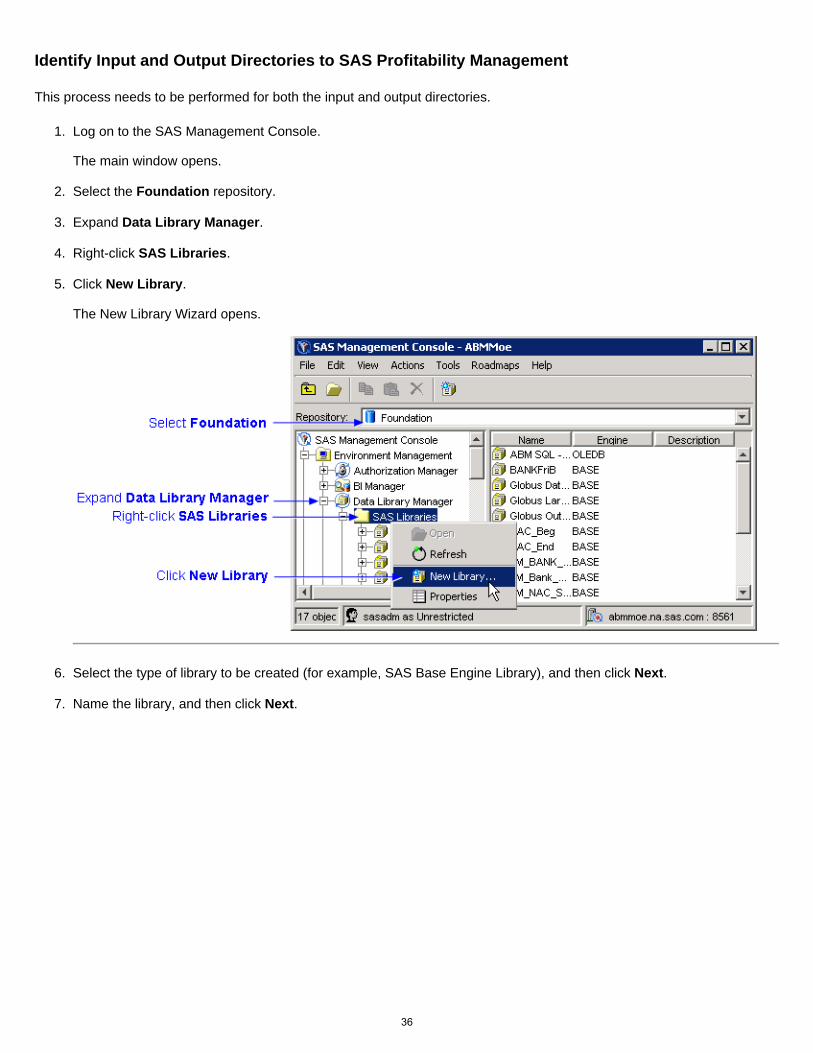
5. Click New Library. The New Library Wizard opens.
6. Select the type of library to be created (for example, SAS Base Engine Library), and then click Next.
7. Name the library, and then click Next.
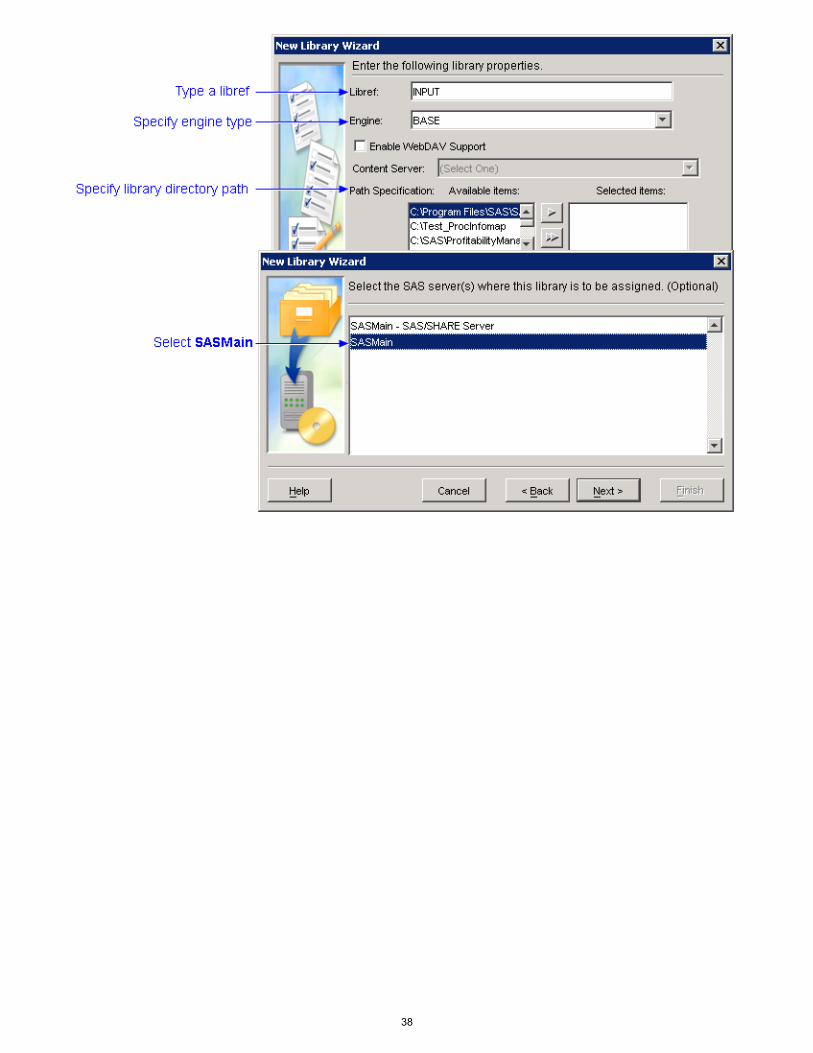
8. Type a libref name (the name you use to refer to the library). The libref name must be less than eight characters.
9. Specify BASE as the engine type.
10. Specify the library directory path, and then click Next.
11. Select SASMain as the server where the library is to be assigned.
12. Click Next, and then click Finish.
13. Select View Refresh to see the library listed.
35
Identify Input and Output Directories to SAS Profitability Management
This process needs to be performed for both the input and output directories.
1. Log on to the SAS Management Console. The main window opens.
2. Select the Foundation repository.
3. Expand Data Library Manager.
4. Right-click SAS Libraries.
5. Click New Library. The New Library Wizard opens.
6. Select the type of library to be created (for example, SAS Base Engine Library), and then click Next.
7. Name the library, and then click Next.
36
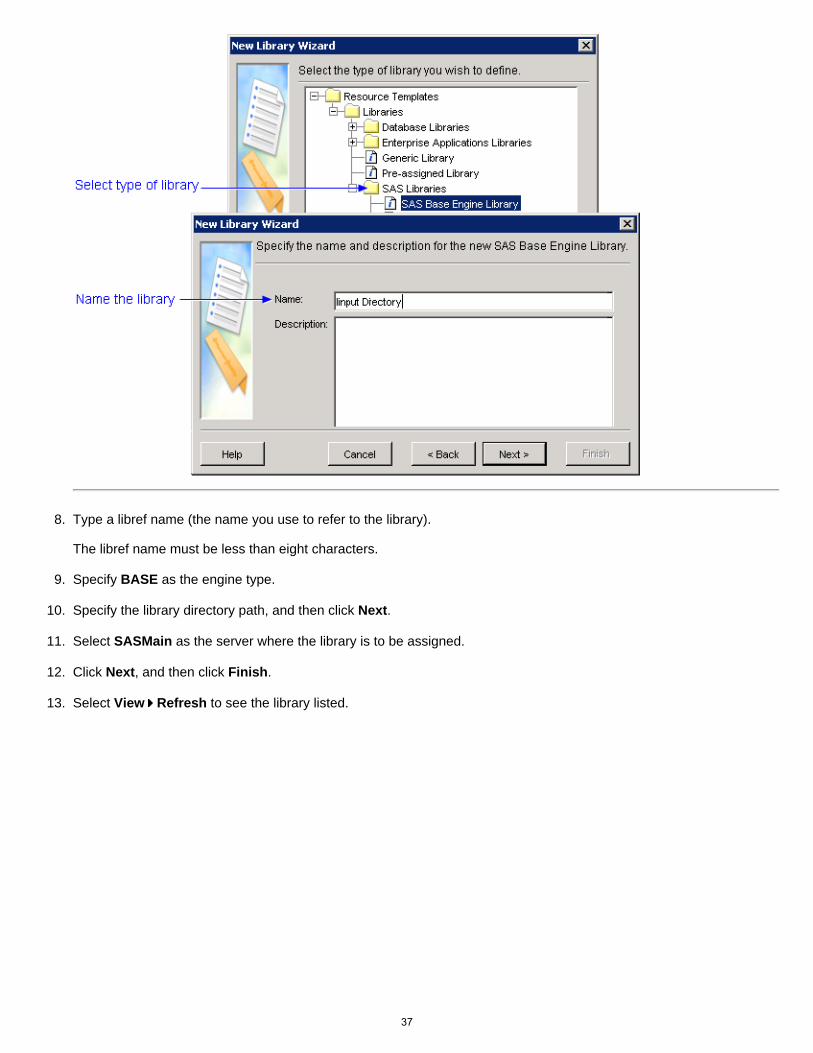
8. Type a libref name (the name you use to refer to the library). The libref name must be less than eight characters.
9. Specify BASE as the engine type.
10. Specify the library directory path, and then click Next.
11. Select SASMain as the server where the library is to be assigned.
12. Click Next, and then click Finish.
13. Select View Refresh to see the library listed.
37
38
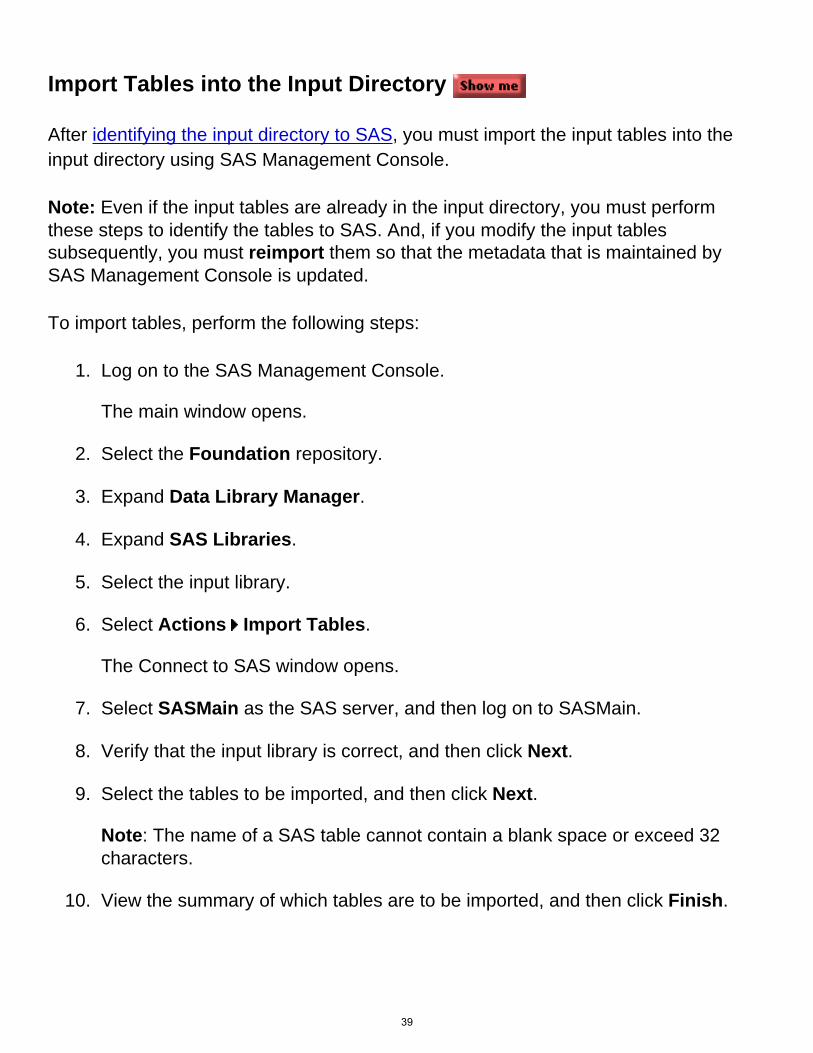
Import Tables into the Input Directory
After identifying the input directory to SAS, you must import the input tables into the input directory using SAS Management Console.
Note: Even if the input tables are already in the input directory, you must perform these steps to identify the tables to SAS. And, if you modify the input tables subsequently, you must reimport them so that the metadata that is maintained by SAS Management Console is updated.
To import tables, perform the following steps:
1. Log on to the SAS Management Console. The main window opens.
2. Select the Foundation repository.
3. Expand Data Library Manager.
4. Expand SAS Libraries.
5. Select the input library.
6. Select Actions Import Tables. The Connect to SAS window opens.
7. Select SASMain as the SAS server, and then log on to SASMain.
8. Verify that the input library is correct, and then click Next.
9. Select the tables to be imported, and then click Next. Note: The name of a SAS table cannot contain a blank space or exceed 32 characters.
10. View the summary of which tables are to be imported, and then click Finish.
39
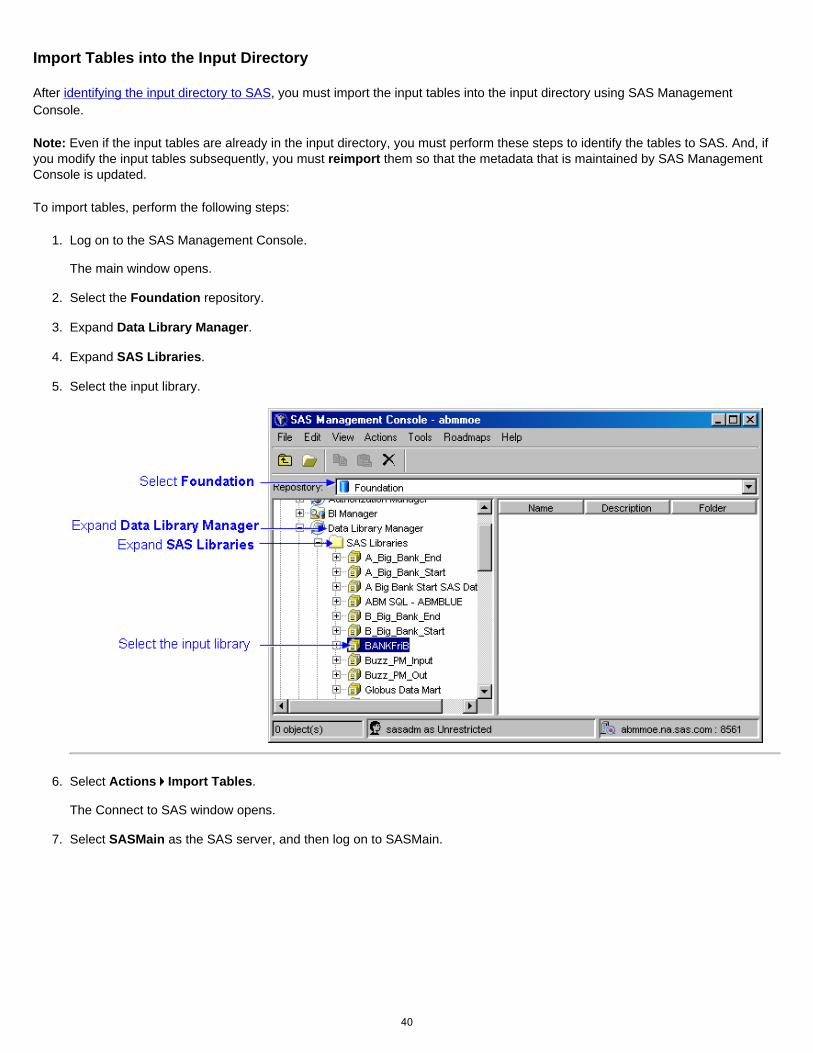
Import Tables into the Input Directory
After identifying the input directory to SAS, you must import the input tables into the input directory using SAS Management Console.
Note: Even if the input tables are already in the input directory, you must perform these steps to identify the tables to SAS. And, if you modify the input tables subsequently, you must reimport them so that the metadata that is maintained by SAS Management Console is updated.
To import tables, perform the following steps:
1. Log on to the SAS Management Console. The main window opens.
2. Select the Foundation repository.
3. Expand Data Library Manager.
4. Expand SAS Libraries.
5. Select the input library.
6. Select Actions Import Tables. The Connect to SAS window opens.
7. Select SASMain as the SAS server, and then log on to SASMain.
40

8. Verify that the input library is correct, and then click Next.
9. Select the tables to be imported, and then click Next. Note: The name of a SAS table cannot contain a blank space or exceed 32 characters.
10. View the summary of which tables are to be imported, and then click Finish.
41

42

Rule Association Table
A rule association table associates rules with behaviors. Because an assignment rule selects rows from the transaction tables in a transaction table group, the ultimate effect of a rule association table is associating each behavior with a set of rows. A rule association table contains the following columns:
Name Maximum Length DescriptionBehaviorID Char 32 The identifying value for the behavior BehaviorName Char 255 Optional field; the name of the behavior Table Group Char 64 Defined transaction table group for the rule that is applied
AssignmentRule Char 64 The name for the assignment rule; must be unique within the model
In a rule association table, consider the following rules:
● The columns must appear in the order that is shown.
● The columns must have the length that is shown.
● The order of the columns is arbitrary.
● The column name is arbitrary.
● If any column is blank, it is an error and the row is not imported.
● If the assignment rule name is not found, it is an error and the row is not imported.
● If the table group name is not found, it is an error and the row is not imported.
● If an association already exists for a behavior, the new association in the import table replaces the existing association.
The following picture shows a sample rule association table that can be imported into a model.
43

Related Topics:
● Import a rule definition table
● Import a rule association table
● Rule definition table
44

Rule Definition Table
An assignment rule associates rows in a group of transaction tables with behaviors. An assignment rule:
● is associated with one or more rows in a behavior table (the associations can be done interactively using the SAS Profitability Management GUI, or can be imported from a file that specifies the associations).
● specifies which rows in a transaction table group to include in the calculation.
● specifies what quantity to include in the calculation.
A rule definition table contains the following columns:
Name Maximum Length Description
Table Group Name Char 64 The name of the transaction table group in the model in which the assignment rule will be applied
Name Char 64 The name for the assignment rule; this must be unique within the model
Selection Criteria Char 1024 The formula defining the filter logic Driver Formula Char 1024 The formula defining the calculated quantity
In a rule definition table, consider the following rules:
● The columns must have the length that is shown.
● The order of the columns is arbitrary.
● The column name is arbitrary.
● If any column is blank, it is an error and the row is not imported.
● If an assignment rule with the name already exists, it is an error and the row is not imported.
● If the table group name is not found, it is an error and the row is not imported.
Related Topics:
● Import a rule definition table
● Import a rule association table
● Rule association table
45
Index of Terms
● Assignment rule
● Behavior table
● Calculated value
● Custom dimensions table
● Detail report
● Driver formula
● Driver quantity
● Profitability model
● Period dimensions table
● Report hierarchy table
● Report layout table
● Rule association table (for importing)
● Rule definition table (for importing)
● Summary report
● Transaction table
● Transaction table group
● Unit value/Total value
● Value
46

Add Labels to a Report
You can add labels to your reports. For each label, add a row that contains the following data to the report layout table:
1. The id field, which is a string. The string is arbitrary but must be unique and cannot occur elsewhere in the ID field of either the report layout table or the report hierarchy table.
2. The name field, which is a string that is the label. The maximum length is 32 characters.
3. The formula field, which contains "."
The following picture shows a report layout table with labels and the resulting report:
47

48
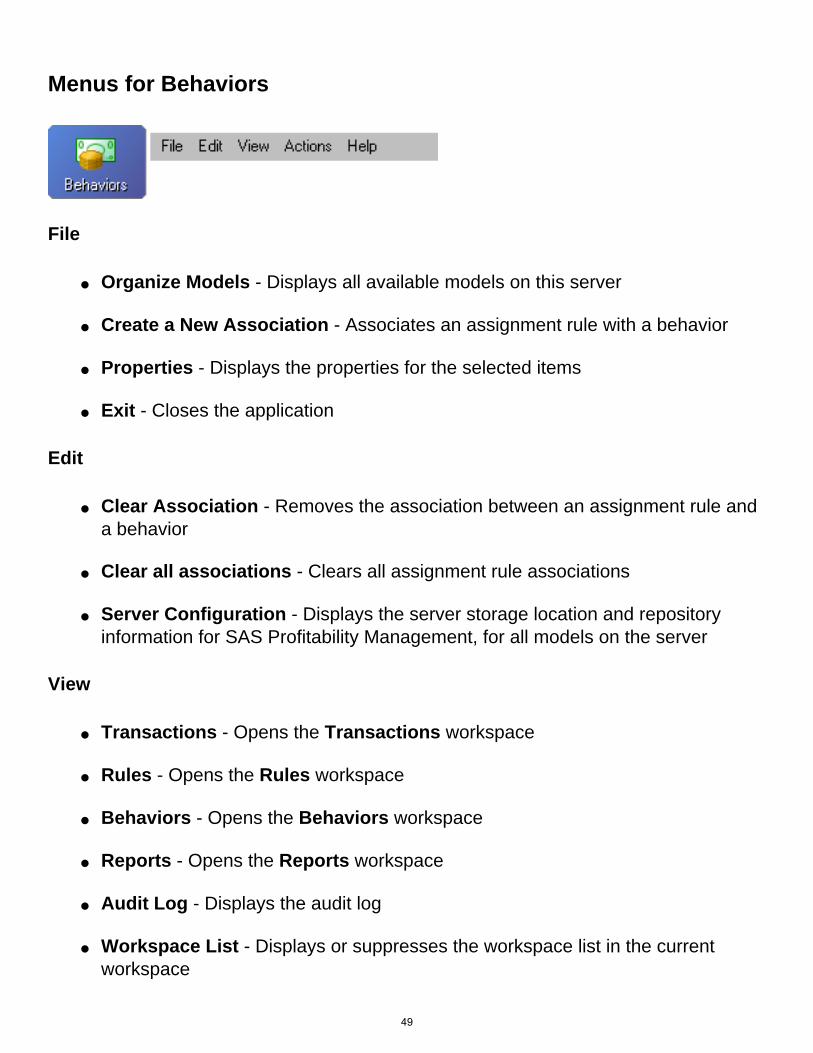
Menus for Behaviors
File
● Organize Models - Displays all available models on this server
● Create a New Association - Associates an assignment rule with a behavior
● Properties - Displays the properties for the selected items
● Exit - Closes the application
Edit
● Clear Association - Removes the association between an assignment rule and a behavior
● Clear all associations - Clears all assignment rule associations
● Server Configuration - Displays the server storage location and repository information for SAS Profitability Management, for all models on the server
View
● Transactions - Opens the Transactions workspace
● Rules - Opens the Rules workspace
● Behaviors - Opens the Behaviors workspace
● Reports - Opens the Reports workspace
● Audit Log - Displays the audit log
● Workspace List - Displays or suppresses the workspace list in the current workspace
49

● Task List - Displays or suppresses the task list in the current workspace
Actions
● Calculate Model - Calculates a model by taking the transaction tables in the input directory, applying rules in the model to make calculations, and storing the calculated results in columns that are appended to the transaction tables in the output directory
● Import Associations - Imports a file that associates assignment rules with behaviors
● Export Associations - Exports a file that associates assignment rules with behaviors
● Refresh - Refreshes the screen to display the current status of all table source data; when you change the underlying SAS tables, you should always refresh the model before you continue editing the content in SAS Profitability Management
Help
● Contents - Opens the Help file
● PM on the Web - Links to the SAS Profitability Management Web site
● SAS on the Web - Links to http://www.sas.com/
● About - Provides version information for the application
50

Menus for Reports
Summary Reports Tab
File
● Organize Models - Displays all available models on this server
● New Summary Report Definition - Creates a new summary report
● Properties - Displays the properties for the selected items
● Exit - Closes the application
Edit
● Remove - Removes the selected item from the SAS Profitability Management model
● Server Configuration - Displays the server storage location and repository information for SAS Profitability Management, for all models on the server
View
● Transactions - Opens the Transactions workspace
● Rules - Opens the Rules workspace
● Behaviors - Opens the Behaviors workspace
● Reports - Opens the Reports workspace
● Audit Log - Displays the audit log
● Workspace List - Displays or suppresses the workspace list in the current workspace
51

● Task List - Displays or suppresses the task list in the current workspace
Actions
● Calculate Model - Calculates a model by taking the transaction tables in the input directory, applying rules in the model to make calculations, and storing the calculated results in columns that are appended to the transaction tables in the output directory
● Generate Cube - Generates a cube for a SAS Profitability Management model
● Refresh - Refreshes the screen to display the current status of all table source data; when you change the underlying SAS tables, you should always refresh the model before you continue editing the content in SAS Profitability Management
Help
● Contents - Opens the Help file
● PM on the Web - Links to the SAS Profitability Management Web site
● SAS on the Web - Links to http://www.sas.com/
● About - Provides version information for the application
Detail Reports Tab
File
● Organize Models - Displays all available models on this server
● New Detail Report Definition - Creates a new detail report
● Properties - Displays the properties for the selected items
● Exit - Closes the application
Edit
52

● Remove - Removes the selected item from the SAS Profitability Management model
● Server Configuration - Displays the server storage location and repository information for SAS Profitability Management, for all models on the server
View
● Transactions - Opens the Transactions workspace
● Rules - Opens the Rules workspace
● Behaviors - Opens the Behaviors workspace
● Reports - Opens the Reports workspace
● Audit Log - Displays the audit log
● Workspace List - Displays or suppresses the workspace list in the current workspace
● Task List - Displays or suppresses the task list in the current workspace
Actions
● Calculate Model - Calculates a model by taking the transaction tables in the input directory, applying rules in the model to make calculations, and storing the calculated results in columns that are appended to the transaction tables in the output directory
● Refresh - Refreshes the screen to display the current status of all table source data; when you change the underlying SAS tables, you should always refresh the model before you continue editing the content in SAS Profitability Management
Help
● Help Contents - Opens the Help file
● PM on the Web - Links to the SAS Profitability Management Web site
● SAS on the Web - Links to http://www.sas.com/53

● About - Provides version information for the application
54
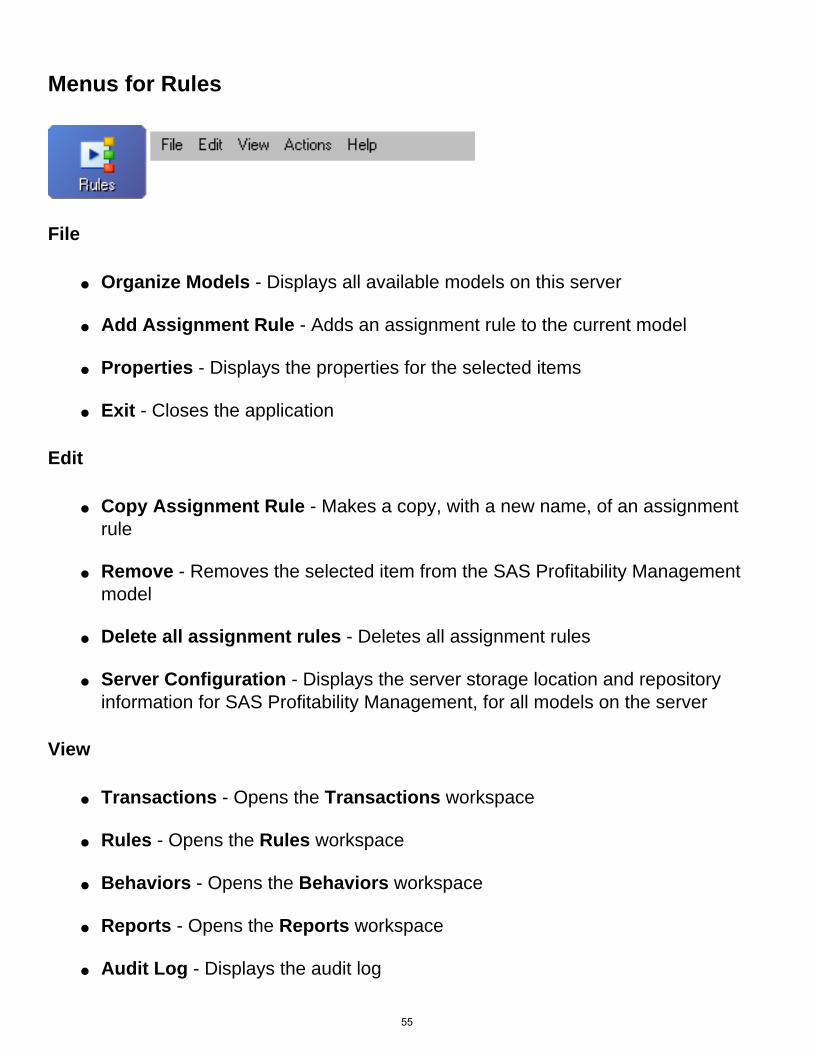
Menus for Rules
File
● Organize Models - Displays all available models on this server
● Add Assignment Rule - Adds an assignment rule to the current model
● Properties - Displays the properties for the selected items
● Exit - Closes the application
Edit
● Copy Assignment Rule - Makes a copy, with a new name, of an assignment rule
● Remove - Removes the selected item from the SAS Profitability Management model
● Delete all assignment rules - Deletes all assignment rules
● Server Configuration - Displays the server storage location and repository information for SAS Profitability Management, for all models on the server
View
● Transactions - Opens the Transactions workspace
● Rules - Opens the Rules workspace
● Behaviors - Opens the Behaviors workspace
● Reports - Opens the Reports workspace
● Audit Log - Displays the audit log
55
● Workspace List - Displays or suppresses the workspace list in the current workspace
● Task List - Displays or suppresses the task list in the current workspace
Actions
● Calculate Model - Calculates a model by taking the transaction tables in the input directory, applying rules in the model to make calculations, and storing the calculated results in columns that are appended to the transaction tables in the output directory
● Import Assignment Rules - Imports a file defining rules that associate rows in a group of transaction tables with a behavior
● Export Assignment Rules - Exports a file defining rules that associate rows in a group of transaction tables with a behavior
● Refresh - Refreshes the screen to display the current status of all table source data; when you change the underlying SAS tables, you should always refresh the model before you continue editing the content in SAS Profitability Management
Help
● Contents - Opens the Help file
● PM on the Web - Links to the SAS Profitability Management Web site
● SAS on the Web - Links to http://www.sas.com/
● About - Provides version information for the application
56
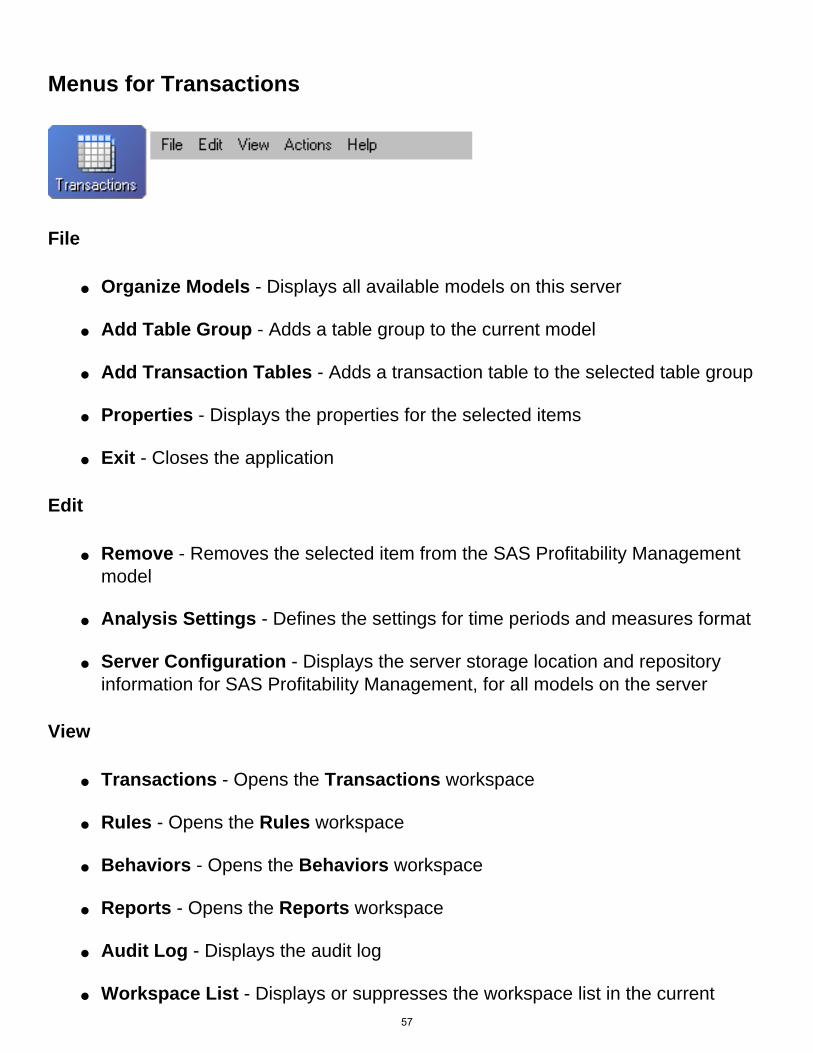
Menus for Transactions
File
● Organize Models - Displays all available models on this server
● Add Table Group - Adds a table group to the current model
● Add Transaction Tables - Adds a transaction table to the selected table group
● Properties - Displays the properties for the selected items
● Exit - Closes the application
Edit
● Remove - Removes the selected item from the SAS Profitability Management model
● Analysis Settings - Defines the settings for time periods and measures format
● Server Configuration - Displays the server storage location and repository information for SAS Profitability Management, for all models on the server
View
● Transactions - Opens the Transactions workspace
● Rules - Opens the Rules workspace
● Behaviors - Opens the Behaviors workspace
● Reports - Opens the Reports workspace
● Audit Log - Displays the audit log
● Workspace List - Displays or suppresses the workspace list in the current 57
workspace
● Task List - Displays or suppresses the task list in the current workspace
Actions
● Calculate Model - Calculates a model by taking the transaction tables in the input directory, applying rules in the model to make calculations, and storing the calculated results in columns that are appended to the transaction tables in the output directory
● Refresh - Refreshes the screen to display the current status of all table source data; when you change the underlying SAS tables, you should always refresh the model before you continue editing the content in SAS Profitability Management
● Preview Data - Previews the first 1000 rows of data in a table
Help
● Help Contents - Opens the Help file
● PM on the Web - Links to the SAS Profitability Management Web site
● SAS on the Web - Links to http://www.sas.com/
● About - Provides version information for the application
58
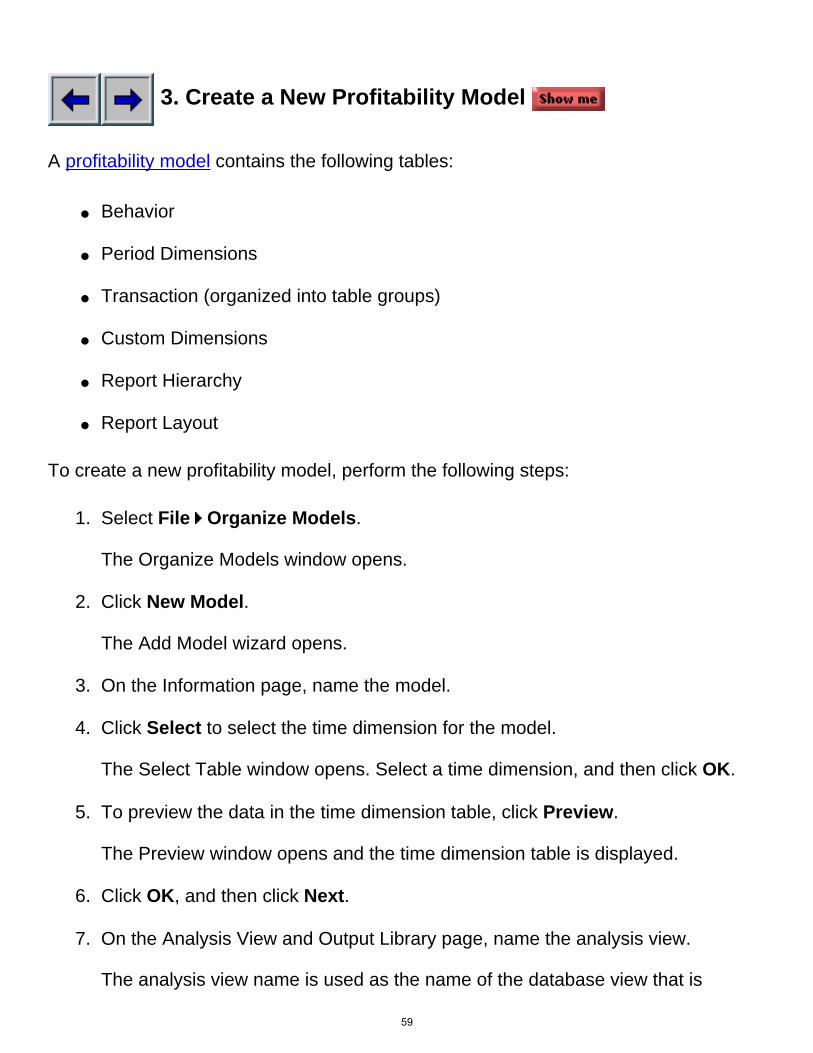
3. Create a New Profitability Model
A profitability model contains the following tables:
● Behavior
● Period Dimensions
● Transaction (organized into table groups)
● Custom Dimensions
● Report Hierarchy
● Report Layout
To create a new profitability model, perform the following steps:
1. Select File Organize Models. The Organize Models window opens.
2. Click New Model. The Add Model wizard opens.
3. On the Information page, name the model.
4. Click Select to select the time dimension for the model. The Select Table window opens. Select a time dimension, and then click OK.
5. To preview the data in the time dimension table, click Preview. The Preview window opens and the time dimension table is displayed.
6. Click OK, and then click Next.
7. On the Analysis View and Output Library page, name the analysis view. The analysis view name is used as the name of the database view that is
59
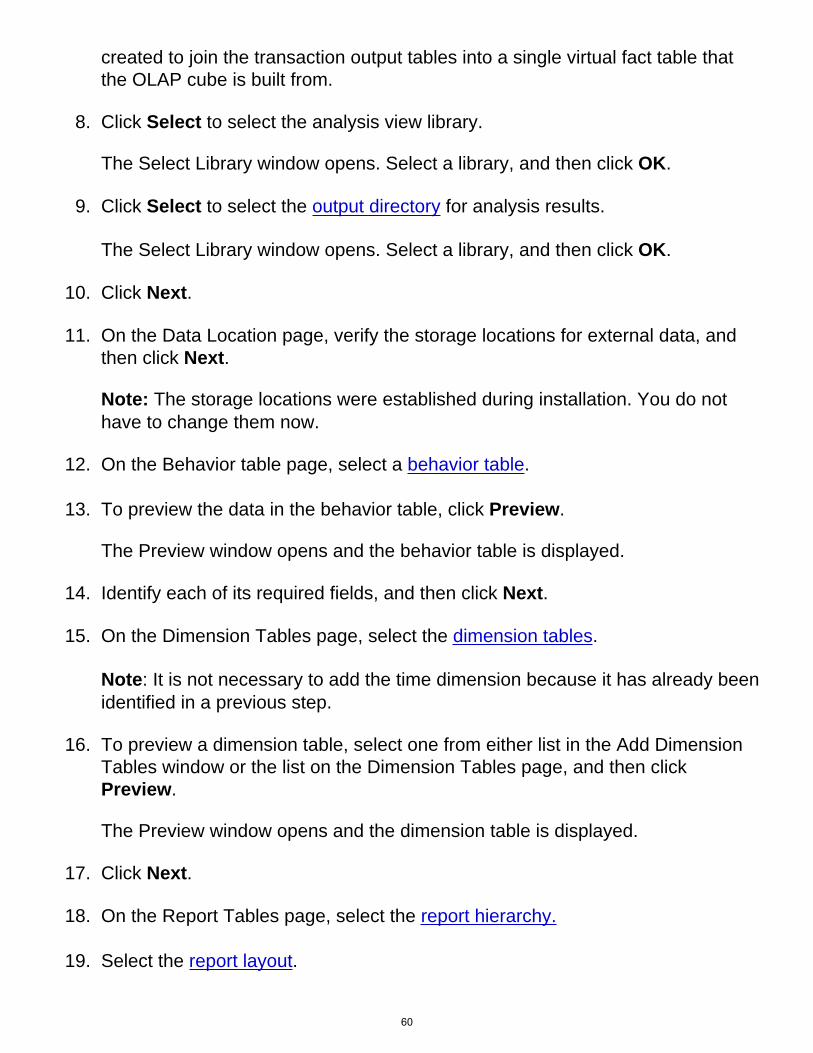
created to join the transaction output tables into a single virtual fact table that the OLAP cube is built from.
8. Click Select to select the analysis view library. The Select Library window opens. Select a library, and then click OK.
9. Click Select to select the output directory for analysis results. The Select Library window opens. Select a library, and then click OK.
10. Click Next.
11. On the Data Location page, verify the storage locations for external data, and then click Next. Note: The storage locations were established during installation. You do not have to change them now.
12. On the Behavior table page, select a behavior table.
13. To preview the data in the behavior table, click Preview. The Preview window opens and the behavior table is displayed.
14. Identify each of its required fields, and then click Next.
15. On the Dimension Tables page, select the dimension tables. Note: It is not necessary to add the time dimension because it has already been identified in a previous step.
16. To preview a dimension table, select one from either list in the Add Dimension Tables window or the list on the Dimension Tables page, and then click Preview. The Preview window opens and the dimension table is displayed.
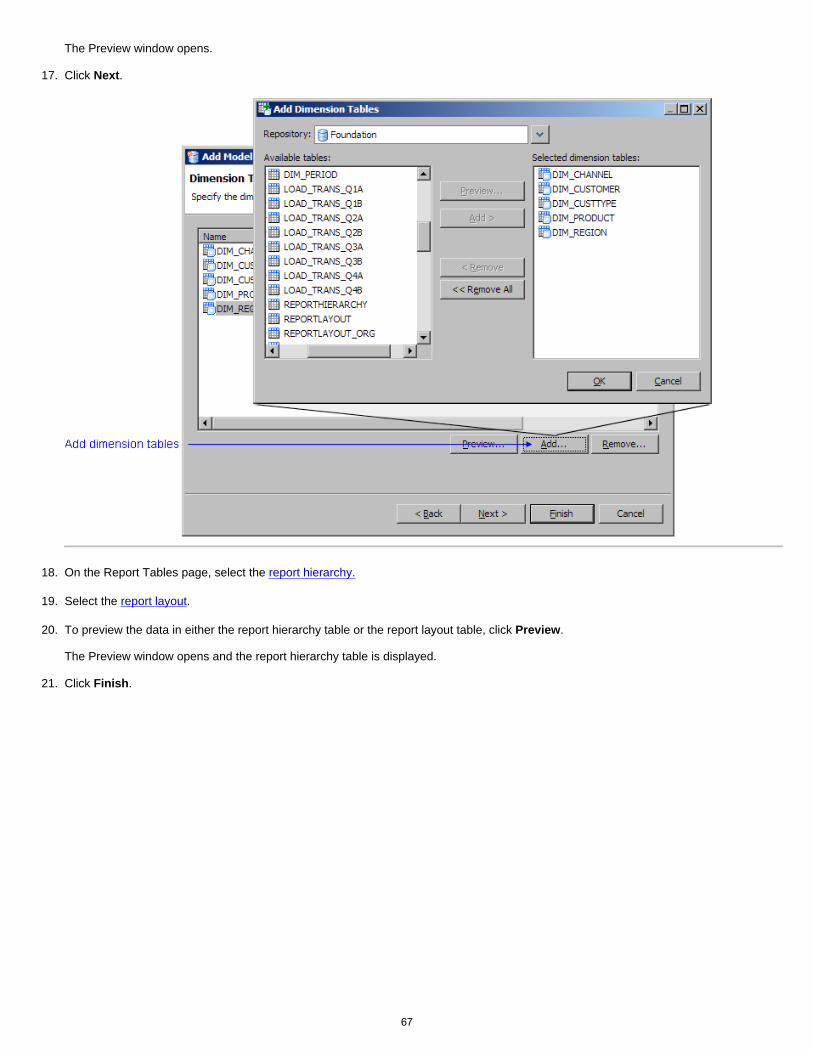
17. Click Next.
18. On the Report Tables page, select the report hierarchy.
19. Select the report layout.
60

20. To preview the data in either the report hierarchy table or the report layout table, click Preview. The Preview window opens and the report hierarchy table is displayed.
21. Click Finish. The new profitability model is added to the Organize Models window.
22. Click Close.
Related Topics:
● Edit a model
61

Profitability Model
A profitability model contains the following tables:
● Behavior
● Report Hierarchy
● Report Layout
● Period Dimensions
● Custom Dimensions
● Transaction (organized into table groups)
The following picture shows the relationships between the behavior table and the other tables in a profitability model.
The following pictures shows additional relationships among the tables that make up a profitability model:
62

63

Create a New Profitability Model
1. Select File Organize Models. The Organize Models window opens.
2. Click New Model. The Add Model wizard opens.
3. On the Information page, name the model.
4. Click Select to select the time dimension for the model. The Select Table window opens. Select a time dimension, and then click OK.
5. To preview the data in the time dimension table, click Preview. The Preview window opens and the time dimension table is displayed.
6. Click OK, and then click Next.
64

7. On the Analysis View and Output Library page, name the analysis view. The analysis view name is used as the name of the database view that is created to join the transaction output tables into a single virtual fact table that the OLAP cube is built from.
8. Click Select to select the analysis view library. The Select Library window opens. Select a library, and then click OK.
9. Click Select to select the output directory for analysis results. The Select Library window opens. Select a library, and then click OK.
10. Click Next.
11. On the Data Location page, verify the storage locations for external data, and then click Next. Note: The storage locations were established during installation. You do not have to change them now.
65
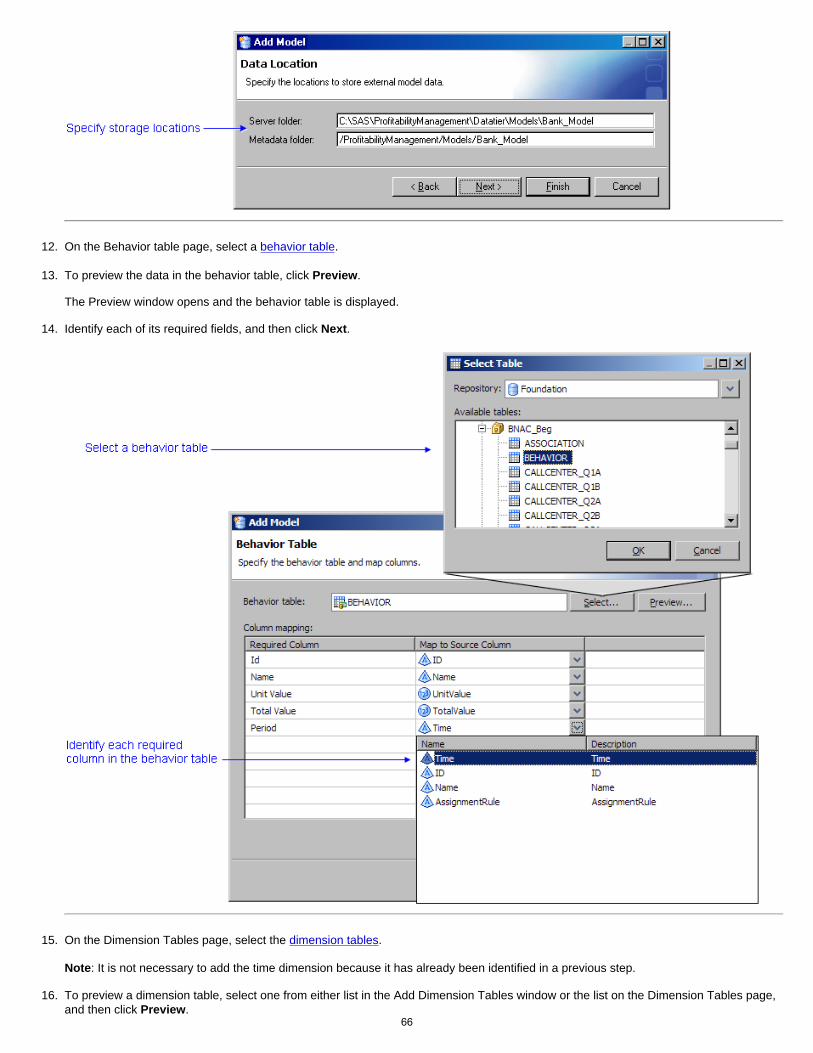
12. On the Behavior table page, select a behavior table.
13. To preview the data in the behavior table, click Preview. The Preview window opens and the behavior table is displayed.
14. Identify each of its required fields, and then click Next.
15. On the Dimension Tables page, select the dimension tables. Note: It is not necessary to add the time dimension because it has already been identified in a previous step.
16. To preview a dimension table, select one from either list in the Add Dimension Tables window or the list on the Dimension Tables page, and then click Preview.
66
The Preview window opens.
17. Click Next.
18. On the Report Tables page, select the report hierarchy.
19. Select the report layout.
20. To preview the data in either the report hierarchy table or the report layout table, click Preview. The Preview window opens and the report hierarchy table is displayed.
21. Click Finish.
67
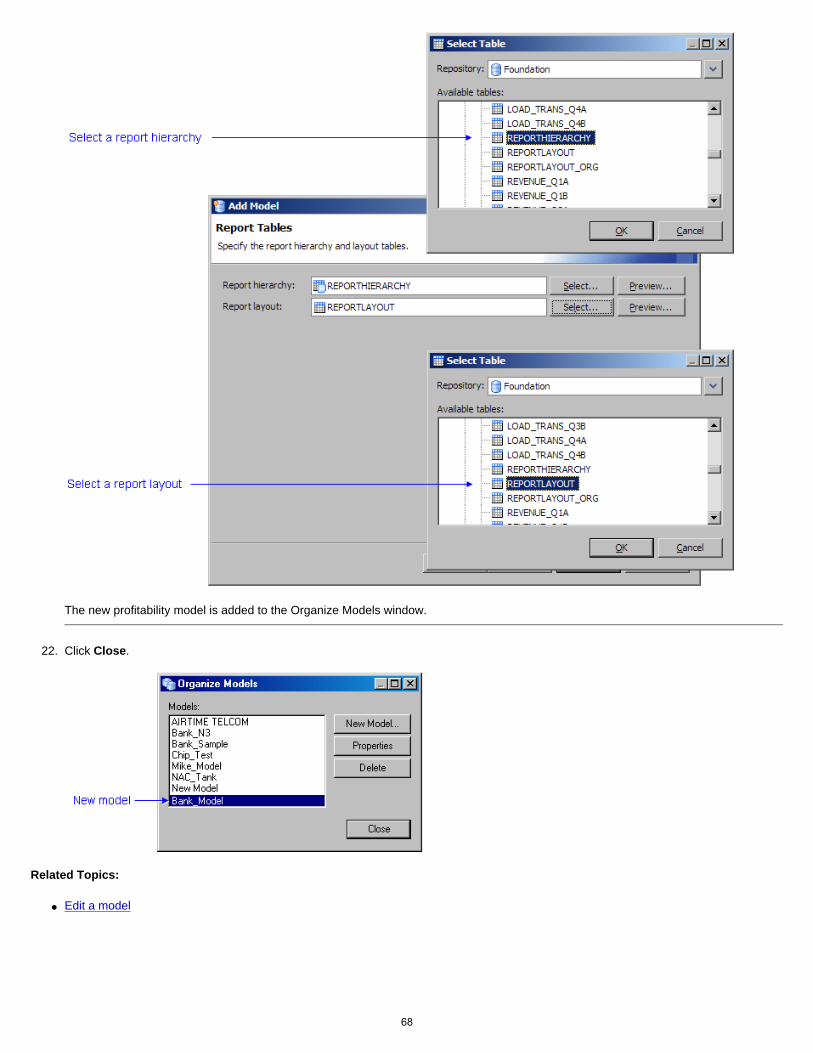
The new profitability model is added to the Organize Models window.
22. Click Close.
Related Topics:
● Edit a model
68
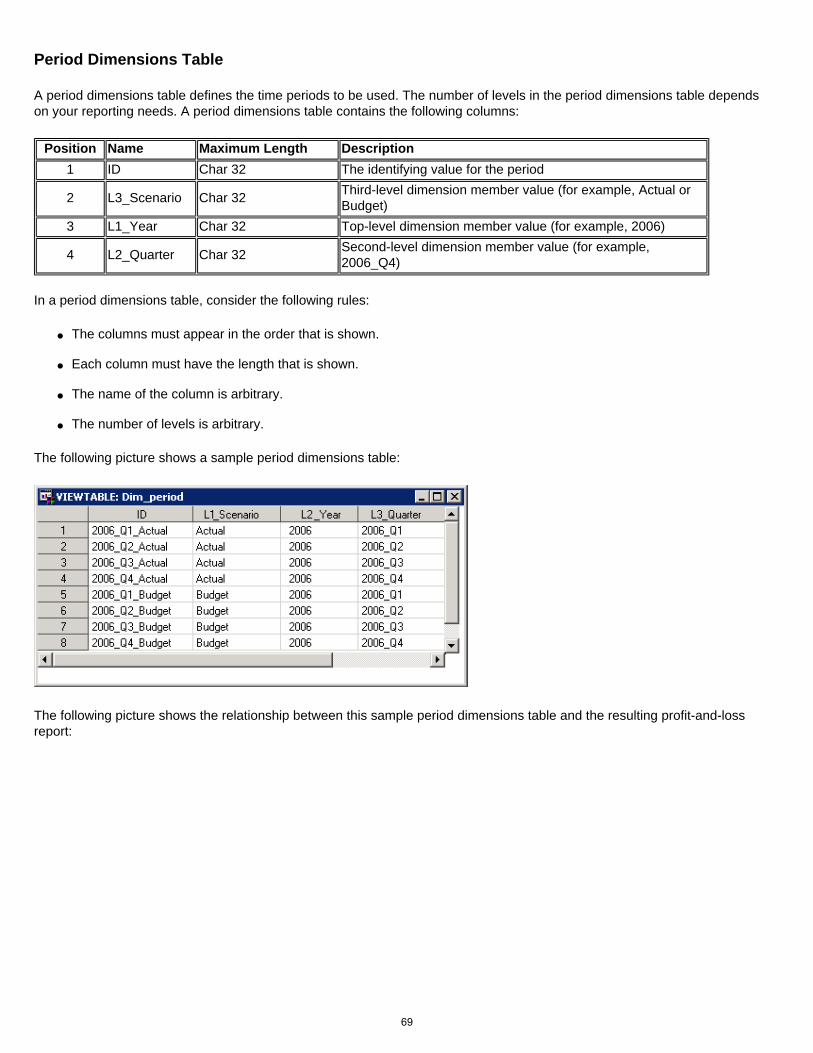
Period Dimensions Table
A period dimensions table defines the time periods to be used. The number of levels in the period dimensions table depends on your reporting needs. A period dimensions table contains the following columns:
Position Name Maximum Length Description1 ID Char 32 The identifying value for the period
2 L3_Scenario Char 32 Third-level dimension member value (for example, Actual or Budget)
3 L1_Year Char 32 Top-level dimension member value (for example, 2006)
4 L2_Quarter Char 32 Second-level dimension member value (for example, 2006_Q4)
In a period dimensions table, consider the following rules:
● The columns must appear in the order that is shown.
● Each column must have the length that is shown.
● The name of the column is arbitrary.
● The number of levels is arbitrary.
The following picture shows a sample period dimensions table:
The following picture shows the relationship between this sample period dimensions table and the resulting profit-and-loss report:
69
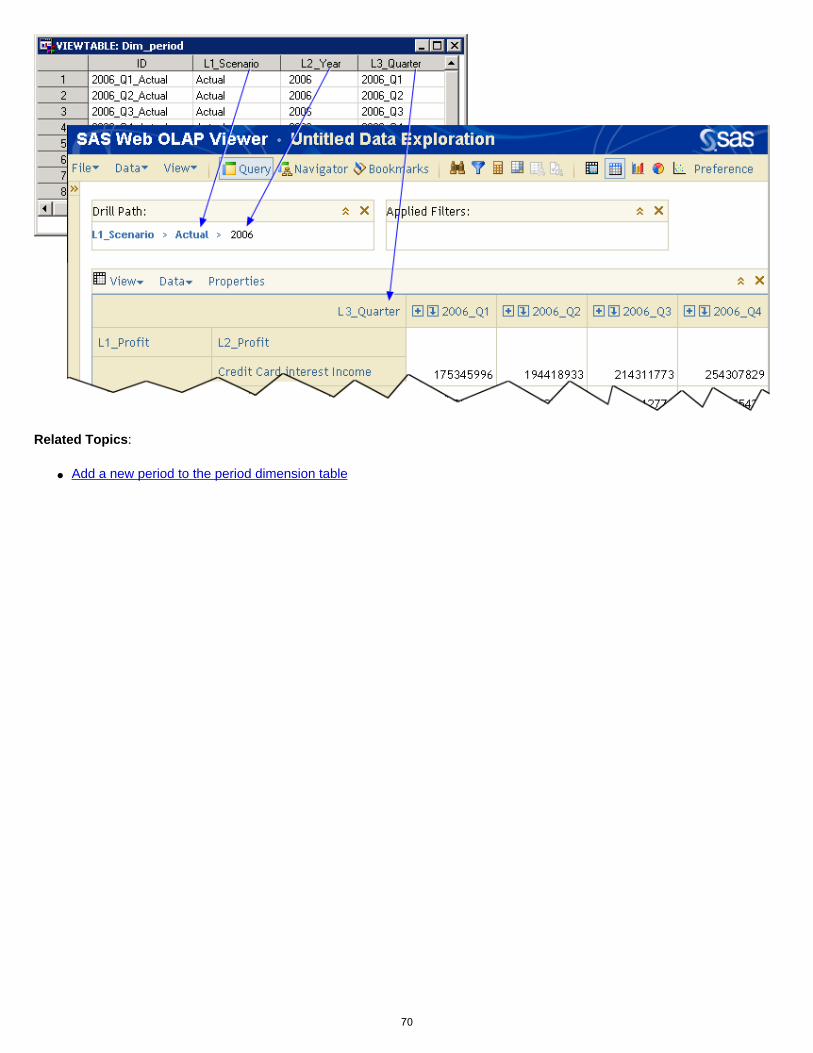
Related Topics:
● Add a new period to the period dimension table
70

1. Populate the Input Directory
Your input directory must contain the following tables:
● Behavior
● Report Hierarchy
● Report Layout
● Period Dimensions
● Custom Dimensions
● Transaction
The input directory can contain the following tables:
● Rule Definition
● Rule Association
A profitability model ties these tables together.
Notes:
● In addition to the required columns, all of the tables can contain additional columns without causing any problems.
● The following characters are not valid in reports (cubes):
. , ; ' ` : ? * & % $ ! - + = ( ) [ ] { } / \
71

Preview the Data in a Table
To preview the data in a table, perform the following steps:
1. Activate the Transactions workspace.
2. Select a model and a table.
3. Click Preview Data, or select Actions Preview Data. The Preview window opens.
72

The TRANASSIGN Procedure
Overview Syntax: TRANASSIGN Procedure PROC TRANASSIGN Statement TRANSACTION Statement DIMENSION Statement Example ChildOf Function
Overview
The TRANASSIGN procedure provides a batch method for calculating a SAS Profitability Management model. The procedure takes the transaction tables in your input directory, applies rules in the model to make calculations, and stores the calculated results in columns that are appended to your transaction tables in the output directory. Errors and warnings are written to the SAS log file.
Syntax:PROC TRANASSIGN AR=assignment-rule-table BH=behavior-table TS=transaction-schema-table; TRANSACTION DATA=transaction-table OUTPUT=output-table PERIOD='period-name' TYPE='transaction-table-group'; DIMENSION NAME=dimension-name TABLE=dimension-table;
PROC TRANASSIGN Statement
The PROC TRANASSIGN statement specifies the input data sources for transaction table schema, transaction behaviors, and assignment rules.
PROC TRANASSIGN AR=assignment-rule-table BH=behavior-table TS=transaction-schema-table;
Required Arguments:
AR | ASSIGNMENTRULE=assignment-rule-table Specifies the data source for the assignment rule table. The table must conform to the following schema:
73

Name Data Type
Maximum Length
Description
Name Char 64 The name of the assignment rule Condition Char 4096 The expression that is used to select transactions as assignment
destinations; the expression should be SAS-compliant and only use variables from the transaction table; the only exception is that it can use the customized dimension-member filtering function ChildOf
Formula Char 4096 The formula expression that is used to calculate the driver quantity for a particular assignment; the expression must be SAS-compliant and only use variables from the transaction table
Type Char 64 The transaction table group that the assignment rule applies to; the value of this field is matched by the value of the TYPE parameter in a TRANSACTION statement
BH | BEHAVIOR=behavior-table Specifies the data source for the behavior table. The behavior table must conform to the following schema: Name Data
Type Maximum Length
Description
Name Char 32 The name of the behavior Period Char 64 The period name for the behavior row AssignmentRule Char 64 The name of the assignment rule used by the
behavior TotalValue Double The total cost/revenue value for the behavior row UnitValue Double The unit cost/revenue value for the behavior row
Note: This behavior table is not identical to the behavior table that is used by a SAS Profitability Management model. Whereas the TRANASSIGN behavior table contains an AssignmentRule field, the SAS Profitability Management model behavior table does not contain such a field. Internally, SAS Profitability Management combines its behavior table with a rule association table to append an AssignmentRule field to produce the kind of behavior table that is used by the TRANASSIGN procedure.
TS | TRANSCHEMA=transaction-schema-table Specifies the data source for the transaction-schema table. The table must conform to the following schema: Name Data
Type Maximum Length
Description
Type Char 64 The transaction table group to which a transaction table belongs; the value of this field is matched by the value of the TYPE parameter in a TRANSACTION statement
Column Char 64 The name of the column Output Char 1 Is it part of the output (dimension or measure): 'Y' or
'N' ?
74

Note that the transaction schema table can contain multiple schemas. There is one schema per transaction table group. The Type field in the transaction schema table contains a string that identifies the transaction table group. The following is a sample transaction schema table:
TRANSACTION Statement
The TRANSACTION statement specifies the input data source for a transaction table. It is also used to specify the transaction type, the period for the transaction table, and the data source for the output table. The statement specifies the action (overwrite or append) when there is a pre-existing output table with the same name. At least one TRANSACTION statement is required for a TRANASSIGN procedure.
TRANSACTION DATA=transaction-table OUTPUT=output-table PERIOD='period-name' TYPE='transaction-table-group'
Required Arguments:
DATA=transaction-tableSpecifies the data source for the transaction table. Its schema must match the value of the TYPE parameter.
OUTPUT=output-table
Specifies the output table for the resulting transaction table. The schema of the output table is based on the transaction table schema that is specified in the TRANSCHEMA parameter in the PROC
75
TRANASSIGN statement. All columns that are specified as output columns for the transaction table are in the output table. In addition, the following columns are part of the schema for the output table: Name Data
Type Maximum Length
Description
Behavior Char 32 The name of the behavior that corresponds to the assignment
Quantity Double The driver quantity of the assignment Value Double The cost/revenue that flows through the assignment
PERIOD='period-name'
Specifies the period for the transaction table. The period information determines the corresponding behavior rows for the transaction assignment.
TYPE='transaction-table-group'
Specifies the name of the transaction table group to which this transaction table belongs. The transaction table group determines the schema of the transaction table. Every transaction table in a group must share the same schema. The schema for a transaction table group is in the table specified by the TRANSCHEMA parameter in the PROC TRANASSIGN statement.
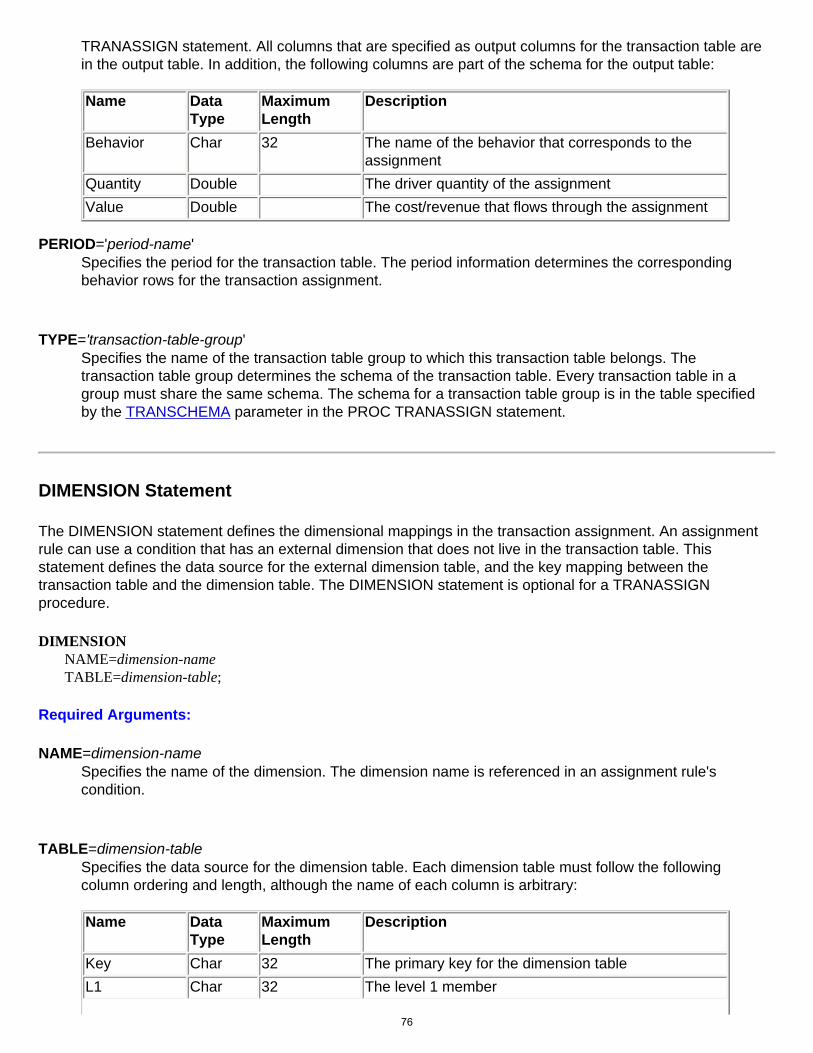
DIMENSION Statement
The DIMENSION statement defines the dimensional mappings in the transaction assignment. An assignment rule can use a condition that has an external dimension that does not live in the transaction table. This statement defines the data source for the external dimension table, and the key mapping between the transaction table and the dimension table. The DIMENSION statement is optional for a TRANASSIGN procedure.
DIMENSION NAME=dimension-name TABLE=dimension-table;
Required Arguments:
NAME=dimension-nameSpecifies the name of the dimension. The dimension name is referenced in an assignment rule's condition.
TABLE=dimension-table
Specifies the data source for the dimension table. Each dimension table must follow the following column ordering and length, although the name of each column is arbitrary: Name Data
Type Maximum Length
Description
Key Char 32 The primary key for the dimension table L1 Char 32 The level 1 member
76

L2 Char 32 The level 2 members ... Ln Char 32 The level n mm
Example
In the following example, the caller invokes the TRANASSIGN procedure to process two transaction tables and write the output to the same data source. The REGION dimension is used for dimension-member filtering:
libname model .;libname modelOut .;
PROC TRANASSIGN TranSchema=TranSchema Behavior=Behavior AssignmentRule=Rule; Transaction Data=model.Atm04Q3 Period='2004_Q3' Type='General' Output=modelOut.ATMOut;Transaction Data=model.Atm04Q4 Period='2004_Q4' Type='General' Output= modelOut.ATMOut;Dimension Name='Region' Table=model.DimRegion;
RUN;
ChildOf Function
double IsChildOf(dim_member_column_in_transaction_table, parent_dim_member_full_name);
The ChildOf function returns 1 when the corresponding dimension member for the current transaction row is a descendant of the member parent_dim_member_full_name. Otherwise, it returns 0.
The first parameter specifies the column name of the dimension member in the transaction table. This parameter should not be in quotation marks.
The second parameter specifies the full name of a parent dimension member. The syntax of dim_member_full_name is similar to MDX (multidimensional expressions). Square brackets enclose the name of a single dimension member. The full name must start with the dimension name, and it must contain the name of each level for the parent dimension member. This parameter must be in quotation marks.
Examples for calling this function include:
● IsChildOf(Region, "[Region].[USA].[North Carolina]")
● IsChildOf(Product, "[Product].[Paper Goods].[Tissue Paper[429x340]]]")
● IsChildOf(Product, '[Product].[Beverages].[Fred''s choice]')
77

The examples demonstrate the following rules:
● Both single quotation marks and double quotation marks can enclose strings.
● "]" is used as an escape character for embedded closing square bracket.
● A single quotation mark is used as an escape character for an embedded single quotation mark.
78

SAS Profitability Management Quick Start
1. Populate the input directory
2. Set up the environment
3. Create a new profitability model
4. Define transaction table groups
5. Define rules
6. Calculate a model
7. Prepare reports
8. View reports
Take the SAS Profitability Management Tutorial to familiarize yourself with this software.
79
Reference
● Index of terms
● Menus and toolbars
● The TRANASSIGN Procedure
80

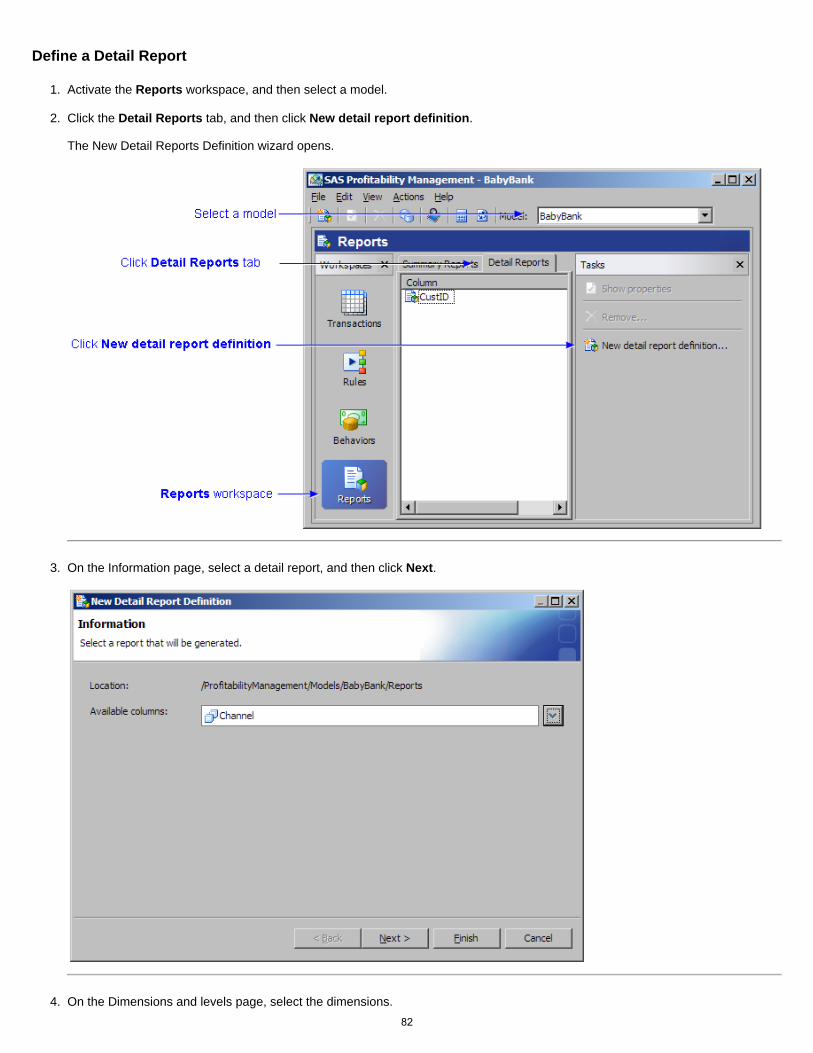
Define a Detail Report
Each detail report is available to produce a report that is based on a single dimension and by filtering a single value in that dimension. Detail reports are run from the SAS Profitability Management Web Client and create a cube on the fly. To configure a detail report, perform the following steps:
1. Activate the Reports workspace, and then select a model.
2. Click the Detail Reports tab, and then click New detail report definition. The New Detail Report Definition wizard opens.
3. On the Information page, select a detail report, and then click Next.
4. On the Dimensions and levels page, select the dimensions. Note: Although all of the columns in all of the tables of the model are displayed, only those columns corresponding to dimensions should be selected to produce the most meaningful report. For the best response time, select dimensions with a limited number of records. Three dimensions are automatically selected: the column that you selected in the previous step, the DIM_PERIOD dimension, and the REPORTHIERARCHY dimension. These dimensions are automatically selected and disabled because they are required for the report. However, you can select the levels of these dimensions.
5. In the Allow Drill Down To column, select the level for each dimension.
6. Click Next.
7. On the Measure page, select the measures to be included in the detail report. Note: Value is automatically selected and disabled because it is required for the report.
8. Click Finish. After the selected dimensions are configured, the list of detail reports is displayed on the Detail Reports tab of the Reports workspace. This is the same list of detail reports that will be available in the SAS PRofitability Management Web Client for viewing.
81
Define a Detail Report
1. Activate the Reports workspace, and then select a model.
2. Click the Detail Reports tab, and then click New detail report definition. The New Detail Reports Definition wizard opens.
3. On the Information page, select a detail report, and then click Next.
4. On the Dimensions and levels page, select the dimensions. 82

Note: Although all of the columns in all of the tables of the model are displayed, only those columns corresponding to dimensions should be selected to produce the most meaningful report. For the best response time, select dimensions with a limited number of records. Three dimensions are automatically selected: the column that you selected in the previous step, the DIM_PERIOD dimension, and the REPORTHIERARCHY dimension. These dimensions are automatically selected and disabled because they are required for the report. However, you can select the levels of these dimensions.
5. From the Allow Drill Down To column, select the level for each dimension.
6. Click Next.
7. On the Measure page, select the measures to be included in the detail report. Note: VALUE is automatically selected and disabled because it is required for the report.
8. Click Finish. After the selected dimensions are configured, the list of detail reports is displayed on the Detail Reports tab of the Reports workspace. This is the same list of detail reports that will be available in the SAS PRofitability Management Web Client for viewing.
83

84

Report Hierarchy Table
The report hierarchy table defines the dimension hierarchy for drilling down into the profit-and-loss report. The number of levels in the hierarchy is a critical decision in model design and is subject to the ultimate reporting needs for the business managers to make decisions. A report hierarchy contains the following columns.
Position Name Maximum Length Description1 ID Char 32 The identifying reference for the behavior 2 L1_Profit Char 32 Top-level dimension members for the hierarchy3 L2_Profit Char 32 Second-level dimension members for the hierarchy4 L3_Profit Char 32 Third-level dimension members for the hierarchy5 L4_Profit Char 32 Fourth-level dimension members for the hierarchy6 L5_Profit Char 32 Fifth-level dimension members for the hierarchy
In a report hierarchy table, consider the following rules:
● The columns must appear in the order that is shown.
● Each column must have the length that is shown.
● The name of the column is arbitrary.
● The number of levels is arbitrary.
The following picture shows a sample report hierarchy table:
Note: Do not include calculated rows from the report layout table, such as the following row, in the report hierarchy table:
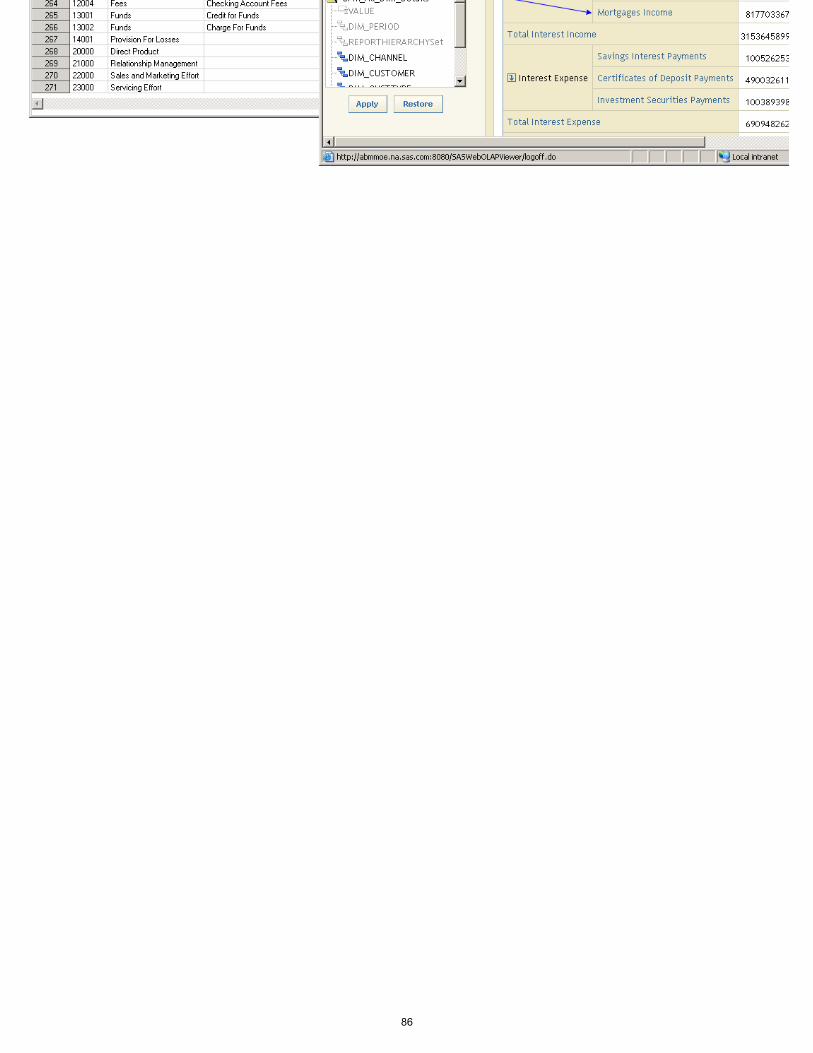
The following picture shows the relationship between this sample report hierarchy table and the resulting profit-and-loss report:
85
86

Report Layout Table
The report layout table defines the calculation formula for the profit-and-loss report. A report layout table contains the following columns:
Position Name Maximum Length Description
1 ID Char 32
The unique identifying reference for the item
● IDs for source costs are based on the behavior IDs
● IDs for calculated values are defined here
2 Name Char 32 The name of the behavior3 Formula Char 255 For calculated rows, the formula for the calculation is based on the IDs4 RowOrder Numeric 8 The position of the row in the profit-and-loss report
In a report layout table, consider the following rules:
● The columns must appear in the order that is shown.
● Each column must have the length that is shown.
● The column names must be exactly as shown.
Note: You can add labels to a report.
The following picture shows a sample report layout table:
Note: Do not include calculated rows, such as the following row, in the report hierarchy table:
The following picture shows the relationship between this sample report layout table and the resulting profit-and-loss report:
87

88

Reports-Workspace Toolbar
89
7. Prepare Reports
● Define a summary report
● Define a detail report
90
Define a Summary Report
A summary report is a cube that is generated from the SAS Profitability Management client for later viewing in the SAS Web OLAP Viewer.
1. Activate the Reports workspace, and then select a model.
2. Click New summary report definition. The New Summary Report Definition wizard opens.
3. On the Information page, name the summary report, and then click Next.
4. On the Dimensions and levels page, select the dimensions and levels, and then click Next. Note: The fewer dimensions and drill-down levels that you select, the smaller the summary cube will be. Smaller summary cubes have better response time.
5. On the Measures page, select the measures. VALUE is included by default. All numeric properties are available.
6. Click Finish. The new report is added to the list of summary reports.
7. Select the new report in the list of summary reports, and then click Generate cube. The cube is generated.
8. Click Details to view the message log.
91

Define a Summary Report
1. Activate the Reports workspace, and then select a model.
2. Click New summary report definition. The New Summary Report Definition wizard opens.
3. On the Information page, name the summary report, and then click Next.
4. On the Dimensions and levels page, select the dimensions and levels, and then click Next. Note: The fewer dimensions and drill-down levels that you select, the smaller the summary cube will be. Smaller summary cubes have better response time.
92

5. On the Measures page, select the measures. VALUE is included by default. All numeric properties are available.
6. Click Finish. The new report is added to the list of summary reports.
7. Select the new report in the list of summary reports, and then click Generate cube. The cube is generated.
93
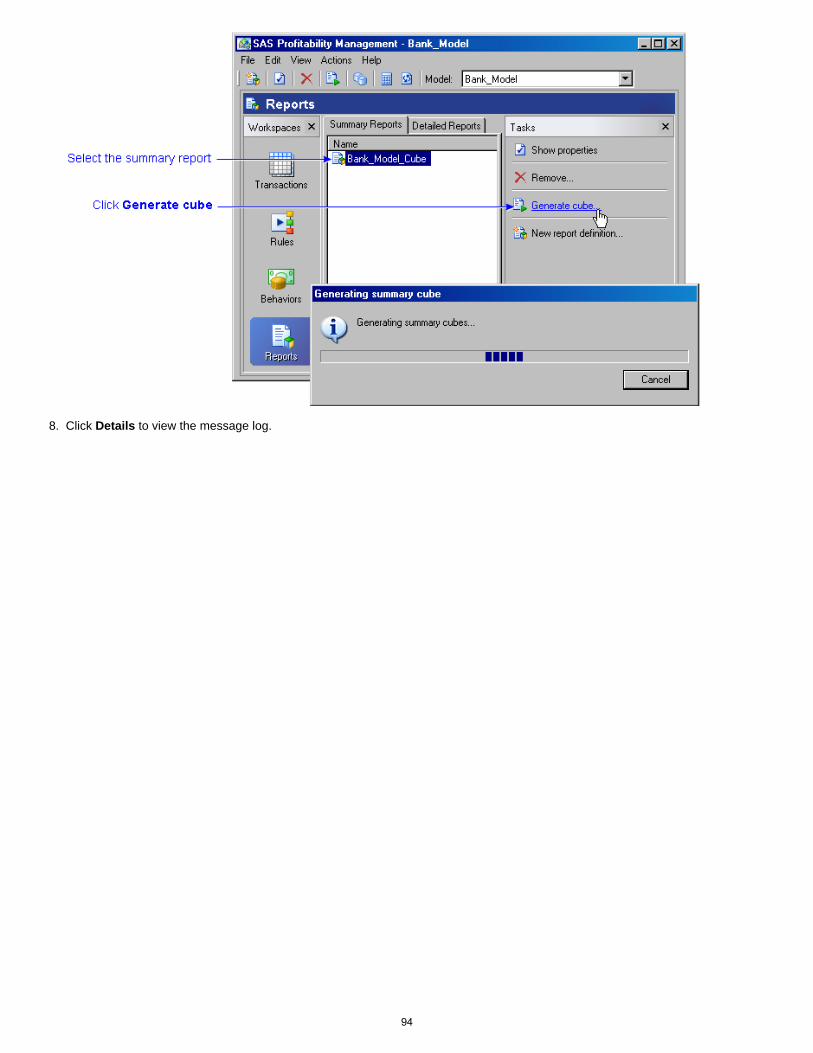
8. Click Details to view the message log.
94
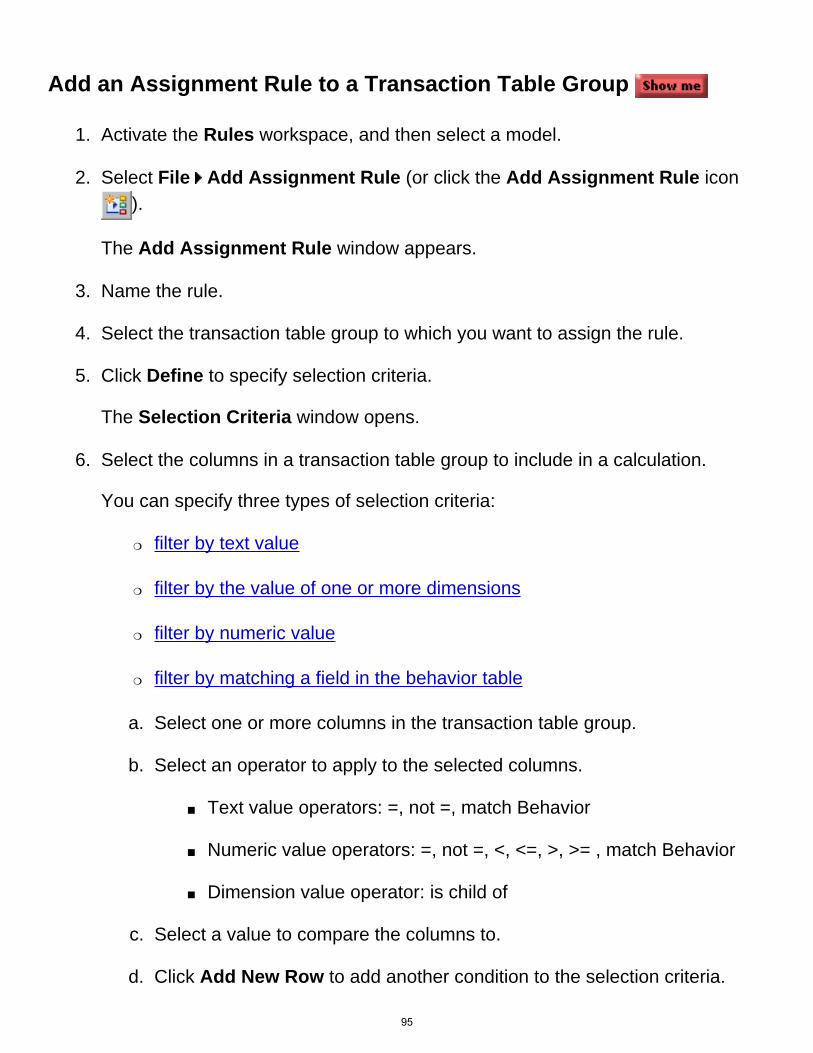
Add an Assignment Rule to a Transaction Table Group
1. Activate the Rules workspace, and then select a model.
2. Select File Add Assignment Rule (or click the Add Assignment Rule icon ).
The Add Assignment Rule window appears.
3. Name the rule.
4. Select the transaction table group to which you want to assign the rule.
5. Click Define to specify selection criteria. The Selection Criteria window opens.
6. Select the columns in a transaction table group to include in a calculation. You can specify three types of selection criteria:
❍ filter by text value
❍ filter by the value of one or more dimensions
❍ filter by numeric value
❍ filter by matching a field in the behavior table
a. Select one or more columns in the transaction table group.
b. Select an operator to apply to the selected columns.
■ Text value operators: =, not =, match Behavior
■ Numeric value operators: =, not =, <, <=, >, >= , match Behavior
■ Dimension value operator: is child of
c. Select a value to compare the columns to.
d. Click Add New Row to add another condition to the selection criteria.
95
Note: If you are using the match Behavior operator, then each condition must be joined with the And operator.
e. Click OK.
7. After building the selection criteria, modify the conditions manually, as necessary.
8. Select a numeric column to use in the driver formula. Note: You are not restricted to a single field.
9. Click OK. The assignment rule appears in the Rules workspace under the transaction table group to which the rule belongs.
96

Import a Rule Definition Table
1. Activate the Rules workspace, and then select the model to which you want to add the rule definitions.
2. Select Actions Import Assignment Rules. The Import Rules window opens.
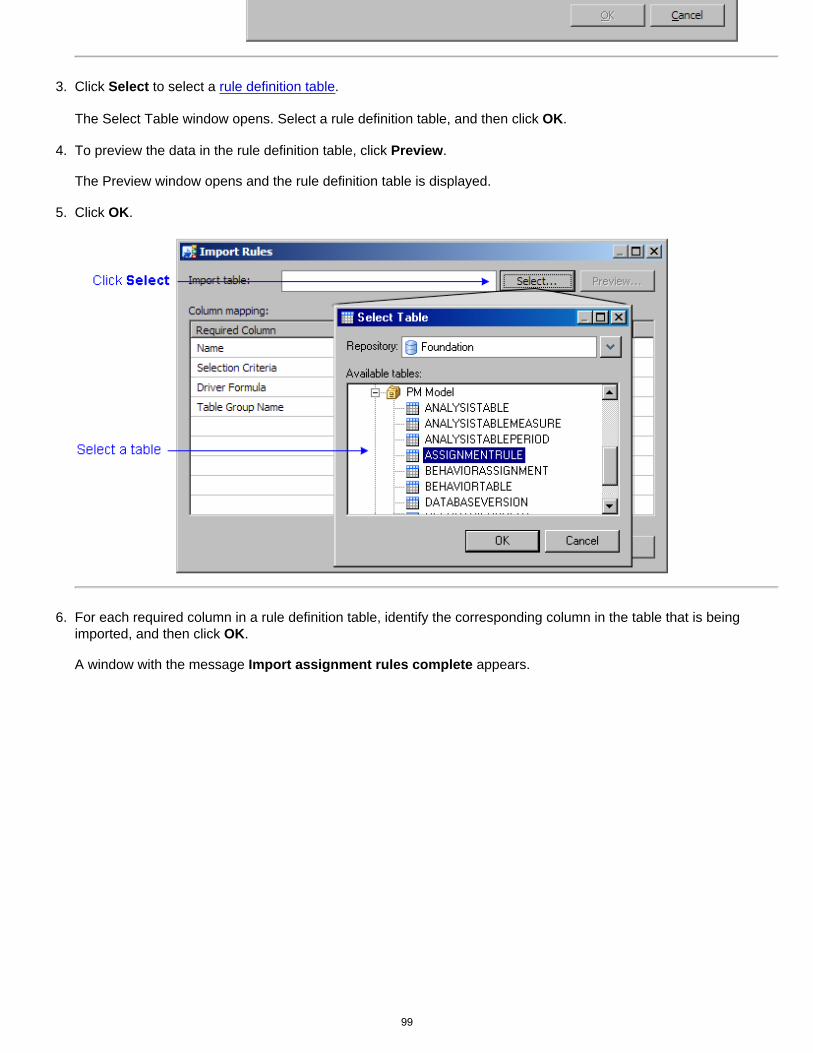
3. Click Select to select a rule definition table. The Select Table window opens. Select a rule definition table, and then click OK.
4. To preview the data in the rule definition table, click Preview. The Preview window opens and the rule definition table is displayed.
5. Click OK.
6. For each required column in a rule definition table, identify the corresponding column in the table that is being imported, and then click OK. A window with the message Import assignment rules complete appears.
7. Click Details to verify that the import succeeded, and then click OK.
Related Topics:
● Export a rule definition table
97

Import a Rule Definition Table
1. Activate the Rules workspace, and then select the model in which the rule definitions will be added.
2. Select Actions Import Assignment Rules. The Import Rules window opens.
98
3. Click Select to select a rule definition table. The Select Table window opens. Select a rule definition table, and then click OK.
4. To preview the data in the rule definition table, click Preview. The Preview window opens and the rule definition table is displayed.
5. Click OK.
6. For each required column in a rule definition table, identify the corresponding column in the table that is being imported, and then click OK. A window with the message Import assignment rules complete appears.
99

7. Click Details to verify that the import succeeded, and then click OK.
Related Topics:
● Export a rule definition table
100

Add an Assignment Rule to a Transaction Table Group
1. Activate the Rules workspace, and then select a model.
2. Select File Add Assignment Rule (or click the Add Assignment Rule icon ). The Add Assignment Rule window appears.
3. Name the rule.
4. Select the transaction table group to which you want to assign the rule.
101
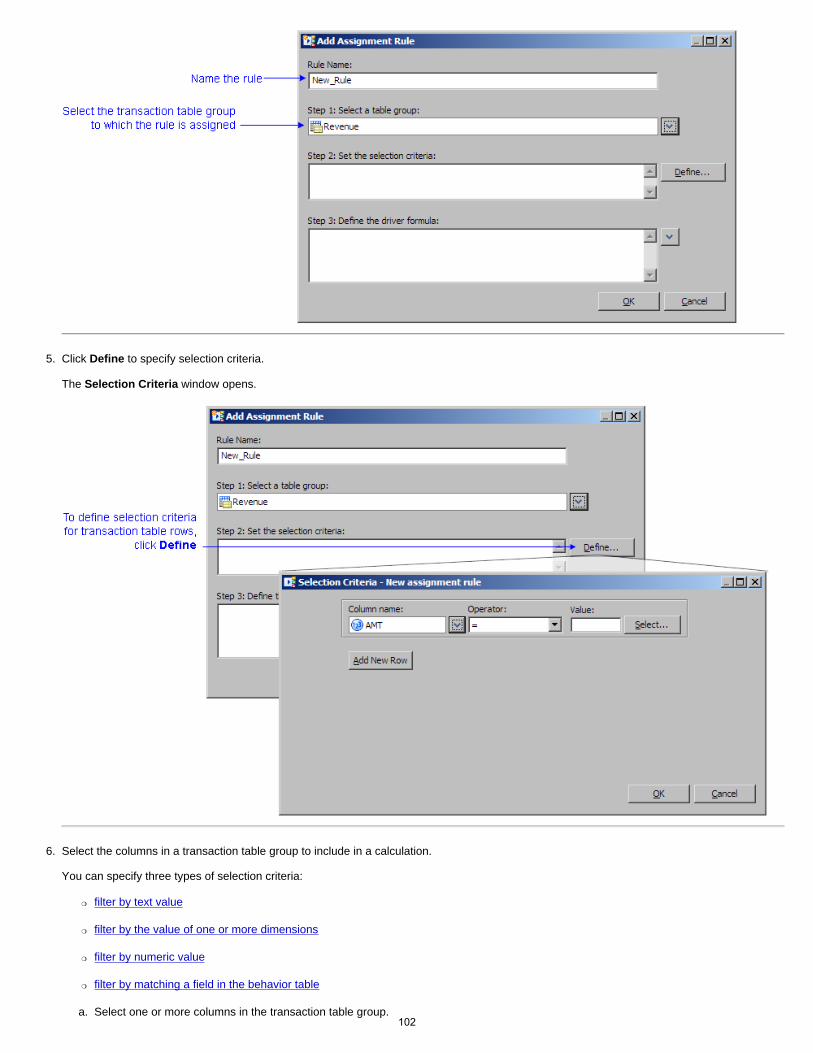
5. Click Define to specify selection criteria. The Selection Criteria window opens.
6. Select the columns in a transaction table group to include in a calculation. You can specify three types of selection criteria:
❍ filter by text value
❍ filter by the value of one or more dimensions
❍ filter by numeric value
❍ filter by matching a field in the behavior table
a. Select one or more columns in the transaction table group. 102

b. Select an operator to apply to the selected columns.
■ Text value operators: =, not =, match Behavior
■ Numeric value operators: =, not =, <, <=, >, >= , match Behavior
■ Dimension value operator: is child of
c. Select a value to compare the columns to.
d. Click Add New Row to add another condition to the selection criteria. Note: If you are using the match Behavior operator, then each condition must be joined with the And operator.
e. Click OK.
7. After building the selection criteria, modify the conditions manually, as necessary.
8. Select a numeric column to use in the driver formula. Note: You are not restricted to a single field.
9. Click OK.
103
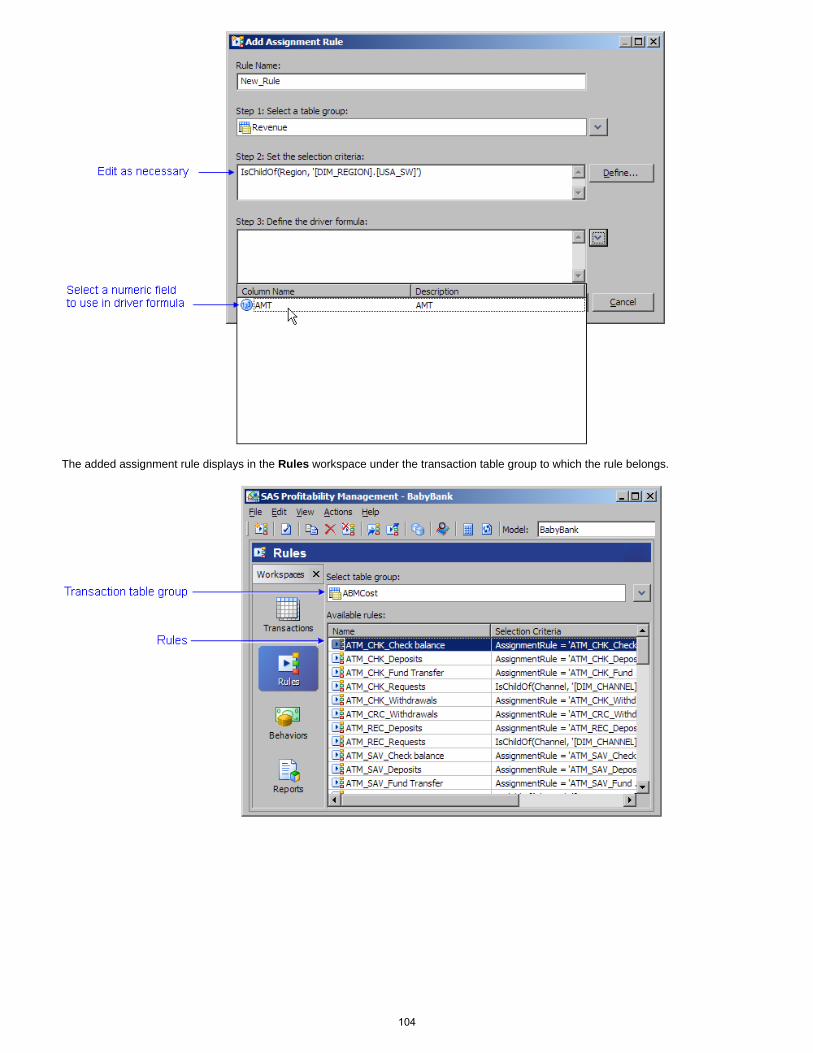
The added assignment rule displays in the Rules workspace under the transaction table group to which the rule belongs.
104

Associate an Assignment Rule with a Behavior
Because an assignment rule selects rows from a group of transaction tables, the effect of associating an assignment rule with a behavior is associating the behavior with a set of transaction table rows.
1. Activate the Behaviors workspace, and then select a model.
2. Select a behavior.
3. Click Create a new association (or click the Create a New Association icon, or select File Create a New Association). The Associate Rules window opens.
4. Select a table group.
5. Select additional behaviors to associate with a rule.
❍ Every behavior must be associated with a rule.
❍ A rule can be associated with multiple behaviors.
6. Select a rule to apply to the selected behaviors.
7. Click OK. The new assignment rule displays in the Behaviors workspace.
105
Import a Rule Association Table
1. Activate the Behaviors workspace, and then select a model to which you want to import the rule associations.
2. Select Actions Import Associations. The Import Associations window opens.
3. Click Select to select a rule association table. The Select Table window opens. Select a rule association table, and then click OK.
4. To preview the data in the rule association table, click Preview. The Preview window opens and the rule association table is displayed.
5. Click OK.
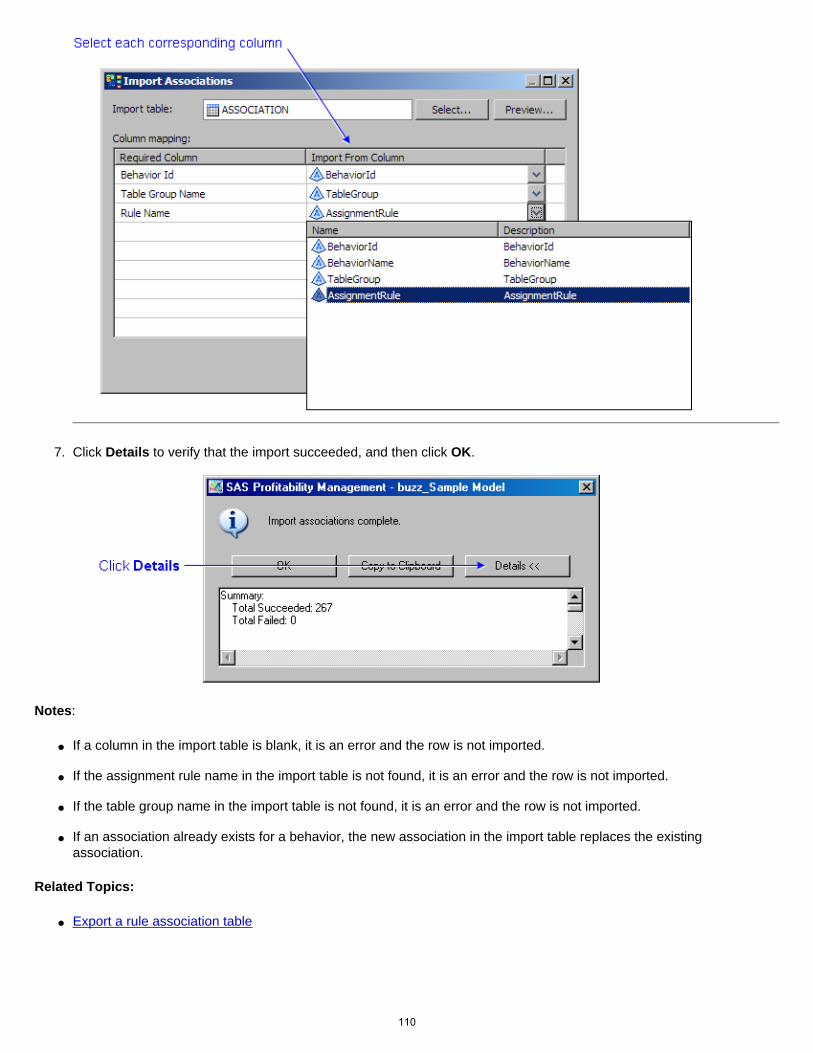
6. For each required column in a rule association table, identify the corresponding column in the table that is being imported, and then click OK. A window with the message Import associations complete appears.
7. Click Details to verify that the import succeeded, and then click OK.
Notes:
● If a column in the import table is blank, it is an error and the row is not imported.
● If the assignment rule name in the import table is not found, it is an error and the row is not imported.
● If the table group name in the import table is not found, it is an error and the row is not imported.
● If an association already exists for a behavior, the new association in the import table replaces the existing association.
Related Topics:
106
● Export a rule association table
107
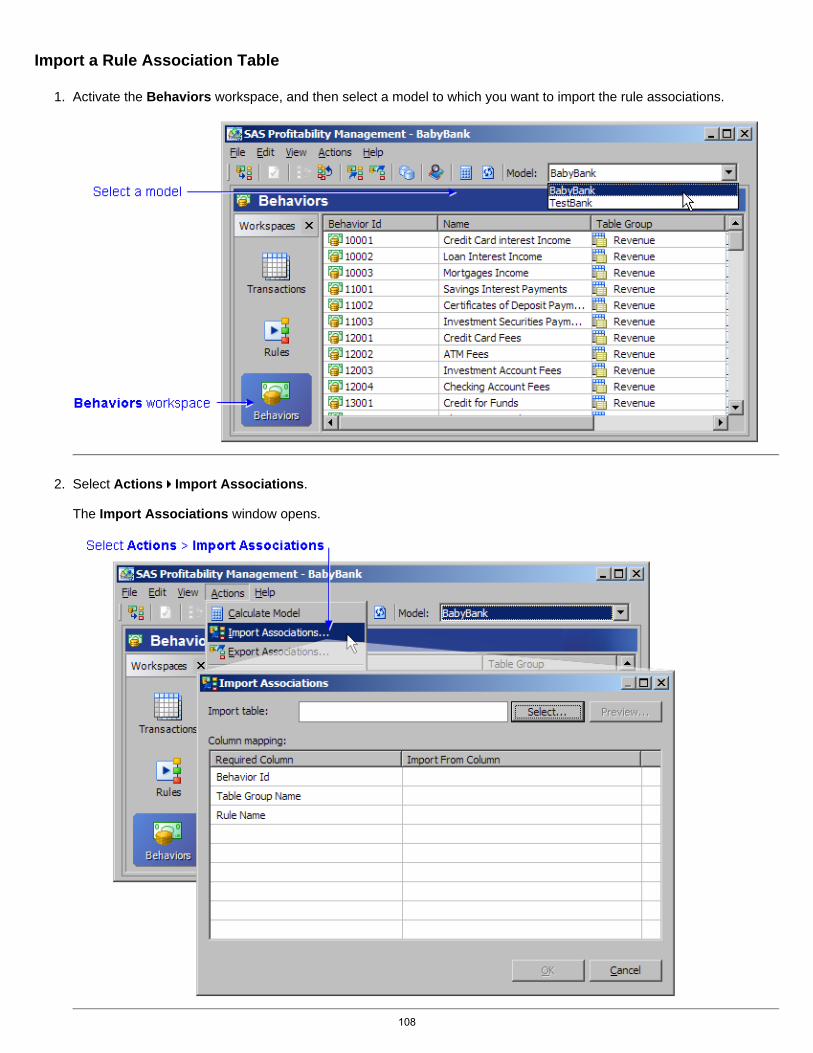
Import a Rule Association Table
1. Activate the Behaviors workspace, and then select a model to which you want to import the rule associations.
2. Select Actions Import Associations. The Import Associations window opens.
108
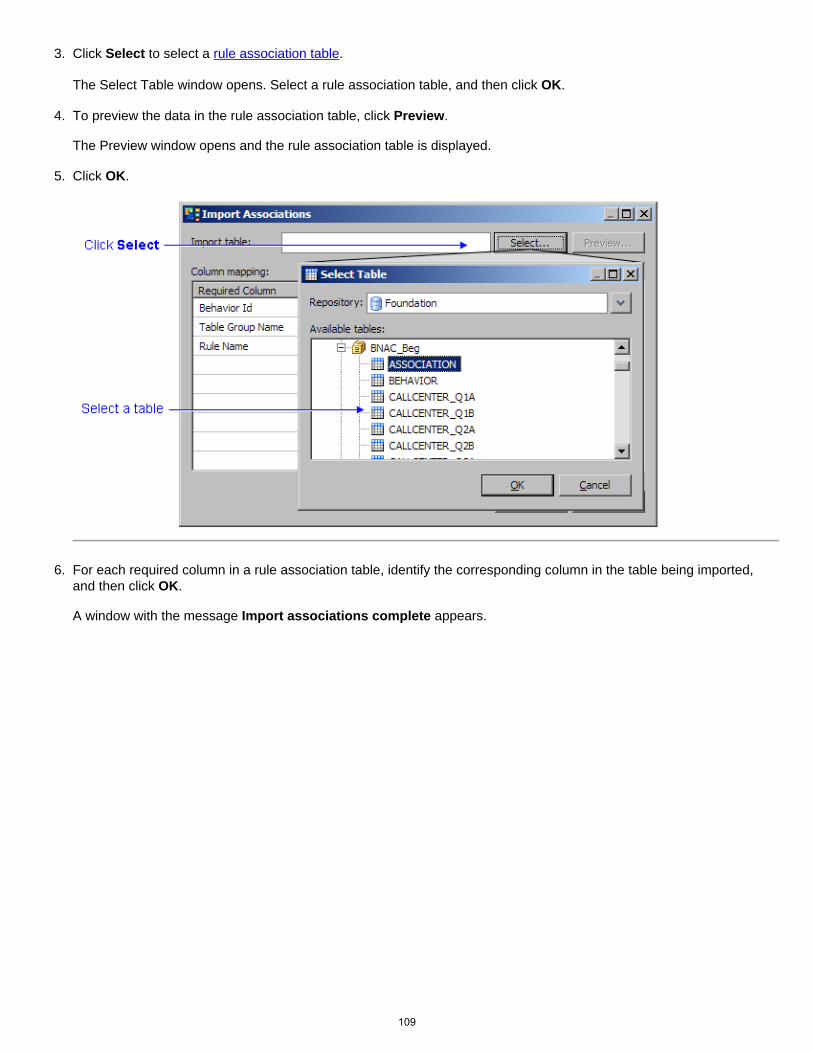
3. Click Select to select a rule association table. The Select Table window opens. Select a rule association table, and then click OK.
4. To preview the data in the rule association table, click Preview. The Preview window opens and the rule association table is displayed.
5. Click OK.
6. For each required column in a rule association table, identify the corresponding column in the table being imported, and then click OK. A window with the message Import associations complete appears.
109
7. Click Details to verify that the import succeeded, and then click OK.
Notes:
● If a column in the import table is blank, it is an error and the row is not imported.
● If the assignment rule name in the import table is not found, it is an error and the row is not imported.
● If the table group name in the import table is not found, it is an error and the row is not imported.
● If an association already exists for a behavior, the new association in the import table replaces the existing association.
Related Topics:
● Export a rule association table
110
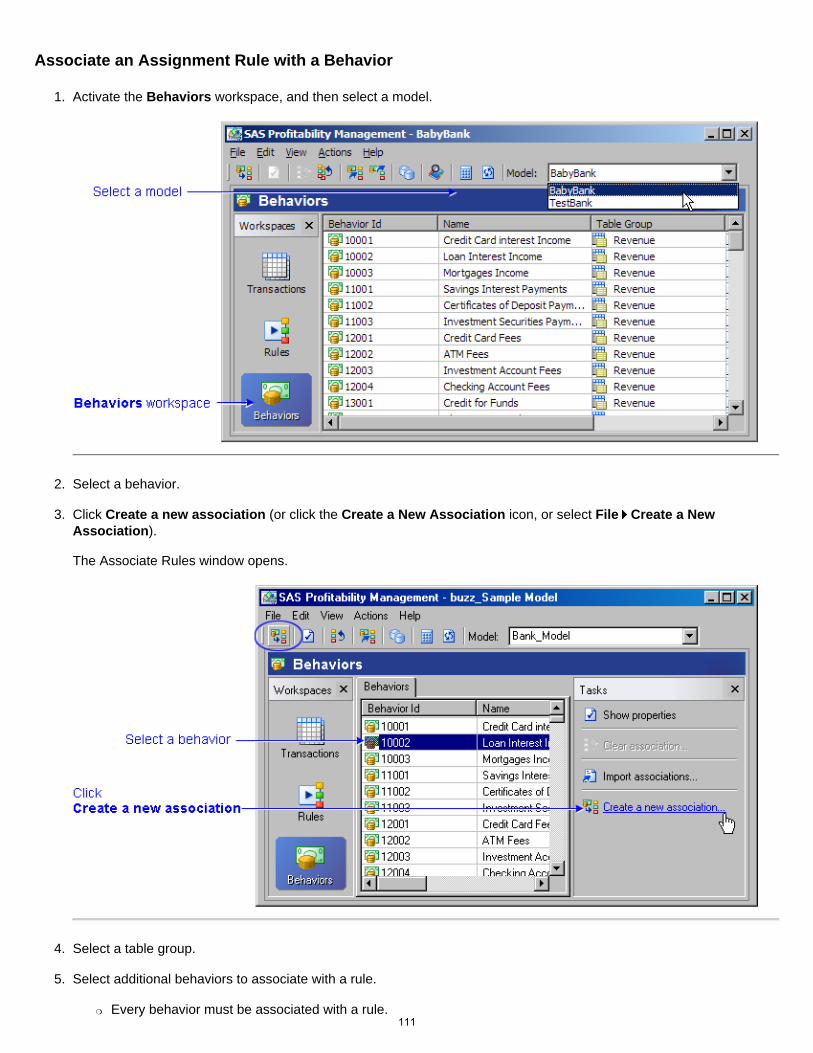
Associate an Assignment Rule with a Behavior
1. Activate the Behaviors workspace, and then select a model.
2. Select a behavior.
3. Click Create a new association (or click the Create a New Association icon, or select File Create a New Association). The Associate Rules window opens.
4. Select a table group.
5. Select additional behaviors to associate with a rule.
❍ Every behavior must be associated with a rule. 111
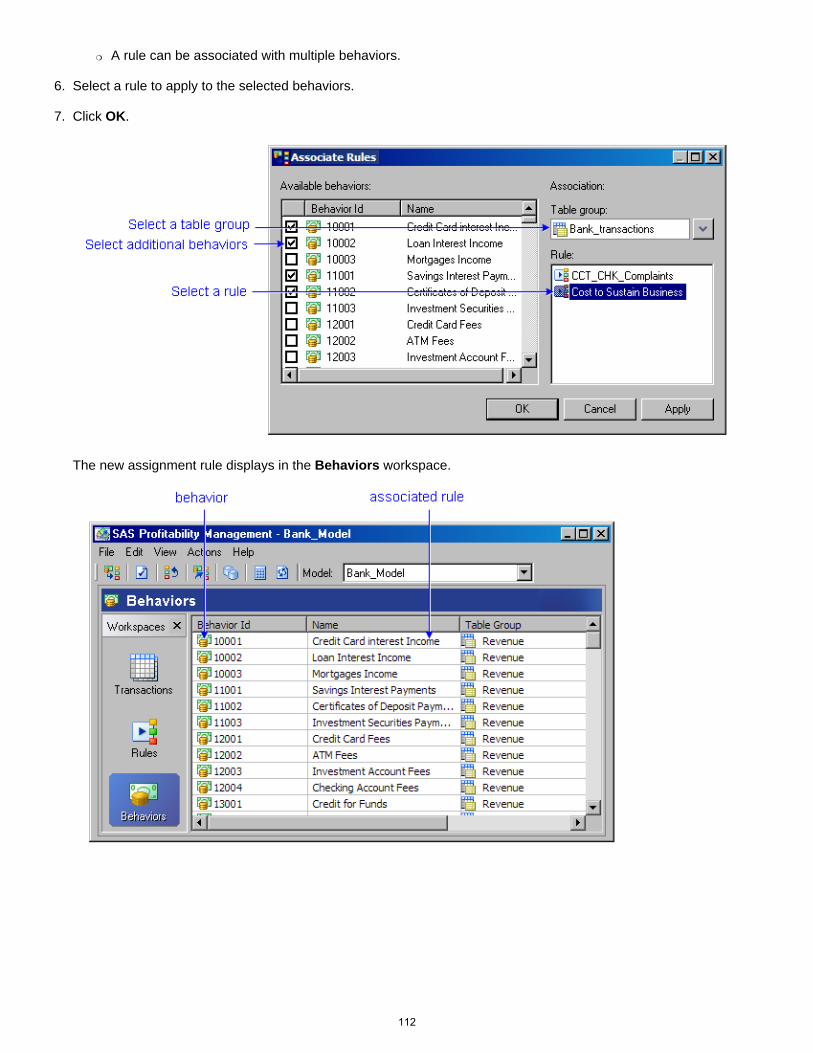
❍ A rule can be associated with multiple behaviors.
6. Select a rule to apply to the selected behaviors.
7. Click OK.
The new assignment rule displays in the Behaviors workspace.
112

5. Define Rules
An assignment rule associates rows in a transaction table with a behavior. An assignment rule:
● Is associated with one or more rows in a behavior table.
● Specifies which rows in a transaction table group to include in a calculation.
● Specifies what quantity to include in the calculation.
An assignment rule is implicitly associated with a single transaction table in a table group — namely, the transaction table whose period is specified in the behavior table row with which the assignment rule is associated.
Defining an assignment rule and associating it with a behavior is a two-step process.
1. Add an assignment rule to a transaction table group.
❍ One at a time
❍ By importing a rule definition table
2. Associate an assignment rule with a behavior.
❍ One at a time
❍ By importing a rule association table
Related Topics:
● Copy an assignment rule to a new name
● Clear an association between a behavior and an assignment rule
113

Suppress the Display of Blank Content
To suppress blank content, perform the following steps:
1. Log on to the SAS Web OLAP Viewer.
2. Select View Preferences.
3. Select Suppress empty data.
114
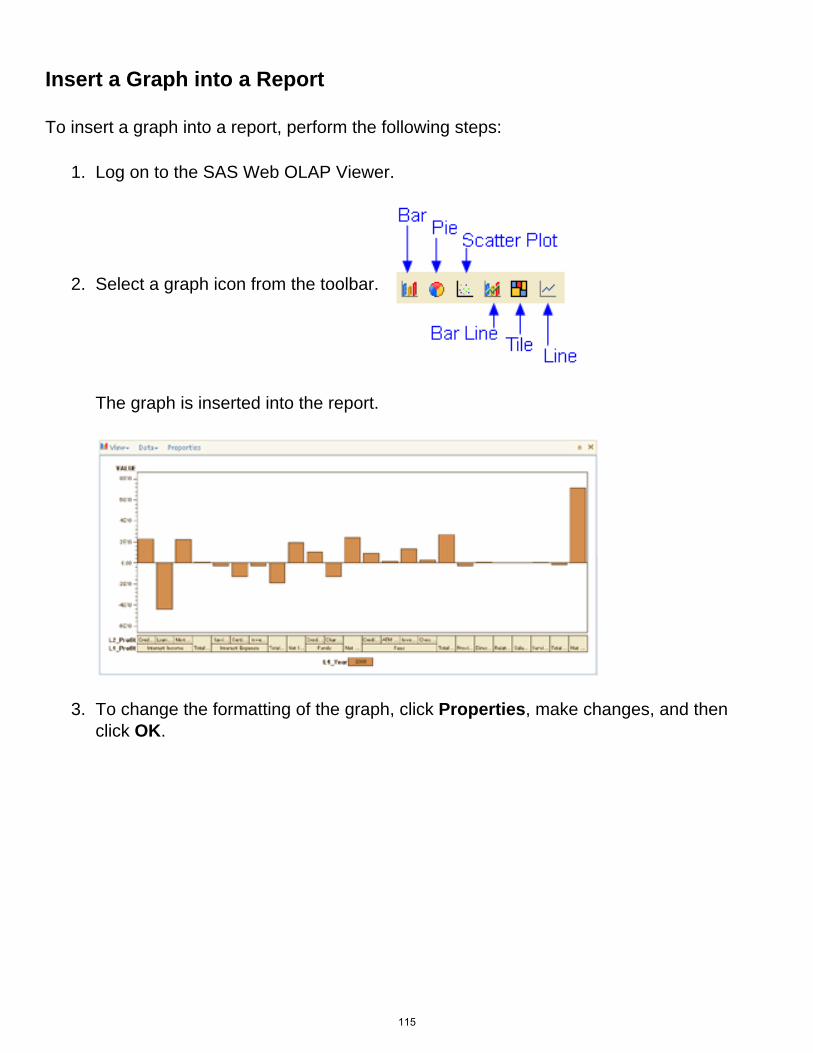
Insert a Graph into a Report
To insert a graph into a report, perform the following steps:
1. Log on to the SAS Web OLAP Viewer.
2. Select a graph icon from the toolbar.
The graph is inserted into the report.
3. To change the formatting of the graph, click Properties, make changes, and then click OK.
115

4. You can display the table and graph next to each other by selecting View Preferences and selecting two columns for the layout.
116
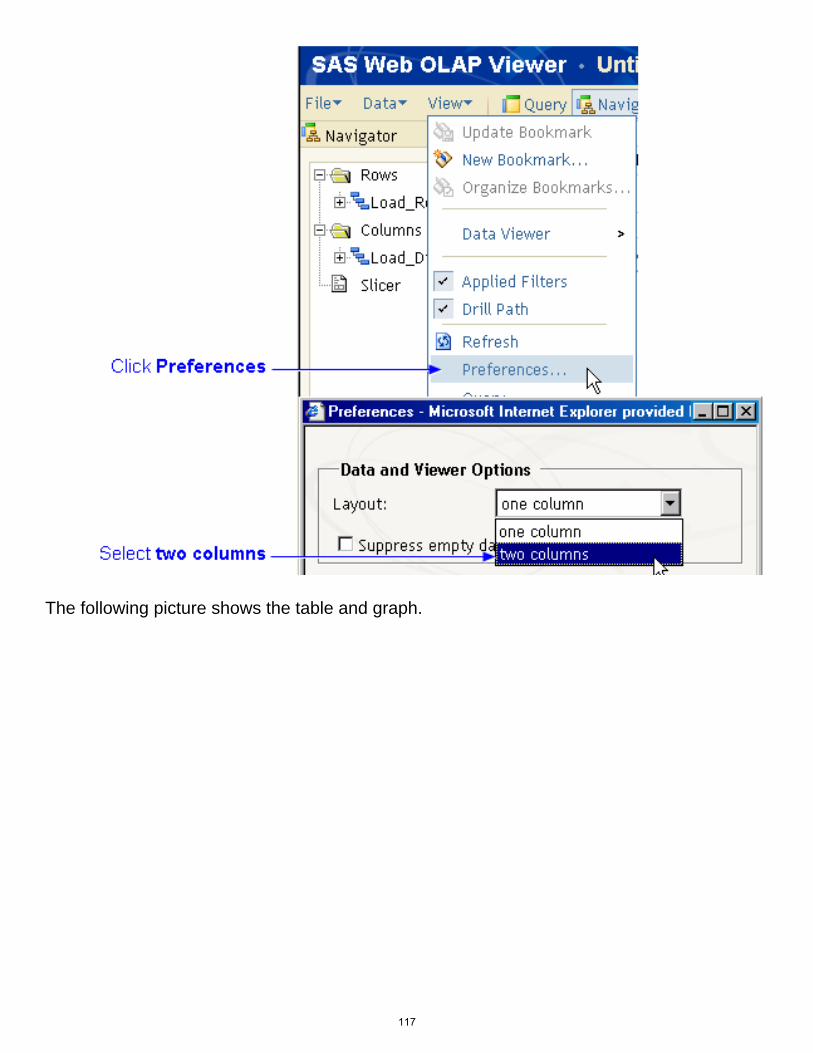
The following picture shows the table and graph.
117

118
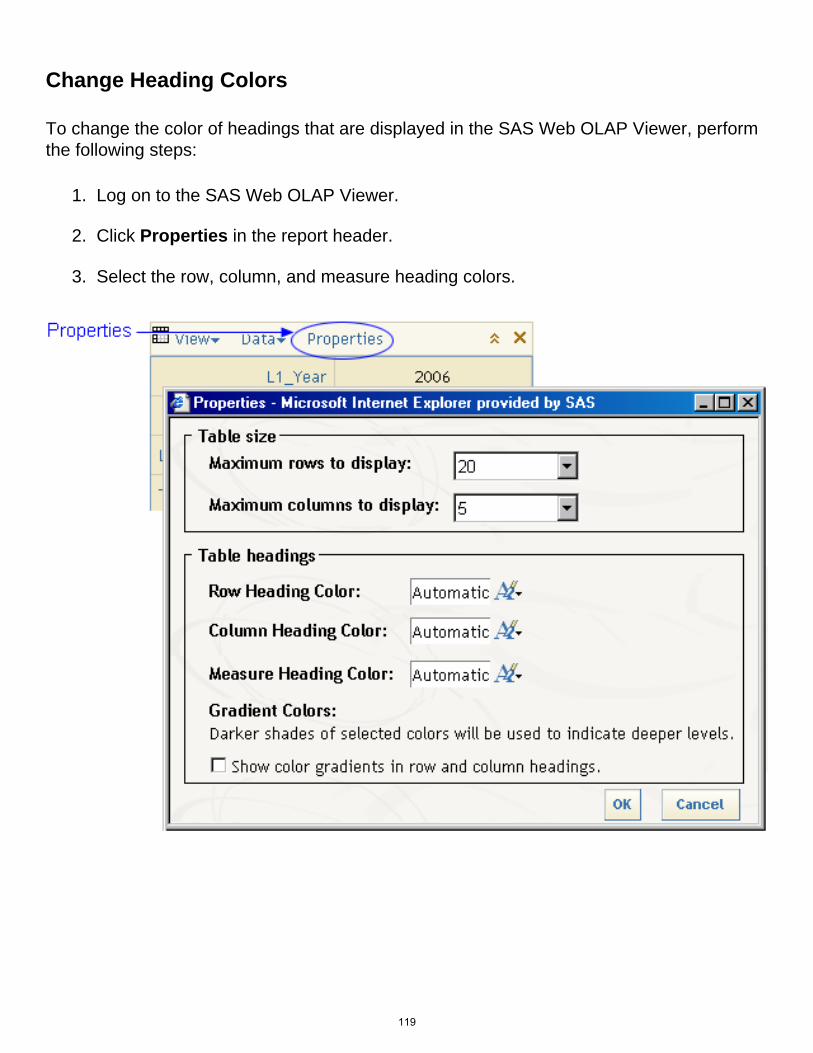
Change Heading Colors
To change the color of headings that are displayed in the SAS Web OLAP Viewer, perform the following steps:
1. Log on to the SAS Web OLAP Viewer.
2. Click Properties in the report header.
3. Select the row, column, and measure heading colors.
119
Drill into a Summary Report
● Drill by columns
● Drill by rows
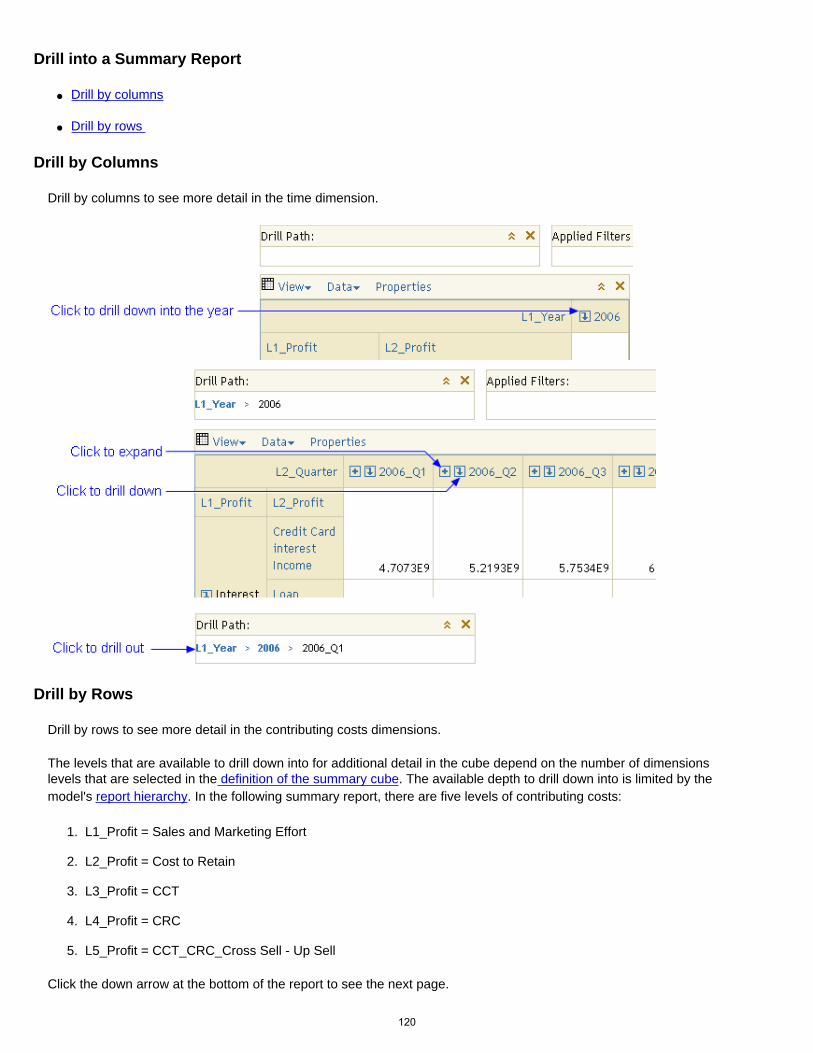
Drill by Columns
Drill by columns to see more detail in the time dimension.
Drill by Rows
Drill by rows to see more detail in the contributing costs dimensions.
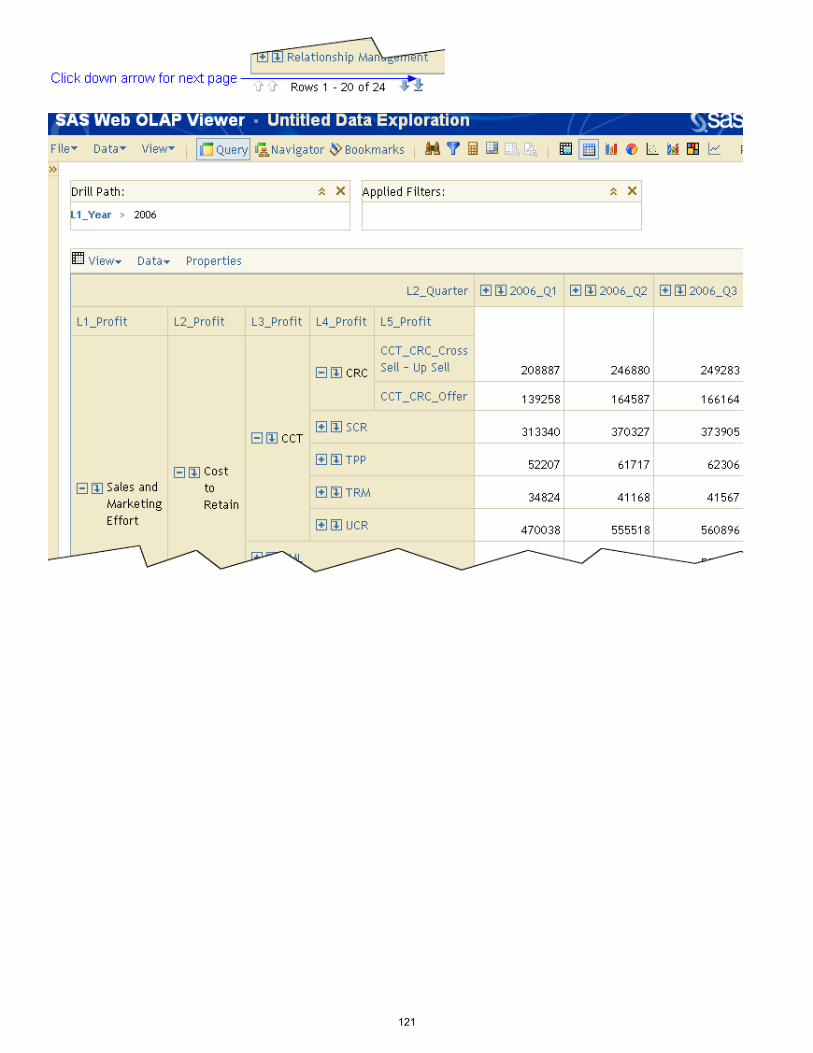
The levels that are available to drill down into for additional detail in the cube depend on the number of dimensions levels that are selected in the definition of the summary cube. The available depth to drill down into is limited by the model's report hierarchy. In the following summary report, there are five levels of contributing costs:
1. L1_Profit = Sales and Marketing Effort
2. L2_Profit = Cost to Retain
3. L3_Profit = CCT
4. L4_Profit = CRC
5. L5_Profit = CCT_CRC_Cross Sell - Up Sell
Click the down arrow at the bottom of the report to see the next page.
120
121
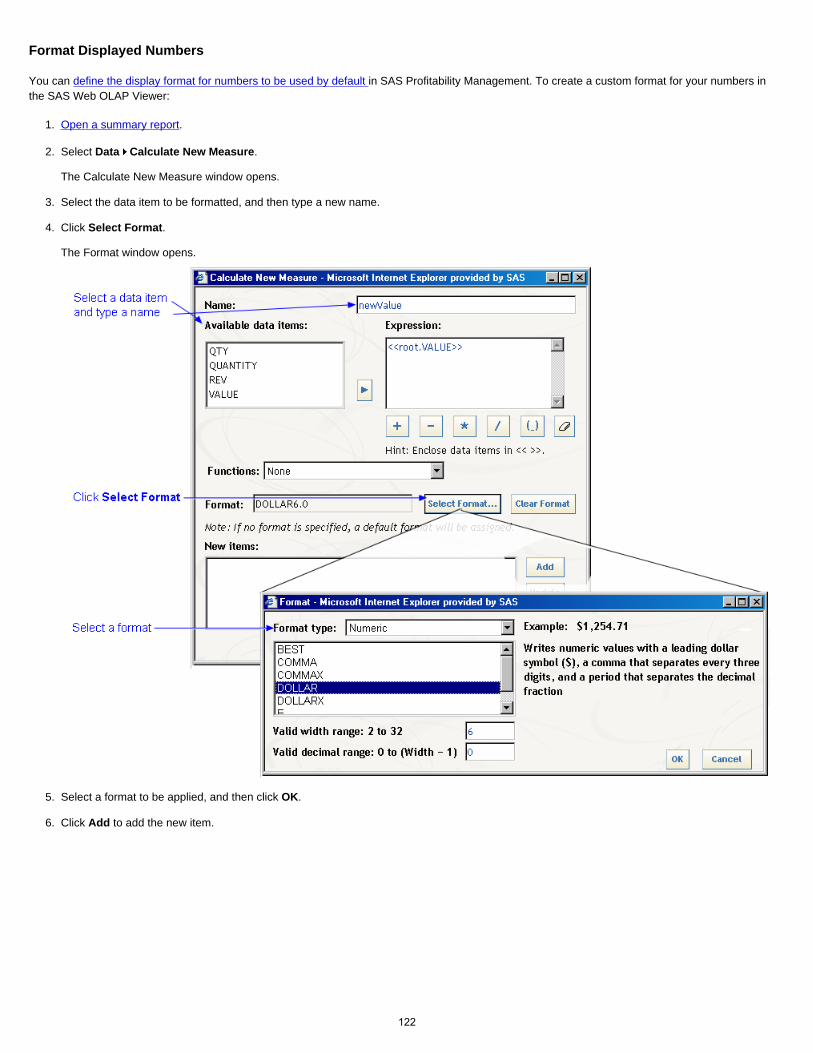
Format Displayed Numbers
You can define the display format for numbers to be used by default in SAS Profitability Management. To create a custom format for your numbers in the SAS Web OLAP Viewer:
1. Open a summary report.
2. Select Data Calculate New Measure. The Calculate New Measure window opens.
3. Select the data item to be formatted, and then type a new name.
4. Click Select Format. The Format window opens.
5. Select a format to be applied, and then click OK.
6. Click Add to add the new item.
122
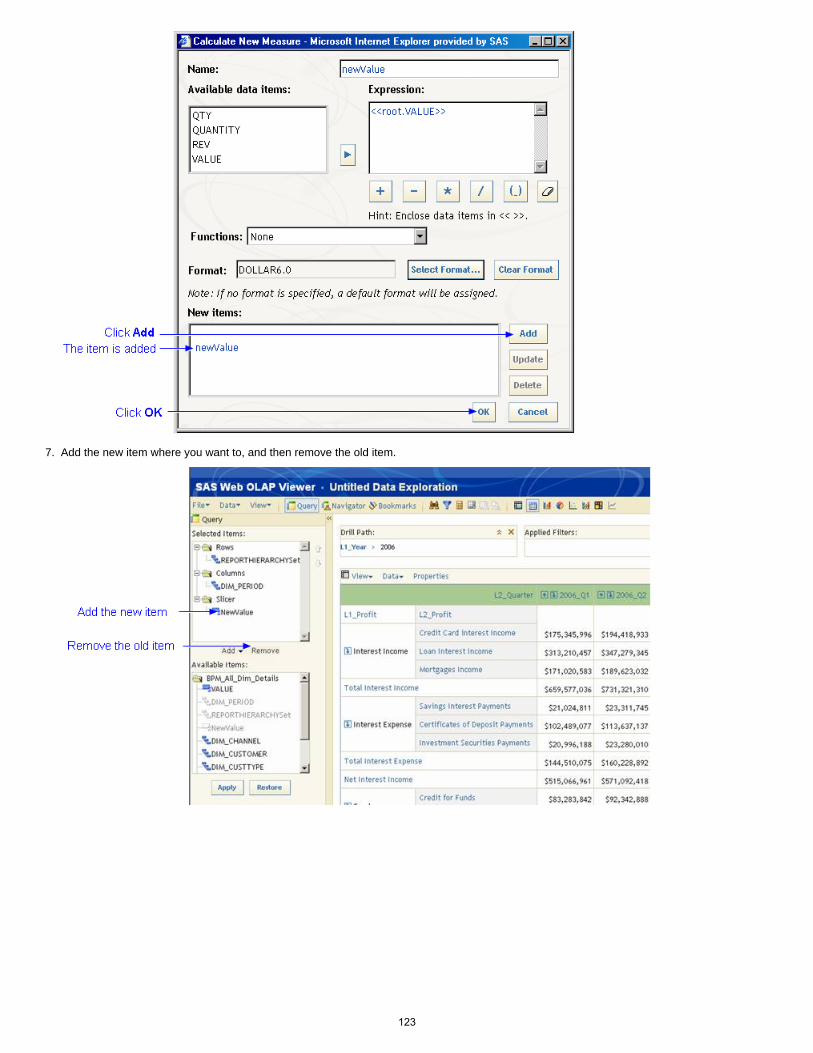
7. Add the new item where you want to, and then remove the old item.
123

Select Specific Values to Display
To filter by value, perform the following steps:
1. Log on to the SAS Web OLAP Viewer.
2. Click the filter icon on the toolbar, or select Data Filters.
3. Select the dimension to filter by (row or column).
4. Select the values to include in the report, and then click OK.
5. The resulting report lists the applied filters in the header of the report and applies the filters.
124

Open a Summary Report
Use the SAS Profitability Management Web Reporting Client to select a summary report for viewing. The report is viewed with the SAS Web OLAP Viewer. To view a summary report, perform the following steps:
1. Log on to the SAS Profitability Management Web Reporting Client. User IDs and passwords were established during installation. The exact URL to use depends on your server installation. A sample URL is the following:
http://profitmgmt:8080/SASProfitability/LogonCreate.do
2. Click the Summary Reports tab.
3. Select a model.
4. Select a cube.
The selected cube opens in the SAS Web OLAP Viewer. The SAS Web OLAP Viewer displays the profit-and-loss report. The default configuration for the report is the following:
Rows Report hierarchy dimension from SAS Profitability Management
Columns Period dimension from SAS Profitability Management
Slicer Value - the cost and revenue properties from SAS Profitability Management
For additional information about customizing profit-and-loss report in the SAS Web OLAP Viewer, see its online Help.125

126

Change the Number of Rows or Columns That Are Displayed
To change the number of rows or columns that are displayed in the SAS Web OLAP Viewer, perform the following steps:
1. Log on to the SAS Web OLAP Viewer.
2. Click Properties in the report header.
3. Select the maximum number of rows and columns to display.
127

Save a View of a Report
To save a view of a report, including its data and layout, perform the following steps:
1. Select File Save As.
2. Select the location where you want to save the view.
3. Name the view.
4. Select Data Exploration as the type, and then click Save.
128

View System Information
To view system information, such as storage locations, perform the following steps:
1. Select Help About.
2. Click System Information. The System Information window opens.
129
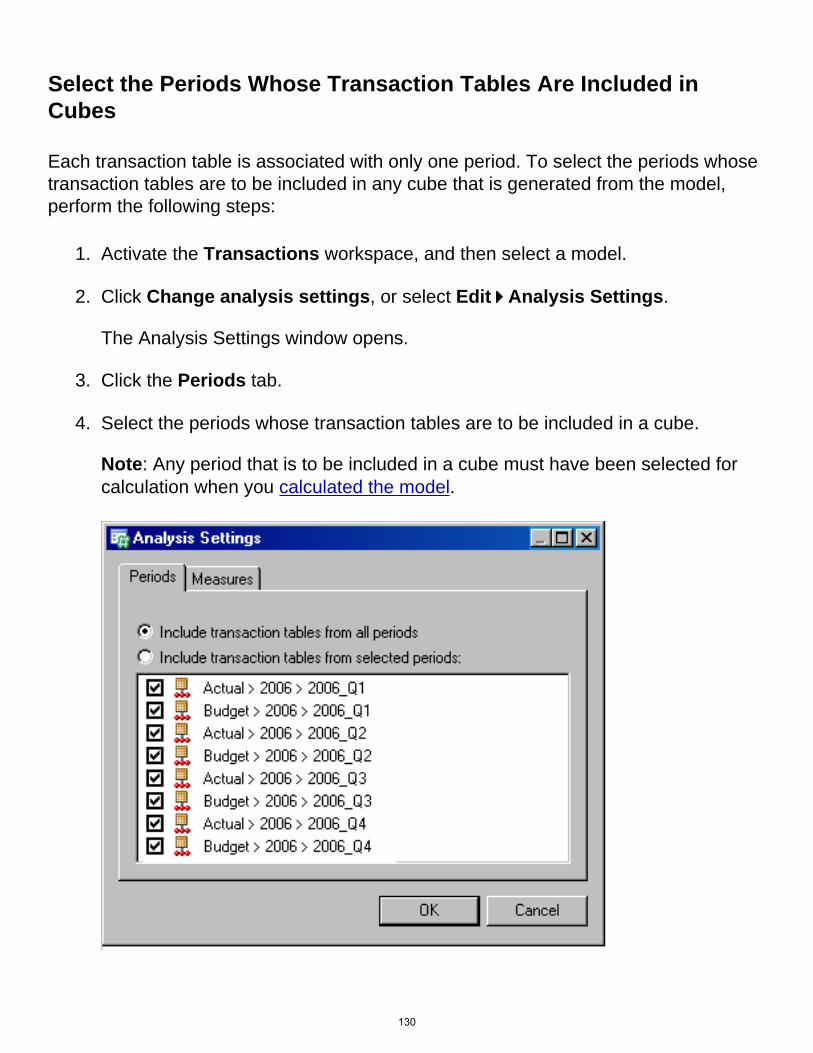
Select the Periods Whose Transaction Tables Are Included in Cubes
Each transaction table is associated with only one period. To select the periods whose transaction tables are to be included in any cube that is generated from the model, perform the following steps:
1. Activate the Transactions workspace, and then select a model.
2. Click Change analysis settings, or select Edit Analysis Settings. The Analysis Settings window opens.
3. Click the Periods tab.
4. Select the periods whose transaction tables are to be included in a cube. Note: Any period that is to be included in a cube must have been selected for calculation when you calculated the model.
130
Clear Associations
To clear an association between an assignment rule and a behavior, perform the following steps:
1. Activate the Behaviors workspace, and select a model.
2. Select a behavior.
3. Click Clear association, or select Edit Clear Association.
4. Click Yes.
131
Copy an Assignment Rule to a New Name
To copy an assignment rule to a new name, perform the following steps:
1. Activate the Rules workspace, and then select a model.
2. Select the assignment rule to be copied.
3. Click Copy assignment rule, or select Edit Copy Assignment Rule. The Copy Assignment Rule window opens.
4. Type the new name of the assignment rule.
5. Select the transaction table group to which the assignment rule applies.
6. Click OK.
132
Delete All Assignment Rules
To delete all assignment rules, perform the following steps:
1. Activate the Rules workspace, and select a table group.
2. Click Delete all assignment rules, or select Edit Delete all assignment rules.
133
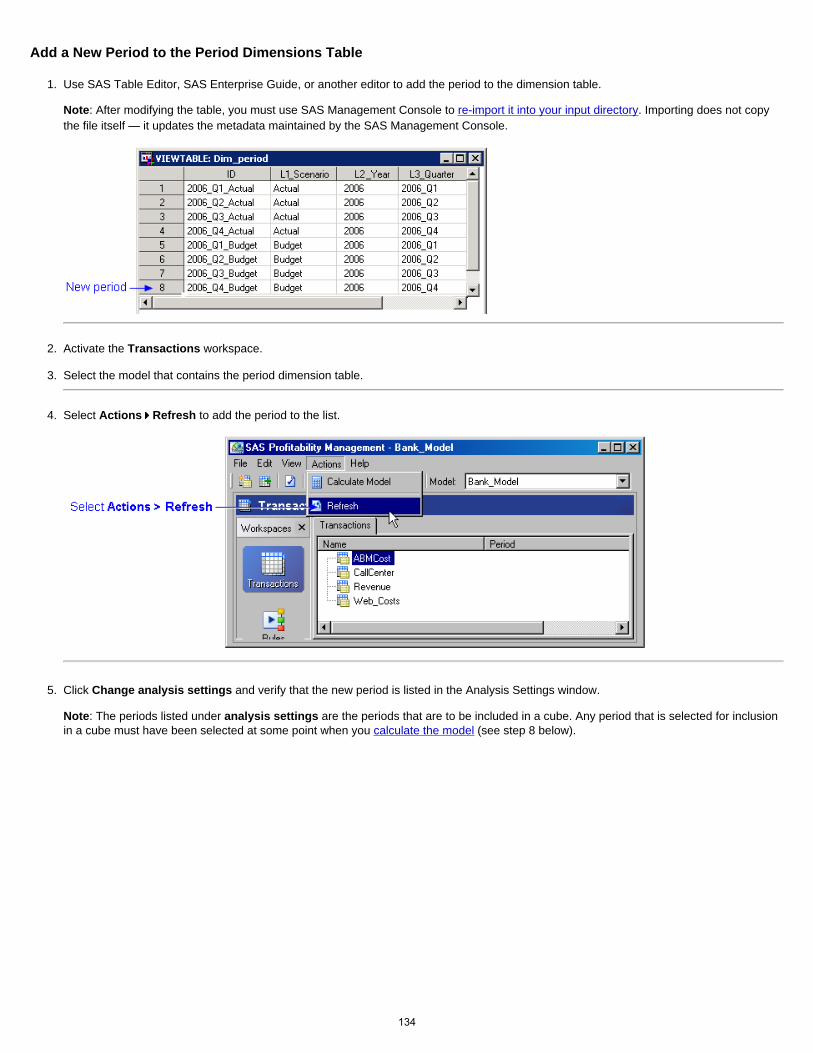
Add a New Period to the Period Dimensions Table
1. Use SAS Table Editor, SAS Enterprise Guide, or another editor to add the period to the dimension table. Note: After modifying the table, you must use SAS Management Console to re-import it into your input directory. Importing does not copy the file itself — it updates the metadata maintained by the SAS Management Console.
2. Activate the Transactions workspace.
3. Select the model that contains the period dimension table.
4. Select Actions Refresh to add the period to the list.
5. Click Change analysis settings and verify that the new period is listed in the Analysis Settings window. Note: The periods listed under analysis settings are the periods that are to be included in a cube. Any period that is selected for inclusion in a cube must have been selected at some point when you calculate the model (see step 8 below).
134
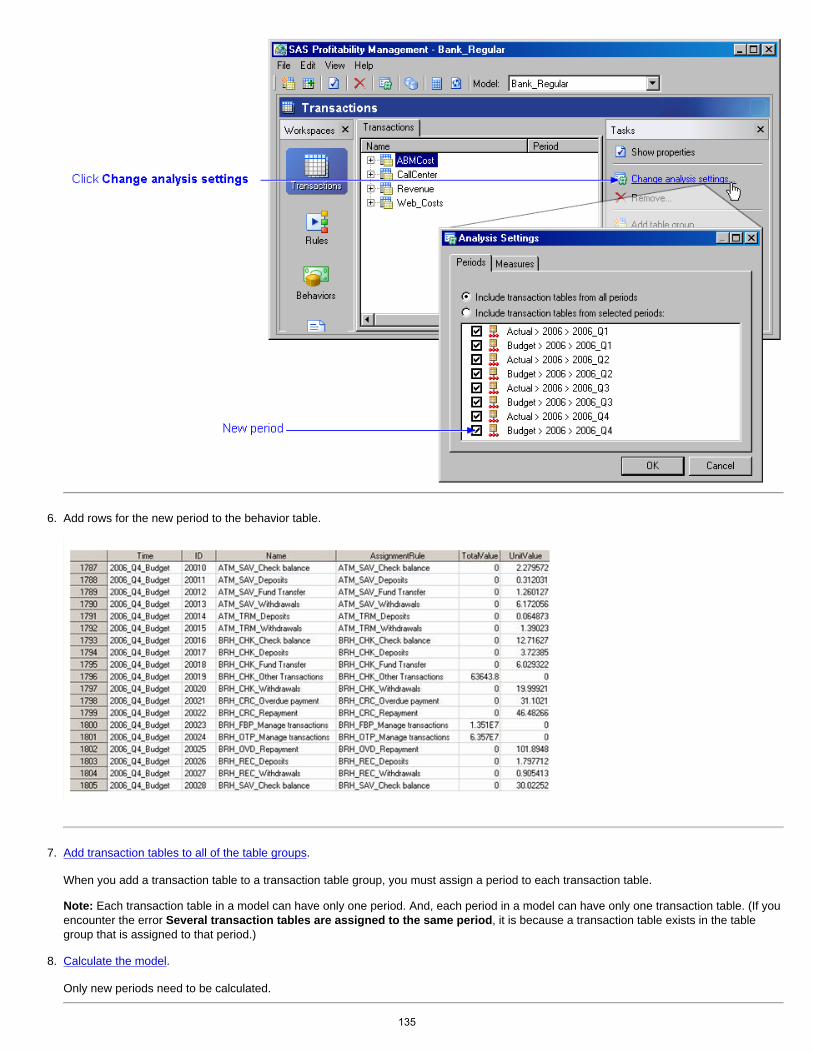
6. Add rows for the new period to the behavior table.
7. Add transaction tables to all of the table groups. When you add a transaction table to a transaction table group, you must assign a period to each transaction table. Note: Each transaction table in a model can have only one period. And, each period in a model can have only one transaction table. (If you encounter the error Several transaction tables are assigned to the same period, it is because a transaction table exists in the table group that is assigned to that period.)
8. Calculate the model. Only new periods need to be calculated.
135
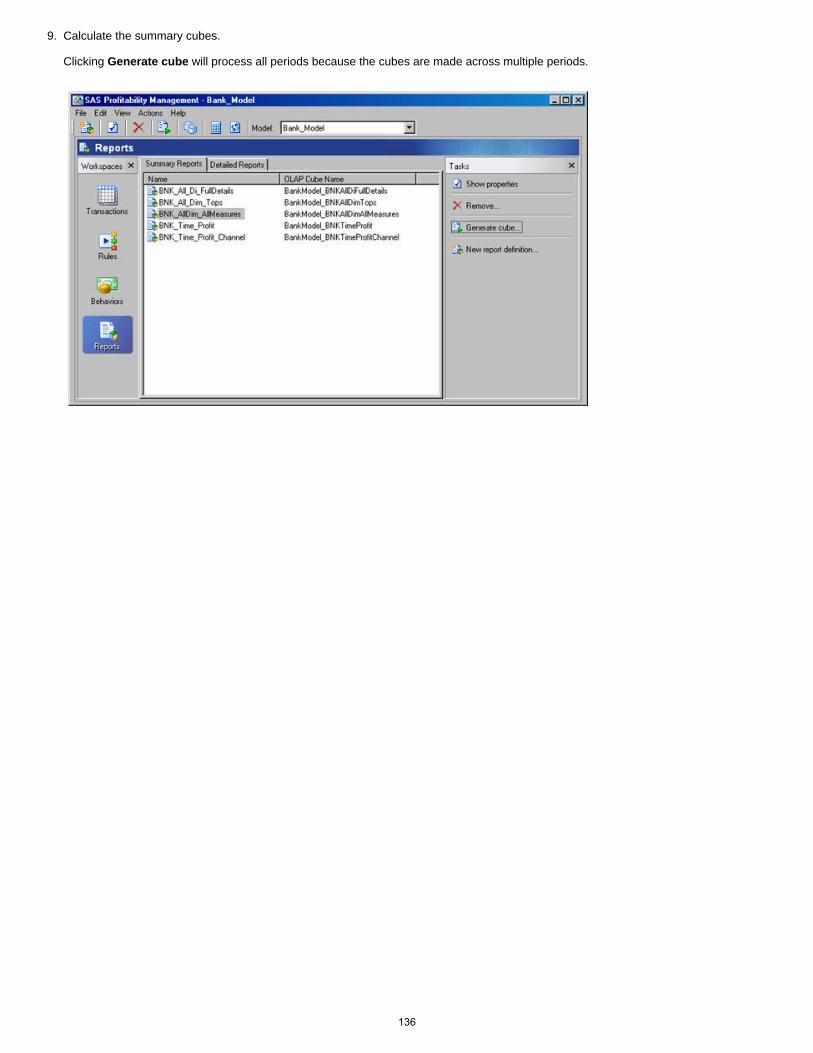
9. Calculate the summary cubes. Clicking Generate cube will process all periods because the cubes are made across multiple periods.
136
Working with Behaviors
● Clear an association
● Associate an assignment rule with a behavior
● Import a rule association table
● Copy an assignment rule to a new name
137
Working with Cubes
● Generate a cube
● Edit the properties of a cube
● Select the periods whose transaction tables are included in cubes
● Define the display format for numbers
● View a cube (summary report)
● Format displayed numbers
138

Define Reports
● Define a summary report
● Define a detail report
● Add labels to a report
● Define the display format for numbers
139
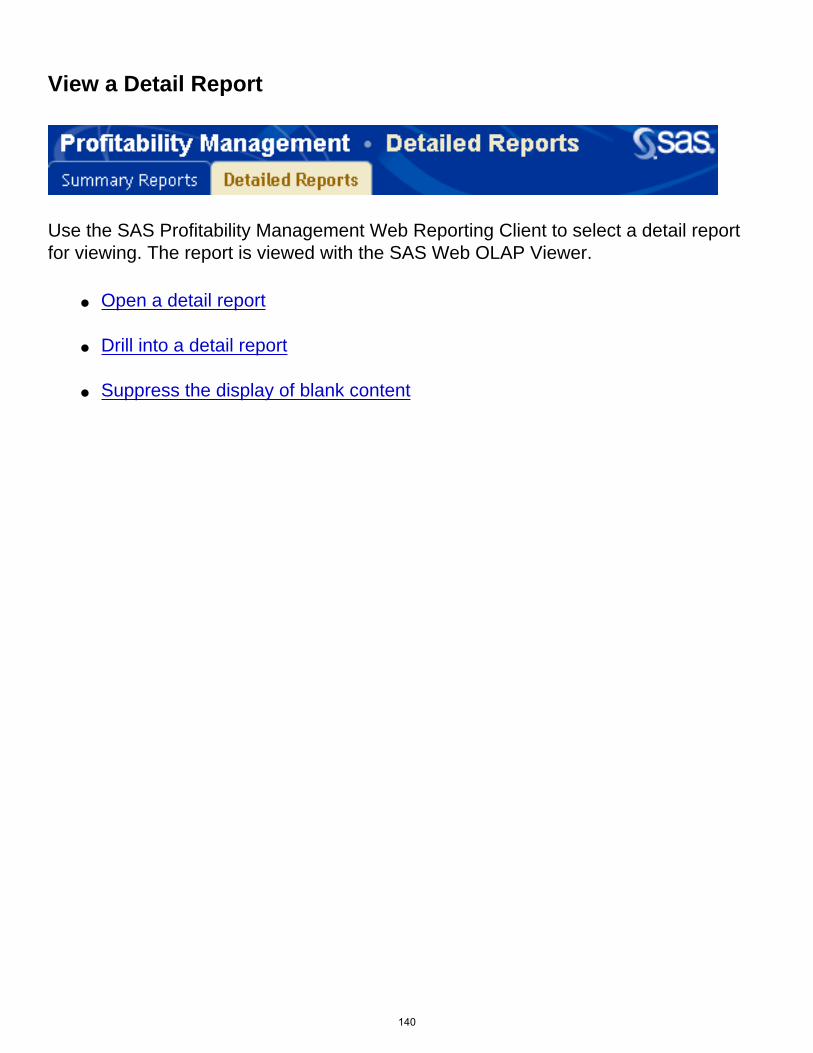
View a Detail Report
Use the SAS Profitability Management Web Reporting Client to select a detail report for viewing. The report is viewed with the SAS Web OLAP Viewer.
● Open a detail report
● Drill into a detail report
● Suppress the display of blank content
140
Working with Dimensions
● Add a new period to the period dimensions table
141

Working with Models
● Create a new profitability model
● Calculate a model
● Edit a model
142

Working with Reports
Define Reports
● Define a summary report
● Define a detail report
● Add labels to a report
● Define the display format for numbers
View Summary Reports
● Open a summary report
● Drill into a summary report
● Suppress the display of blank content
● Select specific values to display
● Change the number of rows or columns that are displayed
● Change heading colors
● Format displayed numbers
● Insert a graph into a report
● Save a view of a report
View Detail Reports
● Open a detail report
● Drill into a detail report
● Suppress the display of blank content
143
144
Working with Rules
● Add an assignment rule to a transaction table group
● Import a rule definition table
● Export a rule definition table
● Associate an assignment rule with a behavior
● Import a rule association table
● Export a rule association table
● Copy an assignment rule to a new name
● Clear an association
145
Set Up the Environment
● Populate the input directory
● Identify input and output directories to SAS Profitability Management
● Import tables into the input directory
● Add users
● Configure the server
● View system information
146

View a Summary Report
Use the SAS Profitability Management Web Reporting Client to select a summary report for viewing. The report is viewed with the SAS Web OLAP Viewer.
● Open a summary report
● Drill into a summary report
● Suppress the display of blank content
● Select specific values to display
● Change the number of rows or columns displayed
● Change heading colors.
● Format displayed numbers.
● Insert a graph
● Save a view of a report
147

Working with Transactions
● Define a transaction table group
● Select the periods whose transaction tables are included in cubes
● Define the display format for numbers
148

Tasks
● Set up the environment
● Working with behaviors
● Working with cubes
● Working with dimensions
● Working with models
● Working with rules
● Working with transactions
● Working with reports
149
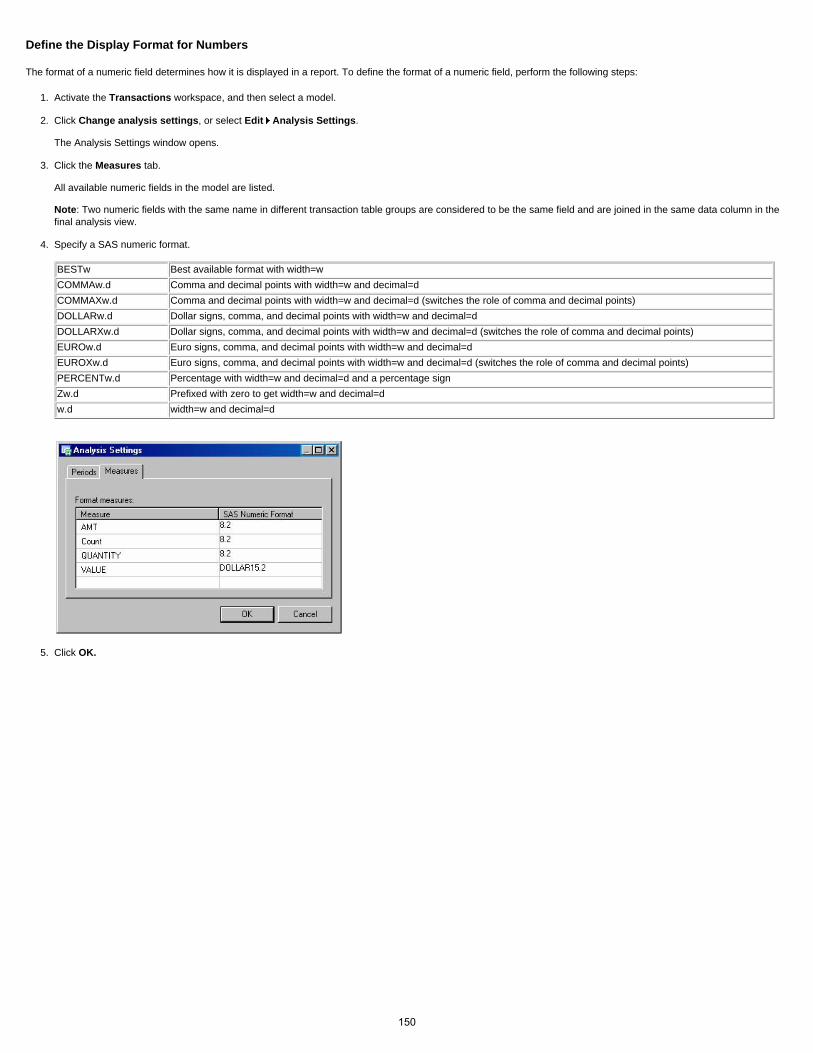
Define the Display Format for Numbers
The format of a numeric field determines how it is displayed in a report. To define the format of a numeric field, perform the following steps:
1. Activate the Transactions workspace, and then select a model.
2. Click Change analysis settings, or select Edit Analysis Settings. The Analysis Settings window opens.
3. Click the Measures tab. All available numeric fields in the model are listed. Note: Two numeric fields with the same name in different transaction table groups are considered to be the same field and are joined in the same data column in the final analysis view.
4. Specify a SAS numeric format. BESTw Best available format with width=wCOMMAw.d Comma and decimal points with width=w and decimal=dCOMMAXw.d Comma and decimal points with width=w and decimal=d (switches the role of comma and decimal points)DOLLARw.d Dollar signs, comma, and decimal points with width=w and decimal=dDOLLARXw.d Dollar signs, comma, and decimal points with width=w and decimal=d (switches the role of comma and decimal points)EUROw.d Euro signs, comma, and decimal points with width=w and decimal=dEUROXw.d Euro signs, comma, and decimal points with width=w and decimal=d (switches the role of comma and decimal points)PERCENTw.d Percentage with width=w and decimal=d and a percentage signZw.d Prefixed with zero to get width=w and decimal=dw.d width=w and decimal=d
5. Click OK.
150

Toolbar for Behaviors
Create a New Association
Opens the Associate Rules window.
Available behaviors - The list of behaviors
Select table group - The list of table groups for the rule source
Apply rule - The list of rules
OK - Apply the selections and close the window
Cancel - Cancel the selections and close the window
Associate -
Disassociate -
Properties
Displays the properties for the selected items.
General tab
Name - The name of the behavior
Reference - The ID for the behavior
151

Association -
Clear Association
Clears the assignment rule association from the behavior.
Clear all associations
Clears all assignment rule associations from all behaviors.
Import Associations
Opens the Import Associations window.
Import table - The source table in which you have created your associations
Select -
Preview -
Column mapping
Behavior Id - The text property that defines the behavior
Table Group Name - The table group for the rule source
Rule Name - The name of the rule to map to the behavior
OK - Accept changes and close the window
Cancel - Cancel changes and close the window
152

Export Associations
Opens the Export Associations window.
Table Name -
Save in -
Select -
OK -
Cancel -
Organize Models
Opens the Organize Models window.
Models - Select the model from the list
New Model - Start the Add Model wizard
Properties - Display the properties for the selected model
General tab
Name -
Description -
Time dimension -
Select -
Preview -
153

Analysis tab
Analysis view name - The name for the model
Analysis view library -
Select -
Output table library -
Select -
Data Location tab
Server folder -
Metadata folder -
Behavior Table tab
Behavior table -
Select -
Preview -
Column mapping
Id - The key that will be used to map cost to reporting
Name - The description for the field
Unit Value - The source unit cost amount that is used in calculations
Total Value - The source total cost amount that is used in calculations
Period -
154
Dimensions tab
Name - Each dimension in the SAS Profitability Management model
Levels - Each layer in each dimension
Preview -
Add -
Remove -
Reports tab
Report hierarchy - The source table that is used to define the drill-down hierarchy in the contributing cost dimensions for reporting
Select -
Preview -
Report layout - The source table that is used to define the calculation for the profit and loss statement
Select -
Preview -
OK -
Cancel -
Delete - Remove the selected model
Close - Close the window
155
Audit Log
Opens the Audit Log window.
Calculate Model
Opens the Calculate wizard.
Refresh
Refreshes the screen to display the current table source data. When you change the underlying SAS tables, you should always refresh before you continue editing the content in SAS Profitability Management.
156
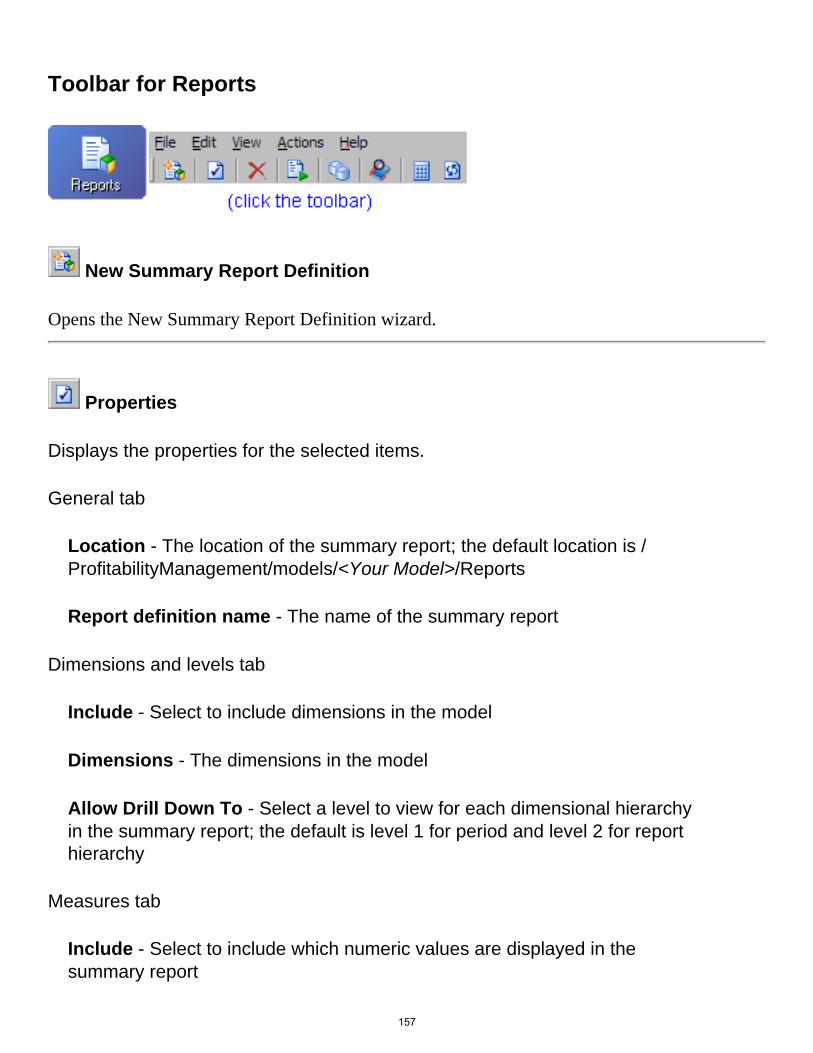
Toolbar for Reports
New Summary Report Definition
Opens the New Summary Report Definition wizard.
Properties
Displays the properties for the selected items.
General tab
Location - The location of the summary report; the default location is /ProfitabilityManagement/models/<Your Model>/Reports
Report definition name - The name of the summary report
Dimensions and levels tab
Include - Select to include dimensions in the model
Dimensions - The dimensions in the model
Allow Drill Down To - Select a level to view for each dimensional hierarchy in the summary report; the default is level 1 for period and level 2 for report hierarchy
Measures tab
Include - Select to include which numeric values are displayed in the summary report
157
Measures - All available numeric properties
Remove
Deletes the selected items.
Generate Cube
Generates a cube. After the cube is generated, a dialog box is displayed.
OK -
Copy to Clipboard -
Details -
Organize Models
Opens the Organize Models window.
Models - Select the model from the list
New Model - Start the Add Model wizard
Properties - Display the properties for the selected model
General tab
Name -
Description -
158
Time dimension -
Select -
Preview -
Analysis tab
Analysis view name - The name for the model
Analysis view library -
Select -
Output table library -
Select -
Data Location tab
Server folder -
Metadata folder -
Behavior Table tab
Behavior table -
Select -
Preview -
Column mapping
Id - The key that will be used to map cost to reporting
Name - The description for the field
Unit Value - The source unit cost amount that is used in calculations
159
Total Value - The source total cost amount that is used in calculations
Period -
Dimensions tab
Name - Each dimension in the SAS Profitability Management model
Levels - Each layer in each dimension
Preview -
Add -
Remove -
Reports tab
Report hierarchy - The source table that is used to define the drill-down hierarchy in the contributing cost dimensions for reporting
Select -
Preview -
Report layout - The source table that is used to define the calculation for the profit and loss statement
Select -
Preview -
OK -
Cancel -
Delete - Remove the selected model
160
Close - Close the window
Audit Log
Opens the Audit Log window.
Calculate Model
Opens the Calculate wizard.
Refresh
Refreshes the screen to display the current table source data. When you change the underlying SAS tables, you should always refresh before you continue editing the content in SAS Profitability Management.
161

Toolbar for Rules
Add Assignment Rule
Rule Name - The name of the assignment rule
Step 1: Select a table group - The assignment rule will be assigned to all transactions in this group
Step 2: Set the selection criteria - The selection criteria defines which records in the source transaction tables will receive assigned costs from a specific source account
Define - Opens the Selection Criteria window
Column name - Column to filter from source table
Operator - Filter
Text Fields Operators: =, not =
Numeric Fields Operators: =, not =, <, <=, >, >=
Dimension Fields Operator: is child of
Value -
Select -
Text Field: List of all text values in the source table
Numeric Field: List of all numeric values in the source table
Dimensional Fields: Dimension member from dimensional
162

hierarchy; the is child of operator includes a member in the hierarchy and all children of the selected member in the filter
Add New Row -
Compound Filter Options - And or Or
Step 3: Define the driver formula - The driver formula defines how much of a source account is assigned to a destination account that has been selected by the filter; this definition is based on the source transactional table quantities and values
Properties
Transaction Table - General tab
Table group name
Description
Transaction Table - Columns tab
Include
Source column
Description
Category
Assignment Rule - General tab
Rule Name - The name of the rule
Step 1: Select a table group
Step 2: Set the selection criteria
163

Step 3: Define the driver formula
Copy Assignment Rule
Opens the Copy Assignment Rule window.
Name - The name of the copied assignment rule
Location - The table group in which to place the assignment rule in
Remove
Deletes the selected items.
Delete All Assignment Rules
Deletes all assignment rules.
Import Assignment Rules
Opens the Import Rules window.
Import table - Source table in which rules are defined
Select -
Preview -
Column mapping
164
Name - The name of the rule that is being defined
Selection Criteria - The filter criteria for the rule definition
Driver Formula - The numeric properties that are defined for the driver formula
Table Group Name - The table group in which the rule will be applied
OK - Accept changes and close the window
Cancel - Cancel changes and close the window
Export Assignment Rules
Opens the Export Rules window.
Table Name -
Save in -
Select -
Organize Models
Opens the Organize Models window.
Models - Select the model from the list
New Model - Start the Add Model wizard
Properties - Display the properties for the selected model
165

General tab
Name -
Description -
Time dimension -
Select -
Preview -
Analysis tab
Analysis view name - The name for the model
Analysis view library -
Select -
Output table library -
Select -
Data Location tab
Server folder -
Metadata folder -
Behavior Table tab
Behavior table -
Select -
Preview -
Column mapping
166
Id - The key that will be used to map cost to reporting
Name - The description for the field
Unit Value - The source unit cost amount that is used in calculations
Total Value - The source total cost amount that is used in calculations
Period -
Dimensions tab
Name - Each dimension in the SAS Profitability Management model
Levels - Each layer in each dimension
Preview -
Add -
Remove -
Reports tab
Report hierarchy - The source table that is used to define the drill-down hierarchy in the contributing cost dimensions for reporting
Select -
Preview -
Report layout - The source table that is used to define the calculation for the profit and loss statement
Select -
Preview -
167
OK -
Cancel -
Delete - Remove the selected model
Close - Close the window
Audit Log
Opens the Audit Log window.
Calculate Model
Opens the Calculate wizard.
Refresh
Refreshes the screen to display the current table source data. When you change the underlying SAS tables, you should always refresh before you continue editing the content in SAS Profitability Management.
168

Menus and Toolbars
Menus ToolbarsMenus for Transactions
Toolbar for Transactions
Menus for Rules
Toolbar for Rules
Menus for Behaviors
Toolbar for Behaviors
Menus for Reports Toolbar for Reports
169

Toolbar for Transactions
Add Table Group
Opens the Add Table Group wizard.
Add Transaction Tables
Opens the Add Transaction Tables wizard.
Properties
Transaction Table - General tab
Table group name
Description
Transaction Table - Columns tab
Include
Source column
Description
Category
Transaction Table: General tab
170

Name - The name of the source table
Repository - The source table repository
SAS libref - The source table SAS libname
Table name - The name of the source table
Period - The correct period for this source table
Remove
Deletes the selected items.
Analysis Settings
Opens the Analysis Settings window.
Period tab
Include transaction tables from all periods
Include transaction tables from selected periods
Measures tab
Format measures
Measure
SAS Numeric Format - The display format for the reporting
OK - Accept any changes and close the window
Cancel - Cancel changes and close the window171
Audit Log
Opens the Audit Log window.
Organize Models
Opens the Organize Models window.
Models - Select the model from the list
New Model - Start the Add Model wizard
Properties - Display the properties for the selected model
General tab
Name -
Description -
Time dimension -
Select -
Preview -
Analysis tab
Analysis view name - The name for the model
Analysis view library -
Select -
172

Output table library -
Select -
Data Location tab
Server folder -
Metadata folder -
Behavior Table tab
Behavior table -
Select -
Preview -
Column mapping
Id - The key that will be used to map cost to reporting
Name - The description for the field
Unit Value - The source unit cost amount that is used in calculations
Total Value - The source total cost amount that is used in calculations
Period -
Dimensions tab
Name - Each dimension in the SAS Profitability Management model
Levels - Each layer in each dimension
Preview -
173
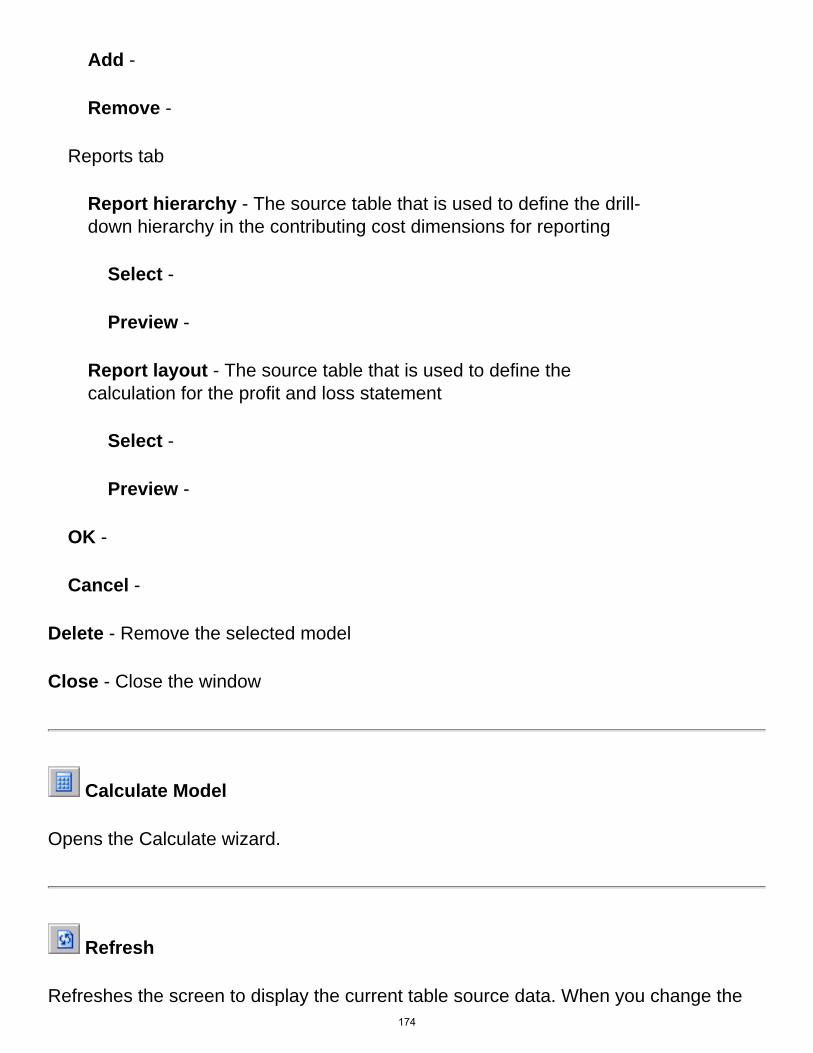
Add -
Remove -
Reports tab
Report hierarchy - The source table that is used to define the drill-down hierarchy in the contributing cost dimensions for reporting
Select -
Preview -
Report layout - The source table that is used to define the calculation for the profit and loss statement
Select -
Preview -
OK -
Cancel -
Delete - Remove the selected model
Close - Close the window
Calculate Model
Opens the Calculate wizard.
Refresh
Refreshes the screen to display the current table source data. When you change the 174

underlying SAS tables, you should always refresh before you continue editing the content in SAS Profitability Management.
Preview Data
Opens the Preview window.
175

Add Transaction Tables to a Table Group
To add transaction tables to a table group, perform the following steps:
1. Activate the Transactions workspace, and then select a model.
2. Select a transaction table group to which you want to add transaction tables.
3. Click Add transaction tables, or select File Add Transaction Tables. The Add Transaction Tables wizard opens.
4. On the Transaction Tables page, select the transaction tables to add to the table group.
5. Click Add.
6. Repeat steps 4 and 5 as necessary.
7. To preview the data in a transaction table, select a table from either list, and then click Preview. The Preview window opens and the transaction table is displayed.
8. Click OK, and then click Next.
9. On the Period page, assign a period to each transaction table. Note: Each transaction table in a model can have only one period. And, each period in a model can have only one transaction table. (If you encounter the error Several transaction tables are assigned to the same period, it is because a transaction table exists in the table group that is assigned to that period.)
10. Click Finish.
11. Transaction tables that have been added to a table group are displayed under the table group name in the Transactions workspace.
176
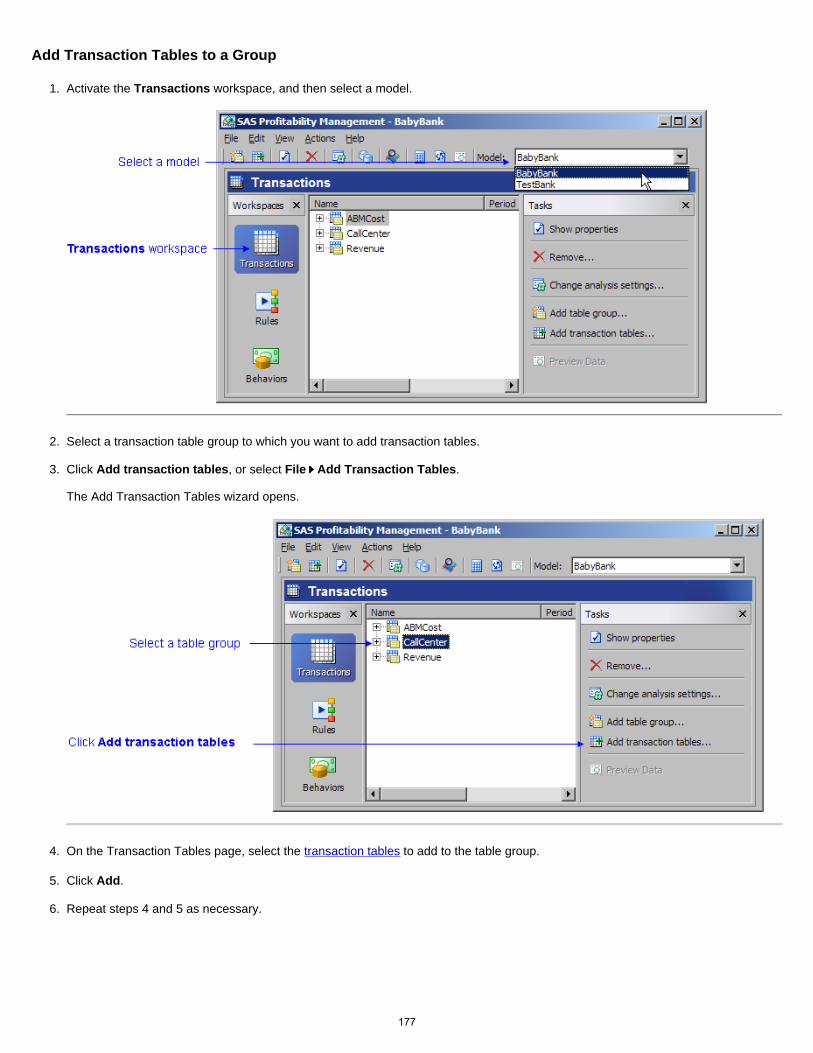
Add Transaction Tables to a Group
1. Activate the Transactions workspace, and then select a model.
2. Select a transaction table group to which you want to add transaction tables.
3. Click Add transaction tables, or select File Add Transaction Tables. The Add Transaction Tables wizard opens.
4. On the Transaction Tables page, select the transaction tables to add to the table group.
5. Click Add.
6. Repeat steps 4 and 5 as necessary.
177

7. To preview the data in a transaction table, select a table from either list, and then click Preview. The Preview window opens and the transaction table is displayed.
8. Click OK, and then click Next.
9. On the Period page, assign a period to each transaction table. Note: Each transaction table in a model can have only one period. And, each period in a model can have only one transaction table. (If you encounter the error Several transaction tables are assigned to the same period, it is because a transaction table exists in the table group that is assigned to that period.)
10. Click Finish.
178

11. Transaction tables that have been added to a table group are displayed under the table group name in the Transactions workspace.
179
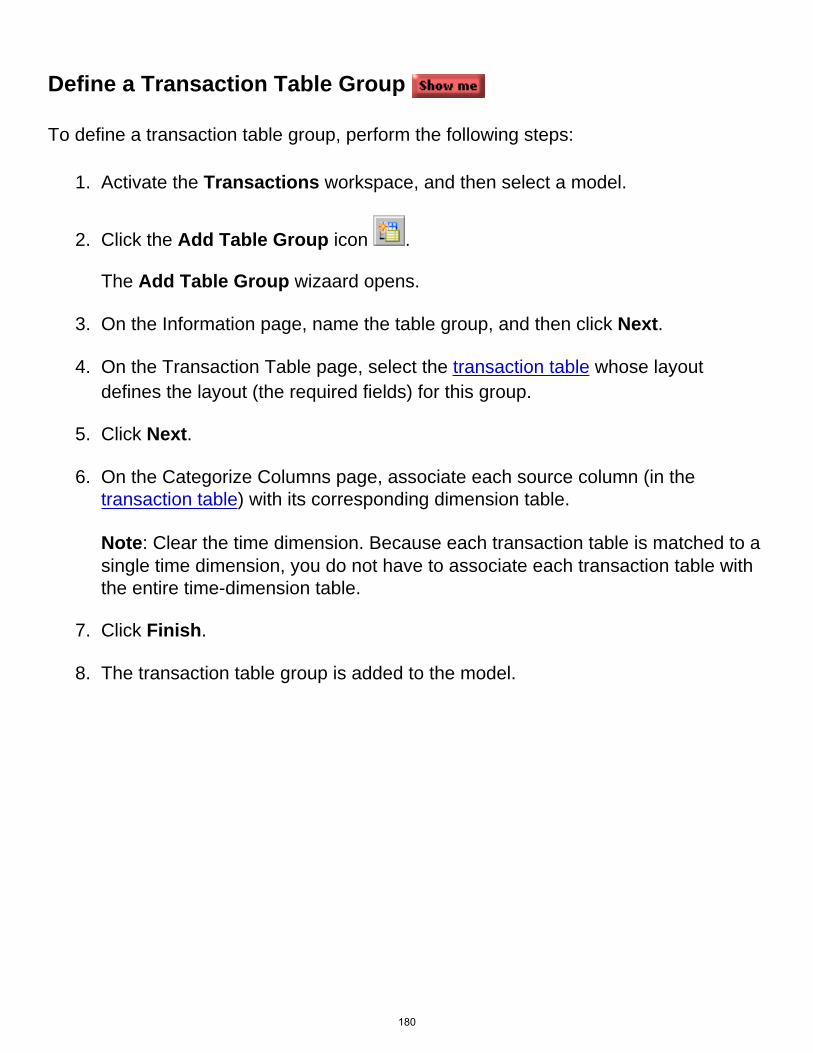
Define a Transaction Table Group
To define a transaction table group, perform the following steps:
1. Activate the Transactions workspace, and then select a model.
2. Click the Add Table Group icon . The Add Table Group wizaard opens.
3. On the Information page, name the table group, and then click Next.
4. On the Transaction Table page, select the transaction table whose layout defines the layout (the required fields) for this group.
5. Click Next.
6. On the Categorize Columns page, associate each source column (in the transaction table) with its corresponding dimension table. Note: Clear the time dimension. Because each transaction table is matched to a single time dimension, you do not have to associate each transaction table with the entire time-dimension table.
7. Click Finish.
8. The transaction table group is added to the model.
180

Define a Transaction Table Group
1. Activate the Transactions workspace, and then select a model.
2. Click the Add Table Group icon . The Add Table Group wizard opens.
3. On the Information page, name the table group, and then click Next.
4. On the Transaction Table page, select the transaction table whose layout defines the layout (the required fields) for this group.
5. Click Next.
181
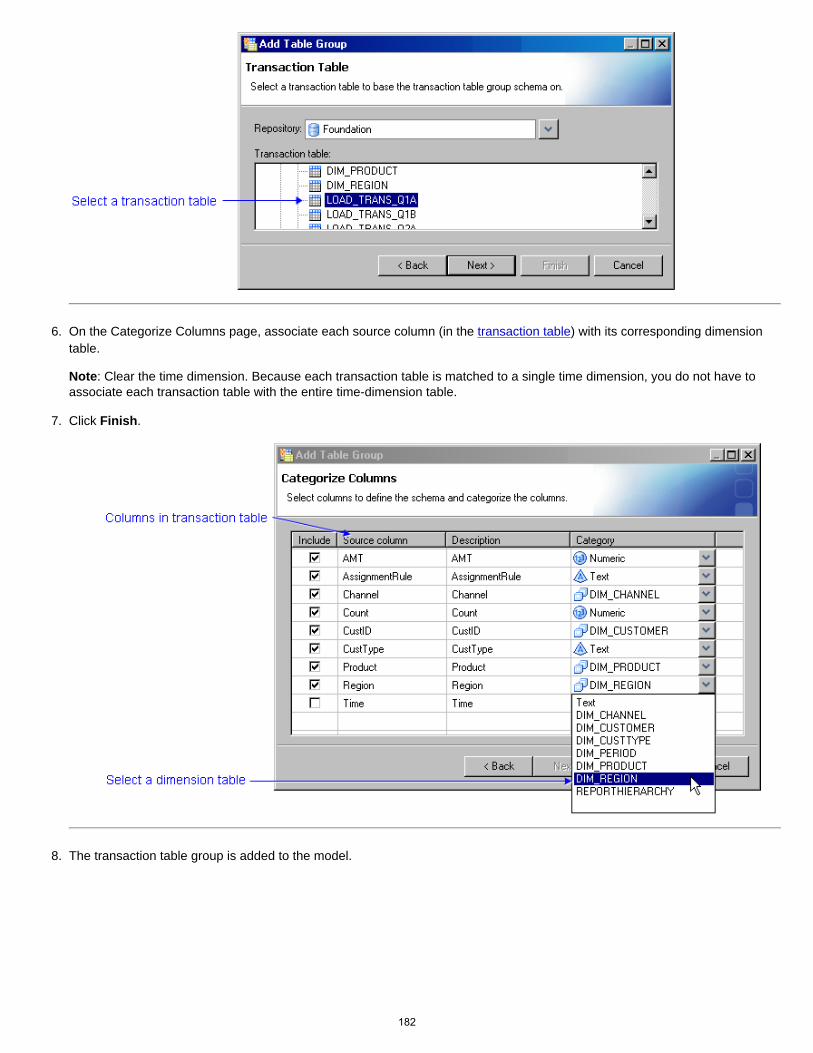
6. On the Categorize Columns page, associate each source column (in the transaction table) with its corresponding dimension table. Note: Clear the time dimension. Because each transaction table is matched to a single time dimension, you do not have to associate each transaction table with the entire time-dimension table.
7. Click Finish.
8. The transaction table group is added to the model.
182

183

4. Define Transaction Table Groups
Transaction tables that have the same columns defined are organized into a table group. A single SAS Profitability Management model is likely to have multiple table groups. Multiple rules will likely use the same source table group. There must be one transaction table for each period in a model.
Defining and populating groups of transaction tables is a two-part process:
1. Define a transaction table group.
2. Add transaction tables to a table group (and associate each transaction table with a time period).
Related Topics:
● Select the periods whose transaction tables are included in cubes
● Define the display format for numbers
● Add a new period to the period dimensions table
184
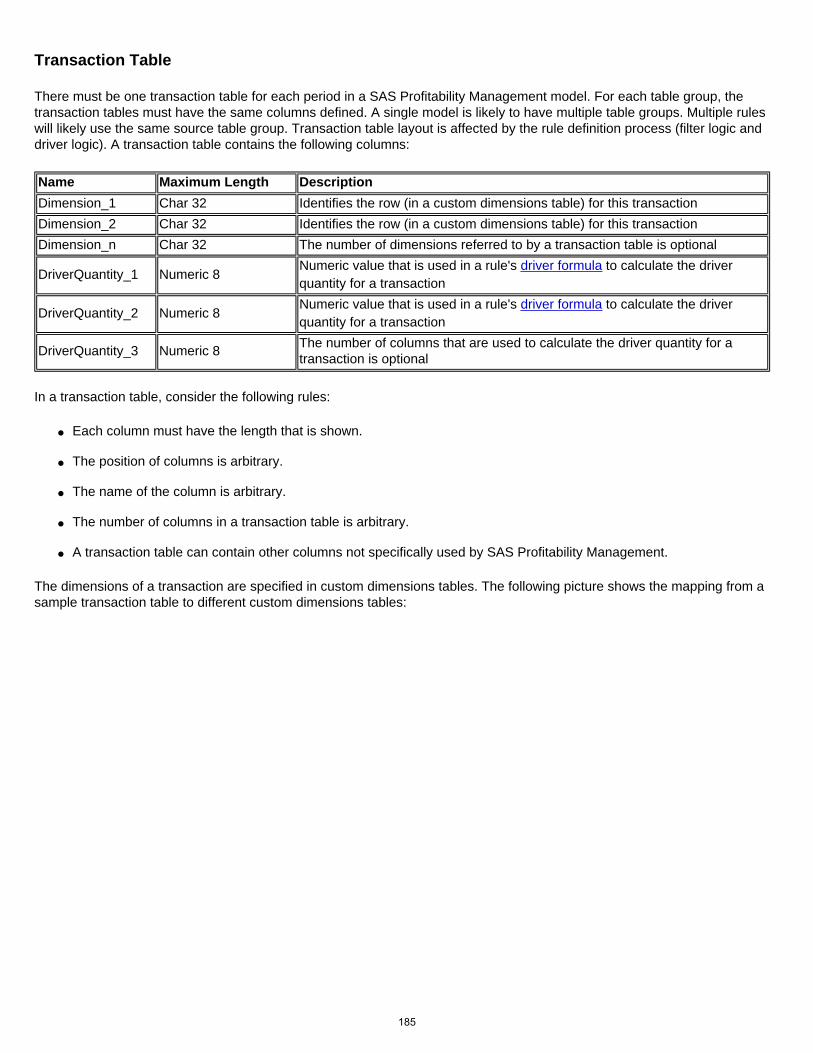
Transaction Table
There must be one transaction table for each period in a SAS Profitability Management model. For each table group, the transaction tables must have the same columns defined. A single model is likely to have multiple table groups. Multiple rules will likely use the same source table group. Transaction table layout is affected by the rule definition process (filter logic and driver logic). A transaction table contains the following columns:
Name Maximum Length DescriptionDimension_1 Char 32 Identifies the row (in a custom dimensions table) for this transactionDimension_2 Char 32 Identifies the row (in a custom dimensions table) for this transactionDimension_n Char 32 The number of dimensions referred to by a transaction table is optional
DriverQuantity_1 Numeric 8 Numeric value that is used in a rule's driver formula to calculate the driver quantity for a transaction
DriverQuantity_2 Numeric 8 Numeric value that is used in a rule's driver formula to calculate the driver quantity for a transaction
DriverQuantity_3 Numeric 8 The number of columns that are used to calculate the driver quantity for a transaction is optional
In a transaction table, consider the following rules:
● Each column must have the length that is shown.
● The position of columns is arbitrary.
● The name of the column is arbitrary.
● The number of columns in a transaction table is arbitrary.
● A transaction table can contain other columns not specifically used by SAS Profitability Management.
The dimensions of a transaction are specified in custom dimensions tables. The following picture shows the mapping from a sample transaction table to different custom dimensions tables:
185
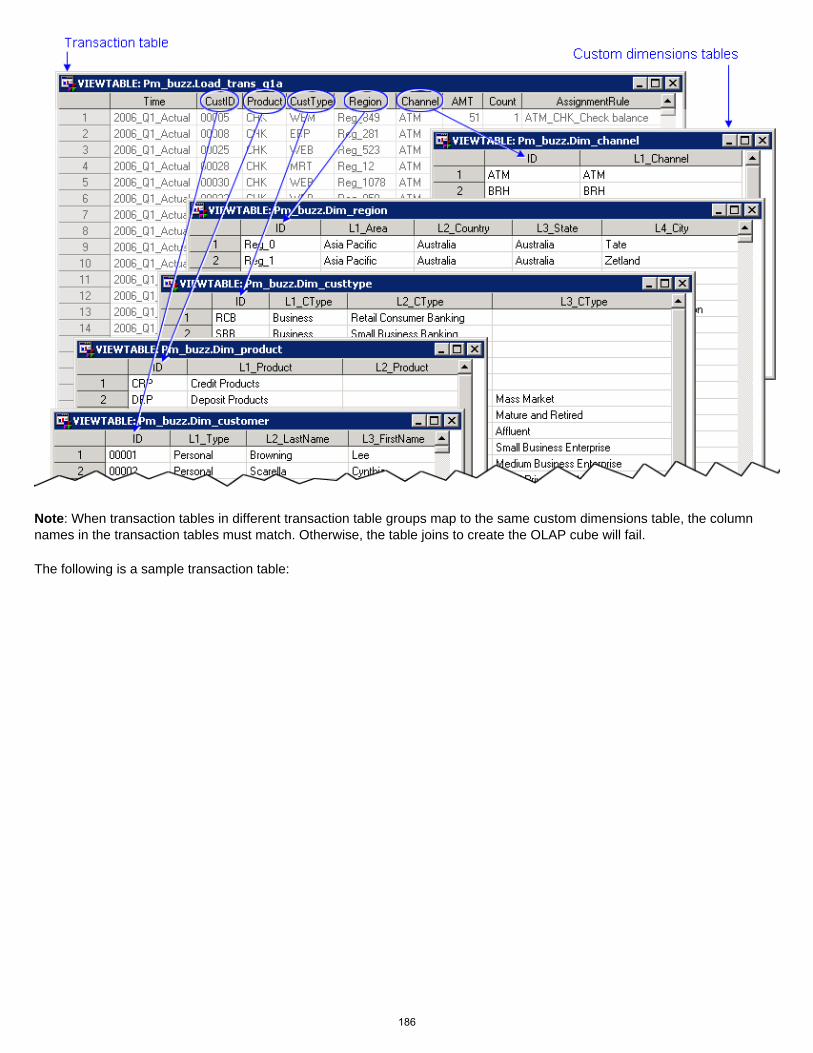
Note: When transaction tables in different transaction table groups map to the same custom dimensions table, the column names in the transaction tables must match. Otherwise, the table joins to create the OLAP cube will fail.
The following is a sample transaction table:
186
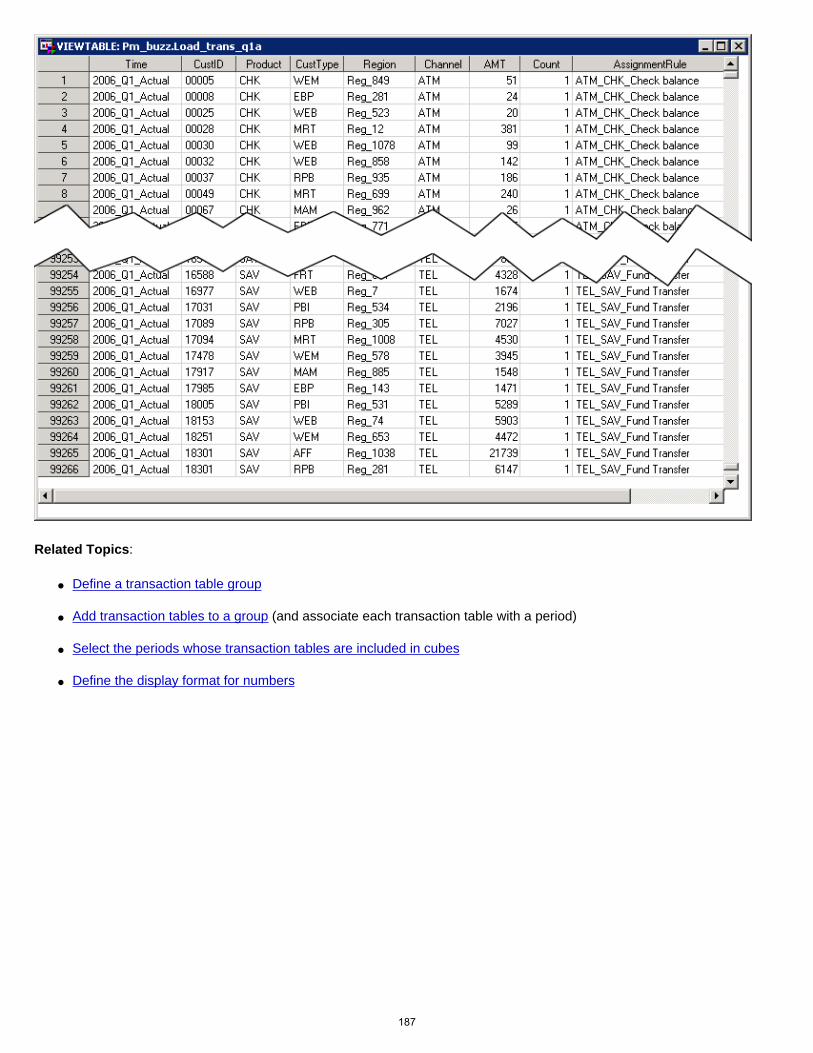
Related Topics:
● Define a transaction table group
● Add transaction tables to a group (and associate each transaction table with a period)
● Select the periods whose transaction tables are included in cubes
● Define the display format for numbers
187
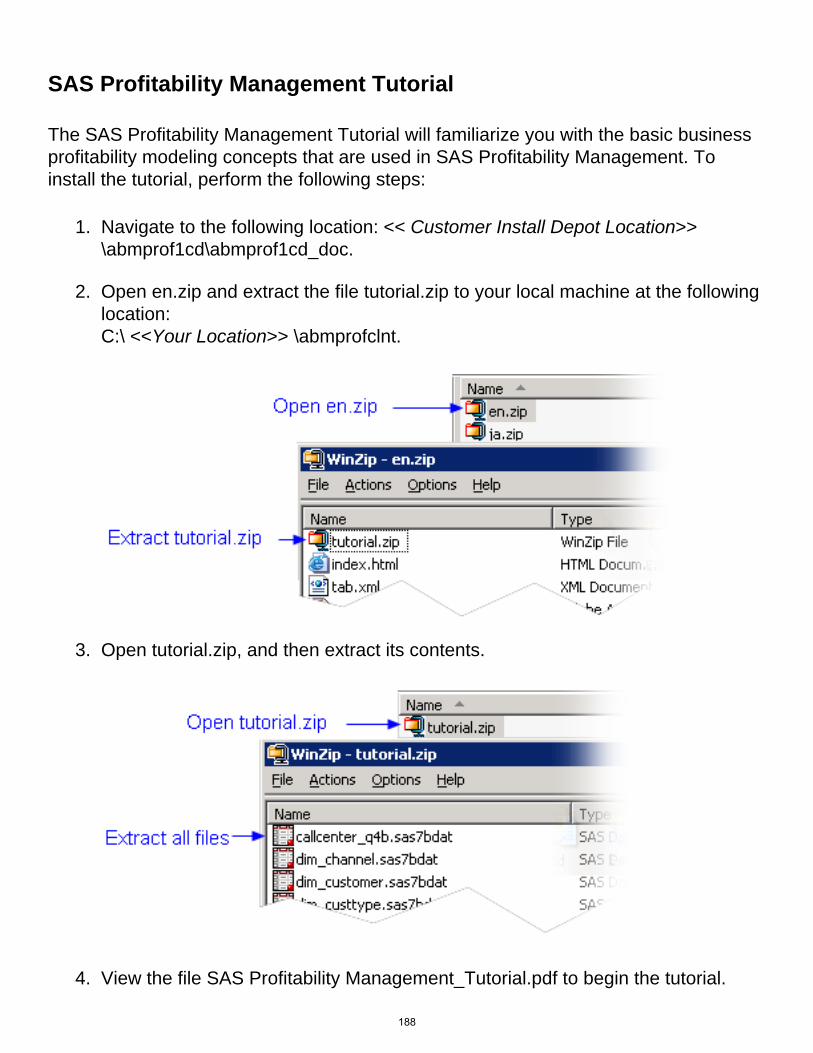
SAS Profitability Management Tutorial
The SAS Profitability Management Tutorial will familiarize you with the basic business profitability modeling concepts that are used in SAS Profitability Management. To install the tutorial, perform the following steps:
1. Navigate to the following location: << Customer Install Depot Location>> \abmprof1cd\abmprof1cd_doc.
2. Open en.zip and extract the file tutorial.zip to your local machine at the following location: C:\ <<Your Location>> \abmprofclnt.
3. Open tutorial.zip, and then extract its contents.
4. View the file SAS Profitability Management_Tutorial.pdf to begin the tutorial.
188

Use the supplied SAS tables as the source content for the tutorial.
189
Add Users
To define SAS Profitability Management users in the SAS Management Console, perform the following steps:
1. Log on to the SAS Management Console as an administrator. The main window opens.
2. Select the Foundation repository.
3. Select Environment Management.
4. Right-click User Manager, and then select New User.
5. Name the new user, and then enter other user information on the General tab.
6. Click the Groups tab, and then select the group to which the user is to be added.
7. Click the Logins tab, and then click New.
8. Enter the new user's user ID on the network. The New Login Properties window opens.
9. Leave the Password field blank (it comes from the network).
10. Leave the Confirm Password field blank (it comes from the network).
11. Select DefaultAuth for the authentication domain.
12. Click OK.
Note: You can leave the Authorization tab blank.
190
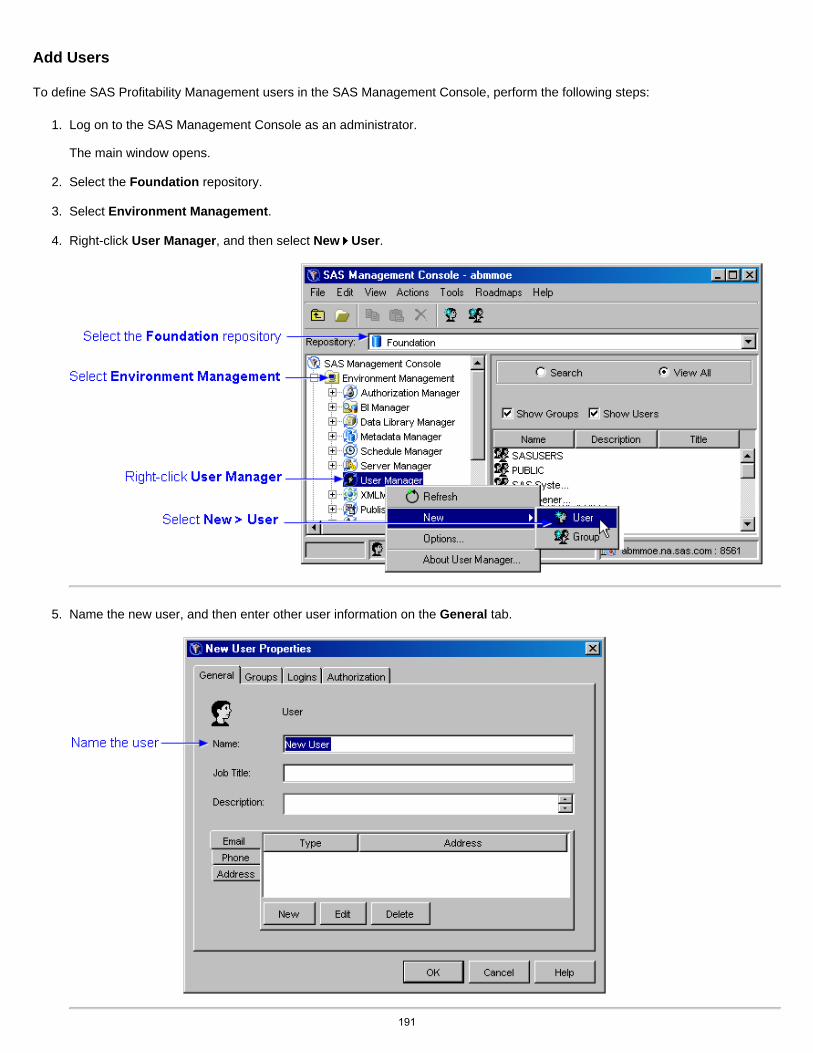
Add Users
To define SAS Profitability Management users in the SAS Management Console, perform the following steps:
1. Log on to the SAS Management Console as an administrator. The main window opens.
2. Select the Foundation repository.
3. Select Environment Management.
4. Right-click User Manager, and then select New User.
5. Name the new user, and then enter other user information on the General tab.
191

6. Click the Groups tab, and then select the group to which the user is to be added.
7. Click the Logins tab, and then click New.
8. Enter the new user's user ID on the network. The New Login Properties window opens.
9. Leave the Password field blank (it comes from the network).
10. Leave the Confirm Password field blank (it comes from the network).
11. Select DefaultAuth for the authentication domain.
12. Click OK. Note: You can leave the Authorization tab blank.
192
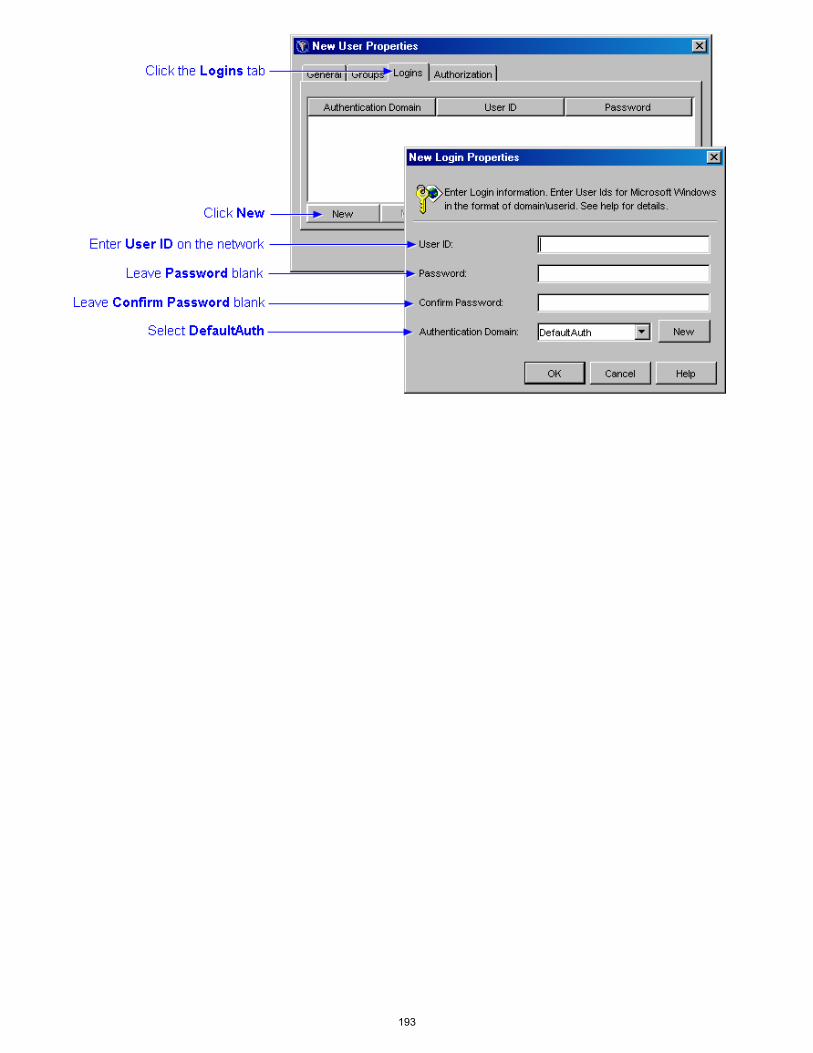
193
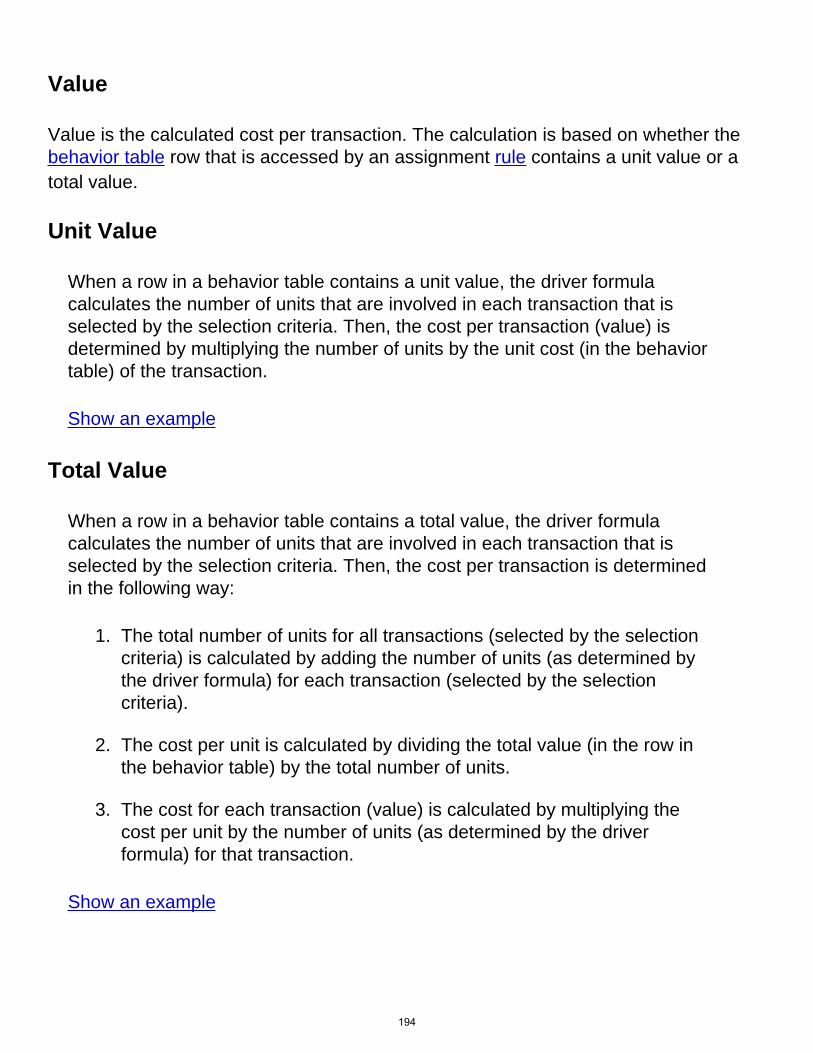
Value
Value is the calculated cost per transaction. The calculation is based on whether the behavior table row that is accessed by an assignment rule contains a unit value or a total value.
Unit Value
When a row in a behavior table contains a unit value, the driver formula calculates the number of units that are involved in each transaction that is selected by the selection criteria. Then, the cost per transaction (value) is determined by multiplying the number of units by the unit cost (in the behavior table) of the transaction.
Show an example
Total Value
When a row in a behavior table contains a total value, the driver formula calculates the number of units that are involved in each transaction that is selected by the selection criteria. Then, the cost per transaction is determined in the following way:
1. The total number of units for all transactions (selected by the selection criteria) is calculated by adding the number of units (as determined by the driver formula) for each transaction (selected by the selection criteria).
2. The cost per unit is calculated by dividing the total value (in the row in the behavior table) by the total number of units.
3. The cost for each transaction (value) is calculated by multiplying the cost per unit by the number of units (as determined by the driver formula) for that transaction.
Show an example
194
View the Audit Log
1. Select View Audit Log. The Audit Log window opens.
2. To filter the audit log items, select a user, model, and operation from the drop-down lists.
3. To view more detailed information, select one or more items, and then click Details. Another Audit Log window opens. If you selected more than one item, you can move through the items by clicking Previous and Next. Click OK.
4. To print items, select one or more items, and then click Print. The Print window opens. Click Print.
5. To copy items to the Microsoft Windows clipboard, select one or more items, and then click Copy.
6. Click OK.
195
8. View Reports
A summary report is a generated cube. A detail report is a cube that is generated on the fly when you request to view it in the SAS Profitability Management Web Reporting Client.
View a Summary Report
● Open a summary report
● Drill into a summary report
● Suppress the display of blank content
● Select specific values to display
● Change the number of rows or columns displayed
● Change heading colors
● Format displayed numbers
● Insert a graph
● Save a view of a report
View a Detail Report
● Open a detail report
● Drill into a detail report
● Suppress the display of blank content
196
Your Turn
We want your feedback.
• If you have comments about this book, please send them to [email protected]. Include the full title and page numbers (if applicable).
• If you have comments about the software, please send them to [email protected].


SAS® Publishing gives you the tools to flourish in any environment with SAS!Whether you are new to the workforce or an experienced professional, you need to distinguish yourself in this rapidly changing and competitive job market. SAS® Publishing provides you with a wide range of resources to help you set yourself apart.
SAS® Press SeriesNeed to learn the basics? Struggling with a programming problem? You’ll fi nd the expert answers that you need in example-rich books from the SAS Press Series. Written by experienced SAS professionals from around the world, these books deliver real-world insights on a broad range of topics for all skill levels.
s u p p o r t . s a s . c o m / s a s p r e s sSAS® DocumentationTo successfully implement applications using SAS software, companies in every industry and on every continent all turn to the one source for accurate, timely, and reliable information—SAS documentation. We currently produce the following types of reference documentation: online help that is built into the software, tutorials that are integrated into the product, reference documentation delivered in HTML and PDF—free on the Web, and hard-copy books.
s u p p o r t . s a s . c o m / p u b l i s h i n gSAS® Learning Edition 4.1Get a workplace advantage, perform analytics in less time, and prepare for the SAS Base Programming exam and SAS Advanced Programming exam with SAS® Learning Edition 4.1. This inexpensive, intuitive personal learning version of SAS includes Base SAS® 9.1.3, SAS/STAT®, SAS/GRAPH®, SAS/QC®, SAS/ETS®, and SAS® Enterprise Guide® 4.1. Whether you are a professor, student, or business professional, this is a great way to learn SAS.
s u p p o r t . s a s . c o m / L E
SAS and all other SAS Institute Inc. product or service names are registered trademarks or trademarks of SAS Institute Inc. in the USA and other countries. ® indicates USA registration. Other brand and product names are trademarks of their respective companies. © 2007 SAS Institute Inc. All rights reserved. 428713_1US.0307