sap world tour 2011 - digital business & business...
TRANSCRIPT

SAP World Tour 2011Sopot, 9 - 10 czerwca 2011 r. Sheraton Sopot Hotel, Conference Center & Spa

SAP World Tour 2011Sopot, 9 - 10 czerwca 2011 r.

SAP World Tour 2011Sopot, 9 - 10 czerwca 2011 r.

SAP World Tour 2011Sopot, 9 - 10 czerwca 2011 r.

SAP World Tour 2011Sopot, 9 - 10 czerwca 2011 r. Sheraton Sopot Hotel, Conference Center & Spa

Business Analytics 2011: The Big Leap Forward
Timo ElliottJune 2011
Business Analytics 2011: The Big Leap Forward
Timo ElliottJune 2011


10
Surging Growth in Business Analytics
2009 2010
+3.8%
+13.4%
Gartner: worldwide BI, analytics and performance management software revenue
BI Growth more than tripled between 2009 and 2010!

11
Analytics is an Ever-Increasing Share of IT Budget
2009 2010 2011
3.9%
+4.1%
+4.3%
Gartner: worldwide BI, analytics and performance management software revenue
“BI spending has far surpassed IT budget growth overall for several years”
Dan Sommer, Gartner

12
Business Analytics Around the World
Business Analytics MarketGrowth 2010
3.0%
3.7%
6.7%
17.8%
18.3%
19.5%
22.9%
Eastern Europe
Japan
Western Europe
North America
Middle East and Africa
Latin America
Asia/Pacific
13.2%
11.6%
Gartner Market Share Analysis: Business Intelligence, Analytics and Performance Management Software, Worldwide, published March 2011
13
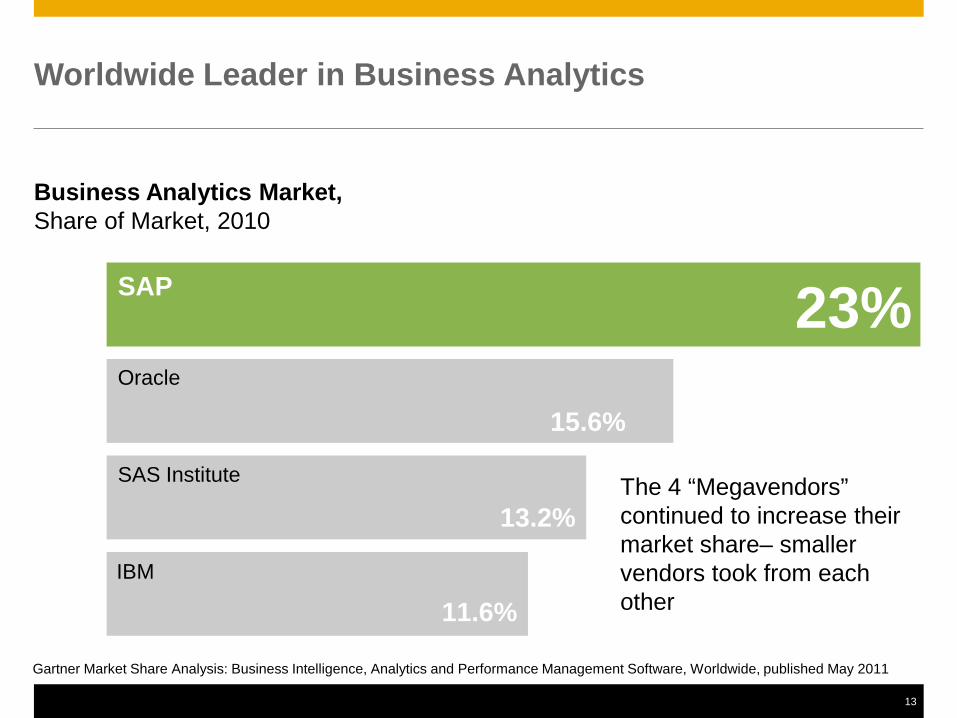
Worldwide Leader in Business Analytics
Business Analytics Market,Share of Market, 2010
SAP
Oracle
SAS Institute
IBM
15.6%
13.2%
11.6%
23%
Gartner Market Share Analysis: Business Intelligence, Analytics and Performance Management Software, Worldwide, published May 2011
The 4 “Megavendors” continued to increase their market share– smaller vendors took from each other
14
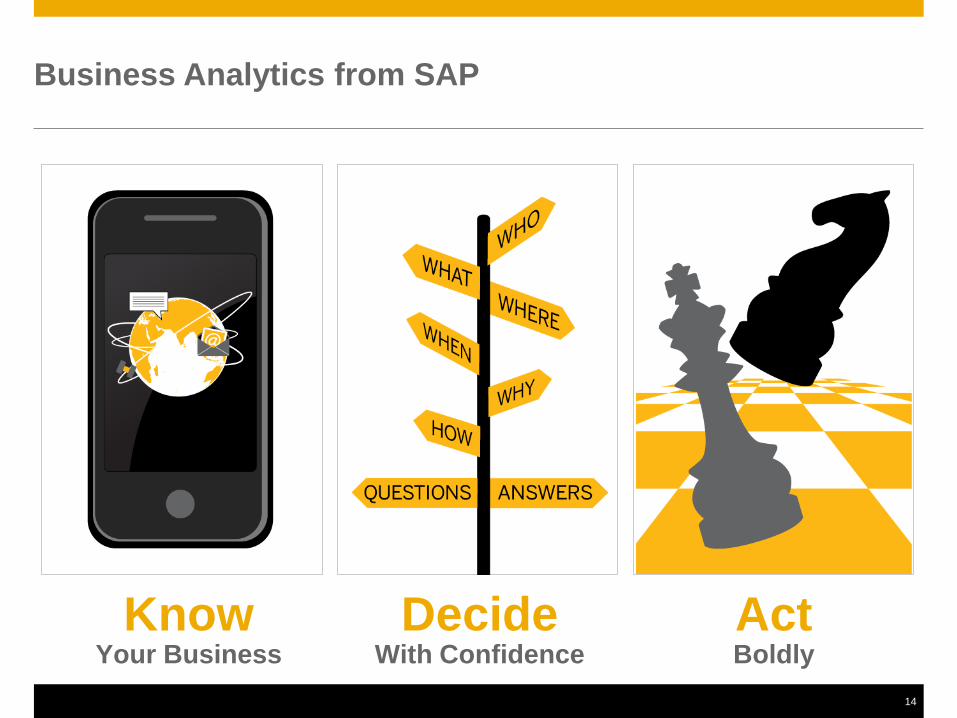
ActBoldly
KnowYour Business
DecideWith Confidence
Business Analytics from SAP

15
Business Analytics Solutions from SAPMost complete offering
Strategy Management
Planning, Budgeting, and
Forecasting
Profitability and Cost Management
Financial Consolidation
Enterprise Performance Management
Disclosure Management
Enterprise Data Warehousing
Data Mart Solutions
High-performance Analytic Solutions
Data Warehousing
Reporting and Analysis
Dashboards and Visualization
Data Exploration Mobile
BI Platform
Business Intelligence
Enterprise GRC Access Risk Management
Global Trade Services
Continuous Transaction Monitoring
Governance, Risk,and Compliance
Data Services
Master Data Management
Event Processing
Content Management
Enterprise Information Management
Information Governance
Analytic Applications
By LoBService, Sales, and Marketing
ProcurementSupply Chain
FinanceSustainability
IT, HR, and more…
By IndustryFinancial Services
Public Sector and Healthcare Manufacturing
Consumer ProductsRetail and Telco
Utilities and more….

16
“Business Analytics” is Nothing New
The “What” doesn’t fundamentally change — but the “How” does

17
Business Analytics Has Struggled to Keep Up

Easy

Ease of Use is The #1 Barrier to Deployment
Top Roadblocks to BI Success
Challenge Rank
Complexity of BI tools and interfaces 1Cost of BI software and per-user licenses 2
Difficulty accessing relevant, timely, or reliable data 3
Insufficient IT staffing or excessive software requirements for IT support 4
Difficulty identifying applications or decisions that can be supported by BI 5
Lack of appropriate BI technical expertise within IT 6
Lack of support from executives or business management 7
Poor planning or management of BI programs 8
Lack of BI technology standards and best practices 9
Lack of training for end users 10
1. Doug Henschen, InformationWeek, “BI Efforts Take Flight”, Oct 13, 2008

20
Intuitive Interfaces

23
Go Faster
Column databases Hardware Acceleration
In-Memory Processing Lower Memory Costs

24
A Revolution is On Its Way…
Credit Suisse, “The Need for Speed”

25
Reporting
“Typical” Business Intelligence Today
Slow
Painful
Expensive
Operational Data Store
Data Warehouse
Indexes
Aggregates
DataBusiness Applications
Copy
ETLCalculation EngineBusiness Intelligence
Query ResultsQuery
Slow
Painful
Expensive
Operational Data Store
Data Warehouse
Indexes
Aggregates
DataBusiness Applications
Copy
ETL
Calculation EngineBusiness Intelligence
Query ResultsQuery
DataMarts

26
In-Memory Computing
Operational Data Store
Data Warehouse
Indexes
Aggregates
DataBusiness Applications
Copy
ETL
Calculation EngineBusiness Intelligence
Query ResultsQuery
Up to 1,000x fasterNo optimizations required
DataMarts

27
Data WarehouseData Warehouse
Column Databases
Operational Data Store
Data Warehouse
DataBusiness Applications
Copy
ETL
Calculation EngineBusiness Intelligence
Query ResultsQuery
Up to 1,000x fasterMore data in less space

28
Data Warehouse
Analytic Appliance
Operational Data Store
DataBusiness Applications
Copy
ETL
Business IntelligenceQuery Results
Query
Up to 1,000x fasterMassively parallel, optimized for hardware
Analytic Appliance
Calculation Engine

29
Real-Time Data
Operational Data Store
Copy
ETL
Real- time replication — why have a separate operational data store?
DataBusiness Applications
Analytic ApplianceBusiness Intelligence

30
Operations and Analytics Together
Copy
Business Applications
Analytic ApplianceBusiness Intelligence
Use a single appliance for both analytics and applications
Data

31
SAP HANA In-Memory Computing
Hardware Innovations
64-bit address space – 2TB in current servers
100 GB/s data throughput
Dramatic decline in price/performance
Multi-core Architecture(8 x 8 core CPU per blade)
Massive parallel scaling with many blades
Row and column store
Compression
Partitioning
No aggregate tables
Insert only on delta
Software Innovations

32
Real-Time on Big Data

34
Just Some of the New HANA-EnabledApplications for 2011
SAP Cash and Liquidity Management: Allows companies to predict inbound and outbound cash flows and risk management.
Sales and Operations Planning: This application will enable sales and marketing departments to collaborate with operations and finance in order to evaluate the impact of their strategies and make accurate predictions.
Intelligent Payment Broker: This application will calculate financing options on open invoices and will help determine which discounting terms should be offered on which invoices.
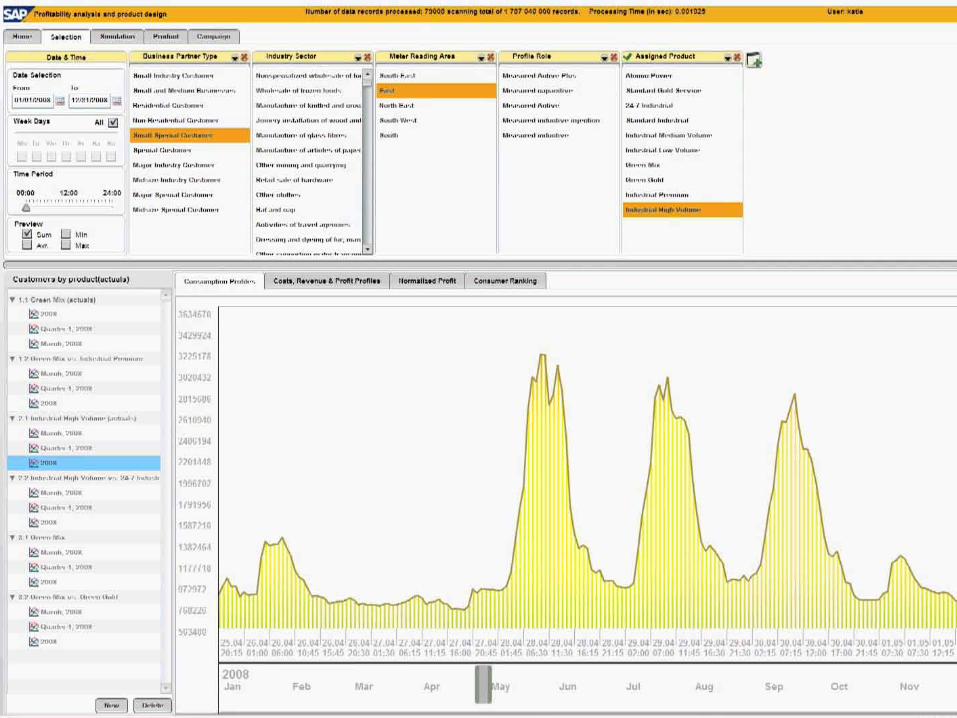
Smart Meter Analytics: The software for intelligent electricity meters: With this application utility companies can analyze smart meter readings to forecast demand and develop new products.
SAP Trade Promotion Management : Improves the planning process and helps develop accurate strategies for particular customers.

35
Reality Is, and Always Will be, Messy
Different information sources
Different levels of expertise
Different access devices
Different time horizons
Different levels of analytic need
Differentproject phases
RiskPolitics
But new architectures mean simplification and new opportunities

36
Better Access to More Relevant Information
Data Exploration
BISuite
Dashboards Reporting and Analysis
New semantic layer
• Native multi-source support
• New information design tool
• 1 consistent user experience across the BI suite

37
Data Quality
Data Integration
Master Data Mgt
Meta Data Mgt
Business IntelligenceTop-to-bottom
visibility required
Enterprise Information Management

38
“Poor-quality customer data costs U.S. businesses $611 billion a year. Yet nearly half of the companies surveyed admit they have no plans to improve data quality”
The Data Warehousing Institute study
Do You Have a Dater Qwality Problem?

39
Information Steward
40
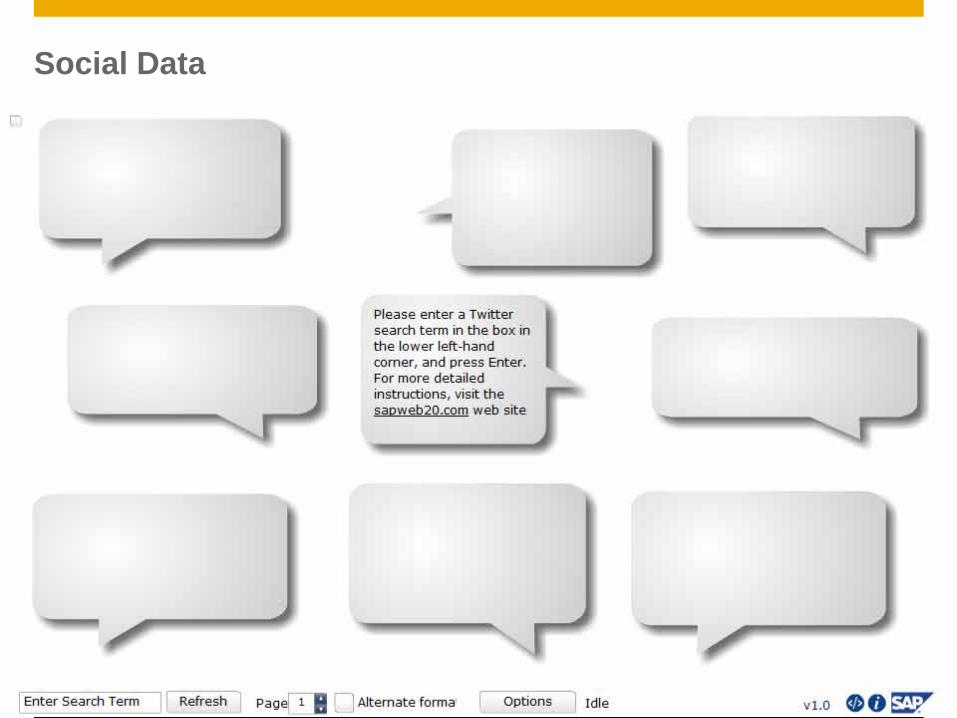
Social Data
41
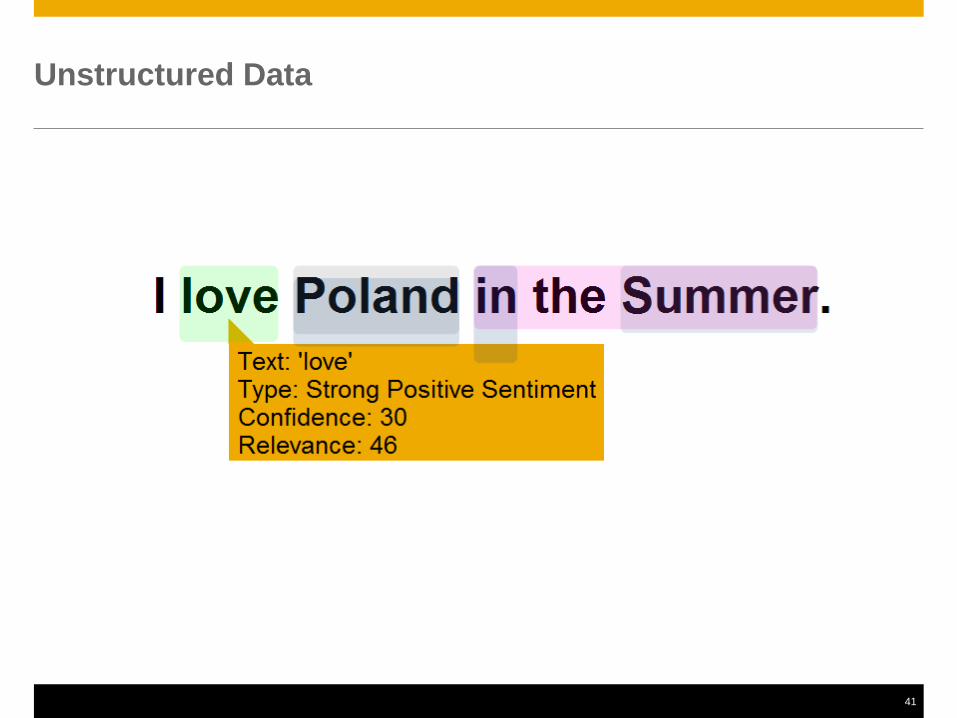
Unstructured Data

42
Text Data Processing for Unstructured Data
http://experience.sap.com/twitterta/sapsummit.jsp

43
WYN-WYN-WYNMobile Opportunities
More People, More Often, More Context

44
Better Adapted for Analysis


47
10k m
De NHM kijker
Eerste Romeinsenederzetting: “OppidumBatavorum”Jaartal: 12 voor Chr.Afstand: 300 meter
0.3
Augmented Reality

48
Filter by: Branch
HighstreetOperations +23%
NE 0.1km

49
Filter by: Maintenance History
Tower Pipe 3Last Maintenance: 2 Weeks
E 0.1km
Photo by Thomas Hawk, Flickr

50

51
Managing Mobile Devices
Sybase Afaria:Over-the-air application installSelectively disable applications and functionsTracking and analytics
Windows 32 iPhone iPad Android
BlackBerry Symbian PalmWindows
Mobile

52

53
SAP BusinessObjects Application PortfolioAnalytic Applications
Public SectorSAP BusinessObjects
Readiness Assessment for Defense and Security
HealthcareSAP BusinessObjects
Planning and Consolidation for Healthcare
RetailSAP BusinessObjects
Sales Analysis for Retail
BankingSAP BusinessObjects
Planning and Consolidation for Banking
TelcoSAP BusinessObjects
Customer Analysis and Retention for Telecom
Consumer ProductsSAP BusinessObjects
Trade Promotion Effectiveness Analysis
Consumer ProductsSAP BusinessObjects
On-Shelf Availability Analysis
BankingSAP BusinessObjects
Enterprise Risk Reporting for Banking
HealthcareSAP BusinessObjects
Healthcare Quality Management
Public SectorSAP BusinessObjects
Planning and Consolidation for Public Sector
HealthcareSAP BusinessObjects
Staff Productivity Management for Healthcare
Life SciencesSAP BusinessObjects
Healthcare Practitioner Spend Analysis & Reporting
InsuranceSAP BusinessObjects Enterprise Risk and
Solvency Management for Insurance
Public SectorSAP BusinessObjects
Planning for Public Sector
MediaSAP BusinessObjects
IP Rights Analysis
Oil & GasSAP BusinessObjects Upstream Operations Performance Analysis


55
Enterprise Risk Reporting for Banking
Gather data and connect to multiple sources Define KPIs, metrics, and dimensions
Create metadata model and universe Generate dashboards, reports, and guided analysis

56
What Technologies Do We Use for Making Decisions?
56
We rely onpeople! Source: IDC

57
Collaboration Around Data
Supermarine Spitfire
Jay Wright Forrester,Inventor of RAM Memory

58
Try it now!sapstreamwork.com
* Requires IT integration using built-in APIs and SAP StreamWork enterprise edition if advanced security is required
Results-Driven Collaboration

59
93% of Us Think We’re Better Than Average Drivers

60
Bad Analysis
61
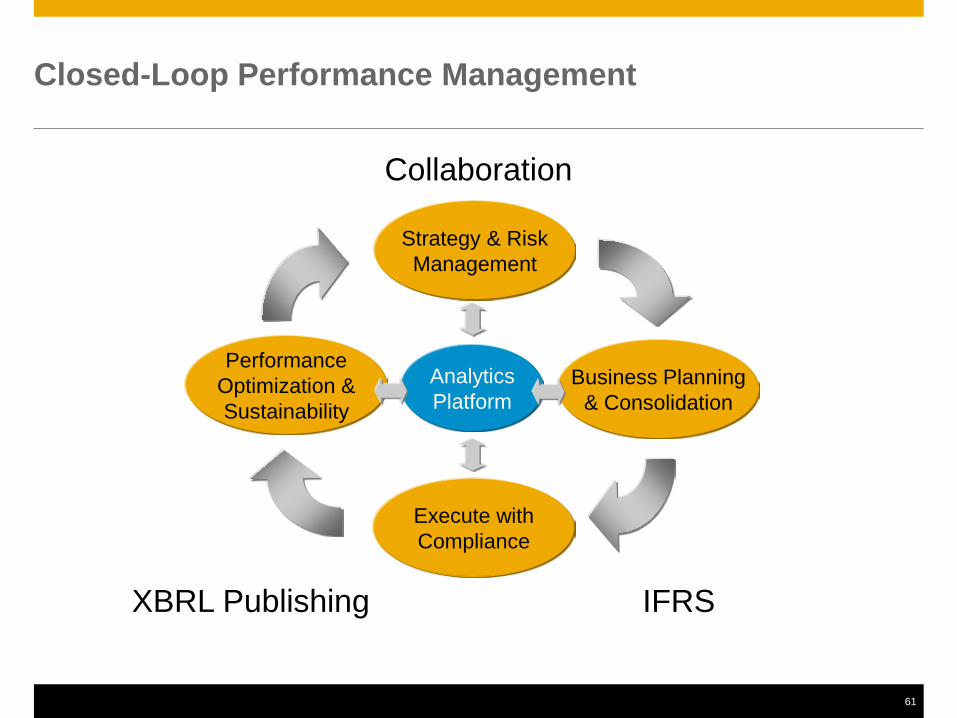
Closed-Loop Performance Management
Strategy & RiskManagement
Business Planning& Consolidation
Execute withCompliance
PerformanceOptimization &Sustainability
AnalyticsPlatform
XBRL Publishing IFRS
Collaboration

62
Strategy Management
Pathways visualize short, medium and long term strategy together with accountability, initiatives and measures aligned to corporate strategy
Custom diagrams help gain user adoption of corporate strategy
Fishbone diagrams highlight critical inter-dependencies that may cause initiatives to fail

63
Easy Budgeting, Planning, and Consolidation

64
Risk

65
Information Strategy Management
Finance
Business Process
Best practice
Collaboration
Knowledge Management
Implement New Strategy Integrate AcquisitionLaunch Product
Applications of the Future

66
Lightening Fast on Big DataLIGHTNING FAST
In-Memory ComputingEASY
SAP Business Objects 4.0TRUSTED
EIM 4.0, EPM, GRC 10.0
WHENEVER, WHEREVEROn Demand, On Device, On Premise
PERVASIVE IN OPERATIONSAnalytic Applications, Embedded
Analytics, EPM
INVOLVING THE RIGHT PEOPLE
Streamwork, EPM
The SAP Difference

Thank You!
Business Analytics Blogs:http://blogs.sap.com/analytics/http://timoelliott.com