santiam and calapooia subbasin fish management plan … · santiam and calapooia subbasin fish...
TRANSCRIPT


SANTIAM AND CALAPOOIA SUBBASIN FISH MANAGEMENT PLAN Prepared by Mary Jo Wevers Joe Wetherbee Wayne Hunt Oregon Department of Fish and Wildlife March 1992

TABLE OF CONTENTS Page
INTRODUCTION ........................................................................................................................................... 1
GENERAL CONSTRAINTS .......................................................................................................................... 3
HABITAT....................................................................................................................................................... 6 Background and Status .................................................................................................................... 6
Basin Description................................................................................................................. 6 Land Use ............................................................................................................................. 9 Habitat Protection.............................................................................................................. 22 Habitat Restoration............................................................................................................ 22
Policies ........................................................................................................................................... 23 Objectives....................................................................................................................................... 23
WINTER STEELHEAD................................................................................................................................ 28 Background and Status .................................................................................................................. 28
Origin................................................................................................................................. 28 Life History and Population Characteristics ....................................................................... 28 Hatchery Production.......................................................................................................... 34 Angling and Harvest .......................................................................................................... 36
Management Considerations.......................................................................................................... 37 Policies ........................................................................................................................................... 38 Objectives....................................................................................................................................... 39
SUMMER STEELHEAD.............................................................................................................................. 47 Background and Status .................................................................................................................. 47
Origin................................................................................................................................. 47 Life History and Population Characteristics ....................................................................... 47 Hatchery Production.......................................................................................................... 51 Angling and Harvest .......................................................................................................... 54
Management Considerations.......................................................................................................... 55 Policies ........................................................................................................................................... 56 Objectives....................................................................................................................................... 56
COHO SALMON ......................................................................................................................................... 60 Background and Status .................................................................................................................. 60
Origin................................................................................................................................. 60 Life History and Population Characteristics ....................................................................... 60 Hatchery Production.......................................................................................................... 60 Angling and Harvest .......................................................................................................... 62
Management Considerations.......................................................................................................... 63 Policies ........................................................................................................................................... 63

TABLE OF CONTENTS-continued Page
SPRING CHINOOK SALMON .................................................................................................................... 64 Background and Status .................................................................................................................. 64
Origin................................................................................................................................. 64 Life History and Population Characteristics ....................................................................... 64 Hatchery Production.......................................................................................................... 69 Angling and Harvest .......................................................................................................... 70
Management Considerations.......................................................................................................... 72 Policies ........................................................................................................................................... 73
FALL CHINOOK SALMON ......................................................................................................................... 80 Background and Status .................................................................................................................. 80
Origin................................................................................................................................. 80 Life History and Population Characteristics ....................................................................... 80 Hatchery Production.......................................................................................................... 83 Angling and Harvest .......................................................................................................... 84
Management Considerations.......................................................................................................... 85 Policies ........................................................................................................................................... 86 Objectives....................................................................................................................................... 86
SOCKEYE SALMON................................................................................................................................... 89 Background and Status .................................................................................................................. 89
Origin................................................................................................................................. 89 Life History and Population Characteristics ....................................................................... 89 Hatchery Production.......................................................................................................... 89 Angling and Harvest .......................................................................................................... 90
Management Considerations.......................................................................................................... 91 Policies ........................................................................................................................................... 91
TROUT AND WHITEFISH........................................................................................................................... 92 Background and Status .................................................................................................................. 92
RAINBOW TROUT ............................................................................................................ 92 Origin.................................................................................................................... 92 Life History and Population Characteristics.......................................................... 92 Hatchery Production............................................................................................. 93 Angling and Harvest ............................................................................................. 98 Management Considerations.............................................................................. 101
CUTTHROAT TROUT ..................................................................................................... 103 Origin.................................................................................................................. 103 Life History and Population Characteristics........................................................ 103 Hatchery Production........................................................................................... 107 Angling and Harvest ........................................................................................... 107 Management Considerations.............................................................................. 107

TABLE OF CONTENTS-continued Page
BROOK TROUT .............................................................................................................. 108 Origin.................................................................................................................. 108 Life History and Population Characteristics........................................................ 108 Hatchery Production........................................................................................... 109 Angling and Harvest ........................................................................................... 109 Management Considerations.............................................................................. 109
BULL TROUT .................................................................................................................. 110 WHITEFISH..................................................................................................................... 111
Origin.................................................................................................................. 111 Life History and Population Characteristics........................................................ 111 Hatchery Production........................................................................................... 111 Angling and Harvest ........................................................................................... 111 Management Considerations.............................................................................. 111
Policies ......................................................................................................................................... 112 Objectives..................................................................................................................................... 112
WARMWATER GAME FISH ..................................................................................................................... 118 Background and Status ................................................................................................................ 118
Origin............................................................................................................................... 118 Life History and Population Characteristics ..................................................................... 118 Hatchery Production........................................................................................................ 122
Management Considerations........................................................................................................ 123 Policies ......................................................................................................................................... 123 Objectives..................................................................................................................................... 124
OREGON CHUB ....................................................................................................................................... 127 Background and Status ................................................................................................................ 127
Origin............................................................................................................................... 127 Life History and Population Characteristics ..................................................................... 127 Hatchery Production........................................................................................................ 128
Management Considerations........................................................................................................ 128 Objectives..................................................................................................................................... 128
SAND ROLLERS ...................................................................................................................................... 131 Background and Status ................................................................................................................ 131
Origin............................................................................................................................... 131 Life History and Population Characteristics ..................................................................... 131
Management Considerations........................................................................................................ 132 Objectives..................................................................................................................................... 132

TABLE OF CONTENTS-continued Page
CRAYFISH ................................................................................................................................................ 134 Background and Status ................................................................................................................ 134
Origin............................................................................................................................... 134 Life History and Population Characteristics ..................................................................... 134 Hatchery Production........................................................................................................ 134 Harvest ............................................................................................................................ 134
Management Considerations........................................................................................................ 135 Objectives..................................................................................................................................... 135
ANGLING ACCESS .................................................................................................................................. 137 Background and Status ................................................................................................................ 137 Policies ......................................................................................................................................... 137 Objectives..................................................................................................................................... 138
PLAN ADOPTION AND REVIEW ............................................................................................................. 140
PRIORITY OF ACTIONS........................................................................................................................... 141
REFERENCES .......................................................................................................................................... 144
APPENDICES ........................................................................................................................................... 151

1
INTRODUCTION A high priority of the Willamette Basin Fish Management Plan (ODFW 1988a) was the preparation of plans for subbasins within the Willamette basin. The Santiam and Calapooia Subbasin Plan was developed to provide specific direction for management of the fish resources of the Santiam and Calapooia subbasins. The scope of the plan includes the main stem, North, and South Santiam and Calapooia rivers and their tributaries. Separate mini-plans will be written for reservoirs and lakes in the subbasin. ODFW is committed to the planning process as an integral part of all current and future management by the agency. The Santiam and Calapooia Plan is one element of the Department's planning efforts. Species plans for coho, steelhead, trout and warmwater game fish have been adopted, and a management plan for chinook salmon is being prepared. These statewide plans guide the development of more localized plans for individual river basins and subbasins. These plans serve several needed functions. They present a logical, systematic approach to conserving our aquatic resources. They establish management priorities and direct attention to the most critical problems affecting our fisheries so that the Department's funds and personnel can be used accordingly. They inform the public and other agencies about the Department's management programs and provide them with the opportunity to help formulate those programs. The Santiam and Calapooia Plan was developed by the Oregon Department of Fish and Wildlife with the assistance of a public advisory committee and a technical advisory committee. The public advisory committee represented user groups and interested members of the community at large. The function of this committee was to help identify objectives and actions and to serve as a sounding board for public interests. The public advisory committee members were: Member Affiliation Al Buhr Santiam Flycasters Richard Bunse Oregon Trout Joe Coffey Santiam Flycasters George Hann Northwest Steelheaders, Stayton Chapter Mike Huddleston Northwest Steelheaders, Salem Chapter Tim Rushing Northwest Steelheaders, Albany Chapter Bill Sanderson North Santiam Guides Bob Weiler Northwest Steelheaders, Albany Chapter The technical advisory committee was composed of representatives of federal and state fishery and land management agencies and electrical utilities. This committee contributed information used in the plan and reviewed drafts of the plan. Members of this committee were:

2
Member Affiliation Sterling Anderson Marion Co. Community Development Dept. John Detar Linn Co. Planning & Building Dept. Bob House Bureau of Land Management Linda Prendergast Pacific Power & Light Lee Vaughn Department of Forestry The habitat, steelhead, and salmon sections of the plan were originally prepared as part of the Integrated System Plan for Salmon and Steelhead Production in the Columbia River Basin (ODFW 1990a, Columbia Basin Fish and Wildlife Authority 1990). Those sections have since been modified to fit ODFW's format for subbasin plans and to comply with the ODFW's Natural Production and Wild Fish Management policies (OAR 635-07-521 through 635-07-529). The plan is divided into sections that deal with habitat, the major fish species or groups of species, and angling access. Each of these sections contains: 1. Background and Status--historical and current information on the topic of that section that
helps explain the context of the policies, objectives, and actions that follow. 2. Policies--constraints or principles developed specifically for management activities in the
subbasin related to that species or topic. 3. Objectives--what is intended to be accomplished. 4. Actions--solutions or methods for accomplishing the objectives.

3
GENERAL CONSTRAINTS Besides the statewide species plans and the Willamette Plan, the Santiam and Calapooia Plan must also conform to other established constraints such as federal acts (e.g., Wild and Scenic Rivers, Wilderness, Endangered Species), state statutes, administrative rules, memoranda of understanding and other policies. Legal Considerations The Department of Environmental Quality (DEQ) has developed state water quality standards that are in compliance with federal water quality standards. State water quality standards are specifically directed at fish bearing waters. DEQ administrative rules (Chapter 340, Division 41) address water quality standards basin by basin. Senate Bill 140 (ORS 537.332 through 537.360) directed the Water Resources Commission to convert minimum stream flows into in-stream water rights following review. In 1989 the Oregon Fish and Wildlife Commission adopted administrative rules (OAR 635-400-000 through 635-400-040) regarding in-stream water rights. Minimum streamflows were adopted for 15 locations in the Santiam and Calapooia subbasins. Although legislation does not guarantee the availability of these flows, it does give minimum flows priority over water rights obtained subsequently. Streams in the Santiam and Calapooia subbasins have been adjudicated. House Bill 2990 of 1985 (codified in part as ORS 543.015 and ORS 543.017) provides strict standards to protect anadromous fish, resident game fish and recreation from adverse effects of hydroelectric development. Its general impact has been to halt hydro development on anadromous fish streams. The Oregon Revised Statutes (ORS) require fish ladders and fish screens at dams and water diversions to provide upstream and downstream fish passage. The Oregon Forest Practices Act (Forest Practices Act) (ORS 527.610 to 527.730) was adopted in 1972. Commercial timber operations on state and private land are regulated by the act, which is administered by the Oregon Department of Forestry. Forest management activities on U.S. Forest Service and Bureau of Land Management lands are designed to comply with Forest Practices Act rules and state water quality standards. The Forest Practices Act does not apply within the urban growth boundary of towns and cities. The Oregon Removal-Fill Law requires a permit for the removal or filling of 50 cubic yards or more of material in natural waterways. The Division of State Lands oversees the program, reviews applications and issues permits, and enforces the law. The Oregon Riparian Tax Incentive Program of 1981 provides a tax exemption to land owners for riparian lands included in a management plan developed by the land owner and ODFW personnel. The Oregon Land Conservation and Development Commission has developed statewide planning

4
goals. Goals that affect fishery resources include Goal 5, which addresses fish and wildlife areas and habitats, and Goal 6, which addresses water quality. Oregon Senate Bill 523 of 1985 initiated a coordinated effort among state resource agencies for planning and management of the state's water resources. ODFW goals and policies for commercial and sport fishing regulations, fish management, and salmon hatchery operation, including the Natural Production and Wild Fish Management policies, are adopted as Oregon Administrative Rules (OAR). Marion and Linn County Comprehensive Land Use Plans contain goals and policies for riparian protection, erosion prevention, and fish and wildlife habitat protection. Procedures Developed by ODFW A Department Guide for Introductions and Transfers of Finfish into Oregon Waters (1982), and Fish Disease Control Guidelines (1979) provide direction for management of fish. Agreements with Other Agencies Each of the land and water management agencies in the Santiam and Calapooia subbasins has regulatory authority over some aspect of land or water use, or has overall responsibility for specific land or water areas. Each agency has its own policies, procedures, and management directives associated with its area of responsibility. No single agency has total jurisdiction over an entire river basin. For this reason, coordinated involvement and cooperation among fishery, land, and water managers is necessary to achieve comprehensive management of a watershed to the benefit of the entire system and its resources. Memoranda of understanding among ODFW and the Bureau of Land Management (BLM), the U.S. Forest Service (USFS), and the U.S. Army Corps of Engineers (USACE) describe cooperative activities for protecting and improving fish habitat on federal lands. Contractual agreements exist with the National Marine Fisheries Service and the U.S. Fish and Wildlife Service concerning Columbia River and ocean salmon fisheries, marine fish investigations, and hatchery production. Annual contracts with the USACE have been established to mitigate for fish production lost as a result of USACE projects. ODFW comments on USFS and BLM project proposals as well as the general land management plans. The plan review process provides a forum for the state to address habitat improvement or protection for fishery resources. The Willamette National Forest has completed their management plan. The BLM has initiated its planning process for western Oregon. USFS and BLM fish habitat improvement projects require close coordination with the Department of Fish and Wildlife's Salmon and Trout Enhancement Program (STEP). ODFW and the state Water Resources Department (WRD) have a memorandum of understanding to coordinate review and action on water rights applications that conflict with protection of fish and wildlife habitats (Memorandum of Understanding, Oregon Department of Fish and Wildlife - Oregon Water Resources Department 1990). WRD is currently updating its management programs for the Willamette basin. Programs affect future water rights, set priorities for water use, and prescribe actions to solve water

5
problems. ODFW, along with other state natural resource agencies, has identified issues that ODFW will cover and contribute to the Water Resources Department's planning process. Final adoption of new programs is expected in 1991. The Governor's Watershed Enhancement Board provides an opportunity for private individuals as well as organizations to become involved in watershed rehabilitation projects. An Oregon Fish and Wildlife Commission member is a member of this board. Linn County Planning and Zoning Department and Marion County Community Development Department are local government agencies involved in land and water management in the Santiam and Calapooia subbasins which would like additional assistance in determining the impact of land-use decisions on fish and wildlife resources. General Policies The following general policies apply to all subbasin plans in the Willamette basin, including the Santiam and Calapooia subbasins. Policy 1. To the extent authorized by law, the Department shall seek compensation for losses
of production due to development and other man-made causes. Policy 2. Hatchery production shall be evaluated to determine if benefits exceed costs. Policy 3. The number of hatchery fish stocked in the Willamette Basin, regardless of species
and size, shall not be increased and stream systems not currently receiving hatchery fish shall not be stocked, with the following exceptions:
(a) Experimental programs where the number of fish released is relatively small
and a planned and funded evaluation program exists; (b) Rehabilitation programs for native species; (c) As provided for in subbasin plans adopted by the Commission in public
hearing; and (d) Special situations approved by the Commission in public hearing. Policy 4. Stocking levels and areas shall be addressed in subbasin plans.

6
HABITAT
Background and Status
Basin Description The Santiam and Calapooia rivers originate in the Cascade mountain range of Oregon and flow west into the Willamette River at River Mile (RM) 108 and RM 119.5, respectively (Figure 1). The Santiam River (EPA Reach 1709.0005.001.00.00) has two main tributaries. The North Santiam River is approximately 92 miles long. It joins the South Santiam River, approximately 66 miles long, 11.7 miles above the confluence of the Santiam and the Willamette River. The entire Santiam basin is 1,827 square miles in size. The Calapooia River (EPA Reach 1709.003.074.00.00) is approximately 75 miles long and drains an area of 374 square miles. The North Santiam drains forested watersheds extending eastward into the High Cascades. This area is characterized by high plateaus containing scattered volcanic peaks and rugged slopes. Mass wasting events and soil erosion are relatively uncommon (USFS 1987a). The headwaters of the South Santiam are in the geologically older Western Cascades. Mass wasting is more prevalent than in the High Cascades due to steep slopes, thicker soils of low strength and a tendency for soils to become saturated with water (USFS 1987a). Rock falls, rapid debris slides, slow-moving earth flows and soil creep occur. Gentle slopes and broad alluvial flats separated by low hills are found in the west (Franklin and Dyrness 1973). The upper Calapooia River drains the western portion of the western Cascade Range. The gradient flattens as it approaches the Willamette Valley, where the river meanders through agricultural land, as does the Santiam River. Soils on the valley floor are derived from silty alluvial deposits (Langridge 1987 and Williams 1972). Sediment production from eroding slopes contributes to river and stream turbidity. Silting of spawning gravel and substrates important for aquatic invertebrate production and juvenile salmonid rearing may occur when quantities exceed the streams normal routing capacity. Rivers and streams which have been identified as having eroding channels and banks and sediment related problems include the Breitenbush River, Middle Santiam River, South Santiam River, Wiley Creek and the Calapooia River (USFS 1987a). The Santiam and Calapooia subbasins have a temperate maritime climate with moderately dry, warm summers and mild, wet winters. Mean annual temperatures range from 46o F at higher elevations to 53o F in the Willamette Valley. Winter temperatures below 10o F and summer temperatures above 100o F are unusual. Subsurface movement of water accounts for nearly all streamflow, except in areas where land use practices have decreased the infiltration capacity of the soil. This helps maintain cool water temperatures

7

8
and sustained flows in the High Cascades and eastern portions of the Western Cascades during the summer. Streams and rivers at lower elevations are subject to lower flows and higher temperatures during the summer and early fall (Table 1).
Table 1. Mean seasonal water temperature data (oF) for rivers in the Santiam and Calapooia subbasins, 1977-1986 (USGS, unpublished data). _________________________________________________________________________ Station Fall Winter `Spring Summer _________________________________________________________________________ No. Santiam R. below Boulder Cr. near Detroit 46 39 43 54 Breitenbush R. above French Cr. 46 37 43 54 No. Santiam R. at Niagra 54 41 43 48 So. Santiam R. below Cascadia 50 41 46 61 So. Santiam R. near Foster 52 43 48 54 So. Santiam R. at Waterloo 52 43 48 59 Santiam R. at Jefferson 54 43 48 61 Calapooia R. at Holley 52 43 50 66 Calapooia R. at Albany 54 43 54 68 _________________________________________________________________________
In 1984, the U.S. Army Corp of Engineers (USACE) initiated a study of the temperature and flow effects of reservoirs on the North and South Santiam rivers. Water discharged during the summer from Detroit Reservoir is 9-14o F lower than natural water temperatures (USACE 1988). Summer cold water from Foster Reservoir varies from 13-20o F and from Green Peter Reservoir 22-27o F lower than natural water temperatures. Low water temperatures during the summer delay migration of adults and decrease growth rates of juvenile fish. Water discharged from the reservoirs in the fall is 2-9o F warmer than natural water temperatures. Warm water temperatures in the fall may accelerate incubation of eggs resulting in premature emergence of chinook fry. Water temperatures commonly exceed 70o F in lower Thomas and Crabtree creeks. This prevents many species and stocks of anadromous salmonids from holding and rearing in these reaches. Upland vegetation in the Santiam and Calapooia subbasins stabilize soils on steep slopes, thereby

9
reducing mass wasting and the resulting sedimentation, increased turbidity, and other impacts in streams and rivers down slope. Vegetation intercepts and stores precipitation and removes soil moisture through evapotranspiration. This buffers the effect of storm events on mass wasting and soil movement. Roots of vegetation bind soil particles together and often anchor soils to underlying bedrock, thereby strengthening soils and increasing slope stability (Swanston and Swanson 1976). Vegetation in riparian areas provides shade, which maintains low water temperatures during summer and early fall. Large trees, particularly conifers, provide woody debris which enhances channel stability, provides structure and fish habitat, moderates sedimentation, and increases retention of spawning gravel (USFS 1987a). Vegetation provides nutrients to the soil and stream through litter drop. This provides an energy base for production of aquatic invertebrates, important food organisms for fish. Streamflow quantity and quality are usually favorable for salmonids in the Santiam and Calapooia except in lower areas of the subbasin. Here, stream gradient is low, and reaches of the Santiam and Calapooia rivers experience low flows in the summer and early fall. Water diversion for agricultural, industrial, and municipal needs further aggravate low flow problems. Water temperatures of the lower Calapooia and South Santiam rivers commonly exceed 75o F in summer months. Releases of cooler water (temperatures generally less than 55o F) from Detroit and Big Cliff Reservoirs alleviate some of these problems in the lower North Santiam, but can delay upstream migration in upper reaches of the North Santiam River. The Oregon DEQ assessed the biological and chemical water conditions of selected streams in the subbasins (DEQ 1978). They concluded that most major rivers and some tributaries had moderate water quality ratings with regard to sedimentation and elevated temperatures. A 12-mile segment of Quartzville Creek was designated a federal wild and scenic river in 1988. A 9.3-mile segment of the Little North Fork of the Santiam River was designated an Oregon Scenic Waterway by the Oregon Rivers Initiative in November 1988. Designated rivers have scenic, fishery, wildlife and recreational uses protected. The Little North Fork Scenic Waterway extends from the confluence of Battle Ax and Opal creeks downstream to the boundary of the Willamette National Forest.
Land Use Approximately 40 percent of the land in the Santiam and Calapooia subbasins is public land, of which 34.4 percent is managed by the U.S. Forest Service (USFS) (Table 2). The headwaters of the Santiam and the uppermost tributaries of the Calapooia originate in the Willamette National Forest. At lower elevations these rivers flow through a mixture of private, BLM, and state-owned lands. Most of this land is managed for commercial production of Douglas-fir. Along the valley floor, privately owned irrigated and non-irrigated agricultural lands predominate.

10
Table 2. Landownership in the Santiam and Calapooia subbasins (acres and percent of total) (Oregon Water Resources Department, unpublished data). ________________________________________________________________________________ Watershed BLM USFS USACE State Private Total ________________________________________________________________________________ North 20,366 325,256 1,946 1,148 185,416 534,132 Santiam (3.8%) (60.9%) (0.4%) (0.2%) (34.7%) South 61,287 150,780 394 347 452,708 665,516 Santiam (9.2%) (22.7%) (<0.1%) (<0.1%) (68.0%) Calapooia 5,413 5,904 189,879 201,196 (2.7%) (2.9%) (94.4%) Total 87,066 481,940 2,340 1,495 828,003 1,400,844 (6.2%) (34.4%) (0.2%) (0.1%) (59.1%) ________________________________________________________________________________
Forestry Most of the land at higher elevations in the Santiam and Calapooia subbasins is managed by the USFS as part of the Willamette National Forest. Vegetation in wilderness areas is unaltered except by natural events, such as fire and wind. Wilderness areas found in USFS land in the Santiam subbasin include the Bull of the Woods Wilderness, the Mount Jefferson Wilderness, the Middle Santiam Wilderness, and the Menagerie Wilderness Area. Most of the other areas are managed for timber production. The Oregon Department of Forestry and the BLM manage other public forest lands. Major forest products industries owning large amounts of forest lands in the subbasin include Timber Service, Willamette Industries, Weyerhaeuser, and Champion International. Farmers and small woodlot owners own parcels of commercial forest land scattered throughout the foothills at lower elevations. Timber management related alterations to a watershed increase the likelihood that storm events will cause damage to streams, fish habitat, and stream habitat improvement structures (USFS 1987a). Road building activities decrease slope stability through alteration of slopes and surface and subsurface drainage patterns (Sidle et al. 1984). Of 725 soil and debris slides reported by National Forests in Oregon following major storm events, 54 percent were associated with roads and 24 percent with logged areas (USFS 1987a). These proportions were also found in the Willamette National Forest, which received the most extensive damage of all the National Forests in Oregon. Chesney (1983) found that 71 percent of the landslides occurring in the Willamette National Forest enter stream channels and 43 percent result in debris torrents in the channels. Current erosion and sediment production in the Willamette National Forest is well above natural levels (USFS 1987a). Table 3 gives sensitivity indices developed by the Willamette National Forest for watersheds in the Santiam and Calapooia subbasins. These indices were developed to represent the tendency toward mass wasting in a watershed and resulting sedimentation of streams.

11
Table 3. Mass wasting and sedimentation indices. Watersheds with high index ratings are more likely to receive impacts to water quality than those with low indices (from USFS 1987a). _________________________________________________________________ Watershed Sensitivity Index _________________________________________________________________ Little North Santiam River Moderate Breitenbush River High North Santiam tributaries Moderate North Santiam, Blowout Cr., Woodpecker Cr. Moderate North Santiam upstream tributaries Low Quartzville Creek High Middle Santiam River High South Santiam River Moderate Wiley Creek High Calapooia River Moderate _________________________________________________________________
Harvesting of riparian zone conifers results in decreased amounts of large woody debris in streams, which provide needed fish habitat structure. Most streams in the Willamette National Forest are deficient in large woody debris (USFS 1987a). Timber harvesting and road construction in riparian areas can also increase stream water temperatures. Riparian areas along USFS Class I and II streams (Class I streams are those having water for municipal or domestic use or large numbers of fish; Class II streams contain or have the potential for resident sport fish) receive the greatest amount of protection through USFS harvest standards and guidelines (USFS 1987a). Water temperature and water quality guidelines are established for these streams. Riparian areas along Class III and IV streams receive protection only to ensure the water quality of Class I and II streams downstream. (Class III streams are perennial streams having no fish; Class IV streams are intermittent.) Up to 50 percent of the streamside area along Class IV streams may be harvested (USFS 1987b). Yet most sediment from timber harvesting and road building enters stream systems through Class III and IV streams. ODFW has expressed several concerns with the Draft Environmental Impact Statement and Proposed Land and Resource Management Plan for the Willamette National Forest (ODFW 1988b). ODFW recommended roadless area designation for several watersheds in the Santiam subbasin (ODFW 1988b). These areas include Elkhorn and Opal creeks in the Little North Santiam subbasin, Pyramid Creek and the Middle Santiam River in the Middle Santiam subbasin, and Moose Creek and Gordon Meadows in the South Santiam drainage basin. The Willamette National Forest contains two mining areas in the Santiam basin, the Little North Santiam and Quartzville. Shiny Rock mine on the Little North Santiam has been commercially mined for gold and silver. Big Minerals, Inc. is a commercial placer mine located on McQuade Creek, a tributary of Quartzville Creek. Suction dredging for gold by Tambercal, a commercial in-stream mining operation, occurs in the Calapooia River on USFS land. The DEQ issues permits for large scale suction dredging. Stream impacts from these operations include increased turbidity and rearrangement of spawning gravel.

12
Agriculture Agriculture is an important element of the mid-Willamette Valley economy. Approximately 25 percent of the Santiam and Calapooia subbasin land area, about 365,000 acres, is privately owned farm land (Linn County Planning and Zoning Department 1985, Marion County Planning Department 1981). Approximately 15 percent of this land is irrigated and 85 percent non-irrigated (Oregon Water Resources Department, unpublished data). In the lowlands, riparian vegetation is often removed by private landowners seeking to expand their farmland. This practice tends to accelerate bank and channel erosion, such as along McDowell Creek, a tributary to the South Santiam. Similar cases of bank erosion are found along the lower reaches of the Calapooia River. This results in high turbidity and sedimentation downstream. Summer and early fall stream temperatures often increase because of reduced shading. Additionally, livestock grazing, such as on Gordon Meadows in the South Santiam drainage basin, causes stream bank erosion. Chemical pollution may be a problem locally when fertilizers and pesticides wash from farm lands into rivers and streams. Non-point source pollution is more difficult to identify, monitor and remedy. The cumulative effects of various forms of pollution decrease stream and river productivity basin wide. Draining of fields and diverting water for irrigation purposes are other agricultural practices which alter streamflows or water quality which in turn affect fish production. Residential and Commercial Development Much of the residential development in the Santiam and Calapooia subbasins has occurred in the floodplain areas of the North and South Santiam and the Calapooia, on the valley floor and in the foothills. Demand for rural homesites is greatest in the scenic foothill areas with close proximity to urban areas (Linn County Planning and Zoning Department 1985). Most residential areas are concentrated in or near the towns and cities listed in Table 4.

13
Table 4. Incorporated towns and cities in the Santiam and Calapooia subbasins. _________________________________________________________________ Town County Populationa Locationb _________________________________________________________________ Idanha Marion & Linn 289 RM 60 No. Santiam R. Detroit Marion 331 RM 56 No. Santiam R. Gates Marion & Linn 499 RM 39 No. Santiam R. Mill City Marion & Linn 1,555 RM 35 No. Santiam R. Lyons Linn 938 RM 27 No. Santiam R. Stayton Marion 5,011 RM 17 No. Santiam R. Jefferson Marion 1,805 RM 9.5 Santiam R. Scio Linn 623 RM 9 Thomas Cr. Sweet Home Linn 6,850 RM 34 So. Santiam R. Lebanon Linn 0,950 RM 18 So. Santiam R. Brownsville Linn 1,281 RM 33 Calapooia R. Tangent Linn 556 Lake Cr. Albany Linn 29,462 RM 119 Willamette R. _________________________________________________________________ a April 1, 1990 census, Center for Population Research and Census, School of Urban and
Public Affairs, Portland State University, OR. b RM = river mile
Developers of residential and commercial land remove riparian vegetation, divert water and channelize streams to manage runoff and flows. These impacts are more pronounced in the vicinity of larger towns or municipalities. Pringle and Clark creeks in Salem are examples of streams which have been channelized by municipal development. Fall chinook spawn in Shelton Ditch, which flows into Pringle Creek, yet in most cases channelized streams and ditches such as these cannot support anadromous fish production to any great extent. Dams and Hydropower Projects Construction of reservoirs has hindered upstream and downstream migration and reduced production of anadromous salmonids in the Santiam and Calapooia subbasins. Since 1953, Detroit Dam and its re-regulating structure Big Cliff Dam on the North Santiam River have completely blocked anadromous fish passage to important spawning and rearing areas. Migration of adult spring chinook is delayed and survival of smolts is poor because of the cold water released from Detroit Dam. Upstream migrants encounter a variety of passage problems on the North Santiam at Stayton (Figure 2). During high spring flows, fish can pass through the south channel relatively easily. Flows over the Upper Bennett Dam fishway are adequate for passage. Beginning in early summer, most of the flow is diverted into the north channel and the power canal. Late migrating fish, such as spring chinook and some summer steelhead, must cross a series of fishways and headgates, avoiding unscreened irrigation canals, power canals and ditches. This route is especially difficult during low flow conditions.

14

15
Juveniles migrating downstream encounter similar passage problems. Santiam Water Control District's (SWCD) Water Street Hydroelectric Project (FERC No. 6943) is on a canal off the north channel of the SWCD irrigation system. Juvenile fish screens were installed in 1985. ODFW is currently monitoring smolt migration and success of downstream migrant passage at this facility to determine if year-long screening is a necessary Federal Energy Regulatory Commission (FERC) condition. Although this project is screened, it is next to two other unscreened hydroelectric projects. These projects are not licensed by FERC or are exempt from licensing. The small Stayton Feed and Seed Hydroelectric Project is located upstream of the Water Street Project. Pacific Power and Light's (PP&L) Stayton Hydroelectric Project, immediately adjacent to the Water Street Hydroelectric Project, is the major hydroelectric facility in the area and uses approximately 760 cubic feet per second (cfs) of water. Tests conducted by the Oregon Game Commission in 1955 and 1959 indicated that there were substantial downstream migrant salmonid losses at the Stayton plant. Currently, ODFW has an agreement with PP&L from March to June to protect the majority of the juvenile outmigrants. However, studies show fish move down the power canal all year. The PP&L plant is under order from the Federal Energy Regulatory Commission to prepare a license application by August 1993. PP&L is consulting with fish and wildlife agencies on fish passage and other environmental study requirements. A recently completed study of fish migrations in the Stayton Power Canal demonstrated that game fish move downstream in this canal in all weeks of the year (personal communication on 2 January 1991 from E. Smith, ODFW, Springfield, Oregon). Juvenile chinook salmon and steelhead migrate downstream to Upper Bennett Dam where they are either diverted into the north channel towards the Water Street hydroelectric project and the two unscreened projects, or are diverted into the south channel, bypassing the canal system. Although there is a limited, three-month-per year closure at PP&L's Stayton project it is likely that a large number of juvenile fish are subjected to turbine-related mortality as they pass through the unscreened turbine units after the closure has ended. The Santiam Water Control District is also responsible for adult fishways that are located between the PP&L and the Water Street powerhouses and at the Headgate Dam. The Headgate Dam fishway was completed in 1987. Stream reaches in the Santiam and Calapooia subbasins protected from further hydroelectric development by the Northwest Power Planning Council are identified in Table 5.

16
Table 5. Stream reaches in the Santiam and Calapooia subbasins protected for anadromous and resident fish under the Northwest Power Planning Council's hydroelectric planning authority. __________________________________________________________________________ Stream Reach (RM) __________________________________________________________________________ Protected for anadromous fish Mill Cr. 0-20 Santiam R. 0-12 North Santiam R. 0-40 Smallman Cr. 0-3 Stout Cr. 0-5 Little North Santiam R. 0-16.5 18-20.5 23-26 Sinker Cr. 0-4 Elkhorn Cr. 0-8 Evans Cr. 0-4 Cedar Cr. 0-4 Mad Cr. 0-5 South Santiam R. 0-61.5 Thomas Cr. 0-29 Neal Cr. 0-10.5 Ella Cr. 0-4 Crabtree Cr. 0-37 Roaring R. 0-7 South Fork Crabtree Cr. 0-6 Bald Peter Cr. 0-1.5 Hamilton Cr. 0-12.5 McDowell Cr. 0-7 Wiley Cr. 0-17 Jackson Cr. 0-3 Little Wiley Cr. 0-6 Middle Santiam R. 0-37 Gedney Cr. 0-2 Whitcomb Cr. 0-3 Rambaugh Cr. 0-2 Quartzville Cr. 0-18 Yellowstone Cr. 0-4 Packers Gulch 0-1 Canal Cr. 0-8 Elk Cr. 0-4 Bear Cr. 0-4 Pyramid Cr. 0-4.5 Canyon Cr. 0-13 Owl Cr. 0-5 Two Girls Cr. 0-4 Moose Cr. 0-4.5 Trout Cr. 0-4 Little Boulder Cr. 0-1.5 Boulder Cr. 0-2.5 Keith Cr. 0-1.5 Soda Fork 0-6 Harter Cr. 0-3 __________________________________________________________________________ (continued)

17
Table 5 continued. __________________________________________________________________________ Stream Reach (RM) __________________________________________________________________________ Calapooia R. 0-75 Sodom Ditch 0-6.5 Brush Cr. 0-2 West Fork Brush Cr. 0-5 East Fork Brush Cr. 0-5 Cedar Cr. 0-6 Protected for resident fish North Santiam R. 40-49 Breitenbush R. Humbug Cr. 0-3.5 East Humbug Cr. 0-5 Marion Cr. 0-7 South Santiam R. Middle Santiam R. Tally Cr. 0-6 __________________________________________________________________________
Summer flows in the North Santiam above Stayton are approximately 1,000 cfs. Most of the flow is diverted into the north channel where approximately 900 cfs is appropriated for power and irrigation, leaving juvenile steelhead rearing in the south channel with little flow. The court adjudicated flow requirement for fish passage in the north channel recommended by the Oregon State Game Commission is 50 cfs. There is no flow requirement in that same decree for the south channel. The Mission Mill Plant in Salem operates a turbine off Mill Creek. The mill race is currently unscreened. Anadromous fish passage has been a major problem at Foster and Green Peter dams on the South Santiam River. The USACE constructed upstream fish passage facilities at Foster and Green Peter dams and a downstream migrant bypass at Green Peter Dam. Because Foster is a low-head dam, downstream migrants were expected to sound 6-15 meters, depending on the reservoir level, and pass through the turbines or the spill gates. Juvenile spring chinook have passed the turbines and spill gates. However only a few of the steelhead smolts that enter the Foster pool after April successfully migrate from the reservoir during the primary migration period (Wagner and Ingram 1973). ODFW has been negotiating with the USACE to adjust releases from Foster Dam that impact fishing, adult salmonid migration, and fish production below the dam. Loss of anadromous salmonids due to USACE structures is partially mitigated with hatchery fish. There is a three-week delay in smolt migration for juveniles passing from Green Peter to Foster Reservoir. Inadequate passage at Green Peter Dam has resulted in a drastic reduction of the native winter steelhead above Foster Dam. High flows and cold water discharged from Green Peter Dam delay upstream movements of adults and has thwarted effective collection of adult salmon and steelhead at the upstream-migrant facilities at Green Peter Dam (Buchanan and Wade 1978).

18
ODFW has completed a 10-year study concerning fish restoration above Foster and Green Peter dams and is currently preparing a final report containing recommendations to the USACE. ODFW is presently considering closing off passage temporarily at Green Peter Dam until passage problems can be resolved. The Lebanon-Albany Power Canal is an unscreened diversion which diverts water from the South Santiam River at Lebanon to a power plant in the city of Albany. The Lacomb hydro diversion off Crabtree Creek is operated by the Lacomb irrigation district. The intake to the canal is screened. Water diverted for hydro power is returned to Crabtree Creek. Unused irrigation water is released into Beaver Creek, a tributary of Crabtree Creek. Adult winter steelhead and spring chinook encounter passage problems between RM 19.5 and RM 28.5 on the Calapooia River (Figure 3). During late winter and early spring high flows, most of the water passes through Sodom Ditch. Migrating winter steelhead use this channel and must pass through a fishway at Sodom Dam. As flows drop, most of the water is channeled into the Calapooia main stem and through Thompson Diversion Ditch. Late migrating spring chinook cannot migrate past the diversion weir near Thompson's Mill. Additionally, unscreened ditches or canals diverting water for irrigation, power generation, and industrial purposes cause mortality and injury to migrating salmonids. Oregon law requires any person who constructs, operates, or maintains any dam or artificial obstruction on a waterway to provide an adequate fish ladder for upstream and downstream fish passage (ORS 509.605; 498.268). The Habitat Conservation Division will be developing standards, criteria, and procedures for evaluating and resolving fish laddering needs at in-stream obstructions. Fish laddering needs in the Santiam and Calapooia subbasins will then be identified and resolved as part of a coordinated Department effort. Diversions and Withdrawals Substantial amounts of water are diverted from the North and South Santiam rivers for municipal, industrial, power generation, and agricultural purposes (Table 6). Values for the Calapooia are overestimates, because available figures include water use in adjacent watersheds.

19

20
Table 6. Surface water withdrawals in the Santiam and Calapooia subbasins, 1985 (1,000 acre ft/yr) (USGS, unpublished data). _______________________________________________________________________________ Location Irriga Live- Public Domestic Commer- Industrial Mining Total tion stock cial _______________________________________________________________________________ North Santiam 10.84 0.25 26.50 0.04 0.00 4.17 0.02 41.82 South Santiam 5.45 0.13 8.29 0.08 0.01 0.28 0.00 14.24 Calapooiaa 24.75 0.86 9.28 1.26 0.01 25.58 0.01 61.75 _______________________________________________________________________________ a Includes portions of the Willamette and Muddy Creek basins.
Minimum streamflows were established in 1964 and 1983. Oregon Senate Bill 140 (ORS 537.346 and OAR 690-77-050) allowed for conversion of minimum streamflows into in-stream water rights as of February 1, 1989 (Table 7). Water rights for the Santiam and Calapooia subbasins total 2,930 cfs (Oregon Water Resources Department, unpublished data). This is the potential amount of water that may be withdrawn during a given year. If all water rights were used at the same time, streamflows would be significantly decreased. Diversion dams and ditches sometime interfere with passage of migrating adult and juvenile salmonids. Adult fish passage is sometimes impeded at the Thompson Ditch diversion dam, Sodom Ditch dam, Upper and Lower Bennett dams, Stayton power canal dam, and Lebanon dam. Thompson Ditch, Sidney Ditch, Stayton power canal, Salem canal and Lebanon-Albany power canal are unscreened diversions that could cause loss of juveniles migrating downstream. Oregon law requires a diverter to provide and maintain an adequate fish screen at a diversion to prevent fish from leaving the stream (ORS 509.615; 498.248). ODFW's Habitat Conservation Division has completed a summary report identifying fish screening needs at water diversions throughout the state. Screening needs in the Santiam and Calapooia subbasins will be addressed according to their state-wide priority as part of an overall Department fish screening program that is currently being developed.

21
Table 7. In-stream water rights for the Santiam and Calapooia subbasins. ______________________________________________________________________________ Minimum flows (cfs)b Effective Streama Location Natural Storage Total date ______________________________________________________________________________ Santiam R. RM 0-1 320 1,570 1,890 6-22-64 Santiam R. RM 9.6 330 1,570 1,900 6-22-64 No. Santiam RM 0 430 640 1,070 6-22-64 Stout Cr. RM 0-3.5 10-18-90 No. Santiam RM 26.8 580 640 1,220 6-22-64 Rock Cr. RM 0-6 10-18-90 Mad Cr. RM 0-headwaters 10-18-90 No. Santiam RM 45.7 500 640 1,140 6-22-64 No. Santiam RM 59 345 - 345 6-22-64 Little No. RM 2 40 - 40 6-22-64 Santiam Little No. RM 0-26 10-18-90 Santiam So. Santiam RM 23.3 170 930 1,100 6-22-64 Thomas Cr. RM 0 20-100 - 20-100 11-03-83 Neal Cr. RM 0-6 10-18-90 Crabtree Cr. RM 0 20-100 - 20-100 11-03-83 Hamilton Cr. RM 0 3-40 - 3-40 11-03-83 McDowell Cr. RM 0 3-45 - 3-45 11-03-83 Wiley Cr. RM 0-1 10 - 10 6-22-64 Wiley Cr. RM 0-3.5 10-18-90 Little RM 0-8 10-18-90 Wiley Cr. Middle RM 0.7 110 260 370 6-22-64 Santiam R. So. Santiam R. RM 48.5 50 - 50 6-22-64 Calapooia R. RM 3.0 20 340 360 6-22-64 Calapooia R. RM 45.4 30 340 370 6-22-64 ______________________________________________________________________________ a Includes all tributaries above the listed locations. b "Natural" minimum flow stipulations were set by the state Water Resources Board. The "storage"
volumes are provided in addition whenever possible from USACE dams located upstream.

22
Habitat Protection ODFW has several roles in habitat protection issues. Enforcement authority for fish screens and fish passage was granted ODFW by ORS 509.605 - 509.640. ODFW can apply for in-stream water rights to protect fish habitat and can collect costs of habitat damage from polluters. ODFW has authority under ORS 468.745 to recover both the value of fish and wildlife destroyed by pollution and all costs of restoring production of fish and wildlife including restoration of their habitat. ODFW has written policy and procedures for investigation of fish kills resulting from pollution, as well as draft administrative rules to determine the monetary value of fish losses, which will be presented to the Fish and Wildlife Commission for adoption as an OAR in the near future. ODFW coordinates with local, state, and federal agencies regarding their habitat protection and management programs. Often this involves making recommendations to avoid impacts from various land and water use practices which conflict with fishery interests, or to provide full habitat compensation. Fish production must compete with other land and water uses such as timber production, irrigation, and hydroelectric power production. Activities which may affect threatened or endangered species must be coordinated with the U.S. Fish and Wildlife Service (USFWS). Activities by other state agencies that may affect threatened or endangered species must be coordinated with ODFW (ORS 496.182). Applications for permits issued by other agencies for land use activities are forwarded to the ODFW for review and comment. ODFW currently has interim policies on screening, fill and removal, and habitat mitigation, which will be before the Fish and Wildlife Commission in the near future. ODFW is a co-equal participant with the NMFS and USFWS in the administration of the Fish and Wildlife Coordination Act. Fishery managers recognize that habitat degradation and loss is a serious threat to the maintenance of healthy fish populations. Enforcing local, state, and federal laws for protecting fish habitat is essential to sustaining a vital habitat base. Consequently, ODFW must be a consistently strong advocate for the protection and proper management of fish habitat.
Habitat Restoration ODFW, with the Santiam Flycasters, has installed log sills in Sinker Creek on the Little North Santiam. Fish ladder repair projects are proposed for Elkhorn Falls and Hardrock Falls. In the South Santiam drainage, STEP projects in progress include installing in-stream structures in Ames Creek and Roaring River. A similar project is proposed for Neal Creek. Bank erosion control projects are currently under way in Hamilton and McDowell creeks. Local fishing groups are planting trees and placing trees on banks to prevent further erosion. Fish ladder repair work is proposed for a ladder on Wiley Creek. The high water channel at the mouth of Moose Creek was removed by blasting in the fall of 1987. Additional fish passage projects are proposed for Moose Creek and Soda Fork. The ODFW and the Albany Steelheaders have planted trees and installed a log gabion on King Creek in the Calapooia basin. They have also planted trees along Washout Creek. Proposed projects include improving passage through the log jam on the North Fork of the Calapooia on Weyerhaeuser land and installing in-stream structures in Potts Creek and the North Fork Calapooia. Habitat improvement projects sponsored by the Willamette National Forest include revegetation of

23
streams and reservoirs, placement of log sills and gabions in streams, and removing barriers to fish migration (Skeesick and Jones 1988). Projects begun in 1988, but not yet completed in the North Santiam drainage include side channel development for trout on Marion Creek and Blowout Creek. The Forest Service proposes to remove barriers by blasting on the Little North Santiam in the next three to four years. They also propose to revegetate along trout streams in the Little North Santiam and Breitenbush drainages. In 1988 they began planting areas along Elk Creek for cutthroat, rainbow trout, and steelhead habitat enhancement. The USFS removed debris from United States Creek and plans to treat additional reaches on the Calapooia to improve steelhead spawning and rearing. The BLM has not recently done any habitat enhancement work in the Santiam and Calapooia subbasins. It currently has no plans for such work until completion of its planning efforts in 1990 (personal communication from R. House, Bureau of Land Management, Salem, Oregon).
Policies Policy 1. The Department shall actively pursue and promote habitat protection and
improvement necessary to achieve the objectives for management of the subbasins' fish resources.
Policy 2. The Department shall coordinate with and advise agencies that manage the land and
water resources of Willamette subbasins. Policy 3. Habitat protection shall be emphasized over habitat rehabilitation and enhancement. Policy 4. Potential losses of fish production from habitat alteration shall be prevented or
reduced to the extent possible.
Objectives Objective 1. Restore, maintain or improve upstream and downstream passage for fish at water
diversions, dams, culverts, and other artificial obstacles.
Assumptions and Rationale 1. Adequate fish passage is necessary to prevent injury, delay or loss of fish as a result of any
water development project. Actions 1.1 Restore or improve upstream passage for anadromous species to spawning areas. a. Monitor the fishways at the SWCD ladder, the headgate ladder, the spill dam ladder,
and at Upper and Lower Bennett dams at Stayton, at Lebanon Dam, and at Thompson's Dam, Sodom Dam, and Brownsville Dam bypass channel on the Calapooia. Review hydroelectric licenses for fish passage provisions. Contact the

24
facility operator if fishways are inoperable or in need of repair. Work with facility operators to improve passage if necessary.
b. Work with utilities and agencies to provide deeper water and increased flows at
Stayton during upstream migration periods for spring chinook to improve upstream passage.
c. Evaluate potential for fish production above impassable culverts, such as on Mad and
Little Rock creeks, and work with landowners to improve passage if appropriate. d. Determine if log jams in upper reaches of the Calapooia River hinder fish passage and
work with land management agencies to improve passage where appropriate. e. Work with Linn County Soil and Water Conservation District on the Calapooia River
Flood Control Project. 1.2 Provide the appropriate ODFW technical fish passage standards and criteria to all state and
federal agencies which regulate or have the potential to impact fish passage on streams through their actions.
1.3 Work with the ODFW Fish Passage Coordinator to establish an implementation schedule
for subbasin screening projects listed in the ODFW report on fish screening needs (as presented to the 66th Legislature, January 1991).
1.4 Improve downstream passage conditions for juvenile fish. a. Determine the extent of injuries and mortalities at unscreened irrigation diversions at
Mill Creek, Stayton, on Rock Creek, and at Brownsville Dam; screen or use other methods to protect downstream migrants if necessary.
b. Resolve passage problems at Foster and Green Peter dams through continued
cooperation with the USACE. 1.5 Survey all culverts within the subbasin for passage problems. 1.6 Make specific recommendations to the responsible agencies or landowners to correct
problems at culverts. Objective 2. Provide necessary in-stream flows for fish production. Assumptions and Rationale 1. Adequate in-stream flows are necessary for fish passage, spawning, and rearing.

25
Actions 2.1 Determine necessary flows for fish production. 2.2 Obtain in-stream water rights for: a. The North Santiam River, south channel at Stayton. b. Ames Creek, a South Santiam tributary. c. The reach of the Calapooia River bypassed by Thompson's Mills millrace. 2.3 Obtain more accurate flow measurements at the mouth of the following streams: a. Minimum stream flow for Thomas Creek is established at the mouth, yet the gauge is
located 14-15 miles upstream and may not reflect actual flows at mouth. b. Minimum stream flow for Crabtree Creek is established at the mouth, gauge is located
8 miles upstream. Water consumption and gravel infiltration occurs between gauge and mouth. Gauge reading does not reflect actual flow at mouth.
2.4 Identify additional areas in the Santiam and Calapooia subbasins in need of in-stream water
rights and file necessary applications with the Department of Water Resources. 2.5 Reapply for in-stream water rights where current in-stream water rights are inadequate to
protect fish and wildlife uses. 2.6 Coordinate with water users and agencies that regulate in-stream flows.
a. Coordinate with the Santiam Water Control District to provide necessary flows in Mill
Creek during fall chinook migration. b. Work with the USACE to test and implement schedules for releases of water from
Detroit, Foster and Green Peter dams that will provide adequate flows for fish production.
c. Coordinate with Pacific Power and Light, the Santiam Water Control District, and the cities of Salem and Stayton and irrigation water users to protect in-stream flows in the north and south channels of the North Santiam River at Stayton for fish passage and survival.
Objective 3. Protect existing stream habitat from degradation associated with timber harvest,
road construction, and related activities on forested watersheds. Assumptions and Rational 1. Land use practices associated with timber harvesting can reduce fish production in forested
watersheds.

26
Actions 3.1 Ensure compliance with state and federal forest management regulations and consideration
of ODFW recommendations.
3.2 Monitor riparian protection at timber sales at sites which need riparian vegetation to prevent further in-stream temperature increases, such as in the upper Hamilton, McDowell, and Thomas creek drainages and in the Middle and South Santiam River basins.
3.3 Request that state and federal land management agencies conduct periodic monitoring
programs on the success and effectiveness of stream riparian and water quality protection measures.
Objective 4. Protect existing stream habitat in lowland areas from degradation associated
with agricultural, residential and commercial development, and other human activities.
Assumptions and Rationale 1. Channel erosion, sedimentation, loss of riparian vegetation, and pollution reduce fish
production. Actions 4.1 Cooperate with other agencies to increase protection of stream habitat. a. Work with the Soil Conservation Service, the Department of Agriculture, the Water
Resources Department, and the Department of Environmental Quality to identify locations in the Santiam and Calapooia subbasins where agricultural practices reduce fish production. Encourage agricultural land owners to protect riparian habitat, minimize practices which contribute to pollution and sedimentation of in-stream habitat, and to use techniques that conserve water.

27
b. Identify areas in the Santiam and Calapooia subbasins where in-stream structure and spawning gravel have been altered due to channelization and bank stabilization projects and limit fish production. Coordinate with the DSL, SCS, USACE, and Linn County Soil and Water Conservation District to minimize damage to fish habitat from gravel mining, fill and removal, revetment, erosion control and channelization projects.
c. Identify impacted locations and coordinate with city and county agencies to minimize
degradation of riparian and in-stream habitat from urban development projects such as construction of bridges, pipelines, city storm drains, and flood control projects.
d. Encourage municipalities, sewage treatment districts and mill pond owners to acquire
specialized equipment and adequately trained personnel so that catastrophic spills of harmful substances are avoided.
e. Investigate fish kills and pursue recovery of monetary damages and restoration of fish
and wildlife in pollution affected areas. Objective 5. Develop subbasin specific knowledge that integrates fish distribution and
abundance information, habitat characteristics and potential for improvement, and sensitive watershed areas into the Department's Habitat Database system.
Assumptions and Rationale 1. Better understanding of factors that affect fish distribution and abundance will lead to more
effective habitat protection. 2. Computerized information will readily allow access by anyone in ODFW for habitat protection
issues. Actions 5.1 Inventory stream and watershed characteristics that affect fish production. 5.2 Promote increased interagency sharing of inventory information. 5.3 In coordination with USFS, BLM, private landowners, and volunteers, survey streams to
determine specific habitat problems and opportunities for habitat protection projects, especially in the Calapooia River, Neal Creek, McDowell Creek, Hamilton Creek, and Little Wiley Creek drainages.
5.4 Ensure that all survey information is entered into the Habitat Database system.

28
WINTER STEELHEAD
Background and Status
Origin Winter steelhead are native to the Santiam and Calapooia subbasins. Although upstream reaches of the North and Middle Santiam are essentially lost to natural production because of dams, the Santiam subbasin still provides the majority of winter steelhead production in the Willamette basin. Loss of natural production due to dams has been partially compensated for by releases of mainly Willamette hatchery stock since 1952 (Howell et al. 1985a). Hatchery summer steelhead are released in the South Santiam as mitigation for loss of winter steelhead in Green Peter Reservoir. Some introductions of Big Creek stock have been made. Winter steelhead in the South Santiam are currently listed by ODFW as a stock of concern because of the decline in the run due to problems associated with Foster and Green Peter dams. Winter steelhead in the South Santiam should be given a high priority with respect to future population and habitat inventory and monitoring activities in the subbasin.
Life History and Population Characteristics Distribution Winter steelhead were historically found in the Little North Santiam, Mad Creek, Rock Creek, and the North Santiam main stem (Fulton 1970). In the South Santiam drainage, spawning areas for winter steelhead were found in Thomas, Crabtree, McDowell, Wiley, Canyon, and Moose creeks and the upper main stem. Spawning areas were also located in Quartzville Creek and the Middle Santiam main stem. In the Calapooia River, winter steelhead spawned in the upper main stem and tributaries such as Potts Creek and the North Fork of the Calapooia. Presently, distribution in the North Santiam is limited to reaches and tributaries below Big Cliff Dam. Access to the upper reaches of the North Santiam has been eliminated by Big Cliff and Detroit dams since 1953. ODFW has attempted to maintain natural production in the upper South and Middle Santiam above Foster and Green Peter dams. Natural production has declined in the South Santiam above Foster, and no natural production presently occurs in the Middle Santiam above Green Peter Dam. Winter steelhead continue to spawn and rear in the Calapooia and its uppermost tributaries, although run size has declined from historical levels.

29
Run Timing The Minto Dam collection facility on the North Santiam River traps adults from April to May (Table 8). Adult winter steelhead arrive at Foster Dam from February through June. The peak of the run usually occurs in mid-April. Catch records indicate adults are present in the Calapooia River February through May (ODFW 1990b). Hatchery winter steelhead return over a shorter period of time than wild steelhead (personal communication on 8 May 1991 from D. Buchanan, ODFW, Corvallis, Oregon).
Table 8. Winter steelhead trapped at Minto and Foster dams in the Santiam subbasin 1984-1988 (ODFW, unpublished data). ___________________________________________________________________________________________ Minto collection facilities Foster trap Total fish Dates trap Total fish Year Dates trap open Males Females open Males Females ___________________________________________________________________________________________ 1984 April 3-May 2 141 166 April 20-May 2 31 24 1985 March 22-April 29 96 169 Feb. 14-June 30 336 656 1986 March 31-May 6 280 243 Feb. 25-June 24 360 482 1987 April 1-May 18 196 302 Jan. 21-June 25 312 376 1988 April 5-May 3 382 420 Feb. 25-July 5 413 615 ___________________________________________________________________________________________
Run Size Total run size of Willamette winter steelhead entering the Santiam and Calapooia subbasins was estimated from Willamette Falls counts (Foster 1990) and steelhead sport catch data (ODFW 1990b) for 1976 to 1988. Yearly counts of fish passing Willamette Falls were multiplied by the proportion of the total upper Willamette sport catch caught in the Santiam and Calapooia subbasins (Table 9). Using this method, the minimum mean run size is 5,740 hatchery and naturally produced steelhead, 59 percent of the total above Willamette Falls run. Approximately 85 percent of the run passing Willamette Falls is considered to be of natural origin (Buchanan et al. 1991), 15 percent of hatchery origin. However actual hatchery fish-to-naturally produced fish ratios of returning adults are unknown. Clady (1971) reports an annual average of 1,000 steelhead adults collected at Minto Dam from 1952 to 1959. An average of 120 adults was detected by an electronic counter at Elkhorn Falls on the Little North Fork Santiam from 1959 to 1964. Prior to construction of Foster and Green Peter dams in 1966, an estimated 2,600 native winter steelhead migrated above the Foster Dam site (Buchanan et al. 1984). Two-thirds of these fish were produced in the Middle Santiam, above Green Peter Dam. Inadequate downstream passage at Foster and Green Peter dams and inadequate upstream passage at Green Peter Dam have resulted in a drastic reduction of the native winter steelhead run above Foster Dam. Runs in the South Santiam above Foster Dam have declined from averages of 2,183 naturally produced fish during 1967 to 1971 (21.2 percent of the total run above Willamette Falls) to 823 hatchery and naturally produced fish (1984-1988), 5.8 percent of the run above Willamette Falls. There has been almost no fish passage above Green Peter Dam since 1979.

30
Table 9. Number of late run hatchery and naturally produced winter steelhead migrating past Willamette Falls and reaching the Santiam and Calapooia subbasins (estimated) and dams (Clady 1971, Howell et al. 1985a, Foster 1990, ODFW 1990b, and unpublished data, ODFW). __________________________________________________________________________________ Santiam/Calapooiaa Foster Dam Green Peter Dam b Willamette % Will. % Will. % Year Falls No. Falls No. Falls No. Foster Dam __________________________________________________________________________________ 1967 14,600 -- -- 2,731 18.7 -- -- 1968 6,400 -- -- 1,100 17.2 -- -- 1969 8,596 -- -- 1,417 16.5 -- -- 1970 4,682 -- -- 1,413 30.2 -- -- 1971 18,314 -- -- 4,254 23.2 766 18.0 1972 16,588 -- -- 2,153 13.0 289 13.4 1973 11,511 -- -- 755 6.6 83 11.0 1974 8,528 -- -- 695 8.2 84 12.1 1975 3,034 -- -- 354 11.7 20 5.7 1976 5,196 3,532 68.0 302 5.8 25 8.3 1977 8,277 5,380 64.9 503 6.1 92 18.3 1978 8,270 5,706 68.9 488 5.9 96 19.7 1979 5,865 3,871 66.0 149 2.5 0 0 1980 16,142 8,049 50.0 515 3.2 0 0 1981 9,038 4,592 50.9 317 3.5 13 4.1 1982 6,894 3,930 57.0 399 5.8 3 0.8 1983 4,702 2,163 46.0 200 4.3 6 3.0 1984 10,720 5,682 53.0 1,497 14.0 78 5.2 1985 16,043 10,909 67.9 984 6.1 27 2.7 1986 12,776 9,326 72.9 811 6.4 39 4.8 1987 7,630 4,494 58.9 467 6.1 11 2.4 1988 15,007 7,033 46.9 1,028 4.4 -- -- 1989 5,361 -- -- 222 4.1 -- -- 1990 9,222 -- -- 271 2.9 -- -- _______________________________________________________________________________ a Estimates based on proportion of total upper Willamette sport catch caught in Santiam and Calapooia
subbasins. b Green Peter trap not operated after 1987.

31
Age, Size, and Sex Ratio Most Willamette stock steelhead spend two years in the ocean prior to returning (Tables 10 and 11).
Table 10. Age composition of North Santiam winter steelhead returning to Minto Dam (DeCew 1969). _________________________________________________________________ Brood Year Return Year Age Group n _________________________________________________________________ 1957 1962 3/2 3 1958 1962 2/2 30 1958 1963 3/2 9 1959 1963 2/2 63 _________________________________________________________________ Table 11. Age composition of 1977 and 1978 brood winter steelhead returns to Foster Dam (Howell et al. 1985a). _________________________________________________________________ Smolt Year Return Year Ocean Age n % _________________________________________________________________ 1977 1978 1 N/A N/A 1979 2 130a 77.8 1980 3 36 21.6 1981 4 1 0.6 1978 1979 1 9a 1.7 1980 2 452 87.4 1981 3 54 10.4 1982 4 2 0.4 _________________________________________________________________ a Actual sample sizes of 83 2-salt and 6 1-salt returns were expanded for total adult run to
Foster trap in 1979.
Average fork lengths of a subsample of 1978 and 1980 hatchery brood winter steelhead adults are given in Table 12.
Table 12. Average fork length (cm) of subsamples of 1978 and 1980 brood year winter steelhead adults (Howell et al. 1985a). _________________________________________________________________ Adults 1978 brood 1980 brood _________________________________________________________________ 1-salt male -- 45.0 2-salt male 67.9 69.5 2-salt female 66.2 66.3 3-salt male 81.6 -- 3-salt female 77.7 -- ________________________________________________________________
Adults collected at Foster Dam had a female-to-male ratio of approximately 2-to-1 (Table 13).

32
Table 13. Sex ratio of adult winter steelhead returning to Foster Dam, 1985-1987 (M. Wade, ODFW, unpublished data). _________________________________________________________________ Year No. Females No. Males Ratio _________________________________________________________________ 1985 237 118 2.0:1.0 1986 208 118 1.8:1.0 1987 141 73 1.9:1.0 _________________________________________________________________
The average fork length of 26 adult winter steelhead captured in the South Santiam River during March to May 1966 was 28.8 inches (Clady 1971). No information on weight is available. Time and Location of Spawning Spawning occurs during April and May with the peak occurring in late April and early May (Howell et al. 1985a). Detroit and Big Cliff dams on the North Santiam have blocked access to spawning areas above RM 46.5. Passage problems at Green Peter Dam have limited accessibility to spawning areas in the Middle Santiam and Quartzville Creek. Redd counts from spawning surveys conducted in the Santiam and Calapooia subbasins from 1979 through 1988 are shown in Table 14. Fecundity of 1982 brood year naturally produced winter steelhead collected at Foster trap averaged 3,500 eggs per female (personal communication from M. Wade, ODFW, Springfield, Oregon). Fecundity estimates of hatchery fish made in 1978 through 1980 and 1984 ranged from 3,640 eggs per female in 1984 to 4,700 eggs per female in 1979 (Howell et al. 1985a). A conservative estimate of 3,500 eggs per female is used at Marion Forks Hatchery for production purposes (personal communication from T. Jones, ODFW, Marion Forks Hatchery, Marion Forks, Oregon).

33
Table 14. Winter steelhead redds per mile in the Santiam and Calapooia subbasins (J.J. Wetherbee, ODFW, unpublished data). _______________________________________________________________________________________ Year Location 1979 1980 1981 1982 1983 1984 1985 1986 1987 1988 1989 1990 _______________________________________________________________________________________ North Santiam River Little North Fork Sinker Cr. 39 33 9 0 Elkhorn Cr. 31 14 0 Rock Cr. 45 31 10 44 14 " 68 Mad Cr. 108 82 60 46 44 88 Little Rock Cr. 23 44 15 8 0 24 South Santiam River Thomas Cr. 25 22 14 3 " 10 0 0 Neal Cr. 50 26 20 2 6 " 11 11 Crabtree Cr. 5 15 " 67 Wiley Cr. 40 72 16 18 " 32 7 5 " 28 Little Wiley Cr. 7 Canyon Cr. 25 15 " 22 Owl Cr. 7 Moose Cr. 10 Soda Fork 3 Calapooia River RM 50.3-51.3 3 RM 65-71.3 5 RM 65-72.5 1 10 6 8 9 16 16 RM 72.5-73 56 34 Potts Cr. 11 5 7 12 6 7 " 7 North Fk. 15 14 20 25 11 8 11 ____________________________________________________________________________________________
Juvenile Life History Juveniles usually spend two years in fresh water before smolting (Tables 10 and 15) (Howell et al. 1985a). Smolt migration of naturally produced fish in the North Santiam River begins in early spring (DeCew 1969). DeCew (1969) reports that the average length at the end of freshwater growth for 1958 and 1959 broods of North Santiam winter steelhead was 7.2 inches. Hatchery smolts are released at age 2+ at an average size of five fish per pound from April 7-15 (personal communication from T. Jones, ODFW, Marion Forks Hatchery, Marion Forks, Oregon). Juveniles released in early April above the South Santiam River dams pass Green Peter Dam from mid-April through early May, pass Foster and Lebanon dams late April through mid-May, and pass Willamette

34
Falls from late April through late May (Buchanan and Wade 1982). Winter steelhead released in the North Santiam River pass Willamette Falls from late April to late May.
Table 15. Freshwater age of winter steelhead trapped at Foster Dam 1979-1982 (Howell et al. 1985a). ___________________________________________________________________________ Freshwater 1979 1980 1981 1982 age (yrs.) n % n % n % n % ___________________________________________________________________________ 1 0 0 9 2 5 2 0 0 2 57 60 430 89 246 87 180 89 3 38 40 43 9 32 11 19 9 4 0 0 0 0 0 0 4a 2 ___________________________________________________________________________ a Freshwater age may have been 3 years
Hatchery pre-smolt releases above Foster Dam have not been successful in maintaining the run above Foster and Green Peter dams (Wade et al. 1985). Hatchery smolts from 1980 through 1986 broods released below Foster Dam yielded an average return rate of 1.7 percent (range 0.13 percent to 2.73 percent) after subtracting 23 percent to 50 percent of the non-migrating smolts that were too small or obviously precocious. Without this adjustment, smolt-to-adult survival would average about 0.9 percent to 1.3 percent. A smolt production model developed by the Washington Department of Wildlife using reach gradient, area, and flow (GAFM) was employed to provide estimates of habitat carrying capacity. The smolt production estimate for the Calapooia is 20,452 steelhead smolts and for the Santiam 150,544 steelhead smolts.
Hatchery Production Description of Hatcheries Marion Forks Hatchery, located on Marion Creek, a tributary of the North Santiam River, is operated by ODFW with funding from the USACE and ODFW. Spring chinook salmon and winter steelhead are produced at the hatchery. Production of winter steelhead at Marion Forks Hatchery mitigates for loss of spawning area above Detroit Dam and supplements the Willamette winter steelhead run in the basin. The mitigation level for the North Santiam River is no more than 84,000 pounds of juvenile chinook and steelhead. Rearing of winter steelhead eggs to smolts requires two years because of cold water and late egg-take. Winter steelhead adults are captured and held until spawning at Minto collection facility near Gates. Steelhead capture and spawning take place from April 15 to May 15. The brood stock is a mixture of naturally produced and hatchery fish.

35
Willamette winter steelhead returning to the South Santiam River were reared at the former South Santiam Hatchery on Coal Creek from 1926 through 1944. Since then the stock has been infrequently reared in a hatchery (ODFW 1986). There is no current program for propagating the South Santiam stock. An estimated 700 winter steelhead that spawned in areas flooded by Foster and Green Peter reservoirs are mitigated for at the South Santiam Hatchery with summer steelhead. The mitigation level for South Santiam Hatchery is a maximum of 71,000 pounds of juvenile chinook and steelhead. Supplementation History Approximately 100,000 Willamette winter steelhead smolts (five fish per pound size) are released each year in April in the Santiam subbasin, mostly in the North Santiam River (Table 16 and Appendix Table A-1). Experimental releases of pre-smolts have also been made in the Middle Santiam and Quartzville Creek as part of a study to restore the native winter steelhead run above Foster and Green Peter dams (Wade et al. 1985).
Table 16. Releases of hatchery winter steelhead in the Santiam subbasin (ODFW, unpublished data). ________________________________________________________________________ Release Number released year Hatchery and stock Fry Fingerlings Smolts ________________________________________________________________________ 1978 Gnat Cr., Big Cr. 19,076 Marion Fks., No. Santiam 96,038 23,435 1979 Roaring R., Big Cr. 12,441 Marion Fks., No. Santiam 75,586 29,000 77,744 1980 Roaring R., Big Cr. 58,632 22,090 Marion Fks., No. Santiam 223,889 117,756 1981 Marion Fks., No. Santiam 142,660 1982 Marion Fks., No. Santiam 103,474 28,130 110,791 So. Santiam, So. Santiam 23,276 1983 Marion Fks., No. Santiam 61,150 23,600 151,315 1984 Marion Fks., No. Santiam 49,222 8,337 74,483 So. Santiam, So. Santiam 8,537 21,064 1985 Roaring R., Klaskanine 8,504 Marion Fks., No. Santiam 63,449 47,940 91,853 So. Santiam, So. Santiam 74,651 8,653 1986 Marion Fks., No. Santiam 61,097 103,599 So. Santiam, So. Santiam 14,175 1987 Marion Fks., No. Santiam 110,634 1988 Marion Fks., No. Santiam 116,745 1989 Marion Fks., No. Santiam 85,490 1990 Marion Fks., No. Santiam 93,442 ________________________________________________________________________________
STEP releases of winter steelhead fry in the Santiam subbasin are given in Table 17.

36
Table 17. STEP releases of winter steelhead fry in the Santiam subbasin during 1982-1987 (ODFW, unpublished data). ______________________________________________________________________________ Brood Number Release Year Hatchery and stock released Release location date ______________________________________________________________________________ 1984 Marion Fks., No. Santiam 8,391 Little North Santiam July 1984 1985 " " 8,000 Beaver Cr. (Mill Cr.) June 1985 1985 " " 2,000 Simpson Cr. (Mill Cr.) June 1985 1986 " " 21,927 Salem Canal June 1986 1986 " " 1,534 Simpson Cr. (Mill Cr.) June 1986 1987 " " 24,260 Little North Santiam June 1987 ______________________________________________________________________________
Angling and Harvest Sport catch of winter steelhead in the Santiam and Calapooia subbasins has remained fairly constant, averaging 1,970 adults with a range of 542 to 3,396 fish during the 1977-78 through 1988-89 run years (Table 18). Approximately 45 percent of the subbasin harvest is from the North Santiam, 30 percent from the Santiam, and 12 percent from the South Santiam. Only 3 percent of the combined subbasins harvest comes from the Calapooia.

37
Table 18. Subbasin adult harvest for Willamette winter steelhead (ODFW 1990b). _________________________________________________________________________________________________________ Years 1977 1978 1979 1980 1981 1982 1983 1984 1985 1986 1987 1988 _________________________________________________________________________________________________________ Mill Creek 4 0 9 3 9 5 0 0 0 3 0 0 Santiam River 965 395 818 434 340 90 254 446 345 321 859 274 North Santiam River 1,391 437 1,129 918 757 281 681 1,182 1,570 9171,142 495 Little No. Santiam 139 92 118 93 89 48 35 157 236 161 187 130 South Santiam River 748 57 74 25 30 42 288 552 1,014 578 483 107 Thomas Creek 145 23 102 45 81 24 51 72 27 25 41 29 Crabtree Creek 4 6 51 72 33 45 29 118 140 0 31 11 Calapooia River 0 96 122 48 32 7 20 20 31 36 58 8 Sub-total 3,396 1,106 2,423 1,638 1,371 542 1,358 2,547 3,363 2,0412,801 1,054 _________________________________________________________________________________________________________
Management Considerations Willamette winter steelhead are one of the few anadromous fish stocks native to subbasins above Willamette Falls, including the Santiam and Calapooia. The Santiam subbasin contributes significantly to winter steelhead production in the Willamette basin. Access to the upper reaches of the North Santiam has been blocked by Big Cliff and Detroit dams since 1953. Loss of natural production above Detroit Dam has been partially compensated for by releases of hatchery stock in the Santiam subbasin since 1952. Approximately 100,000 Willamette winter steelhead smolts are released each year in the North Santiam River. Major habitat constraints for winter steelhead production in the North Santiam include passage problems for migrating adults and unscreened diversion ditches, which cause loss of smolts during downstream migration. USACE dams on the North and South Santiam influence sedimentation, flows, temperatures and water quality as well as anadromous fish passage. Since construction of Foster and Green Peter dams, natural production in the upper South Santiam has been seriously reduced and essentially eliminated in the Middle Santiam. Although Green Peter Dam was fitted with fish passage facilities, adults are not attracted to the ladder, possibly due to flows and water temperatures. Smolts migrating out of Green Peter Reservoir are delayed up to two weeks due to the size of the reservoir and

38
the length of the shoreline. Survival of smolts passing through Green Peter Reservoir is very low, apparently due to predation by squawfish and largemouth bass. Smolts must sound in Foster Reservoir to reach passage facilities at the dam, and have not been very successful. Annual returns to Foster and Green Peter dams have averaged 882 and 96 fish, respectively, since 1971 (Buchanan et al. 1991). Efforts by ODFW to solve production problems on the South Santiam include addressing downstream passage problems of juvenile steelhead, upstream passage problems of adult steelhead, and evaluating rehabilitation of steelhead production above Foster and Green Peter dams (Buchanan et al. 1984). Green Peter Dam and Reservoir have altered anadromous fish habitat and passage so that in-kind, in-place compensation for the loss of at least 1,250 native winter steelhead above Green Peter Reservoir is impossible at this time. Adult passage is impeded at Thompson's Mill Dam and at Sodom Ditch in the Calapooia River. Unscreened diversions and irrigation ditches cause loss of migrating smolts. Crabtree, Thomas and Wiley creeks in the South Santiam and the Calapooia River have been managed for natural production of native stock. The impacts of introduced summer steelhead on production of winter steelhead are unknown. There is the potential for hybridization of Skamania summer steelhead with native Willamette winter steelhead. Rainbow trout spawn in the spring when hatchery steelhead smolts are released. Some hatchery steelhead smolts are precocious and may spawn with wild trout. The proportion of hatchery releases that are precocious and that contribute to natural production requires monitoring and evaluation. Changes in steelhead hatchery programs may be required in order to meet Wild Fish Management Policy guidelines for trout. Winter steelhead in the South Santiam are currently listed by ODFW as a stock of concern because of the decline in the run due to problems associated with Foster and Green Peter dams. Winter steelhead in the South Santiam should be given a high priority with respect to future population and habitat inventory and monitoring activities in the subbasin.
Policies Policy 1. Winter steelhead in the main stem Santiam River and North Santiam system shall be
managed for natural and hatchery production. Policy 2. Winter steelhead in the South Santiam system and Calapooia subbasin shall be
managed for natural production. No hatchery-produced winter steelhead shall be released into the South Santiam or Calapooia subbasins.

39
Policy 3. Protection of the run above Foster Dam has priority over harvest in the South Santiam.
Policy 4. Protection of the native run in the Calapooia subbasin has priority over harvest.
Objectives Objective 1. Provide an annual minimum escapement of 8,600 naturally produced winter
steelhead adults to the Santiam subbasin and an annual average return of 1,200 hatchery adults to the North Santiam.
Assumptions and Rationale 1. South Santiam winter steelhead have been identified as a stock of concern due to declining
numbers, primarily above Foster Dam. Attaining this objective will strengthen winter steelhead populations.
2. The total escapement of winter steelhead to the Santiam subbasin is unknown. 3. The smolt production of the Santiam subbasin using the gradient-area-flow methodology
(Washington Department of Wildlife) is estimated as 150,544 smolts. Using an egg-to-smolt survival rate of 1 percent (actual rates are unknown, but typically range from 0.5-1.5%), fecundity of 3,500 eggs per female, and a 1:1 sex ratio, an escapement of at least 8,600 fish would be needed to produce the estimated number of smolts.
4. The mitigation level for the North Santiam is 100,000 smolts to compensate for lost
production above Detroit Dam. The current smolt-to-adult survival rate is estimated to be 1.2 percent, which results in a return of 1,200 fish.
5. Releases of precocious hatchery steelhead smolts near areas where spawning of trout
occurs may decrease the genetic fitness of trout populations. 6. Habitat quality will be maintained or improved. 7. Unscreened power canals and diversions contribute to smolt mortality. 8. Escapement for the Santiam subbasin can be estimated from counts at hatchery collecting
facilities, punch card data, and spawning ground surveys of index streams. 9. Some of these actions could be funded by the USACE and PGE as mitigation for loss of wild
winter steelhead above Willamette Falls.

40
Actions 1.1 Conduct annual spawning surveys to assess population distribution and abundance, as
measured by redd counts, the number of miles of production, and an estimate of the number of fish per redd, in the following index stream reaches:
Thomas Creek, RM 30.7-31.7 Neal Creek, RM 3.6-4.4 Crabtree Creek, RM 32.0-33.2 Wiley Creek, RM 11.3-12.4 and RM 15.1-16.4 Mad Creek, RM 0.0-0.5 Rock Creek, RM 0.0-2.0 (for trend information only) and RM 2.4-3.8 Sinker Creek, RM 0.0-0.7 Elkhorn Creek, RM 0.4-1.4 1.2 Conduct an aerial spawning survey of RM 17.0-43.5 of the North Santiam and the Little
North Santiam to determine the extent of natural spawning. Using redd counts, the number of miles of production, and an estimate of the number of fish per redd, estimate the escapement to these areas. Extrapolate the escapement for the Santiam subbasin from survey data.
1.3 Inventory tributaries for potential habitat enhancement projects. Document potential
projects in a report. 1.4 Continue to monitor returns of winter steelhead to hatchery collection facilities annually. 1.5 Investigate the possibility of rearing North Santiam stock smolts to size in one year instead
of two by rearing juveniles at a facility with warmer water than Marion Forks Hatchery, such as Oak Springs Hatchery.
1.6 Continue the current annual release of 100,000 smolts in the North Santiam as mitigation
for Detroit Dam. 1.7 Release smolts at all access sites on the North Santiam, making some releases lower in the
system. 1.8 Continue to mark all hatchery smolts released in the North Santiam with a different mark for
lower river releases. Determine return rates to Minto of fish released lower in the system and of fish released at Minto.
1.9 Investigate the use of acclimation facilities at release sites to improve survival and harvest
of hatchery fish. 1.10 Conduct a creel program on the North Santiam in 1992 to determine if lower river releases
are harvested at a greater rate than Minto releases and to determine if the harvest objective is met.

41
1.11 Continue to maintain a late May opening for trout in the Santiam subbasin to protect winter steelhead smolts.
1.12 Minimize the proportion of hatchery steelhead smolts that are precocious and their impact
on spawning trout populations. This may be achieved by removal of precocious fish during marking of hatchery steelhead.
1.13 Continue to coordinate shut-down periods and release schedules with hydro projects at
Stayton, PP&L, and Albany's Lebanon canal to provide adequate protection. 1.14 Initiate a program to screen the Lebanon-Albany power canal, the PP&L intake at Stayton,
the main irrigation canal at Stayton, Sidney ditch, the 19th Street diversion, and Penn Annex lateral.
1.15 Implement habitat protection actions outlined under objectives for Habitat Protection. Objective 2. Minimize the genetic impacts of hatchery releases on the naturally produced
North Santiam stock. Assumptions and Rationale 1. Hatchery practices and interbreeding of hatchery and naturally produced fish may alter the
genetic characteristics of wild populations. Actions 2.1 Monitor the proportion and timing of naturally produced and hatchery fish taken for
spawning at Minto collection facilities. 2.2 Determine the optimum sex ratio, naturally produced component, and size of the spawning
population used for hatchery brood stock at Marion Forks Hatchery. In the interim, use a minimum of 20 percent naturally produced fish for brood stock in every generation.
2.3 Collect brood stock at Minto collection facilities from both early and late returns. 2.4 Monitor the proportion of naturally spawning hatchery steelhead in the North Santiam and
recommend changes as appropriate if not in compliance with WFMP standards. Objective 3. Reestablish a winter steelhead run in the North Santiam above Detroit Reservoir. Assumptions and Rationale 1. The historical distribution of winter steelhead included areas above Detroit Dam. 2. Passage for adults and smolts around Detroit Dam and reservoir can be provided.

42
3. Providing passage at Detroit Dam would also benefit spring chinook. 4. The run can be monitored at Detroit Dam. Actions 3.1 Re-negotiate with the USACE to provide winter steelhead access to production areas lost
after the construction of Detroit Dam. 3.2 Work with the USACE to establish passage facilities at Detroit Dam. 3.3 Capture winter steelhead adults and pass above Detroit Reservoir. Objective 4. Increase escapement to 650 winter steelhead in the South Santiam above Foster
Dam. Assumptions and Rationale 1. South Santiam winter steelhead have been identified as a stock of concern due to declining
numbers, primarily above Foster Dam. 2. Historically, runs are estimated to have averaged 650 fish (Buchanan et al. 1984). Because
of passage problems at Foster Dam, the run declined to an average of 310 adults during 1979-84.
3. The run can continue to be monitored at Foster Dam. 4. Passage conditions at Foster Dam can be improved. 5. South Santiam Hatchery eggs are susceptible to IHN disease which may be contracted
through the water supply. Actions 4.1 Continue to monitor the run of winter steelhead above Foster Dam at Foster Dam. 4.2 Continue to protect natural production in Moose and Canyon creeks with a complete
angling closure.

43
4.3 Protect naturally produced adults by implementing a catch and release only angling regulation in the South Santiam below Foster Dam for unmarked fish.
4.4 Conduct physical and biological surveys in the South Santiam system above Foster Dam,
including spawning surveys in Moose, Canyon, and Owl creeks to estimate the percent contribution of these streams to the spawning escapement measured at Foster Dam.
4.5 Identify critical spawning and juvenile rearing areas for native steelhead in the South
Santiam River above Foster Dam and other areas in the subbasin. Advocate special protection of these critical areas to the respective landowners.
4.6 Improve downstream passage of winter steelhead smolts at Foster Dam by constructing
downstream passage facilities at the dam or trapping smolts above the reservoir and transporting them below the dam. Until this action is implemented or if it fails to increase survival of smolts:
a. Continue to coordinate with the USACE to hold Foster Reservoir at the 614-foot level
from April 15 to May 10 to allow smolts to migrate over spillways. b. Use stoplogs at Foster Dam to produce a 300 cfs surface free-fall spill from April 20 to
May 10 to improve downstream passage of native steelhead smolts. 4.7 Submit a proposal to the USACE to provide uncontaminated water at South Santiam
Hatchery to protect hatchery eggs from IHN disease contracted through water from Foster Reservoir.
Objective 5. Reestablish the winter steelhead run above Green Peter Dam. Assumptions and Rationale 1. South Santiam winter steelhead have been identified as a stock of concern due to declining
numbers, primarily above Foster Dam. 2. Historically, runs above Green Peter Reservoir are estimated to have averaged 1,250 fish
(Buchanan et al. 1984). 3. Green Peter Dam was constructed with the intention that winter steelhead production would
continue above the reservoir. 4. Winter steelhead production in the Middle Santiam has been essentially eliminated due to
passage problems at Green Peter Dam and Reservoir and predation problems in Green Peter Reservoir.
5. Passage conditions at Green Peter can be improved. 6. The run can be monitored at Green Peter Dam.

44
Actions 5.1 Protect naturally produced adults by implementing a no harvest objective in the South
Santiam below Foster Dam for unmarked fish. 5.2 Improve passage of winter steelhead at Green Peter Dam or trap smolts above the
reservoir and transport them below the dam and trap adults and transport them above the reservoir. Until this action is implemented or if it fails to reestablish runs, negotiate with the USACE with coordination with NMFS and USFWS to provide in-kind compensation (natural production) for loss of winter steelhead production above Green Peter and Foster dams. Possibilities include:
a. Identify life history characteristics and habitat needs for native winter steelhead above
Foster Dam. b. Identify strategies for restoring natural production levels, including potential sites for
habitat improvement. Enhance critical areas limiting to native steelhead smolt production.
5.3 Investigate methods to improve upstream passage at Green Peter Dam. Objective 6. Provide an annual minimum escapement of 1,170 winter steelhead adults to the
Calapooia subbasin. Assumptions and Rationale 1. The current escapement of winter steelhead to the Calapooia subbasin is unknown. 2. Spawning densities in the upper main stem Calapooia and its tributaries averaged 15 redds
per mile between RM 50.3 and RM 73 (see Table 14). Using a 1:1 sex ratio, an estimated 700 adults would be needed to account for the spawning density in this reach.
3. The smolt production of the Calapooia subbasin using an alternative method, the gradient-
area-flow methodology (Washington Department of Wildlife), is estimated as 20,452 smolts. Using an egg-to-smolt survival rate of 1 percent (actual rates are unknown, but typically range from 0.5-1.5%), fecundity of 3,500 eggs per female, and a 1:1 sex ratio, an escapement of at least 1,170 fish would be needed to produce the estimated number of smolts.
4. Habitat quality will be maintained or improved. 5. Unscreened diversions contribute to smolt mortality.

45
Actions 6.1 Conduct annual spawning surveys to assess population distribution and abundance as
measured by redd counts, the number of miles of production, and an estimate of the number of fish per redd, in the following index stream reaches:
Calapooia River, RM 65.0-72.5 (for trend information only) North Fork Calapooia River, RM 0.0-1.0 Potts Creek, RM 0.0-1.0 6.2 Inventory streams for potential habitat enhancement projects. Document potential projects
in a report. 6.3 Initiate a program to screen the Brownsville irrigation diversion. 6.4 Improve passage at Thompson's Mill Dam on the Calapooia. 6.5 Monitor upstream passage at the Brownsville Dam bypass and at Sodom Dam on the
Calapooia and recommend steps to improve passage if needed. Objective 7. Provide an average annual sport catch of 290 fish (200 natural plus 90 hatchery-
produced) in the main stem Santiam and 870 fish (600 natural plus 270 hatchery-produced) in the North Santiam, and provide a catch-and-release fishery in the South Santiam.
Assumptions and Rationale 1. Applying an 8% smolt-to-adult survival to the smolt production estimate of 150,544 smolts for
the Santiam subbasin results in a return of 12,044 adults. 2. If the spawning escapement goal of 8,600 adults is met through a return of 12,000 adults to
the Santiam subbasin, then 3,400 naturally produced adults would be available for harvest. 3. A harvest rate of 30% would provide a catch of 1,020 naturally produced fish from 3,400
available to the sport fishery. 4. Of the total Santiam sport harvest during 1980-85, 19% occurred in the main stem Santiam,
60% in the North Santiam, and 21% in the South Santiam. Applying these percentages to a total subbasin harvest of 1,020 naturally produced fish results in catches of about 200, 600, and 200 naturally produced fish in the main stem, North, and South Santiam, respectively.
5. Continued hatchery releases of 100,000 smolts should result in a return of 1,200 hatchery
adults to the North Santiam. Applying a 30% harvest rate would result in an additional catch of 360 hatchery-produced fish in the main stem Santiam and North Santiam rivers. About 25% of these fish would be harvested in the main stem Santiam, 75% in the North Santiam.

46
6. Run size can be monitored at Willamette Falls to estimate the size of the Santiam run. The spawning escapement needed for the Willamette basin above Willamette Falls based on an estimated smolt production of 353,620 (gradient-area-flow method) is 10,103 adults.
Actions 7.1 Conduct a random creel check on the Santiam River and lower North and South Santiam
rivers during late March and April to provide an estimate of fishing pressure. 7.2 Continue to monitor the harvest of winter steelhead in the subbasin through punch card
returns. Objective 8. Provide a potential average annual harvest of 140 winter steelhead in the
Calapooia. Assumptions and Rationale 1. Applying an 8% smolt-to-adult survival to the smolt production estimate of 20,452 smolts for
the Calapooia subbasin results in a return of 1,636 adults. 2. If the spawning escapement goal of 1,170 adults is met through a return of about 1,640
adults to the Calapooia subbasin, then 470 adults would be available for harvest. 3. A harvest rate of 30% would provide a catch of 141 fish from 470 available to the sport
fishery. 4. Anglers have limited access below RM 45.5. 5. Protection of the native run has priority over harvest. Actions 8.1 Continue to monitor the harvest of winter steelhead in the subbasin through punch card
returns.

47
SUMMER STEELHEAD
Background and Status
Origin Summer steelhead are not native to the Santiam and Calapooia subbasins. Skamania summer steelhead were successfully introduced into the Willamette basin following improvement of fish passage at Willamette Falls in 1971, improved water quality through pollution abatement programs in the 1950s and 1960s, and increased summer flows from releases from dams. Skamania stock was first introduced into the Little North Santiam in 1966 and the South Santiam in 1969 (Buchanan 1975). Releases have also been made in the North Santiam. No releases have been made in the Calapooia River.
Life History and Population Characteristics Distribution and Abundance Summer steelhead in the Willamette basin are managed for production and harvest of hatchery fish (OAR 635-500-211). Summer steelhead are not managed for natural production because of the possible negative impacts on the native winter steelhead stock. Sizeable self-sustaining runs of summer steelhead have not developed. However redds have been found in Rock and Mad creeks in the North Santiam and in Hamilton, McDowell, and Wiley creeks in the South Santiam (Table 19).
Table 19. Skamania summer steelhead redds per mile in the Santiam subbasin (J.J. Wetherbee, ODFW, unpublished data). ________________________________________________________________ Year Location 1985 1986 1987 1988 1989 1990 ________________________________________________________________ North Santiam R. Rock Cr. 2.0 -- -- -- -- -- Mad Cr. 16.0 -- -- -- -- -- South Santiam R. Hamilton Cr. 5.8 -- 11.8 2.9 -- 2.5 McDowell Cr. 18.0 -- 10.3 3.2 -- -- Wiley Cr. 8.9 -- 3.9 3.6 -- -- ________________________________________________________________
Run Timing Adults return to Foster Dam from April through October with the peak of the returns occurring in June and July (Buchanan et al. 1979).

48
Run Size Returns to Minto Dam on the North Santiam and Foster Dam on the South Santiam provide an index of subbasin hatchery run size. These counts underestimate total subbasin hatchery run size as many smolts are released lower in the system and may not return to Minto or Foster dams. These estimates also do not include the proportion of the run harvested. Counts of fish passing Willamette Falls, Minto Dam, Foster Dam, and Green Peter Dam are given in Table 20. Counts from dams in the Santiam subbasin combined with catch data suggest that approximately 61 percent of the Willamette Falls run enters the Santiam subbasin (intra-agency memo dated 12 December 1988 from J.J. Wetherbee, ODFW, Salem, Oregon).
Table 20. Counts of Skamania summer steelhead at Willamette Falls and dams in the Santiam subbasin (Buchanan et al. 1979, Foster 1990, and unpublished data, ODFW). ___________________________________________________________________________ Run Willamette North Santiam South Santiam year Falls Minto Dam Foster Green Petera ___________________________________________________________________________ 1970 146 -- 154 0 1971 2,310 -- 2,740 143 1972 690 -- 858 20 1973 1,686b 20 1,365 57 1974 4,858 77 4,568 438 1975 2,910 375 1,157 16 1976 3,876 810 1,526 39 1977 9,244 1,737 4,809 331 1978 15,172 1,367 4,997 161 1979 7,638 782c,d 2,641 2e 1980 11,222 2,184 -- 1981 15,224 2,429 -- 1982 12,571 2,161 -- 1983 5,301 1,296 -- 1984 25,002 4,930 -- 1985 22,223 4,466 -- 1986 40,719 5,146 -- 1987 23,742 3,908 -- 1988 36,940 8,642 -- 1989 6,841 1,655 -- 1990 23,428 6,569 -- ___________________________________________________________________________ a Summer steelhead were not passed above Foster Dam after 1980. b May include 200-plus sockeye salmon. c Counts adjusted for 18% recycling at Minto Dam. d Incomplete counts, through 30 September 1979. e Incomplete counts, through 31 December 1979. f Includes 156 fish removed from potholes below the falls.
Another method of estimating subbasin run size using smolt releases, smolt-to-adult survival rates, and age at return was employed (Table 21). Run size estimates for 1979 to 1988 ranged from 4,688 to

49
29,920 fish. Run size averaged 15,790 fish during 1979 to 1988. During 1984-88 estimated run size has more than doubled compared to previous years. The estimated percent of the Willamette Falls run entering the Santiam subbasin during 1979-88 was 70 percent to 90 percent.
Table 21. Summer steelhead run size estimates for 1979-88 for the Santiam subbasin based on smolt releases, an estimated smolt-to-adult survival of 7 percent, and age at return as reported by Wade and Buchanan (1983). ___________________________________________________________ % Willamette Falls Run Year Estimated Run Sizea Run Size ___________________________________________________________ 1979 6,891 90.2 1980 9,251 82.4 1981 13,378 87.9 1982 11,214 89.2 1983 4,688 88.5 1984 20,765 83.1 1985 19,009 85.5 1986 29,920 73.5 1987 17,002 71.6 1988b 25,779 69.8 ___________________________________________________________ a Age at return 2% 1-salt, 90% 2-salt, 8% 3-salt. b Preliminary data on 1987 smolt releases.
Returns of adult Skamania stock to collection facilities at Foster Dam have fluctuated substantially in the last five years, ranging from 1,043 to 8,926 adults (Table 22). Strong returns to Foster Dam since 1984 have permitted recycling of excess adults through the fishery.
Table 22. Hatchery return size of Skamania summer steelhead at Foster trap (ODFW, unpublished data). ____________________________________________________________ Run Year Brood Year Hatchery Return ____________________________________________________________ 1983-84 1984 1,043 1984-85 1985 7,899 1985-86 1986 7,357 1986-87 1987 8,926 1987-88 1988 5,090a ____________________________________________________________ a Preliminary data

50
Age, Size, and Sex Ratio Approximately 85 percent of the run returning to Foster Dam are 2-salt fish (Table 23). Releasing smolts at larger sizes to increase survival tends to increase the proportion of 2-salts in the adult return (Wade and Buchanan 1983).
Table 23. Ocean age of adult summer steelhead returning to Foster Dam (Howell et al. 1985a). _________________________________________________________________ Brood Adult age (%) year 1-salt 2-salt 3-salt 4-salt _________________________________________________________________ 1969 8.7 72.8 16.3 2.2 1970 7.5 84.4 8.0 0.2 1971 5.2 87.8 6.8 0.1 1972 5.1 85.6 9.3 0.0 1973 11.0 86.7 2.9 0.0 1974 21.1 86.6 2.1 0.0 1975 8.1 88.0 4.2 0.0 1976 2.8 88.9 8.3 0.0 1977 6.1 76.8 17.1 0.0 1978 2.9 94.2 2.9 0.0 1979 1.5 87.6 11.0 0.0 Mean 7.3 85.4 8.1 <0.1 _________________________________________________________________
The average length of 1979 and 1981 brood year adult summer steelhead collected at Foster Dam ranged from 56.5 cm to 81.8 cm (Table 24).
Table 24. Average length of adult summer steelhead collected at Foster Dam (Howell et al. 1985a). _________________________________________________________________ Brood Saltwater year Sex Age Length (cm) n _________________________________________________________________ 1981 M&F 1-salt 56.5 50 1979 M 2-salt 70.6 650 1979 F 2-salt 68.0 618 1979 M 3-salt 81.8 50 1979 F 3-salt 78.3 50 _________________________________________________________________
Approximately 50 percent of the adult returns of 1984 to 1987 brood year summer steelhead (n=30,315) to Foster Dam were females (ODFW, unpublished data).

51
Time of Spawning Skamania summer steelhead adults are spawned from January through early March. Fecundity at South Santiam Hatchery averaged 3,875 eggs per female during 1984 to 1988. Juvenile Life History Eggs are incubated at South Santiam Hatchery for approximately six weeks until hatching, usually in mid-April. Alevins are shipped to Roaring River Fish Hatchery for rearing in warmer water until June. Fry are then shipped back to South Santiam Hatchery for rearing until the following April (Howell et al. 1985a). Fingerlings are released in the fall and smolts in April and early May. Skamania summer steelhead smolts are age 1+ (Howell et al. 1985a) and usually 18 cm to 22 cm long. Smolts migrate past Lebanon Dam on the South Santiam from mid-April until mid-May (Howell et al. 1985a). Smolt-to-adult survival varies with size at release. Smolts greater than 20 cm fork length return at twice the rate of smolts 18 cm to 20 cm and 10 times the rate of smolts less than 18 cm. Returns to the South Santiam in 1984 through 1986 averaged 7.1 percent. Survival rates in the North Santiam are believed to be less, around 5 percent (intra-agency memo dated 12 December 1988 from J.J. Wetherbee, ODFW, Salem, Oregon).
Hatchery Production Description of Hatcheries Two hatcheries in the Santiam subbasin, South Santiam and Roaring River, are currently used for production of Skamania summer steelhead. South Santiam Hatchery has facilities to collect returning adults. Hatchery summer steelhead collected at Foster Dam provide the brood stock for South Santiam and Roaring River hatcheries. Naturally produced fish returning to Foster Dam are recycled through the fishery. South Santiam Hatchery takes fish from the entire run season for brood. Adult fish recycled through the fishery are marked for identification of original time of return. South Santiam Hatchery incubates summer steelhead eggs, but seasonal turbidity of the water source limits rearing. Eyed eggs are shipped to other hatcheries (Oak Springs and Leaburg) for hatching and rearing. Some of the eyed eggs shipped to Oak Springs Hatchery are hatched and reared to 100 to 200 fish per pound and sent back to South Santiam Hatchery for completion of rearing until release at five fish per pound. Roaring River Hatchery also receives eyed eggs from South Santiam Hatchery and raises them to five fish per pound before release. Hatchery Releases Production of Skamania summer steelhead mitigates for loss of native winter steelhead in areas flooded by Foster and Green Peter reservoirs. Summer steelhead extend the steelhead fishery beyond the winter run. The steelhead sport fishery in the subbasin now lasts 9-10 months.

52
Early adult returns of Skamania stock to the Little North Santiam and North Santiam rivers were poor (Buchanan 1975), possibly due to the combined effects of poor quality smolts and bacterial infections (Aeromonas salmonicida and A. liquefaciens) associated with high water temperatures in the lower Willamette during smolt outmigration (Buchanan 1975). Presently, low spring flows below Foster Dam on the South Santiam River tend to retard smolt migration. The recent annual allocation of summer steelhead smolts is 20,000 in the Little North Santiam, 180,000 in the North Santiam, and 160,000 in the South Santiam. These allocations have provided adequate returns to the fishery as well as ample fish for brood stock at South Santiam Hatchery. Releases are made to maximize harvest by the fishery by encouraging adults to hold near fishing areas. Releases in the Little North Santiam are made below RM 17 to minimize potential impacts on naturally produced winter steelhead, which are found primarily above RM 17. Releases of Skamania summer steelhead in the Santiam subbasin during 1978 to 1986 are listed in Table 25 and Appendix Table B-1. STEP releases of Skamania summer steelhead fry are listed in Table 26. Further STEP releases of summer steelhead will not be made in the subbasin, as required by the Willamette Basin Fish Management Plan (OAR 635-500-211).
Table 25. Releases of Skamania stock summer steelhead in the Santiam subbasin (ODFW, unpublished data). ______________________________________________________________________ Release Number released year Hatchery Fingerlings Smolts ______________________________________________________________________ 1976 Alsea 106,690 Roaring River 163,560 South Santiam 192,403 1977 Alsea 106,987 Roaring River 85,831 South Santiam 7,191 142,745 1978 Alsea 130,622 Roaring River 5,986 83,102 1979 Alsea 100,503 Roaring River 58,824 76,674 South Santiam 26,638 164,694 1980 Alsea 125,681 Roaring River 24,770 81,047 South Santiam 191,165 ______________________________________________________________________ (continued).

53
Table 25 continued. ______________________________________________________________________ Release Number released year Hatchery Fingerlings Smolts ______________________________________________________________________ 1981 Alsea 123,883 Oak Springs 45,157 Roaring River 81,769 South Santiam 82,022 1982 Oak Springs 64,998 Roaring River 76,475 South Santiam 101,713 139,333 Trojan Ponds 30,305 1983 Gnat Creek 43,827 McKenzie 35,269 Roaring River 72,976 South Santiam 78,149 260,700 1984 Marion Forks 13,420 Roaring River 56,030 South Santiam 25,173 174,785 Willamette 68,542 1985 McKenzie 41,168 Roaring River 134,251 South Santiam 33,406 298,258 1986 McKenzie 39,977 Roaring River 30,303 114,657 South Santiam 2,768 252,464 1987 McKenzie 38,622 Roaring River 71,540 Willamette 83,048 1988 McKenzie 29,700 Roaring River 114,187 South Santiam 201,650 1989 South Santiam 345,432 1990 McKenzie 41,424 Roaring River 123,712 South Santiam 195,352 ______________________________________________________________________

54
Table 26. STEP releases of South Santiam Hatchery Skamania summer steelhead fry in the Santiam subbasin, 1982-87 (ODFW, unpublished data). ______________________________________________________________________ Brood Number Release year Released Release location date ______________________________________________________________________ 1983 46,261 Scott Cr., So. Santiam April 1983 1984 25,600 Little North Santiam May 1984 26,300 Scott Cr., So. Santiam May 1984 1,500 Thomas Cr., So. Santiam May 1984 1985 35,648 Little North Santiam April 1985 26,900 Little North Santiam May 1985 14,877 North Santiam May 1985 1986 18,048 Little North Santiam March 1986 18,225 Scott Cr., So. Santiam April 1986 ___________________________________________________________________________
Angling and Harvest Of the total Willamette basin sport harvest of summer steelhead during 1975 to 1986, an average of 45.4 percent of the catch came from the Santiam subbasin. Sport catch has generally increased in recent years, yet catch can vary greatly from year to year (Table 27). Sport catch during 1977 to 1988 ranged from 1,601 to 12,089 fish and averaged 7,188 fish. Approximately 50 percent of the subbasin harvest is from the North Santiam, 35 percent from the South Santiam, and 15 percent from the Santiam River. Minimal numbers of fish are caught in Mill and Crabtree creeks. Harvest of summer steelhead in the Santiam subbasin is subject to general ODFW angling regulations for steelhead.

55
Table 27. Harvest of summer steelhead in the Santiam subbasin (ODFW 1990b). _______________________________________________________________________________________________________ Years 1977 1978 1979 1980 1981 1982 1983 1984 1985 1986 1987 1988 _______________________________________________________________________________________________________ Mill Creek 15 11 0 0 3 4 0 0 0 0 0 0 Santiam River 1,552 1,024 751 836 582 632 201 540 941 779 805 960 North Santiam River 1,641 3,198 1,985 3,144 2,700 2,087 853 4,320 5,033 5,399 3,956 4,365 Little No. Santiam R. 36 104 115 138 92 131 30 257 557 353 237 269 South Santiam River 1,374 4,742 1,293 1,031 1,531 1,648 514 4,147 4,660 4,973 2,982 6,478 Foster Reservoir 33 27 0 0 0 4 0 0 2 6 0 8 Crabtree Creek 12 8 22 0 0 0 3 0 76 36 0 9 Total Subbasin Harvest 4,663 9,114 4,166 5,149 4,908 4,506 1,601 9,264 11,269 11,546 7,980 12,089 _______________________________________________________________________________________________________
Management Considerations Summer steelhead are not native to the Santiam and Calapooia subbasins. Skamania stock summer steelhead were introduced into the North and South Santiam in the late 1960s. No releases have been made in the Calapooia River. Because of the concern for possible impacts of natural production of summer steelhead on native winter steelhead, summer steelhead in the Willamette basin are managed for production and harvest of hatchery fish. The effects of natural summer steelhead production on native winter steelhead production in the Santiam subbasin are unknown. Although natural production of summer steelhead has not been monitored, it is considered to be minimal. Estimates of natural production of summer steelhead in rivers and streams of the Santiam subbasin are needed. Returning adult summer steelhead encounter upstream passage problems at Stayton. Unscreened diversion ditches at Stayton cause loss of smolts during downstream migration. Releases of summer steelhead smolts are generally made in the main stem of large rivers rather than in small tributaries where winter steelhead spawn. However releases are made in the lower 17 miles of the Little North Santiam, a stream identified in this plan as being managed for natural production of winter steelhead. Releases of summer steelhead in the Little North Santiam could be reallocated

56
elsewhere in the North or South Santiam rivers to minimize the potential negative impact of summer steelhead on natural production of winter steelhead if needed. Rainbow trout spawn in the spring when hatchery steelhead smolts are released. Some hatchery steelhead smolts are precocious and may spawn with trout. The proportion of hatchery releases that are precocious and that contribute to natural production requires monitoring and evaluation. Changes in steelhead hatchery programs may be required in order to meet Wild Fish Management Policy guidelines for trout.
Policies Policy 1. Summer steelhead shall be managed for production and harvest of hatchery fish.
The Department shall monitor the run for possible natural production. Policy 2. Summer steelhead smolts shall be released into streams that have suitable adult
holding habitat throughout the summer and where adults will provide optimum recreational opportunity.
Policy 3. Summer steelhead in the South Santiam River shall be confined to
areas below Foster Dam to protect native winter steelhead production in the upper South Santiam.
Policy 4. Only smolt-sized fish shall be released to minimize competition with native
salmonids. Policy 5. Brood stock shall be collected May through October to maintain broad run-timing
while reducing overlap with the run-timing of the native winter steelhead stock.
Objectives Objective 1. Increase the potential average annual sport catch to 700 summer steelhead in the
main stem Santiam, 4,500 in the North Santiam, and 5,600 in the South Santiam. Assumptions and Rationale 1. The Santiam has a popular summer steelhead fishery. Summer steelhead extend the
shorter winter steelhead fishery. 2. The average annual catch during 1984 to 1988 was 805 fish on the main stem Santiam,
4,949 in the North Santiam (including the Little North Santiam), and 4,675 on the South Santiam. In recent years sport catch has generally increased.

57
3. The proposed harvest levels are the product of applying 7 percent and 5 percent survival rates to current smolt allocations in the South and North Santiam drainages, respectively, and a 50 percent exploitation rate in the fishery.
4. The use of acclimation ponds and releasing smolts lower in the fishery will increase the
likelihood that returning adults will hold there longer, increasing their harvest rate. Actions 1.1 Negotiate with the USACE to provide uncontaminated water at South Santiam Hatchery to
protect hatchery eggs from IHN disease contracted through water from Foster Reservoir. 1.2 Provide an annual average return of 9,000 adults to the North Santiam River through the
annual release of 200,000 smolts in the North Santiam (which should produce 10,000 adults at a 5 percent return rate).
1.3 Provide an annual average return of 11,200 fish to the South Santiam, including 2,000 fish
for broodstock needs, through the annual release of 160,000 smolts in the South Santiam (which should produce 11,200 adults at a 7 percent return rate).
1.4 Consider the use of acclimation ponds to increase returns of adults to the fishery. 1.5 Release smolts throughout the North and South Santiam rivers for better distribution of
returning adults for harvest potential. 1.6 Continue to maintain a late May opening for trout in the Santiam streams where summer
steelhead smolts are released to protect outmigrant summer steelhead smolts. 1.7 Continue to coordinate release schedules with hydro projects such as Stayton, PP&L, and
Albany's Lebanon canal to provide adequate protection of outmigrant smolts. 1.8 Initiate a program to screen all diversions to protect outmigrant smolts. 1.9 Continue to monitor run size with sport catch, collection facility counts, Willamette Falls
counts, and the percent of the Willamette Falls run that returns to the Santiam subbasin. 1.10 Implement habitat protection actions outlined under objectives for Habitat Protection.

58
Objective 2. Continue to maximize harvest of adults in the subbasin. Assumptions and Rationale 1. Natural spawning by summer steelhead is not desirable because of the potential impact on
production of native winter steelhead. 2. Except for meeting brood stock needs at Foster Dam, theoretically all adults could be
harvested. Actions 2.1 Continue recycling adults through the fishery below Foster Dam unless studies show that
recycling results in negative impacts on winter steelhead, such as an increase in natural production of summer steelhead.
2.2 Negotiate with the USACE to maintain a minimum release of 800 cfs from Foster Dam June
through July to increase harvest of fish in the South Santiam. Objective 3. Maintain a return of 2,000 adults to Foster Dam to meet brood stock needs. Assumptions and Rationale 1. Only 1,000 adults are required for brood stock, but the overage allows for mortality and better
variety for selection of timing segments. Usually 5,000 adults are handled at Foster collection facilities, but most are recycled into the fishery until brood stock collection is completed.
2. Current hatchery releases of 160,000 smolts in the South Santiam would provide a return of
11,200 fish assuming a 7 percent survival rate. Actions 3.1 Provide an annual average return of 11,200 fish to the South Santiam, including 2,000 fish
for broodstock needs, through the annual release of 160,000 smolts in the South Santiam (which should produce 11,200 adults at a 7 percent return rate).
3.2 Continue to tag adults returning to Foster Dam with a different color for each month to
enable selection of brood fish for variety in run timing.

59
Objective 4. Minimize the potential impact of summer steelhead on native winter steelhead and trout.
Assumptions and Rationale 1. Summer steelhead are known to spawn in some areas in the subbasin, but the success of
natural production and its impact on production of winter steelhead is unknown. 2. Releases of precocious hatchery steelhead smolts near areas where spawning of trout
occurs may decrease the genetic fitness of trout populations. Actions 4.1 Conduct spawning surveys on several tributaries during the period when fish are mature. 4.2 Assess juvenile production of summer steelhead in Hamilton Creek and the Little North
Santiam. 4.3 Evaluate the experimental releases of groups of sterilized smolts below Foster Dam and
their returns. 4.4 Investigate the potential impact of the current summer steelhead hatchery program,
including recycling of fish returning to Foster Dam through the fishery, on natural production of winter steelhead in the Santiam subbasin.
4.5 Make any necessary changes in the current hatchery program for summer steelhead to
protect the genetic integrity and natural production of winter steelhead in the Santiam subbasin.
4.6 Minimize the proportion of hatchery steelhead smolts that are precocious and their impact
on spawning trout populations. This may be accomplished by removal of precocious fish during marking of hatchery steelhead.
4.7 If necessary modify hatchery steelhead programs to minimize their effects on trout
populations and to be in compliance with Wild Fish Management Policy guidelines.

60
COHO SALMON
Background and Status
Origin Coho are not native to the Willamette River or its tributaries above Willamette Falls, but were widely introduced above the falls in the 1960s following improvements in fish passage conditions (Williams 1983a). Efforts to develop a self-sustaining run above Willamette Falls have been largely unsuccessful.
Life History and Population Characteristics Distribution Spawning surveys conducted during 1970-77 documented successful natural spawning in the North and South Santiam rivers, Mill Creek and the Calapooia River (Williams 1983a). Currently, spawning of coho is thought to be confined to Mill Creek and possibly Stout Creek, a tributary to the North Santiam. Returns to Mill Creek may be from fry and pre-smolt releases. Strays from remnant populations from nearby streams are occasionally found in the Santiam River system. Run Timing Early run coho adults and jacks pass Willamette Falls from early September through the end of October (Howell et al. 1985b). They probably enter Mill Creek approximately two weeks later. Age Structure Coho generally return as 2-year-old jacks and 3-year-old adults.
Hatchery Production Coho were introduced into the Santiam and Calapooia subbasins as part of the Oregon Fish Commission's program to establish self-sustaining runs above Willamette Falls. Managers initiated releases of fry, fingerlings, yearlings, and adult spawners in the 1950s (Table 28). Coho were released in the North Santiam from 1961 to 1972, in Mill Creek from 1964 to 1970, in the South Santiam from 1957 to 1974, and in the Calapooia from 1961 to 1970 (Williams 1983b). The objective of the releases was to seed as many suitable streams as possible with coho that would use the available rearing capacity (Williams 1983a).

61
Table 28. Summary of releases of coho in the Santiam and Calapooia subbasins (Williams 1983b; ODFW, unpublished data). Brood Release Number released year years Hatchery Fry Fingerlings Yearlings Adults 1957 1958 Sandy 44,340 1958 1959 Sandy 46,000 1959 1960 Sandy 77,759 1960 1961 Sandy 100,913 1961 1962 Bonneville 474,096 1962 1963 Bonneville 1,234,448 Klaskanine 502,444 1963 1965 Sandy 68,998 1964 1965 Bonneville 494,728 169,265 1964, 65 Cascade 696,850 201,217 1,857 1965 Klaskanine 50,400 1966 Sandy 103,672 1965 1966 Big Creek 542,587 1966 Bonneville 450,000 1966 Klaskanine 526,634 1966 Oxbow 231,756 1965, 66 Sandy 90,000 1966 1966, 67 Big Creek 444,288 150 1967 Bonneville 539,015 113 1966 Cascade 594 1967 Klaskanine 2,514,124 1967 Sandy 315,906 123,900 1967 1967, 68 Bonneville 744,660 2,219 1967, 68 Cascade 806,295 2,174 1968 Klaskanine 521,000 2,160 1968 Sandy 677,872 1,126 1968 1968, 70 Big Creek 73,920 200 1968, 69 Bonneville 1,244,607 2,180 1969, 70 Cascade 519,000 131,992 1970 Klaskanine 28,440 1969, 70 Sandy 293,618 20,234 1969 1971 Alsea 15,001 1969 Big Creek 540 1969, 70 Bonneville 806,642 200 1970, 71 Cascade 391,000 341,553 1970 Sandy 824,474 1970 1972 Alsea 12,320 1972 Cascade 330,810 1971 1973 Bonneville 217,708 1973 Cascade 160,957 1971 Sandy 150 " continued

62
Table 28 continued. Brood Release Number released year years Hatchery Fry Fingerlings Yearlings Adults 1972 1972, 74 Bonneville 300,421 200 1973 Cascade 99,184 1972, 74 Sandy 77,905 158 1973 1973 Eagle Creek 363 1974 1976 Cascade 50,960 1983 -- Cascade 118,754 1985 -- Oxbow 55,480 In 1982, the Oregon Fish and Wildlife Commission banned further releases of coho in eastside tributaries of the Willamette upstream of the Santiam River. The commission acted in recognition of concerns about negative interactions between coho and cutthroat trout, or other native species. Releases were authorized for Mill Creek, which currently may have some natural production supplemented by STEP releases (Table 29). Currently no hatchery releases of coho are made in the Santiam or Calapooia subbasins.
Table 29. STEP releases of coho fry in Mill Creek during 1982-1987 (ODFW, unpublished data). Brood Number Release year released location Release date 1985 27,250 Beaver Creek March 1986 1986 3,000 Beaver Creek February 1987 1987 1,000 Mill Creek February 1988
Angling and Harvest Sport harvest of coho in the subbasin has declined to minimal levels in recent years (Table 30). Potential harvest of coho in the Santiam and Calapooia subbasins is subject to general Oregon Department of Fish and Wildlife angling regulations for salmon.

63
Table 30. Santiam subbasin adult harvest for coho (ODFW 1990b). _________________________________________________________________________________________________________ Years 1975 1976 1977 1978 1979 1980 1981 1982 1983 1984 1985 1986 1987 1988 1989 _________________________________________________________________________________________________________ Santiam River 14 44 26 9 0 0 0 0 0 0 0 16 0 20 0 North Santiam River 0 0 2 0 3 9 0 0 0 0 8 0 0 8 0 South Santiam River 0 45 10 0 0 0 0 0 0 6 16 46 0 0 0 Total Subbasin Harvest 14 95 38 9 3 9 0 0 0 6 24 62 0 28 0 __________________________________________________________________________________________________________
Management Considerations Streams in the Santiam and Calapooia subbasins are generally considered to be unsuitable for coho due to habitat constraints and potential competition with other species. Low flows and warm water temperatures in the early fall limit spawning of early run stocks. Coastal stocks released are susceptible to Ceratomyxa shasta, a naturally occurring disease organism in the Willamette River. The Willamette Basin Fish Management Plan (ODFW 1988a) states that STEP hatch-box projects using coho eggs will be phased out in tributaries above Willamette Falls. No further releases of coho will occur in Mill Creek.
Policies Policy 1. No further releases of coho salmon shall be made in the Santiam and Calapooia
subbasins.

64
SPRING CHINOOK SALMON
Background and Status
Origin Spring chinook is the only race of salmon native to the Santiam and Calapooia subbasins. The Santiam subbasin has produced approximately 33 percent of the naturally produced spring chinook in the Willamette basin above Willamette Falls (unpublished intra-department memo dated November 22, 1977 from W. Saltzman, ODFW, Portland, Oregon). Currently, the number of naturally produced fish is probably the same, however the percentage has probably decreased due to the increase in numbers of hatchery fish released. Marking studies of the 1970 brood year indicated that approximately 25 percent of the returns to the Willamette River were naturally produced fish (Bennett 1988). The current percentage of naturally produced fish in the spring chinook run above Willamette Falls is unknown, but is believed to be 5-15 percent (letter dated June 7, 1989 from H. Wagner, ODFW, Portland, Oregon to L. Sowa, Salem, Oregon). Run size appears to be directly tied to the number of hatchery smolts released. Spring chinook adults returning to Foster Dam are primarily hatchery fish, however some spawn in the river and its tributaries downstream. Willamette River spring chinook are currently listed by ODFW as a stock of concern due to diminished habitat, the small percentage of the total run that is of natural origin, and possible genetic impacts on naturally produced fish from the large hatchery program. Spring chinook in the North and South Santiam should be given a high priority with respect to future management funding and staffing.
Life History and Population Characteristics Distribution Spawning ground surveys conducted during 1946 and 1947 indicated that historically the major spring chinook production areas in the North Santiam system occurred in the main stem North Santiam, the Little North Santiam and Breitenbush rivers, Marion Creek and Blowout Creek (Mattson 1948). An estimated 71% of the spring chinook production occurred above Detroit Dam (Mattson 1948). Because passage facilities were not incorporated into Detroit Dam, this production area was lost when the Dam was constructed. Major spring chinook producing areas in the South Santiam system were the Middle Santiam River, Quartzville Creek, and a 5-mile reach upstream of Cascadia on the South Santiam River. Historically, 85% of the spring chinook production in the South Santiam system occurred above Foster Dam (Mattson 1948). Reservoir mortality and passage problems have contributed to the decline in the runs above Foster Dam. Currently adults are not passed above Foster Dam. In recent history, access to much of the potential spawning area in the Calapooia River has been

65
blocked by Thompson's Mill and Sodom dams. Additionally, timber harvesting in the watershed has resulted in mass erosion and massive land movements, which have degraded spawning habitat. By the 1970s natural production of spring chinook in the Calapooia was thought to be minimal or non-existent. Run Timing Adult spring chinook begin entering the Santiam subbasin in mid-May. The peak of the migration is from late May through early June. Adults reach Minto Dam from late June through mid-October although peak entry into Minto adult collection facility is most often in September (Howell et al. 1985b). Adults arrive at Foster Dam primarily in June and July, but may show as early as late April and as late as mid-October. No information is available for adult time of entry into the Calapooia subbasin. Run Size A minimum run size of naturally produced and hatchery spring chinook entering the Santiam subbasin was estimated by adding sport catch and returns to dams and collection facilities (Table 31). This method underestimates run size as few fish return to collection facilities and many are not caught. Minimum run size averaged 5,238 fish from 1971 to 1989 with a range of 1,350 to 11,404 fish. During 1975-89 the average run size of naturally produced and hatchery spring chinook over Willamette Falls was about 40,000 adults (Foster 1990). If 10% of these fish were of natural origin, then the average run size for naturally produced fish was 4,000 adults. Of the total run of naturally produced fish above Willamette Falls, approximately 50% are believed to return to the McKenzie, 40% to the Santiam subbasin, and 10% to other Willamette tributaries (personal communication on 18 January 1991 from D. Swartz, ODFW, Clackamas, Oregon). Therefore the average naturally produced run of spring chinook into the Santiam subbasin during 1975-89 was about 1,600 fish. Since the run in the South Santiam is believed to be almost exclusively hatchery fish, about 1,600 naturally produced fish returned to the North Santiam, a minimal amount to the South Santiam. The average minimum hatchery run size during 1986-90 was about 6,800 fish. During 1986-90 an average of 1,061 fish returned to Minto Dam and 5,733 to Foster Dam, the collection sites for Marion Forks and South Santiam hatcheries, respectively. Run size for the Calapooia subbasin is more difficult to estimate. There are no collection facilities in the subbasin to obtain counts, and no catch has been recorded since 1976 (Bennett 1988). Spawning surveys from 1976 estimated a spawning population of 100 in the main stem (ODFW, unpublished data).

66
Table 31. Minimum run size of naturally produced and hatchery spring chinook entering the Santiam subbasin and percent of Willamette Falls count (estimated by adding sport catch from the Santiam, North Santiam, and South Santiam and returns to collection facilities, Minto on the North Santiam and Foster Dam on the South Santiam) (Bennett 1988; Foster 1990; ODFW 1990b; and ODFW, unpublished data). % Collection Minimum Will. Sport catch facility countsa run Falls Year Sant. N. San. S. San. Total Minto Foster Total size count 1971 -- -- -- 1,320 1,731 4,756 6,104 7,424 16.7 1972 -- -- -- 597 1,885 1,175 3,060 3,657 14.0 1973 -- -- -- 698 1,842 2,735 4,577 5,275 12.6 1974 -- -- -- 698 1,041 4,485 5,526 6,224 14.0 1975 278 167 44 489 949 1,798 2,747 3,236 17.0 5-year average 5,163 1976 53 48 80 181 1,809 966 2,775 2,956 13.3 1977 785 668 283 1,736 558 1,766 2,324 4,060 10.5 1978 103 381 399 883 1,097 2,221 3,318 4,201 9.2 1979 81 153 153 387 166 797 963 1,350 5.3 1980 194 440 219 853 145 947 1,092 1,945 7.4 5-year average 2,902 1981 98 847 148 1,093 744 2,324 3,098 4,191 14.6 1982 235 1,180 105 1,520 960 267 1,227 2,747 6.1 1983 114 446 167 727 605 1,543 1,707 2,434 8.5 1984 66 558 412 1,036 754 3,019 3,773 4,809 11.4 1985 121 1,028 486 1,635 2,189 3,061 5,250 6,885 20.8 5-year average 4,213 1986 101 565 959 1,625 1,100 3,885 4,985 6,610 17.7 1987 243 1,804 1,465 3,512 990 6,902 7,892 11,404 21.6 1988 263 1,872 1,802 3,937 1,059 4,107 5,158 9,095 12.9 1989 291 1,767 1,412 3,470 1,149 6,393 7,542 11,012 15.9 1990 -- -- -- -- 1,007 7,377 8,384 -- --
Age, Size, and Sex Ratio Age composition of 12,863 adults returning to Foster Dam from 1964 to 1969 broods was 3.6 percent age-3 fish, 61.8 percent age-4 four, and 34.6 percent age-5 adults (Smith et al. 1987) (Table 32).

67
Table 32. Age composition of spring chinook adults returning to Foster Dam, 1964-69 brood years (Smith et al. 1987). Brood Age-3 Age-4 Age-5 Year # % # % # % 1964 12 3 184 47 195 50 1965 28 3 492 53 406 44 1966 23 7 1,030 61 541 32 1967 157 3 4,261 83 705 14 1968 80 6 411 32 810 62 1969 59 2 1,571 46 1,798 52 Total 459 3.6 7,949 61.8 4,455 34.6
The average median fork length of adults measured at Marion Forks Fish Hatchery during 1960 to 1968 was 80.38 cm for males and 85.20 cm for females (Table 33).
Table 33. Median fork length (cm) of spring chinook adults measured at Marion Forks Fish Hatchery, 1960-68 (Wallis and Burck 1961, 1962, 1963; Wallis 1964; Swartz and Wallis 1966; Swartz 1967, 1968a, 1968b). Median fork length (cm) Year Males Females 1960 81.49 87.47 1961 71.61 82.18 1962 74.59 80.86 1963 79.18 86.05 1964 85.62 88.33 1965 88.58 89.28 1966 79.24 83.62 1967 79.38 86.93 1968 83.74 82.09
Female-to-male ratios for returns to Marion Forks and South Santiam hatcheries are provided in Table 34. Ratios range from 1:1.1 to 1:3.

68
Table 34. Female-to-male ratios of spring chinook returning to hatcheries in the Santiam subbasin, 1979-83 (Howell et al. 1985b). Hatchery Year Marion Forks South Santiam 1979 1:2.7 -- 1980 -- -- 1981 1:3.0 1:1.1 1982 -- -- 1983 1:1.8 1:1.5
Time and Location of Spawning Spring chinook in the Willamette River system generally spawn from August 25 through October 15 (Mattson 1962). During 1952, fish were taken for spawning as late as November 25 (Mattson 1962). Presently, spring chinook spawn and rear in Mill Creek, in the Little North Santiam up to Henline Creek, and in the North Santiam River from Stayton up to Minto. In the South Santiam drainage, spawning and rearing occurs in Thomas Creek from Jordan Creek to Hall Creek, in Crabtree Creek from RM 14 to White Rock Creek, and in the South Santiam main stem. Spawning and rearing occurs in the Calapooia River from Holley to Treadwell Creek. Marion Forks and South Santiam hatchery fish are spawned as early as August and into October, the median date usually falling in the later half of September (Howell et al. 1985b). Average fecundity of chinook returning to hatcheries during 1978 to 1983 was 4,421 eggs per female at Marion Forks and 4,394 eggs at South Santiam (Howell et al. 1985b). Juvenile Life History Naturally produced fish emerge prematurely in the North Santiam. Warm water discharged from Detroit reservoir in the fall shortens the incubation time of spring chinook eggs. Naturally-spawned salmon fry emerge as early as Thanksgiving in the North Santiam River, based on trap catches in Stayton Power Canal. In an experiment on the North Santiam in 1949, naturally produced fish appeared by June 5 (Mattson 1962). Presently, most juveniles are believed to have emerged by March (personal communication from E. Smith, ODFW, Springfield, Oregon). Fry emerge by the end of January at most hatcheries (Howell 1985b). Hatchery smolt releases in recent broods have concentrated primarily on age-1 fall releases in November and age-2 spring releases in March at both Marion Forks and South Santiam hatcheries. Currently, all Marion Forks smolts are released in March as age-2 emigrants. Fall-released smolts are targeted at 150 mm or larger. Spring releases are fed to achieve an average of nine fish per pound with a uniform length-frequency distribution (personal communication from E. Smith, ODFW, Springfield, Oregon). Initial studies at Dexter and South Santiam hatcheries indicated that fall releases of smolts will

69
produce substantially more adults and larger adults than spring releases (Smith and Zakel 1980a). More recent results indicate a higher survival rate for March-released smolts, with adult age and size determined by smolt size (Smith et al. 1987). Currently yearling smolt releases are divided between fall and spring liberations. Releases in the South Santiam are made in March and November. Releases in the North Santiam are made only in the spring. Smolts begin emigration soon after release. Tagged smolts released from Minto on March 18, 1977 were recaptured at Willamette Falls from March 23 through June (Smith and Zakel 1980b). The protracted emigration pattern for Marion Forks smolts may be related to their relatively small size at release. Large chinook smolts emigrate faster than small smolts (Smith et al. 1987). Smolt-to-adult survival of 1976 to 1980 brood year spring releases from Marion Forks Hatchery averaged 0.68 percent. Survival of 1975 to 1978 brood year hatchery fish from South Santiam Hatchery averaged 0.49 percent for fall releases and 0.51 percent for spring releases (personal communication from E. Smith, ODFW, Springfield).
Hatchery Production Description of Hatcheries Hatcheries in the Santiam subbasin that rear spring chinook are Marion Forks and South Santiam hatcheries. Marion Forks Hatchery has operated since 1951 by ODFW with funding from the USACE and ODFW. Spring chinook adults are captured and held until spawning at Minto collection facility near Gates. The Minto collection facility operates during September 15 through October 15. Early returning fish are believed to hold below the trap until the trap opens, and are included in the brood stock. Fish returning to the collection facilities are mixed and randomly selected for spawning. The proportions of naturally produced and hatchery fish spawned are not monitored. South Santiam Hatchery is also operated by the ODFW with funding from the USACE and ODFW. The original hatchery began operation in 1925, five miles upstream from the present facility. In 1968 the hatchery began operating at its present location near Foster Dam. Hatchery fish are captured for brood stock at Foster Dam. Early, mid, and late-returning fish are selected for brood. Production of spring chinook at Marion Forks and South Santiam hatcheries during the 1975 to 1985 brood years averaged 0.65 and 0.32 million smolts, respectively. These smolts are released in several subbasins in the Willamette basin, including the Santiam.

70
Supplementation History Hatchery releases are derived primarily from native Willamette stock. Experimental releases of 1976 to 1980 brood Carson stock were made from Marion Forks Hatchery, but discontinued due to poor returns to the fisheries. Hatchery releases are intended to compensate for loss of natural production due to construction of dams on the North and South Santiam rivers. The current mitigation levels are no more than 84,000 pounds of juvenile chinook and steelhead for the North Santiam and a maximum of 71,000 pounds of juvenile chinook and steelhead for the South Santiam. Mean releases of spring chinook smolts for 1981-90 were 493,800 fish for the North Santiam and 734,200 for the South Santiam (Appendix Table C-1). Green Peter Reservoir was stocked with approximately 2 million fry and fingerlings annually during 1968-75 and 1979-86. Originally this was a successful program. However, sampling of emigration from spring 1985 through fall 1986 indicated that juveniles had low survival in the reservoir, possibly due to increasing predation (unpublished ODFW intra-department memo dated February 17, 1987 from E. Smith, ODFW, Springfield, Oregon). Releasing fewer, but larger fingerlings later did not increase emigration from the 1985 brood. Managers have stocked pre-smolts, smolts, and adults in the Calapooia River to restore the run. Few returns have been noted, possibly due to continued passage problems, low flows, and limited rearing habitat. However returns have not been adequately monitored and evaluated. STEP releases of spring chinook fry have occurred in the Little North Santiam, and Hamilton and Crabtree creeks (Table 35). Incubation boxes in the Little North Santiam are operated at Camp Cascade. About 20,000 eggs are allocated to the Camp Cascade program. Future STEP releases will be limited to 500 eggs or less at Camp Cascade for educational purposes.
Table 35. STEP releases of spring chinook fry in the Santiam subbasin during 1983-88 (ODFW, unpublished data). Brood Number Release year Hatchery and Stock released Release location date 1983 South Santiam, South Santiam 750 Hamilton Creek Dec 83 1984 " " 35,352 Little North Santiam Jan 85 1985 " " 21,397 Little North Santiam Jan 86 1985 " " 3,929 Crabtree Creek Jan 86 1986 " " 19,500 Little North Santiam Feb 87 1986 " " 5,082 Crabtree Creek Jan 87 1987 " " 8,760 Little North Santiam Feb 88 1987 " " 3,900 Crabtree Creek Jan 88
Angling and Harvest

71
Spring chinook provide angling opportunities in May, June, and July. Sport catch in the North and South Santiam rivers has generally increased since 1975 (Table 36), perhaps due to increasing angler interest. The average annual sport catch during 1977 to 1989 in the Santiam subbasin was 1,724 fish. Average annual sport catch has been increasing in more recent years. The average annual catch during 1987 to 1989 was 3,640 fish. During 1987-89 the Santiam subbasin had the highest sport catch of spring chinook among Willamette tributaries above Willamette Falls. The 1981 to 1989 average annual catch for the North and South Santiam was 1,119 and 772 fish, respectively. Sport catch in the Calapooia subbasin prior to 1975 was minimal (Bennett 1988). The average annual catch during 1963 to 1974 was 13 fish with a range of 0 to 34 fish. Since 1977 there has been no recorded catch of spring chinook in the subbasin. Harvest of Willamette spring chinook in the Santiam subbasin is subject to general Oregon Department of Fish and Wildlife angling regulations for chinook. The sport fishing season has been extended to August 15 in the Santiam subbasin. The Calapooia has been closed to angling for salmon since 1988. Table 36. Santiam and Calapooia subbasin adult harvest for spring chinook, 1977-89 (ODFW 1990b). ____________________________________________________________________________________________________________ Years 1977 1978 1979 1980 1981 1982 1983 1984 1985 1986 1987 1988 1989 ____________________________________________________________________________________________________________ Santiam River 785 103 81 194 98 235 114 66 121 101 243 263 291 No. Santiam R. 668 381 153 440 847 1,180 446 558 1,028 565 1,804 1,872 1,767 So. Santiam R. 267 393 153 219 145 105 164 409 486 959 1,465 1,794 1,412 Crabtree Cr. 16 6 0 0 3 0 3 3 0 0 0 8 0 Total 1,736 883 387 853 1,093 1,520 727 1,036 1,635 1,625 3,512 3,937 3,470 Calapooia River 0 0 0 0 0 0 0 0 0 0 0 -- -- Total Subbasin Harvest 1,736 883 387 853 1,093 1,520 727 1,036 1,635 1,625 3,512 3,937 3,470 ______________________________________________________________________________________________________

72
Management Considerations Dams constructed on the North and South Santiam have blocked access to much of the important adult holding, spawning and rearing habitat in the subbasin. Historically, 71% of the spring chinook production in the North Santiam system occurred above Detroit Dam and 85% of the spring chinook production in the South Santiam system occurred above Foster Dam (Mattson 1948). Changes in natural streamflow patterns and water temperatures below the dams affect fish production in lower reaches of the subbasins (USACE 1988). Cold water discharged from Detroit Dam during early summer causes spring chinook to delay their upstream migration in the North Santiam River several miles downstream from Minto holding facilities. Warm water temperatures in the fall from reservoir draw-down in the North and South Santiam cause early emergence of fry and resulting exposure to winter freshets and juvenile feeding during a nutrient-poor time period. The result of these effects is reduced fry survival. Since construction of Foster and Green Peter dams, spring chinook production upstream has been seriously reduced. Although the Green Peter Dam passage facilities are viable, working facilities, adults are not attracted to the ladder, possibly due to irregular peaking flows and cold water temperatures. Survival of juvenile spring chinook in Green Peter reservoir is very low, apparently due to predation by squawfish and largemouth bass. Spring chinook have not been passed above Foster Dam to avoid fish disease problems at South Santiam Hatchery, which takes its water from the South Santiam River. Also, until the 1980s, returns of adult spring chinook to Foster Dam were not sufficient to meet hatchery needs. Consequently, no fish were available to pass above the dam. Upstream and downstream passage is impeded at the Stayton complex on the North Santiam and at Lebanon Dam on the South Santiam. Downstream passage is impeded at the Lebanon-Albany canal on the South Santiam. Small dams on the Calapooia have blocked adult passage, which contributed to the probable elimination of runs and prevents their re-establishment. Unscreened diversions on both the North and South Santiam as well as the Calapooia cause loss of outmigrating smolts. The extent of natural production occurring in the North Santiam, the Little North Santiam, Crabtree and Thomas creeks, and in the South Santiam below Foster Dam is unknown. Hatchery releases of Skamania summer steelhead and Cape Cod rainbow trout are made in the Little North Santiam. The effects of these hatchery releases on natural production is unknown. The likelihood of success for re-establishment of spring chinook runs in the Calapooia is unknown. Willamette River spring chinook are currently listed by ODFW as a stock of concern due to diminished habitat, the small percentage of the total run that is of natural origin, and possible genetic impacts on naturally produced fish from the large hatchery program. The current hatchery program is most likely out of compliance with the Wild Fish Management Policy. Maintaining the current level of hatchery production in the subbasin, which provides for important ocean and in-river fisheries, and coming into compliance with the Wild Fish Management Policy may not be feasible.

73
Policies Policy 1. The Little North Santiam shall be managed for natural production. No hatchery-
produced spring chinook salmon shall be released into this stream. Policy 2. The North Santiam above Detroit Dam, the South and Middle Santiam above Foster
Dam, and Crabtree and Thomas creeks shall be managed for natural production after reestablishment of runs.
Policy 3. The Calapooia subbasin shall be managed for natural production after a run is
reestablished.
Objectives Objective 1. Increase natural production of spring chinook salmon in the North Santiam,
including the Little North Santiam, and in the South Santiam, including Crabtree and Thomas creeks.
Assumptions and Rationale 1. Willamette spring chinook have been identified as a stock of concern. This objective
addresses some of the problems with the stock. 2. The subbasin supports natural production of spring chinook, although at lower than historic
levels. 3. Monitoring the distribution and abundance of populations of spring chinook will provide an
indication of their health and adaptiveness. 4. Remnant runs of spring chinook in the Little North Santiam, and Crabtree and Thomas
creeks were documented in the 1960s. Currently, little is known about natural production in these and other Santiam system tributaries. Reestablishment of runs may be needed in Thomas and Crabtree creeks.
5. Habitat quality will be maintained or improved. Actions 1.1 Determine the status, including the population abundance, of naturally produced runs of
spring chinook in the North and South Santiam drainages. a. Snorkel resting holes in the Little North Santiam and Crabtree and Thomas creeks
during the summer to estimate returns of spring chinook. b. Conduct spawning surveys in the Little North Santiam and Crabtree and Thomas
creeks during late September to estimate natural production.

74
c. Snorkel the Little North Santiam and Crabtree and Thomas creeks to assess rearing
populations. 1.2 Conduct aerial surveys to determine the distribution and number of spawning redds from
Stayton to Minto on the North Santiam, in the Little North Santiam, and below Foster Dam on the South Santiam.
1.3 If necessary, rehabilitate runs in Thomas and Crabtree creeks by stocking naturally
produced fish from another Willamette tributary system or hatchery smolts for a limited period of time.
1.4 Mark spring chinook hatchery smolts. 1.5 Determine the percent hatchery fish in the run through creel studies, carcass surveys, and
returns to Foster and Minto collection facilities. 1.6 Estimate the contribution of hatchery fish to natural production through carcass surveys. Objective 2. Protect, restore, and enhance spring chinook salmon habitat in the Santiam and
Calapooia subbasins. Assumptions and Rationale 1. Willamette spring chinook have been identified as a stock of concern. This objective
addresses some of the problems with the stock. 2. Protection and enhancement of spring chinook populations can be achieved principally
through habitat protection and improvement. 3. Warm water temperatures from reservoir draw-down in the North and South Santiam rivers
results in reduced survival of spring chinook fry. 4. Unscreened power canals, turbines, and diversions contribute to smolt mortality. Actions 2.1 Identify sites for habitat improvement. 2.2 Develop habitat improvement plans. 2.3 Implement habitat protection actions outlined under objectives for Habitat Protection. 2.4 Emphasize the need to correct water temperature problems associated with USACE
reservoir releases in the North and South Santiam rivers.

75
2.5 Initiate a program to screen all diversions especially the Lebanon-Albany power canal, Stayton Power Canal, the main irrigation canal at Stayton, the Salem water supply intake at Stayton, Sidney ditch, the 19th Street diversion, and Penn Annex lateral.
2.6 Evaluate upstream passage at Stayton and at Lebanon Dam and recommend steps to
improve passage. Objective 3. Reestablish spring chinook salmon runs in the North Santiam above Detroit
Reservoir. Assumptions and Rationale 1. Willamette spring chinook have been identified as a stock of concern. This objective
addresses some of the problems with the stock. 2. Historically, 71% of the spring chinook production in the North Santiam system occurred
above Detroit Dam (Mattson 1948). Because passage facilities were not incorporated into Detroit Dam, this production area was lost when the Dam was constructed.
3. Passage for adults and smolts around Detroit Dam and reservoir can be provided. 4. The run can be monitored at Big Cliff Dam. Actions 3.1 Re-negotiate with the USACE to provide spring chinook access to production areas lost
after the construction of Detroit Dam. 3.2 Determine the hatchery-to-naturally produced ratio of spring chinook in the North Santiam
run. If there are sufficient naturally produced fish, capture adults and pass above Detroit Reservoir to reestablish natural production in the upper North Santiam, following establishment of passage facilities. If there are insufficient naturally produced fish to use for such purposes in the North Santiam, then consider using naturally produced fish from another suitable stock or hatchery fish to reestablish production.
3.3 Continue to pass spring chinook adults above Detroit Reservoir after reestablishing
production.

76
3.4 Monitor the run in the North Santiam at Big Cliff Dam. Objective 4. Reestablish spring chinook salmon runs in the South Santiam above Foster and
Green Peter dams. Assumptions and Rationale 1. Willamette spring chinook have been identified as a stock of concern. This objective
addresses some of the problems with the stock. 2. Historically, 85% of the spring chinook production in the South Santiam system occurred
above Foster Dam (Mattson 1948). Reservoir mortality and passage problems have contributed to the decline in the runs above Foster Dam.
3. Reservoir mortality and passage problems associated with Foster and Green Peter dams can
be resolved. 4. Eggs at South Santiam Hatchery are susceptible to IHN and other diseases which can be
contracted through the water supply. 5. Disease-free water can be provided for South Santiam Hatchery. 6. The run can be monitored at Foster Dam. Actions 4.1 Negotiate with the USACE with coordination with NMFS and USFWS to provide in-kind
compensation (natural production) for loss of spring chinook production above Green Peter and Foster dams.
4.2 Negotiate with the USACE to provide uncontaminated water at South Santiam Hatchery to
protect hatchery eggs and juveniles from IHN and other potential diseases contracted through water from Foster Reservoir.
4.3 Determine the hatchery-to-naturally produced ratio of spring chinook in the South Santiam
run. If there are sufficient naturally produced fish, capture adults and pass above Foster Dam to reestablish production in the upper South Santiam. If there are insufficient naturally produced fish to use for such purposes in the South Santiam, then consider using naturally produced fish from another suitable stock or hatchery fish to reestablish a run.
4.4 Continue to pass spring chinook adults above Foster Dam after reestablishing a run. 4.5 Negotiate with the USACE to conduct a study to assess predation by squawfish and
largemouth bass on juvenile spring chinook in Green Peter Reservoir and determine methods to reduce predation.

77
4.6 Investigate methods to improve upstream passage at Green Peter Dam. 4.7 Monitor the run in the South Santiam at Foster Dam. Objective 5. Reestablish a run of 650 spring chinook salmon in the Calapooia subbasin. Assumptions and Rationale 1. Willamette spring chinook have been identified as a stock of concern. This objective
addresses some of the problems with the stock. 2. A run of spring chinook existed in the Calapooia prior to the 1970s. Spawning surveys in
1976 suggest that the run in the main stem Calapooia was reduced to about 100 fish. Currently, the run in the Calapooia is believed to be minimal or non-existent.
3. Habitat quality will be maintained or improved. 4. Resolving passage problems at Thompson's Mill Dam is necessary for the reestablishment of
a spring chinook run. 5. Unscreened diversions contribute to smolt mortality. 6. Based on smolt production estimates, a maximum spawning escapement of about 700 fish is
needed to fully seed the habitat. This estimate is based on the estimated spring chinook run in the Willamette basin in 1953, which is the largest run on record consisting of mainly naturally produced fish and the proportion of the historical spawning habitat remaining after construction of dams in the Willamette basin. The residual smolt production capacity is 45,952 for the Calapooia and other minor Willamette tributaries. The spawning escapement needed to produce these smolts was back-calculated using an egg-to-smolt survival rate of 3%, fecundity of 4,400 eggs per female, and a female-to-male ratio of 1:1.
7. The spring chinook run could be monitored at the fish passage facilities at Thompson's Mill
Dam, once they are installed. Actions 5.1 Evaluate stream habitat from Holley to Dollar (RM 46-56) for spring chinook spawning and
rearing and adequate temperatures. 5.2 If the results of Action 5.1 confirm that the Calapooia could support a spring chinook run,
then request improvement of upstream passage at Thompson's Mill Dam and bypasses. 5.3 Evaluate upstream passage at Brownsville Dam bypass and recommend steps to improve
passage if needed.

78
5.4 Initiate a program to screen the Brownsville irrigation diversion. 5.5 Rehabilitate the Calapooia run by stocking naturally produced fish from another Willamette
tributary system or hatchery smolts annually below Dollar for a four- to five-year period. 5.6 Monitor adult returns at Thompson's Mill Dam. Objective 6. Provide a potential harvest of 200 adults in the main stem Santiam, 1,400 adults
in the North Santiam, and 1,300 adults in the South Santiam through the release of hatchery spring chinook salmon.
Assumptions and Rationale 1. Proposed hatchery mitigation levels funded by USACE for spring chinook for 1991 are
63,750 lbs. of smolts for the North Santiam and 37,000 lbs. of smolts for the South Santiam. The level of production at South Santiam is expected to produce a return of 1,400 adults. Additional hatchery production will not be funded by USACE.
2. The average annual sport catch during 1985-89 was 204 fish for the main stem Santiam,
1,407 for the North Santiam, and 1,225 for the South Santiam. 3. Angler interest in spring chinook has increased in recent years. 4. Releases of hatchery smolts downstream closer to the fishery and continued recycling of
adults through the South Santiam fishery will contribute to increased harvest. 5. Protection of natural production of spring chinook has priority over harvest in the subbasin. Actions 6.1 Continue to release about 50,000 pounds of hatchery smolts in the North Santiam and
70,000 pounds of smolts in the South Santiam. 6.2 Monitor the proportion of naturally spawning hatchery fish and recommend changes as
appropriate if not in compliance with WFMP standards. 6.3 Investigate the possibility of using acclimation facilities and associated collection facilities to
reduce straying of hatchery spring chinook. 6.4 Consider releasing part of the North Santiam smolt allocation below Minto (at Mehama and
Stayton) in conjunction with acclimation and collection facilities to maximize adult returns to the fishery.
6.5 Evaluate problems associated with early returning adults at Minto, such as closed holding
facilities and poaching potential, and make recommendations to increase harvest of these fish or their use as brood stock.

79
6.6 Evaluate the effectiveness of increasing harvest by recycling spring chinook adults trapped
at Foster collection facilities through the fishery below Foster. 6.7 Conduct stream flow studies using In-stream Flow Incremental Methodology (IFIM) to
determine appropriate flows to maximize angler catch. 6.8 Evaluate the effectiveness of redistributing hatchery releases in conjunction with
acclimation and collection facilities to maximize adult returns to the South Santiam fishery. In cooperation with the Washington Department of Fisheries, use the proposed otolith method to mark smolts released at Waterloo to determine if these fish return to Foster Dam at the same rate as Foster releases, rather than returning to the South Santiam fishery near Waterloo.
6.9 Continue to monitor the sport harvest of spring chinook in the Santiam subbasin. Objective 7. Provide an annual average return of 400 and 1,200 hatchery adults to Marion
Forks and South Santiam hatcheries, respectively. Assumptions and Rationale 1. Brood stock needs for Marion Forks and South Santiam hatcheries are 400 and 1,200 spring
chinook adults, respectively, assuming a 1:1 sex ratio and 20% pre-spawning mortality. Actions 7.1 Mark hatchery smolts for determination of percent hatchery fish in the run. 7.2 Incorporate naturally produced fish into the brood stock at Marion Forks and South Santiam
hatcheries in every generation.

80
FALL CHINOOK SALMON
Background and Status
Origin Fall chinook are not native to the Santiam and Calapooia subbasins. Efforts made in the 1950s to establish a run above Willamette Falls failed because of an inadequate fishway and industrial pollution. Fall chinook were established above Willamette Falls in the late 1960s following improvements in water quality in the Willamette basin and passage facilities at the falls. The fall chinook run is largely the product of "tule" stock hatchery fish (Howell 1986). Since tules spawn shortly after entering the Willamette River, they are usually dark, have poor quality flesh, and do not bite well. To provide a brighter fish for the sport fishery, later spawning Cowlitz stock from Washington were released experimentally in Mill Creek. Studies in Row River with Cowlitz stock indicated a relatively long freshwater residence, an undesirable trait due to potential competition or predation effects on native fish species. Cowlitz releases were discontinued for this reason and also because the egg supply was not dependable. Naturally spawning adults are hatchery and wild returns. Wild fish are the progeny of hatchery fish that returned and spawned in the wild. About 28 percent of the runs above Willamette Falls are naturally produced (personal communication from E. Smith, ODFW, Springfield, Oregon).
Life History and Population Characteristics Distribution Fall chinook spawn and rear in Mill Creek, Shelton Ditch, the Salem Canal, the main stem Santiam, the North Santiam up to Valentine Creek, and the South Santiam up to Hamilton Creek (Table 37). The Calapooia River was not surveyed as consistently as Mill Creek and Santiam tributaries because natural spawning is thought to be minimal or non-existent due to warm water temperatures, low flows, and the barrier at Thompson's Mill.

81
Table 37. Spawning surveys of fall chinook in Mill Creek and the Santiam subbasin, 1976-88 (Hansen 1977, 1978; Hansen and Williams 1979; Smith et al. 1982; ODFW, unpublished data). ______________________________________________________________________________________________ Spawning redds per mile Location 1976 1977 1978 1979 1980 1981 1982 1983 1984 1985 1986 1987 1988 ______________________________________________________________________________________________ Mill Cr. RM 0-18.5 75 62 57 14 10 19 3 3 4 -- 9 5 12 Shelton Ditch -- 88 77 29 -- 93 46 42 101 -- 70 20 16 Santiam R. RM 0.0-3.0 107 67 43 66 118 37 82 26 -- -- 40 42 33 RM 3.0-6.0 117 71 77 68 95 54 137 58 -- -- 82 50 33 RM 6.0-10.0 85 57 43 36 52 38 115 58 -- -- 59 25 22 RM 10.0-12.0 125 104 56 69 44 99 187 51 -- -- 108 46 16 North Santiam R. RM 0.0-3.0 50 34 13 12 1 9 -- 9 -- -- 23 10 1 RM 3.0-11.0 39 43 26 7 4 7 6 7 -- -- 8 7 5 RM 11.0-17.0 7 11 3 3 2 3 22 1 -- -- 8 7 5 RM 17.0-27.0 1 4 1 1 1 2 1 1 -- -- 2 2 1 South Santiam R. RM 0.0-7.5 124 122 114 54 28 33 149 57 -- -- 48 19 14 RM 7.5-18.0 83 114 108 33 13 12 80 50 -- -- 22 7 7 RM 18.0-21.0 18 37 32 2 7 9 99 73 -- -- 23 5 3 RM 21.0-38.0 1 5 2 2 5 4 4 2 -- -- 3 3 9 Thomas Cr. RM 0.0-2.0 -- 2 1 0 0 1 1 0 -- -- -- -- -- RM 2.0-12.0 -- 2 0 0 0 0 -- -- -- -- -- -- -- Crabtree Cr. RM 0.0-4.0 -- 7 12 0 0 1 18 7 -- -- -- -- -- RM 4.0-10.0 -- 4 17 0 0 -- -- -- -- -- -- -- -- RM 10.0-11.0 -- 8 -- -- -- -- -- -- -- -- -- -- -- ______________________________________________________________________________________________
Run Size and Timing Run size for Mill Creek and the Santiam and Calapooia subbasins was calculated using Willamette Falls run counts and spawning survey redd counts above Willamette Falls (Table 38). The proportion of above Willamette Falls redds in the subbasin was multiplied by a fish per redd factor. This was computed by dividing the Willamette Falls count by the total number of redds above the falls for the year. Run size was estimated by multiplying the number of redds by the fish-per-redd factor. Estimated returns to Mill Creek ranged from a low of 678 fish in 1980 to a high of 10,881 fish in 1975. The average run size during 1969 to 1988 was 3,620 adults. Returns to the Santiam subbasin varied from 2,146 to 19,320 adults and averaged 8,136 adults. Spawning surveys were conducted in the Calapooia until 1976. During 1975 and 1976 no redds were found. The 1969 to 1974 average run size estimate is 18 fish; current run size is thought to be minimal or non-existent.

82
Table 38. Estimated returns of fall chinook to Mill Creek and the Santiam and Calapooia subbasins, 1969-88. The fish-per-red factor is the Willamette Falls count divided by the total number of redds above the falls. Run size is estimated by multiplying the number of redds in the subbasin by the fish-per-red factor. Will. Redds Fish/ Mill Creek Santiam Calapooia Falls above redd # Run # Run # Run Year counts Falls factor redds size Redds size Redds Size 1969 6,817 982 6.94 -- -- 772 5,358 1 7 1970 7,457 2,398 3.11 961 2,989 888 2,762 5 16 1971 4,880 1,382 3.53 600 2,118 608 2,146 1 4 1972 11,614 3,223 3.60 1,354 4,874 672 2,419 0 0 1973 21,861 6,502 3.36 1,992 6,693 1,525 5,124 22 74 1974 33,924 9,597 3.53 1,990 7,025 5,473 19,320 1 4 1975 32,877 8,524 3.86 2,819 10,881 3,938 15,201 0 0 1976 29,269 6,642 4.41 1,656 7,303 3,651 16,101 0 0 1977 25,742 6,739 3.82 1,410 5,386 3,710 14,172 -- -- 1978 17,437 6,581 2.65 1,261 3,342 3,165 8,387 -- -- 1979 9,905 2,616 3.79 305 1,156 1,588 6,019 -- -- 1980 7,760 2,445 3.17 214 678 1,445 4,581 -- -- 1981 16,834 2,473 6.81 408 2,779 1,110 7,559 -- -- 1982 25,760 6,451 3.99 183 730 1,945 7,761 -- -- 1983 13,205 2,832 4.66 173 806 1,906 8,882 -- -- 1984 20,060 -- -- 377 -- -- -- -- -- 1985 29,089 -- -- -- -- -- -- -- -- 1986 14,037 2,168 6.47 366 2,368 1,747 11,303 -- -- 1987 8,766 1,627 5.39 157 846 916 4,937 -- -- 1988 6,867 1,158 5.93 265 1,571 744 4,412 -- -- 1989 6,472 1990 4,490
Fall chinook first appear in Mill Creek September 10-15. The peak of the run usually occurs during the third week in September. Time of Spawning Tule fall chinook and native Willamette spring chinook have substantially overlapping timing of spawning and compete for the same main stem rearing areas. Fall chinook spawn in Mill Creek in September and October. The proportion of female carcasses sampled during spawning surveys in 1973 and 1978 ranged from 29 percent to 59 percent (Table 39).

83
Table 39. Sex ratios of fall chinook from Mill Creek and the Santiam system as determined from carcasses recovered during September and October (Hansen and Williams 1979). Females Males Year Stream No. % No. % 1973 Mill Creek 1,234 39 1,930 61 1978 Mill Creek 164 59 116 41 Santiam River 32 52 30 48 North Santiam River 38 59 26 41 South Santiam River 34 29 83 71
Juvenile Life History Fall chinook are released as subyearlings from Stayton Pond. The mean size of 1978 to 1984 brood year fish averaged 6.5 grams per fish (Table 40). Fall chinook are trucked out of Stayton Pond during late April through early May.
Table 40. Date of release and size of juvenile fall chinook released from Stayton Pond, 1978-1984 brood (Smith et al. 1985). Brood Mean size year Date of release (g/fish) 1978 05/07-05/29/79 6.8 1979 03/28-06/21/80 5.2 1980 04/28-06/15/81 6.1 1981 04/03-05/21/82 5.2 1982 04/25-05/19/83 5.8 1983 05/08-05/31/84 7.8 1984 05/14-05/31/85 8.6
Hatchery Production Description of Hatcheries Eggs to support the Willamette fall chinook program are supplied by Bonneville Hatchery (Howell et al. 1985b). Unfed tule fry from Bonneville Hatchery are reared at Aumsville Pond until mid-February and then shipped to Stayton Pond for final rearing. The Aumsville and Stayton ponds are located east and south of Stayton, respectively, and are satellite facilities of South Santiam hatchery. Only tule fall chinook are reared at these facilities.

84
Hatchery Releases Since releases of hatchery fish have continued since the original introductions of fall chinook into the subbasin, it has not been possible to determine if the runs could become self-sustaining. It is apparent, however, that hatchery releases are necessary to maintain adult production at the present levels. Fry and fingerlings were released in the North and South Santiam and the Calapooia primarily during 1965 to 1968 (Appendix Table D-1). Since then, releases of mostly smolts have been made in Mill Creek and the North and South Santiam. No further releases have been made in the Calapooia since 1968. Smolts have been released into Mill Creek since 1968. Releases have ranged from 0 to 2,386,835 fish annually. Releases in the Santiam main stem occurred during 1968, 1979-83, and 1987-90. Releases in the main stem and North Santiam rivers during 1987-90 averaged 894,766 smolts annually. Smolts released into the South Santiam averaged 1,368,712 smolts during 1987-90.
Angling and Harvest Since tule fall chinook spawn shortly after entering the Willamette, they are usually dark, have poor quality flesh, and do not bite well. They have not been a popular sport fish in the Santiam subbasin. The fishery in Mill Creek has been closed since 1972. The Santiam salmon fishery has been closed since 1986. The Calapooia River has been closed to salmon angling year round since 1988. Small sport fisheries occurred primarily on spawning grounds. The average annual catch during 1978-85 on the main stem Santiam was 134 fish; on the North Santiam, 34 fish; on the Little North Santiam, 2 fish; and on the South Santiam, 176 fish (Table 41). The average total subbasin harvest was 345 fish.

85
Table 41. Santiam subbasin adult harvest for fall chinook, 1978-89 (ODFW 1990b). __________________________________________________________________________________________ Years 1978 1979 1980 1981 1982 1983 1984 1985 1986 1987 1988 1989 __________________________________________________________________________________________ Santiam River 88 111 89 154 293 47 89 200 14 5 31 0 North Santiam River 0 42 24 12 63 31 19 79 0 15 0 0 Little North Santiam -- -- 6 6 0 0 0 0 0 0 0 4a South Santiam River 242 144 37 154 257 41 272 263 11 0 4 0 Total Subbasin Harvest 330 297 156 326 613 119 380 542 25 20 35 4 __________________________________________________________________________________________ a These fish were probably spring chinook.
Management Considerations Fall chinook are not native to the Santiam and Calapooia subbasins. Although fall chinook are managed for hatchery production, there is some natural production. Fall chinook that spawn in the subbasin are an incentive for water resource managers to provide adequate flows and good water quality during late summer and fall to meet the needs of these fish. This, in turn, provides better water conditions for other species in the subbasin. Major fish production constraints for fall chinook in Mill Creek include loss of smolts in unscreened diversion ditches and non-game fish predation. Flooding and gravel erosion as well as non-game fish predation are major problems in the lower reaches of the North and South Santiam and the main stem Santiam. Channelization, migration barriers and diversions, streambank degradation and sedimentation problems due to urban and agricultural practices, low flows and high summer temperatures are also problems. Currently there is no sport fishery in the subbasin. The Mill Creek fishery was closed in 1972 and the Santiam fishery in 1986. However, fall chinook produced in the subbasin contribute to the offshore and Columbia River fisheries. As a result of the United States-Canada Pacific Salmon Treaty, maintaining production of tule stock for harvest in Canadian waters will result in reduced British Columbia harvest of other less abundant or more important Oregon chinook salmon stocks.

86
The impact of fall chinook on native salmonids, particularly spring chinook and resident trout, in the subbasin is unknown. Juvenile fall chinook have been found to rear in the same reaches as juvenile spring chinook.
Policies Policy 1. Fall chinook salmon shall not be stocked above Stayton on the North Santiam to
avoid impacts on native salmonids.
Objectives Objective 1. Provide a harvest of fall chinook salmon in ocean and Columbia River fisheries. Assumptions and Rationale 1. Fall chinook do not contribute to fisheries in the subbasin. 2. Willamette tule fall chinook survive at higher rates than tule stock produced at other
hatcheries in the Columbia basin. 3. Establishing a collection facility in the North Santiam River would provide an additional
source of eggs and decrease our dependence on adult returns to Bonneville Hatchery. 4. If large numbers return to Stayton, then the facilities will have to be upgraded to handle the
greater number of fish. 5. Confining releases to stream reaches adjacent to the Stayton rearing ponds will minimize
trucking stress and increase survival of smolts, as well as decrease the costs associated with trucking.
Actions 1.1 Continue to release smolts in Mill Creek. 1.2 Release the smolt allocation for the main stem, North, and South Santiam in the North
Santiam at Stayton. 1.3 Initiate a pilot program to investigate the rate of return of adult fall chinook to a collection
facility at on the North Santiam at Stayton. If feasible, apply for Restoration and Enhancement (R&E) funding for construction.
1.4 Develop operational plans for fall chinook releases and an adult collection facility at
Stayton.

87
Objective 2. Provide an annual return of at least 4,000 adults to Mill Creek. Assumptions and Rationale 1. The annual migration and spawning activity of fall chinook in Mill Creek has been popular
with Salem residents. It provides a unique opportunity for people to watch salmon within the city limits and has increased public awareness of water quality for the stream.
Actions 2.1 Continue to release smolts in Mill Creek. 2.2 Evaluate upstream passage at the 19th Street Dam and at the state Penitentiary Annex
Dam and recommend steps to improve passage on Mill Creek. 2.3 Require screening of Mill Creek diversions, including Pen Annex irrigation lateral and the
19th Street Diversion. 2.4 Implement habitat protection actions outlined under objectives for Habitat Protection. Objective 3. Monitor the distribution and abundance of spawning populations. Assumptions and Rationale 1. Information on straying and spawning distribution is necessary to identify areas for habitat
protection in Mill Creek and to assess the potential impacts on native salmonids. Actions 3.1 Continue spawning surveys in Mill Creek and aerial redd counts in the main stem Santiam
and the North and South Santiam. Objective 4. Minimize impacts of fall chinook salmon on native species. Assumptions and Rationale 1. Fall chinook may compete with native species, particularly spring chinook, in main stem
rearing areas. 2. Resident trout are found in some reaches currently stocked with fall chinook. 3. Establishing adult collection facilities on the North Santiam River near the smolt release site
will minimize spawning in the wild, thereby reducing the potential for fall chinook impacting production of native fish species.

88
Actions 4.1 Initiate a pilot program to investigate the rate of return of adult fall chinook to a collection
facility at on the North Santiam at Stayton. 4.2 Develop operational plans for fall chinook releases and an adult collection facility at
Stayton. 4.3 Determine the distribution of juvenile spring chinook in the North Santiam and evaluate the
potential impacts of fall chinook on them. 4.4 Determine the distribution of resident trout populations in the North Santiam and evaluate
the potential impacts of fall chinook on them.

89
SOCKEYE SALMON
Background and Status
Origin Sockeye salmon are not native to the Santiam and Calapooia subbasins. From July 1966 through September 1968, the Fish Commission of Oregon released sockeye salmon in Willamette basin reservoirs (Lukas and Korn 1968). The purpose of sockeye introductions was to determine the feasibility of producing harvestable numbers by rearing juveniles to smolt size in reservoirs. Studies indicated that Green Peter Reservoir could be used to rear fingerlings to smolt size. Releases of sockeye were made in Green Peter Reservoir in 1967 and 1968.
Life History and Population Characteristics Adults from 1967 and 1968 releases returned in 1970 and 1971. Approximately 600 fish returned to Foster Dam and less than 200 to Green Peter Dam in 1970 and 1971 (Table 42). The average annual return to Foster Dam during 1977 to 1986 was 312 fish. Sockeye adults returning to the subbasin were allowed to spawn naturally above Green Peter Reservoir. Natural production continued even though no further hatchery releases were made. Kokanee "smolts" may contribute to the sockeye runs. Adults returning to Foster Dam have been killed since 1984 to prevent exposure of South Santiam Hatchery fish to IHN disease.
Hatchery Production A total of 143,000 1966-brood Columbia River sockeye, 3.3-3.7 inches long, were released in Green Peter Reservoir on the Middle Santiam in late summer 1967. In 1968, 243,000 Adams River fingerlings from British Columbia were released. There has been no hatchery production of sockeye, except for kokanee, in the Willamette basin.

90
Table 42. Estimated escapement of sockeye salmon over Willamette Falls and counts at Foster and Green Peter dams, 1969-87 (Frazier 1988; D. Buchanan, ODFW, unpublished data). Willamette Falls Foster Dam Green Peter Dam Year returnsa returnsb returnsb 1969 0 40 -- 1970 887 636 188 1971 1,070 614 142 1972 0 7 0 1973 26 202 105 1974 21 69 33 1975 1 15 6 1976 575 528 370 1977 151 46 24 1978 16 2 1 1979 16 23 3 1980 3,194 1,835 998 1981 1,521 840 512 1982 3 10 -- 1983 120 81 -- 1984 663 223c -- 1985 70 29c -- 1986 69 53c -- 1987 69 23c -- 1977-86 ave 582 312 308 a Willamette Falls counts are sometimes less than Foster Dam counts due to misidentification
of sockeye as steelhead. b Three-year old jacks are included in counts. c All fish were killed.
Angling and Harvest Sport catch of sockeye salmon in Green Peter Reservoir reached a high of 823 fish in 1969, which contributed half of the total sport catch for the year (Table 43). Sockeye adults in later years may have been produced from releases of kokanee. Sockeye, which have residualized as kokanee, together with kokanee from hatchery releases, have continued to provide a sport fishery at Green Peter Reservoir.

91
Table 43. Sport catch of sockeye salmon from Green Peter Reservoir creel census, 1968-78 (Campbell and Locke 1968, 1969, 1970, 1971; Campbell and Daily 1972, 1973; J.J. Wetherbee, ODFW, unpublished data). Year No. of sockeye salmon 1968 54 1969 823 1970 5 1971 0 1972 26 1973 0 1974 0 1975 0 1976 0 1977 0 1978 0
Management Considerations Sockeye are frequently carriers of IHN viral disease. There has been concern that sockeye returning to the Santiam system might spread the disease to other anadromous stocks, such as spring chinook, and to the South Santiam Hatchery, which takes its water from the South Santiam River. For this reason, beginning in 1984, all adult sockeye trapped at Foster Dam have been killed to terminate the run.
Policies Policy 1. No further releases of sockeye salmon shall be made in the Santiam subbasin.

92
TROUT AND WHITEFISH
Background and Status
RAINBOW TROUT
Origin Rainbow trout are indigenous to the Santiam and Calapooia subbasins. Indigenous populations have been supplemented with hatchery fish in order to meet previous management objectives. Rainbow trout found in the wild may be descendants of local stock, hatchery rainbow trout, or steelhead. Willamette basin rainbow trout are currently listed by ODFW as a stock of concern due to insufficient information regarding their status. Rainbow trout should be given a high priority with respect to future population and habitat inventory and monitoring activities in the Willamette basin.
Life History and Population Characteristics Distribution In the North Santiam above Detroit Dam, rainbow trout occur in the Blowout Creek and Breitenbush River watersheds, Boulder and Marion creeks, and the North Santiam River. Below Detroit Dam, they occur in the Little North Fork including Henline, Cedar, and Gold creeks, Rock Creek and East Fork Rock Creek,and Sardine Creek. Populations in Cedar and Rock creeks are isolated above the falls at RM 2 and 5, respectively. Rainbow trout also occur in the main stem North Santiam below Detroit Dam. Rainbow trout occur in the South Santiam above Foster Dam in Wolf, Owl, Falls, and Sevenmile creeks. The Wolf Creek population is isolated above the falls at the mouth of the creek. Isolated rainbow trout populations are found in the South Santiam River above the falls at RM 63, however these trout may be descendants of catchable rainbow which were stocked in the past. In the Middle Santiam, they are found in Coal, Bear, and Pyramid creeks. Below Foster Dam, the main stem South Santiam, Neal and Crabtree creeks and Roaring River contain rainbow trout. Isolated populations occur in Neal Creek above the falls at RM 5 and in Crabtree Creek above the falls at RM 34.5. Rainbow trout in Crabtree Creek may be drop-outs from fingerlings stocked in Crabtree Lake. Few resident rainbow occur in the main stem Santiam River. Rainbow trout occur in the Calapooia River from about RM 45 upstream. Some or all of these trout may be residual winter steelhead. Both cutthroat and rainbow trout are often present in a watershed. Where they both occur, rainbow are usually found in the warmer, larger main stem and lower tributaries. In the Blowout Creek watershed, rainbow trout are usually not found above minor barriers, indicating they have probably moved up from the main stem or Detroit Reservoir.

93
Abundance Occasional population estimates of rainbow trout have been made in the Santiam subbasin during the past 10-15 years. Population estimates of trout were made in Blowout Creek and Quartzville Creek in 1982 (Appendix Tables E-1 and E-2) and in the Middle Santiam in 1979 and 1988-89 (Appendix Tables E-3 and E-4). The limited information available is not adequate for establishing trends in population abundance. No estimates of population abundance have been made in the Calapooia subbasin. Adult Age Structure and Size Age I rainbow in Blowout Creek drainage averaged 4.6 inches in length, age II averaged 6.1 inches, age III averaged 7.3 inches, and age IV averaged 7.2 inches (Appendix Table E-5) (Hunt 1982 and Wetherbee and Hunt 1982). Legal sized fish were mostly age 2. The smallest mature rainbow trout was 4.4 inches long. Rainbow spawn at age 2 or 3. Time of Spawning and Fecundity Native rainbow trout spawn in the spring. In Blowout Creek, rainbow spawning extends into May. Fish are spawned at Roaring River Fish Hatchery from early December through mid-January. Three year old hatchery fish have a fecundity of 7,000-7,500 eggs per female. Four and five year old fish have a fecundity of 9,000-10,000 eggs per female. Early Juvenile Life History Eggs begin hatching in early February at Roaring River Hatchery. Hatched eggs are placed in rearing troughs at a size of 4,000/lb. They are reared indoors until they reach a size of about 1,000/lb. In late March or early April they are transferred to concrete rearing ponds outdoors. Shipments of fry and fingerlings to other hatcheries occur in mid-June at a size of 200-300/lb and in late August at a size of 60/lb. Growth is controlled with feeding regimes during the winter and early spring. The largest fish are selected for brood stock and early releases beginning in March. Yearling trout are raised to a size of 8-10 inches in a year, a size that requires 2-3 years in the wild. One year old catchable trout are released at a size of about 3 fish/lb beginning in March.
Hatchery Production Description of Hatcheries Hatchery rainbow trout released in the Santiam and Calapooia subbasins are raised at Leaburg, Roaring River, Willamette, and Wizard Falls fish hatcheries. Descriptions of Leaburg and Willamette hatcheries are found in the McKenzie and Middle Fork Willamette subbasin plans. Wizard Falls Fish Hatchery is outside of the Willamette subbasin. Rearing of rainbow trout at Roaring River Fish Hatchery is described below.

94
Roaring River Fish Hatchery is operated by ODFW with funding from Oregon state general funds and the Oregon Wildlife Fund. The hatchery has been in operation since 1924. It is located 11 miles southeast of Scio off State Highway 226 near the mouth of Roaring River (RM 1.5), a tributary of Crabtree Creek. The hatchery receives water from Roaring River for its hatchery ponds. Ground water is used to incubate eggs. Rearing Goals and Practices Roaring River Fish Hatchery is primarily used to rear winter and summer steelhead, fall rainbow, and to produce rainbow eggs. About one million rainbow are reared annually, of which 230,000 are raised to catchable size (3 fish/lb). Two thousand selected rainbow brood are kept on hand. These brood produce 5 to 7 million eggs annually. Most of these eggs are transferred to other ODFW hatcheries for hatching and rearing. Until the early 1970s, only Roaring River stock was reared at the hatchery. In January 1967, Cape Cod rainbow eggs were transported from Washington to Roaring River Fish Hatchery. A brood stock was established in 1971 (Kinunen and Moring 1976). Both Roaring River and Cape Cod rainbow were reared from 1971-80. The hatchery switched over entirely to Cape Cod stock during the 1980-81 brood year. Presently, only Cape Cod stock is used at the hatchery. Brood stock is selected from fish rearing at Roaring River Hatchery. Moring and Buchanan (1978) investigated downstream movement and angler catch of Roaring River and Cape Cod strains of hatchery rainbow yearlings. The Roaring River strain showed a tendency for rapid downstream movement while the Cape Cod strain tended to remain in the planted area longer and were harvested in greater numbers. Based on these results, the Cape Cod strain is considered to be more desirable than Roaring River stock for a catchable trout program. However, later experiments at Green Peter Reservoir found that the Cape Cod strain exhibited more movement than the Roaring River strain. Fish which attempt to swim out of rearing ponds are culled from the brood stock in an effort to select for fish which do not demonstrate any migratory behavior. The results of this effort are inconclusive. Hatchery Releases Releases of hatchery rainbow trout are made in the Santiam and Calapooia subbasins to supplement or provide a sport fishery. Catchable rainbow are stocked in areas where public access is good, recreational use is high, and natural production alone does not provide for a fishery. Fingerlings have been released in the North Santiam River above Detroit Reservoir to make use of available rearing area. Stocking hatchery fish in areas where natural production of trout exists can either increase or reduce harvest of naturally produced stocks. Hatchery trout are released in the Santiam and Calapooia subbasins in reaches where impact on natural production of trout and steelhead is believed to be minimal. Releases which had been made higher up in the subbasins have been moved to lower reaches to avoid negative impacts on native trout and steelhead.

95
Streams in the Santiam and Calapooia subbasins have been stocked with hatchery rainbow since the 1920s. Stocking levels during 1979-90 have averaged 131,276 catchable rainbow in the Santiam subbasin, 5,919 in the Calapooia subbasin, and 460 in Mill Creek (Table 44). Current release goals are 130,000 catchable rainbow trout in the Santiam subbasin, 6,000 in the Calapooia, and 500 in Mill Creek. Rainbow trout are released from April through July. Releases of yearling rainbow trout in the Santiam subbasin are now made in the North Santiam, Breitenbush, Little North Santiam, and South Santiam rivers, and Quartzville, Thomas and Crabtree creeks (Table 45). In the Calapooia River releases are confined to the reach between RM 33 and RM 56 to minimize competition with native winter steelhead and to minimize harvest of juvenile winter steelhead. Since 1988, smaller releases have been made more frequently at sites in an attempt to maximize the proportion of hatchery fish harvested (Table 46).

96
Table 44. Summary of hatchery releases of catchable rainbow trout in the Santiam and Calapooia subbasins and Mill Creek, 1955-72 and 1979-89 (Oregon State Game Commission 1956-1973 and ODFW, unpublished data). _______________________________________________________________ Release Year Santiam Calapooia Mill Creek _______________________________________________________________ 1955 116,516 1,929 1,535 1956 85,540 6,021 1,003 1957 125,566 8,056 5,754 1958 144,041 11,997 1,998 1959 140,991 9,479 5,514 1960 128,121 10,011 1,508 1961 133,750 12,007 1,506 1962 127,477 12,008 1,501 1963 122,503 12,052 1,562 1964 128,964 12,034 1,508 1965 96,254 11,999 1,360 1966 243,930 10,000 1,500 1967 144,007 9,999 2,751 1968 126,965 11,001 1,512 1969 148,740 6,750 1,504 1970 144,429 8,095 1,470 1971 159,223 8,004 1,003 1972 147,029 8,006 1,000 1973-1978 data not available 1979 117,925 6,000 501 1980 133,502 6,002 500 1981 139,534 6,002 510 1982 139,590 6,038 504 1983 139,677 5,998 498 1984 134,887 6,021 499 1985 132,480 7,997 501 1986 126,257 5,980 509 1987 133,107 5,999 499 1988 127,659 3,000 501 1989 122,446 6,000 499 1990 128,253 5,990 0 _______________________________________________________________

97
Table 45. Locations of current releases of hatchery rainbow trout in the Santiam and Calapooia subbasins. ___________________________________________________________________________ Location of No. of Stream release sites release sites Mill Cr. RM 5 1 North Santiam R. RM 28-35 10 RM 58.5-77 10 Breitenbush R. RM 3-14.5 5 Little No. Santiam RM 0-20 8 South Santiam R. RM 40-64 10 Quartzville Cr. RM 6-18 9 Crabtree Cr. RM 17.5-20 2 Roaring R. RM 0.5 2-3 Thomas Cr. RM 9 1 RM 27-31.5 2 Calapooia R. RM 33-56 9 ___________________________________________________________________________

98
Table 46. Catchable rainbow stocking analysis in large streams of the Santiam subbasin, 1987-90a (ODFW, unpublished data). ___________________________________________________________________________________________ No. Total Dates times fish Fish/ No. Fish/ Year stocked stocked stocked trip sites site South Santiam R. 1987 5/22-7/17 5 24,438 5,000 9-10 500 1988 5/13-7/07 6 19,002 3,200 10 320 1989 5/12-7/10 7 22,506 3,200 10 320 1990 5/07-7/20 7 22,000 3,000 10 300 Quartzville Cr. 1987 5/15-7/10 3 11,998 4,000 7-9 500 1988 5/13-7/07 5 10,008 2,000 8-9 250 1989 5/12-7/03 5 10,019 2,000 9 222 1990 5/07-7/13 6 12,000 2,000 9 222 Breitenbush R. 1987 5/22-7/22 7 21,004 3,000 3-5 600-1,000 1988 5/26-8/05 9 18,009 2,000 4-5 400 1989 5/26-8/01 10 20,011 2,000 4-5 400 1990 5/21-8/03 9 18,000 2,000 5 400 Little North Fork Santiam R. 1987 5/29-7/01 4 14,502 3,500 6-7 500+ 1988 5/26-7/08 6 12,006 2,000 7 285 1989 5/26-7/11 7 14,010 2,000 6-7 285 1990 5/21-7/20 7 14,000 2,000 7 285 North Santiam R. 1987 5/22-7/24 8 38,975 5,000 10 500 1988 5/27-8/04 10 34,987 3,500 9-10 350 1989 5/24-7/31 10 35,016 3,500 8-10 437 1990 5/21-8/3 10 34,500 3,500 8 437 ___________________________________________________________________________________________ a 1987 stocking patterns are representative of previous years.
STEP releases of rainbow fry were made in Thomas Creek in 1984 and 1985 to evaluate rearing of rainbow in lower Thomas Creek. About 24,500 fry were released in 1984 and 19,861 in 1985. Currently, there are no plans for STEP releases of rainbow fry in the Santiam and Calapooia subbasins.
Angling and Harvest Average catch rates for naturally produced and hatchery rainbow trout during 1965-72 in various tributaries in the subbasins are presented in Table 47 (Kinunen 1975). Catch rates were highest in the Little North Santiam (1.92 Rb/angler and 0.91 Rb/hr) and lowest in Crabtree Creek (0.87 Rb/angler and 0.42 Rb/hr).

99
Table 47. Rainbow trout stocking and angler success for naturally produced and hatchery reared rainbow trout in the Santiam and Calapooia subbasins (modified from Kinunen 1975). ____________________________________________________________________ Ave. no. Approx. Ave. no. stocked Catch ratea date of of times 1964- 1965-1972 first stocked Stream 1973 Rb/angler Rb/hr release annually ____________________________________________________________________ Mill Cr. 1,660 4/25 1 Little No. Santiam 19,050 1.92 0.91 5/10 4 No. Santiam, Sec. I 15,981 1.72 0.84 5/20 3 No. Santiam, Sec. II 37,341 5/20 9 Quartzville Cr. 19,244 1.70 0.92 5/15 3 So. Santiam 22,456 1.20 0.61 4/25 4 Thomas Cr. 1,482 4/25 1 Crabtree Cr. 4,724 0.87 0.42 4/25 2 Calapooia R. 9,389 0.93 0.40 4/25 3 ____________________________________________________________________ a Catch rate based on a minimum of 2 years of data and 100 anglers.
Creel surveys were conducted on the main stem Santiam, North, and South Santiam rivers during 1978 and 1979 to determine the sport catch of steelhead adults and smolts (Buchanan and Wade 1978, Buchanan et al. 1979). Sport catch of naturally produced and hatchery rainbow trout are presented in Tables 48 and 49.
Table 48. Comparison of sport catch on the main stem Santiam and North Santiam rivers and on the South Santiam during March 4-September 30, 1978 (Buchanan and Wade 1978). ___________________________________________________________________________ Species Santiam & No. Santiama So. Santiamb ___________________________________________________________________________ Hatchery Rb trout 8,902 19 Naturally produced Rb trout 1,281 703 Cutthroat trout 344 99 ___________________________________________________________________________ a Reaches sampled were from Minto Dam to Mehama (15.5 miles) and from Stayton to the I-5
bridges (27 miles). b Reaches sampled were from Foster Dam to McDowell Creek (10 miles) and from Waterloo
to Sanderson's bridge (16 miles).

100
Table 49. Estimated angling effort and sport catch of trout in the main stem Santiam and North Santiam rivers, from Stayton island to the I-5 bridges, March 4-September 30, 1978 and 1979 (Buchanan et al. 1979). ___________________________________________________________________________ 1978 1979 ___________________________________________________________________________ Anglers 7,629 5,998 Angler hours 20,340 14,930 Species caught Hatchery rainbow trout 0 0 Naturally produced rainbow trout 59 39 Cutthroat trout 30 57 ___________________________________________________________________________
Angler effort and estimated sport catch of rainbow in the South Santiam during part of the open seasons 1975-79 are presented in Table 50. Although angler effort in 1979 was half that of 1978, estimated catch of hatchery rainbow increased and catch of naturally produced rainbow was 70% of the 1978 catch.
Table 50. Estimated angling effort and sport catch of trout in the South Santiam River from the trout season opening through July 4 1975 and 1976, and March 4-September 30 1978 and 1979 (Buchanan and Wade 1978, Buchanan et al. 1979). ___________________________________________________________________________ 1975a 1976a 1978b 1979b ___________________________________________________________________________ Anglers --- --- 19,489 10,053 Boat angler hours 820 602 --- --- Shore angler hours 6,003 3,006 --- --- Total angler hours 6,823 3,608 51,610 26,807 Species caught Hatchery Rb 113 123 15 29 Naturally produced Rb 4 8 372 263 Cutthroat 5 2 15 8 ___________________________________________________________________________ a Reach surveyed extended from Foster Dam to Sweet Home boat ramp (4 miles). b Reach surveyed extended from Foster Dam to McDowell Creek (10 miles).
Results of a 1975-76 study suggested that reducing the number of catchable rainbow trout stocked in the South Santiam and Quartzville Creek had no significant effect on the proportion of the fish caught. Reduction in stocking level reduced angler pressure which in turn slightly reduced catch rates (Table 51). Public access to the Calapooia is restricted primarily to road crossings below RM 33. There is limited angling pressure on tributary streams in the subbasin. An opening-day 1980 count of 108 cars was made on the Calapooia, which was interpreted as adequate fishing pressure (J.J. Wetherbee, ODFW, unpublished data). The harvest of hatchery legal rainbow released in the Calapooia is unknown.

101
Few creel studies have been done in recent years for sport harvest of rainbow trout in the Santiam subbasin and none have been conducted in the Calapooia subbasin. The information available is not adequate for indicating trends in angling pressure and harvest of naturally produced and hatchery rainbow trout.
Table 51. Plants of catchable rainbow trout, catch rates, and hatchery composition of the catch in Quartzville Creek and in the South Santiam 1975-76 (modified from Moring 1979). ___________________________________________________________________________ Stream Quartzville Cr. So. Santiam R. ___________________________________________________________________________ No. stocked 1975 12,995 18,504 1976 9,806 13,804 Percent harvested 1975 82.5% 82.5% 1976 82.6% 81.8% Catch per angler 1975 1.09 0.85 1976 1.07 0.74 Catch per hour 1975 1.04 1.02 1976 0.77 0.86 Hatchery composition of catch 1975 92.8% 95.4% 1976 89.3% 87.0% ___________________________________________________________________________
Daily catch limit for trout is 5 fish. There is no winter season. Canyon and Moose creeks in the South Santiam system are closed to trout angling to protect native winter steelhead. Major streams in the subbasin have a late opening to protect winter steelhead smolts.
Management Considerations Warm water temperatures in portions of the South Santiam system and competition with steelhead limit production of rainbow trout. Rainbow trout spawn in the spring when hatchery steelhead smolts are released. Some hatchery steelhead smolts are precocious and may spawn with native trout. The proportion of hatchery releases that are precocious and that contribute to natural production requires monitoring and evaluation. Changes in steelhead hatchery programs may be required in order to meet Wild Fish Management Policy guidelines for trout.

102
Information needs for improved management of the catchable rainbow program include survival of catchable rainbow after release and the dispersal of catchable trout from stocking sites. The response of angler pressure to varying stocking frequencies needs to be investigated. Angling pressure and catch rates for catchable trout are needed. Measurements of angler pressure and harvest rates of trout at catchable release sites and in unstocked reaches of the same streams are needed. Willamette basin rainbow trout are currently listed by ODFW as a stock of concern due to insufficient information regarding their status. Rainbow trout should be given a high priority with respect to future population and habitat inventory and monitoring activities in the Willamette basin.

103
CUTTHROAT TROUT
Origin Willamette cutthroat trout are classified as the same subspecies as the sea-run coastal variety (Moring 1978). However, anadromous stocks do not occur above Willamette Falls. Instead, cutthroat often migrate shorter distances within streams and rivers, utilizing larger rivers of the Willamette system for accelerated growth (Moring 1978). There are non-migratory populations above Willamette Falls, as well. Willamette basin cutthroat trout are currently listed by ODFW as a stock of concern due to insufficient information regarding their status. Cutthroat trout should be given a high priority with respect to future population and habitat inventory and monitoring activities in the Willamette basin.
Life History and Population Characteristics Distribution Cutthroat trout are found together with rainbow trout in many streams draining the Cascades (Nicholas 1978). An overlapping distribution of rainbow (some of which may have been juvenile winter steelhead) and cutthroat trout has been observed in the Santiam, North Santiam, and South Santiam rivers and in Packer's Gulch, Fish Creek (Little North Santiam), Lewis Creek (South Santiam), Indian Prairie Creek (Thomas Creek), and Cork Boot Creek (E. Brush Creek, Calapooia) (Moring and Youker 1979). Cutthroat are more abundant in headwater and tributary streams than rainbow trout. Isolated populations of cutthroat trout occur above natural barriers in the North Santiam such as in Opal Creek and Battle Ax Creek in the Little North Santiam system and in Rock Creek above the falls at RM 5. In the South Santiam system above Foster Reservoir, isolated populations occur in the South Santiam River above RM 63, in Soda Fork above the falls at RM 5, in Moose Creek above the falls at RM 5.5, and in Canyon Creek above the falls at RM 10. Isolated populations occur in the Middle Santiam headwaters above RM 31. Below Foster Reservoir, isolated populations of cutthroat occur in McDowell Creek above the falls at RM 5, in Hamilton Creek above the falls at RM 12, in Crabtree Creek above the falls at RM 34.5, in Neal Creek above the falls at RM 5, and in Thomas Creek above the falls at RM 32. In the Calapooia, isolated populations of cutthroat trout occur above the falls at RM 73 and in the North Fork Calapooia above the falls on the west fork at RM 0.8. Time of Entry into Subbasin Migratory cutthroat enter smaller tributaries to spawn in the winter.

104
Abundance Population surveys of salmonids in selected Willamette tributaries during the 1970s estimated Big Creek (Little North Santiam drainage) had approximately 262 cutthroat trout per mile while tributaries of the Middle Santiam system had 53-317 cutthroat per mile (Appendix Table E-6). The Blowout Creek system had an average of 1,364 cutthroat trout per mile in a 1980 survey (Appendix Table E-7). Other estimates of cutthroat trout abundance have been made in Quartzville Creek (Appendix Table E-8), the main stem Santiam River (Appendix Table E-9), Minto Creek (Appendix Table E-10), and Calapooia River tributaries (Appendix Table E-11). The limited information available for cutthroat trout in the Santiam and Calapooia subbasins is not sufficient to establish trends in population abundance. Average Adult Age Structure The age structure of cutthroat in North Santiam tributary streams was 80% age 1 and 20% age 2 (Appendix Table E-12). Cutthroat trout in South Santiam and Calapooia streams were primarily age 2 (41-51 %) and age 1 (32-40 %). Cutthroat trout sampled from large rivers in the Santiam subbasin were mostly age 2 (59.2%) and age 3 (25.8%) (Appendix Table E-13). Larger rivers tended to have a greater percentage of older fish than small streams. Average Adult Size Legal sized cutthroat are usually age 1+ in large rivers and 2 in small tributaries due to the greater productivity of large rivers (Moring 1978). In a wild trout inventory of Blowout Creek (Wetherbee and Hunt 1982), the smallest mature female cutthroat was 4.7 inches in length. Age 1 cutthroat in Blowout Creek averaged 4.3 inches, age 2 fish 5.7 inches, age 3 fish 7.0 inches, and age 4 fish 8.1 inches (Appendix Table E-14) (Hunt 1982). An average of 23-26% of the cutthroat sampled from Minto Creek during 1985-90 were 4.0-5.5 inches long. An average of 23-30% of the fish were 2.4-3.9 inches, 18-21% were 5.6-12.0 inches, and 13-20% were less than 2.4 inches in length (Appendix Table E-15). Length frequency data of cutthroat trout sampled in Elk Creek in 1982 (Figure 4) indicate a distinct group of fish about 1.2-2.8 inches in length and a second group of fish ranging from 3.5-7.5 inches in length. Cutthroat trout sampled from the main stem Santiam River had a size range of 5.1-6.3 inches for age 1 fish, 4.7-10.6 inches for age 2 fish, 5.5-12.2 inches for age 3 fish, and 6.3-15.0 inches for age 4 fish (Appendix Table E-16). The average growth rate for cutthroat in the Santiam River was 0.25 inch/month (Moring 1978). Size range of cutthroat trout electrofished in the Calapooia subbasin was 1.4-7.8 inches (Appendix Table E-11). A ripe cutthroat sampled from Fish Creek was 2 years old and 3.9 inches in length. A ripe cutthroat taken from Hands Creek in the Calapooia subbasin was 6.5 inches long (Moring and Youker

105
1979). Age specific length data of cutthroat trout in the Santiam and Calapooia subbasins is summarized in Appendix Table E-17 (Moring and Youker 1979). Time of Spawning Cutthroat spawn earlier than rainbow trout, usually during the winter months. In the Willamette basin, cutthroat generally spawn between January and July, later for higher elevations (Nicholas 1978). Movement and Migration Movements of cutthroat within Willamette tributaries and migration to and from the main stem Willamette have been observed (Moring et al. undated, Moring 1977). Moring et al. (undated) found that extensive movement occurs primarily in large rivers. Potamodromous cutthroat are residents of larger rivers moving to small tributaries for spawning and immature fish moving from tributaries to forage areas in large rivers. Adults generally migrate to small tributaries in fall and winter, spawn in late winter or early spring, and then migrate back to larger rivers soon afterward. Cutthroat have been observed to home to small tributaries in two successive years (Nicholas 1978). The degree of straying is unknown. Not all upstream migrants are mature fish on a spawning run (Nicholas 1978). Movement of cutthroat between the main stem Santiam and North Santiam rivers and within the North Santiam River was studied during 1976-79 (Moring and Youker 1979). The majority of fish tagged were recaptured near the original point of capture, or within 4 miles of that location (Table 52) suggesting that these populations were non-migratory or displayed little migratory behavior.

106

107
Table 52. Recaptures of tagged cutthroat trout in the Santiam subbasin, 1976-79 (Moring and Youker 1979). ___________________________________________________________________________ No. fish >4 Distance No. No. tags miles from traveled Stream tags recaptured capture site (miles) ___________________________________________________________________________ Santiam R. 253 36 1 6 No. Santiam R. 21 2 1 4 So. Santiam R. 31 1 0 - Soda Fork 12 2 0 - ___________________________________________________________________________
Hatchery Production There is no hatchery production of cutthroat trout in the Santiam and Calapooia subbasins. No hatchery releases of cutthroat have been made in running waters in the Santiam and Calapooia subbasins.
Angling and Harvest A comparison of sport catch of trout in the Santiam subbasin during 1978 shows fewer cutthroat were harvested than rainbow (Buchanan and Wade 1978) (Table 48). A total of 344 cutthroat were harvested in the main stem Santiam and North Santiam and 99 cutthroat in the South Santiam. Angling effort and sport catch of cutthroat for the reach from Stayton to the I-5 bridges is shown in Table 49 (Buchanan et al. 1979). Only 30 cutthroat were harvested in this 27 mile reach in 1978 and 57 cutthroat in 1979. Most of the reported sport catch of cutthroat came from the 15.5 mile reach between Minto Dam and Mehama. Creel studies in the South Santiam during part of the open seasons in 1975-79 indicate that few cutthroat were caught between Foster Dam and McDowell Creek (Buchanan and Wade 1978, Buchanan et al. 1979) (Table 50). Daily catch limit for trout is 5 fish. There is no winter season. Canyon and Moose creeks in the South Santiam system are closed to trout angling to protect native winter steelhead. Major streams in the subbasin have a late opening to protect winter steelhead smolts. The main stem Santiam and the North Santiam below Stayton have a catch and release regulation for cutthroat trout.
Management Considerations Land use practices such as timber harvesting and road construction have impacted smaller tributaries used by cutthroat. Dams have limited potential migratory movements of cutthroat within the subbasins. Channelization of lower elevation streams and rivers has reduced spawning and rearing habitat for cutthroat trout. Introductions of anadromous fish in reaches used by cutthroat trout can negatively impact cutthroat production through competition. Nicholas (1978) reports circumstantial evidence of a negative impact from coho salmon and steelhead trout. Cutthroat populations are more abundant in some stream areas above falls which exclude these species. Cutthroat trout production has been found to be lower when coho are present in the same stream reach (Nicholas 1978). Willamette basin cutthroat trout are currently listed by ODFW as a stock of concern due to insufficient information regarding their status. Cutthroat trout should be given a high priority with respect to future population and habitat inventory and monitoring activities in the Willamette basin.

108
BROOK TROUT
Origin Brook trout are not native to the Santiam and Calapooia subbasins. They have been successfully introduced into high lakes in the Santiam subbasin and have become established in a few headwater streams.
Life History and Population Characteristics Distribution Brook trout populations occur in Opal Creek in the Little North Santiam drainage, in the North Fork Breitenbush River, and in the Big Meadows area in the headwaters of the North Santiam. Brook trout occur in Holman Creek in the Middle Santiam drainage and in Black Creek and Soda Fork in the South Santiam. Populations in Opal Creek and in the Middle and South Santiam may not be self-sustaining, but consist of drop-outs from high lakes. Abundance No population estimates of brook trout in running waters have been made in the Santiam and Calapooia subbasins. In a wild trout inventory of the Santiam and Calapooia subbasins, brook trout were found in the South Santiam River above Foster Dam and in the North Santiam above Detroit Dam (Table 53) (Ely 1981).
Table 53. Abundance of brook trout sampled during a wild trout inventory in the Santiam and Calapooia subbasins (Ely 1981). ___________________________________________________________________________ Length (inches) Site 4.0 4.5 5.0 5.5 6.0 6.5 7.0 7.5 8.0 ___________________________________________________________________________ So. Santiam R. above Foster 1 1 No. Santiam R. above Detroit 1 3 1 2 ___________________________________________________________________________
Size Brook trout found in the South Santiam River were 6.0 and 8.0 inches in length (Table 53). Brook trout found in the North Santiam River were 4.0-5.5 inches in length.

109
Time of Spawning Brook trout spawn in the fall.
Hatchery Production There is no hatchery production of brook trout in the Santiam and Calapooia subbasins. No releases of hatchery brook trout are made in rivers or streams in the Santiam and Calapooia subbasins.
Angling and Harvest There is no information concerning harvest of brook trout in the Santiam and Calapooia subbasins. Daily catch limit for trout is 5 fish. There is no winter season.
Management Considerations Brook trout require streams with gentle gradients and good water quality. The factors which appear to limit brook trout to headwater areas are not understood.

110
BULL TROUT Bull trout are currently listed as a species of concern in the Willamette Valley. Bull trout populations in the Willamette valley were never known to be large. Habitat alterations, especially impassible dams and culverts, have adversely impacted bull trout. Historically, bull trout were present in upper portions of the Santiam subbasin (Willamette National Forest 1989). They were last observed in the North Santiam in 1945 and in the South Santiam in 1953. Currently, bull trout are not believed to occur in either the Santiam or Calapooia subbasins. There may be opportunities for reestablishment of the species in the Santiam subbasin in the future.

111
WHITEFISH
Origin Whitefish are a member of the trout and salmon family Salmonidae and are native to larger streams in the Willamette basin.
Life History and Population Characteristics The distribution of whitefish is similar to that of trout. In the Santiam subbasin, whitefish occur in the main stem Santiam River, the North Santiam River, the Little North Fork Santiam, the South Santiam, and Thomas Creek. Whitefish occur in the Calapooia River above Holley (RM 45) (J.J. Wetherbee, ODFW, unpublished data). Mountain whitefish mature at 3 to 4 years of age and spawn in the fall and early winter (Daily 1971). Length at maturity in most waters is less than 12 inches (ODFW 1987a). A few whitefish caught by anglers in the North Santiam River during the early 1980s were 10-18 inches in length (J.J. Wetherbee, ODFW, unpublished data). Mountain whitefish have habitat preferences and a diet similar to trout.
Hatchery Production There is no hatchery production of whitefish.
Angling and Harvest There is limited information concerning harvest of whitefish in the Santiam subbasin and no information for the Calapooia subbasin (J.J. Wetherbee, ODFW, unpublished data). Records show a few whitefish harvested from the North Santiam River during 1980, 1982, and 1984. Although whitefish can be caught on natural bait and flies, they are seldom sought by anglers. Whitefish have a potential for increased sport use. Whitefish may be taken from any water open to salmon, steelhead or trout angling. There is no bag limit.
Management Considerations Whitefish are underutilized in the sport fishery. It is thought that populations in the Santiam and Calapooia subbasins can support a fishery and provide additional angling diversity.

112
Policies Policy 1. Releases of hatchery rainbow trout in the Santiam and Calapooia subbasins shall be
confined to the following streams and reaches: Mill Creek RM 0-14.5 of the Breitenbush River RM 0-20 of the Little North Santiam River RM 28-38 and 58.5-77 of the North Santiam River RM 40-64 of the South Santiam River Quartzville Creek Crabtree Creek Thomas Creek RM 0-56 of the Calapooia River
Objectives Objective 1. Maintain the genetic diversity and adaptiveness of trout and whitefish
populations. Assumptions and Rationale 1. Willamette basin rainbow and cutthroat trout have been identified as stocks of concern. This
objective addresses some of the problems with these stocks. 2. Monitoring the distribution and abundance of populations of trout will provide an indication of
their health and adaptiveness. 3. Releases of precocious hatchery steelhead smolts near areas where spawning of trout
occurs may decrease the genetic fitness of native trout populations. Actions 1.1 Establish population trends in trout distribution and abundance in selected index streams to
be sampled on an annual basis. Possible index streams are Divide Creek above Detroit Reservoir, the upper North Santiam River above Parish Lake Road, RM 35-46 of the North Santiam River, RM 0-27 of the North Santiam River including Marion Creek, Sheep Creek in the upper South Santiam system, and the Calapooia River above the North Fork log jam.
1.2 Verify and document the distribution and upper limits of cutthroat trout in streams. 1.3 Assess the status of cutthroat trout populations of concern in the main stem Santiam and
North Santiam below Stayton through electrofishing surveys and scale analysis.

113
1.4 Assess the migratory patterns of cutthroat trout by conducting a tagging study in the main stem Santiam and the North Santiam below Stayton.
1.5 Minimize the proportion of hatchery steelhead smolts that are precocious and their impact
on spawning trout populations. This may be accomplished by removal of precocious fish during marking of hatchery steelhead.
1.6 If necessary modify hatchery steelhead programs to minimize their effects on trout
populations and to be in compliance with Wild Fish Management Policy guidelines. Objective 2. Protect, restore, and enhance trout and whitefish habitat. Assumptions and Rationale 1. Protection and enhancement of trout and whitefish populations can be achieved principally
through habitat protection and improvement. Actions 2.1 Recommend to the Department of Forestry that they change their policy to provide full
riparian protection to all streams containing resident trout populations. 2.2 Identify additional sites for habitat improvement. 2.3 Develop habitat improvement plans. 2.4 Work with volunteers, sporting clubs, landowners and agencies to implement habitat
improvement projects in the upper North Santiam River, Blowout Creek, and Marion Creek to create additional pools.
2.5 Implement habitat protection actions outlined under objectives for Habitat Protection. Objective 3. Provide angling opportunities for trout and whitefish under the Wild Fish
management alternative for trout in the following streams and reaches: North and South forks of the Breitenbush River Humbug and French creeks in the Breitenbush system Blowout Creek RM 0-28 and 35-46 of the North Santiam River Santiam River RM 56-73 of the Calapooia River Assumptions and Rationale 1. The Trout Plan (ODFW 1987a) sets management options for trout, one of which is Wild Fish.

114
2. Management under this alternative seeks to provide a diversity of angling opportunities including nonconsumptive as well as consumptive use of trout.
3. Special regulations may be necessary to protect stock fitness and life history characteristics
and to maintain healthy trout populations with multiple age classes or to provide watchable wildlife only opportunities.
4. Whitefish population levels are adequate to support an increased sport fishery. 5. Many people are not aware of the excellent sporting and eating qualities of whitefish. Actions 3.1 Evaluate angling pressure and harvest rates on trout through creel studies on key streams
such as the North Santiam River below Detroit Dam and the main stem Santiam to determine consumptive use and impacts on native populations.
3.2 Determine the need for additional or modified angling regulations to protect populations of
native trout by monitoring the production, harvest, and catch rate of trout. 3.3 Continue to use angling regulations to protect or conserve native trout. 3.4 Publicize information on distinguishing characteristics of whitefish and angling opportunities. Objective 4. Provide additional angler opportunity and recreation by stocking legal-sized
hatchery rainbow trout in the following streams and reaches: Mill Creek Breitenbush River Little North Santiam River RM 28-38 and 58.5-77 of the North Santiam River South Santiam River Quartzville Creek Crabtree Creek including Roaring River Creek Thomas Creek RM 33-56 of the Calapooia River

115
Assumptions and Rationale 1. The consumptive demand for trout is greater than natural production can provide in
accessible streams favored by anglers and close to population centers. 2. Additional angling opportunities can be provided through the release of hatchery rainbow
where native trout populations are not sufficient to support a fishery. 3. Over time, releases of catchable rainbow may be moved from running waters to standing
waters in the subbasin. 4. The current level of hatchery releases provide harvest rates and returns to the angler which
satisfy angler demand. 5. Harvest rate of catchable rainbow is at least 40% of the number released. Actions 4.1 Continue to release a maximum of 500 catchable rainbow in Mill Creek at RM 5. 4.2 Continue to release a maximum of 130,000 catchable rainbow in the Santiam subbasin at
release sites in the following reaches: RM 28-38 and RM 58.5-77 in the North Santiam River, RM 3-14.5 of the Breitenbush River, RM 0-20 of the Little North Santiam, RM 40-64 of the South Santiam River, RM 6-18 of Quartzville Creek, RM 17.5-20 of Crabtree Creek, RM 0.5 of Roaring River, and RM 9 and RM 27-31.5 of Thomas Creek.
4.3 Continue to release a maximum of 6,000 catchable rainbow in the Calapooia River at
release sites located in RM 33-56. 4.4 Evaluate current angling pressure and harvest rates through creel studies on key streams
such as the Breitenbush, North Santiam, Little North Santiam, South Santiam, and Calapooia rivers and Quartzville Creek. Modify stocking practices to better meet angler demand where necessary.
4.5 If harvest rates fall below 40% then modify stocking practices such as release timing,
frequency, and sites to improve harvest rate.

116
Objective 5. Provide angling opportunities for trout and whitefish under the basic yield management alternative for trout in those reaches not stocked in the Santiam and Calapooia subbasins.
Assumptions and Rationale 1. The Trout Plan (ODFW 1987a) sets management options for trout, one of which is Basic
Yield. 2. These waters are managed to use their natural productivity to grow trout and whitefish to a
harvestable size. Most of the trout available to the angler are either from natural production or from drift of catchable rainbow from hatchery releases made upstream.
3. The fisheries on these waters are of a general, consumptive nature. 4. Other species may be present and may have fishery values equal to or greater than trout. 5. Special regulations may be needed to protect native populations without seriously restricting
the major fisheries. Actions 5.1 While conducting monitoring activities and creel programs designed for other fish species,
collect data on the distribution, abundance, fishing pressure, and harvest of trout and whitefish.
Objective 6. Maximize the harvest of hatchery rainbow trout. Assumptions and Rationale 1. Angler catch rate of hatchery rainbow can be increased without increasing release numbers. 2. Increased harvest would minimize the negative effects of hatchery rainbow on native fish. Actions 6.1 Determine how harvest rates can be increased by modifying stocking schedules, release
sites, and release numbers. 6.2 Continue the hatchery rainbow drop out study for another year at Roaring River Hatchery to
further evaluate the migration tendency of the Cape Cod stock. 6.3 Continue to use hatchery stock which demonstrates a minimum of migratory behavior.

117
Objective 7. Minimize the potentially negative effects of hatchery rainbow trout on the production and genetic integrity of native trout, whitefish, and winter steelhead.
Assumptions and Rationale 1. Hatchery fish are released in streams and rivers used by native trout and winter steelhead.
Hatchery trout may compete with native fish for food and habitat. 2. The increased angling effort brought about by releases of hatchery trout may increase the
harvest of native trout and steelhead. 3. Cape Cod stock is thought to contribute less than 10% to rainbow trout natural production in
the Santiam and Calapooia subbasins. Actions 7.1 Consider marking hatchery trout to enable anglers to distinguish naturally produced from
hatchery trout. 7.2 Post signs at popular angling sites informing anglers about differences between native and
hatchery trout. 7.3 Continue to document hold over of hatchery rainbow during creel studies and use this
information to estimate the contribution of hatchery rainbow to natural production. 7.4 Continue to release Cape Cod stock unless it is estimated that they are contributing more
than 10% to natural production.

118
WARMWATER GAME FISH
Background and Status
Origin Warmwater game fish are not native to the Santiam and Calapooia subbasins. There is little documentation of introductions of warmwater game fish in the subbasins. Largemouth bass and panfish have existed in standing and running waters in the Willamette basin since the 1800s. Smallmouth bass were successfully introduced into Thomas Creek by ODFW and now provide a fishery in the lower South Santiam system.
Life History and Population Characteristics Distribution Largemouth bass, black and white crappie, bluegill, pumpkinseed, brown and yellow bullhead are widely distributed throughout the slower flowing portions of the Santiam, South Santiam, and Calapooia rivers and their tributaries (ODFW 1988a). Bullfrogs are also found in the subbasins. These species are found primarily in sloughs, old channels, and oxbow lakes. Smallmouth bass are primarily stream fish, found in eddies and deeper holes in lower reaches of rivers. Warmwater game fish found in Mill Creek, the lower Santiam, South Santiam, Thomas and Crabtree creeks, and the Calapooia Rivers and its tributaries are listed in Table 54.

119
Table 54. Distribution of warmwater game fish in the Santiam and Calapooia subbasins (J.J. Wetherbee, ODFW, unpublished data). _________________________________________________________________________________________________ Stream Speciesa and site SB LB Wm Bg Pk WC BC BrB YB B _________________________________________________________________________________________________ Mill Creek X X X Santiam R. X X X X X Talbot Slough X X X X X South Santiam R. RM 0.0-3.5 X X X Thomas Creek RM 0.0-1.0 X RM 0.0-4.0 X X RM 0.0-10.0 X X X X Crabtree Creek X Calapooia R. RM 0.0-9.5 X RM 0.0-30.0 X X X X Oak Cr. RM 0.0-15.0 X X X Lake Cr. RM 0.0-4.0 X X X Butte Cr. RM 0.0-7.0 X X X Sodom Ditch RM 0.0-6.5 X X X Cochran Cr. RM 0.0-6.5 X X X Shedd Slough RM 0.0-2.0 X X X Walton Slough RM 0.0-3.0 X X X Wright Slough RM 0.0-1.0 X X X _________________________________________________________________________________________________ a SB = smallmouth bass, LB = largemouth bass, Wm = warmouth bass, Bg = bluegill, Pk = pumpkinseed, WC = white crappie, BC = black
crappie, BrB = brown bullhead, YB = yellow bullhead, B = bullhead catfish. Abundance The range and numbers of smallmouth bass appear to be slowly increasing in the subbasins. There are no population estimates for warmwater game fish in the Santiam or Calapooia subbasins. Age structure The age structure of smallmouth bass sampled in the Santiam River in 1977 was 5.6% age 0+, 44.4% age 1+, 47.2% age 2+, and 2.8% age 3+ (Table 55).

120
Table 55. Age specific length data for smallmouth bass sampled in the Santiam River, April-June 1977 (n=36) (K. Daily, ODFW, unpublished data). ______________________________________________________________________ Age Size range Mean length class N % (inches) (inches) ______________________________________________________________________ 0+ 2 5.6 2.8-3.6 3.2 1+ 16 44.4 4.6-9.1 7.1 2+ 17 47.2 8.1-14.1 10.4 3+ 1 2.8 13.6 13.6 ______________________________________________________________________
Average length Smallmouth bass sampled in the Santiam River in 1977 averaged 3.2 inches in length for age 0+ fish, 7.1 inches for age 1+ fish, 10.4 inches for age 2+ fish, and 13.6 inches for age 3+ fish (Table 55). Smallmouth bass sampled from Thomas Creek in 1980 ranged in size from 2-11 inches in length (Table 56). The mean length was 4.3 inches (n=82). Age I fish averaged 3.0 inches in length and age II fish 6.9 inches. Samples of smallmouth bass taken in 1987 ranged from 2-15 inches in length (Table 56). The mean length was 6.2 inches. Age I bass averaged 3.3 inches, age II bass 6.7 inches, age III bass 9.3 inches, age IV bass 10.6 inches, age V bass 11.8 inches and age VI bass 12.9 inches (Table 57). These growth rates are moderate in comparison to smallmouth bass growth rates in other Oregon streams (Daily et al. 1990). Table 56. Size frequency of bass sampled by electrofishing in Thomas Creek, 1980 and 1987 (K. Daily, ODFW, unpublished data). ____________________________________________________________________________________________________________ No. of fish by one-inch size groups (F.L.) Speciesa 2 3 4 5 6 7 8 9 10 11 12 13 14 15 ____________________________________________________________________________________________________________ 28 May 1980, RM 0-5 SB 26 24 13 7 3 2 2 1 4 LB 1 28 May 1987, RM 0-9 SB 11 44 9 6 4 6 1 1 2 1 3 2 1 ____________________________________________________________________________________________________________ a SB = smallmouth bass, LB = largemouth bass.

121
Table 57. Age specific mean calculated fork length for smallmouth bass collected from Thomas Creek in 1987 (K. Daily, ODFW, unpublished data). _____________________________________________________________________________________________ Mean length Mean calculated length (inches) at age Age No. (in) 1 2 3 4 5 6 _____________________________________________________________________________________________ 0+ 1+ 7 5.15 4.11 2+ 9 8.50 2.94 7.13 3+ 1 11.69 2.17 6.93 10.39 4+ 3 12.17 3.20 5.67 7.94 10.21 5+ 6+ 2 14.15 3.92 7.10 9.63 10.90 11.79 12.92 _ _ _ _ _ _ _ _ _ _ _ _ _ _ _ _ _ _ _ _ _ _ _ _ _ _ _ _ _ _ _ _ _ _ _ _ _ _ _ _ _ _ _ _ _ _ _ _ _ _ _ _ _ _ _ __ _ _ _ _ _ _ _ Mean fork length 3.27 6.71 9.32 10.55 11.79 12.92 Mean annual increment 3.27 3.44 2.62 1.23 1.24 1.13 Number of fish 22 15 6 5 2 2 _______________________________________________________________________________________________
A single largemouth bass sampled from Thomas Creek in 1980 was 3.0 inches in length (Table 56). Warmouth sampled from Talbot Slough in 1967 were 5.0-5.4 inches in length (Table 58). Bluegill were 4.5-5.0 inches in length. White crappie were 4.6-8.8 inches and black crappie 8.3-8.4 inches. Yellow bullhead were 7.2-11.7 inches in length.
Table 58. Size of warmwater game fish sampled by gill net in Talbot Slough, Santiam River, July 19-20, 1967 (K. Daily, ODFW, unpublished data). ___________________________________________________________________________ Size range Mean length Species N (inches) (inches) ___________________________________________________________________________ Warmouth bass 3 5.0-5.4 5.1 Bluegill 4 4.5-5.0 4.7 White crappie 65 4.6-8.8 6.9 Black crappie 2 8.3-8.4 8.3 Yellow bullhead 7 7.2-11.7 8.3 ___________________________________________________________________________
Brown bullhead sampled from the lower South Santiam and Santiam rivers in 1978 were 7.6 and 8.4 inches in length (K. Daily, ODFW, unpublished data).

122
Hatchery Production Description of Hatcheries There are no hatcheries or rearing facilities for warmwater game fish in the Santiam and Calapooia subbasins. Hatchery fish are reared at St. Paul rearing ponds (see the Main stem Willamette Plan). Hatchery Releases Hatchery produced fish are used primarily to establish populations of warmwater game fish in the wild (ODFW 1987b). Hatchery fish are obtained or reared for specific release programs. Largemouth bass, smallmouth bass, and channel catfish are either purchased or raised. Other species are captured and transplanted. A single release of 738 channel catfish was made into Talbot Slough on the Santiam River in 1978. Releases of smallmouth bass totaling 3,372 fish were made in lower Thomas Creek in 1973 (Table 59). There are no other records of warmwater game fish releases in streams or rivers in the Santiam or Calapooia subbasins.
Table 59. Releases of warmwater game fish in running waters of the Santiam subbasin (K. Daily, ODFW, unpublished data). ___________________________________________________________________________ No. & lbs.() Site Date Speciesa released Size ___________________________________________________________________________ Talbot Slough 10-13-78 CC 738 (15.0) 4.0 fish/lb Thomas Creek RM 1.5 5-11-73 SB 26 (25) 9-17 in RM 1.5 9-10-73 SB 1,133 (21.5) fingerling 10-3-73 SB 2,213 (29.5) 2.9 in ___________________________________________________________________________ a CC = channel catfish, SB = smallmouth bass.
Angling and Harvest Harvest of warmwater game fish in flowing waters in the Santiam and Calapooia subbasins occurs mainly in the Santiam River, the lower South Santiam River, and Thomas Creek. Poor access to lower reaches of the Calapooia River limits sport harvest. All species of warmwater game fish are believed to be underutilized in running waters in the Santiam and Calapooia subbasins. Creel surveys have only been conducted on the Santiam River during 1979 and 1984 (Table 60). Largemouth and smallmouth bass were harvested.

123
Table 60. Random creel information for warmwater game fish on the main stem Santiam River (J.J. Wetherbee, ODFW, unpublished data). ___________________________________________________________________________ No. & size () Total Hours Fish/ Fish/ Year Speciesa in inches anglers fished angler hour ___________________________________________________________________________ 1979 LB 1 (12-14) 7 16 0.14 0.06 1984 SB 5 (12-14) 2 7 2.50 0.71 ___________________________________________________________________________ a LB = largemouth bass, SB = smallmouth bass.
The bag limit for bass is 5 per day with no more than 3 over 15 inches. There is no bag limit for bluegill, catfish, crappie, other sunfish and yellow perch.
Management Considerations Cold water temperatures, lack of habitat, and competition with non-game fish constrain production of warm water fish in running waters of the Santiam and Calapooia subbasins. There is no information concerning the interactions of warmwater game fish and native species in the Santiam and Calapooia subbasins. There is the potential for predation and competition from warmwater species to decrease the production of native fish. This management plan calls for maintaining or increasing natural production of native winter steelhead and for maintaining natural production of spring chinook in Thomas Creek. The effects of warmwater fish species, in particular smallmouth bass, on winter steelhead and spring chinook in Thomas Creek are unknown. Studies conducted in the Columbia River have shown that smallmouth bass prey on juvenile salmonids (Gray et al. 1982) and may substantially impact their production. The effects of increasing the abundance of larger smallmouth bass through more intensive management on winter steelhead and spring chinook predation is also unknown. Columbia River studies suggest that larger smallmouth consume slightly more salmonids in number than small bass but substantially more salmonids in terms of biomass since they tend to consume larger, older juvenile salmonids (Connolly and Rieman 1988).
Policies Policy 1. Management proposals that initiate or expand release programs for warmwater game
fish or that alter the distribution of warmwater game fish shall be reviewed and evaluated for potential effects on indigenous fish species.

124
Objectives Objective 1. Maintain populations of warmwater game fishes. Assumptions and Rationale 1. Little is known about warmwater game fish species presence, distribution, abundance, and
population characteristics in flowing waters of the Santiam and Calapooia subbasins. Data on warmwater game fish in the Santiam and Calapooia has come from a limited number of stream inventories and creel studies.
2. Monitoring the distribution and abundance of warmwater game fish populations in the
subbasins will provide an indication of population status. 3. Protection of existing warmwater populations can be achieved principally through habitat
protection. Actions 1.1 Inventory the Santiam River, RM 0.0-17.0 of the North Santiam, RM 0.0-15.0 of the South
Santiam, and RM 0.0-32.0 of the Calapooia River for warmwater game fish population distribution and abundance.
1.2 Assess the distribution and abundance of smallmouth bass and other warmwater game fish
in Thomas and Crabtree creeks. 1.3 On priority waters where long-term data sets are necessary to understand population
dynamics, carry out routine sampling programs to determine the species composition, distribution, and population structure of warmwater game fish. Possible priority waters include the Santiam and the lower North and South Santiam rivers, Thomas and Crabtree creeks, and the Calapooia River.
1.4 Implement habitat protection actions outlined under objectives for Habitat Protection. Objective 2. Provide angling opportunities for smallmouth bass in Thomas Creek under
quality fish management if feasible. Assumptions and Rationale 1. Quality fish management provides a better than average opportunity to catch mid- to large-
sized fish. 2. Smallmouth bass in Thomas Creek exhibit moderate growth rates. 3. Forage for smallmouth bass is adequate in Thomas Creek.

125
4. Angling mortality may be controlled through regulations more restrictive than those in general use to prevent overharvest of any size group.
Actions 2.1 Determine the feasibility of Thomas Creek providing a quality smallmouth bass fishery. 2.2 Determine the effects of a change in Thomas Creek smallmouth bass angling regulations
on native fish species. 2.3 Evaluate angling pressure, harvest rates of smallmouth bass, and angler satisfaction
through creel studies in Thomas Creek. Objective 3. Provide additional angling opportunities under quality fish management in the
subbasins if feasible, such as for smallmouth bass in Thomas Creek. Assumptions and Rationale 1. Growth rates for Thomas Creek smallmouth bass show potential for providing fish which are
larger than average without attempting to produce trophy fish. 2. In addition to Thomas Creek, other running waters may be able to provide a better than
average opportunity to catch mid- to large-sized fish. 3. Angler demand may warrant more intensive management of additional warmwater fisheries. Actions 3.1 Identify additional potential sites in running waters for more intensive management of
warmwater game fish. 3.2 Investigate the feasibility of managing identified waters under quality fish management. Objective 4. Provide a diversity of warmwater angling opportunities in remaining running
waters of the subbasins through basic yield management. Assumptions and Rationale 1. Basic yield management requires little intervention in natural processes affecting production. 2. Running waters will be managed under general statewide regulations for warmwater game
fish. 3. Anglers will find variety in species and sizes. 4. Catch rates will be highly variable.

126
5. Public access limits the warmwater fishery in the Santiam and Calapooia subbasins. Actions 4.1 Collect data on the distribution, abundance, fishing pressure, and harvest of warmwater
game fish. 4.2 Evaluate angling pressure, harvest rates, and angler satisfaction through creel studies on
key reaches and streams. 4.3 Improve access by implementing actions outlined under objectives for Access. Objective 5. Increase public awareness of warmwater angling opportunities in the subbasins. Assumptions and Rationale 1. The warmwater game fish resource may be underutilized. 2. ODFW's weekly fishing report can be used to provide current information to attract anglers
during times of good fishing. 3. Publications can direct people to angling opportunities in specific areas. Actions 5.1 Provide warmwater fishing information to be included in the weekly fish reports. 5.2 Publish a guide for warmwater game fish in the mid-Willamette Valley. 5.3 Continue to direct anglers to warmwater fishing opportunities in the subbasins when they
contact district offices for information. 5.4 Consider involving the public in habitat enhancement projects, sampling studies, and
volunteer creel programs.

127
OREGON CHUB
Background and Status
Origin The Oregon chub is a small minnow historically recorded only from the Willamette and Umpqua basins in Oregon. The Willamette population is now considered to be genetically discrete from the Umpqua population, which will most likely be classified as separate species (Markle et al. 1990). Although the Oregon chub is not presently on the federal list of threatened or endangered species, it is on the Federal Register as a category 2 species. Markle and Pearsons (1990) have submitted a petition to list the Oregon chub as an endangered species. The Oregon chub is currently listed by ODFW as a sensitive species due to the decline in its distribution and abundance in the Willamette Valley. Sensitive species have been granted protection. The Oregon chub should be given a high priority with respect to future management activities in the Willamette basin.
Life History and Population Characteristics Oregon chub have been found in quiet waters such as sloughs and overflow ponds at low elevations in the Willamette valley (Dimick and Merryfield 1945). They prefer shallow, warm water with depositional substrates having abundant aquatic vegetation (Markle et al. 1990). Oregon chub have been collected from the South Santiam River (RM 8 and RM 18), the North Santiam River (RM 14.5), and in ponds near Mill Creek (RM 10) (Markle et al. 1990). The most recent sightings have been near Greens Bridge on the North Santiam River (RM 14.5) in 1983 and 1989. Currently, the only Oregon chub population thought to occur in running waters of the Santiam subbasin is in the lower North Santiam River. The Oregon chub is not known to have occurred in the Calapooia subbasin. The Oregon chub spawns in the spring and early summer (Markle et al. 1990). Spawning occurs in aquatic vegetation. Fecundity of females taken from Shady Dell Pond in the upper Willamette basin ranged from 147 to 671 (Markle et al. 1990). Oregon chub feed primarily on zooplankton and midge larvae (Markle et al. 1990).

128
Hatchery Production There is no hatchery production of Oregon chub. Fish captured for introductions into new sites may be held for short periods of time in isolated ponds at the St. Paul rearing facilities (see the main stem Willamette plan). It is more likely that they would be transferred directly to re-introduction sites.
Management Considerations The apparent decline of the Oregon chub in the Willamette valley correlates with the construction of dams and flood control projects. Historically large rivers had braided channels with numerous secondary side channels and wetlands. During winter and spring flooding events, Oregon chub could have been widely dispersed in the flood plain to pond and slough habitats where spawning and juvenile rearing would take place. With recent flood control projects, channelization of rivers and streams, and loss of backwaters, sloughs, and ponds, the dispersal opportunities and available habitat for Oregon chub is now greatly reduced. Oregon chub may also be vulnerable to predation by introduced fish species such as bass. Introduced warmwater fish are often the dominant inhabitants of quiet waters along lower reaches of the Santiam, North Santiam, South Santiam, and Calapooia rivers. They are probably a major detriment to recolonization, if not the cause of the decline of the Oregon chub in the subbasin. The Oregon chub is listed by ODFW as a sensitive and protected species due to the decline in its distribution and abundance in the Willamette Valley. A petition has been submitted to list the Oregon chub on the Federal Register as an endangered species.
Objectives Objective 1. Protect and enhance existing populations of Oregon chub in the Santiam
subbasin. Assumptions and Rationale 1. Oregon chub have been identified by ODFW as a protected species. This objective
addresses some of the problems with this species. 2. A small population of Oregon chub may currently exist in the North Santiam River near
Greens Bridge (RM 14.5). 3. Additional populations may exist in the subbasin. 4. Protection of critical habitat is necessary to avoid further declines in abundance and
distribution.

129
5. Oregon chub populations may be vulnerable to predation and competition from introduced fish species such as bass.
6. Many of the following actions cannot be accomplished under current levels of funding. If
funding continues to be limiting, ODFW will pursue actions according to priority as funds become available.
Actions 1.1 Survey likely habitat in the Santiam subbasin to identify undocumented Oregon chub
populations. 1.2 Discourage introduction of fish species that may negatively impact the recovery of Oregon
chub populations. 1.3 Identify and implement habitat protection and improvement measures for Oregon chub at
Greens Bridge. 1.4 Periodically assess chub population status at Greens Bridge. 1.5 Implement habitat protection measures at additional sites where Oregon chub may be
found. Objective 2. Establish new populations of Oregon chub in isolated waters in the Santiam
subbasin where possible. Assumptions and Rationale 1. Oregon chub have been identified by ODFW as a protected species. This objective
addresses some of the problems with this species. 2. A preliminary list of introduction sites prepared by an interagency task force has identified two
sites as potentially suitable for introductions of Oregon chub in the subbasin (ODFW et al. 1990). Further investigation and review may identify additional sites.
3. Introductions will be confined to the historic distribution of the Oregon chub. 4. Introductions of Oregon chub will be approved through the ODFW stocking policy review
process. 5. If the Oregon chub is added to the federal list of threatened or endangered species, then
ODFW will comply with U.S. Fish and Wildlife Service procedures before reintroducing new populations.

130
6. Many of the following actions cannot be accomplished under current levels of funding. If funding continues to be limiting, ODFW will pursue actions according to priority as funds become available.
Actions 2.1 Evaluate the following potential sites for introductions: Aumsville Ponds, Mill Creek drainage 2.2 Identify and evaluate other potential sites for introductions in isolated waters in the
subbasin. 2.3 Stock Oregon chub in selected, appropriate sites according to Guidelines for Re-introducing
Oregon chub into their Historic Range (ODFW et al. 1990). 2.4 Conduct systematic monitoring of introduced populations. 2.5 Develop criteria to define a successful introduction of Oregon chub. 2.6 Determine the causes of unsuccessful introductions. 2.7 Restock sites if warranted. Objective 3. Promote greater public understanding and appreciation of the status of Oregon
chub. Assumptions and Rationale 1. The status and importance of the Oregon chub is recognized by only a small portion of the
general public. Actions 3.1 Publicize efforts taken and their rationale for protecting and enhancing populations of
Oregon chub. 3.2 Educate anglers and angling groups about the status of Oregon chub and the risks of
introducing exotic species into potential Oregon chub habitat.

131
SAND ROLLERS
Background and Status
Origin The sand roller, Percopsis transmontana, a member of the trout-perch family, is native to the Columbia River and its tributaries, including the Willamette. It is currently listed by ODFW as a stock of concern statewide. Populations are suspected of being at low levels, but its exact status is unknown. The sand roller should be given a high priority with respect to future population and habitat inventory and monitoring activities in the Santiam and Calapooia subbasins.
Life History and Population Characteristics Sand rollers are generally found in low gradient reaches of rivers and streams. During daylight hours they hide among large submergent objects such as root wads and under banks. At night they move out in small schools to feeding areas over sandy substrates (personal communication on 23 October 1990 from P. Reimers, ODFW, Charleston, Oregon). Because of their secretive nature during the day, sand rollers often go uncollected during routine stream sampling. Current records for the subbasins may underestimate their distribution. Sand rollers have been collected from Mill Creek, the South Santiam River, and the Calapooia River and its tributary Oak Creek (Table 61). They have also been observed in Stout Creek (RM 1) in the North Santiam system and in Hamilton Creek (RM 0-9) in the South Santiam system (personal communication on 28 August 1990 from W. Hunt, ODFW, Salem, Oregon). Sand rollers collected from the Columbia River ranged in age from 1 to 6 years (Gray and Dauble 1979). Sand rollers usually attain sexual maturity at age II. All fish are mature by age III. Gravid females were collected from sites in the Columbia River from June through mid-July (Gray and Dauble 1979). Females collected from January through July contained 1,106 to 3,369 eggs. Carlander (1969) reports that a single female contained 4,748 eggs. Spawning occurs in the Columbia River in midsummer when water temperatures range from 57-61o F (Gray and Dauble 1979). Emergent fry were collected in mid-August in the Columbia River. Larger fry were collected in mid-September. Aquatic insects are the main food of sand rollers. Zooplankton may contribute a greater portion of the diet of immature fish (Gray and Dauble 1979).

132
Table 61. Records of sand rollers collected from rivers and streams in the Santiam and Calapooia subbasins (D. Markle, Oregon State University, Department of Fisheries and Wildlife, Corvallis, Oregon, unpublished data). ___________________________________________________________________________ Date Stream Site ___________________________________________________________________________ 8-29-40 Mill Creek At Salem 7-25-53 So. Santiam R. At Lebanon, RM 18 8-12-55 So. Santiam R. At Lebanon, RM 18 9-6-57 So. Santiam R. At Lebanon Dam, RM 21 1968 Thomas Creek Near Scio, RM 9 8-90 Hamilton Creek RM 0-9 9-21-82 Oak Cr., Calapooia R. Near Albany 8-17-83 Calapooia R. 2.5 mi south of Tangent Undated Stout Creek RM 1 Undated So. Santiam R. Undated Calapooia R. Near Albany ___________________________________________________________________________
Management Considerations Sand rollers may be susceptible to habitat degradation and water diversions found in lower reaches of rivers and streams in the subbasins. Channelization of rivers and streams and removal of riparian vegetation reduces the structural complexity required by sand rollers. The sand roller is listed by ODFW as a stock of concern statewide. Information is needed concerning its status.
Objectives Objective 1. Determine the distribution, relative abundance, and habitat use of sand rollers in
the Santiam and Calapooia subbasins. Assumptions and Rationale 1. Determining the distribution and relative abundance of populations of sand rollers will provide
an indication of their health. 2. Information on the distribution and habitat use of sand rollers in the subbasins is necessary in
order to implement habitat protection actions.

133
3. Many of the following actions cannot be accomplished under current levels of funding. If
funding continues to be limiting, ODFW will pursue actions according to priority as funds become available.
Actions 1.1 While conducting routine inventory for other fish species, collect more detailed data for sand
rollers when present. 1.2 Survey rivers and streams of the Santiam and Calapooia subbasins to determine the
relative abundance of sand rollers. 1.3 Determine the habitat requirements of sand rollers in the Santiam and Calapooia
subbasins. Objective 2. Protect, restore, and enhance sand rollers habitat. Assumptions and Rationale 1. Protection and enhancement of sand roller populations can be achieved principally through
habitat protection and improvement. Actions 2.1 Advocate riparian protection for river and stream reaches containing sand rollers. 2.2 Develop habitat improvement plans where needed. 2.3 Work with volunteers, landowners, and agencies to implement habitat improvement projects
in stream reaches used by sand rollers. 2.4 Implement habitat protection actions outlined under objectives for Habitat Protection.

134
CRAYFISH
Background and Status
Origin Crayfish are the most important freshwater invertebrate to Oregon's fisheries. They provide a small fishery in the lower Calapooia River. They are also important fish forage in the Santiam and Calapooia subbasin.
Life History and Population Characteristics Three species of crayfish are native to Oregon (Hobbs 1976). These species, their subspecies and intergrades are spread statewide, with overlapping distributions. An introduced species found in the Rogue River is not known to occur in the Willamette or its tributary subbasins, including the Santiam and Calapooia. Crayfish breed in the summer, with the first egg-bearing females appearing as early as September. Eggs are carried over the winter and hatch late April to late June. The young are attached to the female by a thread-like material for a short time. Size achieved by zero-age crayfish during the first summer is quite variable due to the long period over which eggs hatch. Age determination by the length-frequency method is extremely difficult. Females mature at about 18-30 months. Fecundity increases with size and perhaps age. There is evidence to suggest that some or perhaps all females do not breed each year.
Hatchery Production There is no hatchery production of crayfish in the Santiam and Calapooia subbasins. No commercial crayfish culture operations have yet been successful in the state.
Harvest Crayfish have been fished commercially in Oregon since before 1893 when records were first kept. Markets for bait and for restaurant food dictate the size of landings. Most of the Willamette basin harvest occurs in Multnomah, Clackamas, and Yamhill counties (ODFW, unpublished data). There are no estimates of commercial landings specifically for the Santiam and Calapooia subbasins. The commercial crayfish season is open from April 1 through October 31. Crayfish may be taken only by crayfish pots or ring nets. Only crayfish 3-5/8 inches or longer in length may be taken. Undersized crayfish must be returned unharmed to the water. Any crayfish caught with eggs attached must be returned unharmed to the water. Gear must be labeled with an identification number issued by ODFW.

135
Recreational use of the resource is widespread for bait and direct consumption. No license is required to take crayfish. The daily bag limit is 100 per person. The season is open the entire year at all hours. Estimates of sport harvest levels in the Santiam and Calapooia subbasins are unavailable.
Management Considerations Water pollution, particularly pesticides and some industrial wastes, and flow depletions are the most serious threats to crayfish populations. Local populations may be subject to overharvesting.
Objectives Objective 1. Assess the population status and commercial harvest of crayfish in the Santiam
and Calapooia subbasins. Assumptions and Rationale 1. Presently, commercial catch information is reported only by date and county. 2. Information should be collected for the most heavily fished waters. 3. Data can be collected at reasonable cost from commercial operators. Actions 1.1 Conduct biological sampling in key areas to determine size and age composition and
relative abundance of crayfish. 1.2 Require commercial harvesters to use a logbook to record effort and catch for all crayfish
harvest. Objective 2. Determine the size and importance of the recreational crayfish harvest in the
Santiam and Calapooia subbasins. Assumptions and Rationale 1. Currently there is no measure of the impact of the recreational harvest or the fishery potential
of crayfish. 2. There are no estimates of current harvest or effort. 3. Recreational harvest is widespread and appears to be increasing.

136
Actions 2.1 While conducting routine stream surveys, collect data to determine size and relative
abundance of crayfish. 2.2 Conduct creel studies in key areas to evaluate harvest and effort.

137
ANGLING ACCESS
Background and Status The Oregon State Land Board has recommended that the main stem Santiam River, the North Santiam from its mouth to RM 27 near Mehama, and the South Santiam River from its mouth to RM 26.5 above Waterloo be declared navigable based on historical use of the rivers for log drives (Oregon State Land Board 1983). Under this classification streambanks below the ordinary high water mark would be publicly owned and could be used for public angling. The Land Board has recognized that the North Santiam from RM 27 to 40 and the South Santiam from RM 26.5 to 48 show evidence of navigability based on historic use of the rivers for log drives and commercial tourism. The state legislature may exercise its full right to declare these reaches navigable, although in the past only reaches that had navigable use and were also meandered have been recommended. The main stem Santiam River has boat access at both the I-5 rest area and at Jefferson. The North Santiam River has adequate access for both boat and bank anglers due to the proximity of the river to Highway 22. The one exception is in the North Santiam just above Stayton, where low flows due to a water diversion dam pose a perpetual boating problem and safety hazard. A new take-out site is needed at or just above Geren Island since the city of Salem has gated the former ramp access site. Additional access would be desirable at the old fish hatchery just below Mehama. The South Santiam River has more limited bank access than the North Santiam. Highway 20 does not parallel the river closely. Additionally, most of the land along the South Santiam below RM 51 is privately owned. The greatest need for access on the South Santiam is at McDowell Creek Bridge. Currently, there is a small privately owned ramp which is available to the public for a fee. Access to the public could be lost completely. Nearly all of the land along the Calapooia River is in private ownership. Boat access is limited to sites in Brownsville (RM 32.5) and at McKercher County Park (RM 40.5). Demand for additional access has not been great. However additional access sites would be needed if interest in the warmwater fishery increased. Adequate bank access above Holley (RM 45.5) provides angling opportunities for trout. Conflicts between anglers and landowners primarily involve trespass, littering, and damage to vegetation. Incentives need to be developed to encourage private landowners to allow public access and to encourage anglers to respect property rights and to minimize disturbance to wildlife.
Policies Policy 1. The Department shall seek to provide access for boat and bank angling that will
satisfy public need for a variety of angling opportunities and a dispersion of angling effort throughout the subbasin.
Policy 2. Acquisition and development of angler access sites shall be consistent with

138
guidelines and objectives for management of fish species and habitat.
Objectives Objective 1. Provide and maintain 2 permanent boat access sites on the main stem Santiam
River, 9 permanent sites on the North Santiam River from the mouth up to RM 44, 4 permanent sites on the South Santiam River from the mouth up to RM 33, and at least 1 permanent site on the Calapooia River.
Assumptions and Rationale 1. It is necessary to work with other agencies, public groups, and private landowners to provide
and maintain access sites. 2. Existing access sites meet the objective, except for the North Santiam at Stayton and the
South Santiam River near the McDowell Creek Bridge site (RM 27.5). 3. Boat anglers primarily use the rivers for day-trips. Consequently, access sites need to be
relatively close together. 4. Some boat access sites are poorly maintained or are in need of improved or expanded
facilities. 5. ODFW may need to acquire boat access sites currently owned by other parties or agencies
in order to assure continued operation of facilities. 6. Many of the following actions cannot be accomplished under current levels of funding. If
funding continues to be limiting, ODFW will pursue actions according to priority as funds become available.
Actions 1.1 Work with the Oregon Department of Transportation to improve existing boat access at the
I-5 rest area on the main stem Santiam River (RM 6). 1.2 Acquire and improve the Jefferson Boat Ramp on the main stem Santiam (RM 9.5), or
acquire and develop a boat access site just to the south. 1.3 Maintain the parking facilities at Greens Bridge on the North Santiam (RM 3). 1.4 Acquire and develop a boat access site on the lower power canal at Stayton on the North
Santiam River (RM 15.5).

139
1.5 Acquire and develop a boat access site at or near the upstream end of Geren Island on the North Santiam River (RM 16.5).
1.6 Work with the State to develop a boat access site behind the old fish hatchery below
Mehama on the North Santiam River. 1.7 Work with the Oregon Department of Transportation to expand and develop the parking and
toilet facilities at Mehama Bridge on the North Santiam (RM 27). 1.8 Work with Oregon State Parks to improve the launch area and parking facilities at North
Santiam State Park on the North Santiam (RM 29). 1.9 Work with Linn County to extend the ramp at Waterloo Park on the South Santiam (RM
23.5). 1.10 Acquire the privately-owned boat access site at McDowell Creek Bridge on the South
Santiam (RM 27.5) and improve the ramp and parking facilities. 1.11 Work with the city of Sweet Home to improve the parking facilities at the Pleasant Valley
Road on the South Santiam (RM 33). 1.12 Work with the Oregon Department of Transportation to develop a pram slide and parking
facilities at the Tangent site on the Calapooia (RM 9.5). 1.13 Acquire and develop a boat access site on the Calapooia River between RM 0 and 9.5. Objective 2. Increase bank angling access in the subbasins. Assumptions and Rationale 1. Additional bank angling access would increase angling opportunities. 2. Much of the shoreline along the South Santiam and Calapooia rivers is privately owned. 3. Private landowners often attempt to prevent public access on their property. Actions 2.1 Identify potential sites for bank angling access on rivers in the Santiam and Calapooia
subbasins. 2.2 Acquire additional sites for bank angling where desirable. 2.3 Develop incentives to encourage private landowners to allow public access. 2.4 Develop incentives to encourage anglers to respect property rights and minimize
disturbance to wildlife.

140
PLAN ADOPTION AND REVIEW The Santiam and Calapooia Plan should not be viewed as the final statement on the management of the fish and fisheries in the subbasin. Planning is a continuing process. As conditions of the resources and desires of the public change and as new information is obtained, the plan must be responsive and evolve as well. Every 2 years public meetings will be held to review progress made in implementing the plan. These meetings are intended to provide an opportunity for the public to comment on management direction and progress. At that time implementation priorities will also be reexamined and adjustments made where necessary. This review will precede the preparation of ODFW's biennial budget, which is submitted to the legislature for funding. The Santiam and Calapooia Plan will be formally reviewed every 5 years. Portions of the plan will be rewritten as needed and presented to a public advisory committee. The final draft will be presented to the Fish and Wildlife Commission for adoption. Upon adoption by the Oregon Fish and Wildlife Commission, the policies and objectives will become Oregon Administrative Rules. Revision of these rules requires action by the Commission. Emergency changes in administrative rules can be made by the Commission in accordance with the Administrative Procedures Act when needed.

141
PRIORITY OF ACTIONS The Santiam and Calapooia Subbasin Fish Management Plan proposes many actions, more than can be completed within existing budgets. Some actions are currently on-going activities of ODFW and only need to be continued or modified. Other actions are new and need funding before they can be implemented. In order to achieve the objectives of this plan within ODFW's budgetary and staff limitations, priorities for funds and effort must be identified. High priority actions were identified for habitat protection, species or species groups, and access (Table 62). These priorities reflect what ODFW and the citizens advisory committee believe are the most important actions that should be addressed in the Santiam and Calapooia Subbasin Fish Management Plan. The first five actions identified in Table 61 are habitat protection actions which affect more than a single stock or species of fish. The current funding status for each action is indicated. A "yes" in the currently funded column denotes that funding for that action is presently budgeted under existing programs, however current funding may not be adequate. If funding or additional funds are needed, they are noted in the next column. Table 62. High priority actions in the Santiam and Calapooia Subbasin Fish Management Plan and funding status. ______________________________________________________________________________ Currently Actions funded Remarks on funding status ______________________________________________________________________________ Reduce the impacts of timber harvest activities on fish production
Yes Included in base budget
Implement a basin-wide fish screening plan based on the needs identified by HCD as well as those identified in this plan
No Funding needed
Improve upstream and downstream passage at Stayton on the North Santiam River
No Operators of facilities required to fund protec-tion devices; funding needed for ODFW staff
Resolve passage problems at Foster, Green Peter, and Detroit dams through continued cooperation with USACE
No Operators of facilities required to fund protec-tion devices; funding needed for ODFW staff
______________________________________________________________________________ continued

142
Table 61 continued. ______________________________________________________________________________ Currently Actions funded Remarks on funding status ______________________________________________________________________________ Improve passage at Thompson's Mill Dam on the Calapooia River
No Operators of facilities required to fund protec-tion devices; funding needed for ODFW staff
Increase natural production of winter steelhead in the Santiam and Calapooia
No Additional funding needed for inventories and habitat enhancement
Protect and enhance the native winter steelhead run above Foster Dam
No Additional funding needed from USACE to correct passage at Foster Dam
Determine the status of spring chinook populations in the various Santiam subbasin tributaries
No Additional funding needed for developing technology and seasonal staff for field surveys
Increase natural production of spring chinook in the Santiam subbasin a. Reestablish runs of spring chinook above Foster and Detroit dams b. Increase production in Thomas and Crabtree creeks
No Partially funded by base budget; additional funding needed for smolt releases and from USACE to correct passage at Green Peter Dam and predation problems in Green Peter Reservoir
Reestablish natural production of spring chinook in the Calapooia subbasin
No Partially funded by base budget; additional funding needed for smolt releases
Protect and enhance the productivity of native trout
No Partially funded by base budget; additional funding needed for surveys and habitat improvement
Provide additional angling opportunities for warmwater game fish while protecting populations of native fish species
No Partially funded by base budget; additional funding needed to publish a warmwater angling guide
______________________________________________________________________________ continued

143
Table 61 continued. ______________________________________________________________________________ Currently Actions funded Remarks on funding status ______________________________________________________________________________ Protect and enhance populations of sensitive species and stocks of concern
No Additional funding needed for surveys and habitat improvement
Provide and maintain angling access No Maintenance of existing sites is funded
in the base budget; additional funding needed for acquisition and development of new sites
______________________________________________________________________________

144
REFERENCES Bennett, D.E. 1988. 1987 Willamette River spring chinook salmon run. ODFW, Columbia River
Management, Portland, OR. 36 pp. Buchanan, D.V. 1975. Willamette River steelhead. Columbia River fishery development program,
quarterly report. Oregon Department of Fish and Wildlife, Portland, Oregon. 16 pp. Buchanan, D.V. and M.G. Wade. 1978. Willamette River steelhead. Annual report. Oregon Department
of Fish and Wildlife, Research Division. Buchanan, D.V., R.M. Hooton, M.G. Wade and J.E. McCrae. 1979. Willamette River steelhead. Annual
report. Oregon Department of Fish and Wildlife. Buchanan, D.V. and M.G. Wade. 1982. Restoration of the native winter steelhead run on the South
Santiam River above Foster Dam. Annual progress report of the Oregon Department of Fish and Wildlife.
Buchanan, D.V., M.G. Wade, S.P. Trask, B.J. Lee and T.J. Lichatowich. 1984. Restoration of the native
winter steelhead run on the South Santiam River above Foster Dam. Oregon Department of Fish and Wildlife annual progress report, Portland, Oregon. 40 pp.
Buchanan, D.V., M.G. Wade and D.L. Higley. 1991. Restoration of the native winter steelhead run on the
South Santiam River above Foster Dam - Completion Report. Oregon Department of Fish and Wildlife, Portland, Oregon.
Campbell, C.J. and F.E. Locke, editors. 1968. 1968 annual report, fishery division. Oregon State Game
Commission, Portland, Oregon. Campbell, C.J. and F.E. Locke, editors. 1969. 1969 annual report, fishery division. Oregon State Game
Commission, Portland, Oregon. Campbell, C.J. and F.E. Locke, editors. 1970. 1970 annual report, fishery division. Oregon State Game
Commission, Portland, Oregon. Campbell, C.J. and F.E. Locke, editors. 1971. 1971 annual report, fishery division. Oregon State Game
Commission, Portland, Oregon. Campbell, C.J. and M.K. Daily, editors. 1972. 1972 annual report, fishery division. Oregon State Game
Commission, Portland, Oregon. Campbell, C.J. and M.K. Daily, editors. 1973. 1973 Annual report, fishery division. Oregon State Game
Commission, Portland, Oregon.

145
Carlander, K.D. 1969. Handbook of Freshwater Fishery Biology, Volume I. Iowa State University Press, Ames, Iowa.
Chesney, C.J. 1983. Mass erosion occurrence and debris torrent impacts on some streams in the
Willamette National Forest. Oregon State University Master's Thesis. Corvallis, Oregon. Clady, M.D. 1971. The biology of the winter steelhead of the Willamette River, Oregon. Oregon State
Game Commission Progress Memorandum, Fisheries, No. 5, 31 pp. Columbia Basin Fish and Wildlife Authority. 1990. Integrated system plan for salmon and steelhead
production in the Columbia River basin, public review draft. Columbia Basin Fish and Wildlife Authority, Portland, Oregon.
Connolly, P.J. and B.E. Rieman. 1988. Population dynamics of walleye and smallmouth bass and
potential predation on salmonid smolts in John Day reservoir. U.S.D.O.E., Bonneville Power Administration. Vol. I, Final Report of Research 1983-86.
Daily, M.K. 1971. The mountain whitefish: a literature review. Univ. Idaho Forest, Wildlife and Range
Expt. Station Paper No. 8. 18 pp. Daily, M.K., R. Perkins and J. Johnson. 1990. Umpqua River smallmouth bass investigation, 1982-88.
Oregon Department of Fish and Wildlife Information Report. DeCew, M.G. 1969. The Marion Forks Hatchery steelhead trout rearing program and life history study of
adult steelhead returning to Minto Pond. Fish Commission of Oregon, 24 pp. Dimick, R.E. and R. Merryfield. 1945. The fishes of the Willamette River system in relation to pollution.
Eng. Exp. Sta., Oregon St. Coll., Bull. 20. Ely, C. 1981. Wild trout inventory, 1979. Oregon Department of Fish and Wildlife. Information Report
Series, Fisheries No. 81-6. Foster, C.A. 1990. Fish passage at Willamette Falls in 1989. ODFW, Columbia River Management
Annual Report, 33 pp. Franklin, J.F. and C.T. Dyrness. 1973. Natural vegetation of Oregon and Washington. USDA Forest
Service General Technical Report PNW - 8. 417 pp. Frazier, P.A. 1988. Fish at Willamette Falls in 1987. ODFW, Columbia River Management Annual Repot,
22 pp. Fulton, L.A. 1970. Spawning areas and abundance of steelhead trout and coho, sockeye, and chum
salmon in the Columbia River Basin - past and present. National Marine Fisheries Service Spec. Sci. Report - Fisheries No. 618.

146
Gray, G.A., G.M. Sonnevil, H.C. Hansel, C.W. Huntington and D.E. Palmer. 1982. Feeding activity, rate of consumption, daily ration and prey selection of major predators in the John Day pool. U.S.D.O.E., Bonneville Power Administration. Annual Report.
Gray, R.H. and D.D. Dauble. 1979. Biology of the sand roller in the central Columbia River. Trans. Amer.
Fish. Soc. 108: 646-649. Hansen, H.L. 1977. Stock assessment and enhancement of fall salmon species in the Willamette River
system. Federal Aid Progress Reports, Fisheries. ODFW, Portland, Oregon. Hansen, H.L. 1978. Stock assessment and enhancement of fall salmon species in the Willamette River
system. Federal Aid Progress Reports, Fisheries. Oregon Department of Fish and Wildlife, Portland, Oregon.
Hansen, H.L. and R.H. Williams. 1979. Stock assessment and enhancement of fall salmon species in the
Willamette River system. Annual Progress Report of the Oregon Department of Fish and Wildlife. Hobbs, Jr., H.H. 1976. Crayfishes (Astacidae) of North and Middle America. U.S.E.P.A. Water Pollution
Control Research Series 18050 ELD05/72. Howell, P.J. 1986. Willamette basin fish management plan: status and progress 1979-85. Oregon
Department of Fish and Wildlife, Portland, Oregon. Howell, P.J., K. Jones, and D. Scarnecchia, L. LaVoy, W. Kendra and D. Ortmann. 1985a. Stock
assessment of Columbia River anadromous salmonids. Vol. II: steelhead stock summaries, stock transfer guidelines - information needs. USDOE Bonneville Power Administration, Division of Fish and Wildlife.
Howell, P.J., K. Jones, D. Scarnecchia, L. LaVoy, W. Kendra and D. Ortmann. 1985b. Stock assessment
of Columbia River anadromous salmonids. Vol. I: chinook, coho, chum and sockeye salmon stock summaries. USDOE. Bonneville Power Administration, Division of Fish and Wildlife.
Hunt, W.L. 1982. Wild trout inventory, 1980. Oregon Department of Fish and Wildlife. Information Report
Series, Fisheries No. 82-1. Kinunen, W. 1975. A review of rainbow trout stocking and catch statistics in Oregon streams, 1952-1975.
Progress memorandum. Oregon Department of Fish and Wildlife, Research Division. Kinunen, W. and J.R. Moring. 1976. Status and origin of rainbow trout brood stocks in Oregon. Oregon
Department of Fish and Wildlife. Information Report Series, Fisheries No. 76-7. Langridge, R.W. 1987. Soil survey of Linn County area, Oregon. USDA Soil Conservation Service. Linn County Planning and Zoning Department. 1985. The Linn County comprehensive plan. Linn County,
Oregon.

147
Lukas, G. and L. Korn. 1968. The feasibility of rearing sockeye salmon in reservoirs. Final report. Fish Commission of Oregon, Research Division.
Marion County Planning Department. 1981. Marion County comprehensive land use plan. Marion
County, Salem, Oregon. Markle, D.F. and T.N. Pearsons. 1990. Petition to list the Oregon chub, Oregonichthys crameri, as an
endangered species. Manuscript. Oregon State University, Corvallis, Oregon. Markle, D.F., T.N. Pearsons and D.T. Bills. 1990. Natural history of Oregonichthys (Pisces: Cyprinidae)
with a description of a new species from the Umpqua River of Oregon. Copeia in press. Mattson, C.R. 1948. Spawning ground studies of Willamette River spring chinook salmon. Fish
Commission of Oregon Research Briefs, Portland, Oregon pp. 21-32. Mattson, C.R. 1962. Early life history of Willamette River spring chinook salmon. Fish Commission or
Oregon, Portland, Oregon. 49 pp. Moring, J.R. 1977. Oregon rainbow and cutthroat trout evaluation. Final report. Oregon Department of
Fish and Wildlife, Research Division. Moring, J.R., ed. 1978. Proceedings of the wild trout--catchable trout symposium, February 15-17, 1978.
Oregon Department of Fish and Wildlife, Research Division. Moring, J.R. 1979. Changes in catch rates following reduction of trout stocking density in Oregon
streams. Oregon Department of Fish and Wildlife. Information Report series, Fisheries No. 79-4. Moring, J.R. and D.V. Buchanan. 1978. Downstream movements and catches of two strains of stocked
trout. J. Wildl. Manage. 42(2):329-333. Moring, J.R. and R.L. Youker. 1979. Oregon rainbow and cutthroat trout evaluation. Final report. Oregon
Department of Fish and Wildlife, Research Division. Moring, J.R., R.L. Youker and R.M. Hooton. Undated. Movement patterns of potamodromous cutthroat
trout of the Willamette Valley, Oregon. Oregon Department of Fish and Wildlife, Research Division.
Nicholas, J.W. 1978. A review of literature and unpublished information on cutthroat trout (Salmo clarki
clarki) of the Willamette watershed. Oregon Department of Fish and Wildlife. Information Report Series, fisheries No. 78-1.
Oregon Department of Environmental Quality. 1978. Oregon statewide assessment of nonpoint source
problems, August, 1978. Water Quality Program, Portland, Oregon. Oregon Department of Fish and Wildlife. 1986. Steelhead management plan 1986-1992. Portland,
Oregon.

148
Oregon Department of Fish and Wildlife. 1987a. Trout plan. ODFW, Portland, Oregon. Oregon Department of Fish and Wildlife. 1987b. Warmwater game fish management plan. Portland,
Oregon. Oregon Department of Fish and Wildlife. 1988a. Willamette basin fish management plan. Fish Division.
Portland, Oregon. Oregon Department of Fish and Wildlife. 1988b. Comments on the Willamette National Forest draft
environmental impact statement and proposed plan. Portland, Oregon. Oregon Department of Fish and Wildlife. 1990a. Willamette River Subbasin Salmon and Steelhead Plan,
Santiam and Calapooia Rivers. Columbia Basin Fish and Wildlife Authority, Portland. Oregon Department of Fish and Wildlife. 1990b. Oregon salmon and steelhead catch data, 1975-1986.
Portland, Oregon. Oregon Department of Fish and wildlife, Oregon State University Fisheries and Wildlife Department, and
Willamette National Forest. 1990. Conservation agreement for the Oregon chub in the Willamette Valley, Oregon. Draft report.
Oregon State Game Commission, Fishery Division. 1956. 1955 fish stockings by watersheds. Portland,
Oregon. Ibid. 1957-1973. Oregon State Land Board. 1983. Report and recommendation on the navigable waters of Oregon.
Division of State Lands, Salem, Oregon. Oregon Water Resources Department. 1985. Mid-Willamette basin water resources plan update. Salem,
Oregon. Sidle, R., A. Pearce and C. O'Loughlin. 1984. Soil mass movement: influence of natural and management
factors. Unpublished manuscript. Skeesick, D.G. and S.V. Jones. 1988. Draft fish status report. Willamette National Forest. USDA Forest
Service. Smith, E.M. and J.C. Zakel. 1980a. Improving survival of spring chinook smolts from Willamette River
hatcheries. Annual progress report. Oregon Department of Fish and Wildlife, Portland, Oregon. Smith, E.M. and J.C. Zakel. 1980b. Willamette River spring chinook evaluation. Oregon Department of
Fish and Wildlife, Portland, Oregon. 53 pp. Smith, E.M., R.H. Williams and J.C. Zakel. 1982. Willamette River salmon studies. Annual progress
report of the Oregon Department of Fish and Wildlife.

149
Smith, E.M., J.C. Zakel and W.H. Day. 1985. Willamette River salmon studies. Annual progress report of
the Oregon Department of Fish and Wildlife. 14 pp. Smith, E.M., J.C. Zakel, W.H. Day, K. Homolka and M.A. Buckman. 1987. Willamette River salmon
studies. Annual progress report. Oregon Department of Fish and Wildlife, Portland, Oregon. Swanston, D. and F.J. Swanson. 1976. Timber harvesting, mass erosion, and steepland forest
geomorphology in the Pacific Northwest. In D. Coates, ed., Geomorphology and engineering. Dowden, Hutchinson, Ross, Inc., Stroudsburg, Pennsylvania.
Swartz, D.F. 1967. Number, size, and age composition of adult salmon and steelhead handled at Fish
Commission of Oregon hatcheries in 1965. Fish Commission of Oregon. Swartz, D.F. 1968a. Number, size and age composition of adult salmon and steelhead handled at Fish
Commission of Oregon hatcheries in 1966. Fish Commission of Oregon, Research Division. Swartz, D.F. 1968b. Number, size, and age composition of adult salmon and steelhead handled at Fish
Commission of Oregon hatcheries in 1967. Fish Commission of Oregon, Research Division. Swartz, D.F. and J. Wallis. 1966. Number, size, and age composition of adult salmon and steelhead
handled at Fish Commission of Oregon hatcheries in 1964. Fish Commission of Oregon. U.S. Army Corps of Engineers. 1988. Willamette system temperature control study - Santiam River
subbasin. Phase I report. Portland District, Portland, Oregon. U.S. Forest Service. 1987a. Draft environmental impact statement, Willamette National Forest. U.S.
Forest Service, Pacific Northwest Region, Portland, Oregon. U.S. Forest Service. 1987b. Proposed land and resource management plan, Willamette National Forest.
U.S. Forest Service, Pacific Northwest Region, Portland, Oregon. Wade, M.G. and D.V. Buchanan. 1983. Development and assessment of steelhead in the Willamette
River basin, annual report. Oregon Department of Fish and Wildlife, Portland, Oregon. 18 pp. Wade, M.G., D.V. Buchanan and S.P. Trask. 1985. Restoration of the native winter steelhead run on the
South Santiam above Foster Dam. Oregon Department of Fish and Wildlife annual progress report, Portland, Oregon. 22 pp.
Wagner, E. and P. Ingram. 1973. Evaluation of fish facilities and passage at Foster and Green Peter
dams on the South Santiam River drainage in Oregon. Fish Commission of Oregon, Fish Research Project DAWC57-68-C-0013, Final Report, Portland, Oregon.
Wallis, J. 1964. A report on the size and age composition of adult salmon handled at Oregon Fish
Commission hatcheries during the 1963-64 spawning season. Oregon Fish Commission.

150
Wallis, J. and W.A. Burck. 1961. A preliminary report on the size and age composition of adult salmon handled at Oregon Fish Commission hatcheries during the 1960-61 spawning season. Oregon Fish Commission Research Report. Clackamas, Oregon.
Wallis, J. and W.A. Burck. 1963. A report on the size and age composition of adult salmon handled at
Oregon Fish Commission hatcheries during the 1962-63 spawning season. Oregon Fish Commission.
Wetherbee, J.J. and W.L. Hunt. 1982. A wild trout inventory of the Blowout Creek system. Oregon
Department of Fish and Wildlife. Information Report Series, Fisheries No. 82-2. Willamette Basin Task Force. 1969. The Willamette basin, comprehensive study of water and related land
resources. Appendix D. Fish and Wildlife. Pacific Northwest River Basins Commission. Willamette National Forest. 1989. Biology of the bull trout, Salvelinus confluentus, a literature review.
Willamette National Forest, U.S.F.S., Eugene, Oregon. Williams, L.H. 1972. Soil survey of the Marion County area, Oregon. USDA Soil Conservation Service. Williams, R. 1983a. Coho salmon in the upper Willamette River, Oregon, Draft. Oregon Department of
Fish and Wildlife, Portland, Oregon. Williams, R. 1983b. Releases of coho salmon into the upper Willamette River, Oregon. Information
Report No. 83-3, ODFW, Portland, Oregon.

151
APPENDICES

152
APPENDIX A Winter Steelhead
Table A-1. Releases of hatchery winter steelhead in the Santiam subbasin by release site (ODFW, unpublished data). _______________________________________________________________________________ Release Number released Release year Hatchery and stock Fry Fingerlings Smolts location _______________________________________________________________________________ 1978 Gnat Cr, Big Cr 19,076 Mill Cr. Marion Fks, No Santiam 96,038 23,435 Big Cliff Res. 1979 Roaring R, Big Cr 12,441 Roaring R. Marion Fks, No Santiam 75,586 29,000 Big Cliff Res. " 77,744 No. Santiam 1980 Roaring R, Big Cr 58,632 Santiam " 22,090 Mill Cr. Marion Fks, No Santiam 50,420 No. Santiam " " 22,434 Green Peter Res. " 13,101 Foster Res. " 31,801 So. Santiam " 223,889 Thomas Cr. 1981 Marion Fks, No Santiam 62,679 No. Santiam " 10,000 Young Lk. " 14,943 Green Peter Res. " 19,781 Foster Res. " 35,257 So. Santiam 1982 Marion Fks, No Santiam 874 Horn Cr. " 28,130 39,454 No. Santiam " " 9,752 Walter Wirth Pd. " 51,300 Quartzville Cr. " 51,300 Mid. Santiam " " 15,174 Green Peter Res. " 15,675 Foster Res. " 30,736 So. Santiam So Santiam, So Santiam 1,748 Horn Cr. " 10,764 Quartzville Cr. " 10,764 Mid. Santiam 1983 Marion Fks, No Santiam 23,600 99,971 No. Santiam " 8,160 Mid. Santiam " 9,762 Green Peter Res. " " 16,368 Foster Res. " 17,054 So. Santiam " 61,150 Crabtree Cr. 1984 Marion Fks, No Santiam 8,337 2,483 Horn Cr. " 22,898 No. Santiam " 49,222 Quartzville Cr. 1984 Marion Fks, No Santiam 1,999 Mid. Santiam " " 13,014 Green Peter Res. " 11,088 Foster Res. " 23,001 So. Santiam So Santiam, So Santiam 21,064 No. Santiam " " 8,537 Quartzville Cr. _______________________________________________________________________________ (continued)

153
Table A-1 continued. _______________________________________________________________________________ Release Number released Release year Hatchery and stock Fry Fingerlings Smolts location _______________________________________________________________________________ 1985 Roaring R, Klaskanine 8,504 Crabtree Cr. Marion Fks, No Santiam 3,221 Horn Cr. " 45,390 No. Santiam " 21,483 271 Quartzville Cr. " " 16,110 281 Mid. Santiam " 63,449 10,347 20,200 Green Peter Res. " 22,490 So. Santiam So Santiam, So Santiam 39,916 8,653 Quartzville Cr. " 29,535 Mid. Santiam " 5,200 Green Peter Res. 1986 Marion Fks, No Santiam 11,690 Horn Cr. " 48,060 No. Santiam " " 20,404 Pyramid Cr. " 20,420 Quartzville Cr. " 20,273 31,232 Green Peter Res. " 12,617 So. Santiam So Santiam, So Santiam 14,175 So. Santiam 1987 Marion Fks, No Santiam 110,102 No. Santiam " " 532 Green Peter Res. 1988 Marion Fks, No Santiam 116,745 No. Santiam 1989 Marion Fks, No Santiam 85,490 No. Santiam 1990 Marion Fks, No Santiam 93,442 No. Santiam ________________________________________________________________________________

154
APPENDIX B Summer Steelhead
Table B-1. Releases of Skamania stock hatchery summer steelhead in the Santiam subbasin by release site (ODFW, unpublished data). ______________________________________________________________________________ Release Number released year Hatchery Fingerlings Smolts Release location ______________________________________________________________________________ 1976 Alsea 106,690 No. Santiam Roaring River 163,560 So. Santiam South Santiam 40,970 Minto 41,129 No. Santiam 110,304 So. Santiam 1977 Alsea 106,987 Santiam Roaring River 41,771 No. Santiam 41,310 So. Santiam 2,750 Roaring River South Santiam 7,191 Sunnyside Pk.Pd. 19,838 No. Santiam 122,907 So. Santiam 1978 Alsea 53,324 No. Santiam 77,298 So. Santiam Roaring River 5,986 Roaring River 41,370 No. Santiam 41,732 So. Santiam 1979 Alsea 100,503 No. Santiam Roaring River 58,824 Santiam 68,949 So. Santiam 7,725 Roaring River South Santiam 26,638 84,542 No. Santiam 80,152 So. Santiam 1980 Alsea 85,673 No. Santiam 40,008 So. Santiam Roaring River 18,654 Santiam 39,995 No. Santiam 41,052 So. Santiam 6,116 Roaring River South Santiam 93,551 No. Santiam 97,614 So. Santiam 1981 Alsea 81,665 No. Santiam 42,218 So. Santiam Oak Springs 45,157 No. Santiam Roaring River 41,631 No. Santiam 40,138 So. Santiam South Santiam 18,701 No. Santiam 63,321 So. Santiam 1982 Oak Springs 64,998 No. Santiam Roaring River 40,335 No. Santiam 36,140 So. Santiam South Santiam 64,980 30,272 No. Santiam 36,733 109,061 So. Santiam Trojan Ponds 30,305 No. Santiam ______________________________________________________________________________ (continued)

155
Table B-1 continued. ______________________________________________________________________________ Release Number released year Hatchery Fingerlings Smolts Release location ______________________________________________________________________________ 1983 Gnat Creek 43,827 No. Santiam McKenzie 35,269 No. Santiam Roaring River 17,898 Little No. Santiam 55,078 No. Santiam South Santiam 20,940 134,176 No. Santiam 57,209 126,524 So. Santiam 1984 Marion Forks 13,420 No. Santiam Roaring River 25,736 Little No. Santiam 30,294 No. Santiam South Santiam 35,550 No. Santiam 25,173 139,235 So. Santiam Willamette 68,542 No. Santiam 1985 McKenzie 41,168 No. Santiam Roaring River 17,748 Little No. Santiam 116,503 No. Santiam South Santiam 33,406 157,671 No. Santiam 140,587 So. Santiam 1986 McKenzie 39,977 No. Santiam Roaring River 30,303 12,524 Little No. Santiam 102,133 No. Santiam South Santiam 2,768 149,727 So. Santiam 604 Green Peter Reservoir 1987 McKenzie 38,622 No. Santiam Roaring River 20,073 Little No. Santiam 51,467 No. Santiam Willamette 83,048 No. Santiam 160,043 So. Santiam 1988 McKenzie 29,700 No. Santiam Roaring River 22,578 Little No. Santiam 91,609 No. Santiam South Santiam 40,700 No. Santiam 160,950 So. Santiam 1989 McKenzie 40,091 No. Santiam Roaring River 110,051 No. Santiam South Santiam 15,181 Little No. Santiam 20,007 No. Santiam 160,102 So. Santiam 1990 McKenzie 41,424 No. Santiam Roaring River 20,024 Little No. Santiam 103,688 No. Santiam South Santiam 31,625 No. Santiam 163,727 So. Santiam ______________________________________________________________________________

156
APPENDIX C Spring Chinook
Table C-1. Releases of hatchery spring chinook in the Santiam and Calapooia subbasins (ODFW, unpublished data). Release Number released Release year Hatchery Fry Fingerlings Smolts location 1958 Marion Forks 51,815 Little No. Santiam 134,895 North Santiam South Santiam 182,657 South Santiam 19,992 Wiley Creek 33,705 Quartzville Creek 1959 Marion Forks 512,080 1,615,632 North Santiam 200,000 Little No. Santiam South Santiam 62,967 South Santiam 1960 Marion Forks 1,092,163 North Santiam South Santiam 81,925 South Santiam 1961 Marion Forks 1,810,841 North Santiam South Santiam 273,140 South Santiam 1962 Marion Forks 1,415,536 North Santiam South Santiam 154,118 Middle Santiam 1963 Marion Forks 1,503,305 North Santiam South Santiam 157,893 South Santiam 1964 Marion Forks 1,225,857 North Santiam 747,790 Big Cliff Res. 1,677,427 Horn Creek South Santiam 147,751 Middle Santiam 1965 Marion Forks 1,934,146 North Santiam 8,644 Horn Creek 1966 Marion Forks 1,212,927 161,884 North Santiam 32,125 Dry Creek 36,066 Big Cliff Res. South Santiam 147,026 Middle Santiam 1967 Marion Forks 2,108,793 North Santiam South Santiam 146,607 Middle Santiam Willamette 267,746 South Santiam (continued)

157
Table C-1 continued. Release Number released Release year Hatchery Fry Fingerlings Smolts location 1968 Marion Forks 2,408,234 141,912 North Santiam 312,908 Canal Fork 596,496 Quartzville Cr. 88,128 Packers Gulch Cr. 87,423 Yellowstone Cr. 602,403 Middle Santiam South Santiam 147,781 Middle Santiam 190,148 Green Peter Res. 246,450 South Santiam Willamette 31,710 South Santiam 1969 Marion Forks 649,276 77,473 North Santiam 102,521 Quartzville Cr. 102,000 15,310 South Santiam South Santiam 274,010 Green Peter Res. 53,322 70,955 South Santiam Willamette 148,000 Quartz Creek 220,173 Green Peter Res. 1970 Marion Forks 1,310,299 88,574 Minto Dam 352,730 North Santiam 791,302 Quartzville Cr. 373,877 Packers Gulch Cr. 384,203 Canal Creek 2,647,210 15,443 Green Peter Res. 5,338 South Santiam South Santiam 650,840 Green Peter Res. 214,114 335,176 South Santiam 1971 Marion Forks 346,084 248,066 North Santiam South Santiam 1,401,581 Green Peter Res. 19,865 Foster Res. 285,451 South Santiam 1972 Marion Forks 1,029,832 73,792 Minto Dam South Santiam 463,217 Green Peter Res. 141,815 South Santiam Willamette 2,074,174 Green Peter Res. 1973 Marion Forks 668,907 345,976 Minto Dam South Santiam 338,955 Green Peter Res. 38,469 South Santiam Willamette 210,433 Green Peter Res. (continued)

158
Table C-1 continued. Release Number released Release year Hatchery Fry Fingerlings Smolts location 1974 Marion Forks 632,143 397,777 Minto Dam South Santiam 411,620 Moose Creek 1,127,996 Green Peter Res. 152,687 198,632 South Santiam Willamette 215,068 Foster Dam 1975 Marion Forks 1,322,053 683,293 Minto Dam South Santiam 332,235 South Santiam Willamette 1,818,961 Green Peter Res. 1976 Marion Forks 667,117 Minto Dam 248,050 245,181 North Santiam South Santiam 105,363 South Santiam 1977 Marion Forks 100,916 293,760 North Santiam South Santiam 199,816 South Santiam 1978 Marion Forks 2,208 Detroit Res. 340,941 359,182 North Santiam 1979 Marion Forks 961,273 North Santiam 676,057 Green Peter Res. South Santiam 106,821 South Santiam 1980 Marion Forks 881,847 North Santiam 321,030 74,652 Green Peter Res. South Santiam 258,489 South Santiam 1981 Marion Forks 153,567 441,225 North Santiam South Santiam 214,532 South Santiam Willamette 1,557,634 271,057 Green Peter Res. 244,506 South Santiam 3,624 Calapooia River 1982 Marion Forks 187,121 473,021 North Santiam South Santiam 237,531 South Santiam Willamette 2,258,035 Green Peter Res. 252,207 South Santiam McKenzie 41,540 Green Peter Res. 25,439 Calapooia River (continued)

159
Table C-1 continued. Release Number released Release year Hatchery Fry Fingerlings Smolts location 1983 Marion Forks 153,112 Little No. Santiam 80,150 427,350 557,255 North Santiam 151,250 Thomas Creek 108,228 Middle Santiam 174,900 Foster Res. 210,700 South Santiam South Santiam 394,280 South Santiam Willamette 150,160 Crabtree Creek 1,999,180 Green Peter Res. 251,241 South Santiam 100,094 Calapooia River Dexter 161,263 North Santiam 24,868 Calapooia River 1984 Marion Forks 627,781 North Santiam 28,421 Horn Creek South Santiam 302,738 South Santiam Willamette 204,160 Little No. Santiam 196,014 5,950 Crabtree Creek 115,994 53,666 Thomas Creek 1,999,713 Green Peter Res. 145,517 55,596 South Santiam 149,845 Calapooia River Dexter 172,177 South Santiam McKenzie 200,760 South Santiam 1985 Marion Forks 361,377 North Santiam 13,929 Horn Creek South Santiam 279,363 South Santiam Willamette 150,478 Thomas Creek 1,893,430 106,750 Green Peter Res. 150,322 46,308 94,102 South Santiam 200,276 Calapooia River Dexter 573,446 South Santiam 20,821 Calapooia River Stayton Pond 2,964 5,287 North Santiam 1986 Marion Forks 475,134 North Santiam South Santiam 255,864 South Santiam Willamette 500,240 Green Peter Res. 420,200 104,494 South Santiam Dexter 515,854 South Santiam (continued)

160
Table C-1 continued. Release Number released Release year Hatchery Fry Fingerlings Smolts location 1987 Marion Forks 497,745 North Santiam 33,316 South Santiam South Santiam 74,953 South Santiam Willamette 228,216 South Santiam Dexter 166,700 South Santiam 1988 Marion Forks 557,671 North Santiam South Santiam 166,212 South Santiam Willamette 763,645 South Santiam 1989 Marion Forks 496,474 North Santiam 15,576 South Santiam South Santiam 226,656 South Santiam Willamette 884,573 South Santiam 1990 Marion Forks 450,352 North Santiam South Santiam 246,347 South Santiam Willamette 693,993 South Santiam

161
APPENDIX D Fall Chinook
Table D-1. Releases of hatchery fall chinook in the Santiam and Calapooia subbasins by release site (ODFW, unpublished data). Release Number released Release year Hatchery Fry & Fingerlings Smolts location 1965 Bonneville 800,000 South Santiam R. Ox Bow 860,790 North Santiam R. 1966 Big Creek 500,187 North Santiam R. Cascade 350,000 North Santiam R. Ox Bow 499,994 South Santiam R. 1967 Bonneville 500,000 Thomas Creek 2,000,000 South Santiam R. 485,000 Calapooia R. Cascade 504,432 North Santiam R. 785,000 Calapooia R. Ox Bow 795,000 Little No. Santiam 408,000 North Santiam R. 396,000 Stout Creek 1968 Big Creek 114,070 Santiam R. 257,298 South Santiam R. Bonneville 172,572 North Santiam R. 100,076 Stayton Pond 511,274 Santiam R. 495,658 South Santiam R. Cascade 521,400 North Santiam R. 1,254,815 Calapooia R. Salem Pond 1,741,317 Mill Creek 1969 Big Creek 246,140 South Santiam R. Sandy 48,876 Foster Reservoir Salem Pond 1,248,796 Mill Creek Stayton Pond 29,459 North Santiam R. 1970 Aumsville Ponds 4,899,780 South Santiam R. Salem Pond 380,525 Mill Creek Stayton Pond 4,120,074 North Santiam R. 1971 Aumsville Ponds 792,238 4,531,460 North Santiam R. Salem Pond 10,080 464,693 Mill Creek Stayton Pond 3,737,296 North Santiam R. (continued)

162
Table D-1 continued. Release Number released Release year Hatchery Fry & Fingerlings Smolts location 1972 Aumsville Ponds 3,758,318 South Santiam R. 106,296 Mill Creek Salem Pond 867,790 Mill Creek Stayton Pond 3,831,618 Stayton Pond 1973 Aumsville Ponds 3,391,307 South Santiam R. 1,541,660 Mill Creek Salem Pond 1,749,294 Mill Creek Stayton Pond 4,365,456 North Santiam R. 1974 Aumsville Ponds 2,386,835 Mill Creek 1,477,388 South Santiam R. Stayton Pond 4,019,625 North Santiam R. 1,512,154 South Santiam R. 1975 Aumsville Ponds 1,409,793 Mill Creek 3,977,710 North Santiam R. 2,034,782 Crabtree Creek 1976 Aumsville Ponds 1,170,048 Crabtree Creek 163,222 South Santiam R. Stayton Pond 62,700 Crabtree Creek 873,561 South Santiam R. 1977 Aumsville-Stayton Pond 259,075 Mill Creek 1979 Stayton Pond 421,353 North Santiam R. 380,645 Santiam R. 1,862,860 South Santiam R. 1980 Stayton Pond 263,225 Santiam R. 71,065 713,655 North Santiam R. 382,525 Santiam R. 2,189,665 South Santiam R. 1981 Aumsville-Stayton Pond 393,087 Santiam R. 1,325,094 North Santiam R. 1,858,481 South Santiam R. 1982 Stayton Pond 1,368,866 North Santiam R. 398,020 Santiam R. 2,300,940 South Santiam R. 1983 Stayton Pond 1,885,821 Mill Creek 1,460,531 North Santiam R. 77,507 Santiam R. 1,851,156 South Santiam R. (continued)

163
Table D-1 continued. Release Number released Release year Hatchery Fry & Fingerlings Smolts location 1984 Stayton Pond 614,118 Mill Creek 1,197,007 North Santiam R. 1,404,450 South Santiam R. 1985 Stayton Pond 624,951 Mill Creek 70,379 North Santiam R. 1986 Stayton Pond 1,021,959 Mill Creek 1,207,099 North Santiam R. 813,522 South Santiam R. 1987 Stayton Pond 1,010,995 Mill Creek 1,137,846 Santiam R. 1,543,769 South Santiam R. 1988 Stayton Pond 904,387 Mill Creek 855,508 Santiam R. and North Santiam R. 1,448,118 South Santiam R. 1989 Stayton Pond 521,371 Mill Creek 971,932 Santiam R. and North Santiam R. 1,270,355 South Santiam R. 1990 Stayton Pond 1,002,457 Mill Creek 613,776 Santiam R. and North Santiam R. 1,212,604 South Santiam R.

164
APPENDIX E Trout
Table E-1. Population estimates of rainbow trout in the Blowout Creek system, 1980 (Wetherbee and Hunt 1982). ______________________________________________________________________ Miles of No. of Fish per Stream fish production trout mile ______________________________________________________________________ Blowout Cr. 9.5 3,879 408 Beard Cr. 0.9 0 0 Kay Cr. 1.4 24 17 Cliff Cr. 2.1 388 185 Little Cliff Cr. 0.5 0 0 Divide Cr. 2.6 96 37 tributaries 0.5 0 0 Ivy Cr. 2.1 563 268 Lost Cr. 0.5 0 0 Total 20.1 4,950 246 ______________________________________________________________________ Table E-2. Population estimates of rainbow trout in the Quartzville Creek drainage, 1982 (J.J. Wetherbee, ODFW, unpublished data). ___________________________________________________________________________ No. of Fish per Density Stream and site fish mile (fish/m2) ___________________________________________________________________________ Packer's Gulch RM 0.1 7 272 0.02 RM 2.1 6 160 0.01 Canal Creek RM 0.1 24 944 0.07 Elk Creek RM 0.7 5 112 0.01 RM 0.9 2 64 0.01 RM 1.1 10 160 0.02 RM 2.1 1 32 <0.01 RM 2.2 0 0 0.00 RM 2.6 0 0 0.00 ___________________________________________________________________________

165
Table E-3. Population estimates of trout in the Middle Santiam drainage, 1979 (unpublished data in letter from P. Bisson to W. Hunt, ODFW, Salem, Oregon). ________________________________________________________________________ Reach length No. Fish/mile Site (miles) Ct Rb/St Ct Rb/St ________________________________________________________________________ Upper Bear Cr. (old growth) 0.031 65 50 2,092 1,609 Bear Cr. tributary (clear cut) 0.031 57 24 1,835 772 Lower Bear Cr. (old growth) 0.031 31 19 998 612 Mid. Santiam R. near mouth of Bear Cr. 0.057 3 12 53 212 pool nr. mouth of Bear Cr. 0.015 4 10 268 671 ________________________________________________________________________ Table E-4. Population estimates of trout in the Middle Santiam River, 1988-89 (K. Moore, Oregon State University, unpublished data). ___________________________________________________________________________ Fish per mile Species Reach fry adults compositiona ___________________________________________________________________________ Lower (RM 15-23) 80 192 2/3 Rb, 1/3 Ct Middle (RM 23-29) 80 368 Upper (RM 29-36) 240 608 1/3 Rb, 2/3 Ct ___________________________________________________________________________ a Rb = rainbow trout, Ct = cutthroat trout. Table E-5. Age specific length data for rainbow trout in Blowout Creek, 1980 (Hunt 1982 and Wetherbee and Hunt 1982). ___________________________________________________________________________ Age Size range Mean length Age at class N (inches) (inches) legal size ___________________________________________________________________________ I 40 3.1-5.9 4.6 II 31 3.9-10.1 6.1 2 III 1 7.3 7.3 IV 3 6.9-7.5 7.2 ___________________________________________________________________________
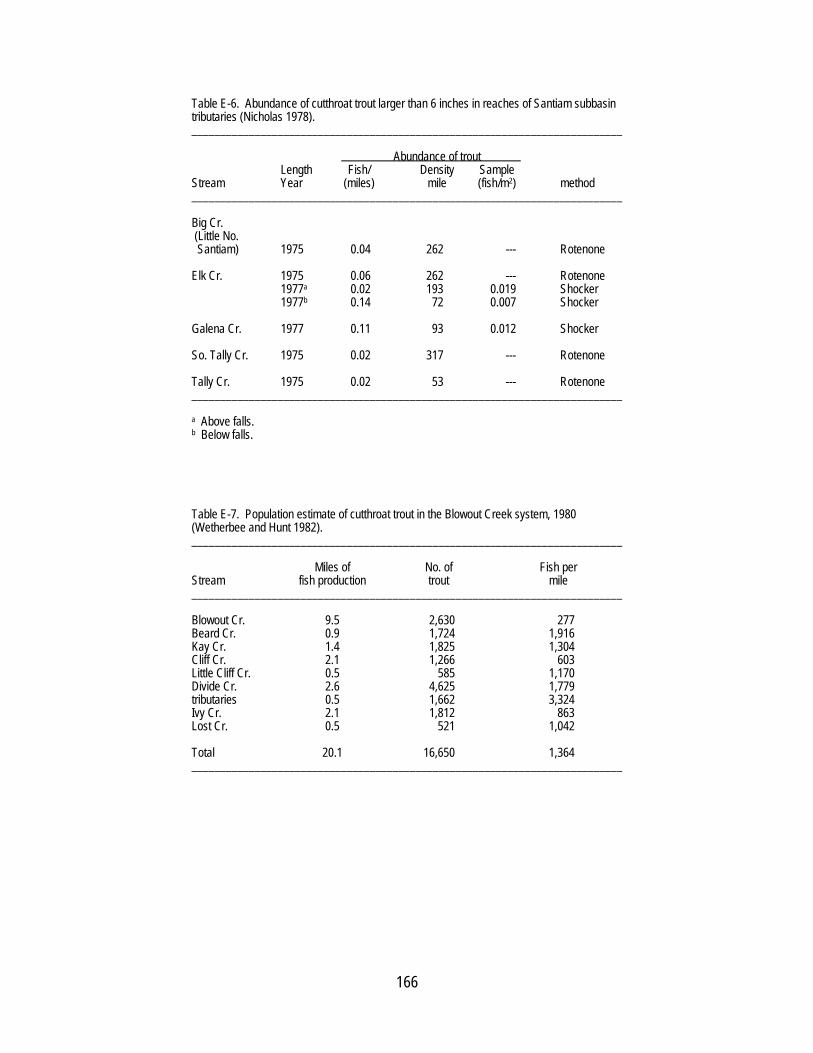
166
Table E-6. Abundance of cutthroat trout larger than 6 inches in reaches of Santiam subbasin tributaries (Nicholas 1978). ___________________________________________________________________________ Abundance of trout Length Fish/ Density Sample Stream Year (miles) mile (fish/m2) method ___________________________________________________________________________ Big Cr. (Little No. Santiam) 1975 0.04 262 --- Rotenone Elk Cr. 1975 0.06 262 --- Rotenone 1977a 0.02 193 0.019 Shocker 1977b 0.14 72 0.007 Shocker Galena Cr. 1977 0.11 93 0.012 Shocker So. Tally Cr. 1975 0.02 317 --- Rotenone Tally Cr. 1975 0.02 53 --- Rotenone ___________________________________________________________________________ a Above falls. b Below falls. Table E-7. Population estimate of cutthroat trout in the Blowout Creek system, 1980 (Wetherbee and Hunt 1982). ___________________________________________________________________________ Miles of No. of Fish per Stream fish production trout mile ___________________________________________________________________________ Blowout Cr. 9.5 2,630 277 Beard Cr. 0.9 1,724 1,916 Kay Cr. 1.4 1,825 1,304 Cliff Cr. 2.1 1,266 603 Little Cliff Cr. 0.5 585 1,170 Divide Cr. 2.6 4,625 1,779 tributaries 0.5 1,662 3,324 Ivy Cr. 2.1 1,812 863 Lost Cr. 0.5 521 1,042 Total 20.1 16,650 1,364 ___________________________________________________________________________

167
Table E-8. Cutthroat population estimates in the Quartzville Creek drainage, 1977 and 1982 (M. Montgomery, ODFW, unpublished data and J.J. Wetherbee, ODFW unpublished data). ___________________________________________________________________________ No. of Fish per Density Stream and site fish mile Fish/m2 g/m2 ___________________________________________________________________________ Packer's Gulcha RM 0.1 0 0 0.00 RM 2.1 40 1,040 0.10 Canal Creeka RM 0.1 2 80 0.01 Elk Creekb 59 230 0.04 1.30 RM 0.7a 10 224 0.02 RM 0.9a 26 752 0.11 RM 1.1a 54 832 0.10 RM 2.1a 25 784 0.10 RM 2.2a 128 3,984 0.60 RM 2.6a 153 6,352 1.20 Galena Creekb 71 410 0.08 1.79 ___________________________________________________________________________ a From J.J. Wetherbee, ODFW, unpublished data for 1982. b From M. Montgomery, ODFW, unpublished data for 1977. Table E-9. Modified Schnabel population estimate of legal sized cutthroat trout (>6 inches) in the Santiam River, computed from tag and recapture trips, late March to late June 1976 and 1977 (modified from Moring 1977). ___________________________________________________________________________ 1976 1977 ___________________________________________________________________________ Reach length surveyed RM 0.0-6.0 RM 0.0-9.5 Population estimate 316 350 Poisson confidence limits 226-508 235-690 Fish/mile and confidence limits () 52.9 36.9 (37.8-85.1) (24.8-72.6) ___________________________________________________________________________

168
Table E-10. Density (number/m2) of cutthroat trout in forested and clear-cut reaches of Minto Creek, Linn County (C. Frissell, Oregon State University, unpublished data). ___________________________________________________________________________________________ Reach Stream length No. No. fish Fish/ Fish >6" Area Density Year reach (mi) fish >6" mile per mile (m2) (fish/m2) ___________________________________________________________________________________________ 1984a Forested 0.08 36 6 450 6 691 0.05 Clear-cut 0.08 34 4 425 50 829 0.04 1985b Forested 0.08 51 11 640 135 541 0.09 Clear-cut 0.09 54 11 600 120 776 0.07 1986b Forested 0.10 99 26 990 220 866 0.11 Clear-cut 0.12 87 26 725 215 1,046 0.08 1987b Forested 0.10 85 16 850 160 866 0.10 Clear-cut 0.12 105 27 875 225 1,046 0.10 1988b Forested 0.10 83 18 830 180 866 0.10 Clear-cut 0.12 87 21 725 175 1,046 0.08 1989b Forested 0.10 88 20 880 200 866 0.10 Clear-cut 0.12 64 10 980 85 1,046 0.06 1990b Forested 0.10 98 15 980 150 866 0.11 Clear-cut 0.12 85 30 710 250 1,046 0.08 1985-90 Average: Forested 0.10 84 18 860 180 812 0.10 Clear-cut 0.12 80 21 770 180 962 0.08 ___________________________________________________________________________________________ a Data from electroshocking surveys. b Data from visual observations supplemented by some electroshocking.

169
Table E-11. Population estimates of cutthroat trout in the Calapooia subbasin based on electrofishing surveys (J.J. Wetherbee, ODFW, unpublished data). ______________________________________________________________________ Reach Size length No. range Stream Date (miles) fish (inches) ______________________________________________________________________ Courtney Cr. 10/29/79 0.006 1 --- Warren Cr. 10/29/79 0.019 1 5.8 West Brush Cr. 9/11/79 0.019 5 4.3-6.8 East Brush Cr. 12/22/78 0.062 3 5.6-7.4 9/11/79 0.066 44 1.9-7.8 Cork Boot Cr. 8/2/78 0.031 15 2.6-7.4 12/22/78 0.031 3 6.1-7.3 9/11/79 0.028 21 2.4-6.4 Bigs Cr. 5/2/78 0.016 1 3.5 Hands Cr. 5/2/78 0.031 11 3.1-6.5 E. Fk. Potts Cr. 9/12/79 0.019 22 <2.8-7.0 W. Fk. Potts Cr. 9/12/79 0.019 9 <2.8-4.0 N. Fk. Calapooia 6/22/79 0.065 7 1.4-5.6 Calapooia R. 6/22/79 0.067 15 5.3 (headwaters) 9/11/79 0.028 3 2.8-6.7 ______________________________________________________________________

170
Table E-12. Cutthroat trout population age structure in Santiam and Calapooia subbasin streams (Moring and Youker 1979). ___________________________________________________________________________ Subbasin and Age at Age stream legal size N 0 1 2 3 ___________________________________________________________________________ North Santiam Fish Cr. unknown 2 0 1 1 0 Rock Cr. unknown 3 0 3 0 0 Total 5 0 4 1 0 % -- 0 80.0 20.0 0 South Santiam Church Cr. 2 4 0 0 3 1 Lewis Cr. unknowna 1 0 0 1 0 Marita Cr. unknown 1 0 1 0 0 Moose Cr. 2-3 84 0 19 55 10 Morgan Cr. unknown 1 0 1 0 0 Packer's Gulch 1-2 4 0 1 3 0 Rock Cr. 2 5 0 2 3 0 Sheep Cr. unknown 1 0 1 0 0 Soda Fk. 2-3b 147 0 75 61 11 Toad Cr. unknown 5 1 1 3 0 Total 254 1 101 130 22 % -- 0.4 39.8 51.2 8.7 Thomas Cr. Anderson Cr. 2-3 4 0 0 4 0 Burmester Cr. 2 1 0 0 1 0 Criminal Cr. 2-3 10 1 1 7 1 Hall Cr. 2 3 0 0 3 0 Indian Prairie Cr. unknown 4 2 2 0 0 Wade Cr. unknowna 22 8 11 3 0 Total 44 11 14 18 1 % -- 25.0 31.8 40.9 2.3 Calapooia River Bigs Cr. unknown 1 0 1 0 0 Cork Boot Cr. 2 14 2 3 7 2 E. Brush Cr. 2-3 2 0 0 1 1 Hands Cr. 2 9 0 5 4 0 Total 26 2 9 12 3 % -- 7.7 34.6 46.2 11.5 ___________________________________________________________________________ a Probably age 2. b Primarily age 3.

171
Table E-13. Comparison of age structure of cutthroat trout populations in large rivers in the Santiam subbasin (Moring and Youker 1979). ___________________________________________________________________________ Age at legal Age River size N 0 1 2 3 4 5 6 ___________________________________________________________________________ Santiam 2 250 0 13 178 43 15 1 0 % 0.0 5.2 71.2 17.2 6.0 0.4 0.0 No. Santiam 2 64 0 2 24 29 8 0 1 % 0.0 3.1 37.5 45.3 12.5 0.0 1.6 So. Santiam 2 66 0 2 23 26 12 3 0 % 0.0 3.0 34.8 39.4 18.2 4.5 0.0 Total 0 17 225 98 35 4 1 % 0.0 4.5 59.2 25.8 9.2 1.1 0.3 ___________________________________________________________________________ Table E-14. Age specific length data for cutthroat trout in Blowout Creek, 1980 (modified from Hunt 1982). ___________________________________________________________________________ Age Size range Mean Age at class N (inches) length legal size ___________________________________________________________________________ I 58 3.1-6.2 4.3 II 101 4.1-8.7 5.7 2, 3 III 19 5.9-8.7 7.0 IV 2 7.4-8.7 8.1 ___________________________________________________________________________

172
Table E-15. Size class distribution of cutthroat trout in Minto Creek, Linn County, 1984-89 (C. Frissell, Oregon State University, unpublished data). ___________________________________________________________________________ No. fish and % () of total by size (in) Year Reach N 0-2.3 2.4-3.9 4.0-5.5 5.6-12.0 ___________________________________________________________________________ 1984a Forested 36 3 (8) 20 (56) 7 (19) 6 (17) Clear-cut 29 0 (0) 11 (38) 14 (48) 4 (14) 1985b Forested 51 9 (18) 17 (33) 14 (27) 11 (22) Clear-cut 54 11 (20) 17 (31) 15 (28) 11 (20) 1986b Forested 99 18 (18) 32 (32) 23 (23) 26 (26) Clear-cut 85 4 (5) 21 (25) 34 (40) 26 (31) 1987b Forested 118 17 (14) 55 (47) 30 (25) 16 (14) Clear-cut 123 20 (16) 48 (39) 28 (23) 27 (22) 1988b Forested 83 11 (13) 27 (33) 27 (33) 18 (22) Clear-cut 87 14 (16) 20 (23) 32 (37) 21 (24) 1989b Forested 88 30 (34) 16 (18) 22 (25) 20 (23) Clear-cut 64 5 (8) 19 (30) 30 (47) 10 (16) 1990b Forested 98 25 (26) 35 (36) 23 (23) 15 (15) Clear-cut 85 12 (14) 26 (31) 17 (20) 30 (35) 1985-90 Average: Forested 90 18 (20) 30 (23) 23 (26) 18 (20) Clear-cut 83 11 (13) 25 (30) 26 (31) 21 (25) ___________________________________________________________________________ a Data from electroshocking surveys. b Data from visual observations supplemented by some electroshocking.

173
Table E-16. Age specific lengths for cutthroat trout from the Santiam River (n=230), 1976-78 (Moring 1978). ___________________________________________________________________________ Fork length range Age (inches) ___________________________________________________________________________ 1 5.1-6.3 2 4.7-10.6 3 5.5-12.2 4 6.3-15.0 ___________________________________________________________________________ Table E-17. Age specific length ranges for cutthroat in large rivers and drainage systems of the Santiam and Calapooia subbasins (Moring and Youker 1979). ___________________________________________________________________________ Stream or Fork length range (inches) at age drainage 1 2 3 4 5 6 ___________________________________________________________________________ Santiam R. 5.1-6.7 4.9-9.6 5.6-12.2 6.5-15.2 11.4 --- No. Santiam 4.6-5.1 5.3-11.4 7.1-13.3 11.1-15.7 --- 17.7 R. No. Santiam drainage 4.6-4.8 5.2-8.0 9.8 --- --- --- So. Santiam 6.1-7.2 5.4-9.6 8.0-12.2 10.2-12.5 11.7-12.1 --- R. So. Santiam drainage 2.6-5.4 3.7-7.7 5.9-8.1 --- --- --- Thomas Cr. drainage 4.0-4.4 4.4-7.0 6.8 --- --- --- Calapooia drainage 3.1-4.6 4.4-7.3 5.6-7.3 --- --- --- ___________________________________________________________________________