sandia report - digital library/67531/metadc685055/m2/1/high... · suwey measurements to obtain...
TRANSCRIPT

FEB 9’ i9~
2SANDIA REPORT

.
,
Issued by San&a National Laboratories, operated for the United StatesDepartment of Energy by San&a Corporation.
NOTICE: This report was prepared as an account of work sponsored by anagency of the United States Government. Neither the United States Govern-ment nor any agency thereof, nor any of their employees, nor any of theircontractors, subcontractors, or their employees, makes any warranty,express or implied, or assumes any legal liability or responsibility for theaccuracy, completeness, or usefulness of any information, apparatus, prod-uct, or process disclosed, or represents that its use would not infringe pri-vately owned rights. Reference herein to any specific commercial product,process, or service by trade name, trademark, manufacturer, or otherwise, doesnot necessarily constitute or imply its endorsement, recommendation,or favoring by the United States Government, any agency thereof, or any oftheir contractors or subcontractors. The views and opinions expressedherein do not necessarily state or reflect those of the United States Govern-ment, any agency thereof, or any of their contractors.
Printed in the United States of America. This report has been reproduceddirectly from the best available copy.
Available to DOE and DOE contractors fromOffice of Scientific and Technical InformationPO. BOX 62Oak Ridge, TN 37831
Prices available born (615) 576-8401, FTS 626-8401
Available to the public fromNational Technical Information ServiceU.S. Department of Commerce5285 ~ort Royal RdSpring%eld, VA 22161
NTIS price codesPrinted copy Al 1Microfiche copy AO1
2

DISCLAIMER
Portions of this document may be illegiblein electronic image products. Images areproduced from the best available originaldocument.
SAND99-0173Unlimited Release
Printed February 1999
●
●
Automated Geometric ModelBuilder Using Range Image Sensor
Data: Final Acquisition
Carl DiegertComputer Architectures Department
Sandia National LaboratoriesP.O. BOX5800
Albuquerque, NM [email protected]. gov
John SackosFiring Set & Mechanical DesignSandia National Laboratories
P.O. BOX 5800Albuquerque, NM 87185-1109
Abstract
This report documents a data collection where we recorded redundant rangeimage data from multiple views of a simple scene, and recorded accuratesurvey measurements of the same scene. Collecting these data was a focus ofthe research project Automated Geometric Model Builder Using RangeImage Sensor Data (96-0384), supported by Sandia’s Laboratory-DirectedResearch and Development (LDRD) Program during fiscal years 1996, 1997,and 1998. The data described here are available from the authors onCDROM, or electronically over the Internet. Included in this data distributionare Computer-Aided Desi@ (CAD) models we constructed from the surveymeasurements. The CAD models are compatible with the SolidWorks 98 Plussystem, the modern Computer-Aided Design software system that is centralto San&a’s DeskTop Engineering Project (DTEP). Integration of ourmeasurements (as built) with the constructive geometry process of the CADsystem (as designed) delivers on a vision of the research project. This reporton our final data collection will also serve as a final report on the project.
3

Intentionally Left Blank
4

Table of Contents
TABLE OF CONTENTS ................................................................................................................................... 5
INTRODUCTION .............................................................................................................................................. 6
TEST SCENE ................................................................................................................................ ..................... 6
SURVEY MEASUREMENTS .......................................................................................................................... 7
SURVEY MEASUREMENTS .......................................................................................................................... 8
CAD MODELS FROM SURVEY MEASUREMENTS . ............................................................................. 11
RANGE IMAGE MEASUREMENTS ............................................................................................................ 13
CONCLUSION ......................................................................................................................................... ........ 17
REFERENCES ................................................................................................................................................ . 19
b
5

Introduction
Light radar instruments (LADAR) constructed using flood illuminatio~ and using animaging receiver can inexpensively produce abundant information on the shapes of visiblesurfaces in a scene. By recording range images of a static scene from multiple viewpoints,we can record redundant information on the shape and location of the scene’s surfaces. Bystatistically reducing these data, we maybe able to obtain a surface model with accuracymuch greater than is possible when processing a single, best range image view of eachsurface. We may also be able to estimate surface shape and location from multiple viewswithout the single-image biases from multipath ambiguities and other systematic errorsources.
This report describes data we collected in support of experiments with building models fromthe redundant information in multiple range images. We recorded both range images from anexperimental, flood-ihminated LADAR, and recorded survey measurements on the mainsurfmes in the scene. We have also used the survey measurements to build a model of thescene’s major features using a Computer-Aided Design (CAD) software application calledSolidWorks 98 Plus. The CAD environment is a powerful tool for easily computing anddisplaying new views and dimensions as needed when working with the range and surveymeasurements. We archived the CAD models, together with the survey and range imagemeasurements to facilitate subsequent work.
Test Scene
We setup a simple scene, comprising two objects with approximately rectangular, planarfaces, a planar floor, and a planar wall backdrop. We positioned the two objects, a woodenshipping box (box) and a fan coil cooler unit (cooler), so that they would occlude each otherin the various range images we obtained. We setup the scene in a high bay area of Sandia’sbuilding 826. Figure 1 shows the scene, with box, cooler and wall positioned for the datacollection. We acquired the survey and range image data on August 8, 1998.
6
*
●

*
.
b
Figure 1. Simple scene comprising a box object, cooler object, wall, and floor.The left tripod supports Sandia’s range image sensor located at data collectionstation 7. The right tripod supports the Leica electronic theodolite and distance-measuring instrument used to collect survey-quality ground truth.
7

Suwey Measurements
To obtain survey measurements, we occupied a station location with an electronic theodolite(Leica Model TM1 800) equipped with a laser distance meter (Leica Power Disto), Leica b
bracket and software. This instrumentation allowed us to establish a coordinate system withcoordinate origin on the floor directly under the theodolite station, and with three mutuallyorthogonal axes called elevation, northing, and casting. The leveling system in the moderntheodolite establishes the elevation axis to within one arc second of true vertical. Sightingthe number two target marker (the rightmost marker on the wall) through the theodolitetelescope allowed us set establish the northing coordinate perpendicular to elevatio~ andwith the plane formed by elevation and northing intersecting this wall target. The castingcoordinate is, of course, taken perpendicular to the northing-elevation plane. Theconservative accuracy specification for the Power Disto, plus-or-minus 5 millimeters, islarge relative to other errors in the TM1800/Disto system.
File survey/shots. txt, included in our digital archive, gives coordinates of fifteen
points in the scene as a comma-separated variable, text-format file. This information is alsodisplayed in table 1. The fust line of the file (row of the table 1) defines point number 1 atcoordinate (0,0,0). This is the location of a marker on the floor directly under the theodolite.The next five lines of the file give coordinates of five targets arranged in a cross pattern onthe wall behind the box and cooler. The next six lines are coordinates of six stations wesequentially occupied with our range-imaging instrument. We recorded these six stationlocation coordinates at the point where the optical axis of the range-imaging instrument’sreceiver camera lens intersected its external (first) lens surface. The last four lines of the fileare coordinates of target markers, two on the cooler front face, and two on the box front face.
We used a tape measure to record dimensions (in meters) of the wooden box: 1.50 wide,1.12 deep, and 0.79 high, and of the cooler: 1.21 wide, 0.755 deep, and 2.80 high. Height ofthe box excludes the palette between the box and the floor. Distance from top of the box tothe floor was 0.885. Under the cooler was a palette with palette height 0.13. We placed twotarget markers on the front face of the box at height 0.416 from its bottom. We placed twotarget markers on ihe front face of the cooler at height 1.88 from its bottom.
8

Table 1. Coordinates of scene features and observation stations.
Theodolite Station
Wall Target
Range Image Station
Cooler Target
Box Target
Point Easting Northing ElevationLabel (meters) (meters) (meters)
1 0 0 0
2 -0.001 6.479 1.849
3 -1.904 6.541 1.850
4 -3.810 6.596 1.851
5 -1.907 6.549 0.146
6 -1.907 6.534 3.559
7 -2.090 -0.455 1.133
8 -2.772 -3.393 1.655
9 -6.610 -2.383 1.694
10 -8.689 0.360 1.678
11 -9.888 5.756 1.693
12 4.112 0.517 1.666
13 -3.730 3.857 2.086
14 -2.624 4.343 2.083
15 -2.214 2.018 0.755
16 -0.855 2.658 0.747
9

u I w’ r, I
q&JG--@
I
eEl
aaa
Figure Z.Station/target numbering.“ + -(l I <
The TM1 800 theodoIite recorded the source itiormation for these survey measurements inthe Wild Geo Serial Interface (GSJ format [1]. These source data are in filesurvey/ shots.gsi inthe archive. At fust, we used the Leica/Wild Survey EngineeringEnvironment (SEE) software to work with these measurements. This software appears wellsuited for analysis of conventional land surveys, but was awkward for manipulating ourscene measurements. We wrote a short program, gs i 2 c SV, and used it in place of SEE totranslate file shots. gs i file into a comma-separated variable text file shots.txt.
We implemented an optional #s flag argument in the gs i 2 csv program to produce a seriesof files, each in comma-separated variable format, to load the coordinates into theSolidWorks 98 Plus system. For each point in the input, GSI-format file, the optional use ofour gs i2 csv program writes a separate text file. For an input point numbered, say, 13, atcoordinate (casting, northing, elevation) =(10,20,30), the program will write a file namedlinels .sldcrv. This file will comprise two lines, one to define a start point of (0,0,0),and a second to define an end point of (20,60,-40). In general, the first point is always(0,0,0), and the second point’s three coordinate values are: twice the input casting coordinatevalue, twice the input elevation value, and the negative of twice the northing coordinate.From SolidWorks, then, we can introduce the measured coordinate by adding a referencegeometry entity called line throughfiee points by referring to this file. The midpoint of thisreference line is at the surveyed coordinate, given the SolidWorks conventions for fi-ont, top,and right views. The sldcrv files are in archive directory mode 1.
CAD Models from Survey Measurements
The SolidWorks assembly defined in file model/room. sldasm places into correctgeometric relationship the simple scene’s floor (model/floor.sldprt),wall(model/wall.sldprt),cooler (model/cooler.sldprt),box(model/wood_box. sldprt),five wall targets (model/target-disc. sldprt),and six measurement stations (model /stat ion. s ldprt). Figure 2 shows four views ofthese elements, and also shows the numbering of the surveyed points. The floor is taken tobe pefiectly level, and intersecting the (0,0,0) point below the theodolite. The wall is takento be petiectly planar, although is it not quite perpendicular to the floor. The threeorthogonal views that appear in Figure 2 are constructed from a coordinate system definedby the floor plant and the axis formed by the intersection of the floor plane and the wallplane. Note that this coordinate system is not quite coincident with that used to record thesurveyed points in table 1. The fourth view in figure 2 is isometric, and is formed from thesame coordinate system that defines the other three views.
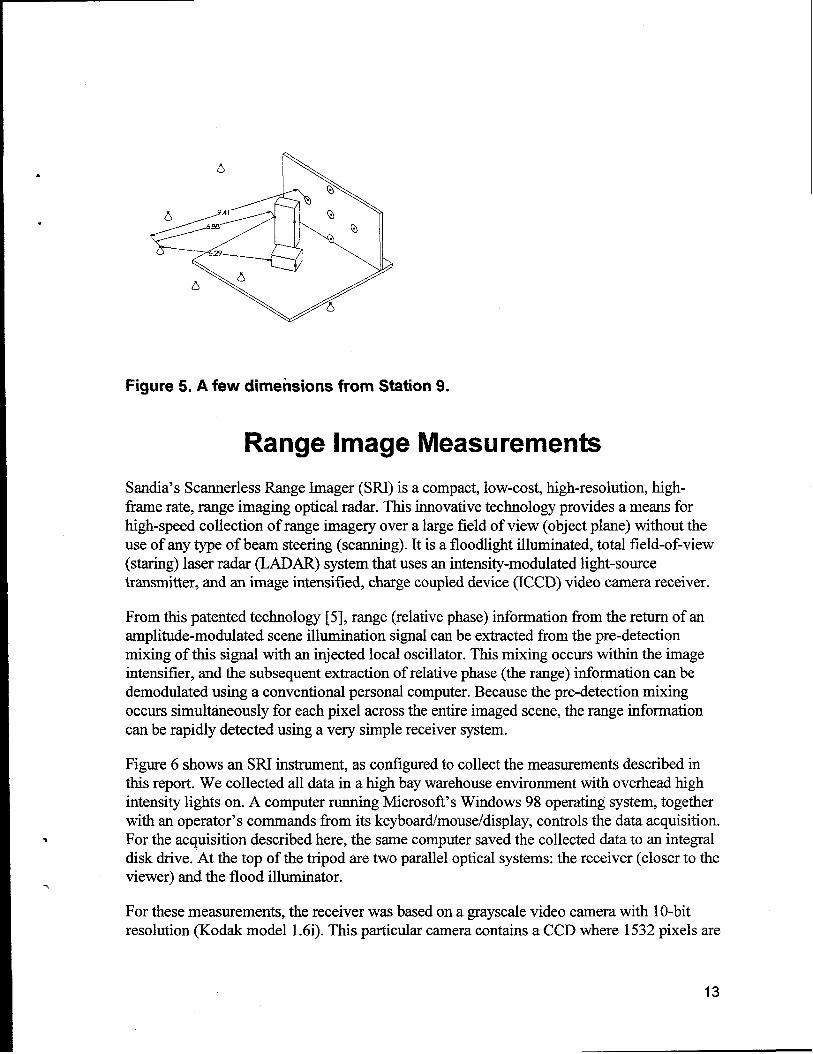
Figures 3,4, and 5 show a few dimensions from the first three observation stations. Alldimensions are in meters. The wall is planar to within measurement error, but is not quiteperpendicular to level. The floor model is petiectly level, but may not correspond preciselyto the actual floor. We placed the floor model at the (0,0,0) coordinate below the theodolitemeasurement station (Station 1).
11

Figure 3. A few dimensions from
Figure 4. A few dimensions from Station 8.
12
.
.
Figure 5. A few dimensions from Station 9.
Range Image Measurements
Sandia’s Scannerless Range Imager (SRI) is a compact, low-cost, high-resolution, high-fia.rne rate, range imaging optical radar. This innovative technology provides a means forhigh-speed collection of range imagery over a large field of view (object plane) without theuse of any type of beam steering (scanning). It is a floodlight illuminated, total field-of-view(staring) laser radar (LADAR) system that uses an intensity-modulated light-sourcetransmitter, and an image intensified, charge coupled device (ICCD) video camera receiver.
From this patented technology [5], range (relative phase) itiormation born the return of anamplitude-modulated scene illumination signal can be extracted from the pre-detectionmixing of this signal with an injected local oscillator. This mixing occurs within the imageintensifier, and the subsequent extraction of relative phase (the range) information can bedemodulated using a conventional personal computer. Because the pre-detection mixingoccurs simultaneously for each pixel across the entire imaged scene, the range informationcan be rapidly detected using a very simple receiver system.
Figure 6 shows an SRI instrument, as conf@red to collect the measurements described inthis report. We collected all data in a high bay warehouse environment with overhead highintensity lights on. A computer running Microsoft’s Windows 98 operating system, togetherwith an operator’s commands from its keyboardlmouse/display, controls the data acquisition.
% For the acquisition described here, the same computer saved the collected data to an integraldisk drive. At the top of the tripod are two parallel optical systems: the receiver (closer to theviewer) and the flood illuminator..
For these measurements, the receiver was based on a grayscale video camera with 10-bitresolution (Kodak model 1.6i). This particular camera contains a CCD where 1532 pixels are
13

in each horizontal row, and 1024 pixels are in each vertical column. The CCD was fiberoptically coupled to a 18mm Litton (formerly, Varo) Generation 111(GaAs) image intensifierto form an intensified charge coupled device (ICCD) assembly. A conventional videocamera lens with 24 mm focal length, F/l.4 aperture, and c-mount imaged the scene ontothis ICCD. The resulting imager had a spatial resolution of approximately 50 lines permillimeter.
The flood illuminator for this data collection was a pulsed, frequency doubled NdYAG laser(model Mini-light 10 from Continuum). It operated at the 532nm (green) wavelength, andproduced 15 nanosecond, 50 millijoules pulses at a 10 Hz pulse repetition rate. Modulation ofthe transmitter and synchronous receiver was at 10 MHz. No filter was used on the receiver,but an electronic shutter was set to open for a few hundred nanoseconds around eachreceived pulse was, thus to limiting the collection of background light. We aligned the laseraxis and diverged its beam to illuminate all but the extreme corners of the scene.
We used temporal averaging, averaging a conservatively large number (30) of sequentiallyobtained range images. This averaging reduced the adverse effects of uncorrelated noise onthe measurement performance of the sensor. A quick, conservative analysis of range imagedata from this sensor shows a range resolution of ten centimeters.
Figure 6. Range imaging instrument.
As a result of the 10 MHz operating frequency, the SRI system measures 2.385 meters perradian (7.827 feet per radkm or 93.924 inches per radian), or 0.419 radians per meter (O.127radians per foot or 0.010 radians per inch). A range ambiguity occurs after a fill (2 Pi)interval, corresponding to 14,9896 meters (49.178 feet). Since the variation in ranges to allobjects in our scene was less than 15 meters, there are no range ambiguities in the recorded
14

.
data. Further, because we did not power cycle or adjust the SKI during the complete datacollection at all six stations, the range measurements have a common (but arbitrary) zerorelative range @base) reference. Accurate, redundant survey measurements on the flat wallsurface (point labels 2, 3,4, 5 and 6) can be used to obtain a precise estimate of the fixedrange offset in the range images.
We tm.nsfemed single images from this camera with an unsigned, 10 bit intensity for eachpixel in this camera’s 1532 by 1024 pixel array. The range imaging process demandsmultiple images, with some processing performed by the controlling computer. For thesemeasurements, we averaged 30 sequential range image measurements to form a single rangeimage archived to disk. Each of these component range images was formed from eightimages with equally spaced phase offsets between the flood illuminator and the phase-sensitive receiver. The scannerless range imaging process is described, for example, in [2].The range image formation and the averaging is all computed using 32-bit, floating-pointarithmetic. As part of forming the range images, we also form a reflectance image. Thelocation of the flood illuminator parallel and to the left of the receiver is apparent in theshadow fea~es in the reflectance images.
Our digital archive of the range and reflectance image information includes six pairs ofimages in a raw data format. In this format, the value of each pixel is a range expressed inradkms and represented by four bytes in the file. The pixel value is represented in the IEEE-standard representation. The pixels appear in row-major order, and there is no header orother information in the file, and no compression. The number of bytes in each of these files,then, is four times their number of pixels, (4)(1532)(1024)= 6,272,072 bytes. For our ownwork with these data, we store these images in tiff format, using both the little-used tiffstandard for storing floating-point pixel values, and using a few of our own extensions toincIude various information into the fiIe headers. We have not included these non-standardversions of the six pairs of images in the archive.
The raw-format reflectance and range images from Station 7 are in archive filessri/raw/cAL 7 REF. raw and sri/raw/CAL ‘7RNG.raw, receptively. As is—— ——clear from the images, the box and cooler objects were not moved into the scene until afterwe acquired the Station 7 data.
The raw-format reflectance and range images from Station 8 are in archive filessri/raw/BOX 8 REF.raw andsri/raw/BOX 8 RNG.raw. Theimages from——Stations 9, 10, 11, and 12, follow this naming, with the station number substituted for the
——
digit 8 in the names.
Tables 2 and 3 show small, low-quality versions of the six range and reflectance images. Toform lightweight reflectance images that most clearly depicted scene features, weinteractively choose a window into the huge dynamic range inherent in the floating-pointpixel values. We then downsampled the images to greatly reduce the number of pixels, andapplied a filter to sharpen the image features.
15

Table 2. Reflectance images from each of six measurement stations afterdownsampling and adjustments.
Station 7.
Station 10
Station 8.
Station 11
Station 9.
Station 12
Table 3. Range images from each of six measurement stations afierdownsampling and adjustments.
Station 7
Station 10
Station 8
Station 11
Station 9
Station 12
16

Conclusion
I
We have not included the field of view and other geometry of the range imager in this reportbecause the specifications on the lens, image intensifier, faceplate, and other components areonly a crude guide to actual imaging characteristics. We anticipate that users of these datawill begin work by building a calibration of the imaging from correspondence of the imagedfeatures with the survey measurements of these features. To date, we have had success withfitting a simple pinhole camera model to interpret these data.
Less usual than dealing with camera calibration is treating the systematic pattern of rangeand reflectance image errors produced by the image intensifier and its fiber optic faceplatecoupling to the CCD. Figure 7 shows a window into the reflectance image from Station 10(archive file photos /box_lO_zoomed. j pg). The faceplate was manufactured by firstarraying bundles of optical fiber, then fising these bundles together. The residual structureof this process, especially the effects at the edges of the bundles, is clearly imprinted on thereflectance image. Systematic errors fkom the faceplate also appear in the range data, ofcourse. Obtaining these measurements with a lower-resolution CCD would suppress theoptical fiber patterns, of course. However, careful processing of the high-resolution data canalso suppress these errors with less severe reduction in spatial resolution. Suppressing thefiber patterns by simultaneous consideration of multiple views of a scene probably demandseven more modeling and processing power that we envision for proper interpretation of thisdata collection.
17

Figure 7. Diamond pattern of systematic error from the fiber optic faceplate isclear in this enhanced view of a portion of reflectance image taken fromStation 10.
This report documents a data collection that recorded redundant range image data frommultiple views of a simple scene, and recorded accurate survey measurements of the samescene. Collecting these data was a focus of the research project Automated Geometric ModelBuilder Using Range Image Sensor Data, supported by Sandia’s Laboratory-DirectedResearch and Development (LDRD) Program during fiscal years 1996, 1997, and 1998. Thedata described here are available from the authors on CDROM, or electronically over theInternet. Included in this data distribution are Computer-Aided Design (CAD) models weconstructed from the survey measurements. The CAD models are compatible with theSolidWorks 98 Plus system, the modem Computer-Aided Design software system that iscentral to Sandia’s DeskTop Engineering Project (DTEP). Integration of our measurements(as built) with the constructive geometry process of the CAD system (as designed) deliverson a vision of the research project. This report on our final data collection will also serve asa final report on the project.
18

References
[1] Wild Instruments On Line: A Guide for connection of WILD instruments to computers; via the Geo Serial Interface (GSI), Leica Heerbrugg AG, CH-9435 Heerbrugg (Switzerland),
11/1994.
v [2] Sackos, John T.; Bradley, Bart D.; Nellurns, Bob; Diegert, Carl. Emerging versatility of ascannerless range imager. Proc. SPIE Vol. 2748, p. 47-60, Laser Radar Technology and
Applications, Gary W. Kamerman; Ed. 6/1996.
[3] Diegert, Carl F.; Sackos, John T.; Nellurns, Robert O. Building accurate geometricmodelsfiom abundant range ima@g information. Proc. SPIE Vol. 3065, p. 428-434, Laser
Radar Technology and Applications 11,Gary W. Kamerman; Ed. 8/1997.
[4] Sandia National Laboratories, Technology Transfer Opportunity- Scannerless Rangelivaging System, Commerce Business Daily, 9/30/1994.
[5] Scott, M. W., Range Imaging Laser Radar, U.S. Patent 4,935,616, 6/19/1990.
[6] Anthes, J. P., P. Garcia, et al., Non-scannedLADAR Imaging and Applications, AppliedLaser Radar Technology, Proceedings of SPIE, v. 1936, 1993.
[7] Garcia, P., J. P. Anthes, et al., Characterization of a Scannerless LADAR System,Applied Laser Radar Technology, Proceedings of SPIE, v. 1936, 1993.
[8] M. M. Lecavalier, et al., “Scannerless Range Imaging with a Square Wave,” Guidanceand Navigation - Applied Laser Radar Technology II, Proceedings of SPIE, 1995.
[9] Ken Frazier, Innovative Range Imager Sees How Targets Measure Up, SandiaLaboratory News, Vol. 46, No. 19, 9/16/1994.
[10] Cress, D. H. and M. M. Lecavalier, Fusion of LADAR with SAR for Precision Strike,Proceedings from the Eighth National Symposium on Sensor Fusion, 1995.
[11] Shepherd, O., L LePage, G. Wyntjes, T. Zehnpfenning, J. Sackos, R. Nellurns, CounterSniper 3-D Laser Radar Phase ISTTR Final Technical Report, DARPA Contract No.DAAHO1-96-C-R199, 9/16/1997.
[12] Fuchs. E., M. Bonin, J. Sackos, C. Smith, D. Goldstein, N. Rhymarchyk, Jr., OpticalSensors and Controls for Improved Basic @ygen Furnace Operation: Lance-Based
* Temperature Measurement and Laser Radar Contouring, Presented at the 1997 AISEAnnual Convention and Iron and Steel Exposition, Cleveland, OH, 9/29/1997 – 10/2/1997.
-,[13] Capt. M. Keltos, Demonstration of Imaging LADAR for Battle Damage Indication,Meeting of the IRIS Specialty Group on Active Systems, Albuquerque, NM, 3/1998.
19
[14] Pletta. J. B., J.T. Sackos, An Advanced Uninanned Vehicle for Remote Applications,Sandia Report SAND98-0562, 3/1998.
[15] Fuchs. E., D. Hardesty, M. Benin, J. Sackos, C. Smith, D. Goldstein, N. Rhymarchyk,Jr., Update of the BOF Lance-Based Temperature and Range/Contour Measurement.Presented at the 1SS Cotierence, Toronto Ontario, Canada, 3/22-25/1998.
[16] Sackos, John T.; Nellums, Robert O.; Lebien, Steve M.; Diegert, Carl F.; Grantham,Jeff W.; Monson, Todd. Low-cost high-resolution video-rate imaging optical radar. Proc.SPIE Vol. 3380, p. 327-342, Laser Radar Technology and Applications Ill, Gary W. Kamerman; Ed.
9/1998.
[17] Fuchs, E., M. Benin, J. Sackos, C. Smith, D. Goldstein, N. Rhymarchyk, Jr., OpticalSensors and Controis for Improved Basic Oxygen Furnace Operatio?% Lance-BasedTemperature Measurement and Laser Radar Contouring, Reviewed and accepted forpublication in Iron and Steel Engineer.
[18] Sackos, John T.; Bradley, Bart D.; Diegert, Carl F.; M% Paul W.; Gary, Charles.Scannerless terrain mapper. Proc. SPIE Vol. 2810, p. 144-153, Space Sciencecraft Control and
Tracking in the New Millennium, E. Kane Casani; Mark A. Vander Doeq Eds. 10/1996.
Distribution.1 MS 0188 Donna Chavez (LDRD Office)1 MS 9018 Central Technical Files, 8940-22 MS 0899 Technical Library, 4916 +2 MS 0619 Review &Approval Desk, 15102
For DOE/OSTl10 MS 0328 John Sackos10 MS 1109 Carl IXegert
20