sana akbar khan adoption stages and determinants -...
TRANSCRIPT

Sana Akbar Khan
Consumer Innovation Adoption Stages and Determinants
Working Paper n. 3/2017March 2017
ISSN: 2239-2734

This Working Paper is published under the auspices of the Department of Management at Università Ca’ Foscari Venezia. Opinions expressed herein are those of the authors and not those of the Department or the University. The Working Paper series is designed to divulge preliminary or incomplete work, circulated to favour discussion and comments. Citation of this paper should consider its provisional nature.

Consumer Innovation Adoption Stages and Determinants
SANA AKBAR KHAN
Department of Management
Ca'Foscari University of Venice
(February 2017)
Abstract:
Existing research on innovation adoption is divided into two main streams: organizational innovation
adoption and individual (consumer) innovation adoption. Proponents of both perspectives approach
the topic in a variety of ways. Contrary to the organizational adoption, research on the consumer
adoption investigates the determinants of adoption/non-adoption without considering the innovation-
decision as a process. Particularly, for high involvement innovations that require efforts in terms of
cost, money, and resources to switch to a new routine and behavior, innovation adoption as a multi-
stage process is most relevant. In line with Rogers' (2003) multi-stage individual adoption process,
this study aims to first explore the existence of distinct stages of innovation adoption and then identify
the different determinants of each stage of adoption. To address both research questions, an
exploratory factor analysis (EFA) and a structural equation modeling (SEM) technique were used.
Data was collected from individuals using two different online surveys on smartwatch and alternative
engine cars (AECs). Data from the first survey was used to extract factors using EFA. The results
confirmed the existence of five distinct stages: knowledge, persuasion, decision, implementation, and
confirmation. Based on these results, data from the second online survey was used to identify the
predictors of each stage. Different determinants in terms of perceived innovation characteristics of
AECs were analyzed using a structural model. In line with temporal distance theories and loss
aversion theory, the findings show that perceived benefits of an innovation explain variation in
persuasion stage, while perceived losses impact implementation stage. Decision and confirmation
stages on the other hand are less explained. The study contributes by confirming the existence of
distinct stages of consumer adoption of high involvement innovations and developing a framework
which not only determines the direction but also the strength of the relationships between different
determinants and adoption stages.
Keywords: Consumer innovation adoption stages, alternative engine cars, perceived innovation
characteristics, diffusion of innovation.
Correspondence to:
Sana Akbar Khan Department of Management, Ca'Foscari University of Venice
San Giobbe, Cannaregio 873
30121 Venezia, Italy.
Email: [email protected]

1
1. Introduction
The diffusion of innovation (DOI) as a field of research has gained as much importance, if
not more, as the innovation creation itself. Early studies on DOI highlight the importance of
understanding the nature of this phenomenon, whose empirical manifestations show
subsequent decisional stages (Rogers, 1962, 1983), in contrast with the discontinuous
concurrence of events of the Schumpeterian perspective (Robertson, 1967).
Researchers from various disciplines adopt different perspectives. Economists tend to
conceive innovation as an outcome while organizational sociologists mainly adopt a process
perspective (Gopalakrishnan & Damanpour, 1997). Management studies consider both
viewpoints with a focus on the adoption process conditions and emerging patterns, both in
organization and in consumer behavior literature (Kimberly & Evanisko, 1981; Meyer &
Goes, 1988; Van de Ven & Rogers, 1988).
Rogers' (1983, 1995, 2003) theory on DOI supports that innovation-decision is a multi-stage
process through which a decision making unit passes through a number of selective steps.
Such process occurs both in individuals and organizations adoption choices. Understanding
the process perspective is relevant as the adoption of new technologies often requires
resources and efforts to shift towards a new behavior. Different actors in a society e.g. policy
makers, industry players, local authorities make and implement strategies to make the shift
successful. Hence it is of paramount importance for such stakeholders to analyze how a
decision making unit passes through the adoption process and which factors ensure smooth
transition from one phase to another in the process. The dynamics that play role during each
phase may be different due to a distinct nature of each phase and identification of success
factors behind every step in the process can foster diffusion. Rogers' seminal contributions
have deeply influenced the research in this field. He claims that the process nature of

2
innovation should be investigated through a research based on a type of data gathering and
analysis that seeks to determine the ordered sequence of a set of events. In contrast, the
majority of diffusion studies mainly focus on variance type investigation; innovation
adoption as a process consisting of sequence of stages is, indeed, ignored (Frambach &
Schillewaert, 2002; Rogers, 2003).
Empirical studies, on large bases, investigate determinants of adoption/non-adoption
decision; ignoring other pre and post adoption phases in the decision process. For example,
Frambach, Barkema, Nooteboom, & Wedel (1998) analyze determinants of adoption of an
innovation by quantifying it as a binary variable (i.e., adoption or non-adoption decision).
Very little is known about the factors that affect other phases (Frambach & Schillewaert,
2002; Arts, Frambach, & Bijmolt, 2011). There are few exceptions in consumer innovation
adoption literature, however they either focus relatively on the broad categorization of phases
or a subset of the whole process (e.g., Alexander, Lynch, & Wang, 2008; Arts et al., 2011;
Manning, Bearden, & Madden, 2005; Wood & Moreau, 2006). On the other hand, relatively
higher number of studies have empirically tested the phenomena in organizational innovation
adoption with an interactive process perspective (e.g., Chong & Chan, 2012; Damanpour &
Schneider, 2006; Kim & Garrison, 2010; Matta, Koonce, & Jeyaraj, 2012). Although the
topic is considered relevant (Frambach & Schillewaert, 2002; Hameed, Counsell, & Swift,
2012), to the best of my knowledge the empirical validation of a multi-staged innovation-
decision in consumer adoption process is still to be provided.
This article finds its motivation in this gap. Adoption is the premise for innovation diffusion
and the research in this field commonly assumes that an individual evaluates a new idea and
decides whether or not to incorporate the idea into an ongoing practice through an interrelated
series of actions and choices. As highlighted above, presently this assumption do not relies on

3
empirical validation. What is more, adoption of the innovation which suffers from lock-in
and is in early stages of diffusion curve requires more time, effort, and cost to switch to a new
behavior compared to the adoption of the established alternative. Adoption of such
innovations is likely to occur in distinct steps, hence provides a relevant setting to validate the
assumption. This leads to two overarching research questions: whether distinct innovation
adoption stages exist and whether different determinants affect different stages?
The study relies on the individual innovation adoption framework (Rogers, 2003) to test stage
assumption and on temporal distance theories (Trope & Liberman, 2003; Wright & Weitz,
1977) to test varying effects of perceived innovation characteristics on each stage. Two
surveys were conducted in order to collect the responses from (potential) adopters. The
existence of stages is explored through principal factor analysis (PCA) using data collected
from the first online survey on smartwatch technology (N1=110) while the determinants of
each stage are identified through a Structural Equation Modeling (SEM) approach using data
gathered from the second survey on alternative engine cars (AECs) (N2= 246). The peculiar
kind of innovations has been chosen since both requires high consumer involvement and
efforts and are in early phases of diffusion; thus the possible separation among stages is more
evident with respect to a situation where the choices have assumed a routine connotation. The
second survey, in particular, benefitted from a series of contributions (e.g., Jansson, 2011;
Jansson, Marell, & Nordlund, 2010; Jansson, Marell, & Nordlund 2011; Ozaki &
Sevastyanova, 2011; Petschnig, Heidenreich, & Spieth, 2014; Rezvani, Jansson, & Bodin;
2015) that also analyze high involvement consumer behaviors related to adoption of hybrid
electric vehicles (HEVs) and electric vehicles (EVs).
The findings confirm the existence of five distinct stages –knowledge, persuasion, decision,
implementation, and confirmation stage in both empirical settings in line with Rogers'

4
framework. The findings further reveal that each stage is explained by different set of
perceived innovation characteristics- persuasion is affected by perceived benefits of an
innovation, while implementation is explained by perceived costs and proximal factors.
Decision and confirmation are explained by only few attributes.
The contribution to the present knowledge stands both in the proposed model and in the
implications stemming from the results of the empirical research. First, the paper contributes
by empirically validating and confirming the existence of five unique stages in case of high
involvement innovations. Such contribution differs from prior studies in the field to the extent
they look at adoption decision as a dichotomous variable (adoption or rejection i.e., 1 or 0)
rather than focusing on each stage of the process. In addition, prior adoption literature utilizes
2-stage (e.g., Arts et al., 2011) or 3-stage models (e.g., Chong & Chan, 2012; Damanpour &
Schneider, 2006; Kim & Garrison, 2010) while this study utilizes the five stages of adoption
process as suggested by Rogers (2003). Secondly, the findings extend the results of earlier
studies by identifying a clear dynamic role of antecedents of each of the five stages.
Furthermore, the empirical analysis developed to test the model of determinants here
suggested, identifies both the direction and the strength of the relationships between
determinants and stages. Finally, to the best of author's knowledge, the existing literature
provides weak operationalization of the five stages, with few exceptions from different fields
(Celik, Sahin, & Aydin, 2014; Gilly & Zeithmal, 1985; Li & Lindner, 2007). The current
study validates the stage questions partly adapted for both surveys.
The remainder of the paper is structured as follows: section two lays the foundation by
introducing DOI theory and consumer innovation-decision process and presents hypotheses
and framework of the study. The third section covers sample details, data collection, and

5
measures and operationalization of variables. Fourth section is devoted for factor analysis and
SEM results. Finally, fifth section discusses the results, limitations and contributions.
2. Literature review and theoretical framework
Existing empirical work on consumer innovation adoption considers it as an outcome and
determines it in terms of adoption or non-adoption (e.g. Jansson, 2011; Jansson et al., 2011;
Lassar, Manolis, & Lassar, 2015). This perspective affects the way innovation adoption and
related issues are interpreted. In particular, a crucial problem regards innovations that suffer
from lock-in due to established/ dominant products available in the market are hard to diffuse
quickly. This is because consumers using conventional products have to break their existing
routines in order to switch to a new innovation. For example, the substitution of conventional
brown products with green innovations requires a process of change in existing behavior.
Roger's (2003) work on DOI clarifies this point by conceptualizing innovation adoption as a
multi-stage process. However, existing literature did not investigate multi-step process of
adoption empirically. This study fills the gap by first exploring consumer innovation adoption
as a process based on different stages and secondly identifying different predictors of each
stage further confirming the existence of stages for new products. Below, I review the
existing literature after briefly shedding light on DOI and its emergence.
2.1.Background of the diffusion of innovation theory
Diffusion is a social process which is characterized by seven elements: acceptance, over time,
of some specific item- an idea or practice, by adopting units, linked to specific channels of
communication, to a social structure, and to a given system of values or culture (Katz, Levin,
& Hamilton, 1963). The diffusion of innovation is generally acknowledged as the main
mechanism of technical and social change; its importance emerged around the turn of
twentieth century by the work of Gabriel Tarde, a French lawyer, judge, and sociologist, who

6
wrote the book, "The Laws of Imitation" in 1903. Although he did not use the word
'diffusion' directly in his work, he opened the way for further studies identifying the role of
opinion leader and of social status in the diffusion process. He also postulated the S-shape
curve of the rate of adoption (Tarde, 1903). Later, during the 1930s and the 1940s, sociologist
and anthropologists started conducting empirical studies on diffusion of cultural traits, for
example Pemberton (1936, 1937, 1938) analyzed postage stamps diffusion and Bowers
(1937) studied diffusion of consumer innovations. Ryan & Gross (1943) studied the diffusion
of hybrid corn seed. These contributions, as many others, commonly look at the diffusion as a
cultural fact that follows successive, distinctive phases. Starting from these and other
pioneering studies, the theory of diffusion was gradually modified and its principles were
adopted by other social sciences. DOI then progressed overtime and Rogers' (1962) most
widely cited theory played a vital role in popularizing and spreading the field. Presently the
diffusion research is spread among various academic disciplines like anthropology,
agriculture, sociology, economics, geography, political science, marketing, communication,
management etc.; infact the diffusion paradigm has provided an interdisciplinary common
ground.
This paper is grounded in the classical DOI theory introduced by Rogers (1962, 2003), whose
seminal work lays the foundation of today's research on innovation adoption and diffusion. In
his book "Diffusion of Innovations", Rogers (1983) defines innovation as "an idea, practice,
or object perceived as new by an individual or other unit of adoption" (p. 35), and defines
diffusion process as "the process by which an innovation is communicated through certain
channels over time among the members of a social system" (p. 5). The diffusion process
follows the S-shaped curve. The S-shaped slope of the curve represents the rate of adoption
or diffusion. Some new innovations, which diffuse quickly, form a steeper S-shaped curve,
while others form a gradual curve. The S-shaped curve is formed in relation with different

7
adopter categories: innovators, early adopters, early majority, late majority, and laggards
(Rogers, 1995, 2003). Initially, the S-curve starts progressing slowly as the innovators start
adopting the new innovation. Due to early adopters the curve then raises faster (reaches
"take-off") and reaches at its steepest as early majority and late majority start adopting the
innovation. Lastly, the curve moves slower and levels-offs at the top as laggards adopt the
innovation slowly and the cumulative number of adopters are exhausted.
Although strictly related, innovation diffusion and innovation adoption are two different
concepts. Innovation diffusion refers to the accumulated level of users of an innovation in the
market; whereas, innovation adoption refers to the decision process in which a decision
making entity- an individual or an organization makes use of an innovation (Rogers, 1995).
The decision process reflects the existence of distinct stages ranging from the first knowledge
of the innovation to the confirmation of innovation use. During 1960s and 1970s, a number of
other studies of innovation adoption (e.g., Robertson, 1974; Ostlund, 1974) and diffusion
(e.g., Bass, 1969; Mahajan, Muller, & Bass, 1991) were conducted, but the adoption process
of a decision making unit and the way it is influenced lie at the heart of the diffusion
paradigm.
2.2.Innovation adoption: A multi-stage perspective
The adoption of an innovation is a process that results in the introduction and use of a
product, process, or practice that is new to the adopter (Kimberly & Evanisko, 1981). The
adoption process is defined as the "mental and behavioral sequences through which the
consumer progresses and which may result in acceptance and continued use of a product or
brand" (Robertson, 1974, p. 271). Being a process, the innovation adoption occurs through a
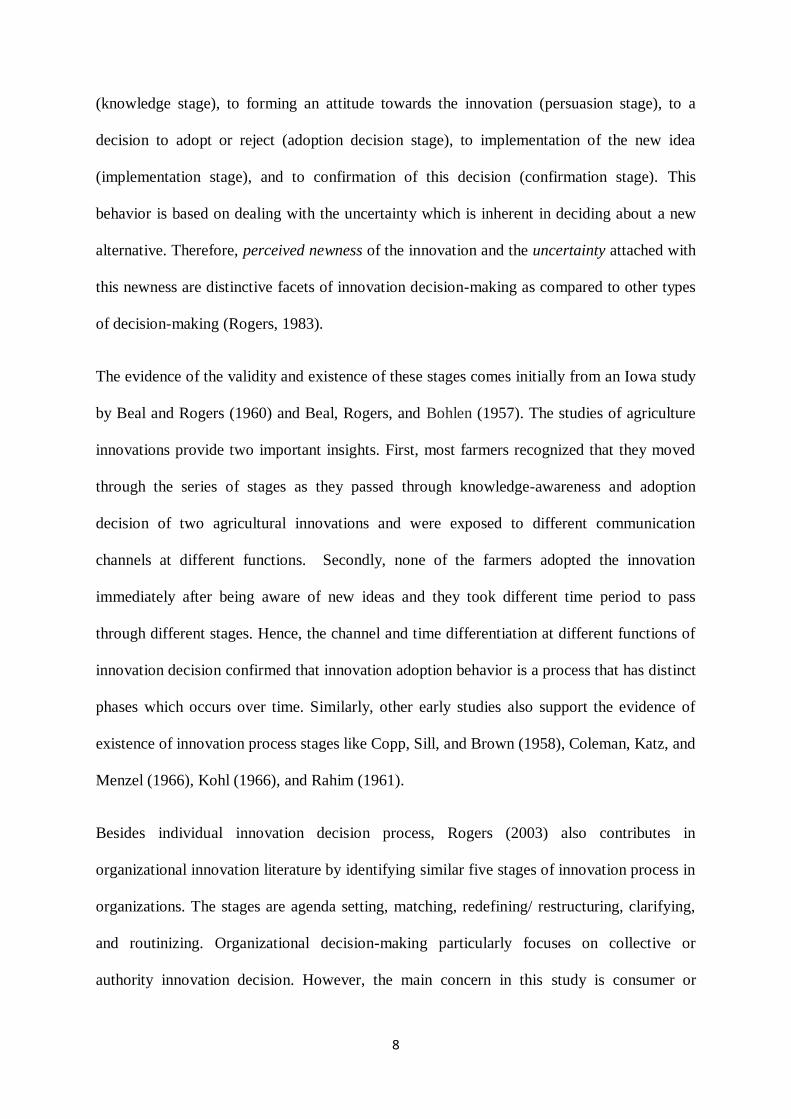
sequence of actions and choices. Rogers (2003) defines innovation-decision process as the
process through which an individual passes from first knowledge to an innovation
8
(knowledge stage), to forming an attitude towards the innovation (persuasion stage), to a
decision to adopt or reject (adoption decision stage), to implementation of the new idea
(implementation stage), and to confirmation of this decision (confirmation stage). This
behavior is based on dealing with the uncertainty which is inherent in deciding about a new
alternative. Therefore, perceived newness of the innovation and the uncertainty attached with
this newness are distinctive facets of innovation decision-making as compared to other types
of decision-making (Rogers, 1983).
The evidence of the validity and existence of these stages comes initially from an Iowa study
by Beal and Rogers (1960) and Beal, Rogers, and Bohlen (1957). The studies of agriculture
innovations provide two important insights. First, most farmers recognized that they moved
through the series of stages as they passed through knowledge-awareness and adoption
decision of two agricultural innovations and were exposed to different communication
channels at different functions. Secondly, none of the farmers adopted the innovation
immediately after being aware of new ideas and they took different time period to pass
through different stages. Hence, the channel and time differentiation at different functions of
innovation decision confirmed that innovation adoption behavior is a process that has distinct
phases which occurs over time. Similarly, other early studies also support the evidence of
existence of innovation process stages like Copp, Sill, and Brown (1958), Coleman, Katz, and
Menzel (1966), Kohl (1966), and Rahim (1961).
Besides individual innovation decision process, Rogers (2003) also contributes in
organizational innovation literature by identifying similar five stages of innovation process in
organizations. The stages are agenda setting, matching, redefining/ restructuring, clarifying,
and routinizing. Organizational decision-making particularly focuses on collective or
authority innovation decision. However, the main concern in this study is consumer or
9
individual decision-making that focuses on optional innovation decisions. Optional decision
to adopt or reject is made by an individual who is independent of the decisions or choices of
other members in the system.
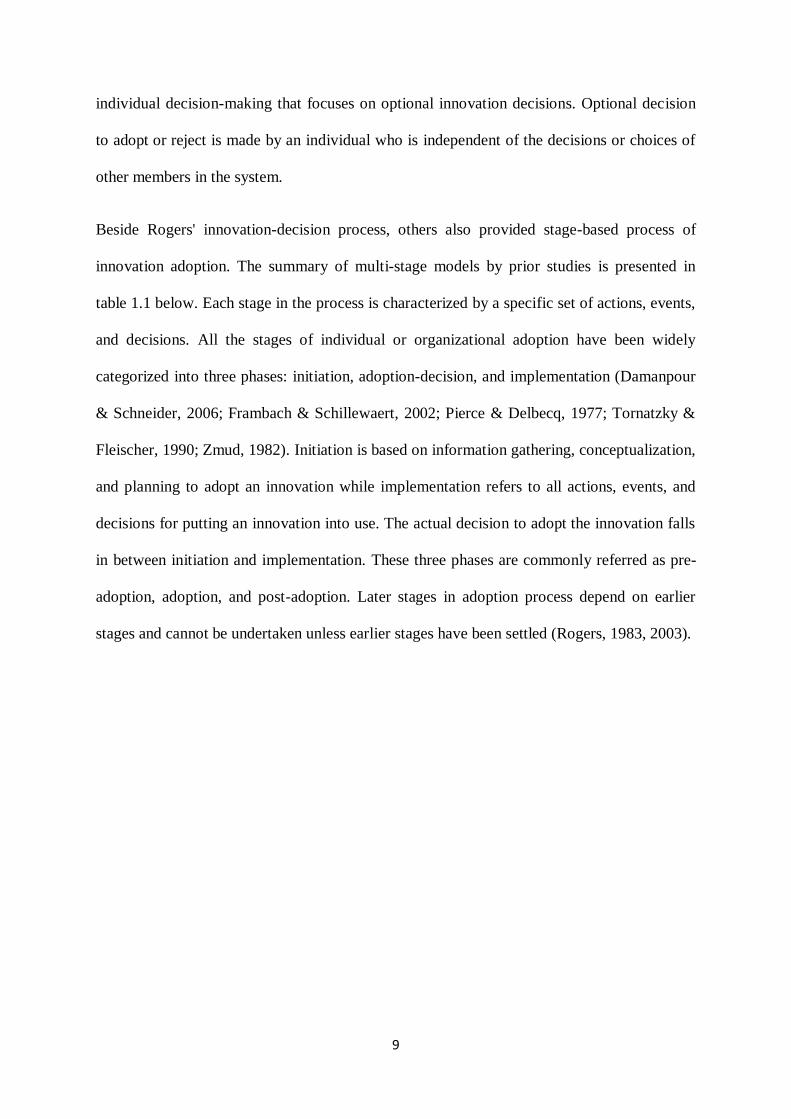
Beside Rogers' innovation-decision process, others also provided stage-based process of
innovation adoption. The summary of multi-stage models by prior studies is presented in
table 1.1 below. Each stage in the process is characterized by a specific set of actions, events,
and decisions. All the stages of individual or organizational adoption have been widely
categorized into three phases: initiation, adoption-decision, and implementation (Damanpour
& Schneider, 2006; Frambach & Schillewaert, 2002; Pierce & Delbecq, 1977; Tornatzky &
Fleischer, 1990; Zmud, 1982). Initiation is based on information gathering, conceptualization,
and planning to adopt an innovation while implementation refers to all actions, events, and
decisions for putting an innovation into use. The actual decision to adopt the innovation falls
in between initiation and implementation. These three phases are commonly referred as pre-
adoption, adoption, and post-adoption. Later stages in adoption process depend on earlier
stages and cannot be undertaken unless earlier stages have been settled (Rogers, 1983, 2003).

10
Table 1.1. Examples of multi-stage adoption models
Stages of Adoption Studies
Intention, behavior 2-stage process Ajzen (1991), Fishbein &
Ajzen, (1975)
Evaluation, adoption, integration 3-stage process Grover & Goslar (1993),
Kim & Garrison (2010)
Awareness, selection, adoption, implementation, routinization 5-stage process Hage & Aiken (1970)
Awareness, consideration, intention, adoption decision,
continued use
5-stage process Frambach & Schillewaert
(2002)
Knowledge, persuasion, decision, implementation,
confirmation
5-stage process Rogers (2003)
Knowledge, awareness, attitudes formation, decision, initial
implementation, sustained implementation
6-stage process Zaltman, Duncan, &
Holbek (1973)
Initiation, adoption, adaptation, acceptance, routinization, and
infusion
6-stage process Cooper & Zmud (1990)
2.3.Hypotheses development and the research model
Given the limited literature on antecedents of Rogers' five adoption stages namely
knowledge, persuasion, decision, implementation, and confirmation stage; the theoretical
framework and research hypotheses have been developed partially from available consumer
adoption studies on relatively less number of stages (e.g. Alexander et al., 2008; Arts et al.,
2011; Castaño, Sujan, Kacker, & Sujan, 2008; Meuter, Bitner, Ostrom, & Brown, 2005;
Wood & Moreau, 2006) and organization innovation adoption literature (e.g. Chong & Chan,
2012; Damanpour & Schneider, 2006; Frambach & Schillewaert, 2002; Hameed et al., 2012;
Kim & Garrison, 2010).
The literature highlights different categories of predictors of adoption. Given the overall
framework and the exploratory nature of the present work, this study focuses on a subset of
relationships referring to the most fundamental aspect- perceived characteristics of an
innovation, which are found to be a major driver of innovation adoption (Arts et al., 2011;
Frambach, 1993; Frambach et al., 1998; Frambach & Schillewaert, 2002; Gatigno &

11
Robertson, 1985; Rogers, 2003; Tornatzky & Klien, 1982; Vowles, Thirkell, & Sinha, 2011).
Arts et al. (2011) conduct a meta-analysis of 77 studies from 1970 –2007 on consumer
innovation adoption to identify how drivers of adoption differ across two broad stages:
intention and behavior. The study confirms that different stages have different predictors in
terms of innovation attributes. The research framework of this study hence is built on the
assumption that perceived attributes of an innovation vary across distinct stages of
innovation-decision. This assumption, if proven, will further confirm the stage existence
hypothesis and it will provide the premise to the analysis of the relationships between
different determinants and stages. The constructs describing the stages and perceived
innovation characteristics are the following.
Knowledge Stage: A potential adopter learns about the existence of an innovation and gains
some understanding of its way of functioning during the first stage. The knowledge stage is
not included in the structural model of this study, since the awareness of the innovation's
existence is a pre-requisite for the evaluation of determinants of subsequent stages.
Persuasion Stage: This stage helps form an attitude towards the innovation. During this
stage, the potential consumer takes interest and actively seeks information about the
innovation. The attitude is formed based on the knowledge they developed in the previous
stage and on continued exposure. Whereas the mental activity at the knowledge stage was
mainly cognitive (or knowing), the main type of thinking at the persuasion function is
affective (or feeling).
Decision Stage: During this stage, the potential consumer takes the concept of change and is
involved in certain activities e.g. trying out an innovation on a probationary basis, comparing
its pros and cons etc. Such activities help a potential adopter to make the choice to adopt or

12
reject the innovation. The adoption decision infact precedes the actual choice or acquisition
of an innovation.
Implementation Stage: Until the implementation stage, the innovation-decision process has
been strictly a mental exercise. But implementation involves overt behavior change, as the
new idea is actually put into practice by employing the innovation to a varying degree.
Rogers (1983) adds that this stage may continue for a long period but ends up when the
innovation loses its distinction and becomes a routine.
Confirmation Stage: The consumer finalizes his decision to continue using the adopted
innovation. Confirmation is the stage of reinforcement for the adoption decision which has
already been taken. Consumers reconsider the innovation based on their level of satisfaction
or dissatisfaction. He may reverse the decision to continue if received conflicting messages
about the innovation. Hence, a consumer continuously seeks to avoid the state of cognitive
dissonance.
Perceived Innovation Characteristics: Innovation characteristics refer to the attributes
consumers use to evaluate an innovation (Arts et al., 2011). Innovation adoption literature
generally utilizes six most common innovation characteristics. Rogers (2003) suggests five
attributes namely relative advantage, compatibility, trialability, complexity, and observability
to evaluate an innovation. Hoeffler (2003), Midgley and Dowling (1978), and Ostlund (1974)
add perceived uncertainty or risk to the list. Moore and Benbasat (1991) developed an
instrument to measure perceived characteristics of IT innovation. They identify eight
characteristics useful to study diffusion of innovations namely voluntariness, image, relative
advantage, compatibility, ease of use, trialability, result demonstrability, and visibility.
As explained above, different attributes are tested in this study to identify determinants of
stages. These are perceived relative advantage, compatibility, complexity of use, trialability,

13
risk, ecology, and image. The definitions of each perceived characteristics are provided in
table 1.2.
Table 1.2. Perceived innovation characteristics
Variable Definition Operationalization Source
Relative
Advantage
The extent to which an innovation is perceived as being
better than the existing product it supersedes.
Moore & Benbasat (1991), Jansson
(2011), Petschnig et al. (2014)
Compatibility The extent to which an innovation is perceived as
consistent with the past experiences, existing values,
life style, and needs.
Jansson (2011), Petschnig et al.
(2014)
Complexity The extent to which an innovation is perceived as
relatively difficult to understand and use. Ease-of-use
is taken as an alternative in different studies.
Moore & Benbasat, (1991), Jansson
(2011), Petschnig et al. (2014)
Trialability The degree to which an innovation is perceived to be
easily experimented on a limited/ probationary basis.
Moore & Benbasat (1991), Jansson
(2011)
Risk The degree to which individuals perceive uncertainty
about the functional, social, and/or financial
consequences of purchasing and using an innovation.
Jansson (2011), Petschnig et al.
(2014)
Ecology The extent to which an innovation is perceived as
environmental friendly and harmless to the
environment.
Petschnig et al. (2014)
Image The extent to which the use of an innovation is
perceived by the individual to enhance his/her image or
status in the social system or community.
Moore & Benbasat, (1991);
Petschnig et al. (2014)
Existing studies usually do not distinguish between the impacts of innovation attributes on
different stages of adoption (Arts et al., 2011). The innovation-decision process is essentially
an information seeking and processing activity in which an individual is motivated to reduce
uncertainty about an innovation (Rogers, 2003). This means that each stage in the process
deals with a certain level of uncertainty. To reduce the uncertainty and deal with the
perceived newness of the innovation, individuals consistently seek information and
knowledge of innovation during each stage. This knowledge requirement is higher and
different in the early stages due to relatively higher uncertainty and newness than in the later

14
stages. This represents that consumers may use different criteria to evaluate the innovation
across various stages of decision-making (Alexander et al., 2008; Castaño et al., 2008). At
different stages, use purposes and situations are perceived differently and therefore,
consumers may weigh product attributes differently (Arts et al., 2011).
Similar argument is used by temporal distance theories (Trope & Liberman, 2003; Wright &
Weitz, 1977). The theories explain how consumers adopt a new product and guide how
innovation characteristics can impact temporally distinct decisions. They explain that
adopters evaluate product characteristics differently, depending on whether the purchase
behavior is closer or further in time. For example, construal level theory (CLT) suggests that
the behaviors that are more distant in time, as reflected by adoption intentions, are more
likely to be affected by relatively abstract or general attributes. Behaviors that are closer in
time, as reflected by adoption behavior, are more likely to be affected by concrete, specific,
and context-dependent attributes (Trope and Liberman, 2003). The above arguments clarify
that different innovation attributes are relevant for different stages in the process. Hence, my
first hypothesis is:
Ha: Different stages in the innovation adoption process are influenced by different
perceived innovation characteristics.
Secondly, in order to evaluate which attributes are more relevant for each phase, innovation
attributes are here categorized into perceived benefits, proximity, and costs. Relative
advantage, compatibility, ecology, and image represent the direct benefits which make the
innovation desirable for the potential adopter. Trialability provides close proximity to a
product before purchase and helps to assess the direct benefits of an innovation. In contrast,
risk and complexity represent the expected losses or costs which may decrease the adopter's
motivation to adopt.

15
Potential adopters are likely to give high weights to perceived benefits of an innovation when
they are farther from actual adoption (Arts et al., 2011, Wright & Weitz, 1977). This is
because when potential adopters intend to buy an innovation, they form their attitude based
on abstract or higher level features. In terms of innovation decision as a goal-directed
process, this reflects relatively abstract 'why' aspect of an innovation (Trope & Liberman,
2003; Vallacher &Wegner, 1987). The 'why' aspect shows the desirability of a particular
behavior. The desire increases when a potential buyer perceives the outcome of innovation as
beneficial. Hence, the desirability in terms of improved performance and psychological gains
are more important than the feasibility of choosing an option (Lynch & Zauberman, 2006).
Based on this perspective, Castaño et al. (2008) suggest and find that managing uncertainties
about potential outcomes like performance and symbolic benefits is important for distant
future adoption decisions. The organization innovation adoption literature favors the same
argument. In their study on CRM adoption; Ko, Kim, Kim, and Woo (2008) advocate that the
decision makers perceive advantages of an innovation during persuasion phase and the
benefits affect the decision phase positively. Findings of Chong and Chan (2012) study on
RFID adoption confirm that perceived advantages are significantly relevant for pre-adoption
and adoption stages. Hence this study hypothesizes:
Hb: Perceived relative advantage, compatibility, ecology, and image of an innovation
significantly affect persuasion.
Hc: Perceived relative advantage, compatibility, ecology, and image of an innovation
strongly affect decision.
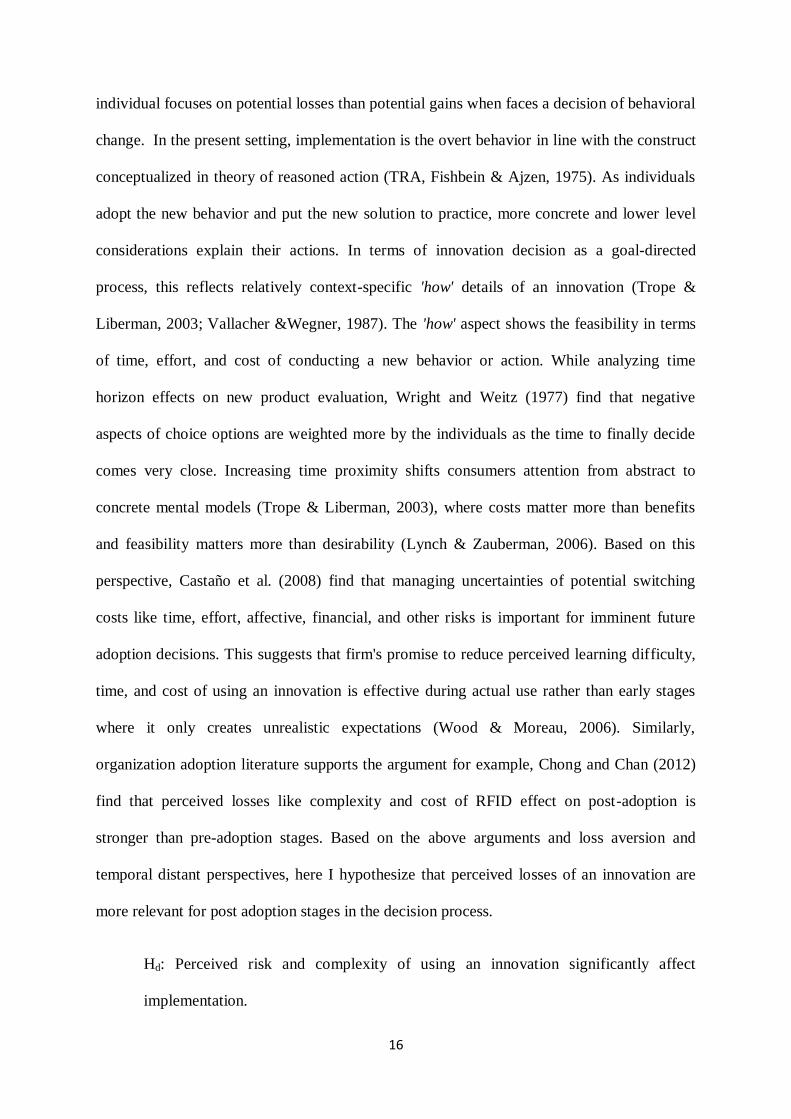
In contrast, individuals are likely to assign high weights to the losses of an innovation when
they are at behavior stage (Arts et al., 2011; Wright & Weitz, 1977). The notion is in line
with loss aversion or prospect theory (Kahneman & Tversky, 1979), which proposes that an
16
individual focuses on potential losses than potential gains when faces a decision of behavioral
change. In the present setting, implementation is the overt behavior in line with the construct
conceptualized in theory of reasoned action (TRA, Fishbein & Ajzen, 1975). As individuals
adopt the new behavior and put the new solution to practice, more concrete and lower level
considerations explain their actions. In terms of innovation decision as a goal-directed
process, this reflects relatively context-specific 'how' details of an innovation (Trope &
Liberman, 2003; Vallacher &Wegner, 1987). The 'how' aspect shows the feasibility in terms
of time, effort, and cost of conducting a new behavior or action. While analyzing time
horizon effects on new product evaluation, Wright and Weitz (1977) find that negative
aspects of choice options are weighted more by the individuals as the time to finally decide
comes very close. Increasing time proximity shifts consumers attention from abstract to
concrete mental models (Trope & Liberman, 2003), where costs matter more than benefits
and feasibility matters more than desirability (Lynch & Zauberman, 2006). Based on this
perspective, Castaño et al. (2008) find that managing uncertainties of potential switching
costs like time, effort, affective, financial, and other risks is important for imminent future
adoption decisions. This suggests that firm's promise to reduce perceived learning difficulty,
time, and cost of using an innovation is effective during actual use rather than early stages
where it only creates unrealistic expectations (Wood & Moreau, 2006). Similarly,
organization adoption literature supports the argument for example, Chong and Chan (2012)
find that perceived losses like complexity and cost of RFID effect on post-adoption is
stronger than pre-adoption stages. Based on the above arguments and loss aversion and
temporal distant perspectives, here I hypothesize that perceived losses of an innovation are
more relevant for post adoption stages in the decision process.
Hd: Perceived risk and complexity of using an innovation significantly affect
implementation.

17
He: Perceived risk and complexity of using an innovation significantly affect
confirmation.
Trialability provides an opportunity to a potential adopter to closely observe the advantages
and disadvantages of an innovation, enables him to see how it works within a limited time
period, and helps him to analyze the required degree of change in existing behavior in order
to switch to new behavior. Perceived trialability increases an individual's readiness to accept
the change in such a way that he understands his role and feels confident to use a new
innovation (Meuter et al. 2005). Hence, it is most relevant for overt behavior stage (Arts et
al., 2011) which is closely associated with implementation. On the basis of this argument, the
study hypothesizes that perceived ease of trialability is relevant for implementation stage.
Hf: Perceived trialability of an innovation strongly affects implementation.
The hypothesized relationships are shown in the research model in figure 1.1.
Ecology
Proximity
Inn
ovati
on
Ad
op
tion
Sta
ges
Per
ceiv
ed C
ost
s
Persuasion
Relative Advantage
Confirmation
Implementation
Decision
Compatibility
Image
Trialability
Complexity
Risk
Per
ceiv
ed B
enef
its
Figure 1.1. The research model

18
3. Methodology
3.1.Research design
The aim of this research is twofold: to identify and verify multi-stage process nature of high
involvement innovation adoption and to identify various predictors of each identified stage.
For this, I collected data about innovations which face lock-in and slowly diffuse due to the
presence of alternative dominant technologies in the marketplace, hence makes existence of
distinct stages more likely. The research questions were investigated through two different
questionnaire-based online surveys. To identify distinct stages of adoption, data collected
during the first survey were analyzed through exploratory factor analysis (EFA) technique
while to identify different determinants of stages, data collected during the second survey
were analyzed through structural equation modeling (SEM) approach. The first survey was
administered for smartwatch innovation while the second survey was administered for
alternative engine cars (AECs). The basic reason to select different innovations is to validate
and confirm the existence of distinct stages for different innovations. Moreover, the two
innovations share common issues. First, both are in early adoption stage of a diffusion curve
and faces lock-in to cross the chasm and penetrate in the mass market. Second, though
smartwatch and AECs are in early stage of diffusion still both are visible in the markets
which means that products are known to the people, hence are possible to survey. Finally, use
of both technologies require a shift to new behavior by breaking existing routines. It is highly
likely for potential adopters of such products to invest their efforts before purchasing and
during change of existing behavior. For example, substituting a conventional watch with a
smartwatch or an existing conventional car with a green car requires building a new routine,
hence requires efforts in terms of cost, time, and resources.
Since major focus of my work and the final survey is on sustainable vehicles, I reviewed
empirical studies on their adoption to identify most suitable perceived characteristics of such

19
vehicles. The review of existing literature provides a list of functional, economical, and social
attributes like range, acceleration, top speed, purchase price, fuel/ energy efficiency,
maintenance/ operating cost, resale price, charging infrastructure availability, ease of driving/
use/ maintenance, charging time, environmental impact, safety, health risk, physical risk,
financial risk, security, safety, comfort, design/ style, social image, visibility, policy
incentives etc. (table 1.3). I categorize all such dimensions into broad characteristics. For this,
I adopt Jansson (2011) and Petschnig et al. (2014) classification of innovation attributes
because (1) their frameworks are based on Rogers' theory of adoption and (2) they study
sustainable vehicles in general. Hence, the existing list of Roger's innovation characteristics
was extended by adding new dimensions related to alternative cars. The attributes included in
this study are perceived relative advantage, compatibility, complexity, trialability, risk,
ecology, and image.
3.2.Measures and operationalization
I adapted the existing scales to measure perceived characteristics of AECs. The details are
given in table 1.2 in previous section. The items were adapted from Jansson (2011), Moore
and Benbasat (1991), and Petschnig et al. (2014). Similarly, I partly adapted existing scales to
measure innovation adoption stages. Since the existing literature on individual adoption lack
operational definitions and measurement scales of different stages; I adapted the existing
scales from organizational and other literature which includes work by Celik et al. (2014),
Chong and Chan (2012), Gilly and Zeithaml (1985), Kim and Garrison (2010), and Li and
Lindner (2007). Few items were newly constructed and were validated before inclusion in the
final survey. All the items were measured on five point Likert scale ranging from 1 =
'strongly disagree' to 5= 'strongly agree' to reflect respondents' degree of agreement or
disagreement with a series of statements.

20
Table 1.3. Summary of perceived characteristics of sustainable vehicles
Studies Ewing &
Sarigollu
(1998,
2000)
Brownsto
ne et al.
(2000)
Tzeng et
al. (2005)
Lane &
Potter
(2007)
Eggers &
Eggers
(2011)
Hidrue et
al. (2011)
Jansson
(2011)
Egbue &
Long
(2012)
Ziegler
(2012)
Schuitem
a et al.
(2013)
Petschnig
et al.
(2014)
Peters &
Dütschke
(2014)
Vehicle
Characteristics
Clean-
Fuel
vehicles
AFV AFV BEV EV EV AFV PHEV
BEV
AFV PHEV
BEV
AFV EV
Relative
Advantage 1
X X X X X X X X X X X X
Ecology X X X X X X X X X X X
Ease of use2 X X X X X X X
Compatibility X X X X
Risk 3 X X X X
Trialability X X X
Observability X X X
Image X X X
Design/ style X X
Note: AFV = Alternative Fuel Vehicle, BEV= Battery Electric Vehicle, EV= Electric Vehicle, PHEV= Plug-in Hybrid Electric Vehicle
1 Relative advantage also includes profitability in terms of price, cost etc. and performance in terms of speed, acceleration, range, energy efficiency, range etc. 2 Ease of use includes ease to drive, charging/ fueling, maintenance etc. 3 Risk includes all types of risks e.g. physical, financial, health, security, emotional, social, safety etc.

21
3.3.Content Validity
Since the scale items for adoption stages were partly adapted from the existing literature, I
analyzed whether items were representative of the adapted construct. For this, content
validity of the innovation adoption scale was performed employing a quantitative approach.
In order to validate contents, the following steps were followed. Based on existing literature
and existing scales, a total of 27 items for five stages were identified and selected for
validation process. A content validity questionnaire was then generated that comprised
definitions of the constructs and associated items on a three-point scale, where 1 = 'clearly
representative of the construct', 2='somewhat representative of the construct', and 3= 'not
representative of the construct'. The questionnaire along with a covering letter indicating the
purpose and instructions were sent to academic experts via email. Responses from 6 experts
were then gathered and item-level content validity index (I-CVI) was calculated. Based on
experts' rating of each item's relevance to a particular construct, I deleted two irrelevant
items: "I will adopt the innovation the next time I need it" and "I have been using the
innovation for quite some time". The I-CVI for both items was less than the threshold value
of 0.78 (Lynn, 1986). Few other items were refined and/or reworded as suggested by experts.
Finally, 25 items were retained for inclusion in the first survey and for factor analysis which
further confirmed convergent and discriminant validity.
3.4.First survey- sample and data collection
The unit of analysis is the individual level. Using Qualtrics software, an online survey was
developed to have quantitative responses for the content validated 25 items. The
questionnaire has two sections. The first part is based on socio-demographic questions while
the second part has the whole set of validated questions of smartwatch innovation adoption.
Smartwatch is a wearable smartphone technology. Compared to a regular watch, it has

22
additional features like game playing, portable media playing, physical fitness tracking,
supporting mobile apps using mobile operating system etc. However, such technology is
relatively less attractive among consumers of conventional watches and faces slow diffusion
rate. For data collection, I used snowball non-probability sampling technique. I contacted
acquaintances, colleagues, and friends with a request to fill the online survey and to send the
survey link to their acquaintances. Moreover, the questionnaire was spread on social
networks. Follow up strategies were adopted to get timely and maximum responses. This
resulted in 138 responses. However, 110 usable set of responses were included in the
analysis. It is not possible to know the exact response rate as the survey was conducted
through the internet. In order to have variation in the variables of interest, I recruited a
heterogeneous sample of respondents with different gender, age, income, and education. The
sample statistics of final sample are shown in table 1.4. Majority of the respondents are non-
owners of smartwatch, male, highly educated, and under age 35. Sample is partially based on
European and Asian residents.

23
Table 1.4. Sample statistics (N1 = 110)
Socio-demographics Frequency
(%age)
Gender Male 85
(77.3%)
Female 25
(22.7%)
Education Groups Primary 0
(0%)
Intermediate 1
(0.9%)
Secondary 3
(2.7%)
University 106
(96.4%)
Continent of Residence Europe 45
(40.9%)
USA 3
(2.7%)
Asia 59
(53.6%)
Africa 1 (0.9%)
Australia 2
(1.8%)
Age
25 and below
27
(24.5%)
26-35
57
(51.8%)
36-45
21
(19.1%)
46 and above
5
(4.5%)
Smartwatch Owners Owners 30
(27.3%)
Non-owners 80
(72.7)
3.5.Second survey- sample and data collection
To test the different determinants of adoption stages a survey instrument was developed
based on existing literature. The data for the second online survey were collected from car
users. A similar approach was used by Petschnig et al. (2014) and Jansson (2011) to analyze
consumer adoption of alternative fuel vehicles. In this research the empirical setting has been
defined as Alternative Engine Cars (AEC). AECs power their engines through additional
sources of energy besides petroleum like CNG, electricity, hydrogen, ethanol etc. Typical
examples of AECs are hybrid, electric, and hydrogen fuel cell cars. The alternative engine

24
innovation is selected for the analysis because such vehicles (1) are in the early phase of
diffusion or S-shaped diffusion curve and (2) require high consumer involvement behavior
and consumers are more likely to pass through distinct stages of adoption. Existing studies by
Jansson (2011), Jansson et al. (2010), Jansson et al. (2011), Ozaki and Sevastyanova (2011),
Petschnig et al. (2014), and Rezvani et al. (2015) also analyze high involvement consumer
behaviors related to adoption of hybrid and electric vehicles. However, none addressed the
adoption in terms of multi-stage process.
The survey questionnaire has 4 sections. The first section asks questions about five distinct
stages of adoption process as identified during EFA discussed in the next results section. The
second section asks questions about seven perceived characteristics of AECs as elaborated
earlier. Finally, the third section is based on socio-demographic questions. Following Chong
and Chan (2012), Jansson (2011), Kim and Garrison (2010), and Petschnig et al. (2014) the
questions of independent and dependent variables were measured on 5-point likert scale. The
5-point Likert scale checks the level of agreement, ranging from 1 = ‘strongly disagree’ to 5
= ‘strongly agree’.
Using snowball sampling technique I received 263 online responses from traditional or
alternative car users and 246 set of data were actually used for analysis. In order to have
variation in the variables of interest, a heterogeneous sample of respondents was recruited.
The sample statistics of final sample are shown in table 1.5. As in case of the previous survey
respondents, individuals are majorly male, highly educated, and under 35 years age. Half of
the respondents live in large towns having more than one million residents. More than half of
individuals own traditional cars while only one tenth of the sample own AECs.

25
Table 1.5. Sample statistics (N2 = 246)
Socio-demographics Frequency
(%age)
Gender Male 214
(86.99%)
Female 32
(13.01%)
Education Groups Primary 1
(0.41%)
Intermediate 2
(0.81%)
Secondary 6
(2.44%)
University 230
(93.5%)
Other 7
(2.84%)
Residence Very large town 124
(50.41%)
Large town 48
(19.51%)
Middle town 49 (19.92%)
Small town 17
(6.91%)
Rural area/ country side 8
(3.25%)
Age
25 and below
62
(25.2%)
26-35
128
(52.03%)
36-45
42
(17.07%)
46 and above
14
(5.7%)
Income
Less than $15,001
74
(30.1%)
$15,001-$35,000
38
(15.4%)
$35,001-$55,000
23
(9.3%)
$55,001-$80,000
12
(4.9%)
More than $80,000
9 (3.7%)
No response
90
(36.6%)
Existing car type Traditional 142
(57.7%)
Bi-fuel 63
(25.6%)
Alternative 25
(10.2%)
Other 16
(6.5%)

26
4. Results
4.1.Analysis of adoption stages
To identify distinct adoption stages, I run factor analysis in SPSS using two extraction
methods- Principal Component Analysis (PCA) and Principal Axis Factor (PAF). To confirm
the validity and reliability, I further run confirmation factory analysis (CFA) and reliability
analysis. The details of each analysis are given below.
Although PCA is the most popular, conventional, and default method to extract factors, PAF
is often considered a preferable approach (Osborne & Costello, 2009). Osborne and Costello
(2009) and Widaman (1990, 1993) suggest that PCA, though a popular and default extraction
method, is not a reliable method of factor analysis. The aim of the factor analysis is to reveal
latent constructs that allow manifest variables to covary. In order to reveal the underlying
factor structure, the shared variance is separated from its unique variance and error variance
during the analysis, and only shared variance is reflected in the solution. PCA disregards the
underlying structure caused by latent variables and components are extracted using all the
variance of manifest variables (Ford, MacCallum, & Tait, 1986). This means that PCA fails
to partition shared and unique variance and analyze all the variance. Factor analysis only
reveals shared variance and avoids the inflation of estimates of variance accounted for. On
the other hand, proponents of PCA disagree that there is much difference between factor
analysis and component analysis and preferred PCA (Arrindell & van der Ende, 1985;
Schoenmann, 1990; Velicer & Jackson, 1990). Keeping in mind pros and cons of both
approaches, this study considered results from both analyses. Following steps were
performed to extract distinct factors using PCA and PAF.
1. To identify the number of distinct stages, the eigenvalues and scree plot were
checked. The scree test examines the graph of eigenvalues and reveals a bend or break point

27
in the data where the curve flattens out. As expected, the eigenvalues (greater than 1.00) and
scree plot (data points above the break) revealed 5 distinct constructs with different number
of items loading on it. Further, 5 distinct constructs explained 59.2% cumulative variance4.
2. The Kaiser-Meyer-Olkin Measure of Sampling Adequacy value of 0.804, greater than
the threshold value 0.60, confirms that the sample (N1 = 110) is adequate to run the factor
analysis. Similarly, the significant p-value of Barlet's test of sphericity confirms that factor
extraction is useful.
3. In the next step, I entered Direct Oblimin rotation method which simplifies and
clarifies the data structure. The oblique rotation assumes that the factors are correlated as
there is generally some correlation among the variables in real life, hence renders more
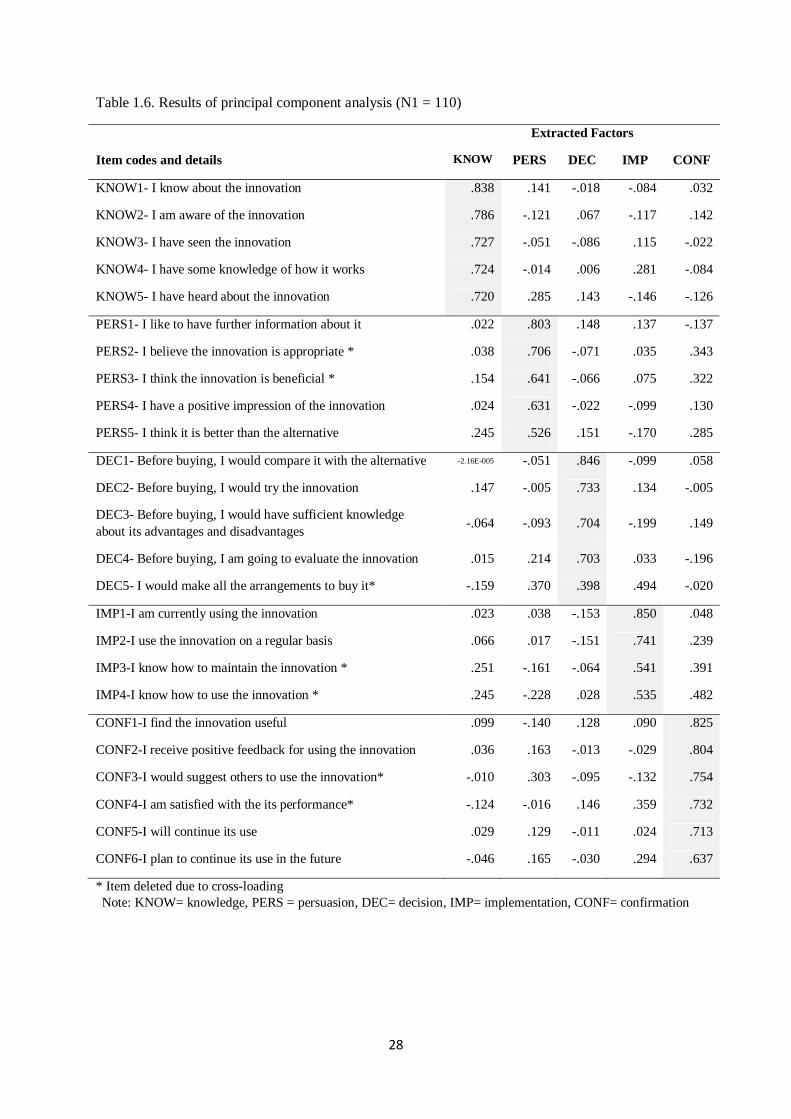
accurate solutions (Osborne & Costello, 2009). This technique resulted in a pattern matrix
which shows the items loadings (table 1.6 and 1.7). As suggested by Osborne and Costello
(2005), I deleted the items with items loadings lesser than 0.30 and which cross load on more
than one factor with loading greater than 0.30. This criterion resulted in the exclusion of 7 out
of 25 content validated items. Once deleted, I calculated correlations between factors for each
stage to confirm the distinctness of each factor or stage (table 1.8 and 1.9).
Comparing the analysis shown in table 1.6 and 1.7 confirms that both techniques PAF and
PCA revealed similar findings with an exception. Both showed clear factor structure and
extracted 5 different constructs. These factors are in line with the adoption stages
conceptualized by Rogers (2003), hence referred as knowledge, persuasion, decision,
implementation, and confirmation. This confirms the existence of stages of high involvement
innovation adoption as hypothesized.
4 To confirm that five distinct factors (extracted) is not the result of over-extraction or under-extraction, I run
multiple factor analyses by manually setting the number of factors to four, five, and six. However, the cleanest factor structure with item loadings greater than 0.25 and only few cross-loadings was achieved with 5 factor solution.
28
Table 1.6. Results of principal component analysis (N1 = 110)
Extracted Factors
Item codes and details KNOW PERS DEC IMP CONF
KNOW1- I know about the innovation .838 .141 -.018 -.084 .032
KNOW2- I am aware of the innovation .786 -.121 .067 -.117 .142
KNOW3- I have seen the innovation .727 -.051 -.086 .115 -.022
KNOW4- I have some knowledge of how it works .724 -.014 .006 .281 -.084
KNOW5- I have heard about the innovation .720 .285 .143 -.146 -.126
PERS1- I like to have further information about it .022 .803 .148 .137 -.137
PERS2- I believe the innovation is appropriate * .038 .706 -.071 .035 .343
PERS3- I think the innovation is beneficial * .154 .641 -.066 .075 .322
PERS4- I have a positive impression of the innovation .024 .631 -.022 -.099 .130
PERS5- I think it is better than the alternative .245 .526 .151 -.170 .285
DEC1- Before buying, I would compare it with the alternative -2.16E-005 -.051 .846 -.099 .058
DEC2- Before buying, I would try the innovation .147 -.005 .733 .134 -.005
DEC3- Before buying, I would have sufficient knowledge
about its advantages and disadvantages -.064 -.093 .704 -.199 .149
DEC4- Before buying, I am going to evaluate the innovation .015 .214 .703 .033 -.196
DEC5- I would make all the arrangements to buy it* -.159 .370 .398 .494 -.020
IMP1-I am currently using the innovation .023 .038 -.153 .850 .048
IMP2-I use the innovation on a regular basis .066 .017 -.151 .741 .239
IMP3-I know how to maintain the innovation * .251 -.161 -.064 .541 .391
IMP4-I know how to use the innovation * .245 -.228 .028 .535 .482
CONF1-I find the innovation useful .099 -.140 .128 .090 .825
CONF2-I receive positive feedback for using the innovation .036 .163 -.013 -.029 .804
CONF3-I would suggest others to use the innovation* -.010 .303 -.095 -.132 .754
CONF4-I am satisfied with the its performance* -.124 -.016 .146 .359 .732
CONF5-I will continue its use .029 .129 -.011 .024 .713
CONF6-I plan to continue its use in the future -.046 .165 -.030 .294 .637
* Item deleted due to cross-loading
Note: KNOW= knowledge, PERS = persuasion, DEC= decision, IMP= implementation, CONF= confirmation

29
Table 1.7. Results of principal axis factoring (N1 = 110)
Extracted Factors
Item codes and details KNOW PERS DEC IMP CONF
KNOW1- I know about the innovation .833 .126 -.024 -.086 .018
KNOW2- I am aware of the innovation technology .718 -.087 .045 -.080 .113
KNOW5- I have heard about the innovation .671 .235 .147 -.141 -.107
KNOW4- I have some knowledge of how it works .652 -.018 .012 .227 -.046
KNOW3- I have seen the innovation .630 -.024 -.080 .113 -.014
PERS2- I believe the innovation is appropriate .030 .742 -.084 .059 .257
PERS1- I like to have further information about it .022 .718 .172 .108 -.132
PERS3- I think the innovation is beneficial for me .146 .664 -.075 .095 .242
PERS5- I think it is better than the alternative .233 .494 .140 -.136 .230
PERS4- I have a positive impression of the innovation .038 .482 .035 -.089 .138
DEC1- Before buying, I would compare it with the alternative -.004 -.078 .813 -.105 .065
DEC4- Before buying, I am going to evaluate the innovation .016 .165 .653 .010 -.175
DEC2- Before buying, I would try the innovation .131 -.020 .650 .079 .023
DEC3- Before buying, I would have sufficient knowledge
about its advantages and disadvantages -.051 -.010 .547 -.130 .054
DEC5- I would make all the arrangements to buy it* -.126 .274 .371 .339 .058
IMP1-I am currently using the innovation .016 .085 -.131 .854 -.016
IMP2-I use the innovation on a regular basis .060 .033 -.123 .716 .210
IMP4-I know how to use the innovation * .247 -.226 .040 .517 .466
IMP3-I know how to maintain the innovation * .243 -.132 -.056 .515 .358
CONF1-I find the innovation useful .105 -.125 .111 .080 .789
CONF2-I receive positive feedback for using the innovation .039 .165 -.025 -.047 .779
CONF3-I would suggest others to use the innovation* -.004 .289 -.100 -.148 .730
CONF4-I am satisfied with the its performance* -.130 -.019 .156 .329 .724
CONF5-I will continue its use .039 .152 -.018 .052 .620
CONF6-I plan to continue its use in the future -.037 .176 -.026 .276 .585
* Item deleted due to cross-loading
Note: KNOW= knowledge, PERS = persuasion, DEC= decision, IMP= implementation, CONF= confirmation
The only exception in the analysis is that PCA suggested the deletion of seven items while
PAF suggested the deletion of five cross loaded items. All other items were converging to

30
different constructs with loadings greater than 0.30 reflecting convergent validity.
Considering the theoretical and empirical perspective, seven items were deleted from further
analysis in order to achieve uncorrelated factor structure as shown in table 1.8 and 1.9. The
low correlation coefficients between different stages shown in both tables confirm the distinct
nature of identified stages.5 However, PAF shows a relatively higher correlation between
implementation and confirmation- which are subsequent post adoption stages, thus signaling
a possibility of emergence of one unique stage instead of two in other settings.
Table 1.8. Factor correlation matrix based on PCA results6
Factors KNOW PERS DEC IMP CONF
KNOW 1 -.160 -.087 -.098 -.253
PERS -.160 1 .226 -.030 .214
DEC -.087 .226 1 -.147 .042
IMP -.098 -.030 -.147 1 .226
CONF -.253 .214 .042 .226 1
Note: KNOW= knowledge, PERS = persuasion, DEC= decision, IMP= implementation, CONF= confirmation
Table 1.9. Factor correlation matrix based on PAF results
Factors KNOW PERS DEC IMP CONF
KNOW 1 -.197 -.104 -.129 -.304
PERS -.197 1 .342 -.053 .286
DEC -.104 .342 1 -.189 .050
IMP -.129 -.053 -.189 1 .336
CONF -.304 .286 .05 .336 1
Note: KNOW= knowledge, PERS = persuasion, DEC= decision, IMP= implementation, CONF= confirmation
5 High correlation of a group of items within a single construct and low correlation among different
constructs confirm construct validity. Discriminant validity is apparent by the examination of the
cross-loadings, which are not substantial in magnitude compared to the loadings. 6 Table 1.8 and 1.9 are the results of SPSS while running PCA and PAF. The negative signs should be
ignored and weights should be considered while interpreting the association between different factors.
31
In order to confirm the validity of constructs or stages identified during EFA and
subsequently used in the second survey, confirmatory factor analysis (CFA) was applied7.
The results are shown in figure 1.2. Findings show that all items except one item of
persuasion "I like to have further information" exceed the stringent threshold value of 0.72
with p-value < 0.05. This shows that except one, all others were loading appropriately on
relevant latent construct. Goodness of fit measures confirmed the uni-dimensionality in the
factors. Goodness Of Fit Index (GFI), Adjusted Goodness Of Fit Index (AGFI), and
Comparative Fit Index (CFI) are greater than the threshold value of 0.90 and Root Mean
Square Error Of Approximation (RMSEA) is below 0.05 (Hair, Black, Babin, Anderson, &
Tatham, 2006).
Additionally, to confirm the internal consistency among items, Cronbach's alpha values were
calculated and results are reflected in table 1.10. A higher coefficient of reliability shows that
all items of each latent construct measure the same content universe. As shown in the table
below, all alpha coefficients exceed the cut-off value of 0.70 (Nunnally & Bernstein, 1978;
1994), thus confirms the internal consistency of group of items within a construct. The table
also reflects the mean values of each variable. Mean of implementation stage is 1.93 which
indicates that respondents on average do not use AECs. Similarly the mean values of
confirmation, trialability, and risk are closer to 3.00 which indicates that the majority of
respondents are neutral about using the innovation in future, the ability of the innovation to
be experimented or tried, and the uncertainty related to the innovation adoption. Bivariate
Pearson correlations (r) were calculated and included in table 1.10 to show early signs of
7 The data from the second survey was not used to replicate EFA due to several reasons: (i) majority of
respondents are non-adopters (70% and 90%non-adopters of smartwatch and alternative engine cars
respectively), which shows that they were are not in the post implementation stages which may affect the
association of last stages differently in different contextual settings, (ii) two innovations used in the surveys are
at different stages of diffusion and the level of involvement and efforts required for the two innovations is
different which reflects the likelihood of different degree of correlation and interaction between different stages
, and (iii) items were adapted from already existing weak operationalization of constructs as mentioned earlier,
which might have an effect on our results.

32
strong associations between the constructs. An unexpected result is a strong association
between implementation and confirmation stage (r =0.73, p <0.01) corroborating the early
signal provided by the factor correlation matrix (table 1.9). Very high correlation is also
observed between relative advantage and compatibility (r = 0.70) and between complexity
and risk (r = 0.60). The possible reason is that innovation attributes are interdependent to
some extent (Holak & Lehman, 1990).
.84
.83
.91
.90
.93
.98
.81
.74
.77
.72
.72
.85
.49
.84
.89
.77
.81
.94
KNOW2
KNOW3
KNOW1
KNOW4
KNOW5
PERS4
PERS5
PERS1
DEC2
DEC3
DEC1
IMP1
IMP2
DEC4
CONF2
CONF5
CONF1
CONF6
Knowledge
Confirmation
Implementation
Decision
Persuasion
.77
.01
.25 -.18
.11
.18 .37
.24
.60
.28
Figure 1.2. Results of CFA (N2=246)

33
Table 1.10. Cronbach's alpha, mean, and bivariate Pearson correlation matrix
Constructs Cron α Mean (SD) Bivariate correlations (r)
KNOW PERS DEC IMP CONF RA COMP
AT
COMP
LEX
TRIAL RISK ECO IMAG
KNOW 0.92 3.71(1.002) 1
PERS 0.76 4.00 (0.796) .50*** 1
DEC 0.84 4.29 (0.673) .24*** .23*** 1
IMP 0.94 1.93 (1.349) .17*** .13** -.15** 1
CONF 0.92 3.25 (0.666) .26*** .22*** .01 .73*** 1
RA 0.83 3.60 (0.689 .29*** .50*** .15** .19*** .28*** 1
COMPAT 0.83 3.71 (0.679 .41*** .53*** .16** .28*** .42*** .70*** 1
COMPLEX 0.74 3.38 (0.729) .16** .001 .15** -.05 .02 -.02 -.05 1
TRIAL 0.84 2.93 (0.823) .16** .09 -.15** .26*** .25*** .26*** .27*** .07 1
RISK 0.75 2.88 (0.702) .02 -.16** -.08 .12* .11* -.09 -.12* .60*** .21*** 1
ECO 0.81 3.87 (0.694) .33*** .45*** .19*** .006 .21*** .40*** .42*** .04 .01 -.15** 1
IMAG 0.84 3.42 (0.742) .16** .34*** .08 .19*** .23*** .40*** .46*** .01 .27*** .02 .23*** 1
Note: *** = p-value significant at 0.01 level, **= p-value significant at 0.05 level, *= p-value significant at 0.10 level
Cron α = cronbach's alpha, SD= standard deviation, KNOW = knowledge, PERS= persuasion, DEC= decision, IMP = implementation, CONF= confirmation, RA= relative
advantage, COMPAT= compatibility, COMPLEX= complexity, TRIAL= trialabity, RISK= risk, ECO = ecology, IMAG= image

34
4.2.Results of the model
The structural equation modeling is applied to examine the hypotheses proposed in the second section
as this method examines both the directions and strengths of the relationships of the latent variables. In
addition it has the potential to analyze a larger number of constructs and their interrelations
simultaneously and to control for measurement error (Mackenzie, 2001; Steenkamp & Baumgartner,
2000). For the estimation of the model, I used AMOS ver 18.0. Before running the SEM analysis, some
of the basic assumptions were tested. There was no multicollinearity among variables as VIF was less
than the stringent cut-off threshold of 3.00 and tolerance level> 0.01. Similarly, the assumption of
homoscedasticity was not violated. Power test showed that the required sample size to run SEM was
200 which is less than the study's sample size of 246 observations. Finally, scale reliability and validity
were confirmed as discussed above. I assessed path coefficients and significance values using
Maximum Likelihood estimation technique in SEM and the results are shown in table 1.11 and figure
1.3 below. The standardized regression weight shown in the table not only indicates the direction but
also the magnitude of the proposed relationship while p-value confirms the significance of the
relationship.
As hypothesized, findings show that persuasion stage is positively affected by all perceived benefits of
AECs like relative advantage, compatibility, ecology, image as expected. Hence hypothesis Hb is
supported. This is consistent with temporal distance theories (Trope & Liberman, 2003; Wright &
Weitz, 1977) suggesting that perceived performance benefits are important for distant future adoption
decisions to encourage non-adopters to adopt (Castaño et al., 2008). Among all the significant AEC
benefits, compatibility is the strongest predictor of persuasion (β = 0.29, p< 0.01). Ecology is the
second critical factor explaining the second stage of AEC adoption (β = 0.28, p<0.01). Image, on the
other hand, is the weakest factor significant at 10% significance level (β = 0.10).

35
Table 1.11. Results of the structural model
Hypotheses Standardized
regression weights (β) p-value Decision
Relative advantage Persuasion Hb 0.21 .000 Accepted
Compatibility Persuasion Hb 0.29 .000
Ecology Persuasion Hb 0.28 .000
Image Persuasion Hb 0.10 .090
Relative advantage Decision Hc 0.03 .635 Rejected
Compatibility Decision Hc 0.08 .183
Ecology Decision Hc 0.15 .021
Image Decision Hc 0.00 .991
Complexity Implementation Hd -0.18 .003 Accepted
Risk Implementation Hd 0.18 .003
Complexity Confirmation He -0.07 .242 Partially
Accepted Risk Confirmation He 0.15 .013
Trialability Implementation Hf 0.23 .000 Accepted
0.15 0.18
-0.07
-0.18
0.23
0.0 0.11
0.15
0.28
0.08
0.29
0.03
0.21
Ecology
Persuasion
Relative Advantage
Confirmation
Implementation
Decision
Compatibility
Image
Trialability
Complexity
Risk
Figure 1.3. Results of the structural model
36
On the other hand, none except perceived ecology of using an AEC significantly explains variation in
decision stage (β = 0.15, p <0.05). This leads to the rejection of hypothesis Hc which proposes that all
perceived benefits predict decision phase.
As hypothesized, potential losses of using an AEC strongly affects implementation at 1% significance
level. Perceived complexity of use and risk associated with AEC, both brings 18% change in
individual's overt behavior of using a green car (β= -0.18 and 0.18 respectively), indicating equal
importance of both predictors. These results confirm the assumptions of temporal distance theories and
loss aversion theory (Kahneman & Tversky, 1979) that perceived costs, losses, and uncertainties of
innovation's actual use are important for imminent future adoptions decision (Arts et al., 2011; Castaño
et al., 2008). More specifically, the finding suggests that perceived learning difficulty, time, and cost
are effective during actual use rather than early stages (Chong & Chan, 2012; Wood & Moreau, 2006).
However, the results show a positive relation between risk and implementation. This is due to
participants neutral response about the potential riskiness of using AECs in terms of financial,
functional, health-related, and social uncertainty (mean score = 2.88, table 1.10) and their disagreement
with AEC current use (mean score = 1.93, table 1.10). In terms of proximal benefits, perceived
trialability also significantly predicts implementation stage (β = 0.23, p <0.01). Both results confirm
hypotheses Hd and Hf. In terms of degree of change, trialability of green cars is the strongest
determinant of overt behavior compared to the other two.
Unexpectedly, complexity of using a sustainable car does not explain significant change in reaching to
confirmation stage (β = -0.07, p >0.10). However, low risk of using a sustainable car explains
significant variation in confirming the adoption decision (β = 0.15, p < 0.05). This result facilitates
partial acceptance of hypothesis He. Finally, the overall results support first hypothesis, Ha which
suggests that different attributes of innovation affect different stages. The results shown in table 1.11
37
reveal that pre-adoption, adoption, and post-adoption stages have different predictors further
confirming the existence of stages in case of AEC technology.
5. Discussion and conclusion
5.1.Discussion
The present paper addresses the first research question by exploring distinct nature of innovation
adoption process. It empirically confirms the stage hypothesis by identifying 5 stages in case of high
involvement innovations which require efforts to break existing routines and switch to new innovations
which are in the early stage of diffusion. To do so, data on smartwatch innovation was collected from
individuals. Exploratory factor analysis extracted solution of 5 different factors referred as knowledge,
persuasion, decision, implementation and confirmation. The factors are unique and show little or no
association with each other. However, the PCA and PAF used to extract factors show relatively highest
association between the last two stages (r = .25 and .30 respectively, table 1.8 and 1.9). Such results
provided an early signal that the two stages have a significant relation and are collinear. To further
confirm the results and to validate the stage existence in another similar setting, data were collected on
AEC adoption from car users. The data were analyzed through CFA, which also confirms the existence
of stages. However, this time the results indicated that there is strong association between
implementation and confirmation of sustainable cars (covariance = 0.77, figure 1.2 and r =0.73, table
1.10). This leads to the conclusion that the two extracted post adoption stages may not be distinct and
may be considered as a single stage. This is further confirmed by the goodness of fit indices of the
SEM which did not exceed the threshold values (GFI and AGFI < 0.90 and RMSEA > 0.05)8. Though
the study supports the existence of different stages of adoption in case of innovations which require
8 Modification indices shown by the SEM suggests to covary the last two stages, confirming that the two constructs are
not unique. The model was retested after merging both constructs which showed goodness of fit (chi-square/df < 5.00, p-value > 0.05, GFI and AGFI > 0.90, CFI > 0.95, RMSEA < 0.05) between observed model and theoretical model.

38
efforts to switch to new behavior, the results should be used cautiously as the last two subsequent
stages show high collinearity. However, the findings of the structural model reveal different predictors
of both stages, signaling a separation.
The study also successfully addresses the second research question by identifying and confirming
dynamic effects of innovation characteristics on consumer innovation adoption process further
verifying the stage existence. Knowledge stage is taken away from the structural model as individuals
at this stage know only about the innovation's existence and do not form a positive or negative
impression hence are less likely to use various criteria for innovation's evaluation. The results suggest
that individuals use different evaluative criterions during the multi-stage adoption process and different
perceived attributes affect stages differently (Alexander et al., 2008; Arts et al., 2011; Castaño et al.,
2008; Wood & Moreau, 2006). I found that perceived benefits of an innovation are relevant for
persuasion in line with the CLT argument (Trope & Liberman, 2003). Similarly, perceived losses of an
innovation are relevant for implementation stage in line with prospect theory (Kahneman & Tversky,
1979). However, the assumptions of both theories are not fully supported in case of decision and
confirmation stage. Infact, the study is unable to find numerous determinants of both stages. This is in
part inconsistent with the stage hypothesis confirmed from both surveys. Perceived ecology explains
variation in buying decision of a sustainable car and risk explains variation in confirming the future use
of an adopted car while all other expected relations could not be confirmed. A possible explanation is
that many other predictors that were not included in the research model due to explorative nature of this
study (for example observability, profitability, car cost, car design) could be additional possible
candidates. In this respect, Moore and Benbasat (1991) classification of innovation characteristics can
serve as a starting point. The present study combines financial, social, health/ safety, and functional
risks under a single latent construct. Testing the impact of each separately (Petschnig et al., 2014) may
affect stages in different ways (Castaño et al., 2008). Castaño and colleagues show that uncertainty
39
about potential benefits is more relevant for distant future decisions while uncertainty about switching
and learning costs is more pertinent for near future decisions. Others add (potential) adopter
characteristics and find relevance with adoption (Arts et al., 2011; Gatignon & Robertson, 1985;
Manning et al., 1995; Tornatzky & Klein, 1982). The other possible explanation is that many
relationships between exogenous and endogenous constructs were not hypothesized during the
literature review which may reveal significant results, if added. For example, complexity-decision link,
ecology-decision link, compatibility-confirmation link etc. show significant correlations (r = 0.15, 0.19,
and 0.42 respectively, table 1.10). The present work is an exploratory study which confirms the basic
assumption of stages' existence. Hence, it should be considered as a first step and used to extend the
existing framework by including other relevant innovation attributes or relationships.
5.2.Conclusion
Existing literature on consumer innovation adoption does not provide empirical validation of distinct
stages of innovation decision process neither typically differentiates between the impact of perceived
innovation characteristics on distinct stages despite the evidence that individuals use different product
evaluation criteria in different stages (see for example, Arts et al., 2011; Gardial, Clemons, Woodruff,
Schumann, & Burns, 1994; Karahanna, Straub, & Chervany, 1999; Wilton & Pessemier, 1981). The
results of this empirical research contribute to the existing knowledge which stands both in the
theoretical framework and in the implications.
The present study contributes by exploring five distinct stages in line with Rogers' (2003) framework of
innovation-decision process and identifying dynamic effects of perceived innovation attributes on each
adoption stage. The SEM technique helped not only to test the model but also to explicate the strongest
and weakest determinant of each stage by identifying the strengths of all relationships. This has
implications as it helps practitioners to understand the most/least weighted abstract and/or concrete

40
benefits that encourage potential adopters in their smooth transition to the next stage. The existing
literature on consumer adoption provides weak operationalization of the five stages, with few
exceptions (Celik et al., 2014; Li & Lindner, 2007; Gilly and Zeithmal, 1985). The study also
contributes by providing a valid and reliable scale for stages.
The findings of the study are also helpful for policy makers and practitioners to foster the diffusion of
technologies which are locked-in due to the dominance of existing technologies in the mass markets.
Since the information needs vary across stages, different messages and communication channels can be
used at different stages to improve (potential) adopters' perception. For example, in distant future
adoption case, managers should use communication strategies that engage individuals in an outcome
simulation which reduces performance uncertainties and encourage positive feelings while in near
future adoption case, managers should use strategies that engage them in a process simulation which
reduces switching cost and assuage fatigue and anxiety (Castaño et al., 2008). In particular, ads and
mass media messages which increase product awareness can help people at the knowledge stage pass to
the next level, peer and subjective opinion can help people at the persuasion stage to form positive
impression and pass to the next stage, while technical assistance by change agents or sales
representatives can help people reduce operational complexity at the implementation stage to pass to
the final stage (Rogers, 2003).
What's more, consumer's evaluation and adoption of a new product results in emotional responses that
should be considered during the development of product launch strategies (Wood and Moreau, 2006).
In this regards, designing a compelling value proposition (Anderson, Narus, & van Rossum, 2006) by
combining required functional and/or hedonic attributes is a suitable strategy to encourage non-
adopters pass through the adoption phases.

41
The main results of the study offer new insights for future research to enrich the much-studied
consumer innovation adoption literature. The results of the study should be verified in other similar
settings to address both the limitations discussed in the previous section. The findings show that
persuasion and implementation have numerous predictors but decision and confirmation are relatively
less explained. In this respect, correlation results provide opportunities to test more determinants. In the
case of sustainable cars, the last two stages seem similar but are not explained by the same set of
variables still favoring the distinction. Besides, another limitation of the present study is that majority
of the respondents in both surveys were non-adopters as obvious from sample statistics. Participants in
the two surveys were mainly in pre-adoption or adoption phases. Although the empirical setting was
chosen for practical reasons, findings especially for post adoption phases may change in the study with
sample of only adopters. The high association among several innovation attributes signals possible
interdependencies and testing such interlinks can be another avenue for future research.

42
References
Ajzen, I. (1991). The theory of planned behavior. Organizational Behavior and Human Decision
Processes, 50(2), 179-211. doi:10.1016/0749-5978(91)90020-T
Alexander, D. L., Lynch Jr, J. G., & Wang, Q. (2008). As time goes by: Do cold feet follow warm
intentions for really new versus incrementally new products?. Journal of Marketing
Research, 45(3), 307-319.
Anderson, J.C., Narus, J.A. & van Rossum,W. (2006). Customer value propositions in business
markets. Harvard Business Review, 84(3), 90-99.
Arrindell, W. A., & Van der Ende, J. (1985). An empirical test of the utility of the observations-to-
variables ratio in factor and components analysis. Applied Psychological Measurement, 9(2),
165-178.
Arts, J. W., Frambach, R. T., & Bijmolt, T. H. (2011). Generalizations on consumer innovation
adoption: A meta-analysis on drivers of intention and behavior. International Journal of
Research in Marketing, 28(2), 134-144.
Bass, F. M. 1969. A new product growth model for consumer durables. Management Science, 15, 215-
27
Beal, G. M., Rogers, E. M., & Bohlen, J. M. (1957). Validity of the concept of stages in the adoption
process. Rural Sociology, 22(2), 166-168.
Bowers, R. V. (1937). The direction of intra-societal diffusion. American Sociological Review, 2(6),
826-836.
Brownstone, D., Bunch, D. S., & Train, K. (2000). Joint mixed logit models of stated and revealed
preferences for alternative-fuel vehicles. Transportation Research Part B:
Methodological, 34(5), 315-338.
Castaño, R., Sujan, M., Kacker, M., & Sujan, H. (2008). Managing consumer uncertainty in the
adoption of new products: Temporal distance and mental simulation. Journal of Marketing
Research, 45(3), 320-336.
Celik, I., Sahin, I., & Aydin, M. (2014). Reliability and Validity Study of the Mobile Learning
Adoption Scale Developed Based on the Diffusion of Innovations Theory. International Journal
of Education in Mathematics, Science and Technology, 2(4).
Chong, A. Y. L., & Chan, F. T. (2012). Structural equation modeling for multi-stage analysis on radio
frequency identification (RFID) diffusion in the health care industry. Expert Systems with

43
Applications, 39(10), 8645-8654.
Coleman, J. S., Katz, E., & Menzel, H. (1966). Medical innovation: A diffusion study. Indianapolis:
Bobbs-Merrill Co.
Cooper, R. B., & Zmud, R. W. (1990). Information technology implementation research: a
technological diffusion approach. Management Science, 36(2), 123-139.
Copp, J. H., Sill, M. L., & Brown, E. J. (1958). The function of information-sources in the farm
practice adoption process. Rural Sociology, 23(2), 146-157.
Damanpour, F., & Schneider, M. (2006). Phases of the adoption of innovation in organizations: Effects
of environment, organization and top managers. British Journal of Management, 17(3), 215-236.
Egbue, O., & Long, S. (2012). Barriers to widespread adoption of electric vehicles: An analysis of
consumer attitudes and perceptions. Energy policy, 48, 717-729.
Eggers, F., & Eggers, F. (2011). Where have all the flowers gone? Forecasting green trends in the
automobile industry with a choice-based conjoint adoption model. Technological Forecasting
and Social Change, 78(1), 51-62.
Ewing, G. O., & Sarigöllü, E. (1998). Car fuel-type choice under travel demand management and
economic incentives. Transportation Research Part D: Transport and Environment, 3(6), 429-
444.
Ewing, G., & Sarigöllü, E. (2000). Assessing consumer preferences for clean-fuel vehicles: A discrete
choice experiment. Journal of Public Policy & Marketing, 19(1), 106-118.
Fishbein, M., & Ajzen, I. (1975). Belief, Attitude, Intention and Behavior: An Introduction to Theory
and Research. Reading, MA: Addison-Wesley.
Ford, J. K., MacCallum, R. C., & Tait, M. (1986). The application of exploratory factor analysis in
applied psychology: A critical review and analysis. Personnel Psychology, 39(2), 291-314.
Frambach, R. T. (1993). An integrated model of organizational adoption and diffusion of innovations.
European Journal of Marketing, 27 (5), 22-41.
Frambach, R. T., & Schillewaert, N. (2002). Organizational innovation adoption: A multi-level
framework of determinants and opportunities for future research. Journal of Business Research,
55(2), 163-176.
Frambach, R. T., Barkema, H. G., Nooteboom, B., & Wedel, M. (1998). Adoption of a service

44
innovation in the business market: an empirical test of supply-side variables. Journal of Business
Research, 41(2), 161-174.
Gardial, S. F., Clemons, D. S., Woodruff, R. B., Schumann, D. W., & Burns, M. J. (1994). Comparing
consumers' recall of prepurchase and postpurchase product evaluation experiences. Journal of
Consumer Research, 20(4), 548-560.
Gatignon, H., & Robertson, T. S. (1985). A propositional inventory for new diffusion research. Journal
of Consumer Research, 11 (4), 849-867.
Gilly, M. C., & Zeithaml, V. A. (1985). The elderly consumer and adoption of technologies. Journal of
consumer research, 353-357.
Gopalakrishnan, S., & Damanpour, F. (1997). A review of innovation research in economics, sociology
and technology management. Omega, 25(1), 15-28.
Grover, V., & Goslar, M. D. (1993). The initiation, adoption, and implementation of
telecommunications technologies in US organizations. Journal of Management Information
Systems, 10 (1), 141-163.
Hage, J., & Aiken, M. (1970). Social change in complex organizations. New York: Chicago.
Hair, J. F., Black, W. C., Babin, B. J., Anderson, R. E., & Tatham, R. L. (2006). Multivariate data
analysis (6th Ed.). New Jersey: Pearson Education.
Hameed, M. A., Counsell, S., & Swift, S. (2012). A conceptual model for the process of IT innovation
adoption in organizations. Journal of Engineering and Technology Management, 29(3), 358-390.
Hidrue, M. K., Parsons, G. R., Kempton, W., & Gardner, M. P. (2011). Willingness to pay for electric
vehicles and their attributes. Resource and Energy Economics, 33(3), 686-705.
Hoeffler, S. (2003). Measuring preferences for really new products. Journal of Marketing
Research, 40(4), 406-420.
Holak, S. L., & Lehmann, D. R. (1990). Purchase intentions and the dimensions of innovation: an
exploratory model. Journal of Product Innovation Management, 7(1), 59-73.
Jansson, J. (2011). Consumer eco‐innovation adoption: assessing attitudinal factors and perceived
product characteristics. Business Strategy and the Environment, 20(3), 192-210.
Jansson, J., Marell, A., & Nordlund, A. (2010). Green consumer behavior: determinants of curtailment
and eco-innovation adoption. Journal of consumer marketing, 27(4), 358-370.

45
Jansson, J., Marell, A., & Nordlund, A. (2011). Exploring consumer adoption of a high involvement
eco‐innovation using value‐belief‐norm theory. Journal of Consumer Behaviour, 10 (1), 51-60.
Kahneman, D., & Tversky, A. (1979). Prospect theory: An analysis of decision under
risk. Econometrica: Journal of the Econometric Society, 47 (2), 263-291.
Karahanna, E., Straub, D. W., & Chervany, N. L. (1999). Information technology adoption across time:
a cross-sectional comparison of pre-adoption and post-adoption beliefs. MIS Quarterly, 23 (2),
183-213.
Katz, E., Levin, M. L., & Hamilton, H. (1963). Traditions of research on the diffusion of
innovation. American Sociological Review, 8 (2), 237-252.
Kim, S., & Garrison, G. (2010). Understanding users’ behaviors regarding supply chain technology:
Determinants impacting the adoption and implementation of RFID technology in South
Korea. International Journal of Information Management, 30(5), 388-398.
Kimberly, J. R., & Evanisko, M. (1981). Organizational innovation: The influence of individual,
organizational, and contextual factors on hospital adoption of technological and administrative
innovations. Academy of Management Journal, 24, 689 – 713.
Ko, E., Kim, S. H., Kim, M., & Woo, J. Y. (2008). Organizational characteristics and the CRM
adoption process. Journal of Business Research, 61(1), 65-74.
Kohl, J. W. (1966). Adoption Stages and Perceptions of Characteristics of Educational Innovations.
Ed.D. Thesis, University of Oregon.
Lane, B., & Potter, S. (2007). The adoption of cleaner vehicles in the UK: exploring the consumer
attitude–action gap. Journal of Cleaner Production,15(11), 1085-1092.
Lassar, W. M., Manolis, C., & Lassar, S. S. (2005). The relationship between consumer innovativeness,
personal characteristics, and online banking adoption. International Journal of Bank
Marketing, 23(2), 176-199.
Li, Y., & Lindner, J. R. (2007). Faculty adoption behaviour about web‐based distance education: a case
study from China Agricultural University. British Journal of Educational Technology, 38(1), 83-
94.
Lynch Jr, J. G., & Zauberman, G. (2006). When do you want it? Time, decisions, and public
policy. Journal of Public Policy & Marketing, 25(1), 67-78.
Lynn, M. R. (1986). Determination and quantification of content validity. Nursing Research, 35(6),
382-386.

46
MacKenzie, S. B. (2001). Opportunities for improving consumer research through latent variable
structural equation modeling. Journal of Consumer Research, 28(1), 159-166.
Mahajan, V., Muller, E., & Bass, F. M. (1991). New product diffusion models in marketing: A review
and directions for research. In Diffusion of technologies and social behavior (pp. 125-177).
Berlin Heidelberg: Springer.
Manning, K. C., Bearden, W. O., & Madden, T. J. (1995). Consumer innovativeness and the adoption
process. Journal of Consumer Psychology,4(4), 329-345.
Matta, V., Koonce, D., & Jeyaraj, A. (2012). Initiation, experimentation, implementation of
innovations: the case for radio frequency identification systems. International Journal of
Information Management, 32(2), 164-174.
Meuter, M. L., Bitner, M. J., Ostrom, A. L., & Brown, S. W. (2005). Choosing among alternative
service delivery modes: An investigation of customer trial of self-service technologies. Journal of
Marketing, 69 (2), 61−83.
Meyer, A. D., & Goes, J. B. (1988). Organizational assimilation of innovations: A multilevel
contextual analysis. Academy of Management Journal, 31, 897-923.
Midgley, D. F., & Dowling, G. R. (1993). A longitudinal study of product form innovation: the
interaction between predispositions and social messages. Journal of Consumer Research, 19 (4),
611-625.
Moore, G. C., & Benbasat, I. (1991). Development of an instrument to measure the perceptions of
adopting an information technology innovation. Information Systems Research, 2(3), 192-222.
Nunally, J. C., & Bernstein, I. H. (1978). Psychometric theory. New York: McGraw-Hill.
Nunnally, J.C., Bernstein, I.H. (1994). Assessment of reliability. Psychometric Theory, 3 (1), 248–292.
Osborne, J. W., & Costello, A. B. (2009). Best practices in exploratory factor analysis: Four
recommendations for getting the most from your analysis. Pan-Pacific Management
Review, 12(2), 131-146.
Ostlund, L. E. (1974). Perceived innovation attributes as predictors of innovativeness. Journal of
Consumer Research, 1(2), 23-29.
Ozaki, R., & Sevastyanova, K. (2011). Going hybrid: An analysis of consumer purchase
motivations. Energy Policy, 39(5), 2217-2227.
Pemberton, H. E. (1936). The curve of culture diffusion rate. American Sociological Review, 1(4), 547-
556.

47
Pemberton, H. E. (1937). The effect of a social crisis on the curve of diffusion. American Sociological
Review, 2(1), 55-61.
Pemberton, H. E. (1938). The spatial order of culture diffusion. Sociology and Social Research, 22,
246-251.
Peters, A., & Dütschke, E. (2014). How do consumers perceive electric vehicles? A comparison of
German consumer groups. Journal of Environmental Policy & Planning, 16(3), 359-377.
Petschnig, M., Heidenreich, S., & Spieth, P. (2014). Innovative alternatives take action–Investigating
determinants of alternative fuel vehicle adoption. Transportation Research Part A: Policy and
Practice, 61, 68-83.
Pierce, J. L., & Delbecq, A. L. (1977). Organization structure, individual attitudes and
innovation. Academy of management review, 2(1), 27-37.
Rahim, S. A. (1961). Diffusion and Adoption of Agricultural Practices: A Study of Pattern
Communication, Diffusion and Adoption of Improved Agricultural Practices in a Village in East
Pakistan. Technical publication no. 7. Comilla, Pakistan: (Bangladesh) Academy for Village
Development.
Rezvani, Z., Jansson, J., & Bodin, J. (2015). Advances in consumer electric vehicle adoption research:
A review and research agenda. Transportation research part D: transport and environment, 34,
122-136.
Robertson, T. S. (1967). The process of innovation and the diffusion of innovation. The Journal of
Marketing, 14-19.
Robertson, T. S. (1974). A critical examination of adoption process models of consumer behavior. In J.
N. Sheth (Ed.), Models of buyer behavior: Conceptual, quantitative and empirical (pp. 271-
295). New York: Harper & Row.
Rogers, E. M. (1962). Diffusion of innovations. New York: Free Press.
Rogers, E. M. (1976). New product adoption and diffusion. Journal of Consumer Research, 2 (4), 290-
301.
Rogers, E. M. (1983). Diffusion of Innovations. New York: Free Press.
Rogers, E. M. (1995). Diffusion of Innovations. New York: Free Press.
Rogers, E. M. (2003). Diffusion of Innovations. New York: Free Press.
48
Rogers, E., & Beal, M. (1960). The adoption of the farm practices in a central Iowa community. Ames,
Iowa (No. 26). Special Report.
Ryan, B., & Gross, N. (1943). The diffusion of hybrid seed corn in two Iowa communities. Rural
Sociology, 8 (1),15–24.
Schonemann, P. H. (1990). Facts, fictions, and common sense about factors and
components. Multivariate Behavioral Research, 25(1), 47-51.
Schuitema, G., Anable, J., Skippon, S., & Kinnear, N. (2013). The role of instrumental, hedonic and
symbolic attributes in the intention to adopt electric vehicles. Transportation Research Part A:
Policy and Practice, 48, 39-49.
Schumpeter, J.A., 1934. The Theory of Economic Development: An Inquiry into Profits, Capital,
Credit, Interest, and the Business Cycle. Cambridge, MA: Harvard University Press.
Steenkamp, J. B. E., & Baumgartner, H. (2000). On the use of structural equation models for marketing
modeling. International Journal of Research in Marketing, 17(2), 195-202.
Tarde, G. (1903). The laws of imitation. New York: Henry, Holt and Co.
Tornatzky, L. G., & Klein, K. J. (1982). Innovation characteristics and innovation adoption-
implementation: A meta-analysis of findings. IEEE Transactions on Engineering Management,
EM-29 (1), 28-45.
Tornatzky, L., & Fleischer, M. (1990). The Process of Technology Innovation. Lexington,
MA: Lexington Books.
Trope, Y., & Liberman, N. (2003). Temporal construal. Psychological Review, 110 (3), 403-421.
Tzeng, G. H., Lin, C. W., & Opricovic, S. (2005). Multi-criteria analysis of alternative-fuel buses for
public transportation. Energy Policy, 33(11), 1373-1383.
Vallacher, R. R., & Wegner, D. M. (1987). What do people think they're doing? Action identification
and human behavior. Psychological Review, 94(1), 3-15.
Van de Ven, A. H., & Rogers, E. M. (1988). Innovations and organizations: Critical perspectives.
Communication Research, 15(5), 632-651.
Vellicer, W. F., & Jackson, D. N. (1990). Component analysis versus common factor analysis: Some
further observations. Multivariate Behavioral Research, 25(1), 97-114.
Vowles, N., Thirkell, P., & Sinha, A. (2011). Different determinants at different times: B2B adoption
of a radical innovation. Journal of Business Research, 64 (11), 1162-1168.

49
Widaman, K. F. (1990). Bias in pattern loadings represented by common factor analysis and
component analysis. Multivariate Behavioral Research, 25(1), 89-95.
Widaman, K. F. (1993). Common factor analysis versus principal component analysis: differential bias
in representing model parameters?. Multivariate Behavioral Research, 28(3), 263-311.
Wilton, P. C., & Pessemier, E. A. (1981). Forecasting the ultimate acceptance of an innovation: The
effects of information. Journal of Consumer Research, 8(2), 162-171.
Wood, S. L., & Moreau, C. P. (2006). From fear to loathing? How emotion influences the evaluation
and early use of innovations. Journal of Marketing, 70(3), 44-57.
Wright, P., & Weitz, B. (1977). Time horizon effects on product evaluation strategies. Journal of
Marketing Research, 4 (4) 429-443.
Zaltman, G., Duncan, R., & Holbek, J. (1973). Innovations and Organizations. New York: John Wiley
& Sons, Inc.
Ziegler, A. (2012). Individual characteristics and stated preferences for alternative energy sources and
propulsion technologies in vehicles: A discrete choice analysis for Germany. Transportation
Research Part A: Policy and Practice, 46(8), 1372-1385.
Zmud, R. W. (1982). Diffusion of modern software practices: influence of centralization and
formalization. Management Science, 28(12), 1421-1431.