san juan river fishes response to thermal modification … · response to thermal modification a...
TRANSCRIPT
San Juan River Utah/New Mexico
San Juan River FishesResponse to Thermal Modification
A White Paper Investigation
Ecosystems Research Institute February 2007 975 South State Highway Logan, Utah 84321

San Juan River FishesResponse to Thermal Modification
A White Paper Investigation
Prepared for:
San Juan River Recovery Implementation ProgramBiology Committee
Prepared by:
Dr. Vincent A. LamarraEcosystems Research Institute975 South State Highway 89-91
Logan, Utah 84321(435) 752-2580
February 2007
San Juan River Fishery Response to Thermal Modification Ecosystems Research Institute
TABLE OF CONTENTS
1.0 INTRODUCTION AND OVERVIEW ........................................................................ 1
2.0 OBJECTIVES ............................................................................................................. 2
3.0 SPECIES ACCOUNTS ............................................................................................... 2
3.1 Overview of Terminology and Approach ....................................................... 2
3.2 Native Species ................................................................................................ 5
3.3 Non-native Species ......................................................................................... 7
4.0 CASE STUDY OF THERMAL MODIFICATION IN THE UPPER COLORADORIVER ......................................................................................................................... 9
5.0 OVERVIEW OF THE SAN JUAN RIVER AND NAVAJO RESERVOIR ............... 12
5.1 San Juan River Thermal History .................................................................. 12
5.2 Habitat Availability ........................................................................................ 14
6.0 SPATIAL DISTRIBUTION OF SAN JUAN FISHES .............................................. 21
6.1 Fish and Temperature Distributions ............................................................ 22
7.0 CONCLUSIONS ......................................................................................................... 31
8.0 REFERENCES ........................................................................................................... 32
LIST OF FIGURES
Figure 1. The thermal niche for the rainbowtrout as defined by the Michigan HatcheryManual, 1968. Nomenclature used in thisreport is presented diagrammatically ............................................................... 4
Figure 2. The thermograph data (dailytemperature) from the Animas River atFarmington (RM 180) and the San JuanRiver (RM 205) in 1954 prior to damclosure. Annual thermal units (ATUs) werecalculated based upon the methods ofKaeding and Osmundson, 1988 .......... 11
Figure 3. The temporal distribution ofannual thermal units calculated fromaverage daily data at Browns Park on theGreen River ......................................... 11
Figure 4. The thermograph data (dailytemperature) from the Animas River atFarmington (RM 180) and the San JuanRiver (RM 205) in 1994 after dam closure.Annual thermal units (ATUs) werecalculated based upon the methods ofKaeding and Osmundson, 1988 .......... 13
Figure 5. A comparison of the thermographsfrom three station on the San Juan River in1995. Annual thermal units (ATUs) werecalculated based upon the methods ofKaeding and Osmundson, 1988 .......... 15
Figure 6. A comparison of minimum,maximum and daily average temperaturesin August 1995 at Archuleta andMontezuma Creek in the San Juan River............................................................... 15

San Juan River Fishery Response to Thermal Modification Ecosystems Research Institute
Figure 7. The thermal response (growth) forpikeminnow as determined by Black andBulkley 1985 and modified by Kaeding andOsmundson (1988) to reflect thecorresponding thermal units .............. 16
Figure 8. The average annual thermal unit(ATUs) with + one standard deviation forthe 11 San Juan River sites and the AnimasRiver at Farmington. Data are overallaverages before and after Navajo Damclosure .................................................. 16
Figure 9. A best fit polynomial regressionfor determining annual thermal units(above base 13/C) based upon river location.Data are from 1965 to 2004 ................ 18
Figure 10. The frequency distribution ofannual thermal units in the Animas Riverbefore 1962 and after 1965 ................. 18
Figure 11. The frequency distribution ofannual thermal units in the San Juan Riverfor years after 1965 ............................. 20
Figure 12. The date to reach 1575calculated cumulated degree days (fromJanuary 1). The 1575 DD is assumed to be athreshold value for pikeminnow spawningbased upon the data collected by Trammelland Chart (1999). Data are averages (+/-standard errors) for the time periods in theSan Juan River before and after closure ofNavajo Dam ......................................... 20
Figure 13. The spatial and temporaldistribution of temperatures (/C) in NavajoReservoir during 1998 and 1999 ........ 21
Figure 14. The average (1998-2002) CPUE(fish/mile) for flannelmouth sucker juvenileand adult in the San Juan River. Data arefrom Ryden 2002 ................................. 23
Figure 15. The average (1998-2002) CPUE(fish/mile) for bluehead sucker juvenile andadult in the San Juan River. Data are fromRyden 2002 .......................................... 24
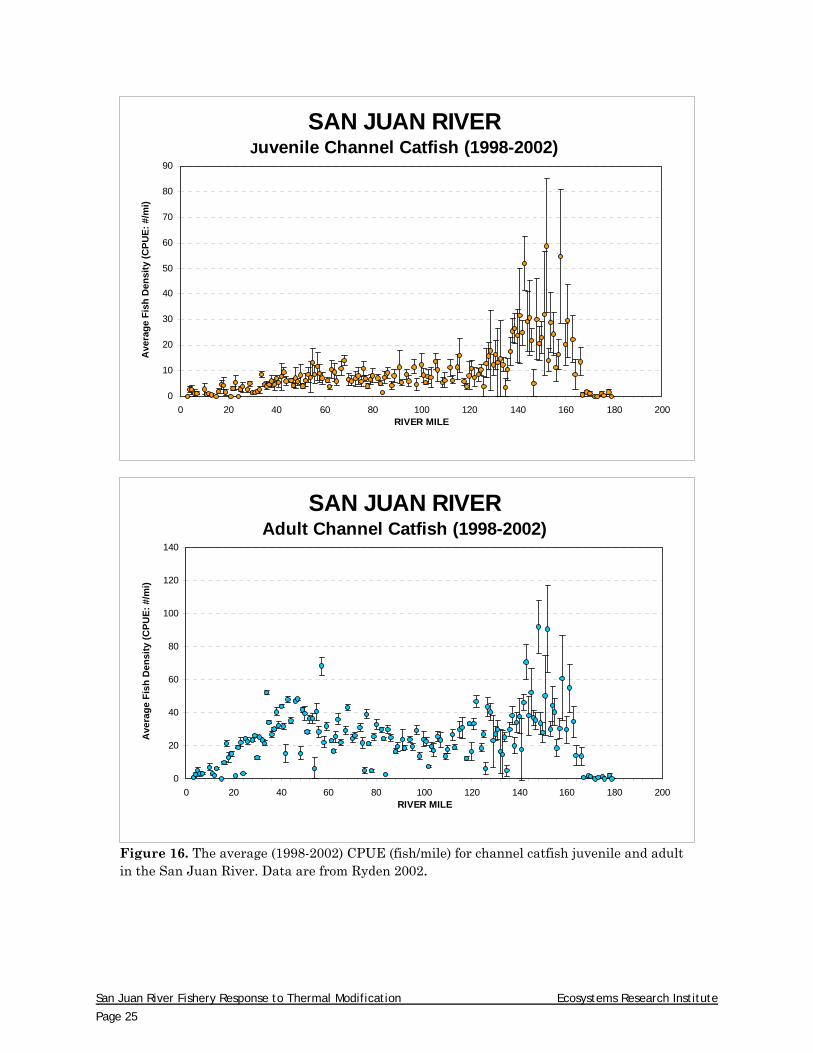
Figure 16. The average (1998-2002) CPUE(fish/mile) for channel catfish juvenile andadult in the San Juan River. Data are fromRyden 2002 .......................................... 25
Figure 17. The average (1998-2002) CPUE(fish/mile) for common carp juvenile andadult in the San Juan River. Data are fromRyden 2002 .......................................... 26
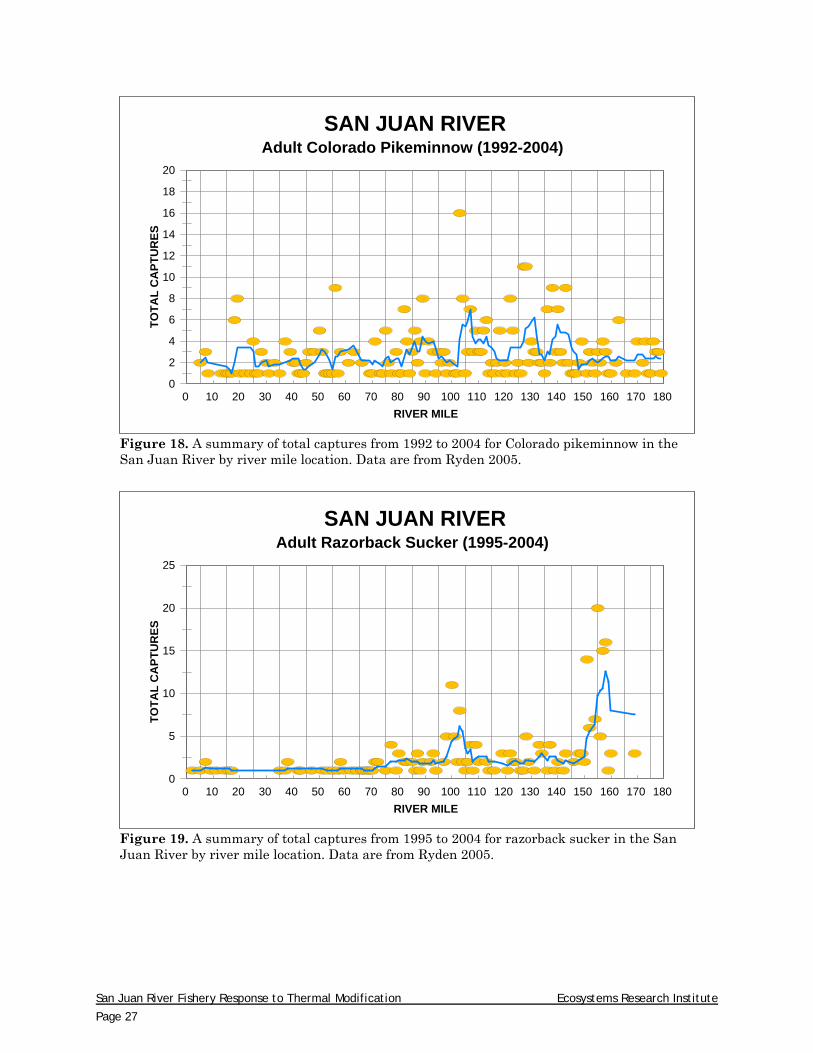
Figure 18. A summary of total capturesfrom 1992 to 2004 for Colorado pikeminnowin the San Juan River by river milelocation. Data are from Ryden 2005 ... 27
Figure 19. A summary of total capturesfrom 1995 to 2004 for razorback sucker inthe San Juan River by river mile location.Data are from Ryden 2005 .................. 27
Figure 20. The maximum observed dailyaverage temperature at seven locations inthe San Juan River in 1995. Data forMexican Hat is averaged from 2001-2002............................................................... 29
Figure 21. The number of days in Aprilwhere the average daily water temperaturewas above 12/C at each station in the SanJuan River during 1995. Data for MexicanHat are averages from 2001-2002 ...... 29
LIST OF TABLES
Table 1. The description of thermal nichesof various species found in the San JuanRiver based upon literature values.Comparison to San Juan River maximumsummer temperatures is also providedwhen available .................................... 3
Table 2. The spatial and temporaldistribution of temperature data for the SanJuan and Animas rivers. The data are fordaily values over an annual period .... 13
San Juan River Fishery Response to Thermal Modification Ecosystems Research Institute
Page 1
1.0 INTRODUCTION ANDOVERVIEW
The San Juan River Basin is an arid tosub-arid 60,000 square kilometer subbasinof the Colorado River, originating high inthe San Juan Mountains of Colorado andemptying into Lake Powell, a Bureau ofReclamation Reservoir (USGS 2005). In1962, the San Juan River was impoundedby Navajo Dam above Archuleta, NewMexico, as part of the Colorado StorageProject. Since that time, releases fromNavajo Dam have been a primary controlfeature for in-stream flows and variationsin aquatic habitat in San Juan River (fromthe base of the dam to Lake Powell). Priorto the construction of large scale dams andreservoirs, the Colorado basin supported aunique assemblage of endemic fishes mostof which have now been listed as federallyendangered species (Carlson and Muth1989; USFWS 1995).
The reduction in the populations of theColorado River fishes has been attributed toa number of factors. Primarily the buildingof mainstream dams, the associateddewatering or altered hydrographs,resultant changes in channelgeomorphology and water quality, as wellas the introduction of exotics, have beensuggested (Miller, 1961; Minckley andDeacon, 1968; Seehaler, 1978; Johnson andRenne, 1982). The thermal alteration belowthe dams has been suggested as a cause forreduced reproduction and downstreamdisplacement due to lower watertemperatures from hypolimnetic discharges(Vanicek, 1967; Vanicek et al., 1970;Holden, 1973; Seethaler, et al., 1976).
Within the San Juan River basin,Navajo Reservoir not only altered thenatural hydrograph, but also impacted
water quality. Because of the presence of ahypolimnetic (bottom of reservoir) waterrelease, the riverine temperaturesimmediately below the reservoir are nowcooler in the summer (4-8/C now vs. 20-25/C before the dam) and warmer in thewinter (4/C now vs. 0/C before the dam). Itwas therefore of interest to the San JuanRiver Recovery Implementation Program(SJRIP) to investigate the ramifications ofthese thermal alterations to the San JuanRiver’s downstream native and non-nativefish species as well as the spatial extent ofthese modifications.
Two preliminary investigations wereundertaken to help address this question.One investigation was to conduct a “whitepaper” literature review. The purpose ofthis review was to summarize the knownthermal requirements of the native anddominant non-native species in the SanJuan River below Navajo Dam.Understanding the thermal requirements ofthe fish species in the river would allowinferences to be made about observedspatial community changes due to rivertemperature alterations below Navajo Dam.In addition, the literature review could actas a partial basis for evaluating thefeasibility of warming Navajo Reservoirwater releases in the future.
Native species considered included theColorado pikeminnow (Ptychocheiluslucius), razorback sucker (Xyrauchentexanus), roundtail chub (Gila robusta),flannelmouth sucker (Catostomuslatipinnis), and bluehead sucker(Catostomus discobolus). Non-native speciespresent in the San Juan River and coveredin this review included channel catfish(Ictalurus punctatus), common carp(Cyprinus carpio), largemouth bass(Micropterus salmoides), striped bass
San Juan River Fishery Response to Thermal Modification Ecosystems Research Institute
Page 2
(Morone saxatilis), and rainbow trout(Oncorhynchus mykiss). In order to betterdefine the thermal requirements for thesespecies, literature reviews were separatedby life stages where possible. It is fullyacknowledged that thermal changes withinthis river system will also effect the detritaldecomposition, periphyton andmacroinvertebrate communities. It ishowever beyond the scope of this review todescribe impacts to these system-widecomponents.
The literature review was conducted inconjunction with a second investigation.This study centered on thermal modeling onNavajo Reservoir and the San Juan Riverbelow the dam. This work was completed bythe Bureau of Reclamation and is availablein a separate report.
2.0 OBJECTIVES
The literature review conducted in this“White Paper Investigation” centered onone major objective. This objective, oncecompleted and in conjunction with thethermal modeling, would allow inferencesto be made concerning the probableresponses of the fishery to thermalmodifications at Navajo Reservoir. To helpin this analysis, two additional reviewswere undertaken and are covered underobjectives 2 and 3, below. The specificproject objectives are:
Objective 1. Review and summarize thethermal requirements of the majornative and non-native species found inthe San Juan River from Navajo Dam toits confluence with Lake Powell;
Objective 2. Review and summarize “casestudies” of riverine responses toreservoir thermal modifications below alarge western reservoir; and,
Objective 3. Briefly summarize the currentspatial distribution of San Juan Riverfishes and conduct preliminary analysisof causative factors.
Each of these objectives will be coveredin a separate section of this report.
3.0 SPECIES ACCOUNTS
The following are summaries of thethermal requirements of the major fishspecies found in the San Juan River. Theliterature reviewed included peer-reviewedjournal articles, gray literature (agency orrecovery program reports), abstracts ofpresentations, and thesis or dissertations.Temperature-related studies included awide range in investigative approaches,such as laboratory studies or direct fieldobservations. Because of the wide array ofstudies, the available thermal toleranceinformation has been summarized in agraphical-tabular format. Table 1 is thesummary of the available information onthe temperature requirements of the tenmajor fish species in the San Juan River (5native and 5 non-native). In addition, ashort narrative summary for each species isprovided.
3.1 Overview of Terminology andApproach
In the review process, a wide range ofnomenclatures were encountered. Thesehave been normalized across all reports inthis literature review in order to minimizeconfusion over definitions of thermaltolerances. A graphical summary of thenomenclature used in this report ispresented in Figure 1. In this figure, theexample used is rainbow trout, thedominant species found in the San JuanRiver immediately below Navajo Reservoir.

San Juan River Fishery Response to Thermal Modification Ecosystems Research Institute
Page 3
Table 1. The description of the thermal niches of various species found in the San Juan River based upon literature values.The maximum observed summer temperatures which correspond to the maximum longitudinal fish densities in the San JuanRiver is also provided where available. The table represents a summary from Section 3.0 and Section 6.0 of this report.
TEMPERATURE (/C) Authors
8 9 10 11 12 13 14 15 16 17 18 19 20 21 22 23 24 25 26 27 28 29 30 31 32 33 34 35
Channel Catfish Allen & Strawn 1968, Aquatic LifeHabitat Assessment (internetliterature), Buentello et al. 2000,Brown 1942, Byerly et al. 2005,Clemens & Sneed 1957, WarmWater Fishes Optimal Temperatures(internet literature), San Juan River28.6/C
Egg X
Larval X
Juvenile X O X
Adult X O A O X
Largemouth Bass Adams et al. 1982, Aquatic LifeHabitat Assessment (internetliterature), Coutant 1975, Rice et al.1983, Scheller et al. 1999, Stuber etal. 1982
Egg O X
Larval O X
Juvenile O O O O O O O
Adult O O O O O O O
Colorado Pikeminnow Bestgen 1996, Bestgen & Bundy1998, Bestgen & Williams 1994,Bestgen et al. 1998, Bulkley & Berry1983, Bliesner & Lamarra 2000,Carter et al. 1985, Clarkson & Childs2000, Marsh 1985, Hammon 1981,Tyus & Hanies 1991, Black 1982,San Juan River 25-26/C
Egg X O O O O O X
Larval A O X
Juvenile O X
Adult O A
Flannelmouth Sucker Bestgen & Crist 2000, Clarkson &Childs 2000, Deacon et al.1987,Holden & Crist 1981, Robins &Childs 2001, Valdez 1990, Word etal. 2002, Deacon et al. 1987 -25.9/C, San Juan River 25.0/C
Egg X
Larval X O
Juvenile X O
Adult A
Common Carp Aquatic Life Habitat Assessment(internet literature), Backiel &Stegman 1968, Davies et al. 1986,San Juan River 22-23/C
Egg O X
Larval X
Juvenile X
Adult O A X
Roundtail Chub Bestgen 1985, Chart et al. 1999,Propst, David L. (internet literature),Southeastern Utah’s Fish Species(internet literature), Deacon et al.1987 - 23.8/C
Egg X O O O O
Larval
Juvenile O
Adult O
Razorback Sucker Bulkley & Berry 1983, Clarkson &Childs 2000, Gorman & Vanhoosen2001, Marsh 1985, Minckley 1991,Papoulias & Minckley 1992, Valdez1999, Bozek 1984, Valentine 1981,San Juan River 22-23/C
Egg X O O X
Larval X O O X
Juvenile X O O X
Adult O A
Striped Bass Aquatic Life Habitat Assessment(internet literature), Bettoli 2005,Moss 1985, Southeastern Utah’sFish Species (internet literature)
Egg O O O
Larval O O O
Juvenile O O O O O O O O O O X
Adult O O O O O O O O O O X
Bluehead Sucker Bestgen & Crist 2000, Gorman &Vanhoosen 2001, Holden & Crist1981, Robins & Childs 2001, Valdez1990, San Juan River <20/C
Egg O O X
Larval X O O X
Juvenile X
Adult O A
Rainbow Trout Hokanson & Koenst 1986, Huh et al.1976, Siegworth & Summerfelt 1990,Smith & Koenst 1975, Summerfelt1996, Warm Water Fishes OptimalTemperatures (internet literature)
Egg O O O X
Larval O O X
Juvenile O O X
Adult O O O X
Tolerance limits A Maximum observed summer temperatures which correspond to the maximum longitudinal fish densities
X Known minimum or maximum O Optimum temperature compiled from various studies

San Juan River Fishery Response to Thermal Modification Ecosystems Research Institute
Page 4
Figure 1. The thermal niche for the rainbow trout as defined by the Michigan HatcheryManual, 1968. Nomenclature used in this report is presented diagrammatically.
This example is modified from the MichiganHatchery Manual 1968 and USBOR 1999.
For the Colorado River and itstributaries, there has not been a basin-widestatistical analysis of the thermalconditions and the associated distribution ofthe native or non-native species such as theanalysis conducted by Huff et al. (2005) forwestern and northern Oregon. That studyclearly distinguished the thermal niches of16 separate species based upon summermaximum temperatures.
There have, however, been severalexcellent reviews of the observed thermalconditions experienced by the rare fish inthe Colorado River. The reader is directedto Joseph et al. (1977) and Miller and
Hubert (1990). These citations representsummaries of investigations conducted on anumber of the rare and endangered speciesin the Colorado River.
Most of the information regardingthermal requirements and preferences ofthe native species in the Colorado Riverbasin have come through field observationsof fish assemblage distributions alongthermal gradients. In an unalteredcondition, seasonal riverine temperaturessystematically change with distancedownstream (Section 5.0). Thesetemperature changes result in complexbioenergetics changes such as consumption,respiration, excretion, and growth in thefish, as well as ontogenetic shifts in
San Juan River Fishery Response to Thermal Modification Ecosystems Research Institute
Page 5
temperature-related physiology betweenlarval, juvenile, and adult fish. These intra-specific changes combined with inter-specific competition and food availabilityresults in the observed fish distributionsalong thermal gradients. Observations suchas those noted by Lamarra (2004) where thedensity of the two dominant native and thetwo dominant non-native fish species werestrongly correlated with river mile (RM),and presumably temperature are heavilydrawn upon by this review. Although it isfully acknowledged that the spatialdistribution of any species within a riversystem is an interaction among a largearray of factors, the analysis conducted byLamarra (2004) indicated that primarilytemperature and secondarily habitat werethe best predictors of fish densities.
In addition to field observations, somethermal preference studies have been directlaboratory studies under controlledconditions or, fish culture data for several ofthe native (e.g. pikeminnow and razorback)and non-native fish (e.g. catfish). Thesestudies, combined with the observationaldata, have resulted in a weight of evidenceconclusion about thermal tolerances for theSan Juan fishes.
Lastly, this literature review looked atthe modification of Flaming GorgeReservoir thermal outflow characteristicswhich provided a “field test” of the responseof fish assemblages before damming, afterdamming with cold releases, and afterdamming with warm releases (Vanicek1967; Kitcheyan and Montagne 2005).
3.2 Native Species
Colorado pikeminnow(Ptychocheilus lucius)
The Colorado pikeminnow has beenrecognized by the federal government asendangered since 1967 and was one of theoriginal species protected under theEndangered Species Act of 1973 (FederalRegister 39(3):1175). Because of the specieslarge size and its wide distribution in theupper Colorado River, the Green River andthe Yampa River, the pikeminnow is themost well known and extensively studied ofthe endemic Colorado River fish (1,181citations starting in 1952:http://www.mesc.usgs.gov/products/data/COFishBib/cosquaw.asp. Within the San JuanRiver, all life-history stages except eggshave been found during the RecoveryImplementation Program (RIP)investigative period (1991-2005). Mostrecently, pikeminnow have been stocked aslarvae or Age-0 fish in the upper reaches ofthe river (Ryden 2003) in an attempt toincrease population sizes.
Most researchers have found spawningto occur when water temperatures reach20/C to 22/C (Hammer 1981; Haynes et al.1984; Tyus 1990). Laboratory and fieldstudies suggest that optimal temperaturesfor hatching are 20/C to 24/C with aminimum tolerance limit of 16/C. Hatching,swimbladder inflation and exogenousfeeding occur sooner under fluctuatingtemperatures than constant temperatures.In addition, no eggs hatch below 14/C andlarvae that were hatched at 30/C were allabnormal and had 100 percent mortality.The optimum range for growth across allother life stages for the Coloradopikeminnow is 20/C to 28/C, with anoptimal (maximum) temperature of 25/C.Laboratory studies found optimum growth

San Juan River Fishery Response to Thermal Modification Ecosystems Research Institute
Page 6
at 25/C with no growth below 13/C.Optimum sustained swimming speed foradult pikeminnow was found to be 20/C.Within the San Juan River, 24/C was theaverage temperature recorded during fielddocumentation of larval Coloradopikeminnow. In addition, the observed (orestimated) maximum summer temperaturein the San Juan River for peak pikeminnowcaptures was found to be 25.5/C. 1
Razorback sucker (Xyrauchentexanus)
The razorback sucker was extirpatedfrom the San Juan River prior to itsreintroduction in 1994 (Ryden 1997). Thespecies has been found to be spawning inthe San Juan River since 1997. Ryden(2001) has noted that field observations ofspawning aggregations of ripe females werefound in 1997, 1999, and 2001, as well asrazorback larvae from 1998 to 2001. Anaggressive stocking program (Ryden 2001)has resulted in the razorback being thethird most common sucker in the San JuanRiver.
Field observations in the lower ColoradoRiver Basin found spawning razorbacksuckers in January to May whentemperatures are 10.5/C to 21/C. Ripefemales were captured in the San Juan armof Lake Powell (March-April) when watertemperatures were 12/C to 20/C. A morenarrow temperature range for razorbacksucker spawning is 15/C to 18/C in theGreen and Yampa rivers, based upon thecollection of ripe fish. Laboratory studies
have shown that the optimal temperaturefor razorback sucker hatching is 20/C to21/C . However, both laboratory studies andfield investigations in the Colorado RiverBasin have documented egg survival acrossa broader temperature range (8-25/C). Forexample, hatching studies found eggsincubated at 10/C or 30/C experiencedcomplete mortality. However, if acclimated,eggs were hatched at 10/C, but hadcomplete mortality at 8/C. The optimumtemperature range for larval and juvenilerazorback suckers is similar (9-25/C), withan optimal temperature of 20/C to 21/C.Field investigations have suggested thatthe optimum temperature range for adultrazorback suckers is 8/C to 26/C, with anoptimal temperature of 21/C. For the SanJuan River, peak captures have occurredwhere maximum summer temperatureswere approximately 22/C to 23/C. 2
Flannelmouth sucker (Catostomuslatipinnis)
The flannelmouth sucker populations inthe San Juan River represent the highestbiomass of any of the native species.Although populations have declined andrebounded over the RIP period (1991-2005),the population has retained it dominancewithin the river system. All life stages havebeen collected in the river, including eggs.
Laboratory studies and fieldinvestigations in the Colorado River Basinhave documented egg, larval, and juvenilegrowth for the flannelmouth sucker across afairly broad temperature range (11-22/C).The optimal temperature for larval and
1 Colorado pikeminnow temperature sources:Bestgen 1996; Bestgen and Bundy 1998; Bestgen andWilliams 1994; Bestgen et al. 1998; Bulkley and Berry1983; Bliesner and Lamarra 2000; Carter et al. 1985;Clarkson and Childs 2000; Marsh 1985; Hammon 1981;Tyus and Haynes 1991; Black 1982; Hayes and Muth1984.
2 Razorback Sucker temperature sources: Bulkleyand Berry 1983; Clarkson and Childs 2000; Gormanand Vanhoosen 2001; Marsh 1985; Minckley 1991;Papoulias and Minckley 1992; Valdez 1990; Valentine1981; Holden 1973.

San Juan River Fishery Response to Thermal Modification Ecosystems Research Institute
Page 7
juvenile flannelmouth suckers is 20/C to21/C. Adult flannelmouth suckers havedemonstrated the ability to survive andgrow at temperatures as low as 10/C to12/C below Glen Canyon Dam. Theoptimum temperature range for adultflannelmouth suckers is 10/C to 30/C, withan optimal temperature of 25/C for growth.For the San Juan River, the distribution ofadult fish reaches a maximum densitywhere maximum summer temperature wasfound to be 25/C. 3
Bluehead sucker (Catostomusdiscobolus)
This species is the second most commonnative fish in the San Juan River. Itsspatial distribution tends to be furtherupstream when compared to the othernative suckers. All life-history stages havebeen collected in the San Juan River, withthe exception of eggs.
Optimal hatching temperature for thebluehead sucker is 20/C to 21/C with amaximum tolerance limit of 26/C. Thetemperature range for larval growth is 8/Cto 26/C. Both larval and juvenile blueheadsuckers have a minimum temperaturetolerance limit for growth of 8/C. Theoptimum temperature range for adultbluehead suckers is 8/C to 25/C, with anoptimal temperature of 20/C. For the SanJuan River, populations are still trendingupward at RM 180 (the uppermost adultmonitoring site). Maximum summertemperatures at this location were 20/C. 4
Roundtail chub (Gila robusta)
Roundtail chub are only found in themainstem of the San Juan River onoccasion (Ryden 2000, Propst and Hobbes2000), although is was abundant upon theclosure of Navajo reservoir (Olsen 1963). Atthe present time, the species is found in themajor tributaries near Farmington, NewMexico (Miller and Rees 2000).
Optimal hatching temperature for theroundtail chub is 23/C to 26/C with aminimum tolerance limit of 17/C. Theoptimum temperature range for eggsurvival is 16/C to 26/C and for larval fishit is 20/C to 23/C. There are no dataavailable on the specific temperaturepreferences for juvenile or adult roundtailchub. 5
3.3 Non-Native Species
Channel catfish (Ictaluruspunctatus)
Channel catfish are the most commonnon-native fish in the San Juan River andposes one of the greatest biological threatsto the re-establishment of Coloradopikeminnow and razorback sucker in theriver basin.
The optimum temperature range forhatching and larval success for channelcatfish is 21/C to 29/C with a maximumtolerance limit of 29/C. Optimaltemperature for juvenile and adult channelcatfish is 28/C. The optimum temperaturerange for juvenile and adult channel catfishis 21/C to 30/C, with a maximum tolerance
3 Flannelmouth sucker temperature sources:Bestgen and Crist 2000; Clarkson and Childs 2000;Deacon et al.1987; Holden and Crist 1981; Robins andChilds 2001; Valdez 1990; Ward et al. 2002; Paukertand Rogers 2004.
4 Bluehead sucker temperature sources: Bestgenand Crist 2000; Gorman and Vanhoosen 2001; Holden
and Crist 1981; Robins and Childs 2001; Valdez 1990.
5 Roundtail chub temperature sources: Bestgen1985; Chart et al. 1999; Propst; David L. Aquatic LifeHabitat Assessment 2007; Southeastern Utah’s FishSpecies, 2006.

San Juan River Fishery Response to Thermal Modification Ecosystems Research Institute
Page 8
limit of 35/C. In the San Juan River,maximum densities of channel catfish arewell-defined. Juvenile densities in the SanJuan River peak at the locationscorresponding to a maximum summertemperature of 28/C corresponding, whileadults distributions correspond to maximumsummer temperature of 25/C. 6
Common carp (Cyprinus carpio)
Common carp are the second mostcommon non-native fish in the San JuanRiver. They are a native to Eurasia andwere widely stocked during the first half ofthe twentieth century throughout theUnited States as a potential food source.
The optimum temperature range forhatching and larval survival for commoncarp is 20/C to 26/C with a maximumtolerance limit of 26/C. The mean optimaltemperature for egg hatching success is21/C. The optimum temperature range forjuvenile and adult common carp is 16/C to33/C with a maximum tolerance limit of35/C. In the San Juan River, peak densitiescorrespond to 22/C to 23/C maximumsummer temperatures. 7
Largemouth bass (Micropterussalmoides)
Largemouth bass are found in lowdensities in the San Juan River Basin incomparison to other non-natives. However,they continue to threaten the recovery ofnative species.
The optimum temperature range forhatching and larval success for largemouthbass is 20/C to 30/C with a maximumtolerance limit of 30/C. The optimaltemperature for egg and larval success is21/C. The optimum temperature range forjuvenile and adult largemouth bass is 21/Cto 35/C. The optimal temperature forjuvenile and adult largemouth bass is 24/Cto 30/C. 8
Striped bass (Morone saxatilis)
Lake Powell has a self-sustainingpopulation of striped bass that move out ofthe lake in the spring and into the SanJuan River to spawn (Ryden 2001). Stripedbass continue to pose a major threat torecovery of native fish in the San JuanRiver Basin. Observations by Ryden (2001)in the San Juan River demonstrated thatstriped bass can move at least 150 milesupstream from Lake Powell and consumenative species within the river system.
The optimum temperature range forhatching and larval success for striped bassis 10/C to 21/C. Optimal temperatures foregg and larval success are 17/C to 19/C. Theoptimum temperature range for juvenileand adult striped bass is 16/C to 31/C witha maximum tolerance limit of 31/C. Theoptimal temperature for juvenile and adultstriped bass is 16/C to 25/C.9
6 Channel catfish temperature sources: 2007;Buentello et al. 2000; Byerly et al. 2005; Warm WaterFishes Optimal Temperatures, 2006.
7 Common carp temperature sources: Aquatic LifeHabitat Assessment, 2007; Backiel and Stegman 1968;Davies et al. 1986.
8 Largemouth bass temperature sources: AquaticLife Habitat Assessment. 2007; Rice et al. 1983;Scheller et al. 1999; Stuber et al. 1982.
9 Striped bass temperature sources: Aquatic LifeHabitat Assessment. 2007; Bettoli 2005; Moss 1985;Southeastern Utah’s Fish Species (internet literature).

San Juan River Fishery Response to Thermal Modification Ecosystems Research Institute
Page 9
Rainbow Trout (Oncorhynchusmykiss)
Rainbow trout are abundant in the firstfifteen miles of the San Juan River belowNavajo Dam. The first three miles belowthe dam is considered one of the besttailwater rainbow trout fisheries in theUnited States. Rainbow trout exceeding 15inches in length are consistently caught byrecreational anglers in the three mile reachbelow Navajo Dam(http://www.troutsource.com/RiversFolder/SanJuan.htm).
The optimum temperature range forrainbow trout across all life stages is 7/C to18/C. Temperatures above 25/C are lethal and15/C is the average optimal temperature forlarval, juvenile, and adult rainbows. Theoptimal temperature for hatching success is13/C. Tolerance limits are from 0/C to 20/C.10
4.0 CASE STUDY OF THERMALMODIFICATION IN THEUPPER COLORADO RIVER
The construction, operation andmodification of Flaming Gorge Dam on theGreen River in Utah represents anunparalleled case study in the thermalmodification of a river system and thesubsequent biological implications.Historically, native species includingColorado pikeminnow and razorbacksuckers were widely distributed in thetributaries of the upper Colorado Riverbasin, including the Green River.
From 1959 to 1962, prior to the closureof Flaming Gorge Dam, there were five fishcollection efforts. Observations indicated
that native species inhabited the area inlarge numbers (Vanicek et al. 1970; Modde,2001). The temperatures near the dam priorto closure ranged from 0.5/C in January to21.1/C in July.
After closure in 1962, Flaming GorgeDam caused major changes in the ecology ofthe downstream Green River by alteringseasonal flow and temperatures up to 65miles downstream to the confluence withthe Yampa River (Vanicek 1967). After damclosure, river temperatures were modifiedand reflected the bottom reservoir watertemperatures. Although temperatures inthe winter increased to 5/C to 7/C,maximum summer temperatures decreaseddown to 6/C to 10/C in July. The impactwas seen down river as far as theconfluence with the Yampa River. Themagnitude was dependent upon the watervolume released from the dam in the springand summer.
Vanicek (1967) noted that the nativefish community in the immediate vicinityand up to 26 miles below the dam werereplaced by rainbow and brown trout. Intwo of the four years studied after the damclosure, Vanicek (1967) found that therewas no reproduction of native species in theGreen River above the confluence with theYampa River. He attributed the lack ofreproduction to high flows and lowertemperatures.
Further observations by Vanicek et al.1970 and Holden and Crist 1981 continuedto document the decline of the native fishcommunity within the Green River belowFlaming Gorge Dam. They concluded thatthe colder water releases altered the nativefish fauna by eliminating most reproductionbetween the dam and the confluence withthe Yampa River. 10 Rainbow trout temperature sources: Huff et al.
2005; Stoltz and Schnell 1991; Schneider and Connors1982.

San Juan River Fishery Response to Thermal Modification Ecosystems Research Institute
Page 10
In 1978, the penstocks at Flaming GorgeDam were modified to release warmerwater in order to improve the non-nativetailwater trout fishery. In 1992, flows werere-regulated in order to better reflect anatural hydrograph.
During this process of “fine tuning” theflow and temperature conditions below thedam, the biological response from the nativefish community has followed eachimprovement. For example, with the initialtemperature modifications, native speciesstarted to return to the lower Green River.Holden and Crist reported in 1981 that theycollected two pikeminnow in the GreenRiver. Karp and Tyus (1990) collected threemore of the same species several yearslater. In addition to the rare species(pikeminnow), flannelmouth and blueheadsuckers were the most common nativespecies caught in Lodore Canyon. Duringthis same time (1987-1989), trout were atthe same densities as flannelmouth suckersin Lodore Canyon.
After re-regulation of flows in 1992,Bestgen and Crist (2000) captured 17pikeminnow greater than 500 mm in size inthe Green River above the confluence withthe Yampa River. This alone has indicatedthat the combination of increased summertemperatures and adjusted flows haveallowed a reoccupation of habitat by nativespecies.
More recently, Kitcheyan and Montagne(2005), using a variety of techniques,captured 78 pikeminnows between 2000and 2002 in the Green River above theYampa River. In their study, they foundthat temperatures ranged from1.5/C to24.5/C. The farthest upstream capture wasapproximately 28 miles below FlamingGorge Dam. They have hypothesized thatpikeminnow may be using the Green River
(specifically sites in Lodore Canyon) forspawning. However, no ripe females orlarval fish have been caught in the UpperGreen River above the Yampa Riverconfluence.
As will be discussed in Section 5.2 ofthis report, the use of annual thermal units(ATUs) as an integration tool in theassessment of growth for Coloradopikeminnow has value in the analysis ofFlaming Gorge thermal modifications andthe response of pikeminnow to thosealterations. Using the methodologydescribed by Kaeding and Osmundson(1988), ATUs were calculated for the GreenRiver at Browns Park. These data can beseen in Figure 2. This data indicates thatfrom 1992 to 1999, the average annual ATUwas 22 units while the period 2000-2005had 36 ATUs. Inspection of Figure 2indicates that 2002 was the year with thehighest ATUs and corresponded to the timeperiod with highest pikeminnow captures.Kaeding and Osmundson (1988) suggestthat 40 ATUs is a threshold level forpermanent habitation by pikeminnow.
As noted in the preceding discussion,the initial low downstream temperaturesand the ultimate warming due to structuralmodifications has resulted in the reuse of50 percent of the habitat lost in the GreenRiver below the dam (30 miles of theoriginal 65 miles) and has directlydemonstrated that the initial impacts of alarge western dam can be partially offset bystructural design modifications and bychanging reservoir operations.Furthermore, the Flaming Gorge experiencehas shown that some degree of thermalmodification can accommodate both anoutstanding tailwater trout fishery and thenative fish community (although displaced20-30 miles downstream).

San Juan River Fishery Response to Thermal Modification Ecosystems Research Institute
Page 11
0
10
20
30
40
50 A
NN
UA
L TH
ERM
AL
UN
ITS
19871988
19891990
19911992
19931994
19951996
19971998
19992000
20012002
20032004
2005
YEAR
GREEN RIVERATUs at Browns Park
Figure 2. The temporal distribution of annual thermal units calculated from average dailydata at Browns Park on the Green River.
0
5
10
15
20
25
30
Tem
pera
ture
(°C
)
01/01 01/31 03/02 04/01 05/01 05/31 06/30 07/30 08/29 09/28 10/28 11/27 12/27 Date
San Juan River at Blanco (99.9 ATU) Animas at Farmington (97.7 ATU)
THERMAL COMPARISONS: PRE-NAVAJO DAMAnimas River and SJR at Blanco (1954)
Figure 3. The thermograph data (daily temperature) from the Animas River at Farmington(RM 180) and the San Juan River (RM 205) in 1954 prior to dam closure. Annual thermalunits (ATUs) were calculated based upon the methods of Kaeding and Osmundson, 1988.

San Juan River Fishery Response to Thermal Modification Ecosystems Research Institute
Page 12
5.0 OVERVIEW OF THE SANJUAN RIVER AND NAVAJORESERVOIR
The San Juan River was impounded byNavajo Dam between 1962 and 1965. Theoperations of the dam have modified thehydrology and water quality (most notablywater temperature) of the downstream SanJuan River. The purpose of this section is todescribe the historical and current thermalconditions of the San Juan River and toplace the possible impacts to fishdistributions into perspective.
5.1 San Juan River Thermal History
Historical daily temperature data forthe San Juan River was collected andsummarized at several locations over thetime period from 1949 to 2004. The yearswhen stations have had complete years ofdaily data were used and can be seen inTable 2. A total of twelve stations werereviewed. Prior to the dam being built, sixlocations downstream from the dam sitehad daily data for a year, including theAnimas River in Farmington, New Mexico.Beginning in 1962 Navajo reservoir startedfilling and modified the San Juan Riverhydrology. After 1965, only one site fromthe original six (Rosa) had no data. Theremaining five stations continued collectingdata to some degree after 1965. In addition,six new stations have collected at least oneyear of daily data after dam closure in 1965.Overall, the most extensive set was fromthe Animas River in Farmington, NewMexico (RM 180) with data available for 50of the 54 years. The least extensive datawere from Rosa (RM 224) with only twoyears of data.
Inspection of the thermographs beforeand after Navajo Dam closure indicatedthat the Animas River at Farmington (RM
180) and the San Juan River at Blanco (RM205) had almost identical temperaturesprior to the Navajo Dam closure. This canclearly be seen in Figure 3.
A comparison of the two stations showsthat the minimum temperatures occurredin December and January (0/C) at bothstations and both stations had maximumsin August (>25/C). Regressions between thetwo stations revealed an intercept of 0 andan r2 of 0.82. This comparison done prior toclosure indicates that the Animas River inFarmington at its confluence with the SanJuan River had similar thermal conditionsas the San Juan at Blanco (RM 205).
Data from 1994 (which represents apost-closure condition in the San Juan atBlanco) was also compared graphically forthe same two stations. The results of thiscomparison can be seen in Figure 4.
The magnitude of differences of thetemperatures between these two sites is theresult of the closure of Navajo Dam and thesubsequent hydrologic modification of theSan Juan River. Although the shape of thetwo curves are remarkably similar, theactual temperatures are greatly reduced atthe Blanco site in the summer and higher inthe winter. In this respect, the data aresimilar to water temperatures in the GreenRiver below Flaming Gorge Dam (Vaniceket al. 1970) prior to withdrawalmodifications and for the Colorado Riverbelow Glen Canyon Dam (USBOR 1999). Inboth cases, as with Navajo Dam, releasesare from the hypolimnetic region of thereservoir.
In order to demonstrate the spatialtemperature differences within the SanJuan River, a comparison was madebetween three thermograph stations for1995. This year was selected because it has

San Juan River Fishery Response to Thermal Modification Ecosystems Research Institute
Page 13
0
5
10
15
20
25
30
Tem
pera
ture
(°C
)
01/01 01/31 03/02 04/01 05/01 05/31 06/30 07/30 08/29 09/28 10/28 11/27 12/27 Date
San Juan River at Blanco (5.2 ATU) Animas at Farmington (94.2 ATU)
THERMAL COMPARISONS: POST-NAVAJO DAMAnimas River and SJR at Blanco (1994)
Figure 4. The thermograph data (daily temperature) from the Animas River at Farmington (RM180) and the San Juan River (RM 205) in 1994 after dam closure. Annual thermal units (ATUs)were calculated based upon the methods of Kaeding and Osmundson, 1988.
7.5 12.5 17.5 22.5 27.5 32.5 37.5 42.5 47.5 52.5 57.5 62.5 67.5
1949 1952 1955 1958 1961 1964 1967 1970 1973 1976 1979 1982 1985 1988 1991 1994 1997 2000 2003
Rosa(RM 224)
Archuleta(RM 215)
Blanco(RM 205)
Bloomfield(RM 195)
Lee Acres(RM 188)
Farmington(RM 179)
Shiprock(RM 148)
Four Corners(RM 119)
Montezuma Creek(RM 93)
Bluff(RM 76)
Mexican Hat(RM 51)
Animas at Farmington(RM 180)
Table 2. The spatial and temporal distribution of temperature data from the San Juan and Animasrivers. Data for the Animas River is near the confluence of the San Juan at RM 180. The data are fordaily values over an annual period.
San Juan River Fishery Response to Thermal Modification Ecosystems Research Institute
Page 14
been one of three years since 1994 that theprimary hydrologic conditions established inthe Flow Recommendation Report have beenmet. As can be seen in Figure 5, the averagedaily summer temperatures at Archuleta (RM205), Lee Acres (RM 188) and MontezumaCreek (RM 93) are progressively higher asthey move downstream. However, thereverse can be seen in the fall where the siteclosest to the dam (Archuleta) has the highesttemperatures with temperatures decreasing atdownstream stations. The importantconsideration to note is that even after closureof Navajo Dam, there is still a seasonalchange that occurs in the temperature of theriver and that the magnitude of that changeincreases with distance from Navajo Dam.
The datasets discussed within this sectionand illustrated in Figures 3 through 5demonstrate temporal patterns as well asspatial changes of water temperatures in theSan Juan River. However, it should be notedthat there is also a diel (daily) variation totemperatures in the San Juan River. Using theAugust 1995 data from the site closest toNavajo Dam (Archuleta) and furthestdownstream (Montezuma Creek), a 4/C to5/C daily variation in temperature can be seen(Figure 6). This variation occurs at bothstations in approximately equal magnitude.
5.2 Habitat Availability
To help compare the historical andexisting thermal conditions in the San JuanRiver and its possible effects on habitatavailability, an analysis of the spatialdistributions of river temperatures as theyrelate to the potential thermal niche ofColorado pikeminnow was undertaken usingthe approach developed by Kaeding andOsmundson (1988).
In this approach, mean daily temperatureswere converted to thermal unit values (TUs)ranging from 0 to 1.0 based on the growthwith Colorado pikeminnow at temperaturesranging from 10/C to 30/C (from thelaboratory work of Black 1982; Black andBulkley 1985). In their method (Kaeding andOsmundson 1998), temperatures less than13/C were assigned a value of 0. Averagedaily temperatures of 25/C were assigned avalue of 1.0 (highest value corresponding to atemperature of maximum growth forpikeminnow). The assignment of daily TUswas in the same proportion as the observedgrowth at the test temperatures over therange of 13/C to 30/C. As temperaturesincreased above 25/C, the thermal unitsdecreased proportionally. This is showndiagrammatically in Figure 7. The daily TUswere summed to obtain a single annual value(ATUs).
This methodology, based upon thegrowth of Colorado pikeminnow, representeda systematic way of integrating an annualthermograph into a single number forcomparison between sites. Furthermore, theanalysis of Kaeding and Osmundson (1988),later confirmed by Osmundson (1999),indicated that a value of 40 ATUs appeared tobe associated with the upper riverinedistribution of Colorado pikeminnow in theYampa River and the Upper Colorado River.
Using historical temperature datapreviously discussed including data collectedas part of the SJRIP (Bliesner 1991-2004),ATUs were calculated at those stations in theSan Juan River shown in Table 2. The datadeveloped in this analysis allowed inferencesas to the habitat available to pikeminnow pre-and post-closure of Navajo Dam.

San Juan River Fishery Response to Thermal Modification Ecosystems Research Institute
Page 15
SAN JUAN RIVERTemperature Comparisons (1995)
5
10
15
20
25
30
8/1 8/3 8/5 8/7 8/9 8/11 8/13 8/15 8/17 8/19 8/21 8/23 8/25 8/27 8/29 8/31DATE
TEM
PER
ATU
RE (°
C)
SJR at Archuleta SJR at Montezuma Creek
Figure 6. A comparison of minimum, maximum and daily average temperatures in August1995 at Archuleta and Montezuma Creek in the San Juan River.
0
5
10
15
20
25
30 Te
mpe
ratu
re (°
C)
01/01 01/31 03/02 04/01 05/01 05/31 06/30 07/30 08/29 09/28 10/28 11/27 12/27 Date
Archuleta (0.0 ATU) Lee Acres (22.2 ATU) Montezuma Creek (64.1 ATU)
THERMAL COMPARISONS: POST-NAVAJO DAMSan Juan River Sites (1995)
Figure 5. A comparison of the thermographs from three station on the San Juan River in1995. Annual thermal units (ATUs) were calculated based upon the methods of Kaeding andOsmundson, 1988.

San Juan River Fishery Response to Thermal Modification Ecosystems Research Institute
Page 16
SAN JUAN RIVERTemperature Comparisons (1949-2004)
0
20
40
60
80
100
120
140
224 215 205 195 188 179 148 119 93 76 51 ANIMASR.RIVER MILE
AN
NU
AL
THER
MA
L U
NIT
S (B
ase
13°C
PRE-DAM (1949-1962) POST-DAM (1965-2004)
Figure 8. The average annual thermal unit (ATUs) with + one standard deviation for the 11San Juan River sites and the Animas River at Farmington. Data are overall averages beforeand after Navajo Dam closure.
THERMAL RESPONSETemperature vs. Growth
0
15
30
45
60
75
10 15 20 25 30 35 40
TEMPERATURE (°C)
GR
OW
TH (m
m/ti
me)
0
0.2
0.4
0.6
0.8
1
THER
MA
L U
NIT
(ATU
)
Figure 7. The thermal response (growth) for pikeminnow as determined by Black andBulkley 1985 and modified by Kaeding and Osmundson (1988) to reflect the correspondingthermal units.

San Juan River Fishery Response to Thermal Modification Ecosystems Research Institute
Page 17
The annual average ATUs for eachthermograph site shown in Table 2 isgraphed in Figure 8. The data shows that if40 ATUs is a critical thermal criteria forpikeminnow habitation, the pikeminnowcould have inhabitated the San Juan Riverat the location of the Rosa station, as wellas the river downstream. Prior to the damclosure, the San Juan River at Rosa was atan ATU value near 40. With distancedownstream, the ATUs increased in a linearmanner for the next 30 miles. The onlyother available data in the San Juan before1965 was data at Farmington (RM 179).The ATUs at Farmington were nearly thesame as the upstream location atBloomfield (RM 195). However, as will bediscussed later, the San Juan Rivertemperatures at the Farmington stationwas and is influenced by the Animas Riverbecause the San Juan River site is locatedbelow the confluence of the two rivers. Asshown in Figure 8, the pre-closure averageATU for the Animas River was less thanthe San Juan River at Bloomfield,indicating that the Animas River may haveslightly cooled the San Juan River prior to1965.
The post-closure thermal environmentbased upon the average ATUs issignificantly different when compared tothe pre-closure averages. Before 1962, 40ATUs were present at the dam site (RM224), while after 1965, no (0) ATUs werecalculated for this site. At both Archeluta(RM 215) and Blanco (RM 205), the post-closure ATUs were calculated to less than 5ATUs. From this low level, the river warmscontinuously (as evidenced by a linearincrease of 0.91 ATUs/mile) for the next 86miles (to Four Corners). Although the ATUswere still increasing down to Mexican Hat(RM 51), the rate of change was reduced to0.31 ATUs/mile. In the post-closure
environment, the 40 ATU level calculates tobe at approximately RM 186.9, based upona best fit polynomial regression noted inFigure 9.
A comparison of thermographs betweenthe Animas River and the San Juan atBlanco before and after closure of NavajoDam noted thermal changes at Blanco after1965 (Figures 3 and 4). A review of thesefigures shows that there are also ATUsprovided for each site and condition. Thisdata indicates that in 1954, both sites hadapproximately identical annual thermalunits (99 and 96 ATUs). In 1994, afterclosure of the dam, the Blanco site had only5.1 ATUs while the Animas was 94 ATUs(near the 1954 level). Due to NavajoReservoir releases, the thermal units atBlanco were about 5 percent of pre-closurelevels. These data indicate that under post-closure conditions, the potential habitat forColorado pikeminnow has been reduced.
As noted above, the Animas River hadthe most extensive temperature data of anylocation (Table 2). In addition, the averagecalculated ATU based upon a base level of13/C was not significantly different betweenthe pre- and post-dam closure periods(Figure 8) at this site. Inspection of the yearto year variability for the pre- and post-closure periods shows similar ATUfrequency distributions (Figure 10),indicating similar thermal ranges for theyears pre- and post-closure. Based uponsimilar forcing factors (e.g. weather), it isanticipated that the San Juan River wouldhave had similar relative distributions ofATUs.
It is not unreasonable to assume that ifresponding to some critical thermal regime,pikeminnow would abandon or invade areasdepending on thermal conditions. This typeof frequency distribution cannot be

San Juan River Fishery Response to Thermal Modification Ecosystems Research Institute
Page 18
SAN JUAN RIVERTemperature Comparisons (1965-2004)
y = -0.000040x3 + 0.012486x2 - 1.559711x + 156.550121R2 = 0.968187
0
20
40
60
80
100
120
140
0 25 50 75 100 125 150 175 200 225 250
RIVER MILE
ANN
UAL
TH
ERM
AL
UNIT
S (B
ase
13°C
)
Figure 9. A best fit polynomial regression for determining annual thermal units (above base13/C) based upon river location. Data are from 1965 to 2004.
0
10
20
30
40
PER
CEN
T O
F TO
TAL
OB
SER
VATI
ON
S
<40 40-50 50-70 70-90 90-100 100-110 110-120 >120ANNUAL THERMAL UNITS (Base 13°C)
Pre-Dam (1949-1962) Post-Dam (1965-2004)
ANIMAS RIVERATU Distributions
Figure 10. The frequency distribution of annual thermal units in the Animas River before1962 and after 1965.
San Juan River Fishery Response to Thermal Modification Ecosystems Research Institute
Page 19
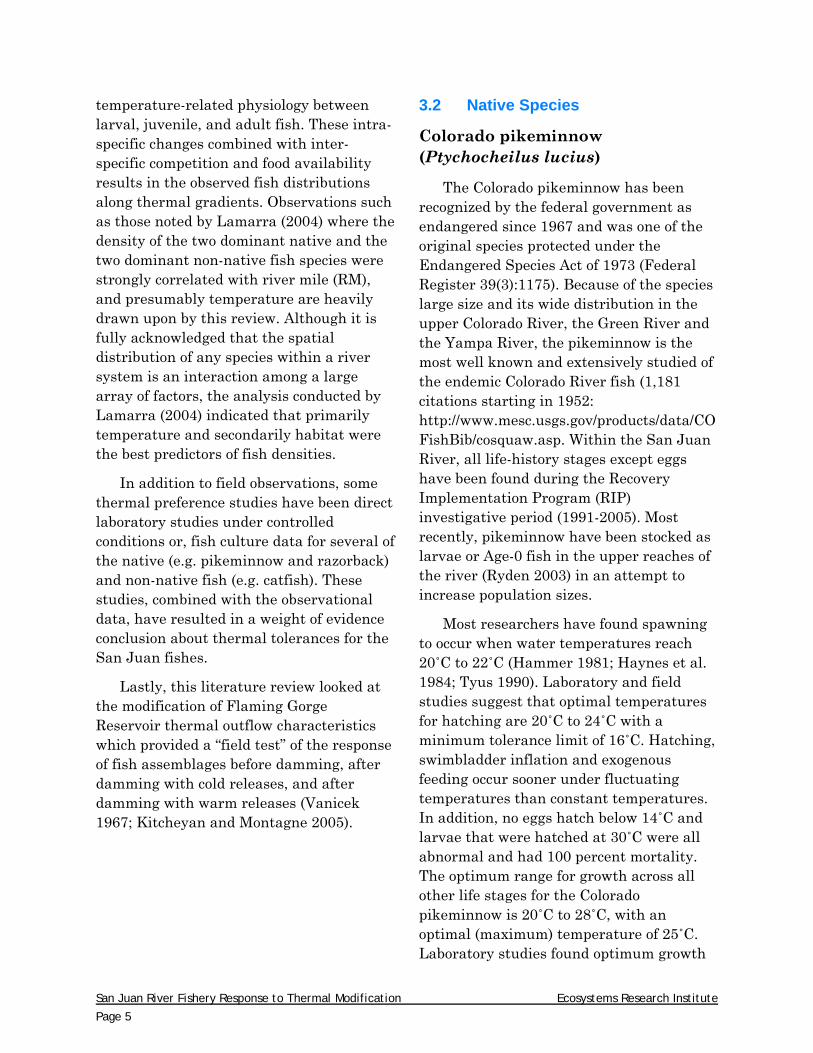
calculated for the San Juan River directlybecause of lack of available data except forFarmington (Figure 11), which is directlyeffected by discharges from the AnimasRiver. Even so, the ATUs at theFarmington site have been less than thepotential 40 ATU threshold 25 percent ofthe time since 1965. Unlike the pre-damclosure period, where the Animas River wascooler than the San Juan River, in the post-closure period the Animas River is warmerthan the river it enters and thus addsthermal units to the San Juan River belowits confluence. The San Juan River abovethe Animas River at Farmington may haveless than 40 ATUs more than 25 percent ofthe years.
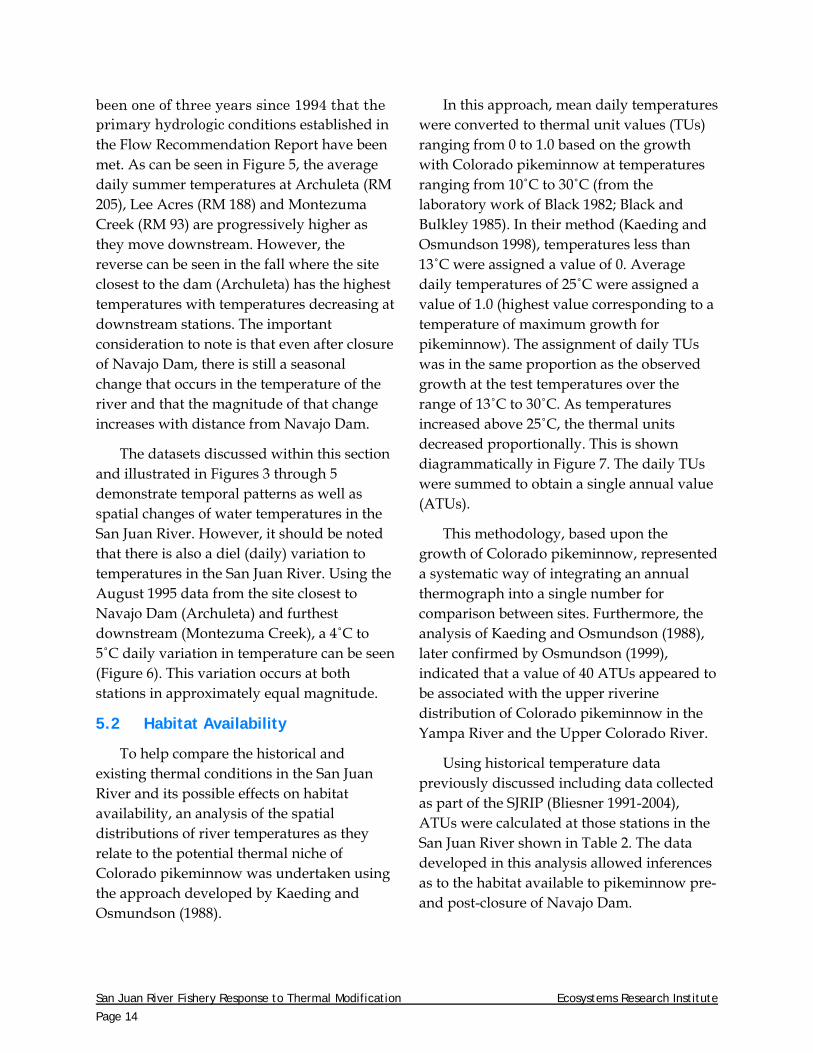
In addition to growth effects as notedabove, the thermal modifications of the SanJuan River by the construction andoperation of Navajo Reservoir may effectother life history requirements of the rarefishes in the San Juan River. To this end,an analysis of potential spawning effectswas undertaken using the work ofTrammell and Chart (1999). In their 5-yearstudy (1992-1996) of pikeminnow larvalproduction in the Colorado River, theyfound a correlation coefficient of 0.99between the degree days (DD) to spawn(starting on January 1) and the catch rateof larval pikeminnow (numbers per 1000cubic meters) in the Moab area. A re-analysis of their data indicated a thresholdvalue of 1,575 DD was necessary forsuccessful capture of larval pikeminnow. Ifone assumes that 1,575 DD represents thecumulative thermal history necessary forsuccessful spawning of pikeminnow, degreedays can be calculated for the San JuanRiver prior to and after closure of NavajoDam. This analysis can be seen in Figure12. Before the closure of the dam, the SanJuan River attained on average 1,575 DD
by August 6 at Rosa, July 11 at Archuleta,June 24 at Blanc, June 19 at Bloomfieldand June 14 at Farmington. The AnimasRiver attained 1,575 DD by June 24 for theyears prior to Navajo Dam closure. Theamount of time necessary to attain 1,575DD in the San Juan River has beensignificantly altered by Navajo Damreleases. For example, at Archuleta it nowtakes on average an additional 32 days toattain 1,575 DD. The same is true forBlanco (37 days), Bloomfield (48 days) andFarmington (10 days). Because there is notemperature data before 1962 prior toNavajo Dam for Shiprock, inspection of thepre-dam Farmington data can indicate thepotential changes. Considering thatFarmington was, on average, attaining1,575 DD on June 14 prior to Navajo Damclosure which was very similar to the SanJuan River from Four Corners anddownstream (Montezuma Creek, Bluff andMexican Hat) post-closure with a date ofJune 12-14. Based upon this data, it is verypossible that Shiprock’s cumulative thermalstructure (cumulative degree days) is beingaltered by Navajo Dam releasetemperatures by delaying the attainment of1,575 DD by an estimated 13 days.
Temperature is an important componentin the spawning activity of Coloradopikeminnow (Hammer 1981; Haynes et al,1984; Trammell and Chart, 1999). Thequantitative effects of the thermalconditions necessary for spawning arepoorly understood. Hammer (1981) hassuggested that 20-22/C is the optimaltemperature for spawning, while Hayes etal (1984) observed spawning attemperatures as low as 18/C. Trammell andChart (1999) suggest that the 18/Cthreshold has little biological significance.Their data indicates that thermal historymay provide a better indication of
San Juan River Fishery Response to Thermal Modification Ecosystems Research Institute
Page 20
SAN JUAN RIVERDate to Accumulation of 1,575 Degree Days
220
193
176171
166
177
209
225
214 210
177 180
165 165 167
155
171
192
Apr-01
Apr-21
May-11
May-31
Jun-20
Jul-10
Jul-30
Aug-19
Sep-08
224 215 205 195 179 148 119 93 76 51 AnimasR
Green RRIVER MILE
AVE
RA
GE
DA
TE
PRE-DAM (1949-1962) POST-DAM (1965-2004)
Figure 12. The date to reach 1575 calculated cumulated degree days (from January 1). The1575 DD is assumed to be a threshold value for pikeminnow spawning based upon the datacollected by Trammell and Chart (1999). Data are averages (+/- standard errors) for the timeperiods in the San Juan River before and after closure of Navajo Dam.
0
10
20
30
40 PE
RC
ENT
OF
TOTA
L O
BSE
RVA
TIO
NS
<40 40-50 50-70 70-90 90-100 100-110 110-120 >120ANNUAL THERMAL UNITS (Base 13°C)
SAN JUAN RIVER AT FARMINGTONATU Distributions
Figure 11. The frequency distribution of annual thermal units in the San Juan River foryears after 1965.

San Juan River Fishery Response to Thermal Modification Ecosystems Research Institute
Page 21
0
5
10
15
20
25
30
Tem
pera
ture
(°C
)
03/30 05/07 06/14 07/21 08/28 10/05 11/12 12/20 01/26 03/04 04/11 05/19DATE
SURFACE 10 FEET 40 FEET 60 FEET 80 FEET 100 FEET
SAN JUAN RIVERNavajo Reservoir Temperature 1998-1999
Figure 13. The spatial and temporal distribution of temperatures (/C) in Navajo Reservoirduring 1998 and 1999.
reproductive timing when combined withthe magnitude of flow. In the San JuanRiver, the cumulative thermal history asdetermined by cumulative degree days hasbeen significantly altered as fardownstream as Farmington and quitepossibly Shiprock.
From March 1998 to June 1999,Lamarra (1999) collected hourlytemperature data at seven depths (surface,10 feet, 20 feet, 40 feet, 60 feet, 80 feet, and100 feet). These data can be seen in Figure13. For analysis purposes, the 40-foot depthstrata was used as an example of anoptimum temperature for rainbow trout asa hypothetical thermal release from NavajoReservoir. The resulting thermographwould produce (at the dam) approximately10 ATUs. This release pattern wouldimprove the trout fishery (e.g. FlamingGorge thermal modification) by providingtemperatures within their optimum growthrange (Figure 1), as well as provide
significant thermal units downstream forColorado pikeminnow. These thermalmodifications may improve the habitatconditions for Colorado pikeminnow as farupstream as Bloomfield (RM 195). Thissame release pattern would also result in aJuly 14 date to attain 1,575 DD, howeverthe absolute temperature with this releasepattern would never exceed 15/C and thusnever attain the 18/C threshold suggestedby Haynes et al (1984).
6.0 SPATIAL DISTRIBUTION OFSAN JUAN FISHES
The existing literature on the thermalrequirements of the major species in thefish community of the San Juan River hasbeen reviewed in this report. In addition,the environmental conditions prior to andafter the closure of Navajo Dam have beenbriefly described. An attempt has also beenmade to infer the changes in Coloradopikeminnow habitat that could have

San Juan River Fishery Response to Thermal Modification Ecosystems Research Institute
Page 22
occurred as a result of the reservoir’splacement and operation and that couldoccur if thermal modifications were made tothe dam. Based upon the aboveinformation, as well as the exhaustiveamount of fishery and temperature databetween Farmington and Lake Powell, itwas felt that a comparison of the San JuanRiver fish thermal regimes to those found inthe literature was warranted. This maythen allow inferences to be drawn aboutpossible changes to the fish community(other than rare species) with thermalmodification at Navajo Dam.
6.1 Fish and TemperatureDistributions
Adult monitoring catch-per-unit-effort(CPUE) data from 1998 to 2002 was used tosummarize the longitudinal distribution ofthe major species in the fish community ofthe San Juan River. These data are bestsuited to describe the river-wide spatialpattern because they cover the entire riverfrom RM 180 to RM 2, and all the CPUEcollections were made at comparable times(fall of the year).
To further simply the analysis, singlespecies distribution was obtained byaveraging the five years of CPUE data foreach river mile for each of the fournumerically dominant species (Figures 14-17). In addition, standard errors for eachriver mile was also calculated for this 5-year period and distributional data forColorado pikeminnow (Figure 18) andrazorback suckers (Figure 19) wereobtained from an analysis conducted byBliesner 2006. Because of the low numberof captures, a summation of captures byriver mile from 1994 to 2004 during adultmonitoring was used as a distributionalindex (rather than an average CPUE andthe associated standard error).
A previous analysis conducted byLamarra (2004) using step-wise multipleregressions and Principals ComponentAnalysis indicated that when using thedominant habitat types as well astemperature (river mile location), thedominant factor predicting fish density wastemperature (river mile designator). Thisriver-wide analysis further indicated thatthe level of correlation with temperaturevaried by life-history stage and year. Thegoodness-of-fit value (r2) between river mileor temperature and the location of blueheadand flannelmouth suckers ranged between0.87 and 0.54, indicating that location (RM)or temperatures were a significant factor indetermining longitudinal densities of thesenative species in the San Juan River, moreso than any other habitat factor.
Inspection of the distributional patternof the fish in Figures 14 through 19indicates that for juvenile flannelmouth,juvenile and adult blueheads, and possiblyrazorback suckers, the full distributionalpattern was not available from the adultmonitoring data. In the case of the notedspecies, it appears that their densities arestill increasing above RM 180, the upperend point of adult monitoring. Peakpopulation sizes (as estimated by CPUE) forthese fish are more than likely higher thanat RM 180. Given this disclaimer, thetemperature preference analysis for thesefish assumed that their distributions peaknear RM 180.
As noted by a number of authors(Deacon et al. 1987; Scheller et al. 1999;Huff et al 2005), ambient temperatures forriverine species can define the species rangelimits. Because fishes in western riversexperience a wide range of temperatures,especially low winter extremes (nearing0/C), low winter temperatures do notappear as a factor in the longitudinal

San Juan River Fishery Response to Thermal Modification Ecosystems Research Institute
Page 23
SAN JUAN RIVERJuvenile Flannelmouth Sucker (1998-2002)
0
20
40
60
80
100
120
140
160
180
0 20 40 60 80 100 120 140 160 180 200RIVER MILE
Ave
rage
Fis
h D
ensi
ty (C
PUE:
#/m
i)
SAN JUAN RIVERAdult Flannelmouth Sucker (1998-2002)
0
50
100
150
200
250
300
0 20 40 60 80 100 120 140 160 180 200RIVER MILE
Ave
rage
Fis
h D
ensi
ty (C
PUE:
#/m
i)
Figure 14. The average (1998-2002) CPUE (fish/mile) for flannelmouth sucker juvenile (top)and adult (bottom) in the San Juan River. Data are from Ryden 2002.

San Juan River Fishery Response to Thermal Modification Ecosystems Research Institute
Page 24
SAN JUAN RIVERAdult Bluehead Sucker (1998-2002)
0
50
100
150
200
250
300
350
0 20 40 60 80 100 120 140 160 180 200RIVER MILE
Aver
age
Fish
Den
sity
(CPU
E: #
/mi)
Figure 15. The average (1998-2002) CPUE (fish/mile) for bluehead sucker juvenile (top) andadult (bottom) in the San Juan River. Data are from Ryden 2002.
SAN JUAN RIVERJuvenile Bluehead Sucker (1998-2002)
0
20
40
60
80
100
120
140
160
180
0 20 40 60 80 100 120 140 160 180 200RIVER MILE
Aver
age
Fish
Den
sity
(CPU
E: #
/mi)
San Juan River Fishery Response to Thermal Modification Ecosystems Research Institute
Page 25
SAN JUAN RIVERJuvenile Channel Catfish (1998-2002)
0
10
20
30
40
50
60
70
80
90
0 20 40 60 80 100 120 140 160 180 200RIVER MILE
Ave
rage
Fis
h D
ensi
ty (C
PUE:
#/m
i)
SAN JUAN RIVERAdult Channel Catfish (1998-2002)
0
20
40
60
80
100
120
140
0 20 40 60 80 100 120 140 160 180 200RIVER MILE
Ave
rage
Fis
h D
ensi
ty (C
PUE:
#/m
i)
Figure 16. The average (1998-2002) CPUE (fish/mile) for channel catfish juvenile and adultin the San Juan River. Data are from Ryden 2002.

San Juan River Fishery Response to Thermal Modification Ecosystems Research Institute
Page 26
SAN JUAN RIVERJuvenile Common Carp (1998-2002)
0
5
10
15
20
25
30
35
40
45
50
0 20 40 60 80 100 120 140 160 180 200RIVER MILE
Ave
rage
Fis
h D
ensi
ty (C
PUE:
#/m
i)
SAN JUAN RIVERAdult Common Carp (1998-2002)
0
10
20
30
40
50
60
0 20 40 60 80 100 120 140 160 180 200RIVER MILE
Ave
rage
Fis
h D
ensi
ty (C
PUE:
#/m
i)
Figure 17. The average (1998-2002) CPUE (fish/mile) for common carp juvenile and adult inthe San Juan River. Data are from Ryden 2002.
San Juan River Fishery Response to Thermal Modification Ecosystems Research Institute
Page 27
0
2
4
6
8
10
12
14
16
18
20 TO
TAL
CA
PTU
RES
0 10 20 30 40 50 60 70 80 90 100 110 120 130 140 150 160 170 180 RIVER MILE
SAN JUAN RIVERAdult Colorado Pikeminnow (1992-2004)
Figure 18. A summary of total captures from 1992 to 2004 for Colorado pikeminnow in theSan Juan River by river mile location. Data are from Ryden 2005.
0
5
10
15
20
25
TOTA
L C
APT
UR
ES
0 10 20 30 40 50 60 70 80 90 100 110 120 130 140 150 160 170 180 RIVER MILE
SAN JUAN RIVERAdult Razorback Sucker (1995-2004)
Figure 19. A summary of total captures from 1995 to 2004 for razorback sucker in the SanJuan River by river mile location. Data are from Ryden 2005.

San Juan River Fishery Response to Thermal Modification Ecosystems Research Institute
Page 28
distribution of fish. For both warm and coldwater species, their upper thermal rangeswill most likely define their downstreamdistributions (Osmundson 1999). Therefore,the use of maximum summer temperatures(which do change with distance upstream)seems a reasonable approach to helpestimate the preferred temperature forthese species. In the case of the San JuanRiver, maximum temperatures occur in themiddle of August and fish surveys occur inSeptember and October. A comparison wastherefore made between the maximumobserved temperatures at seven stations inthe San Juan River (Figure 20) and thedistribution of fish over the same area. Thelocation of peak populations densities(CPUE or total captures) were thencompared to the maximum temperaturesnear that location. These data have beensummarized in Table 1. The assumptionmade in this analysis is that the fish aredistributed longitudinally based upontemperature (Lamarra 2004) and that themaximum observed temperature (at thelocation of highest density) corresponds tothe preferred temperature and optimumgrowth (Jobling 1981) for that species. Theauthor does however acknowledge thatother factors do play an important role inthe observed distributions of these fish,however, the analyses conducted to dateindicates that temperature plays adominant role and that factors such as food,inter and intra specific competition as wellas predator avoidance although notanalyzed could be factors regulating thefish distributions observed in the San JuanRiver.
The distribution of juvenile and adultflannelmouth suckers is shown in Figure14. The adult fish have an increasingdensity with distance upstream reaching amaximum at about RM 135, after which it
remains relatively constant. Based upon theinflection point of this distribution and thedata in Figure 20, it was inferred that theoptimum temperature for adultflannelmouth is approximately 25/C. This isconsistent with the literature values notedin Table 1. Juvenile flannelmouth arecontinuing to increase past RM 180. For thepurpose of this analysis, the preferredmaximum temperature is less than or equalto 20/C for juvenile flannelmouth suckers.
Bluehead sucker distributions areshown in Figure 15. In both life stagesshown in the figure the distributions areincreasing past RM 180. For the purpose ofthis analysis, the preferred maximumtemperature is less than or equal to 20/Cfor both stages of this species. The 20/Ctemperature as a preferred thermalmaximum is consistent with the literaturevalues in Table 1.
For both catfish (Figure 16) andcommon carp (Figure 17), the maximumdensities by river mile form distinctmaximums in their longitudinaldistributions. For catfish adults thiscorresponds to approximately 25/C and forjuveniles, 28/C. These values are consistentwith the literature search noted in Table 1.Adult common carp peaked at RM 155,which corresponded to a maximumtemperature of 22/C to 23/C. As with theother species noted above, this wasconsistent with literature values forpreferred temperatures.
The spatial distribution of Coloradopikeminnow (Figure 18) and razorbacksucker (Figure 19) based upon the locationof captures from 1995 to 2004, do not haveas clear a pattern as the two nonnatives. Inpart this is due to the fewer number ofcaptures compared to the other morecommon species. In looking at an upper

San Juan River Fishery Response to Thermal Modification Ecosystems Research Institute
Page 29
10
15
20
25
30 TE
MPE
RA
TUR
E (°
C)
Mexican Hat (RM 51)**Bluff (RM 76)
Montezuma Crk (RM 93)Four Corners (RM 119)
Shiprock (RM 148)Farmington (RM 179)
Archuleta (RM 215)
SAN JUAN RIVERMaximum Summer Temperatures (1995)
Figure 20. The maximum observed daily average temperature at seven locations in the SanJuan River in 1995. Data for Mexican Hat is averaged from 2001-2002.
0
5
10
15
20
25
NU
MB
ER O
F D
AYS
Mexican Hat (RM 51)**Bluff (RM 76)
Montezuma Crk (RM 93)Four Corners (RM 119)
Shiprock (RM 148)Farmington (RM 179)
Archuleta (RM 215)
21
76
21
0 0
SAN JUAN RIVERDays above 12°C in April (1995)
Figure 21. The number of days in April where the average daily water temperature wasabove 12/C at each station in the San Juan River during 1995. Data for Mexican Hat areaverages from 2001-2002.

San Juan River Fishery Response to Thermal Modification Ecosystems Research Institute
Page 30
envelope of captures by river mile, thehighest densities are near RM 100 (16captures). Considering that river location ashaving the highest densities, thecorresponding maximum temperaturewould be near 25.5/C. This is consistentwith literature temperatures inferred as thepreferred temperatures for Coloradopikeminnow.
Razorback sucker spatial distributionsbased upon total captures from 1995 to2004 during the adult monitoring can beseen in Figure 19. As with pikeminnow, therazorback sucker distributions are notclear-cut. Using a 3-point moving average,two peak distributions emerge, one at RM100 and the second at RM 150-160. Becausethere are lower capture densities above RM160, it is assumed that the RM 150-160reach is the preferred thermal optimum.This corresponds to a maximum summertemperature of 22/C to 23/C, which alsocorresponds to literature values forpreferred temperatures for razorbacksuckers.
Although comparing the distributionalpattern of the fishes found in the San JuanRiver with maximum observed temperaturehas produced temperatures noted in theliterature as optimum temperatures, it doesnot fully explain the distributionalpatterns.
During the initial phases of building thePopulation Carrying Capacity Model, apreliminary analysis of the young-of-year(YOY) fishes (Buntjer et al. 1993; Buntjer etal. 1994) was undertaken in order todevelop hypotheses regarding potentialphysical forcing factors (Lawrence 2002) onfish growth and distribution. This initialanalysis focused on YOY fish densities asdetermined by the river-wide systematicinvestigations of low velocity habitats. A
variety of forcing factors were investigated,including temperatures and winter/springstorm perturbations (as defined by Bliesnerin the San Juan River FlowRecommendation Report 1995).
For the native bluehead sucker, thedensities (#/100 m2) between RM 2 and RM158 in August were found to be negativelycorrelated with the number of days themaximum daily temperatures exceeded12/C during the previous April. It appearsthat this may also be a partial reason forthe longitudinal distribution observed forthis species (Figure 15). At least for 1995,the number of days exceeding 12/Cincreases with distance downstream (Figure21).
Inspection of both Figure 15 and Figure 21indicates that bluehead sucker densitiesstart to increase at about RM 130, whichcorresponds to the location where thenumber of days above 12/C approacheszero. This analysis may indicate thatelevating temperatures during this timeperiod (at least above 12/C) negativelyimpacts the potential recruitment ofbluehead suckers at that location in theriver.
In a similar manner, Lawrence (2002)looked at the factors related to the observedcondition of the native suckers in the SanJuan River based upon the adultmonitoring program. That analysisindicated that both temperature and theperturbation frequency (storms)significantly predicted the condition factorof the flannelmouth sucker juveniles andadults. In the case of temperature, theflannelmouth sucker condition factordetermined in August was higher if averagetemperatures in March and April werewarmer. The number of perturbation eventsfrom October to April also predicted August

San Juan River Fishery Response to Thermal Modification Ecosystems Research Institute
Page 31
condition (more storms resulted in lowerfish condition). The preceding analysisindicates that although maximumtemperature may affect or contribute to thelongitudinal distribution of fish, otherseasonal temperatures may also play animportant role in survival and growth.These temperatures, if defined, should beincluded in an evaluation of potentialthermal benefits to native species throughNavajo Dam modifications. This isconsistent with the opinion thattemperature and food are two dominantfactors regulating growth of riverine fishes(Weatherley 1972).
7.0 CONCLUSIONS
A review of the available literature hashelped define the thermal niche of thenative and dominant non-native speciesfound in the San Juan River.
In addition, the site-specific analysis ofthe inferred temperature optima for the sixspecies undertaken in this report appears toprovide good agreement between thisanalysis and literature values for the samespecies (Table 1). Based upon all theevidence in this review, it is hypothesizedthat warmer summer temperatures in theSan Juan River above the confluence withthe Animas River over current conditionswill result in an upstream movement of allthe species discussed. The relativeproportions and spatial distributions of themembers of the fish community under thecurrent thermal gradient should be thesame, but located further upstream under anew thermal gradient.
Joseph et al. (1977) does an excellent jobof describing the longitudinal distribution ofthe native species within the UpperColorado River. Prior to man’s influence,the Colorado River and its tributaries
generally had headwater streams (“troutwaters”) which were cold, clear water, highgradients streams with rocky or gravellysubstrate. These systems had a transitionzone towards large, warm, and turbidrivers. Drawing upon observations ofJordon (1891), he describes the species thatshould be present in each major zone.
For example, Colorado cutthroat trout,speckled dace, mottled sculpin andmountain whitefish would be in the upperhigh gradient reaches. In the transitionreach, bluehead suckers and roundtail chubwould be major components, along withspeckled dace. In the lower larger riverreaches, flannelmouth sucker, razorbacksucker and Colorado pikeminnow would bepresent. Based upon early investigations,speckled dace, flannelmouth sucker, and toa certain extent, bluehead sucker werefound in both the transition and the lowerzones of these river systems. The falldistributional pattern for razorback suckerswas not described.
For the San Juan River, a similardistribution of species is present, althoughcompressed due to cool water releases fromNavajo Reservoir. Modification intemperatures released from Navajo Damcould allow those species in the San JuanRiver below the Animas River to increasetheir populations further upstream. Thiswould include both the permanent presenceof pikeminnow as well as the potential useof the river for spawning by this species.Under the current thermal conditions in theSan Juan River above the confluence withthe Animas, it is doubtful that pikeminnowwould establish a permanent presence orattempt to spawn.
With selective passage at the P&M weir,the non-native component (primarily catfishand carp) of the current fish community can
San Juan River Fishery Response to Thermal Modification Ecosystems Research Institute
Page 32
be limited in their upstream movement byallowing only selective fish passage and anaggressive removal program. This wouldallow a dominance of the native fishcommunity which would be utilized byColorado pikeminnow. Negative impacts ofa new thermal regime can be mitigated bykeeping spring temperatures moderate andby moving the native fish communityupstream closer to Navajo Dam, whichwould maximize community net productionby lessening the magnitude of stormperturbations that effect growth andcondition factor of the native community.
8.0 REFERENCES
Adams S.M., R.B. McLean, and J.A. Parrotta.1982. Energy partitioning in largemouthbass under conditions of seasonallyfluctuating prey availability. Trans Amer.Fish. Soc. 111(5): 549-558.
Allen, K.O., and K. Strawn. 1968. Heattolerance of channel catfish, Ictaluruspunctatus. Proc. S.E. Assoc. Game FishComm. 21:399-411.
Andrews, J.W. and R.R. Stickney. 1972.Interactions of feeding rates andenvironmental temperatures on growth,food conversion and body composition ofchannel catfish. Trans. Am. Fish. Soc.101:94-99.
Anonymous, 1999. Glen Canyon DamModifications to Control DownstreamTemperatures. Plan and DraftEnvironmental Assessment. UnitedStates Department of Interior Bureau ofReclamation Upper Colorado Region.January, 1999. 57 pages
Aquatic Life Habitat Assessment, 2007.www.water.ncsu.edu/watersheds/info/aqlife.html
Backiel and Stegman 1968. Temperatureand Yield in Carp Ponds. Proceedings ofthe world symposium on warm waterpond fish culture. FAO Fish Report #44,vol. 4, pp. 334-342.
Bestgen, K.R. 1985. Distribution, LifeHistory, and Status of the RoundtailChub, Gila Robusta, in the Gila RiverBasin, New Mexico. Unpublished. MS.Thesis. Colorado State University. Ft.Collins, Colorado.
Bestgen, K.R. 1996. Growth, Survival, andStarvation Resistance of ColoradoSquawfish Larvae. EnvironmentalBiology of Fishes 46: 197-209.
Bestgen, K.R., R.T. Muth, and M.A.Trammell, 1998. Downstream Transportof Colorado Squawfish Larvae in theGreen River Drainage; Temporal andSpatial Variation in Abundance andRelationships with JuvenileRecruitment. Final Report of ColoradoState University Larval FishLaboratory. Upper Colorado RiverEndangered Fish Recovery Program,Colorado.
Bestgen, K.R. and J.M. Bundy, 1998.Environmental Factors Affect DailyIncrement Deposition and OtolithGrowth in Young Colorado Squawfish.Transactions of the American FisheriesSociety, 127: 105-117.
Bestgen, K.R. and L.W. Crist, 2000.Response of the Green River FishCommunity to Construction and Re-regulation of the Flaming Gorge Dam1962-1996. Final Report to the ColoradoRiver Recovery Implementationprogram. Project #40, Larval FishLaboratory. Contribution 109. ColoradoState University. Ft. Collins Colorado.

San Juan River Fishery Response to Thermal Modification Ecosystems Research Institute
Page 33
Bestgen, K.R., and M.A. Williams, 1994.Effects of Fluctuating and ConstantTemperatures on Early Developmentand Survival of Colorado Squawfish.Transactions of the American FisheriesSociety 123: 574-579.
Bettoli, P.W. 2005. The fundamentalthermal niche of adult landlockedstriped bass. Transactions of theAmerican Fisheries Society 134 (2): 305-314.
Black, T. 1982. Preferred temperature ofColorado squawfish (Ptychocheiluslucius) and its relation with age andgrowth rate. Master's thesis, Utah StateUniversity, Logan.
Black, T. and R.V. Bulkley. 1985. Growthrate of yearling Colorado squawfish atdifferent water temperatures.Southwestern Naturalist 30:253-257.
Bliesner, R. 2006. Personal Communication.
Bliesner, R. and V. Lamarra, 2000.Hydrology, Geomorphology, and HabitatStudies: Final Report. United StatesFish and Wildlife Service, San JuanRiver Basin Recovery Program.Albuquerque, NM.
Bozek, M. 1984. Factors affecting thereproductive success of razorbacksuckers and bonytail chubs in LakeMohave, Arizona-California 1982-1983.M.S. Thesis, University of Nevada, LasVegas, Nevada. 149 pp.
Brown, L. 1942. Propagation of spottedchannel catfish (Ictalurus lacustrispunctatus). Trans. Kans. Acad. Sci.45:311-314.
Buentello, J.A., Gatlin, D.M., Neill, W.H.2000. Effects of water temperature anddissolved oxygen on daily feedconsumption, feed utilization and
growth of channel catfish (Ictaluruspunctatus). Aquaculture 182 (3-4): 339-352.
Bulkley, Ross V., and C. R. Berry, 1983.Utah Cooperative Fisheries ResearchUnit Annual Report. October 1982-September 1983.
Buntjer, M., T. Chart, and L. Lentsch. 1993.Early life history investigations1991/1992 Progress Report. UtahDivision of Wildlife Resources, SaltLake City, Utah.
Buntjer, M., T. Chart, and L. Lentsch. 1994.Early life history fisheries survey of theSan Juan River, New Mexico and Utah,1993. Utah Division of WildlifeResources, Salt Lake City, Utah.
Byerly M.T., Fat-Halla S.I., Betsill R.K.,Patino R. 2005. Evaluation of short-term exposure to high temperature as atool to suppress the reproductivedevelopment of channel catfish foraquaculture. North American Journal ofAquaculture. 67 (4): 331-339.
Carter, J.C., R.A. Valdez, R.J. Ryel and V.A.Lamarra. 1985. Fisheries habitatdynamics in the upper Colorado River.Journal of Freshwater Ecology3(2):249-264.
Chart, T.E. D.P. Svendson, and L.D.Lentsch 1999. Investigations ofPotential Razorback Sucker andColorado Pikeminnow Spawning in theLower Green River, 1994,1995. FinalReport of Utah Division of WildlifeResources to Upper Colorado RiverEndangered Fish Recovery Program,Denver Colorado.
Clarkson, R.W. and M.R. Childs. 2000.Temperature Effects of HypolimnialRelease Dams on Early Life Stages of
San Juan River Fishery Response to Thermal Modification Ecosystems Research Institute
Page 34
Colorado River Basin Big-River Fishes.Copeia May (2), pp. 402-412.
Clemens, H.P., and K.E. Sneed. 1957. Thespawning behavior of the channelcatfish Ictalurus punctatus. U.S. FishWildl. Serv., Spec. Sci. Rept., Fisheries219:1-11.
Coutant, C.C. 1975. Responses of bass tonatural and artificial temperatureregimes, pp. 272-285. In: Black bassbiology and management. H Clepper, ed.Sport Fishing Institute, Washington,D.C.
Davies, P.R., Hanyu, I., Furukawa, K.,Nomura, M. 1986. Studies on thereproductive rhythms of fishes 13. Effectof temperature and photoperiod onsexual-maturation and spawning bymanipulating photoperiod andtemperature. Aquaculture 52 (2): 137-144.
Deacon, J.E. Schumann P.B., Stuenkel E.L.1987. Thermal Tolerances andPreferences of Fishes of the Virgin RiverSystem (Utah, Arizona, Nevada). GreatBasin Naturalist 47 (4): 538-546.
Gorman, O.T.; Vanhoosen, R. 2001. Growthof Four Native Colorado Fishes at 12,18, and 24 degrees Celsius. AmericaFisheries Society Annual Meeting. Vol.131, pp. 164-165; Abstracts from the131rst Annual Meeting of the AFS: 2001A Fisheries Odyssey, The Journey ofScience and Education Continues, Phnx,AZ 19-23 August 2001.
Hammon, R.L. 1981. Spawning and cultureof Colorado Squawfish in raceways.Progressive Fish Culturalist 43: 173-177.
Hayes, C.M. and R.T. Muth. 1984.Identification of habitat requirements
and limiting factors of Coloradosquawfish and humpback chubs.Colorado Division of Wildlife ResearchDept. N-2-R-2 (SE-3) 21 pp.
Haynes, C.M., T.A. Lytle, E.J. Wick andR.T. Muth. 1984. Larval Coloradosquawfish (Ptychocheilus lucius girard)in the upper Colorado River basin,Colorado 1979-1981. SouthwesternNaturalist 29(1):21-33.
Holden, P.B. 1973. Distribution, abundance,and life history of the fishes of theUpper Colorado Riverbasin. Ph.D.dissertation, Utah State University,Logan Utah. 59 pages.
Holden, P.B. 1977. Habitat Requirements ofJuvenile Colorado Squawfish. U.S.Department of the Interior Fish andWildlife Service. OBS-77/65.
Holden, P.B. and L.W. Crist, 1981.Documentation of Changes in the MacroInvertebrate and Fish Populations inthe Green River due to InletModification of Flaming Gorge Dam,Final Report PR-16-5. BIO/WEST, Inc.,Logan UT.
Huff, D.U.,Shannon L. Hubler, and A.N.Borisenko. 2005. Using Field Data toEstimate the Realized Thermal Niche ofAquatic Vertebrates. North AmericanJournal of Fishery Management 25:346-360
Jobling, M. 1981. Temperature toleranceand the final preferendum - rapidmethods for the assessment of optimumgrowth temperatures. J. Fish Biol.19:439-455.
Jordan, D.S. 1891. Report of explorations inColorado and Utah during the summerof 1889, with an account of the fishesfound in each of the river basins

San Juan River Fishery Response to Thermal Modification Ecosystems Research Institute
Page 35
examined. U.S. Fish CommissionBulletin No. 9. 90 pp.
Joseph, T.W. J.A. Sinning, R.S. Behnke,and P.H. Holden. 1977. An evaluation ofthe status, life history and habitatrequirements of endangered andthreatened fishes of the Upper ColoradoRiver system. Western Area LanduseTeam. U.S. Fish and Wildlife Service.FWS/OBS-77/62.
Kaeding, L.R., and D.B. Osmundson. 1988.Interaction of Slow Growth andIncreased early-life Mortality: AnHypothesis on the Decline of Coloradosquawfish in the upstream Regions ofits Historic Range. EnvironmentalBiology of Fishes 22:287-298.
Karp, C.A. and H.M. Tyus. 1990.Humpback chub (Gila cypha) in theYampa and Green Rivers, DinosaurNational Monument, with observationson roundtail chub (Gila robusta) andother sympatric fish. Great BasinNaturalist 50: 257-264.
Kitcheyan, D.C. and M. Montagne 2005.Movement, migration and Habitat useby Colorado Pikeminnow (Ptychocheiluslucius) in a Regulated River belowFlaming Gorge Dam, Utah. DinosaurNational Monument (DINO-N-456.006)and Central Utah Project CompletionAct Office. Department of Interior. 59page
Lamarra V.A. 1999. Hourly temperatures atseven depths in Navajo Reservoir, 1998-1999. Ecosystems Research Institute,Logan, Utah.
Lamarra V.A. 2004. Statistical Analysis ofHabitat Availability and FishAbundance in the San Juan River.Ecosystems Research Institute. Logan,Utah.
Lawrence, K. 2002. Personalcommunication.
Marsh, Paul C. 1985. Effect of IncubationTemperature on Survival of Embryos ofNative Colorado River Fishes. TheSouthwestern Naturalist 30(1): 129-140.
Miller, A.S. and W.A. Hubert. 1990.Compendium of existing knowledge forthe use in making managementrecommendations for the UpperColorado River Basin. U.S. Fish andWildlife Service. U.S. Department ofInterior, Region 6. Denver, Colorado.
Miller, W.J. and D.E. Rees. 2000.Ichthyofaunal surveys of tributaries ofthe San Juan River, New Mexico. SanJuan River Basin RecoveryImplementation Program, U.S. Fish andWildlife Service, Albuquerque, NM.
Minckley, W.L. 1991. Native fishes of theGrand Canyon region: An obituary?Pages 124-177 In Colorado RiverEcology and Management. NationalAcademy Press Washington, D.C. pp.276.
Modde. T. 2001. Historical observations ofendangered fishes in the Green Riversubbasin. Annual Upper Colorado RiverResearchers Meeting, Grand Junction,Colorado.
Moss, J.L. 1985. Summer selection ofthermal refuges by striped bass inAlabama reservoirs and tailwaters.Transactions of the American FisheriesSociety 114 (1): 77-83.
Olson, H.F. 1963. Fisheries study of NavajoReservoir. Federal Aid Project F-22-R-4.New Mexico Department of Game andFish, Santa Fe, NM.
Osmundson D.B. 1999. LongitudinalVariation in Fish Community Structure

San Juan River Fishery Response to Thermal Modification Ecosystems Research Institute
Page 36
and Water Temperature in the UpperColorado River: Implications forColorado Pikeminnow HabitatSuitability. Final Report Project No.48.U.S. Fish and Wildlife Service. GrandJunction, Colorado. 70 pages.
Papoulias, D., and W.L. Minckley. 1992.Effects of Food Availability on Survivaland Growth of Larval RazorbackSuckers in Ponds. Transactions of theAmerican Fisheries Society 121: 340-355.
Paukert, C. and R.S. Rogers. 2004. Factorsaffecting condition of flannelmouthsuckers in the Colorado River, GrandCanyon, Arizona. North AmericanJournal of Fisheries Management. 24:648-653.
Propst, David L. Threatened andEndangered Fishes of New Mexico.www.wildlife.state.nm.us/publications/documents/threatened_endangered_fish.pdf
Propst, D.L. and A.L. Hobbes. 2000.Seasonal abundance, distribution, andpopulation size-structure of fishes inSan Juan River secondary channels,1991-1997. San Juan River BasinRecovery Implementation Program, U.S.Fish and Wildlife Service, Albuquerque,NM.
Rice, J.A., Breck, J.E., Bartell, S.M.,Kitchell, J.F. 1983. Evaluating theconstraints of temperature, activity andconsumption on growth of largemouthbass.
Robins, A.T.; Childs, M.R. 2001. JuvenileGrowth of Native Fishes in the LittleColorado River and in a ThermallyModified Portion of the Colorado River.North American Journal of Fisheries
Management. Vol. 21(4), pp. 809-815;2001.
Ryden, D. 1997. Five year Augmentation forrazorback sucker in the San Juan River.U.S. Fish and Wildlife Service. ColoradoRiver Fisheries Project. Grand Junction,Colorado. 27 pages.
Ryden, D. 2000. Adult fish communitymonitoring on the San Juan River,1991-1997. San Juan River BasinRecovery Implementation Program, U.S.Fish and Wildlife Service, Albuquerque,NM.
Ryden, D. 2003. An Augmentation Plan forColorado Pikeminnow in the San Juan.U.S. Fish and Wildlife Service. ColoradoRiver Fisheries Project. Grand Junction,Colorado. 102 pages.
Ryden, D. 2003. An Augmentation Plan forRazorback sucker in the San Juan(Addendum to the Plan). U.S. Fish andWildlife Service. Colorado RiverFisheries Project. Grand Junction,Colorado. 38 pages
Scheller, R.M., Snarski, V.M., Eaton, J.G.,and Oehlert, G.W. 1999. An analysis ofthe influence of annual thermalvariables on the occurrence of fifteenwarmwater fishes. Transactions of theAmerican Fisheries Society 128 (2): 257-264.
Seethalar, K.H., C.W. McAda, and R.S.Wydoski. 1976. Endangered andthreatened fish in the Yampa and Greenrivers of Dinosaur National Monument.Utah Cooperative Fisheries ResearchUnit, Utah State University. Logan,Utah. 22 pages
Southeastern Utah's Fish Species, 2006.www.wildlife.utah.gov/pdf/fish.pdf

San Juan River Fishery Response to Thermal Modification Ecosystems Research Institute
Page 37
Stuber, R., G, Gebhart, and O.E. Maughan,1982. Habitat suitability index modelsfor largemouth bass. Western Energyand Landuse Team, Office of BiologicalServices, United States Fish andWildlife Service, United StatesDepartment of the Interior, WashingtonD.C.
Trammell, M., and T. Chart. 1999. Aspinallstudies: Annual assessment of Coloradopikeminnow larval production in theColorado River, Utah 1992-1996. FinalReport. Utah Division of WildlifeResources. Salt Lake City, Utah. 52pp.
Tyus, H.M. and G.B. Haynes. 1991.Distribution, habitat use and growth ofage-0 Colorado squawfish in the GreenRiver Basin, Colorado and Utah.Transactions of the American FisheriesSociety 120: 79-89.
Tyus, H.M. and C. W. McAda. 1984.Migrations, movements and habitatpreferences of Colorado squawfish,Ptychocheilus lucius, in the Green,White and Yampa rivers, Colorado andUtah. The Southwestern Naturalist29(3): 289-299.
Valdez, R.A. 1990. The Endangered Fish ofCataract Canyon. Final Report Preparedfor the Bureau of Reclamation. SaltLake City, Utah. BIO/West Report# 134-3.
Valentine, J. 1981. Hatchery and laboratoryphase of the Colorado River EndangeredFishes Study. Proc. Bonneville Chapter.Amer. Fish Soc. 1981: 111-117
Vanicek, C.D., R.A. Kramer, and D.R.Franklin. 1970. Distribution of GreenRiver fishes in Utah and Coloradofollowing closure of Flaming GorgeDam. Southwest Naturalist 14(3): 297-315.
Vanicek, C.D. 1967. Ecological Studies ofGreen River Fishes Below FlamingGorge Dam, 1964-1966. Ph. DDissertation Utah State University,Logan Utah. 138 pages.
Ward, D.L.; Maughan, O.E.; Bonar, S.A.;Matter, W.J. Matter, W.J. 2002. Effectsof Temperature, Fish Length, andExercise on Swimming Performance ofAge-0 Flannelmouth Sucker.Transactions of the American FisheriesSociety (3): 492-497
Warm Water Fishes OptimalTemperatures, 2006 www.in-fisherman.com/interactive/docs/science_doc/index1.html
Weatherly, A.H. 1972. Growth and ecologyof fish populations. Academic Press.New York.