sampling what is sampling process of selecting a sample
TRANSCRIPT

Sampling

What is sampling
• Process of selecting a sample

Why do we need to do sampling
• Speed• Economical• Better control

Basics of Sampling
• Defining universe• Selection of Sampling Frame• Selection of Samples

Importance of Sampling
• Samples are representative of the universe• Unbiased selection of samples

Sample Design

What does Sample Design mean?
1. TG Definition & Sub-segments
2. Sample Size and Spread
3. Sampling Methodology
4. Contact Process
TG Definition
• TG Definition = Identifying the Universe / Population
• Needed beyond the primary definition of (say) product usage
• How does one describe the target respondent?
– Could be described by the client – consider following for comparability with other researches
– Else, develop yourself

TG Definition
• Use a very large syndicated database– Check what the IRS / TAM says
• Else, take information from client, basis their other researches
• Understand the Core Audience
• Normal Descriptors of Target Respondent– Age, SEC, Gender– Product Usage – if needed– Lifestyle basis – if needed

Reporting Units
• Need clarity on what you need to report for– State or Zone– Total or Urban / Rural– SEC wise?– Age Wise?– Brand Wise?– . . . . – . . .

Choosing Sample SizeMust be representative
Must be adequate
Depends on
• Sample size requirement depends on heterogeneity of universe (not size)
• Heterogeneity is with reference to a measure
• Before calculating sample size, need to understand– heterogeneity (variance)– accuracy desired (error)– Importance of decision (confidence %)– Reporting Units - Requirement of sub-group analysis
• Cost of error / Risk
• Fixed costs of the research
Sample Size Based on Sampling Error
• Standard Error- reduces with sample size - also depends on result value
• Confidence level- relates to risk of wrong decision - Industry practice 90% - 95 %
• Need for sub-group analysis- young vs old smokers- metros vs smaller towns etc.
• To arrive at sample size, we need to predefine- extent of error acceptable ( absolute or relative to the result value )- expected value- confidence level- sub-group size estimates

Choosing Type of SamplingMinimise Variance
Minimise Bias
• Universe Size and Heterogeneity (Variance)
• Timeliness
• Relative cost and effort vs Risk
• Non-sampling errors
Define TG
Decide Sample Design
Sample Size & Spread
TIME & COSTS

Steps involved in Sampling• Defining Universe.• Selection of Sampling Frame• Selection of samples/ starting points• Fieldwork from the randomly selected household• Selection of subsequent samples following RHR• Following skipping instructions, if any• Selection of respondent in a household• Replacement due to refusals, non availability etc.

Sampling Terminology

Some Terminology
• Population - The term population is not only used in its common sense but for any ‘universe’ of interest: households, shops, farms, other types of business, bus users etc.
• Sample - a selected subset of the population
• Units / Elements - The members of a population
• Sampling Frame - A list of units from which the sample is drawn e.g., electoral register, customer list (Frame Errors)
Sampling Frame
• Choice of Sampling Frame– Voter List / Electoral Rolls– Telephone Directory– Map– Ward List– Area List– Data Base
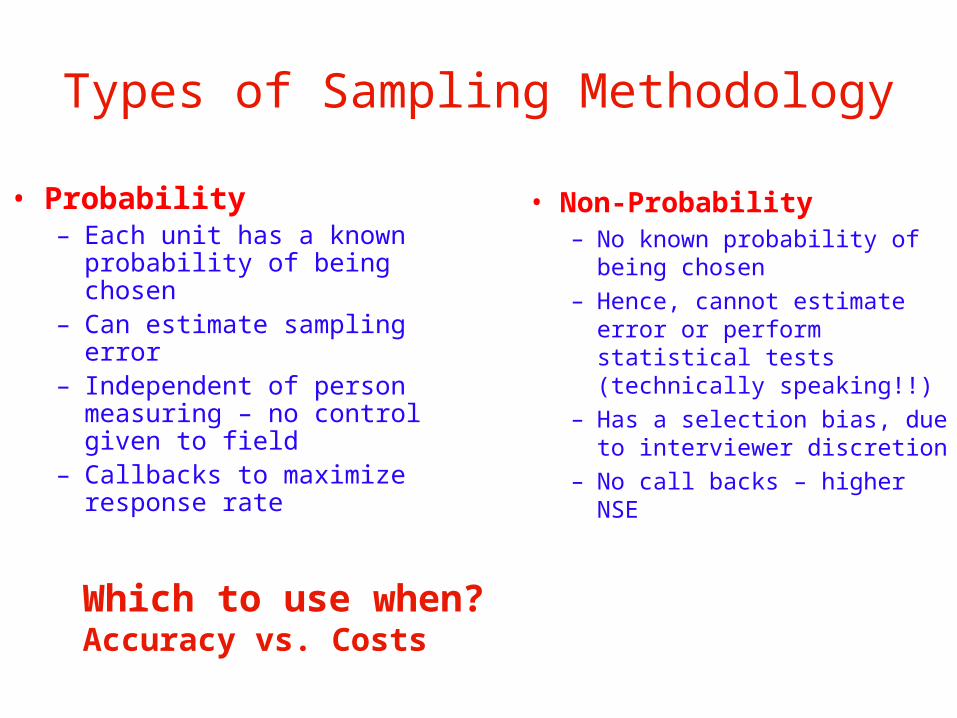
Types of Sampling Methodology
• Probability– Each unit has a known
probability of being chosen– Can estimate sampling error– Independent of person
measuring – no control given to field
– Callbacks to maximize response rate
• Non-Probability– No known probability of being
chosen– Hence, cannot estimate error
or perform statistical tests (technically speaking!!)
– Has a selection bias, due to interviewer discretion
– No call backs – higher NSE
Which to use when?Accuracy vs. Costs

Types of Sampling Methodology
• Probability– Simple Random– Systematic Random – Stratified (proportionate
vs. disproportionate)– Cluster / Multi-stage
• Non-probability– Quota (Proportionate vs
Disproportionate)– Convenience– Judgemental– Snowballing
For many MR purposes the sample design is a ‘mix’ of the various types

Types of Probability Sampling
• Simple random sample– A credit card company randomly selects 500 customers from its customer data
file to participate in a mail survey
• Systematic sample (every nth)– A credit card company selects every 2,000th customer from its customer data
file to participate in a mail survey– Statistically similar to simple random sampling– Frame must be ordered– Increases representative ness in some cases (hi-volume, low volume)– Decreases representative ness in some cases (1st of every month) – though
rarely

Systematic SamplingAn Example
Universe = 100,000Sample = 200Sampling interval = 100,000 / 200 = 500Step 1: Select one random no. between 1 and 500
(=292, say)Step 2 : Select every 500th item after that (292, 792, 1292…)

Types of Probability Sampling
• Stratified sampling
– When the universe is known to be heterogeneous
– Segment the universe – heterogeneous across strata and homogeneous
within
– Random Samples from each (simple, systematic, cluster)
– e.g. the country is divided into regions, the sample size for each is determined and sampling is conducted separately for each; all strata are represented
– If the sample size is a fixed % of the region population, this is proportionate stratified sampling (PSS)
– If the %s vary between regions, this is disproportionate stratified sampling

Types of Probability Sampling
• Cluster/multi-stage sampling– Cluster sampling involves more than one stage– Groups or clusters of elements are selected first, then chosen
clusters are sub sampled• e.g. 1 select companies, then directors• e.g. 2 select city blocks, then households; this is an example of
‘area sampling’– Not all clusters are selected (in contrast to strata, which are all
represented)
FOR LOGISTICAL CONVENIENCE

Types of Non-Probability Sampling
• Quota sampling– Decide sample size in each cell– Leave to Interviewer’s discretion – Major reasons for using quota sampling are:
• to ensure that enough respondents with certain characteristics are interviewed for sub-analysis etc.
• to ensure variety of response where a sufficient random sample size is not possible;
in other words, where a smaller random survey might be more likely “by chance” to be skewed or limited
• to reduce costs and fieldwork time!

Quota Sampling
• E.g. 200 users and 300 non-users of a product category with half of each user group aged 20-34 and half aged 35-39
• The major shortcomings are that control (quota) variables may be unrelated to problem of interest
• May need many interlocking control (quota) variables e.g., age, sex, income and education
• N.B. Interlocking quotas improve control, but reduce the cost/time advantage of quota sampling. To be used with care!

Quota Sampling – Proportionate vs. Disproportionate
• Proportionate – when individual quotas are in line with population proportions
• Disproportionate – when they are not. E.g. a mobile users study, where there is a need to study teenage mobile users separately
• What is the difference between– Proportionate / Disproportionate Quota Sampling and– Proportionate / Disproportionate Stratified Random Sampling?

Types of Non-Probability Sampling
• Convenience sampling
– Respondents are selected on the basis of convenience of the researcher
• Street/mall intercepts• Professors of psychology conducting experiments on
students– These samples may be informative but are not
projectable to the population

Types of non-probability samples
• Judgemental sampling– sample selected to include elements believed will
provide vital information• Experts interviewed by a news reporter • Cities selected for test marketing
– again, not projectable

Types of non-probability samples
• Snowball sampling
– A referral system– Typically used for hard-to-find respondents– In built bias over-ridden by the cost and time
savings

Sampling Errors

What do we mean by accuracy?
• We have used this term several times in its usual sense
• But survey sampling uses two more precise terms :– Variation (variability, variance)– Bias

Sample Size and Reliability of Results
• Sources of error- Sampling error- Non sampling error/ bias
• Sampling error- will always be present in a probability sample survey
• Non-sampling error- can be controlled (to some extent ) by controlling the research process

Sampling Error
TE = SE + NSE
• SE Sample Size (n) Expected heterogeneity
• NSE Random Error Systematic Error

Non Sampling Error
• NSE– Random Error (miscoding, errors in punching etc)
– Systematic Error• Measurement Error (biased question)• Selection Error (skipping, not using Kish grid etc)• Non-response Error (Unavailable, Refusal)

Sample Design
In Practice

What is Random?Degrees of Randomness
• Is your entire design random?
OR
• Are your sample sizes quota’ed with random contact pattern (purposive)
Quota / Convenience
PPS with Cluster Sampling

Know your universe- A Classic case of random sampling
• Proportionate Stratified Sampling (also called PPS)
• A combination of cluster and stratified random sampling
• Cover the UA of every city
Know your universeIRS
• Starting Points– Choice of SPs from electoral rolls
• Kish Grid Selection
• 3 callbacks, before termination

Instructions to choose SPs
• Choose 60 SPs . . . . How ?? Purposively?
• Different ways of choosing SPs– Electoral Rolls– Ward wise– Post Box wise– FO / FC’s discretion / experience– Geographical Clusters
Instructions to choose SPs
• Understand the NSE
– SEC AB TG . . . Safe to choose purposively? OK to miss out (say) SEC B HHs in certain downmarket localities?
– UA vs MC – Safe to do only MC? Are patterns likely to be different in the rest of UA?
– Rules of Substitution

# of Clusters and Size of Cluster
• How many SPs? How many interviews per SP?
• Depends on– TG (SEC) – Size and Heterogeneity– Expected productivity– Balance between efficiency and representation
• Size of cluster defined by– Main Interview OR– Listing ???

Skipping Pattern
• Reduce NSE . . . specify skipping to as much detail as possible
• Skipping pattern will decide the size of the cluster
• # of HH to be skipped - depends upon # of SPs and interviews/SP
What should I skip?
• Skip after . . – Every door knock– Every listing (successful or unsuccessful)– Every completed interview
• How many– In buildings– In row houses– In bungalow colonies

Selection of Respondent
• Kish Grid
• Birthday method
• Available respondents – to meet quota
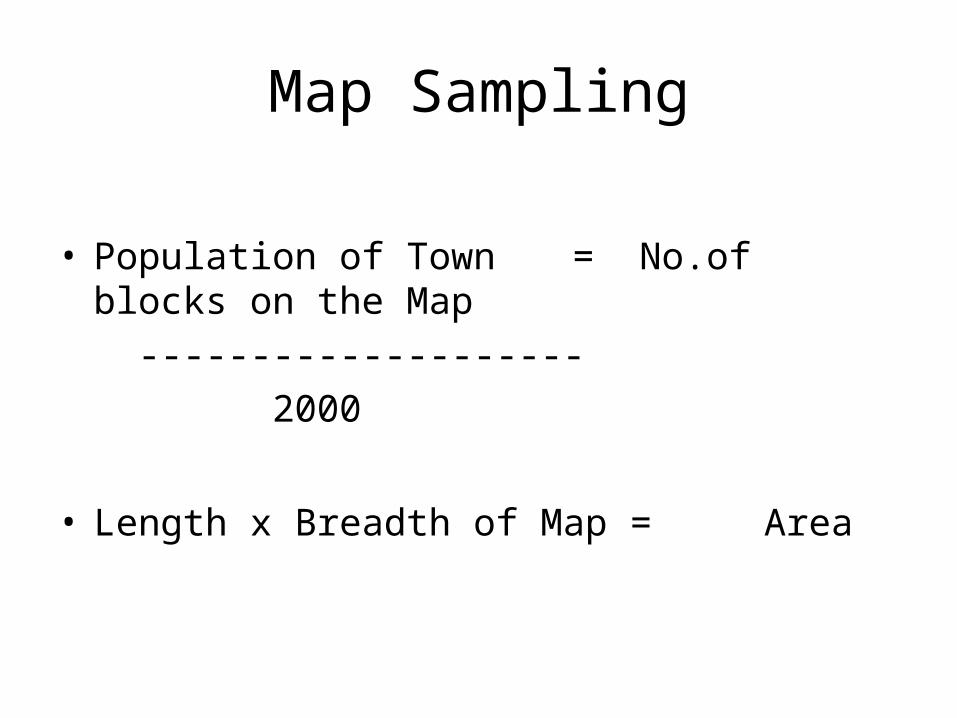
Map Sampling
• Population of Town = No.of blocks on the Map -------------------- 2000
• Length x Breadth of Map = Area

Map Sampling
• Area of Map ------------------- = Area of each block No.of blocks
• Area of block = Length x Breadth of block
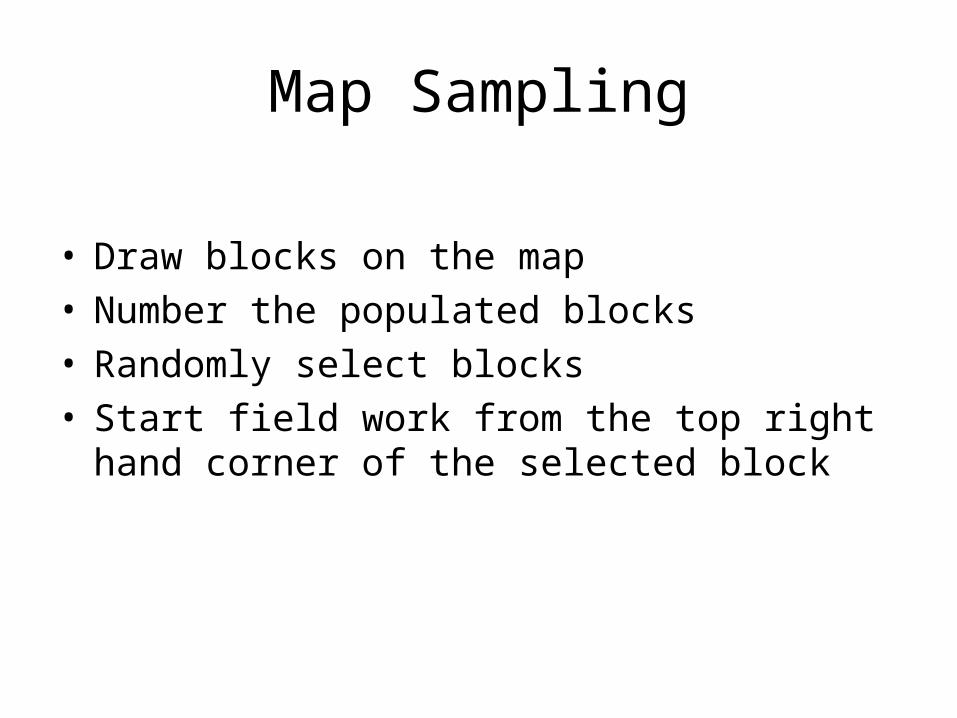
Map Sampling
• Draw blocks on the map• Number the populated blocks• Randomly select blocks• Start field work from the top right hand corner of the
selected block

Map Sampling
x x x 1 2 3 4 x
x x 5 6 7 8 9 10
x x 11 12 13 14 15 16
x x 17 18 19 20 21 22
x 23 24 25 26 27 28 29
Length 30 31 32 33 34 35 36 37
38 39 40 41 42 43 44 45
46 47 48 49 50 51 52 x
x 53 54 55 56 57 58 x
x x 59 60 61 62 63 x
x x 64 65 66 67 x x
x x 68 69 70 x x x
Breadth

Trade Survey Sampling
• Divide city into 12 blocks• Divide each block into 2 Sub-blocks• i..e. 12 x 2 = 24 Sub-blocks• In each Sub- block select 2 busy intersections i.e. 24 x
2 = 48 Intersections• List all shops at each intersection (Main Shop listing)

Trade Survey Sampling
• Walk in a pre-specified direction away from the intersection for 5 minutes (Point 1)
• Walk again using RHR for further 5 minutes (Point 2)• List all shops between point 1 & 2 ( Away shop
listings )
Trade Survey Sampling
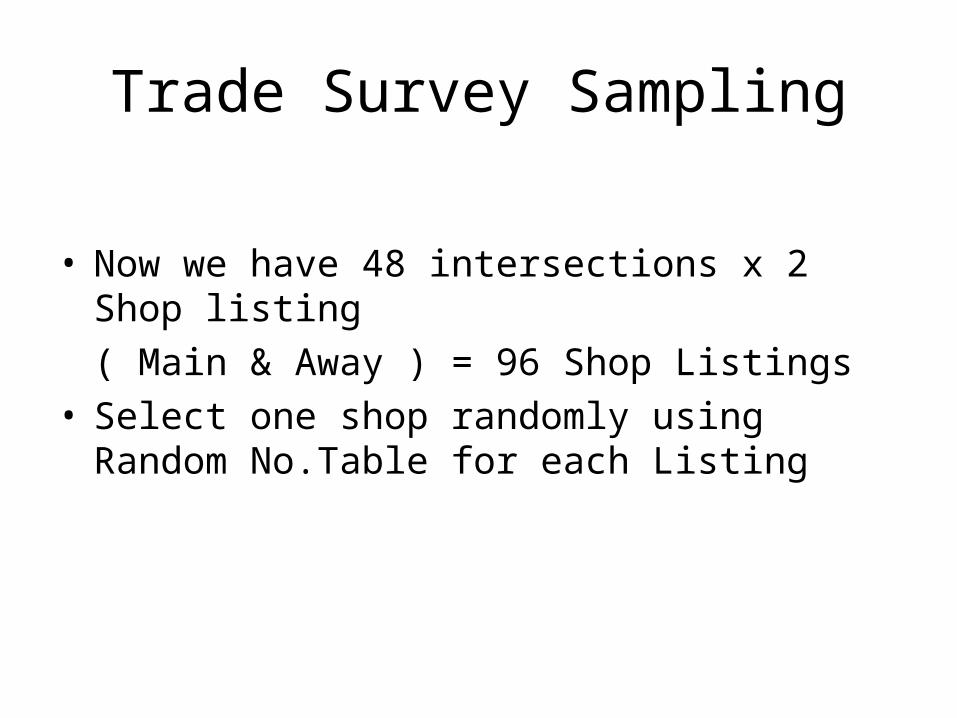
• Now we have 48 intersections x 2 Shop listing ( Main & Away ) = 96 Shop Listings
• Select one shop randomly using Random No.Table for each Listing

SELECTION OF INDIVIDUAL THROUGH KISH GRID
• The Kish grid is a ready reckoner for randomly selecting an individual from the household members
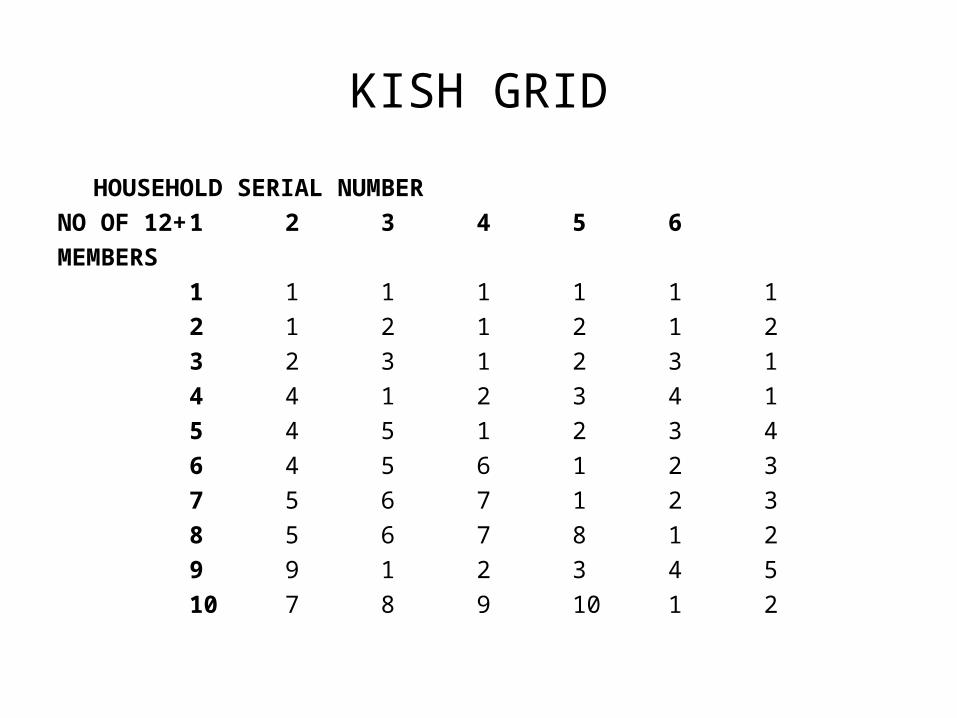
KISH GRID
HOUSEHOLD SERIAL NUMBERNO OF 12+ 1 2 3 4 5 6MEMBERS
1 1 1 1 1 1 12 1 2 1 2 1 23 2 3 1 2 3 14 4 1 2 3 4 15 4 5 1 2 3 46 4 5 6 1 2 37 5 6 7 1 2 38 5 6 7 8 1 29 9 1 2 3 4 510 7 8 9 10 1 2
Replacement
• Sex• Age group• Occupation• Religion etc.

Thank You