statistik industri 1 - aeunike.lecture.ub.ac.id · –convenience sample / snowball sample...
TRANSCRIPT

STATISTIK INDUSTRI 1
Agustina Eunike, ST., MT., MBA

METODE SAMPLING

SAMPLING
3
• Populasi adalah ...
• Sampel adalah ...
• Parameter: – nilai yang merepresentasikan karakteristik populasi
• Statistik:
– nilai yang merepresentasikan karakteristik sampel
• Mungkinkah men-sampling keseluruhan populasi?
• Kenapa sampel? – Sumber daya terbatas (waktu, uang) and beban kerja – Dapat memberikan hasil yang dinilai akurat melalui
perhitungan dan pendekatan matematis

SAMPLING…….
4
• 3 faktor yang mempengaruhi keabsahan sample
• Prosedur sampling
• Ukuran sampel
• Partisipasi (respon)
• Kapan keseluruhan sampling populasi dapat dilakukan?
• Saat populasi sangat kecil
• Saat tersedia sumber daya yang cukup
• Saat tidak mengharapkan respon tinggi atau hasil yang cepat
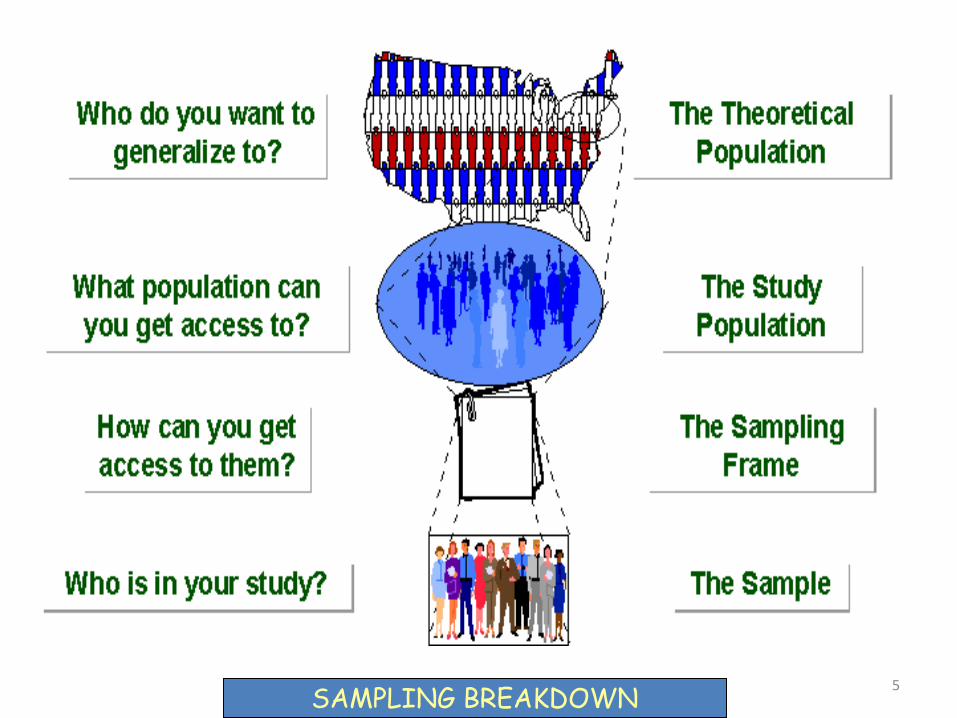
5 SAMPLING BREAKDOWN

SAMPLING…….
6
TARGET POPULATION
STUDY POPULATION
SAMPLE

Jenis Sampel
7
• Probability (Random) Samples – Simple random sample – Systematic random sample – Stratified random sample – Multistage sample – Multiphase sample – Cluster sample
• Non-Probability Samples – Convenience sample / Snowball sample – Purposive sample – Quota
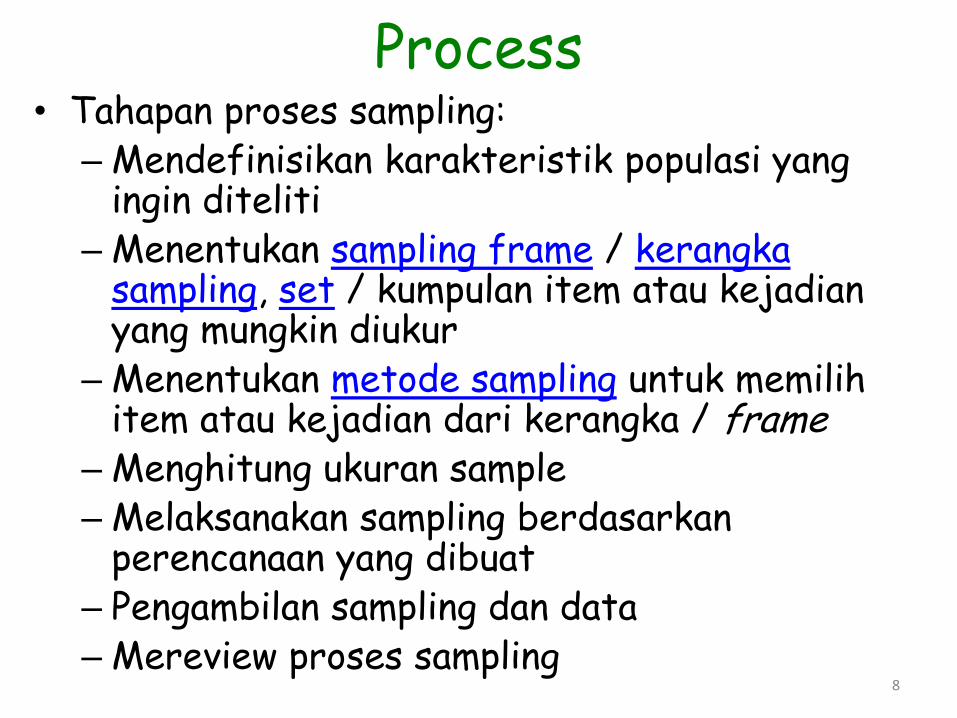
Process
8
• Tahapan proses sampling: – Mendefinisikan karakteristik populasi yang
ingin diteliti – Menentukan sampling frame / kerangka
sampling, set / kumpulan item atau kejadian yang mungkin diukur
– Menentukan metode sampling untuk memilih item atau kejadian dari kerangka / frame
– Menghitung ukuran sample – Melaksanakan sampling berdasarkan
perencanaan yang dibuat – Pengambilan sampling dan data – Mereview proses sampling

SAMPLING FRAME
9
• Jenis data: – Homogen – Heterogen
• Sampling frame: identifikasi properti yang dapat
digunakan untuk mengidentifikasikan tiap elemen dalam sampel
• Sampling frame harus merepresentasikan populasi

PROBABILITY SAMPLING
10
• Probability sampling adalah metode sampling dimana
setiap elemen populasi memiliki peluang dipilih menjadi sampel, dan nilai peluang dapat diukur secara akurat
• 'equal probability of selection' (EPS) design / 'self-weighting': adalah pemilihan sampel dimana tiap item dalam populasi memiliki peluang dan bobot yang sama.

PROBABILITY SAMPLING…….
11
• Probability sampling meliputi:
• Simple Random Sampling,
• Systematic Sampling,
• Stratified Random Sampling,
• Cluster Sampling
• Multistage Sampling.
• Multiphase sampling

NON PROBABILITY SAMPLING
12
• Metode sampling yang tidak dapat ditentukan dengan akurat peluang terpilihnya elemen populasi. Metode ini menitikberatkan pada asumsi pemilihan elemen terkait dengan fokus populasi, yang kemudian mempengaruhi kriteria pemilihan sampel. Pada metode ini tidak dapat dihitung estimasi kesalahan sampling karena pemilihan sampel tidak random.
• Contoh: Sekelompok mahasiswa melakukan wawancara pada tiap orang yang pertamakali membuka pintu di suatu perumahan. Pada rumah yang berpenghuni lebih dari satu maka yang terjadi adalah non probability sample, karena akan ada lebih dari satu orang yang mungkin membuka pintu, dan sangat sulit menghitung probabilitasnya.

NONPROBABILITY SAMPLING…….
13
• Nonprobability Sampling meliputi: Accidental Sampling, Quota Sampling dan Purposive Sampling.
• Catatan: efek nonresponse dapat mengubah probability sampling menjadi nonprobability sampling, karena jika karakteristik tidak dapat dijelaskan maka nonrespon akan mengubah peluang dari tiap elemen dalam sampel

SIMPLE RANDOM SAMPLING
14
• Sesuai untuk sampel kecil, homogen, dan telah tersedia
• Setiap elemen atau bagian dari populasi memiliki peluang yang sama untuk terpilih menjadi sampel
• Pemilihan sampel dapat menggunakan tabel random atau sistem undian

SIMPLE RANDOM SAMPLING……..
15
• Kelebihan: • Mudah dalam melakukan estimasi • Simple random sampling selalu EPS (equal probability of
selection), tetapi tidak semua EPS adalah simple random sampling.
• Kekurangan: • Tidak dapat diterapkan pada sampel yang sangat besar. • Subgrup populasi yang sangat kecil (minoritas) tidak dapat
terwakili dalam jumlah yang sesuai.

REPLACEMENT OF SELECTED UNITS
16
• Sampling schemes may be without
replacement ('WOR' - no element can be selected more than once in the same sample) or with replacement ('WR' - an element may appear multiple times in the one sample).
• For example, if we catch fish, measure them, and immediately return them to the water before continuing with the sample, this is a WR design, because we might end up catching and measuring the same fish more than once. However, if we do not return the fish to the water (e.g. if we eat the fish), this becomes a WOR design.

SYSTEMATIC SAMPLING
17
• Systematic sampling relies on arranging the target
population according to some ordering scheme and then selecting elements at regular intervals through that ordered list.
• Systematic sampling involves a random start and then proceeds with the selection of every kth element from then onwards. In this case, k=(population size/sample size).
• It is important that the starting point is not automatically the first in the list, but is instead randomly chosen from within the first to the kth element in the list.
• A simple example would be to select every 10th name from the telephone directory (an 'every 10th' sample, also referred to as 'sampling with a skip of 10').

SYSTEMATIC SAMPLING……
18
As described above, systematic sampling is an EPS method, because all elements have the same probability of selection (in the example given, one in ten). It is not 'simple random sampling' because different subsets of the same size have different selection probabilities - e.g. the set {4,14,24,...,994} has a one-in-ten probability of selection, but the set {4,13,24,34,...} has zero probability of selection.

SYSTEMATIC SAMPLING……
19
• ADVANTAGES:
• Sample easy to select
• Suitable sampling frame can be identified easily
• Sample evenly spread over entire reference population
• DISADVANTAGES:
• Sample may be biased if hidden periodicity in population coincides with that of selection.
• Difficult to assess precision of estimate from one survey.

STRATIFIED SAMPLING
20
Where population embraces a number of distinct categories, the frame can be organized into separate "strata." Each stratum is then sampled as an independent sub-population, out of which individual elements can be randomly selected.
• Every unit in a stratum has same chance of being selected.
• Using same sampling fraction for all strata ensures proportionate representation in the sample.
• Adequate representation of minority subgroups of interest can be ensured by stratification & varying sampling fraction between strata as required.

STRATIFIED SAMPLING……
21
• Finally, since each stratum is treated as an independent population, different sampling approaches can be applied to different strata.
• Drawbacks to using stratified sampling. • First, sampling frame of entire population has
to be prepared separately for each stratum • Second, when examining multiple criteria,
stratifying variables may be related to some, but not to others, further complicating the design, and potentially reducing the utility of the strata.
• Finally, in some cases (such as designs with a large number of strata, or those with a specified minimum sample size per group), stratified sampling can potentially require a larger sample than would other methods

STRATIFIED SAMPLING…….
22
Draw a sample from each stratum
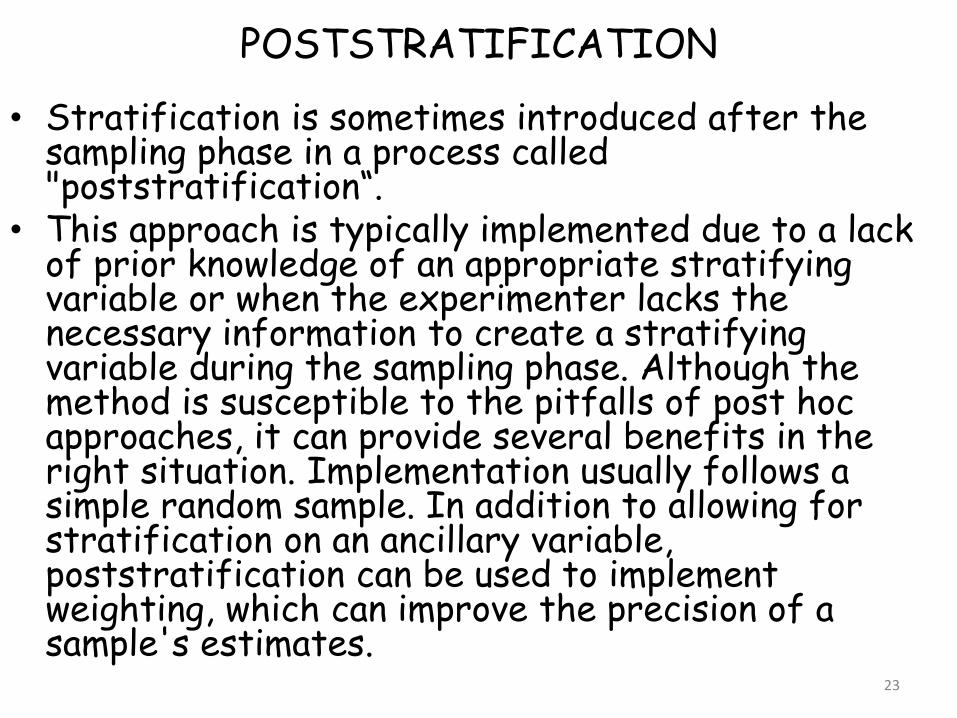
POSTSTRATIFICATION
23
• Stratification is sometimes introduced after the
sampling phase in a process called "poststratification“.
• This approach is typically implemented due to a lack of prior knowledge of an appropriate stratifying variable or when the experimenter lacks the necessary information to create a stratifying variable during the sampling phase. Although the method is susceptible to the pitfalls of post hoc approaches, it can provide several benefits in the right situation. Implementation usually follows a simple random sample. In addition to allowing for stratification on an ancillary variable, poststratification can be used to implement weighting, which can improve the precision of a sample's estimates.

OVERSAMPLING
24
• Choice-based sampling is one of the
stratified sampling strategies. In this, data are stratified on the target and a sample is taken from each strata so that the rare target class will be more represented in the sample. The model is then built on this biased sample. The effects of the input variables on the target are often estimated with more precision with the choice-based sample even when a smaller overall sample size is taken, compared to a random sample. The results usually must be adjusted to correct for the oversampling.

CLUSTER SAMPLING
25
• Cluster sampling is an example of 'two-stage sampling' .
• First stage a sample of areas is chosen;
• Second stage a sample of respondents within those areas is selected.
• Population divided into clusters of homogeneous units, usually based on geographical contiguity.
• Sampling units are groups rather than individuals.
• A sample of such clusters is then selected.
• All units from the selected clusters are studied.

CLUSTER SAMPLING…….
26
• Advantages : • Cuts down on the cost of preparing a
sampling frame. • This can reduce travel and other
administrative costs. • Disadvantages: sampling error is higher
for a simple random sample of same size.
• Often used to evaluate vaccination coverage in EPI

CLUSTER SAMPLING…….
27
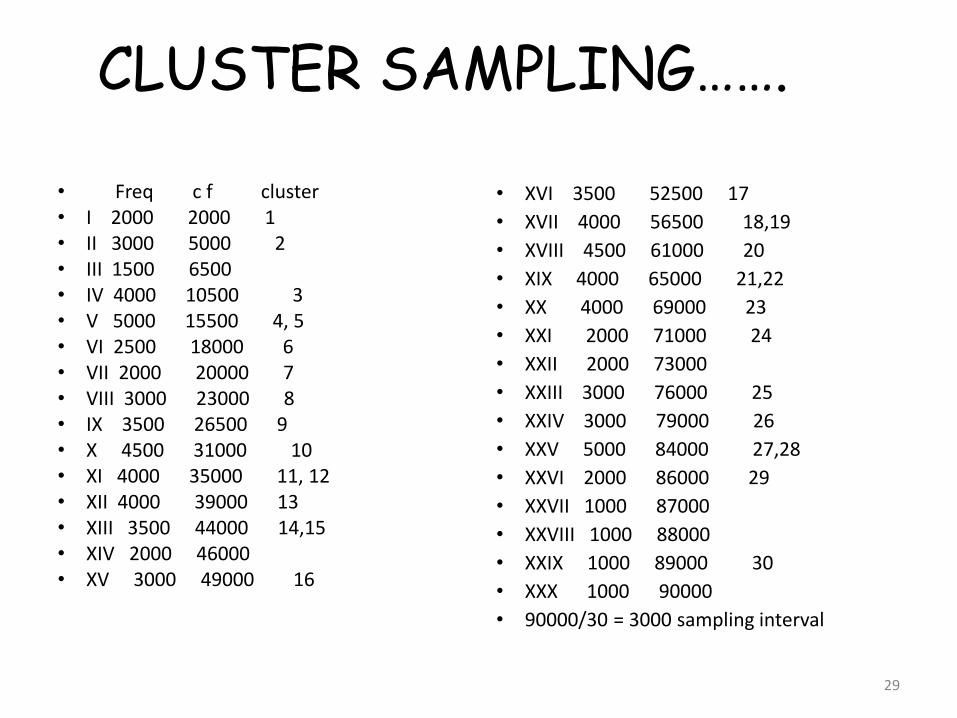
• Identification of clusters – List all cities, towns, villages & wards of cities
with their population falling in target area under study.
– Calculate cumulative population & divide by 30, this gives sampling interval.
– Select a random no. less than or equal to sampling interval having same no. of digits. This forms 1st cluster.
– Random no.+ sampling interval = population of 2nd cluster.
– Second cluster + sampling interval = 4th cluster. – Last or 30th cluster = 29th cluster + sampling
interval

CLUSTER SAMPLING…….
28
Two types of cluster sampling methods.
One-stage sampling. All of the elements within selected clusters are included in the sample.
Two-stage sampling. A subset of elements within selected clusters are randomly selected for inclusion in the sample.
CLUSTER SAMPLING…….
29
• Freq c f cluster • I 2000 2000 1 • II 3000 5000 2 • III 1500 6500 • IV 4000 10500 3 • V 5000 15500 4, 5 • VI 2500 18000 6 • VII 2000 20000 7 • VIII 3000 23000 8 • IX 3500 26500 9 • X 4500 31000 10 • XI 4000 35000 11, 12 • XII 4000 39000 13 • XIII 3500 44000 14,15 • XIV 2000 46000 • XV 3000 49000 16
• XVI 3500 52500 17
• XVII 4000 56500 18,19
• XVIII 4500 61000 20
• XIX 4000 65000 21,22
• XX 4000 69000 23
• XXI 2000 71000 24
• XXII 2000 73000
• XXIII 3000 76000 25
• XXIV 3000 79000 26
• XXV 5000 84000 27,28
• XXVI 2000 86000 29
• XXVII 1000 87000
• XXVIII 1000 88000
• XXIX 1000 89000 30
• XXX 1000 90000
• 90000/30 = 3000 sampling interval

Difference Between Strata and Clusters
30
• Although strata and clusters are both non-
overlapping subsets of the population, they differ in several ways.
• All strata are represented in the sample; but only a subset of clusters are in the sample.
• With stratified sampling, the best survey results occur when elements within strata are internally homogeneous. However, with cluster sampling, the best results occur when elements within clusters are internally heterogeneous

MULTISTAGE SAMPLING
31
• Complex form of cluster sampling in which two or more levels of units are embedded one in the other.
• First stage, random number of districts chosen in all states. • Followed by random number of talukas, villages. • Then third stage units will be houses. • All ultimate units (houses, for instance) selected at last step
are surveyed.
MULTISTAGE SAMPLING……..
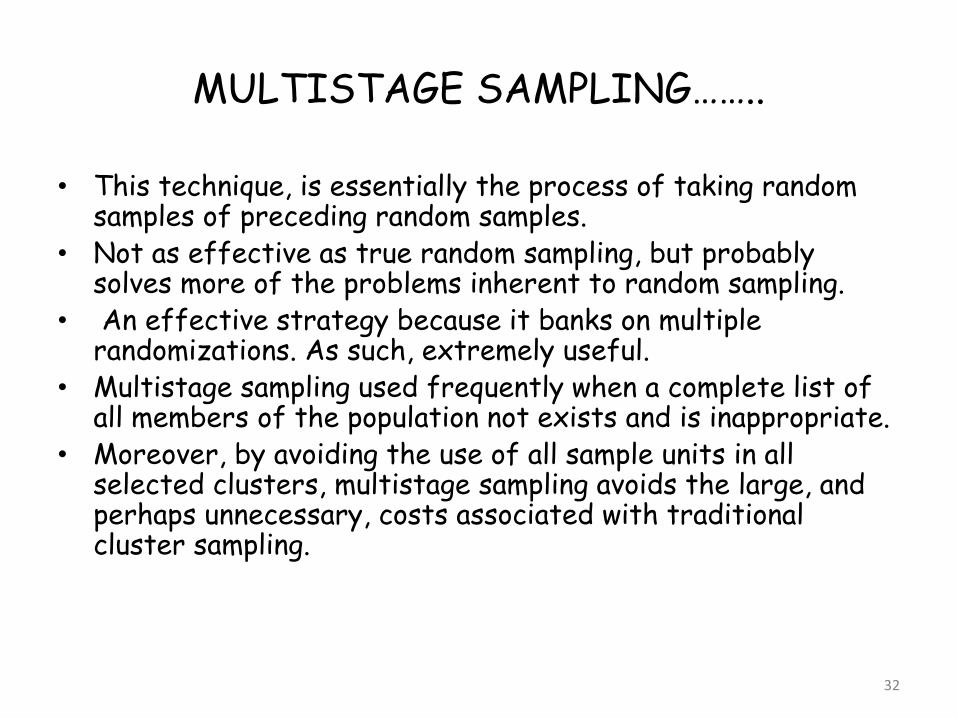
32
• This technique, is essentially the process of taking random samples of preceding random samples.
• Not as effective as true random sampling, but probably solves more of the problems inherent to random sampling.
• An effective strategy because it banks on multiple randomizations. As such, extremely useful.
• Multistage sampling used frequently when a complete list of all members of the population not exists and is inappropriate.
• Moreover, by avoiding the use of all sample units in all selected clusters, multistage sampling avoids the large, and perhaps unnecessary, costs associated with traditional cluster sampling.

MULTI PHASE SAMPLING
33
• Part of the information collected from whole sample & part from subsample.
• In Tb survey MT in all cases – Phase I
• X –Ray chest in MT +ve cases – Phase II
• Sputum examination in X – Ray +ve cases - Phase III
• Survey by such procedure is less costly, less laborious & more purposeful

MATCHED RANDOM SAMPLING
34
A method of assigning participants to groups in which pairs of participants are first matched on some characteristic and then individually assigned randomly to groups.
• The Procedure for Matched random sampling can be briefed with the following contexts,
• Two samples in which the members are clearly paired, or are matched explicitly by the researcher. For example, IQ measurements or pairs of identical twins.
• Those samples in which the same attribute, or variable, is measured twice on each subject, under different circumstances. Commonly called repeated measures.
• Examples include the times of a group of athletes for 1500m before and after a week of special training; the milk yields of cows before and after being fed a particular diet.

QUOTA SAMPLING
35
• The population is first segmented into mutually exclusive
sub-groups, just as in stratified sampling. • Then judgment used to select subjects or units from
each segment based on a specified proportion. • For example, an interviewer may be told to sample 200
females and 300 males between the age of 45 and 60. • It is this second step which makes the technique one of
non-probability sampling. • In quota sampling the selection of the sample is non-
random. • For example interviewers might be tempted to interview
those who look most helpful. The problem is that these samples may be biased because not everyone gets a chance of selection. This random element is its greatest weakness and quota versus probability has been a matter of controversy for many years

CONVENIENCE SAMPLING
36
• Disebut juga sebagai grab atau opportunity sampling atau accidental atau haphazard sampling.
• A type of nonprobability sampling which involves the sample being drawn from that part of the population which is close to hand. That is, readily available and convenient.
• The researcher using such a sample cannot scientifically make generalizations about the total population from this sample because it would not be representative enough.
• For example, if the interviewer was to conduct a survey at a shopping center early in the morning on a given day, the people that he/she could interview would be limited to those given there at that given time, which would not represent the views of other members of society in such an area, if the survey was to be conducted at different times of day and several times per week.
• This type of sampling is most useful for pilot testing. • In social science research, snowball sampling is a similar technique,
where existing study subjects are used to recruit more subjects into the sample.

37
CONVENIENCE SAMPLING…….
– Menggunakan hasil yang mudah diperoleh
37

Judgmental sampling or Purposive sampling
38
• Peneliti memilih sampel berdasarkan kriteria tertentu yang dinilai dapat mewakili studi atau riset yang dilakukan. Pada umumnya dilakukan jika ahli atau orang yang berkompeten pada bidang yang diteliti sangat terbatas (minim).

PANEL SAMPLING
39
• Pada metode ini, pertama dilakukan pemilihan grup partisipan
secara random, kemudian setiap partisipan akan diberi pertanyaan yang sama berulang pada periode yang berbeda. Tiap periode pengambilan data disebut sebagai “wave”.
• Metode ini umum digunakan untuk studi berskala besar untuk mengukur perubahan dalam populasi dengan bermacam-macam variabel, misal penyakit, tingkat stres, hingga uang belanja.
• Contoh aplikasi panel sampling: penelitian mengenai perubahan kesehatan seseorang karena pengaruh usia.
• Terdapat beberapa metode untuk menganalisa data sampel panel diantaranya growth curves.

Ukuran Sampel • Ukuran Vs Kerepresentatifan (keterwakilan)
• Secara umum, semakin besar ukuran sampel akan semakin
baik, karena ukuran sampel yang besar cenderung memiliki error yang kecil, sebagaimana telah kita temui pada latihan menggunakan tabel bilangan acak (random numbers).
• Namun demikian bukan berarti bahwa ukuran sampel yang besar sudah cukup memberikan garansi untuk mendapatkan hasil yang akurat. – Sebagai contoh, Jika satu dari dua sampel dari seluruh
negara terdiri dari satu jenis kelamin saja, berdasarkan ukurannya sampel ini besar namun tidak representatif. Ukuran oleh karena itu tidak lebih penting daripada kereprsentatifan.

Pertimbangan menentukan ukuran sampel
• Heterogenitas dari populasi / Derajat keseragaman
• Tingkat presisi yang dikehendaki / Tingkat kesalahan
• Tipe sampling design yang digunakan / Rencana analisis Jika rencana analisisnya mendetail atau rinci maka jumlah
sampelnya pun harus banyak.
• Biaya, waktu, dan tenaga yang tersedia (Singarimbun dan Effendy, 1989). Makin sedikit waktu, biaya , dan tenaga yang dimiliki peneliti,
makin sedikit pula sampel yang bisa diperoleh. Perlu dipahami bahwa apapun alasannya, penelitian haruslah dapat dikelola dengan baik (manageable).
• Resources availability

Misalnya di samping ingin mengetahui sikap konsumen terhadap kebijakan perusahaan, peneliti juga bermaksud mengetahui hubungan antara sikap dengan tingkat pendidikan. Agar tujuan ini dapat tercapai maka sampelnya harus terdiri atas berbagai jenjang pendidikan SD, SLTP. SMU, dan seterusnya.

• Heterogenitas populasi – Heterogenitas mengacu pada derajat perbedaan di
antara kasus dalam suatu karakteristik. – Semakin heterogen, jumlah kasus yang diperlukan
semakin besar agar estimasinya reliabel. Ekstrimnya, kalau semua kasus sama (homogen, unidimensional), jumlah sampel cukup satu, kalau tidak ada yang sama, harus sensus.
– Satuan pengukuran statistik terbaik untuk heterogenitas populasi adalah standard deviation (s) berhubungan dengan standard error yang tadi dibahas. Rumus standard error = s/√(N).
– Semakin besar heterogenitas populasi, perlu semakin banyak sampel agar lebih presisi

• Tingkat presisi yang dikehendaki – Secara teknis mengacu pada standard error (seperti
dijelaskan di atas). Tapi lebih mudah diilustrasikan dengan confidence interval.
– Pernyataan “rata2 populasi ada di antara 2-4” lebih presisi dibandingkan “rata2 populasi ada di antara 1-5”.
– Rumus standard error s/√(N), sampel perlu diperbesar agar standard error-nya mengecil. Agar standard error turun 1/2, N perlu naik empat kali lipat.
• Sampling design – Misalnya tanpa menambah jumlah sampel presisi
sampel bisa ditingkatkan dengan menggunakan stratified random sampling dan bukan simple random sampling, tapi cluster sampling perlu lebih banyak sampel.

Rumus Ukuran Sampel
• Rumus Solvin – Asumsinya bahwa populasi berdistribusi normal
– Rumusnya:
n = N/(1+Ne2)
Dimana:
– n = ukuran sampel
– N = ukuran populasi
– e = persen kelonggaran ketidaktelitian karena kesalahan pengambilan sampel.
• Rumusan Gay – Ukuran minimum sampel yang dapat diterima berdasarkan pada desain
penelitian yang digunakan, yaitu sebagai berikut:
• Metode Deskriptif : 10% populasi, untuk populasi relatif kecil minimal 20% populasi.
• Metode Deskriptif korelasional, minimal 30 subjek.
• Metode ex post facto, minimal 15 subjek per kelompok.
• Metode Eksperimental, minimal 15 subjek per kelompok.
Untuk populasi kecil (< 10.000)
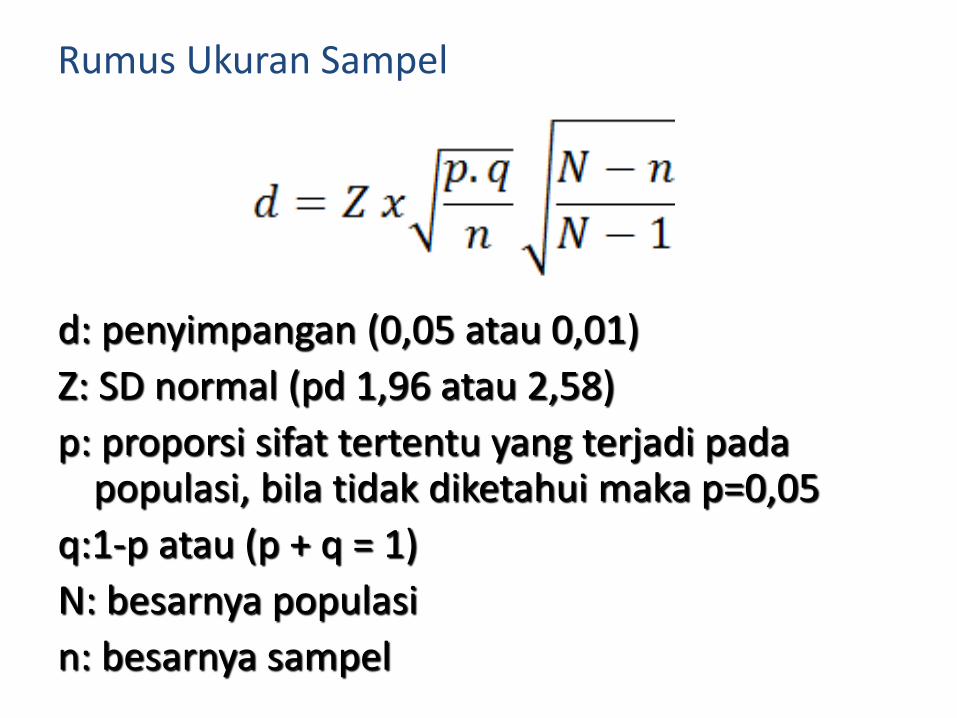
d: penyimpangan (0,05 atau 0,01)
Z: SD normal (pd 1,96 atau 2,58)
p: proporsi sifat tertentu yang terjadi pada populasi, bila tidak diketahui maka p=0,05
q:1-p atau (p + q = 1)
N: besarnya populasi
n: besarnya sampel
Rumus Ukuran Sampel

Contoh: Penelitian tentang status gizi anak balita di
kelurahan X N = 923.000, prevalensi gizi kurang tidak diketahui.Tentukan besar
sampel (n) yang harus diambil bila dikehendaki derajat kemaknaan (1- α =95%
dengan estimasi penyimpangan (α=0,05)
• Bila dimasukan ke dalam formula di atas diperoleh besarnya sampel n = 480

48
Tabel jumlah sampel berdasarkan jumlah populasi
Populasi (N) Sampel (n) Populasi (N) Sampel (n) Populasi (N) Sampel (n)
10 10 220 140 1200 291
15 14 230 144 1300 297
20 19 240 148 1400 302
25 24 250 152 1500 306
30 28 260 155 1600 310
35 32 270 159 1700 313
40 36 280 162 1800 317
45 40 290 165 1900 320
50 44 300 169 2000 322
55 48 320 175 2200 327
60 52 340 181 2400 331
65 56 360 186 2600 335
70 59 380 191 2800 338
75 63 400 196 3000 341
80 66 420 201 3500 346
85 70 440 205 4000 351
90 73 460 210 4500 354
95 76 480 214 5000 357

49
100 80 500 217 6000 361
110 86 550 226 7000 364
120 92 600 234 8000 367
130 97 650 242 9000 368
140 103 700 248 10000 370
150 108 750 254 15000 375
160 113 800 260 20000 377
170 118 850 265 30000 379
180 123 900 269 40000 380
190 127 950 274 50000 381
200 132 1000 278 75000 382
210 136 1100 285 1000000 384
Populasi (N) Sampel (n) Populasi (N) Sampel (n) Populasi (N) Sampel (n)
Morgan & Krecjie, dalam Uma Sekaran, 2003