sample report: eastern europe b2c e-commerce market 2015
TRANSCRIPT

1

© Copyright 2015 ystats.com GmbH & Co. KG, 22765 Hamburg, Germany 2
3

4
METHODOLOGY (1 OF 2)
The reports are compiled based on secondary market research. Secondary research is information gathered from previously published sources. Our reports are
solely based on information and data acquired from national and international statistical offices, industry and trade associations, business reports, business and
company databases, journals, company registries, news portals and many other reliable sources. By using various sources we ensure maximum objectivity for
all obtained data. As a result, companies gain a precise and unbiased impression of the market situation.
Cross referencing of data is conducted in order to ensure validity and reliability.
The source of information and its release date are provided on every chart. It is possible that the information contained in one chart is derived from several
sources. If this is the case, all sources are mentioned on the chart.
The reports take into account a broad definition of B2C E-Commerce, which might include mobile commerce. As definitions may vary among sources, exact
definition used by the source (if available) is included at the bottom of the chart.
Our reports include text charts, pie charts, bar charts, rankings, line graphs and tables. Every chart contains an Action Title, which summarizes the main
idea/finding of the chart and a Subtitle, which provides necessary information about the country, the topic, units or measures of currency, and the applicable time
period(s) to which the data refers. With respect to rankings, it is possible that the summation of all categories amounts to more than 100%. In this case, multiple
answers were possible, which is noted at the bottom of the chart.
Reports are comprised of the following elements, in the following order: Cover page, preface, legal notice, methodology, definitions, table of contents,
management summary (summarizing main information contained in each section of report) and report content (divided into sections and chapters). When
available, we also include forecasts in our report content. These forecasts are not our own; they are published by reliable sources. Within Global and Regional
reports, we include all major developed and emerging markets, ranked in order of importance by using evaluative criteria such as sales figures.
If available, additional information about the data collection, for example the time of survey and number of people surveyed, is provided in the form of a note. In
some cases, the note (also) contains additional information needed to fully understand the contents of the respective data.
When providing information about amounts of money, local currencies are most often used. When referencing currency values in the Action Title, the EUR
values are also provided in brackets. The conversions are always made using the average currency exchange rate for the respective time period. Should the
currency figure be in the future, the average exchange rate of the past 12 months is used.
The reports include mainly data from the last 12 months prior to date of report publication. Exact publication dates are mentioned in every chart.

5
METHODOLOGY (2 OF 2)
This report covers the B2C E-Commerce market in Eastern Europe.
The regional chapter opens the report, including global and regional comparisons that concern criteria related to B2C E-Commerce, such as B2C E-Commerce
sales and B2C E-Commerce’s share of total retail sales, Internet and online shopper penetration.
The rest of the report is divided by countries. The countries are presented in the order of descending B2C E-Commerce sales.
Each country chapter starts with an overview of the development of B2C E-Commerce in the respective country with international comparisons.
Following that, information about trends, sales & shares, users & shoppers, products, payment, delivery and players is presented.
The “Trends” section includes an overview of market trends, such as cross-border B2C E-Commerce, M-Commerce, online price comparison and social
commerce.
The section “Sales & Shares” covers the development of B2C E-Commerce sales, including forecasts. Furthermore, this section shows the development of B2C
E-Commerce’s share of the total retail sales.
In the “Users & Shoppers” section, information about Internet penetration and online shoppers is included.
Afterwards, the section “Products” shows the leading product categories purchased by online shoppers.
The next two sections, “Payment” and “Delivery”, cover information related to delivery and payment methods most used by online shoppers.
Finally, the “Players” section includes information about the leading E-Commerce players, such as marketplaces, online and multichannel retailers.
6
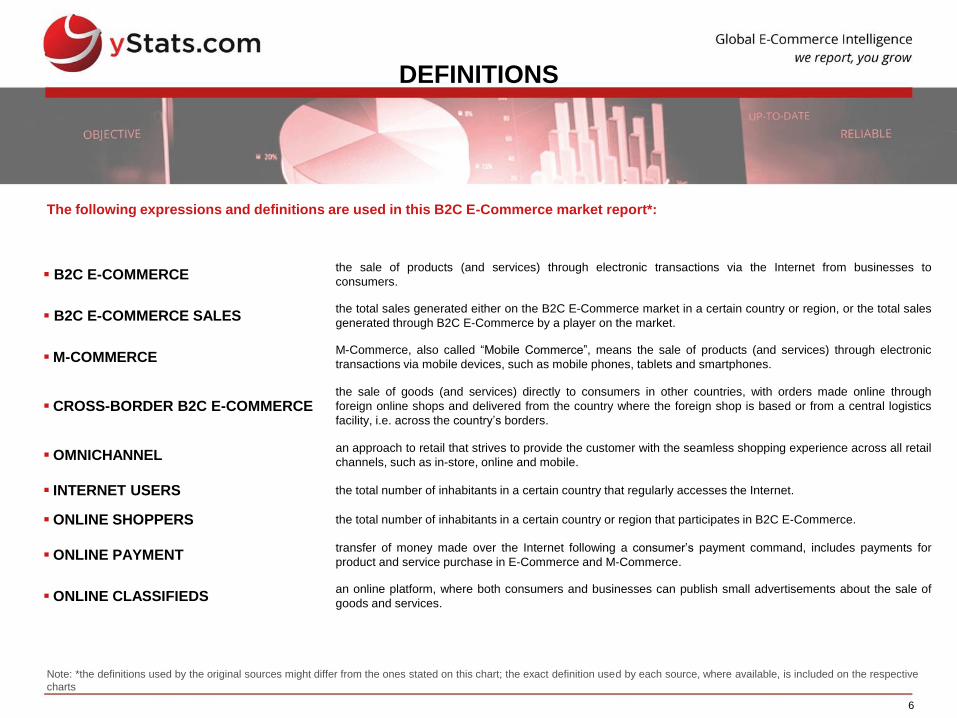
DEFINITIONS
B2C E-COMMERCE the sale of products (and services) through electronic transactions via the Internet from businesses to
consumers.
B2C E-COMMERCE SALES the total sales generated either on the B2C E-Commerce market in a certain country or region, or the total sales
generated through B2C E-Commerce by a player on the market.
M-COMMERCE M-Commerce, also called “Mobile Commerce”, means the sale of products (and services) through electronic
transactions via mobile devices, such as mobile phones, tablets and smartphones.
CROSS-BORDER B2C E-COMMERCE the sale of goods (and services) directly to consumers in other countries, with orders made online through
foreign online shops and delivered from the country where the foreign shop is based or from a central logistics
facility, i.e. across the country’s borders.
OMNICHANNEL an approach to retail that strives to provide the customer with the seamless shopping experience across all retail
channels, such as in-store, online and mobile.
INTERNET USERS the total number of inhabitants in a certain country that regularly accesses the Internet.
ONLINE SHOPPERS the total number of inhabitants in a certain country or region that participates in B2C E-Commerce.
ONLINE PAYMENT transfer of money made over the Internet following a consumer’s payment command, includes payments for
product and service purchase in E-Commerce and M-Commerce.
ONLINE CLASSIFIEDS an online platform, where both consumers and businesses can publish small advertisements about the sale of
goods and services.
The following expressions and definitions are used in this B2C E-Commerce market report*:
Note: *the definitions used by the original sources might differ from the ones stated on this chart; the exact definition used by each source, where available, is included on the respective
charts
7
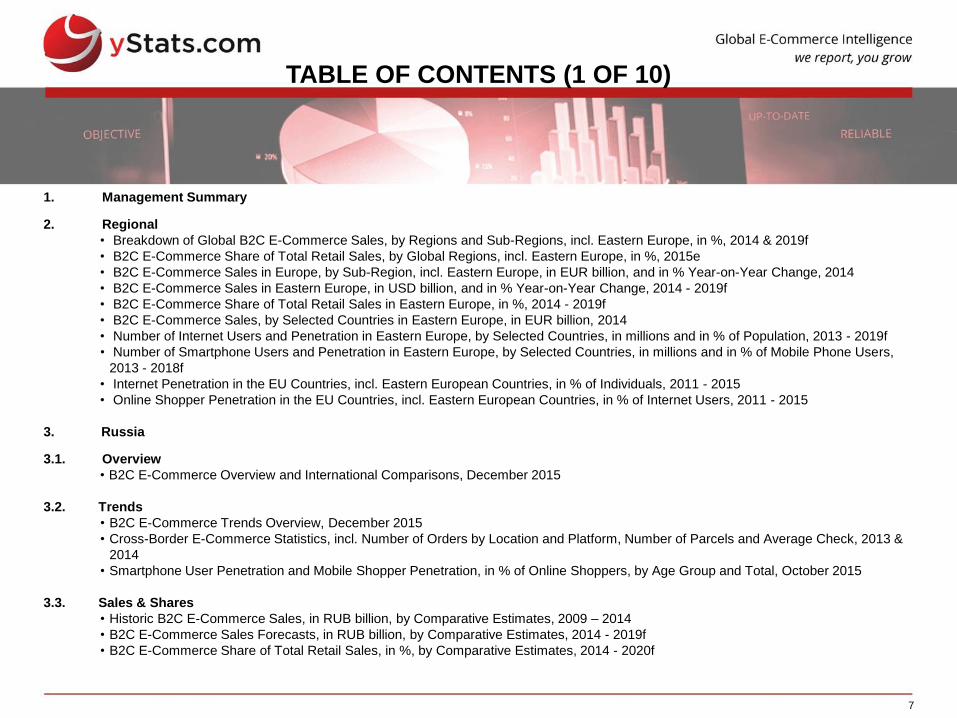
TABLE OF CONTENTS (1 OF 10)
1. Management Summary
2. Regional
• Breakdown of Global B2C E-Commerce Sales, by Regions and Sub-Regions, incl. Eastern Europe, in %, 2014 & 2019f
• B2C E-Commerce Share of Total Retail Sales, by Global Regions, incl. Eastern Europe, in %, 2015e
• B2C E-Commerce Sales in Europe, by Sub-Region, incl. Eastern Europe, in EUR billion, and in % Year-on-Year Change, 2014
• B2C E-Commerce Sales in Eastern Europe, in USD billion, and in % Year-on-Year Change, 2014 - 2019f
• B2C E-Commerce Share of Total Retail Sales in Eastern Europe, in %, 2014 - 2019f
• B2C E-Commerce Sales, by Selected Countries in Eastern Europe, in EUR billion, 2014
• Number of Internet Users and Penetration in Eastern Europe, by Selected Countries, in millions and in % of Population, 2013 - 2019f
• Number of Smartphone Users and Penetration in Eastern Europe, by Selected Countries, in millions and in % of Mobile Phone Users,
2013 - 2018f
• Internet Penetration in the EU Countries, incl. Eastern European Countries, in % of Individuals, 2011 - 2015
• Online Shopper Penetration in the EU Countries, incl. Eastern European Countries, in % of Internet Users, 2011 - 2015
3. Russia
3.1. Overview
• B2C E-Commerce Overview and International Comparisons, December 2015
3.2. Trends
• B2C E-Commerce Trends Overview, December 2015
• Cross-Border E-Commerce Statistics, incl. Number of Orders by Location and Platform, Number of Parcels and Average Check, 2013 &
2014
• Smartphone User Penetration and Mobile Shopper Penetration, in % of Online Shoppers, by Age Group and Total, October 2015
3.3. Sales & Shares
• Historic B2C E-Commerce Sales, in RUB billion, by Comparative Estimates, 2009 – 2014
• B2C E-Commerce Sales Forecasts, in RUB billion, by Comparative Estimates, 2014 - 2019f
• B2C E-Commerce Share of Total Retail Sales, in %, by Comparative Estimates, 2014 - 2020f

8
TABLE OF CONTENTS (2 OF 10)
3. Russia (Cont.)
3.4. Users & Shoppers
• Monthly Internet Audience, in millions and in % of Adult Population, Summer 2011 - Summer 2015
• Number of Online Shoppers, in millions and in % of Internet Users, 2013 & 2014
• Online Shopper Penetration, by Gender, Age Group and Location Type, in % of Internet Users in the Relevant Group, November 2014
3.5 Products
• Product Categories Purchased Online, in % of Online Shoppers, 2013 & 2014
• B2C E-Commerce Sales by Product Categories, in RUB billion, 2013 & 2014
3.6. Payment
• Payment Methods Used in Online Shopping, in % of Online Shoppers, 2011 – 2014
3.7. Delivery
• Breakdown of B2C E-Commerce Orders by Delivery Methods, in %, 2013 & 2014
3.8. Players
• B2C E-Commerce Players Overview, December 2015
• Top 20 Online Shops, Ranked by Sales, incl. E-Commerce Sales, in RUB billion, Number of Orders, in thousands, Average Check, in
RUB, and Main Product Category, H1 2015
4. Poland
4.1. Overview
• B2C E-Commerce Overview and International Comparison, January 2016
4.2. Trends
• M-Commerce Sales, in PLN billion, 2013 & 2016f
• Cross-Border Online Shopper Penetration, in % of Online Shoppers, 2014

9
TABLE OF CONTENTS (3 OF 10)
4. Poland (Cont.)
4.3. Sales & Shares
• B2C E-Commerce Sales, in PLN billion, by Comparative Estimates, and CAGR, in %, 2013 - 2016f
• B2C E-Commerce Share of Total Retail Sales, by Comparative Estimates, 2014 - 2018f
4.4. Users & Shoppers
• Internet Penetration, in % of Individuals, 2011 – 2015
• Online Shopper Penetration, in % of Individuals, 2011 – 2015
• Online Shopper Penetration, by Gender and Age Group, in % of Individuals, 2014 & 2015
4.5 Products
• Product Categories Purchased Online, in % of Online Shoppers, 2014 & 2015
4.6. Payment
• Breakdown of Payment Methods Most Used in Online Shopping, in % of Online Shoppers, 2014
4.7. Delivery
• Breakdown of Delivery Methods Most Used in Online Shopping, in % of Online Shoppers, April 2015
4.8. Players
• E-Commerce Player Overview, December 2015
• Top 5 Most Recognized E-Commerce Websites, in % Internet Users, April 2015
5. Turkey
5.1. Overview
• B2C E-Commerce Market Overview and International Comparisons, January 2016
10
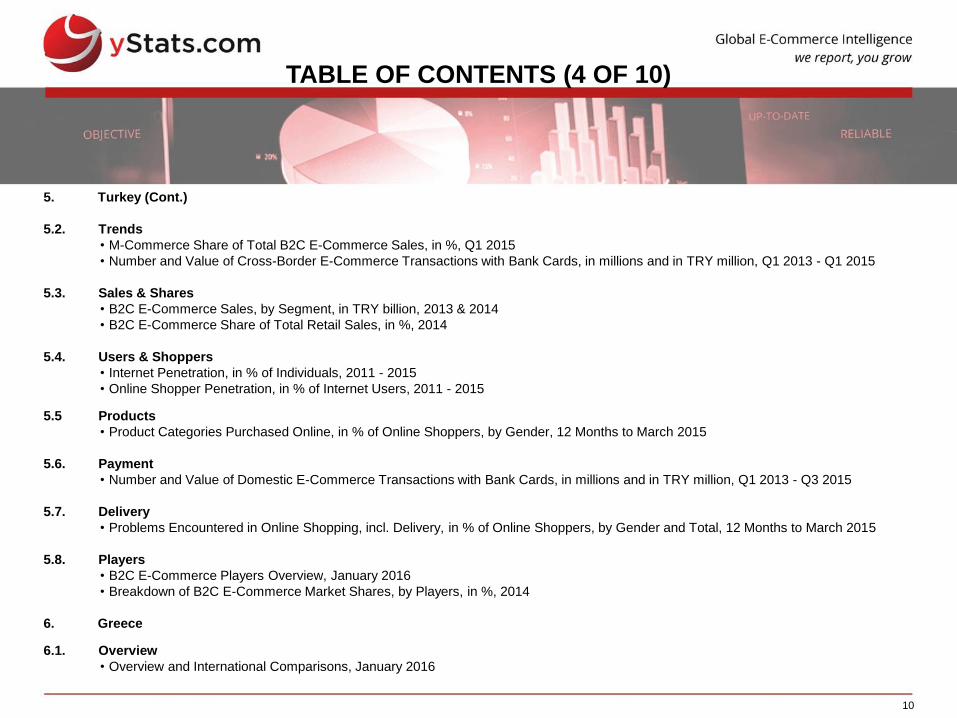
TABLE OF CONTENTS (4 OF 10)
5. Turkey (Cont.)
5.2. Trends
• M-Commerce Share of Total B2C E-Commerce Sales, in %, Q1 2015
• Number and Value of Cross-Border E-Commerce Transactions with Bank Cards, in millions and in TRY million, Q1 2013 - Q1 2015
5.3. Sales & Shares
• B2C E-Commerce Sales, by Segment, in TRY billion, 2013 & 2014
• B2C E-Commerce Share of Total Retail Sales, in %, 2014
5.4. Users & Shoppers
• Internet Penetration, in % of Individuals, 2011 - 2015
• Online Shopper Penetration, in % of Internet Users, 2011 - 2015
5.5 Products
• Product Categories Purchased Online, in % of Online Shoppers, by Gender, 12 Months to March 2015
5.6. Payment
• Number and Value of Domestic E-Commerce Transactions with Bank Cards, in millions and in TRY million, Q1 2013 - Q3 2015
5.7. Delivery
• Problems Encountered in Online Shopping, incl. Delivery, in % of Online Shoppers, by Gender and Total, 12 Months to March 2015
5.8. Players
• B2C E-Commerce Players Overview, January 2016
• Breakdown of B2C E-Commerce Market Shares, by Players, in %, 2014
6. Greece
6.1. Overview
• Overview and International Comparisons, January 2016

11
TABLE OF CONTENTS (5 OF 10)
6. Greece (Cont.)
6.2. Trends
• Share of Online Shoppers Purchasing Online due to Direct Price/Product Comparisons, in %, 2014 & 2015
• Top Three Reasons to Shop Online and Top Three Main Sources of Information in Online Purchases, in % of Online Shoppers, 2015
6.3. Sales & Shares
• B2C E-Commerce Sales, in EUR billion, 2013 & 2014
6.4 Users & Shoppers
• Internet Penetration, in % of Households, 2011 – 2015
• Online Shopper Penetration, in % of Internet Users, 2011 – 2015
• Breakdown of Online Shopper Penetration, by Age and Gender, in %, Q1 2015
6.5 Products
• Product Categories Purchased Online, in % of Online Shoppers, 12 Months to March 2015
6.6 Payment
• Breakdown of Payment Methods Used in Online Shopping, in %, July 2015
6.7 Delivery
• Breakdown of Problems Encountered in Online Shopping, incl. Delivery-Related, in % of Online Shoppers, 12 Months to March 2015
6.8 Players
• Top 10 E-Commerce Websites, by Website Rank, incl. Website Type and Website Visits, December 2015
7. Czech Republic
7.1 Overview
• Overview and International Comparisons, January 2016

12
TABLE OF CONTENTS (6 OF 10)
7. Czech Republic (Cont.)
7.2. Trends
• Share of B2C E-Commerce Websites with Mobile Sites, in %, 2014 & 2015e
• Cross-Border Online Shopper Penetration, by Location of Seller, incl. Any Foreign Country, Other EU Countries, Non-EU Countries, in %
of Online Shoppers, by Gender and Age Group, Q2 2015
7.3. Sales & Shares
• B2C E-Commerce Sales, in CZK billion and in % Year-on-Year Change, 2010 - 2015e
• B2C E-Commerce Share of Total Retail, in %, 2015e & 2017f
7.4 Users & Shoppers
• Internet Penetration, in % of Households, 2011 - 2015
• Number of Online Shoppers, in millions and in % of Population, 2010, 2012, 2014 & 2015
• Online Shopper Penetration, by Age and Gender, in % of Internet Users, Q2 2015
7.5 Products
• Product Categories Purchased Online, in % of Online Shoppers, by Gender and Age Group, Q2 2015
7.6 Payment
• Payment Methods Used in Online Shopping, in % of Online Shoppers, 2015
7.7 Delivery
• Breakdown of Preferences over the Speed of Delivery, in % of Online Shoppers, August 2015
7.8 Players
• B2C E-Commerce Players Overview, January 2016
• Breakdown of Online Shops’ Market Share by Product Category, in %, H1 2015

13
TABLE OF CONTENTS (7 OF 10)
8. Ukraine
8.1 Overview
• Overview and International Comparisons, January 2016
8.2 Trends
• Share of Online Shoppers Placing Orders Online via Social Networks, in %, 2013 & 2014
8.3 Sales & Shares
• B2C E-Commerce Sales, in UAH billion, 2014 - 2017f
• B2C E-Commerce Share of Total Retail Sales, in %, 2014
8.4 Users & Shoppers
• Internet Penetration, in % of Individuals, 2010 - 2014
• Number of Online Shoppers, in millions, Q3 2013 & Q3 2014
8.5 Products
• Product Categories Purchased Online, in % of Online Shoppers, Q3 2014
8.6 Payment
• Share of Online Shoppers Paying by Card, in %, 2015
8.7 Delivery
• Most Important Factors in Online Shopping, incl. Delivery, in % of Online Shoppers, Q3 2014
8.8 Players
• Breakdown of Online Shops by Market Share, by Electronics & Household Appliances and Clothing & Shoes, 2014

14
TABLE OF CONTENTS (8 OF 10)
9. Romania
9.1 Overview
• Overview and International Comparisons, January 2016
9.2 Trends
• Breakdown of Online Transactions with Payment Cards, by Cross-Border and Domestic, in %, 2014
9.3 Sales & Shares
• B2C E-Commerce Sales, in EUR billion, 2013 & 2014
• B2C E-Commerce Share of Total Retail Sales, in %, 2014
9.4 Users & Shoppers
• Internet Penetration, in % of Individuals, 2011 - 2015
• Online Shopper Penetration, in % of Internet Users, 2012 - 2015
9.5 Products
• Top 3 Product Categories in B2C E-Commerce, by Rank, 2014
9.6 Payment
• Share of Cash on Delivery Payment for Online Purchases, in % of Online Purchases, 2014
9.7 Delivery
• Main Disadvantages of Online Shopping, incl. Delivery Costs, September 2014
9.8 Players
• Top 10 Most Visited E-Commerce websites, by in % Internet Users, September 2015
15
TABLE OF CONTENTS (9 OF 10)
10. Hungary
10.1 Overview
• Overview and International Comparisons, January 2016
10.2 Trends
• Average Spending on Online Purchases via Mobile Devices per Shopper, in HUF thousand, 2014 & 2015f
10.3 Sales & Shares
• B2C E-Commerce Sales, in HUF billion, 2013 & 2014
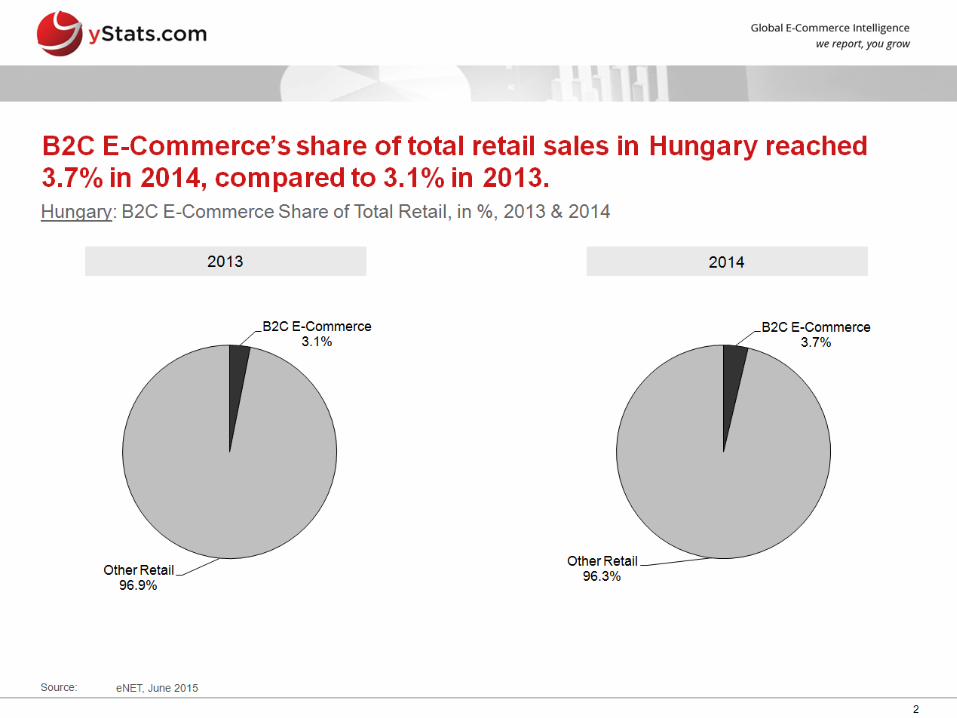
• B2C E-Commerce Share of Total Retail, in %, 2013 & 2014
10.4 Users & Shoppers
• Internet Penetration, in % of Individuals, 2010 - 2014
• Online Shopper Penetration, in % of Population, 2010 - 2014
10.5 Products
• Breakdown of Product Categories Purchased Online, in % of Online Shoppers, 2014
10.6 Payment
• Share of Payment on Delivery of Total Online Shopping Spending, in %, 2014
10.7 Delivery
• Preferences over Delivery Methods, in % of Online Shoppers, 2014 & 2015
10.8 Players
• E-Commerce Websites Type Uses, in % of Online Shoppers, 2014 & 2015
• Top 15 E-Commerce Websites, by Website Rank, incl. Website Type and Website Visits, November 2015
16
TABLE OF CONTENTS (10 OF 10)
11. Belarus
11.1 Overview
• Overview and International Comparisons, January 2016
11.2 Trends
• Breakdown of Online Purchases by Device Used, in %, Q1 2015
• Countries and Regions Purchased Online from, 6 Months to September 2014
11.3 Sales & Shares
• B2C E-Commerce Sales, in USD million, 2013 & 2014
• B2C E-Commerce Share of Total Retail Sales, in %, 2013
11.4 Users & Shoppers
• Internet Penetration, in % of Individuals, 2010 - 2014
• Online Shopper Penetration, in % of Internet Users, 2013 - 2015
11.5 Products
• Products Purchased Online, in % of Online Shoppers, 2014
11.6 Payment
• Breakdown of Last Online Purchase by Payment Methods, in % of Online Shoppers, September 2014
11.7 Delivery
• Breakdown of the Last B2C E-Commerce Order by Delivery Method, by Order Value, in % of Online Shoppers, September 2014
11.8 Players
• Top 10 E-Commerce Websites by Website Rank, January 2015

17
1. Management Summary
17 – 27
2. Regional
28 – 40
3.
4.
5.
6.
Russia
Poland
Turkey
Greece
41 – 59
60 – 73
74 – 86
87 – 98
7.
8.
9.
10.
11.
Czech Republic
Ukraine
Romania
Hungary
Belarus
99 – 112
113 – 123
124 – 134
135 – 146
147 – 158

18
19

20