china b2c e-commerce market 2015 - ystats.com€¦ · china b2c e-commerce market 2015 ... historic...
TRANSCRIPT

1
CHINA B2C E-COMMERCE MARKET 2015 PUBLICATION DATE: SEPTEMBER 2015
PAGE 2 GENERAL INFORMATION I PAGE 3 KEY FINDINGS I PAGE 4-5 TABLE OF CONTENTS I PAGE 6 REPORT-SPECIFIC SAMPLE
CHARTS I PAGE 7 METHODOLOGY I PAGE 8 RELATED REPORTS I PAGE 9 CLIENTS I PAGE 10-11 FREQUENTLY ASKED QUESTIONS
PAGE 12 ORDER FORM I PAGE 13 TERMS AND CONDITIONS

2
2
PRODUCT DETAILS Title:
Type of Product:
Category:
Covered Regions:
Covered Countries:
Language:
Formats:
Number of Charts:
China B2C E-Commerce Market 2015
Market Report
B2C E-Commerce
N/A
China
English
PDF & PowerPoint
75
PRICES* Single User License:
Site License:
Global Site License:
€ 950 (exc. VAT)
€ 1,425 (exc. VAT)
€ 1,900 (exc. VAT)
QUESTIONS
ANSWERED
IN THIS REPORT
How large is the B2C E-Commerce market in China and what is its growth potential?
How does China rank among other major B2C E-Commerce markets worldwide?
How many people are shopping online in China and which products do they buy?
Which payment, delivery and other trends are prevalent in B2C E-Commerce in China?
Who are the leaders in Chinese online retail and how high are their market shares?
SECONDARY MARKET
RESEARCH
Our reports are exclusively based on secondary market research. Our researchers derive
information and data from a variety of reliable published sources and compile the data into
understandable and easy-to-use formats.
ADVANTAGES Maximum Objectivity
Reliable Sources
Up-To-Date Analysis
Boardroom-Ready PowerPoint Presentations
Guidance For Strategic Company Decisions
CHINA B2C E-COMMERCE MARKET 2015

3
CHINA’S B2C E-COMMERCE GROWTH POTENTIAL STILL HIGH ESPECIALLY
IN RURAL AREAS
Due to its rapid growth in recent years and its vast population, China has become
one of the global leaders in B2C E-Commerce. Among the emerging BRIC countries, China’s
average triple-digit growth rate in five years to 2014 was the highest, though the less
advanced market in India is predicted to overtake the leadership by growth for the next
several years. Over 300 million people, more than half of all Internet users, already make
purchases online in China. This number is likely to rise further, as Internet penetration in
China was close to just 50% of population in 2014, less than in Russia or Brazil and
significantly below the advanced Asian markets, such as Japan and South Korea.
The highest potential for growth of online retail in China is reported to be in rural
areas and small villages. Major E-Commerce companies are already expanding their
logistics and delivery services to cover these regions. Another important trend is
proliferation of mobile commerce, which accounted for around one third of total online
retail sales in China in 2014 and is predicted to increase its share further. Moreover, cross-
border E-Commerce imports to China are growing, heating the interest of international
players.
The B2C E-Commerce market in China is dominated by domestic companies. Two
players, Alibaba Group which operates B2C marketplace Tmall among other E-Commerce
businesses and online retailer JD.com each held an international IPO in 2014 and are
actively expanding in China, as well as on the international markets through their cross-
border platforms. Meanwhile, a number of smaller niche players have been backed up by
investment capital, such as group buying websites Meituan and Dianping and online food
delivery service Ele.me. Competition in B2C E-Commerce also intensifies, as foreign players
such as US-based Amazon and Walmart enhance their efforts in China.
CHINA B2C E-COMMERCE MARKET 2015
4
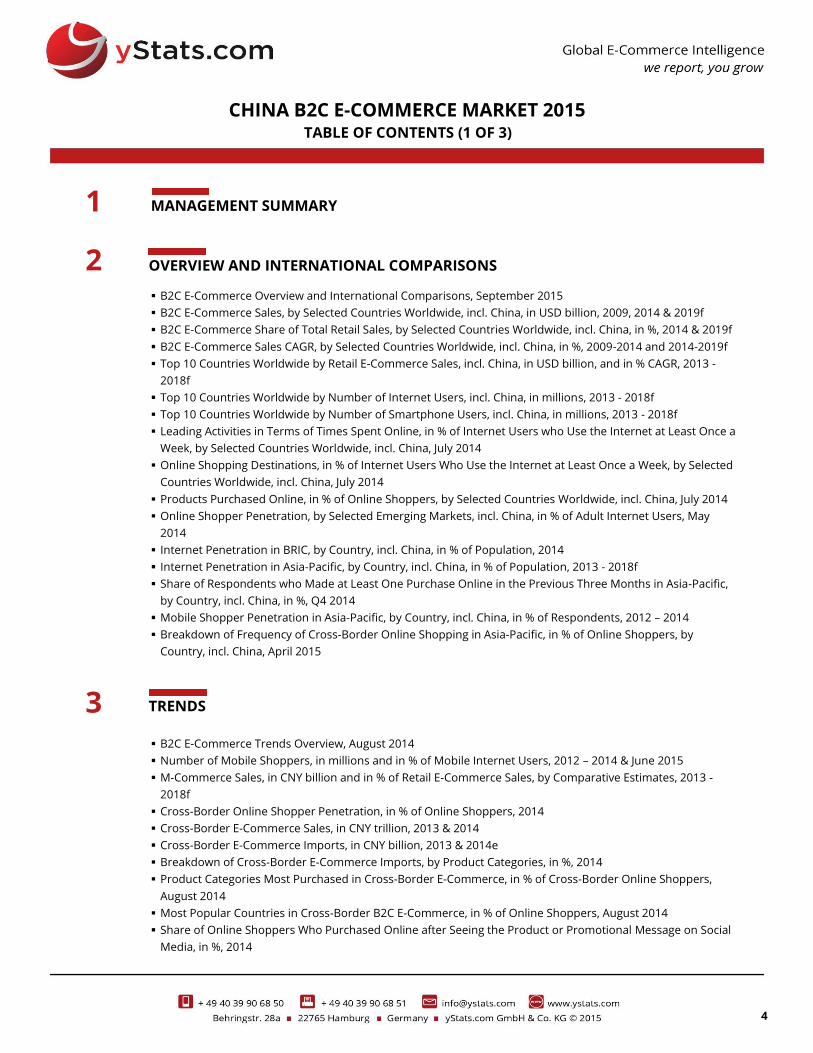
MANAGEMENT SUMMARY
OVERVIEW AND INTERNATIONAL COMPARISONS
B2C E-Commerce Overview and International Comparisons, September 2015
B2C E-Commerce Sales, by Selected Countries Worldwide, incl. China, in USD billion, 2009, 2014 & 2019f
B2C E-Commerce Share of Total Retail Sales, by Selected Countries Worldwide, incl. China, in %, 2014 & 2019f
B2C E-Commerce Sales CAGR, by Selected Countries Worldwide, incl. China, in %, 2009-2014 and 2014-2019f
Top 10 Countries Worldwide by Retail E-Commerce Sales, incl. China, in USD billion, and in % CAGR, 2013 -
2018f
Top 10 Countries Worldwide by Number of Internet Users, incl. China, in millions, 2013 - 2018f
Top 10 Countries Worldwide by Number of Smartphone Users, incl. China, in millions, 2013 - 2018f
Leading Activities in Terms of Times Spent Online, in % of Internet Users who Use the Internet at Least Once a
Week, by Selected Countries Worldwide, incl. China, July 2014
Online Shopping Destinations, in % of Internet Users Who Use the Internet at Least Once a Week, by Selected
Countries Worldwide, incl. China, July 2014
Products Purchased Online, in % of Online Shoppers, by Selected Countries Worldwide, incl. China, July 2014
Online Shopper Penetration, by Selected Emerging Markets, incl. China, in % of Adult Internet Users, May
2014
Internet Penetration in BRIC, by Country, incl. China, in % of Population, 2014
Internet Penetration in Asia-Pacific, by Country, incl. China, in % of Population, 2013 - 2018f
Share of Respondents who Made at Least One Purchase Online in the Previous Three Months in Asia-Pacific,
by Country, incl. China, in %, Q4 2014
Mobile Shopper Penetration in Asia-Pacific, by Country, incl. China, in % of Respondents, 2012 – 2014
Breakdown of Frequency of Cross-Border Online Shopping in Asia-Pacific, in % of Online Shoppers, by
Country, incl. China, April 2015
TRENDS
B2C E-Commerce Trends Overview, August 2014
Number of Mobile Shoppers, in millions and in % of Mobile Internet Users, 2012 – 2014 & June 2015
M-Commerce Sales, in CNY billion and in % of Retail E-Commerce Sales, by Comparative Estimates, 2013 -
2018f
Cross-Border Online Shopper Penetration, in % of Online Shoppers, 2014
Cross-Border E-Commerce Sales, in CNY trillion, 2013 & 2014
Cross-Border E-Commerce Imports, in CNY billion, 2013 & 2014e
Breakdown of Cross-Border E-Commerce Imports, by Product Categories, in %, 2014
Product Categories Most Purchased in Cross-Border E-Commerce, in % of Cross-Border Online Shoppers,
August 2014
Most Popular Countries in Cross-Border B2C E-Commerce, in % of Online Shoppers, August 2014
Share of Online Shoppers Who Purchased Online after Seeing the Product or Promotional Message on Social
Media, in %, 2014
CHINA B2C E-COMMERCE MARKET 2015
1
2
3
TABLE OF CONTENTS (1 OF 3)

5
5
SALES & SHARES
Historic B2C E-Commerce Sales, in USD billion, by Comparative Estimates, 2009 - 2014
B2C E-Commerce Sales Forecasts, in USD billion, by Comparative Estimates, 2014 - 2019f
Historic Retail E-Commerce Sales (incl. C2C and B2C), in USD billion, by Comparative Estimates, 2009 – 2014
Retail E-Commerce Sales Forecasts (incl. B2C and C2C), in USD billion, by Comparative Estimates, 2013 - 2019f
Comparative Estimates of B2C E-Commerce (incl. C2C) Share of Total Retail Sales, in %, 2013 - 2019f
USERS & SHOPPERS
Internet Penetration, in % of Population, 2010 - 2014
Number of Internet Users, in millions, and in % Penetration, 2013 - 2018f
Number of Online Shoppers, in Millions, and in % of Internet Users, 2010 – 2014 & June 2015
PRODUCTS
Product Categories Purchased Online, in % of Online Shoppers, 2013 & 2014
Product Categories Purchased Online in the Previous 3 Months, in % of Online Shoppers, February 2015
Average Annual Online Spending and Number of Online Purchases, by Product Category, February 2015
Share of Internet Users Purchasing Groceries Online and Intending to Purchase Groceries Online, in %,
September 2014
PAYMENT
Payment Methods Used in Online Shopping, in % of Online Shoppers, 2014
Online Payment Methods Used, in % of Online Payment Users, 2014
Alipay’s Share of Total Payments for Online Purchases, in %, 2010 and 2014
DELIVERY
B2C E-Commerce Delivery Overview, September 2015
Main Considerations When Buying Online, incl. Delivery, in % of Online Shoppers, 2014
PLAYERS
B2C E-Commerce Player Overview, September 2015
Overview of Selected Major E-Commerce Investment Deals, 2014
Overview of Selected Major E-Commerce Investment Deals, January 2015 - August 2015
Breakdown of B2C E-Commerce Market Share by GMV, in %, 2014 & Q2 2015
B2C E-Commerce Sales of Top 10 B2C E-Commerce Companies by Market Share, in CNY billion, 2014
E-Commerce Brand Awareness, in % of Online Shoppers, 2014
Profile of Tmall, September 2015
Profile of JD.com, September 2015
Profile of Vip.com, September 2015
CHINA B2C E-COMMERCE MARKET 2015 TABLE OF CONTENTS (2 OF 3)
8
5
6
7
9
4

6
6
CHINA B2C E-COMMERCE MARKET 2015 REPORT-SPECIFIC SAMPLE CHARTS

7
GENERAL METHODOLOGY OF OUR MARKET REPORTS
The reports are compiled based on secondary market
research. Secondary research is information gathered from
previously published sources. Our reports are solely based on
information and data acquired from national and international
statistical offices, industry and trade associations, business
reports, business and company databases, journals, company
registries, news portals and many other reliable sources. By using
various sources we ensure maximum objectivity for all obtained
data. As a result, companies gain a precise and unbiased
impression of the market situation.
Cross referencing of data is conducted in order to
ensure validity and reliability.
The source of information and its release date are
provided on every chart. It is possible that the information
contained in one chart is derived from several sources. If this is
the case, all sources are mentioned on the chart.
The reports take into account a broad definition of B2C
E-Commerce, which might include mobile commerce. As
definitions may vary among sources, exact definition used by the
source (if available) is included at the bottom of the chart.
Our reports include text charts, pie charts, bar charts,
rankings, line graphs and tables. Every chart contains an Action
Title, which summarizes the main idea/finding of the chart and a
Sub Title, which provides necessary information about the
country, the topic, units or measures of currency, and the
applicable time period(s) to which the data refers. With respect to
rankings, it is possible that the summation of all categories
amounts to more than 100%. In this case, multiple answers were
possible, which is noted at the bottom of the chart.
Reports are comprised of the following elements, in the
following order: Cover page, preface, legal notice, methodology,
definitions, table of contents, management summary
(summarizing main information contained in each section of
report) and report content (divided into sections and chapters).
When available, we also include forecasts in our report content.
These forecasts are not our own; they are published by reliable
sources. Within Global and Regional reports, we include all major
developed and emerging markets, ranked in order of importance
by using evaluative criteria such as sales figures.
If available, additional information about the data
collection, for example the time of survey and number of people
surveyed, is provided in the form of a note. In some cases, the
note (also) contains additional information needed to fully
understand the contents of the respective data.
When providing information about amounts of money,
local currencies are most often used. When referencing currency
values in the Action Title, the EUR values are also provided in
brackets. The conversions are always made using the average
currency exchange rate for the respective time period. Should the
currency figure be in the future, the average exchange rate of the
past 12 months is used.
The reports include mainly data from the last 12 months
prior to the date of report publication. Exact publication dates are
mentioned in every chart.
METHODOLOGY OF OUR CHINA B2C E-COMMERCE MARKET 2015 REPORT
This country report covers major trends in the B2C E-
Commerce market, sales figures, B2C E-Commerce share of the
total retail market, the main online product categories, and
relevant information about Internet users, online shoppers and
leading E-Commerce companies.
The report starts with an overview of the B2C E-
Commerce market and international comparisons, where the
relevant country is compared to other countries worldwide and
in the region in terms of criteria relevant to B2C E-Commerce.
The “Trends” section includes an overview of trends on
the B2C E-Commerce market, such as social commerce, cross-
border and M-Commerce trends.
The section “Sales & Shares” includes the development
of B2C and total retail E-Commerce sales, including historical
sales and forecasts. Furthermore, this section shows the
development of B2C E-Commerce share of the total retail market.
In the “Users & Shoppers” section, a review of the
development of Internet users and Internet penetration is
included. Moreover, the evolution of the online shopper
penetration is shown.
Afterwards, the section “Products” shows the leading
product categories among online shoppers.
The next two sections, “Payment” and “Delivery”, cover
information related to E-Commerce delivery and payment
methods most used by online shoppers.
Finally, the “Players” section includes information about
the leading E-Commerce players, such as online marketplaces and
retailers.
CHINA B2C E-COMMERCE MARKET 2015
8
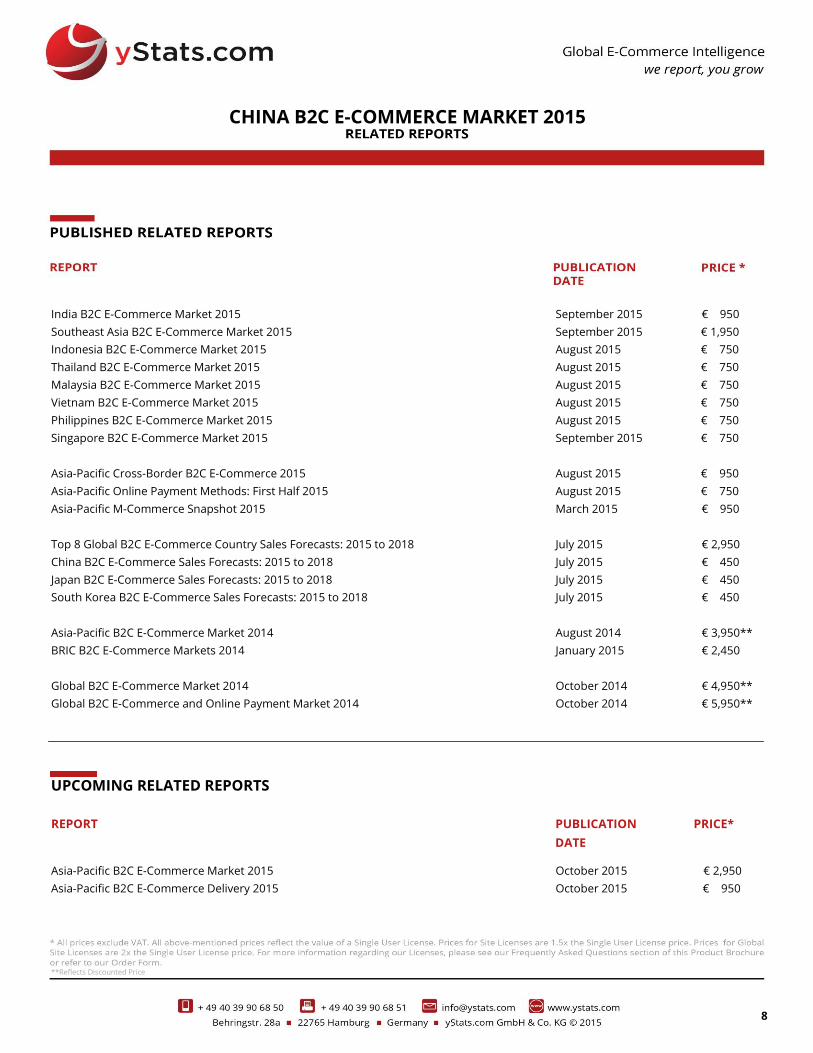
UPCOMING RELATED REPORTS
India B2C E-Commerce Market 2015 September 2015 € 950
Southeast Asia B2C E-Commerce Market 2015 September 2015 € 1,950
Indonesia B2C E-Commerce Market 2015 August 2015 € 750
Thailand B2C E-Commerce Market 2015 August 2015 € 750
Malaysia B2C E-Commerce Market 2015 August 2015 € 750
Vietnam B2C E-Commerce Market 2015 August 2015 € 750
Philippines B2C E-Commerce Market 2015 August 2015 € 750
Singapore B2C E-Commerce Market 2015 September 2015 € 750
Asia-Pacific Cross-Border B2C E-Commerce 2015 August 2015 € 950
Asia-Pacific Online Payment Methods: First Half 2015 August 2015 € 750
Asia-Pacific M-Commerce Snapshot 2015 March 2015 € 950
Top 8 Global B2C E-Commerce Country Sales Forecasts: 2015 to 2018 July 2015 € 2,950
China B2C E-Commerce Sales Forecasts: 2015 to 2018 July 2015 € 450
Japan B2C E-Commerce Sales Forecasts: 2015 to 2018 July 2015 € 450
South Korea B2C E-Commerce Sales Forecasts: 2015 to 2018 July 2015 € 450
Asia-Pacific B2C E-Commerce Market 2014 August 2014 € 3,950**
BRIC B2C E-Commerce Markets 2014 January 2015 € 2,450
Global B2C E-Commerce Market 2014 October 2014 € 4,950**
Global B2C E-Commerce and Online Payment Market 2014 October 2014 € 5,950**
REPORT
PUBLICATION
DATE
PRICE*
Asia-Pacific B2C E-Commerce Market 2015 October 2015 € 2,950
Asia-Pacific B2C E-Commerce Delivery 2015 October 2015 € 950
CHINA B2C E-COMMERCE MARKET 2015
**Reflects Discounted Price

9
10

11
12

13