samoa steps report - who€¦ · appendix 3 – questionnaire (samoan version ... that is one of...
TRANSCRIPT

AmericanSamoaSTEPSReport.doc
21/08/2007 Page 1 of 94
STEPS Report
NCD Surveillance

AmericanSamoaSTEPSReport.doc
21/08/2007 Page 2 of 94
Table of Contents
1. FOREWORD AND SUMMARY………………...………………………….…………………………5 1.1 Foreword from MOH………………………………………………………………………...……..5 1.2 Foreword from WHO…………………………………………………………………………….…6 1.3 Executive Summary…………………………………………………………….………………..…8 2. ACKNOWLEDGMENTS AND KEY CONTACTS……………………………………..…………..11 2.1 Acknowledgments……………………………………………………………………………..….11 2.2 WHO Contact………………………………………………………………………………..……11 2.3 American Samoa Contact…………………………………………………………………..……..12 2.4 Monash University Contact………………………………………………………………….……12 3. INTRODUCTIOIN…………………………………………………………………………..………..13 3.1 Background to the NCD STEPS……………………………………………………….………….13 3.2 The National Context……………………………………………………………………………...14 3.2.1 Geography…………………………………………………………………………..…….…14 3.2.2 Population…………………………………………………………………………………...14 3.2.3 Economy………………………………………………………………………………….…14 3.2.4 Government…………………………………………………………………………….……14 3.2.5 Social Services and Health Status………………………………………………………..….14 3.2.6 NCDs in American Samoa………………………………………………………………..…15 3.2.7 National Health Plan and Priorities………………………………………………………….16 4. SURVEY METHODS AND OPERATIONS…………………………………………………………17
4.1 Survey Rationale and Objectives……………………………………………………………..…..17 4.2 Survey Sampling Methodology……………………………………………………………….….17
4.2.1 Sample Size………………………………………………………………………………....18 4.2.2 Survey Structure………………………………………………………………………….....19
4.3 Survey Administration……………………………………………………………………….…...19 4.4 Data Analysis……………………………………………………………………………………..20
5. RESULTS……………………………………………………………………………………………..21 5.1 Description of the Sample…………………………………………………………………………21 5.1.1 Survey sample characteristics……………………………………………………………....21
5.1.2 Level of Education……………………………………………………………………….…22 5.2 Behavioural Measures……………………………………………………………………………..22
5.2.1 Tobacco Use……………………………………………………………………………..…22 5.2.2 Alcohol Consumption………………………………………………………………………26 5.2.3 Diet………………………………………………………………………………………….29 5.2.4 Physical Activity……………………………………………………………………………32
5.3 Physical Measures…………………………………………………………………………………36 5.3.1 Obesity……………………………………………………………………………………...36 5.3.2 Blood Pressure and hypertension…………………………………………………………...39 5.4 Biochemical Measures…………………………………………………………………………….43 5.4.1 Blood Glucose and Diabetes………………………………………………………………..43 5.4.2 Blood Cholesterol……………………………………………………………………...…..49 5.5 Combined risk factors……………………………………………………………………………..51

AmericanSamoaSTEPSReport.doc
21/08/2007 Page 3 of 94
6. CONCLUSIONS…………………………………………………………………………………….…..52 7. RECOMMENDATIONS……………………………………………………………………………...54 8. APPENDIX 1 – DETAILED RESULTS……………………………………………………………...56 8.1 Demographic Information………………………………………………………………………..56 8.2 Tobacco Use……………………………………………………………………………………...56 8.3 Alcohol Consumption……………………………………………………………………………59 8.4 Diet…………………………………………………………………………………………….…61 8.5 Physical Activity………………………………………………………………………….……...64 8.6 Obesity…………………………………………………………………………………………...66 8.7 Blood Pressure And Hypertension……………………………………………………………….69 8.8 Blood Glucose And Diabetes………………………………………………………………….…71 8.9 Blood Cholesterol………………………………………………………………………………..75 8.10 Data Quality Indices……………………………………………………………………………75 9. APPENDIX 2 – QUESTIONNAIRE (ENGLISH VERSION)……………………………………….77 10. APPENDIX 3 – QUESTIONNAIRE (SAMOAN VERSION)……………………………………...84 11. APPENDIX 4 – Detailed equipment list…………………………………………………………….91 12. REFERENCES……………………………………………………………………………………....92 Lists of tables, graphs and figures
Table 3.1 Ten leading causes of mortality in American Samoa in 2001………………………………...15 Figure 4.1 Survey sampling methodology. ............................................................................................... 18 Table 4.2 List of Villages Selected........................................................................................................... 18 Figure 4.3 The WHO STEPwise approach to surveillance of NCDs. ...................................................... 19 Table 5.1 Demographic Description of Study Sample and Sampling Frame ........................................... 21 Figure 5.1 Age and gender distribution of American Samoa Population and Survey Sample................. 21 Table 5.2.1.1 Current smoking status of the study population ................................................................. 22 Figure 5.2.1.1 Percentage of current daily smokers among total smokers ............................................... 23 Figure 5.2.1.2 Mean age of starting smoking, for current daily smokers ................................................. 23 Table 5.2.1.4 Mean number of years of smoking, for current daily smokers........................................... 23 Table 5.2.1.6 Number of manufactured cigarettes smoked per day by current smokers of manufactured
cigarettes ........................................................................................................................................... 23 Table 5.2.1.7 Smoking prevalence in American Samoa........................................................................... 25 Figure 5.2.2.1 Percentage of male and female current consumers of alcohol across age groups............. 26 Figure 5.2.2.2 Percentage of current consumers of alcohol who binge drink* on at least one day in the
last week across age groups .............................................................................................................. 27 Figure 5.2.2.3 Daily frequency of binge drinking amongst current consumers of alcohol ...................... 27 Table 5.2.3.2 Servings of fruit consumed per day .................................................................................... 29 Table 5.2.3.3 Mean number of servings of fruit consumed per day ......................................................... 29 Table 5.2.3.5 Servings of vegetables consumed per day .......................................................................... 30 Table 5.2.3.6 Mean number of servings of vegetables consumed per day ............................................... 30 Table 5.2.3.7 Combined servings of fruit & vegetables consumed per day ............................................. 30

AmericanSamoaSTEPSReport.doc
21/08/2007 Page 4 of 94
Table 5.2.4.1 Percentages of the study population that are physically inactive ....................................... 33 Table 5.2.4.2 Total physical activity (hours/week) by age group............................................................. 33 Figure 5.2.4.1 Total physical activity by domain (METminutes/week) ................................................... 33 Figure 5.2.4.2 Total physical activity in the work domain amongst participants reporting physical
activity in the work domain across age groups (METminutes/week) .............................................. 34 Figure 5.2.4.3 Total physical activity in the leisure domain amongst participants reporting physical
activity in the leisure domain across age groups (METminutes/week) ............................................ 34 Table 5.2.4.7 Involvement in physical activity for less than 150 minutes per week by age group .......... 34 Table 5.3.1.1a Mean height (inches) of the study population across gender and age groups................... 36 Table 5.3.1.2a Mean weight (pounds) of the study population across gender and age groups ................ 36 Table 5.3.1.3 Mean body mass index (kg/m2) .......................................................................................... 37 Figure 5.3.1.1 Mean body mass index across gender and age groups ...................................................... 37 Table 5.3.1.4 Risk categories for body mass index (kg/m2) ..................................................................... 37 Table 5.3.1.5a Mean waist circumference (cm)........................................................................................ 38 Table 5.3.2.1 Mean resting systolic and diastolic blood pressure (mmHg).............................................. 39 Figure 5.3.2.1 Percentage of study population with a diagnosis of hypertension in the past 12 months
across gender and age group............................................................................................................. 40 Table 5.3.2.3 Percentage of the study population previously diagnosed with high blood pressure
receiving drug treatment for it .......................................................................................................... 40 Table 5.3.2.4 Prevalence of high blood pressure ...................................................................................... 41 Figure 5.3.2.2 Total prevalence* of high blood pressure across age and gender groups ......................... 41 Table 5.4.1.2 Fasting blood glucose (mg/dL) ........................................................................................... 43 Figure 5.4.1.1 Percentage o fthe study population with a previous diagnosis of diabetes across gender
and age group…………………………………………………………………………………….…44 Table 5.4.1.4 Prevalence of diabetes (110 mg/dL cut-off)……………………………………………...44 Figure 5.4.1.2 Total Prevalence of diabetes (110 mg/dL cut-off) by gender across age groups………...45 Table 5.4.1.5 Prevalence of diabetes (120 mg/dL cut-off) by gender across age groups………………..45 Table 5.4.1.6b Type of blood glucose treatment for diabetes................................................................... 46 Table 5.4.1.7 Precentage of study participants with impaired fasting blood glucose (100-110 mg/dL)...47 Figure 5.4.1.3 Percentage of study participants with impaired fasting blood glucose (100-110 mg/dL) by age group and gender………………………………………………………..47 Table 5.4.2 1 Mean total blood cholesterol levels (mg/dL)...................................................................... 49 Figure 5.4.2.2 Percentage of study population with high risk total blood cholesterol levels ................... 49 Table 5.4.2.3 Mean and average total cholesterol levels in American Samoans...................................... 50

AmericanSamoaSTEPSReport.doc
21/08/2007 Page 5 of 94
1.1 Foreword
In American Samoa, as in all other Pacific Island Countries, noncommunicable diseases (NCDs) or “lifestyle diseases” are responsible for a high proportion of death and disability. These common diseases include mainly diabetes, heart disease, stroke and cancer. Throughout the Pacific, the burden of NCDs is increasing rapidly with significant social, economic and health consequences.
If we are going to effectively address this growing problem, we must have accurate information regarding the risk factors that contribute to the development of NCDs. “Risk factors” refer to any characteristic or exposure that increases a person’s likelihood of developing a NCD, and include smoking, alcohol use, physical inactivity, obesity, high blood pressure, a raised level of blood glucose or cholesterol, and an unbalanced diet. The American Samoa NCD STEPS survey, 2004 was specifically designed to assess the prevalence of the common NCDs and risk factors in our population. The information from this survey provides an important platform for the development and implementation of strategic plans and programs to address the growing epidemic of NCDs in American Samoa. Furthermore, the implementation of this important survey in American Samoa provides a firm foundation for an ongoing surveillance for NCDs and their various risk factors. The Department of Public Health is sincerely grateful to the World Health Organization (WHO), the Fiji School of Medicine and Monash University in Australia for the technical assistance provided that helped guide the survey from inception to implementation, analysis and interpretation. We are also most appreciative of the funding from AusAID and WHO that allowed us to undertake this important activity. While available data has clearly indicated an increasing burden of NCDs in American Samoa, there has been no population-based information on the prevalence of the NCD risk factors that are common to many of the NCDs affecting our population. It is this “risk approach” to NCD surveillance and control that is one of the most notable features of the STEPwise surveillance process with a shift in emphasis from individual to community health. Implementing the American Samoa NCD STEPS survey required intensive work, long days, and persistence and dedication from the American Samoa team that undertook the survey. Indeed, it is the hard work of the STEPS team that allowed this vital activity to take place and we owe each of them our sincere appreciation. The American Samoa NCD STEPS and this report is a landmark in our efforts to address the increasing NCD epidemic affecting our people. It marks an increased commitment by the American Samoa health system to tackle the NCD challenge and will serve us well in the further development, monitoring and evaluation of effective health policies and programs appropriate to our context, and to our ongoing efforts in NCD and NCD risk factor surveillance. Indeed, it is our hope that we will now move forward in the formulation of a comprehensive and feasible NCD strategic action plan in American Samoa. Finally, I expect that this report will provide its readers with the opportunity to understand the magnitude of the NCD burden and the vital role of NCD risk factors in the epidemic. I also encourage you to participate in concrete actions to promoting healthier lifestyles within our communities as we work collectively to address the NCD challenge. MOH, American Samoa

AmericanSamoaSTEPSReport.doc
21/08/2007 Page 6 of 94
1.2 Foreword
The World Health Organisation is proud to be part of this collaborative efforts among Ministry of Health of American Samoa, Monash University in Australia, the Fiji School of Medicine and AusAID. WHO Offices in Suva, Apia, Manila and Geneva have had effective and efficient cooperation in working with American Samoa during the whole process of STEPS Survey and Report. The STEPSwise Approach is a simple, standardized method for collecting, analyzing and disseminating data for NCD risk factors in WHO member countries. The publishing of the Noncommunicable Diseases STEPSwise Approach Risk Factor (NCD STEPS) Report marks a milestone in American Samoa as it provides critical and updated data that will assist the Ministry of Health in addressing the escalating issue of NCDs. By using the standardized instruments and protocols, member states can use STEPS information not only for monitoring within country trends, but for making comparisons between and among countries as well. The approach encourages the collection of small amounts of useful data information on a regular and continuing basis adopting standard methodology and sample size to detect trends in age and sex group.
STEPS risk factors is a sequential process, starting with gathering information on key risk factors by the use of interviewer administered questionnaires (STEP 1), then moving to simple physical measurements (STEP 2), and only then recommending the collection of blood samples for biochemical assessment (STEP 3). The baseline data provided by NCD STEPS will ensure that the right emphasis is placed on the risk factors that need to be addressed in the efforts to control obesity, high blood pressure, diabetes, and physical inactivity.
The results showed that 29.9% of both genders reported smoking daily. Manufactured cigarettes were 96.3% of tobacco used, thus manufactured cigarettes were the most frequent form of tobacco use in the country, though “Tobacco: Deadly in any form or disguise”, the theme of World No Tobacco Day 2006. 62.1% of the study population consumed fewer than 5 of combined servings of fruit and vegetables per day. It indicated a physically active population (61.7%). Majority of the study population (93.5%) was overweight or obese, it was indeed too big to ignore.
WHO has newly developed “the summary of combined risk factors”. We have selected 5 common and critical risk factors for NCDs, including current daily smokers, overweight or obese (BMI≥25kg/m2), raised Blood Pressure (SBP≥140 and/or DBP≥90 mmHg or currently on medication for raised BP), less than 5 servings of fruit and vegetables per day and low level of activity (<600 MET-minutes). By this comprehensive assessment, only 0.4% of the study population in American Samoa were low risk to NCD (i.e., none of the 5 risk factors). 71.2% of the population aged 45 to 64 years old were raised risk (at least three of the risk factors included above). What should be paid more attention to was 60.9% of the population were raised risk since their ages were 25 to 44 years old only.
The importance of the results given by the STEPS survey cannot be emphasized more. These figures show that there is a need for urgent intervention measures to be put into place by the countries to counter the growing threat of NCDs.

AmericanSamoaSTEPSReport.doc
21/08/2007 Page 7 of 94
WHO is grateful to AusAID for their financial assistance, Monash University in Australia and the Fiji School of Medicine for their technical assistance, and the staff of Ministry of Health of American Samoa who travelled the length and breadth of the country to obtain this much-needed data.
WHO congratulates you all on this tremendous effort as we continue to work together to tackle the concerning issue of NCDs which is very severe in most Pacific Island Countries. World Health Organization

AmericanSamoaSTEPSReport.doc
21/08/2007 Page 8 of 94
1.3 Executive Summary The American Samoa NCD-STEPS survey was a population-based nation-wide cross-sectional assessment of key chronic diseases and their risk factors in adults aged 25 – 64 years. It was carried out from June to August 2004 using the WHO STEPS surveillance methodology and questionnaires. The main objectives were:
• To investigate the prevalence of key noncommunicable diseases (NCDs) in American Samoa.
• To determine the prevalence of the major risk factors for common NCDs in American Samoa.
Using stratified cluster sampling, data were obtained from 2072 individuals. Summary prevalence data for behavioural measures The percentage who currently smoke tobacco daily was 29.9%. Looking at a gender difference, 38.1% of American Samoan males and 21.6% of females were current daily smokers. Manufactured cigarettes were the most frequent form of tobacco used (96.3%).
The overall prevalence of current alcohol consumption in the population was 28.0% with 45.3% of males and 10.5% of females classified as current consumers of alcohol. There were 49.6% of male consumers of alcohol in the study population and 33.9% of current female consumers of alcohol had participated in binge drinking. Male binge drinkers had consumed 5 or more standard drinks on at least one day in the previous week while female binge drinkers had consumed 4 or more standard drinks on at least one day in the previous week.
The mean number of servings of fruit eaten per day was 1.9 for males and 2.0 for females. The mean number of servings of vegetables eaten per day was 2.5 for males and females. Overall, 62.1% of the study population consumed fewer than 5 of combined servings of fruit and vegetables per day. 63.0% of the male and 61.2% of the female consumed fewer than 5 of combined servings of fruit and vegetables per day, there was no significant difference between men and women on this. “Starchy vegetables” are not counted in this statistic.
Overall, 61.7% of the study population was classified to be physically inactive (57.8% of males and 65.7% of females). For both males and females the majority of physical activity was undertaken during work time. Males undertook significantly more physical activity than females. For males, the amount of physical activity undertaken decreased with increasing age, while for females it remained constant. Out of the three areas activity was reported from (work, transport and leisure), the transport area was the one in which the least physical activity was undertaken.
Summary prevalence data for physical measures
The overall proportion of overweight or obese (defined as BMI≥25kg/m2) in the survey population was 93.5% and for obesity (BMI≥30kg/m2) 74.6%. For males, 92.7% were classified overweight or obese and among them 69.3% were obese. For females, 94.4% were overweight or obese and 80.2% were classified as obese.
Mean waist circumferences for both males and females were 104.7cm and 104.8cm respectively; both of these exceed the values of 94cm (males) and 80cm (females) that are considered to infer increased risk of cardiovascular disease.

AmericanSamoaSTEPSReport.doc
21/08/2007 Page 9 of 94
The total prevalence of high blood pressure amongst males in the survey population was 20.6%. The total prevalence of high blood pressure amongst females was 12.3%. The mean systolic and diastolic blood pressure was 134.1 / 83.5 mmHg in men and 125.1 / 80.0 mmHg in women.
Summary prevalence data for biochemical measures The mean fasting blood glucose level in the study population was 120.3 mg/dL (123.0 mg/dL in males and 117.5 mg/dL in females). Overall, the total prevalence of diabetes in the study population was 47.3%. For males, the total prevalence of diabetes was 52.3% and for females the total prevalence of diabetes was 42.4%. The total prevalence includes the known, or previously diagnosed diabetics, and newly diagnosed diabetics (those with blood glucose levels greater or equal to 110 mg/dL). The mean total blood cholesterol level for the study population was 183.6 mg/dL (183.3 mg/dL in men and 183.8 mg/dL in women). Overall, 23.4% of the study population had cholesterol levels greater than 200 mg/dL or 5.2 mmol/L, which indicates a high risk of coronary artery disease. 23.1% of males and 23.7% of females were in the high risk category as determined by blood cholesterol levels >200 mg/dL or 5.2 mmol/L. Summary of combined risk factors There are 5 common and critical risk factors for NCDs were selected, including current daily smokers, overweight or obese (BMI≥25kg/m2), raised Blood Pressure (SBP≥140 and/or DBP≥90 mmHg or currently on medication for raised BP), less than 5 servings of fruit and vegetables per day and low level of activity (<600 MET-minutes). Only 0.4% of the study population were low risk to NCD (i.e., none of the 5 risk factors). 71.2% of the population aged 45 to 64 years old were raised risk (at least three of the risk factors included above). What should be paid more attention to was 60.9% of the population were raised risk (at least three of the risk factors included above) since their ages were 25 to 44 years old only. Opportunities for intervention and action The survey data indicate that both non-communicable diseases such as diabetes and hypertension as well as their risk factors are very common in American Samoa. NCDs such as diabetes, cardiovascular disease and cancer are already leading the mortality statistics of American Samoa. But the high level of risk factors observed in the survey such as obesity, elevated blood pressure and blood lipids, physical inactivity and a lack of fresh fruit and vegetable intake together with widespread consumption of tobacco and alcohol can only result in more disability and reduced quality of life if preventive measures are not succeeding. Therefore, intervention should be created at multiple levels in the American Samoan community. In particular, the American Samoan public need to be informed and educated about the major risk factors for NCDs, and should be given all possible support to prevent, reduce or eliminate individual risk factors. They should be made aware that many of the adverse health consequences of these risk factors could be reduced or eliminated by adopting a healthier lifestyle. Specific recommendations are: To inform through educational means the American Samoan public about:
• the health risks associated with smoking and of the health benefits of smoking cessation. • the adverse health effects of excessive alcohol consumption and the health benefits of decreasing
alcohol consumption, particularly targeted towards younger males and females.

AmericanSamoaSTEPSReport.doc
21/08/2007 Page 10 of 94
• the health benefits of increasing fruit and vegetable consumption and decreasing consumption of
fatty foods. • the contributions of overweight and obesity to chronic diseases such as type 2 diabetes,
cardiovascular disease, stroke and some cancers. • the health benefits of reducing and preventing overweight and obesity. • ways of achieving weight reduction through modification of diet and physical activity. • the health risks of hypertension, diabetes and cardiovascular disease and the health benefits of
preventing or controlling them. • lifestyle factors contributing to hypertension, diabetes and cardiovascular disease • the importance of appropriately monitoring and treating hypertension and diabetes, particularly
amongst older age groups. To develop, introduce and strengthen environmental, behavioural and policy strategies to decrease the prevalence of lifestyle risk factors among American Samoans, including the following:
• measures to prevent younger Samoans from taking up smoking • measures to encourage and support current smokers to quit smoking • measures to discourage younger Samoans from participating in binge drinking • measures to encourage current consumers of alcohol to decrease their level of alcohol
consumption To develop and introduce programmes that support the prevention and control of hypertension, diabetes and cardiovascular disease including the following:
• an increase in efforts to encourage healthy eating habits across all age groups by promoting the availability and consumption of greater levels of fruit and vegetables.
• instigating strategies that support and promote weight reduction. This should include increased access to healthy foods and options for physical activity. Increasing levels of physical activity during leisure and transportation could be targeted specifically.
• ensuring that the health system adequately performs monitoring and treatment of hypertension, diabetes and cardiovascular disease

AmericanSamoaSTEPSReport.doc
21/08/2007 Page 11 of 94
2. Acknowledgments and Key Contacts 2.1 Acknowledgments
This report follows the WHO standard format for reporting results from STEPS surveys.
The support of the personnel Dr Maximilian de Courten and Dr Andrea Curtis (Monash University), Dr Li Dan, Mr Raj Shalvindra (WHO Office in Suva), Ms Leanne Riley, Dr Gauden Galea and Ms Jacklynn Lippe (WHO Office in Geneva), Ms Nancy Macdonald (WHO Office in Samoa), Ms Elaine Chung (Australia) during the STEPS process is gratefully acknowledged. This study would not be possible without the leadership of the American Samoa Department of Health team, the team from the Fiji School of Medicine and the participation of the STEPS survey team, who managed and implemented all aspects of the survey activities, from participant recruitment to data collection and data entry.
We thank the American Samoa Department of Health for providing staffing, laboratory facilities and office space for the survey.
The contribution made by the people of American Samoa through their participation and support of the survey is gratefully acknowledged. We owe special thanks to the following persons: Elize Gershater (Health Project, Apia), Vizo Halavatau (FSMed), Steven Kaplan (Biostatistician, Department of Health), Fuata'i Kava (Statistical Analyst, Department of Health), La'aloi F. Lili'o (Statistician, Department of Health), Aso Maga (STEPS Project Manager, Deputy Director of Health), Shakila Naidu (FSMed), Dr Jan Pryor (FSMed), Dr Sivia Sunia (STEPS Assistant Project Manager, Assistant Director, Department of Health), Fale Uele (Health Information Systems Administrator, Department of Health), etc.
Analyses of the survey data, interpretation of the results and preparation of the report were carried out as a collaborative effort between staff from the American Samoa Department of Health, staff from the WHO offices in Suva and Apia, and the Department of Epidemiology and Preventive Medicine (DEPM), Monash University in Melbourne, Australia. In this process we gratefully acknowledge the statistical support provided by Mr Shalvindra Raj, Ms Jacklynn Lippe, Ms Leanne Riley and Ms Elaine Chung who made a substantial contribution to the timely completion of data analyses.
The finalization, reviewing and publication of this STEPS Report were greatly contributed by Dr Li Dan, Ms Leanne Riley, Dr Maximilian de Courten, Dr Chen ken (WHO Representative in the South Pacific) and Mr Shalvindra Raj
The American Samoa -STEPS survey was funded by WHO through budgetary allocations and funds received from AusAid, and the American Samoa Department of Health provided funding-in-kind, and the Fiji School of Medicine and the DEPM, Melbourne and WHO provided technical support. 2.2 WHO Contact
Dr Li Dan Medical Officer Noncommunicable Diseases WHO Office for the South Pacific PO Box 113, Suva, Fiji Tel.: (679) 3304600 Fax: (679) 3311530 Email: [email protected]

AmericanSamoaSTEPSReport.doc
21/08/2007 Page 12 of 94
2.3 American Samoa Department of Health Contact Mr. Uto’ofili Aso Maga Director Department of Health American Samoa Telephone: 684 633 2243 Email: [email protected]
2.4 Monash University Contact Dr Maximilian de Courten Associate Professor Clinical Epidemiology
Department of Epidemiology and Preventive Medicine Monash University
Melbourne, Australia Telephone: +61 3 990 30511
Email: [email protected]

AmericanSamoaSTEPSReport.doc
21/08/2007 Page 13 of 94
3. Introduction 3.1 Background to the NCD STEPS surveillance
Noncommunicable diseases (NCDs) are the major cause of death and disability globally and are of great concern to the World Health Organization (WHO) and countries alike. Recent trends indicate that NCDs are responsible for almost 60% of deaths and 43% of disease burden and predict that they will be responsible for 73% of deaths and 60% of the global burden of disease by 2020.
Recent WHO Western Pacific Regional office analyses of NCDs in the Western Pacific Region highlighted the very high mortality already noted in Pacific Islands1 and associated economic burden2. WHO is assisting countries by implementing the WHO STEPwise approach3 - a surveillance program that could help control and prevent growing NCDs. The recent meeting of the Ministers of Health in Tonga has recommended the WHO STEPwise approach for NCD surveillance4.
Surveillance is essential for guiding policy development; for effective allocation of health care resources; to improve capability of countries to respond to emerging disease trends; and to underpin the development of intervention programs and evaluating prevention programs.
The framework of STEPS is the distinction between the different levels of risk-factor assessment into: health risk behaviours; physical measurements; and blood samples. Key premises for implementing STEPS are:
• to establish a surveillance system that produces comparable, reliable, valid and timely risk factor prevalence estimates
• to utilise the modular approach leading to ‘appropriate’ STEPS according to country needs and resources, thereby focussing on essential information and ensuring enough statistical power to detect risk factor trends
• to contribute to comparable data.
The local focus for implementing STEPS is:
• to build local capacity for surveillance
• to understand ‘surveillance’ as information for public health policy
• to strengthen baseline systems with plans for continuity
• to link to existing systems where feasible.
The WHO global surveillance strategy contains provision of technical materials and tools to support the application of surveillance packages; effective communication strategies for providing data to policy and intervention programme planners, decision-makers, potential funding sources, as well as to the general public; and the use of state-of-the-art technology to share information both between and within countries.

AmericanSamoaSTEPSReport.doc
21/08/2007 Page 14 of 94
3.2 The National Context 3.2.1 Geography American Samoa is group of islands located in Oceania, in the South Pacific Ocean, about half way between Hawaii and New Zealand. Its total land area comprises 199 sq km. The climate is tropical marine, moderated by southeast trade winds with annual rainfall averages about 3 m. The rainy season is around November to April, and a dry season from May to October with little seasonal temperature variation. Its terrain comprises five volcanic islands with rugged peaks and limited coastal plains, and two coral atolls (Rose Island, Swains Island). 3.2.2 Population In 2004, American Samoa had an estimated population of 62 600, with around 40% below 15 years of age. Almost 4% were above 65 years of age. The average age was estimated at 21.3 years. About one-half of the population resides in urban areas. American Samoans are US nationals and the 2000 census listed ethnic groups as 92.9% native Pacific islander, 2.9% Asian, 1.2% white, 2.8% mixed, and 0.2% other. 3.2.3 Economy American Samoa is considered a small developing economy that depends on two main sources of income: the United States Government and tuna canning. Federal expenditures and the canning business together account for 93% of the economy. The remaining 7% results from a small tourism industry and service sector. Transfers from the United States Government add substantially to American Samoa’s economy. The United States is the main trading partner. Gross domestic product (GDP) per capita (purchasing power parity) was estimated at US$ 8000 in 20005. 3.2.4 Government The political entity of the Territory of American Samoa was defined in 1899 by a treaty between the United States of America, the United Kingdom of Great Britain and Northern Ireland, and Germany, which gave the United States of America control of American Samoa. American Samoa is a territory of the US, administered by the Office of Insular Affairs, US Department of the Interior. In 1978, the first popularly elected Samoan governor was inaugurated. There is a bicameral legislature (Fono), consisting of a senate (18 members chosen by county councils) and a house of representatives (20 members elected by popular vote, plus one non-voting member from Swains Island). There is also an independent judiciary. 3.2.5 Social Services and Health Status As of the latest census in 2000, life expectancy at birth for men is 69 years, while for women it is 76 years. Based on 2004 estimates, there are 104 males for every 100 females. The crude birth rate was 26.70 per 1000 population in 2002, and the crude death rate was 3.9 per 1000 population in 2000. The infant mortality rate is estimated at 8.50 per 1000 live births, and the under-five mortality rate at 4.90 per 1000 live births. The total fertility rate for women aged 15-49 years is 4.50, and the maternal mortality ratio was 123 per 100 000 live births in 2002. In 2000, 33% of women in the reproductive age group were using modern contraceptive methods6.

AmericanSamoaSTEPSReport.doc
21/08/2007 Page 15 of 94
There has been considerable progress in primary health care in recent years. Water supplies and sanitation systems are well organized and maintained, and 99% of the population has access to safe water. Water is increasingly supplied from deep bores, with a smaller portion from reservoirs, and is chlorinated. Although 99% of the population have adequate excreta disposal facilities, solid waste disposal is still a problem. Waste collection systems have improved significantly, but adequate space for solid waste landfill operations is limited. 3.2.6 NCDs in American Samoa The morbidity pattern has shifted significantly over the past three decades. Where infectious diseases were previously the major cause of morbidity, noncommunicable diseases related to modernization and lifestyle changes now predominate. Enumerated data on the leading causes of morbidity are currently unavailable7.
However, based on the observations of senior health officers, the following are assessed as the leading communicable diseases presently affecting the population: respiratory infectious diseases, filariasis, dengue, hepatitis, tuberculosis, leprosy and intestinal worm infestations. For noncommunicable diseases, obesity, diabetes and complications (including hypertension, heart disease and stroke), chronic disabling conditions (including asthma, gout, osteoarthritis and osteoporosis), tobacco-related obstructive pulmonary disease, cancer and oral health are the leading causes of morbidity.
The most serious health issues are related to the increase in chronic diseases associated with lifestyle, with their roots in improper nutrition and physical inactivity. Significant increases in the prevalence of obesity, in both sexes and at increasingly younger ages, are associated with a number of these conditions. Hypertension, cardiovascular diseases, cerebrovascular diseases, Type 2 diabetes mellitus and its complications, arthritis, gout and some forms of cancer are among these important chronic diseases.
The ten leading causes of mortality also show a predominance of noncommunicable diseases7 (Table 3.1)
Table 3.1 Ten leading causes of mortality in American Samoa in 2001
Cause of mortality Total number
Rate per 100 000 population
1. Heart disease 55 92.00 2. Neoplasms 36 60.00 3. Diabetes 20 33.00 4. Cerebrovascular disease 19 32.00 5. Accidents 15 25.00 6. Prenatal condition 10 17.00 7. Nephritis / nephrosis 9 15.00 8. Chronic obstructive pulmonary disease 8 13.00 9. Septicaemia 4 7.00 10. Pneumonia / influenza 4 7.00

AmericanSamoaSTEPSReport.doc
21/08/2007 Page 16 of 94
3.2.7 National Health Plan and Priorities
Recognizing the burden of chronic diseases and the imperative for prevention, the territorial health priorities listed by the Department of Health are as follows:
1. Increase the capacity of the health system to meet the health challenges of the 21st century through:
• improving health policy development mechanisms,
• developing the health workforce,
• improving management processes at all levels, and
• strengthening long-range health planning and programme planning.
2. Identify emerging and re-emerging diseases and implement effective interventions.
3. Implement effective interventions to decrease the burden of chronic diseases related to unhealthy lifestyles, especially cardiovascular disease, cancer and diabetes mellitus.
4. Actively implement the Healthy Islands concepts of health promotion, health protection and primary health care in priority settings, particularly through community health centres and school-linked programmes.
5. Increase the effectiveness of public investment in health through development of decision-oriented information systems, applied research, effective deployment of the health workforce, application of appropriate technology, and increased allocation of funding for health promotion, health protection and primary health care.

AmericanSamoaSTEPSReport.doc
21/08/2007 Page 17 of 94
4. Survey Methods and Operations 4.1 Survey rationale and objectives The overall objective of the survey was to investigate the prevalence of key NCDs and their associated risk factors, which include smoking, alcohol consumption, physical inactivity, obesity, hypertension, raised blood glucose and lipids. As of mid 2006 STEPS surveys have been conducted in over 41 countries globally, ten of which are in the Pacific. Data collected from this survey will contribute to the Global Database on NCD risk factors8.
This survey will help the government in improving the health of the people of American Samoa by:
1. Keeping track of the magnitude and trends of NCD risk factors.
2. Assisting planning and evaluation of health promotion and preventative campaigns.
3. Predicting likely future demands for health services.
4.2 Survey Sampling Methodology The American Samoa STEPS survey is a population-based nation-wide survey of adults aged 25 – 64. The survey employed a stratified cluster sampling design (stratified by cluster size i.e. large villages and small villages) to obtain a nationally representative sample of adults aged 25 – 64. Large villages were defined as those villages with a population greater than or equal to 350 in the target population (i.e. adults aged 25 – 64). Small villages were defined as those villages with a population of less than 350 in the target population. Villages with a target population of less than 50 were excluded from the survey. Tafuna, a village with a population of over 3000 was also excluded due to logistical reasons. Hence, the sampling frame consisted of 57 villages, covering 83.6 % (19,628 out of 23,479) of the total American Samoa adult population aged 25 to 64 years. Five villages were randomly selected from the two stratums (i.e. Large villages and Small villages) using probability proportional to size (PPS) to village size. For selected villages in the Small Village stratum, everyone in each selected village between the ages of 25-64 was invited to participate in the survey. For selected villages with a population size of greater than or equal to 350, households were selected using simple random sampling until a target of 254 in the target age group was reached.

AmericanSamoaSTEPSReport.doc
21/08/2007 Page 18 of 94
Figure 4.1 Survey sampling methodology.
Population < 50 or logistically infeasible villages excluded
SAMPLING FRAME
RANDOM PPS Sampling
Total population (based on 2000 Census)
73 Villages
57 Villages
Participants Age 25-64 years
10 Villages 5 large, 5 small
Every eligible person in the village or sub- sampled area
4.2.1 Sample size American Samoa adopted the STEPS guidelines, which require a minimum sample size of 2000 participants, with at least 250 participants in each of the 8 age-sex categories (25-34, 35-44, 45-54, 55-64 years for males and females). After sample selection, the total targeted sample size was 2,188. This was designed so that if 80% participation in the 5 smaller villages and 100% of the sub-samples of the larger villages were achieved, this would provide a sample of 2000.
Table 4.2 List of Villages Selected
Villages Target sample size (age 25-64)
Actual sample size (after data cleaning)
Large Villages Leone 254 305 Malaeimi 254 377 Pagopago 254 393 Malaeloa 254 269 Pavaiai 254 198 Small Villages Utulei 323 172 Olosega 76 54 Faganeanea 73 43 Fagasa 340 187 Asili 106 74 Total 2188 2072

AmericanSamoaSTEPSReport.doc
21/08/2007 Page 19 of 94
4.2.2 Survey Structure
The STEPS approach moves along a sequential three-step process (Figure 4.3).
Figure 4.3 The WHO STEPwise approach to surveillance of NCDs.
STEP 1: A simple questionnaire-based survey on selected major health risk behaviours
(smoking, alcohol consumption, physical inactivity) plus additional issues deemed to be of importance in the individual country.
STEP 2: A basic field survey including additional basic physiological measures of health
risks (blood pressure, height, weight, and waist). STEP 3: A comprehensive field survey adding analysis of blood samples (total cholesterol,
and fasting glucose).
4.3 Survey Administration The survey was conducted from June 21, 2004 through August 14, 2004 after staff training was held by Dr. Jan Pryor, Fiji School of Medicine on June 14 – 17, 2004 and a pilot survey at the village of Aua on June 18, 2004. The survey received an approval from the American Samoa IRB on June 15, 2004 after receiving an expedited review as specified in CFR 46.110. American Samoa used the same questionnaire used by Western Samoa with few changes that were translated in-house. All equipment used for measurement of weight, height, waist, and blood pressure were the same recommended by WHO, and purchased through the WHO, Apia Office. Measurement of blood glucose and blood cholesterol was performed using an Accutrend GCT (Bayer Corp). Details on all equipment used can be found in the Appendix. The results from the survey were reported to participants following completion of physical measurements and blood tests.

AmericanSamoaSTEPSReport.doc
21/08/2007 Page 20 of 94
Processing of questionnaires: At the end of each day of data collection, questionnaires were checked for completeness and accuracy. The questionnaires were then packed in a labeled envelope and given to data entry personnel. Team leaders tracked the number of completed questionnaires on a master log sheet. Double data entry using a data entry protocol was done on computers that had EpiInfo™ and Epidata™ software9 for double data entry installed. The database was saved daily in a different drive as backup so that data would not be lost. After each round of data entry, the data entry personnel indicated this accordingly on the front sheet of each questionnaire along with any indication of irregularities. 4.4 Data analysis To take into account the complex design of the American Samoa STEPS Survey, a weighting factor was applied to each participant record to adjust for varying probabilities of selection and non-representativeness in the stratum 10-year age sex groups. Data analyses were conducted using EpiInfo™ for Windows9. Weighted percentages, means and 95% confidence intervals for these percentages and means were computed.

AmericanSamoaSTEPSReport.doc
21/08/2007 Page 21 of 94
5. Results
5.1 Description of the sample The targeted sample size was 2188 from 10 villages. Data were obtained from 2076 individuals with the data being reduced to 2072 following the data cleaning process. Details of the sample characteristics are outlined in Table 5.1 and Figure 5.1 below.
5.1.1 Survey sample characteristics
Table 5.1 Demographic Description of Study Sample10 and Sampling Frame
Study Sample Sampling Frame Demographic Characteristic Number Unweighted
Proportion Weighted Proportion 95% CI Number Proportion
Gender Males 966 46.6 50.6 ±4.1 9,929 50.6 Females 1106 53.4 49.4 ±4.1 9,705 49.4
Total 2072 19,634 Age group 25-34 years 621 30.0 36.7 ±3.2 7,207 36.7 35-44 years 647 31.2 31.5 ±3.9 6,188 31.5 45-54 years 500 24.1 20.2 ±3.1 3,960 20.2 55-64 years 304 14.7 11.6 ±1.9 2,279 11.6
Total 2072 19,634 Table 5.1 describes the age and gender breakdown of the surveyed population and its relation to the overall sampling frame. Figure 5.1 shows that males were slightly over-sampled in the 45-54 and 55-64 year age groups and under sampled in the 25-34 and 35-44 year age groups. Females were slightly over-sampled in the 35-44, 45-54 and 55-64 year age groups and under sampled in the 25-34 year age group.
Figure 5.1 Age and gender distribution of American Samoa Population and Survey Sample
0.20 0.15 0.10 0.05 0.00 0.05 0.10 0.15 0.20
25-34
35-44
45-54
55-64
Proportion
Survey Sample
American Samoa population as per 2000
Females Males

AmericanSamoaSTEPSReport.doc
21/08/2007 Page 22 of 94
5.1.2 Level of Education The survey indicated that American Samoa has a well-educated population with the mean number of years spent in school as 12.1 (±0.2) (Table 5.1.2 Appendix 1). There was no statistically significant difference in the mean number of years spent in school between males (12.1 years ±0.2) and females (12.2 years ±0.2). As expected, the mean number of years spent in school was slightly reduced in the older age groups.
5.2 Behavioural measures (Detailed tables in Appendix 1 Tables 5.2.1.1 – 5.2.4.3) 5.2.1 Tobacco Use Tobacco use was assessed according to participant responses in the questionnaire. The following smoking status definitions were used: Current smokers – those who have smoked any tobacco products (such as cigarettes, cigars or rolled tobacco) in the past 12 months. These are further subdivided into: Daily smokers – those who smoked any tobacco product every day. Non-daily smokers – those who have smoke any tobacco product in the past 12 months but not every day. Result tables Table 5.2.1.1 Current smoking status of the study population
Non-Daily Smokers Daily Smokers Total Current Smokers AGE N % CI n % CI n % CI n
Males 25-34 284 10.1 5.9 31 42.1 4.1 110 52.2 6.6 141 35-44 275 13.1 6.7 31 34.5 9.0 95 47.6 11.9 126 45-54 246 10.7 3.8 23 40.9 4.7 99 51.5 4.5 122 55-64 158 8.0 4.6 14 30.3 6.7 44 38.3 8.5 58 Total 963 10.9 3.8 99 38.1 4.6 348 49.0 6.7 447
Females 25-34 336 8.4 2.9 29 24.5 4.3 74 32.9 5.5 103 35-44 371 8.5 4.5 29 19.4 3.1 66 27.9 7.4 95 45-54 253 7.6 3.1 21 23.7 5.4 58 31.2 7.9 79 55-64 142 6.9 10.1 9 14.2 4.7 19 21.2 13.2 28 Total 1102 8.1 3.1 88 21.6 3.3 217 29.7 6.1 305

AmericanSamoaSTEPSReport.doc
21/08/2007 Page 23 of 94
Figure 5.2.1.1 Percentage of current daily smokers among total smokers
0
20
40
60
80
100
25-34 35-44 45-54 55-64
Age Group (years)
% o
f cur
rent
sm
oker
s in
the
stud
y po
pula
tion
who
are
da
ily s
mok
ers
MalesFemales
Figure 5.2.1.2 Mean age of starting smoking, for current daily smokers
0
5
10
15
20
25
30
25-34 35-44 45-54 55-64
Age Group (years)
Age
sta
rted
sm
okin
g (y
ears
)
malesfemales
Table 5.2.1.4 Mean number of years of smoking, for current daily smokers
Males Females Age Mean CI N Mean CI N
25-34 10.6 0.8 105 10.6 1.4 7235-44 19.4 1.0 94 17.0 2.4 6545-54 27.9 1.3 98 24.0 2.5 5755-64 39.0 3.6 43 36.2 5.2 19Total 19.9 1.1 340 17.4 2.0 213
Table 5.2.1.6 Number of manufactured cigarettes smoked per day by current smokers of manufactured cigarettes
Males Females Age Mean CI N Mean CI N
25-34 12.3 260.1 109 12.6 147.2 7135-44 16.0 173.9 90 12.2 157.7 6245-54 16.0 188.2 97 13.2 343.9 5755-64 12.8 332.9 39 9.5 216.0 19Total 14.2 176.6 335 12.4 92.5 209
AmericanSamoaSTEPSReport.doc
21/08/2007 Page 24 of 94
Result description The survey indicated that 29.9% of the study population were current daily users of tobacco. 60.6% do not smoke (Table 5.2.1.1, Appendix 1). A gender difference was observed, with 49.0% and 29.7% of males and females respectively, being current smokers (Table 5.2.1.1). There was also a higher proportion of male daily smokers 38.1% (±4.6) than female daily smokers 21.6% ±3.3). Figure 5.2.1.1 shows the percentage of current smokers who are daily smokers. There was no significant difference across age groups or gender, with 76.8% (±7.0) of male and 72.7% (±7.5) of female smokers being daily smokers (Table 5.2.1.2, Appendix 1). For all current daily smokers, the mean age of starting smoking was 20.6 (± 0.6) years (Table 5.2.1.3, Appendix 1). Male current daily smokers began smoking at a mean age of 20.1 (± 0.9) years, while females current daily smokers began smoking at a mean age of 21.3 (± 1.3) years (Table 5.2.1.3, Appendix 1). There was no significant difference in the mean age of starting smoking for current male smokers across age groups (Figure 5.2.1.2). Current female smokers in the youngest age group started smoking at a significantly lower mean age than current female smokers in the three older age groups (Figure 5.2.1.2). The mean number of years of smoking for the total study population was 19.0 (± 1.1) years (Table 5.2.1.4, Appendix 1). Male current daily smokers had been smoking for a mean of 19.9 (± 1.6) years, while female current daily smokers had been smoking for a mean of 17.4 (± 1.1) years (Table 5.2.1.4). All current male smokers smoked manufactured cigarettes (Table 5.2.1.5, Appendix 1). A small proportion of male smokers also smoked hand rolled cigarettes (3.8% ±16.5), and cigars, cheroots or cigarillos (3.7% ±20.9). All of the surveyed current daily female smokers smoked manufactured cigarettes only. For daily smokers of manufactured cigarettes the mean number of cigarettes smoked per day was 13.5 (± 1.1) (Table 5.2.1.6, Appendix 1; Male smokers 14.2/day (± 1.2), Female smokers 12.4/day (± 1.3). There was no significant difference in the number of cigarettes smoked per day between the genders at each age group level.

AmericanSamoaSTEPSReport.doc
21/08/2007 Page 25 of 94
Comparison with previous data
Table 5.2.1.7 Smoking prevalence in American Samoa
Publication Survey year Gender Age groups (years)
Current Smoking Prevalence
Males ≥ 20 41% 1985 (Household survey of smoking) Females ≥ 20 16.2%
Males ≥ 15 41%
Dwyer et.al. (1999)11
1994 (Tobacco or Health in the Western Pacific Region, 1997) Females ≥ 15 16%
Males 29-43 43% Males 44-60 51% Females 29-43 36%
McGarvey (2001)12
1994
Females 44-60 19% Mishra et.al. (2005)13
Males & Females
28%
Table 5.2.1.7 lists previous surveys of current smoking prevalence for American Samoa. In general prevalence of smoking amongst females has been lower than that amongst males. Comparisons with the results of the present survey are limited since most of the other surveys do not specify if the current or current daily smoking prevalence was measured. In the present survey 39.4% of the survey population were current smokers. The prevalence of daily smoking for males ≥ 25 years was 38.1% and the prevalence of daily smoking for females ≥ 25 years was 21.6%. This indicates that smoking prevalence for males has remained relatively stable over almost two decades. For females the prevalence of smoking has probably undergone a slight increase over the same period.

AmericanSamoaSTEPSReport.doc
21/08/2007 Page 26 of 94
5.2.2 Alcohol Consumption Prevalence of alcohol consumption was assessed by asking study participants questions on alcohol consumption. The consumption behaviour of binge drinking was specifically assessed due to its cardiovascular and associated risks. The definitions used were as follows:
• Ever drinkers – those who have ever consumed a drink that contains alcohol
• Current drinkers – those who have consumed a drink containing alcohol in the past 12 months
• Binge drinkers – (for males) those who have consumed 5 or more drinks per day on at least one day in the past week. For females – those who have consumed 4 or more drinks per day on at least one day in the past week.
Result tables Figure 5.2.2.1 Percentage of male and female current consumers of alcohol across age groups
0
10
20
30
40
50
60
70
80
90
100
25-34 35-44 45-54 55-64
Age Group (years)
% o
f the
stu
dy p
opul
atio
n w
ho a
re
curr
ent c
onsu
mer
s of
alc
ohol
MaleFemale

AmericanSamoaSTEPSReport.doc
21/08/2007 Page 27 of 94
Figure 5.2.2.2 Percentage of current consumers of alcohol who
binge drink* on at least one day in the last week across age groups
-100
102030405060708090
25-34 35-44 45-54 55-64
Age group (years)
% o
f cur
rent
con
sum
ers
of
alco
hol w
ho b
inge
drin
k on
at
leas
t one
day
in th
e la
st
wee
k Male
Female
*5 or more standard drinks per drinking day for males and 4 or more standard drinks per drinking day for females
Figure 5.2.2.3 Daily frequency of binge drinking amongst current consumers of alcohol
-10
-5
05
10
15
20
25
3035
40
45
Mon
Tues
Wed
Thur
s
Fri
Sat
Sun
% o
f cur
rent
con
sum
ers
of a
lcoh
ol w
ho
bing
e dr
ink
MaleFemale
Result description The survey results indicate that 57% of the study population had never consumed alcohol and 43% (±7.8) had consumed alcohol at some time (Table 5.2.2.1 Appendix 1). A significant gender difference was observed, with 61.4% (±6.5) of males having consumed alcohol at some time compared with 24.3% (±9.2) of females. This gender difference persisted across all age groups. 38.6% of males and 75.7% of females in the study population had never consumed alcohol. There was also a slight decrease with age in the percentage of “ever” consumers of alcohol. This was observed for both genders but was more pronounced for females, where 26.8% of 25-34 years olds had consumed alcohol compared with 15.7% of 55-64 years olds. In the previous 12 months 28.0% (±4.2) of the study population had consumed alcohol (Table 5.2.2.2 Appendix 1). There was a significant gender difference with 45.3% (±5.9) of males and 10.5 % (±3.6) of

AmericanSamoaSTEPSReport.doc
21/08/2007 Page 28 of 94
females having consumed alcohol in the previous 12 months. This gender difference persisted across age groups (Figure 5.2.2.1). The only statistically significant age difference was between the 25-34 and 55-64 age groups for both males and females, with a smaller proportion of those in the oldest age group having consumed alcohol in the previous 12 months. Figure 5.2.2.2 (and Table 5.2.2.3 Appendix 1) shows the percentage of current consumers of alcohol who participated in binge drinking on at least one day in the previous week. For females binge drinking was defined as having 4 or more standard drinks on at least one day in the previous week. For males binge drinking was defined as having 5 or more standard drinks on at least one day in the previous week. A higher proportion of males (49.6% (±6.4)) being binge drinkers compared to females (33.9% (±11.5)). The gender difference was significant and persisted across all age groups, except for the 25-34 year age group. There was a higher proportion of binge drinkers in the younger age groups for both males and females (Figure 5.2.2.2.) The daily pattern of binge drinking for current consumers of alcohol is shown in Table 5.2.2.4 (Appendix 1). Overall Saturday was the day on which the greatest percentage (28.0% ±7.7) of current consumers of alcohol participated in binge drinking. Binge drinking was most common amongst the 25-34 year age group. In general there was a trend for participation in binge drinking to decline with increasing age, and this was observed for both males and females. Figures 5.2.2.3 show participation in binge drinking by males and females, across each day of the week. Comparison with previous data There are no previous survey data available on the prevalence of alcohol consumption in American Samoa. However the WHO Global Status Report on Alcohol (2004) 14 states that the Western Pacific Region is on of the two WHO regions showing “recent and continuing increases in alcohol consumption”.

AmericanSamoaSTEPSReport.doc
21/08/2007 Page 29 of 94
5.2.3 Diet To assess the eating pattern of the surveyed population related to cardiovascular disease risk, the study participants were asked how often they ate fruit and vegetables and the number of servings of each that they ate each day. Study participants were shown a card with illustrations of fruit and vegetables to assist them in answering these questions. For the purposes of the survey, fruit included paw-paw, orange, guava, pineapple, passion fruit, apple, jackfruit, mango, banana, lemon, lime, pear, etc. Coconut and coconut juices were not included. A single serving of fruit was defined as follows:
• ½ cup of chopped, cooked or canned fruit • 1 medium whole fruit (e.g. orange, apple, banana, pear) • ¾ cup (180ml) of 100% fruit juice
Vegetables included the following:
• Dark green leaves: green leafy vegetables (e.g. lettuce, pinapi), rukau, rukau viti, pumpkin leaves, kumara leaves, spinach, etc.
• Yellow/red/orange vegetables: corn, carrot, tomatoes, pumpkin • Other vegetables: cabbage, green beans, cucumber, beets, eggplant, broccoli, cauliflower, onion,
capsicum, chilli A single serving of vegetable was defined as follows:
• 1 cup of raw leafy vegetables • ½ cup of cooked or chopped raw vegetables
Result tables
Table 5.2.3.2 Servings of fruit consumed per day
Total population < 1 serving per
day* 1 serving per day 2-4 servings per day
5 or more servings per day N
% CI n % CI n % CI n % CI n 2052 77.0 2.7 1574 11.4 1.7 251 10.7 2.9 209 0.8 0.5 18
Male 957 80.8 3.6 780 8.2 1.8 78 10.2 3.8 93 0.8 0.9 6
Females 1095 73.2 3.2 794 14.8 2.6 173 11.2 2.1 116 0.8 0.8 12
* Includes “Don’t eat fruit at all”
Table 5.2.3.3 Mean number of servings of fruit consumed per day
Males Females Age Mean CI N Mean CI N
25-34 2.0 0.2 203 2.1 0.2 264 35-44 2.0 0.2 216 1.9 0.2 329 45-54 1.8 0.2 175 2.0 0.2 220 55-64 1.8 0.3 131 1.9 0.7 126 Total 1.9 0.2 725 2.0 0.1 939

AmericanSamoaSTEPSReport.doc
21/08/2007 Page 30 of 94
Table 5.2.3.5 Servings of vegetables consumed per day
Total population < 1 serving per day* 1 serving per day 2-4 servings per day 5 or more servings
per day N % CI n % CI n % CI n % CI n
2031 50.4 8.7 990 21.2 3.6 438 25.6 5.6 548 2.8 1.8 55 Males
949 54.4 8.6 506 18.3 4.0 185 24.4 7.8 233 2.8 1.6 25 Females
1082 46.3 10.0 484 24.2 6.3 253 26.8 5.4 315 2.7 2.3 30 *Includes “Don’t eat vegetables at all”
Table 5.2.3.6 Mean number of servings of vegetables consumed per day
Males Females Age Mean CI N Mean CI N
25-34 2.5 0.3 245 2.5 0.3 306 35-44 2.5 0.3 253 2.6 0.4 355 45-54 2.7 0.4 232 2.6 0.4 245 55-64 2.4 0.7 152 2.5 0.6 137 Total 2.5 0.3 882 2.5 0.4 1043
Table 5.2.3.7 Combined servings of
fruit & vegetables consumed per day
Total population <5 servings N % CI n
2068 62.1 3.3 994 Male
<5 servings % CI n
964 63.0 5.0 441 Female
<5 servings % CI n 1104 61.2 3.7 553
Result description The survey indicated that fruit and vegetable consumption by the majority of the study population in American Samoa was lower than the WHO recommended intake of 400g per day (equivalent of 5x 80g servings per day)15. Fruit was consumed only on an average of 2.4 days per week (± 0.1) and there was significant difference in the number of days per week that males (2.1 ± 0.2) and females (2.6 ± 0.2) consumed fruit (Table 5.2.3.1 Appendix 1).

AmericanSamoaSTEPSReport.doc
21/08/2007 Page 31 of 94
Among the total study population, 77.0% (± 2.7) of people consumed less than 1 serving of fruit per day, while only 0.8.6% (± 0.5) consumed 5 or more servings per day (Table 5.2.3.2). There was a significant difference between the percentage of males and females who consumed <1 serving of fruit per day, which was due to a difference between the genders in the 45-54 year age group. In this age group 83.6% (±5.4) of males and 66.5% (±6.1) of females consumed less than 1 serving of fruit per day. Amongst other age groups there were no significant differences between genders. Overall the mean number of servings of fruit consumed per day was 2.0 (±0.1) (Table 5.2.3.3, Appendix 1). There was no significant gender difference, with males consuming a mean of 1.9 (±0.2) servings of fruit per day and females consuming a mean of 2.0 (±0.1) servings of fruit per day (Table 5.2.3.3). There was no significant difference by age. Vegetables were consumed on an average of 4.2days per day (± 0.4) and there was no significant difference in the number of days per day that males (3.7 ± 0.3) and females (4.2 ± 0.4) consumed vegetables (Table 5.2.3.4 Appendix 1). Again, there was no significant difference across age groups. Among the total study population, 50.4% (± 8.7) of people consumed less than 1 serving of vegetables per day, while 2.8% (± 1.8) consumed more than 5 servings per day (Table 5.2.3.5). The results were not significantly different for males and females. There were no significant differences across age groups for either gender. Overall the mean number of servings of vegetables consumed per day was 2.5 (±0.2) (Table 5.2.3.6, Appendix). There was no significant gender difference, with males consuming a mean of 2.5 (±0.2) servings of vegetables per day and females consuming a mean of 2.5 (±0.2) servings of vegetables per day (Table 5.2.3.6). There was no significant difference by age. In summary, Table 5.2.3.7 shows that 62.1% (± 3.0) of the total study population consumed less than 5 servings of fruit and vegetables in combination per day. There was no gender difference with 63.0 % (± 4.0) of males and 61.2 % (± 3.3) of females consuming less than 5 servings of fruit and vegetables per day. There was also no difference observed across age groups. Overall, in this survey population, the level of consumption of vegetables was higher than that for fruit. Comparison with previous data There are no previous data available on specific levels of fruit and vegetable consumption in American Samoa. However, the traditional diet of Samoans (both American and Western Samoans) based mostly on taro, yams, coconut, bananas and breadfruit has moved to one in which imported and purchased foods including white rice, flour and sugar are more prominent16 17. A similar situation, where traditional foods and local diets have been progressively replaced with Spanish, Japanese and American influenced and imported foods, has occurred in Micronesia and is comprehensively reviewed in Cassels 2006 18.

AmericanSamoaSTEPSReport.doc
21/08/2007 Page 32 of 94
5.2.4 Physical Activity Physical activity participation was measured by asking survey participants to report on the amount of time they spend doing different types of physical activity in their employment, transport and leisure time. Study participants were shown a card with illustrations of various types of physical activity to assist them in answering these questions. For the purposes of the survey, moderate activity was defined as more than 10 minutes at a time of any of the following:
• painting • gardening • cleaning • plastering • swimming • climbing stairs • cycling • farming
Vigorous physical activity was defined as more than 10 minutes at a time of any of the following:
• heavy construction • carrying heavy loads • digging • running • strenuous sport • sawing wood • shovelling
For the purposes of this report physical activity was converted to METminutes. The term MET is an abbreviation for metabolic equivalent and is used to reflect the intensity of the specific physical activity. A MET is defined as the ratio of the associated metabolic rate for a specific activity divided by the resting metabolic rate. The resting metabolic rate is approximately 1 MET and reflects the energy cost of sitting quietly. The MET values for the three PA domains are as follows:
• Moderate PA (work and leisure domain) = 4.0.0 METS • Vigorous PA (work and leisure domain) = 8.0 METS • Transport related walking/cycling = 3.0 METS
In terms of METminutes the following levels of activity were defined:
• Inactive - <600 METminutes • Moderately active - 600-1500 METminutes • Vigorously active - >1500 METminutes

AmericanSamoaSTEPSReport.doc
21/08/2007 Page 33 of 94
Result tables
Table 5.2.4.1 Percentages of the study population that are physically inactive
Males Females Inactive Inactive AGE
N % CI n N
% CI n 25-34 284 36.8 ±12.5 105 335 49.0 ±13.1 16035-44 276 44.9 ±14.0 113 368 40.6 ±7.4 14345-54 245 39.5 ±16.2 92 253 37.1 ±8.4 9255-64 159 46.7 ±12.9 68 145 50.4 ±9.9 68Total 964 41.1 ±10.6 378 1101 44.1 ±9.1 463
Table 5.2.4.2 Total physical activity (hours/week) by age group
Males Females Age Mean CI N Mean CI N
25-34 30.4 ±8.3 160 12.0 ±4.1 14435-44 24.1 ±6.5 141 13.1 ±4.3 18745-54 22.9 ±6.5 129 13.2 ±6.3 13155-64 17.5 ±9.6 74 11.3 ±3.2 66Total 25.7 ±3.5 504 12.6 ±3.4 528
Figure 5.2.4.1 Total physical activity by domain (METminutes/week)
0
2000
4000
6000
8000
10000
12000
14000
16000
Work Transport Leisure
tota
l phy
sica
l act
ivity
by
dom
ain
(met
min
utes
/wee
k)
MaleFemaleTotal

AmericanSamoaSTEPSReport.doc
21/08/2007 Page 34 of 94
Figure 5.2.4.2 Total physical activity in the work domain amongst participants reporting physical activity in the work domain across age groups (METminutes/week)
0
5000
10000
15000
20000
25-34 35-44 45-54 55-64
Age Group (years)
Tota
l phy
sica
l act
ivity
in th
e w
ork
dom
ain
(met
min
utes
/wee
k)
Total populationMaleFemale
Figure 5.2.4.3 Total physical activity in the leisure domain amongst participants reporting physical activity in the leisure domain across age groups (METminutes/week)
0
2000
4000
6000
8000
10000
12000
14000
25-34 35-44 45-54 55-64
Age Group (years)
Tota
l phy
sica
l act
ivity
in th
e le
isur
e do
mai
n (m
etm
inut
es/w
eek)
Total populationMaleFemale
Table 5.2.4.7 Involvement in physical activity for less than 150 minutes per week by age group
Males Females Yes Yes AGE
N % CI n N
% CI n 25-34 285 7.4 ±3.7 21 336 10.5 ±4.4 3135-44 276 6.9 ±5.0 19 371 10.3 ±4.3 3945-54 246 7.4 ±3.2 20 254 10.5 ±4.4 2355-64 159 6.4 ±5.9 12 145 13.1 ±4.8 20Total 966 7.2 ±2.5 72 1106 10.7 ±1.8 113

AmericanSamoaSTEPSReport.doc
21/08/2007 Page 35 of 94
Result description The survey results indicated that 61.7% (±6.3) of the study population was low level of physical activity in their work, transport or leisure time (Table 5.2.4.1). There was no significant difference between males and females with 57.8% (±6.9) and 65.7% (±5.9) of females being physically inactive. There was also no evident difference in the proportions of physically inactive participants across age groups. For study participants who reported engaging in physical activity during their work, transport or leisure time, Table 5.2.4.2 shows total activity in hours per week. There was a significant gender difference with males engaged in physical activity for a mean of 25.7 (±3.5) hours per week and females for a mean of 12.6 (±3.4) minutes per week. There was a significant difference between the youngest and oldest male age groups, with those in the youngest age group engaged in more physical activity than the older group. There was no difference in activity levels across age groups for females. Figure 5.2.4.1 (and Table 5.2.4.3 Appendix) shows the total physical activity (metminutes/week) by domains of activity (work, transport and leisure) for study participants who reported engaging in physical activity. The results indicate that both male and females undertake the majority of their physical activity during work time. Male undertake a significantly greater amount of physical activity during their work time than females. Figure 5.2.4.2 shows the total amount of physical activity undertaken in the work domain across age groups. The results show that total physical activity undertaken at work by male declines with age. There was no significant difference in the level of work-related physical activity across age groups for females. The activity domain accounting for the least amount of physical activity was the transport domain, and there was no difference between male and females for this domain (Figure 5.2.4.1). The amount of physical activity undertaken during leisure time was smaller than that during work time for both male and females (Figure 5.2.4.1). Male participated in more physical activity during leisure time than females; however the difference was not significant. There was also no significant difference in the amount of work undertaken during leisure time across age groups for both males and females (Figure 5.2.4.3). It is notable that although the greatest amount of physical activity was undertaken in the work domain, the domain in which the greatest numbers of participants were physically active was the transport domain (Table 5.2.4.3 Appendix). Table 5.2.4.7 shows that there is no significant difference in the proportion of the population involved in less than 150 minutes per week across age groups or gender. Comparison with previous data There are no previously reported data on levels of physical activity in American Samoans. However it is repeatedly asserted that declining levels of physical activity across the Pacific region result from increasing economic and lifestyle modernisation. Studies carried out in Western Samoa found that lower male BMI (but not females) was associated with increased physical activity19. More recently Keighley et. al. (2006)20 described an association between participation in farm work and significantly lower BMI in older American Samoan females and American Samoan males of all ages.

AmericanSamoaSTEPSReport.doc
21/08/2007 Page 36 of 94
5.3 Physical measures (Detailed tables in Appendix 1 Table 9.8.1 – 9.8.7)
5.3.1 Obesity Height and weight Height and weight was measured for each participant as described in the Survey Operational Manual21.
Waist circumference The waist circumference was measured for each participant (excluding pregnant females). Results for height, weight and waist circumference are presented in the text using U.S. customary units (inches and pounds). In the Appendix results tables both U.S. customary units and SI (metric) measurements are presented. Body Mass Index (BMI) and risk factor categories Body mass index* (BMI) was calculated for each participant as the weight in kilograms over the height in metres2. Risk categories for BMI were defined as follows: Underweight BMI <18.5 Normal BMI 18.5 to 25.0 Overweight BMI ≥25.0 and < 30.0 Obese BMI ≥30.0 *BMI can also be calculated by the following formula with U.S. customary units: BMI = 703x [weight (inches)/height (inches) x height (inches)]
Results Tables **MEAN HEIGHT AND WEIGHT STILL TO BE RECEIVED FROM LEANNE**
Table 5.3.1.1a Mean height (inches) of the study population across gender and age groups
Total population Males Females Age Mean CI N Mean CI N Mean CI N
25-34 68.2 ±0.4 621 70.1 ±0.6 285 66.3 ±0.5 33635-44 67.6 ±0.4 645 69.9 ±0.4 275 65.4 ±0.2 37045-54 67.0 ±0.4 500 69.1 ±0.4 246 64.8 ±0.5 25455-64 66.3 ±0.2 303 68.0 ±0.4 158 64.3 ±0.4 145Total 67.5 ±0.2 2069 69.6 ±0.3 964 65.5 ±0.3 1105
Table 5.3.1.2a Mean weight (pounds) of the study population across gender and age groups
Males Females* Age Mean CI N Mean CI N
25-34 222.8 ±9.4 285 221.5 ±9.1 28535-44 233.8 ±9.6 275 218.1 ±4.1 34445-54 224.7 ±7.7 246 211.9 ±9.6 23955-64 208.9 ±6.0 159 208.1 ±10.4 137Total 224.8 ±4.4 965 216.8 ±3.8 1005
*Missing = 65; pregnant = 35 Pregnant females excluded

AmericanSamoaSTEPSReport.doc
21/08/2007 Page 37 of 94
Table 5.3.1.3 Mean body mass index (kg/m2)
Males Females* Age group Mean CI N Mea
n CI N
25-34 33.2 1.3 271 36.1 0.8 29735-44 34.2 0.7 273 36.7 1.1 35745-54 34.1 0.7 246 35.7 1.6 25255-64 32.9 1.3 155 36.0 1.4 144Total 33.7 0.5 945 36.2 0.3 1050
*Missing = 65; pregnant = 35 Pregnant females excluded
Figure 5.3.1.1 Mean body mass index across gender and age groups
05
1015202530354045
25-34 35-44 45-54 55-64
Age Group (years)
Mea
n bo
dy m
ass
inde
x (k
g/m
2 )
MenWomen
Table 5.3.1.4 Risk categories for body mass index (kg/m2)
Total Population* Overweight (25.0-30.0)
Obese (≥30.0) Age N
% CI n % CI n 25-34 570 22.9 4.1 121 69.7 3.7 40235-44 619 14.9 2.2 91 79.4 2.7 50445-54 485 16.6 6.5 80 77.7 4.3 39355-64 295 22.2 4.6 59 71.0 5.1 221Total 1969 18.9 1.5 351 74.6 1.1 1520
Males 25-34 285 28.8 6.4 78 63.0 6.0 16635-44 275 19.0 4.6 51 74.0 5.0 20445-54 246 18.4 5.6 45 76.1 4.3 18955-64 158 27.5 8.6 37 63.8 7.8 105Total 964 23.5 2.0 211 69.3 2.1 664
Females* 25-34 285 16.3 6.6 43 77.0 4.8 23635-44 344 11.0 2.9 40 84.5 3.4 30045-54 239 14.6 8.1 35 79.4 5.2 20455-64 137 15.9 6.0 22 79.3 5.8 116Total 1005 14.2 3.3 140 80.2 2.0 856
* Pregnant females excluded

AmericanSamoaSTEPSReport.doc
21/08/2007 Page 38 of 94
Table 5.3.1.5a Mean waist circumference (CM)
Total population* Males Females* Age Mean CI N Mean CI N Mean CI N
25-34 103.4 1.4 566 102.7 3.9 264 104.1 3.4 30235-44 105.0 1.8 633 105.5 2.7 270 104.4 1.6 36345-54 105.5 3.7 493 106.3 2.3 240 104.7 5.5 25355-64 107.1 1.3 296 105.7 1.3 151 108.7 3.8 145Total 104.8 1.4 1988 104.7 1.0 925 104.8 3.0 1063
* Pregnant females excluded
Results Description The mean height of the study population was 67.5 (±0.2) inches and the mean weight was 221.1 (± 1.4) lbs (Tables 5.3.1.1a and 5.3.1.2a). For males the mean height was 69.6 (±0.3) inches and the mean weight was 224.8 (±4.4) lbs. For females the mean height was 65.5 (±0.3) inches and the mean weight was 216.8 (±3.8) lbs (Tables 5.3.1.1a and 5.3.1.2a). The mean BMI for the study population was 34.9 (±0.2) kg/m2 (Table 5.3.1.3). Table 5.3.1.3 and Figure 5.3.1.1 show the mean BMI by gender and age group. A significant gender difference was observed with the mean BMI for males being 33.7 (±0.5) kg/m2 and for females being 36.2 (±0.3) kg/m2. The gender difference was significant for all age groups except the 45-54 year group. Table 5.3.1.4 (Appendix 1) shows the proportion of the study population in each BMI risk category by gender and age. Table 5.3.1.4 shows the same information across age groups for the “overweight” and “obese” BMI categories. The percentage of the total study population that was obese (BMI ≥ 30 kg/m2) was 74.6% (±1.5). 69.3% (±2.0) and 80.2% (±3.3) of males and females respectively were obese. In combination, 92.7% and 94.4% of males and females respectively were overweight or obese. There was no significant gender difference in waist measurement, with the mean waist circumference of males being 104.7 (±0.6) CM and that of females being 104.8 (±0.7) CM (Table 5.3.1.5). For males there was a small increase in waist circumference observed with increasing age; however the only significant difference was between the 25-34 and 55-64 year age groups. Mean waist circumferences for both genders were above the values of 102 cm (approx. 40 inches) for males and 88cm (approx. 35 inches) for females that are considered to infer high risk of cardiovascular disease22.
Comparison with previous data Previous survey data regarding the prevalence of overweight and obesity in American Samoa has been reviewed by Coyne (2000)23. Recent prevalence data on obesity in American Samoans has been cited by Keighley et al (2006)24. For males living in American Samoa the prevalence of obesity was estimated to rise from 32.2% in 1976 to 63.1% in 2002. For females living in American Samoa, the prevalence of obesity in 1976 was 58.0% and 75% in 2002. In an earlier study using different BMI cut-offs (overweight BMI ≥27.8 for males, overweight BMI ≥27.3 for females) McGarvey etal (1993)25 found that prevalence of overweight in1990 was 83.6% for males and 87.6% for females. This is a significant increase over the prevalence of overweight for males in 1976. While the prevalence of overweight in the female population did not rise over this period, it was speculated that this was because females already had a higher prevalence of overweight in 1976. The current (2004) WHO NCD-surveillance data indicate that the prevalence of

AmericanSamoaSTEPSReport.doc
21/08/2007 Page 39 of 94
obesity continues to rise, with 69.3% of males and 80.2% of females in the study population having a BMI of ≥ 30 kg/m2. 5.3.2 Blood Pressure and hypertension Diastolic and systolic blood pressure measurements were taken for all study participants using an Omron digital automatic blood pressure monitor (DABPM). Two readings were taken for each participant. If the difference between the first and second readings was 10mm Hg or more, then a third reading was taken. Study participants were also asked about aspects of their medical history relating to high blood pressure. A diagnosis of high blood pressure was recorded if, during the past 12 months, a doctor or health worker had told the participant that they had elevated blood pressure or hypertension. Those participants with a diagnosis of hypertension or elevated blood pressure were asked if they had taken any blood pressure drugs during the past two weeks that were prescribed by a doctor or health worker. For the purposes of this report, high blood pressure is defined as:
• Systolic blood pressure greater than or equal to 140 mmHG and/or • Diastolic blood pressure greater than or equal to 90 mmHG and/or • Receiving treatment for high blood pressure.
Results Tables
Table 5.3.2.1 Mean resting systolic and diastolic blood pressure (mmHg)
Age Systolic Blood Pressure Diastolic Blood Pressure Mean CI N Mean CI N
Males 25-34 131.4 3.3 270 80.9 2.9 27035-44 133.2 1.7 264 84.7 1.6 26445-54 136.0 1.8 214 85.4 1.6 21455-64 142.9 4.2 124 86.3 3.0 124Total 134.1 2.1 872 83.5 1.9 872
Females 25-34 119.0 1.1 328 76.8 1.2 32735-44 123.5 2.0 359 80.1 1.1 35945-54 132.3 1.2 221 84.5 2.0 22155-64 141.5 3.9 116 83.3 2.0 116Total 125.1 1.0 1024 80.0 0.9 1023

AmericanSamoaSTEPSReport.doc
21/08/2007 Page 40 of 94
Figure 5.3.2.1 Percentage of study population with a diagnosis of hypertension in the past 12 months across gender and age group
0
5
10
15
20
25
30
35
40
45
25-34 35-44 45-54 55-64
Age group (years)
% o
f stu
dy p
opul
atio
n w
ith a
co
nfir
med
or n
ew d
iagn
osis
of
hype
rtens
ion
in th
e pa
st 1
2 m
onth
s
malefemale
Table 5.3.2.3 Percentage of the study population previously diagnosed with high blood pressure receiving drug treatment for it
Males Females Yes Yes Age N % CI n N % CI n
25-34 7 27.9 ±29.8 2 13 14.3 ±22.3 235-44 28 40.8 ±25.4 11 26 43.1 ±30.8 1145-54 42 74.3 ±22.9 32 50 59.0 ±15.7 3355-64 47 77.4 ±14.6 34 35 79.5 ±16.2 29Total 124 62.0 ±11.4 79 124 55.8 ±11.1 75

AmericanSamoaSTEPSReport.doc
21/08/2007 Page 41 of 94
Table 5.3.2.4 Prevalence of high blood pressure
Total population
Previously Diagnosed With Hypertension and on Medication
All Individuals NOT Diagnosed Previously but with BP >= 140/90*
Total Prevalence of High Blood Pressure Age N
% CI N % CI n % CI n 25-34 621 0.5 ±0.5 4 20.9 ±5.7 123 21.4 ±5.5 127 35-44 647 3.9 ±2.4 22 33.5 ±5.7 199 37.4 ±7.4 221 45-54 500 12.4 ±3.3 65 33.3 ±5.4 167 45.7 ±5.2 232 55-64 304 22.4 ±5.9 63 36.4 ±8.6 122 58.8 ±5.5 185 Total 2072 6.5 ±1.0 154 29.2 ±4.0 611 35.7 ±3.8 765
Males 25-34 285 0.6 ±1.0 2 30.6 ±11.2 83 31.3 ±11.0 85 35-44 276 4.6 ±3.4 11 42.3 ±8.1 109 46.9 ±10.0 120 45-54 246 12.6 ±5.1 32 32.8 ±8.7 86 45.4 ±8.3 118 55-64 159 24.0 ±8.5 34 34.0 ±12.5 63 58.0 ±7.5 97 Total 966 7.2 ±1.7 79 35.1 ±6.3 341 42.3 ±6.0 420
Females 25-34 336 0.5 ±0.7 2 11.0 ±4.2 40 11.5 ±4.3 42 35-44 371 3.2 ±2.6 11 24.8 ±4.7 90 28.1 ±6.4 101 45-54 254 12.2 ±5.0 33 33.8 ±8.2 81 46.0 ±6.5 114 55-64 145 20.5 ±7.5 29 39.2 ±6.9 59 59.7 ±9.0 88 Total 1106 5.9 ±1.7 75 23.1 ±4.3 270 29.0 ±4.6 345
*All Individuals NOT diagnosed previously but with BP >= 140/90 mmHg also includes individuals not previously diagnosed but with BP >= 160/100 mmHg
Figure 5.3.2.2 Total prevalence* of high blood pressure across age and gender groups
0102030405060708090
100
25-34 35-44 45-54 55-64
Age group (years)
Tota
l pre
vale
nce
of h
igh
bloo
d pr
essu
re
MaleFemale
* Total prevalence of high blood pressure is defined as the % of the study population with a previous diagnosis of high blood pressure and on medication plus the % not previously diagnosed but with blood pressure measured ≥140/90 mmHg Results Description Table 5.3.2.1 shows that the mean systolic blood pressure for males in the study population was 134.1 (±1.5) mmHg and the mean diastolic blood pressure was 83.5 (±1.7) mmHg. The mean systolic blood pressure for females was 125.1 (±1.4) mmHg and the mean diastolic blood pressure was 80.0 (±1.1) mmHg. There was a statistically significant overall gender difference in both systolic and diastolic blood

AmericanSamoaSTEPSReport.doc
21/08/2007 Page 42 of 94
pressure with males having higher blood pressure readings than females. For diastolic blood pressure this gender difference was observed in the two younger age groups, while for systolic blood pressure the difference was only observed in the 35-44 year age group. There was also a significant increase in systolic blood pressure with increasing age. This was observed for both males and females, although the magnitude of the increase was greater for females. There was also a trend for increasing diastolic blood pressure with increasing age, although this was only significant for females. As shown in Table 5.3.2.2 (Appendix 1), only 11.4% (±1.6) of the study population had a diagnosis of high blood pressure by a health worker in the previous 12 months. There was no gender difference with 12.3% (±2.8) of males and 10.6% (±2.1) of females being diagnosed with high blood pressure in the preceding 12 months (Table 5.3.2.2). However there was a pronounced increase in the proportion of the study population diagnosed with hypertension with increasing age. This trend was apparent for both males and females but there was no significant gender difference (Figure 5.3.2.1). Amongst the group of study participants with a diagnosis of high blood pressure in the previous 12 months, 59.1% (±8.4) were on anti-hypertensive medication (Table 5.3.2.3). There was no significant gender difference with 62.0% (±11.4) of male and 55.8% (±11.1) of female hypertensives on medication respectively. However, for both males and females there was an increase in the proportion of hypertensives on medication with increasing age. Table 5.3.2.4 shows the total prevalence of high blood pressure in the study population. Total prevalence was defined as the sum of those participants with a diagnosis of high blood pressure who were taking blood pressure medication and those who have not previously been diagnosed with high blood pressure but who have BP >= 140/90 mmHg. The prevalence of high blood pressure amongst males in the study population was 42.3% (±6.0) while the prevalence amongst females was 29.0 % (±4.6). When stratified by age and gender groups, it was apparent that there was a significantly higher prevalence of high blood pressure amongst younger males compared to younger females. There was no significant gender difference in high blood pressure prevalence in the older age groupings. (Figure 5.3.2.2). Comparison with previous data Coyne (2000)26 has summarized previous investigations of blood pressure undertaken in Samoa and American Samoa. In general, blood pressure increased with age for both males and females. The prevalence of hypertension for Samoan males in 1994 was greater than 35% and for females it was approximately 18%. The current survey data indicated that the prevalence of hypertension for American Samoan males is 43.9% (±6.5) and for females is 30.7 %. (±4.4). The extent to which this can be compared with previous data is limited since the previous surveys incorporate information from both Western Samoa and American Samoa; however, it may indicate that the prevalence of hypertension is increasing.

AmericanSamoaSTEPSReport.doc
21/08/2007 Page 43 of 94
5.4 Biochemical measures (Detailed tables in Appendix 1 Table 5.4.1 -5.4.2.2) 5.4.1 Blood Glucose and Diabetes **STILL BEING ANALYSED** Whole blood capillary glucose was measured for each participant using an Accutrend (Bayer Corp) as described in the operational manual. Elevated blood glucose was defined as being ≥110mg/dL or 6.1 mmol/L and impaired fasting glucose levels were defined as being ≥100 mg/dL and <110 mg/dL (≥5.6 and <6.1 mmol/L)27. The participants were also asked questions about their history of diabetes and treatment for diabetes. A reported diagnosis of diabetes was recorded if, during the past 12 months, a doctor or health worker had told the participant that they had diabetes. Participants with a reported diagnosis of diabetes were asked if they were currently receiving insulin, oral drugs or special dietary treatments as prescribed by a doctor or health worker. To assess the diabetes status of the surveyed population, the total diabetes prevalence was calculated and was defined as including the following two groups of participants:
• Known or previously diagnosed diabetes if they were currently receiving anti-diabetes medication and/or insulin prescribed by a health worker, OR
• Having fasting blood glucose greater than or equal to 110 mg/dl (6.1 mmol/l) without having known diabetes or being on treatment. These were called Newly Diagnosed Diabetics.
Result tables
Table 5.4.1.2 Fasting blood glucose (mg/dL)
Males Females Age Mean CI N Mean CI N
25-34 107.6 ±3.4 270 102.8 ±2.6 32235-44 121.0 ±4.2 266 117.1 ±4.9 36445-54 133.9 ±6.4 235 147.1 ±9.0 23855-64 150.8 ±14.3 155 146.8 ±11.2 138Total 122.6 ±4.4 926 120.9 ±5.2 1062

AmericanSamoaSTEPSReport.doc
21/08/2007 Page 44 of 94
Figure 5.4.1.1 Percentage of the study population with a previous diagnosis of diabetes across gender and age group
-20
0
20
40
60
80
100
25-34 35-44 45-54 55-64
Age Group (years)
% o
f the
stu
dy p
opul
atio
n w
ith a
di
agno
sis
of d
iabe
tes
in th
e pa
st
12 m
onth
s
MaleFemale
Table 5.4.1.4 Prevalence of diabetes (110mg/dL cut-off)
Total population
Previously Diagnosed With Diabetes and on
Medication
All Individuals NOT diagnosed previously but with Glucose >=
110mg/dL
Total Prevalence Age N
% CI n % CI n % CI n 25-34 621 1.1 ±1.2 5 27.7 ±5.6 166 28.9 ±5.8 171 35-44 647 4.0 ±1.6 21 45.9 ±6.3 281 49.9 ±6.7 302 45-54 500 12.5 ±2.0 60 44.4 ±3.8 224 56.8 ±3.5 284 55-64 304 23.4 ±6.5 64 44.6 ±8.9 141 68.0 ±7.6 205 Total 2072 6.9 ±1.6 150 38.8 ±3.9 812 45.7 ±4.4 962
Males 25-34 285 0.3 ±0.6 1 33.1 ±6.9 92 33.4 ±6.9 93 35-44 276 4.1 ±2.5 10 49.4 ±6.4 134 53.6 ±6.2 144 45-54 246 11.9 ±3.2 27 47.4 ±6.4 120 59.2 ±5.8 147 55-64 159 22.8 ±11.9 34 46.1 ±10.9 77 69.0 ±9.7 111 Total 966 6.6 ±2.1 72 42.6 ±3.8 423 49.3 ±5.0 495
Females 25-34 336 2.0 ±2.4 4 22.3 ±8.9 74 24.3 ±8.7 78 35-44 371 3.9 ±3.5 11 42.5 ±7.7 147 46.4 ±8.9 158 45-54 254 13.1 ±3.5 33 41.2 ±5.9 104 54.4 ±4.1 137 55-64 145 24.1 ±8.8 30 42.7 ±14.3 64 66.8 ±7.7 94 Total 1106 7.2 ±2.6 78 34.8 ±4.8 389 42.0 ±5.7 467

AmericanSamoaSTEPSReport.doc
21/08/2007 Page 45 of 94
Figure 5.4.1.2 Total Prevalence* of diabetes (110 mg/dL cut-off) by gender across age groups
0
20
40
60
80
100
25-34 35-44 45-54 55-64
Age group (years)
Tota
l pr
eval
ence
of d
iabe
tes
(%) Male
Female
* Total prevalence of diabetes is defined as: the % of the study population previously diagnosed with diabetes who are on diabetes medication and those newly diagnosed with diabetes. Table 5.4.1.5 Prevalence of diabetes (120mg/dL cut-off)*
*The 120mg/dL glucose cut-off was used for classification until 1999 and is provided here for comparison with older studies.
Total Population
Previously Diagnosed With Diabetes and on
Treatment
All Individuals NOT diagnosed previously
but with Glucose >= 120 mg/dL
Total Prevalence Age N
% CI n % CI n % CI n 25-34 621 1.1 ±1.2 5 12.7 ±2.7 74 13.9 ±3.6 79 35-44 647 4.0 ±1.6 21 27.9 ±5.0 167 31.9 ±5.9 188 45-54 500 12.5 ±2.0 60 28.8 ±4.2 146 41.3 ±5.4 206 55-64 304 23.4 ±6.5 64 29.5 ±8.7 93 52.9 ±9.8 157 Total 2072 6.9 ±1.6 150 22.7 ±2.4 480 29.6 ±3.7 630
Males 25-34 285 0.3 ±0.6 1 15.7 ±6.8 40 16.0 ±6.8 41 35-44 276 4.1 ±2.5 10 30.0 ±7.2 79 34.2 ±7.2 89 45-54 246 11.9 ±3.2 27 29.1 ±6.9 75 40.9 ±7.9 102 55-64 159 22.8 ±11.9 34 29.0 ±9.1 48 51.8 ±11.8 82
Total 966 6.6 ±2.1 72 24.5 ±4.4 242 31.1 ±5.9 314 Females
25-34 336 2.0 ±2.4 4 9.7 ±3.7 34 11.7 ±3.8 38 35-44 371 3.9 ±3.5 11 25.8 ±5.4 88 29.7 ±8.2 99 45-54 254 13.1 ±3.5 33 28.6 ±4.8 71 41.7 ±5.7 104 55-64 145 24.1 ±8.8 30 30.1 ±13.3 45 54.3 ±8.6 75 Total 1106 7.2 ±2.6 78 20.9 ±2.7 238 28.1 ±4.4 316

ericanSamoaSTEPSReport.doc
21/08/2007 Page 46 of 94
Table 5.4.1.6b Type of blood glucose treatment for diabetes
Insulin Only
Am
(includes insulin & diet)
Insulin & Drugs (includes drugs, diet
& insulin)
Diet Only (includes drugs &
diet) Drugs Only No treatment Age N
% CI n % CI n % CI n % CI n % CI n Total
25-34 11 ---- ±0.0 0 6.2 ±14.4 1 7.9 ±17.9 1 37.8 ±52.2 2 48.0 ±42.8 735-44 33 8.2 ±19.3 2 2.3 ±5.3 1 9.6 ±8.4 3 39.3 ±20.6 12 40.6 ±15.8 1545-54 69 2.1 ±4.9 2 4.4 ±6.8 2 14.3 ±9.4 12 54.2 ±20.3 38 25.0 ±13.4 1555-64 62 10.0 ±9.6 5 6.3 ±9.2 3 16.0 ±12.5 11 49.3 ±24.1 32 18.4 ±12.6 11Total 175 5.9 ±5.8 9 4.7 ±3.6 7 13.2 ±5.4 27 47.8 ±15.7 84 28.4 ±8.0 48
Males 25-34 1 ---- ±0.0 0 ---- ±0.0 0 ---- ±0.0 0 ---- ±0.0 0 100.0 ±0.0 135-44 11 10.9 ±27.1 1 5.7 ±11.2 1 23.4 ±29.6 3 35.5 ±22.8 4 24.5 ±24.9 245-54 32 2.1 ±5.2 1 5.4 ±10.8 1 12.6 ±14.4 4 58.8 ±37.8 20 21.1 ±19.3 655-64 31 11.8 ±16.0 2 2.4 ±5.7 1 21.7 ±22.4 6 47.2 ±16.4 16 16.8 ±20.3 6Total 75 7.4 ±5.3 4 4.3 ±6.9 3 18.0 ±13.6 13 48.6 ±22.6 40 21.7 ±11.4 15
Females 25-34 10 ---- ±0.0 0 6.8 ±15.8 1 8.7 ±19.1 1 41.5 ±54.7 2 43.0 ±41.2 635-44 22 6.3 ±15.4 1 ---- ±0.0 0 ---- ±0.0 0 41.8 ±28.9 8 51.9 ±26.8 1345-54 37 2.1 ±4.7 1 3.5 ±8.2 1 16.0 ±12.0 8 49.8 ±13.7 18 28.6 ±13.7 955-64 31 8.5 ±14.4 3 9.6 ±18.1 2 11.1 ±11.5 5 51.2 ±40.3 16 19.7 ±24.4 5Total 100 4.8 ±7.4 5 4.9 ±6.1 4 9.7 ±5.3 14 47.2 ±16.5 44 33.4 ±10.2 33

AmericanSamoaSTEPSReport.doc
21/08/2007 Page 47 of 94
Table 5.4.1.7 Percentage of study participants with impaired fasting blood glucose (100 – 110 mg/dL)
Total Population Males Females Age % CI N % CI N % CI N
25-34 29.3 ±5.8 178 31.9 ±6.1 92 26.7 ±7.4 8635-44 24.8 ±5.1 172 24.7 ±3.9 71 24.8 ±7.4 10145-54 23.0 ±3.8 109 22.1 ±5.7 52 23.8 ±3.5 5755-64 21.1 ±9.1 63 20.8 ±10.3 32 21.6 ±8.5 31Total 25.7 ±1.5 522 26.3 ±1.8 247 25.0 ±2.1 275
Figure 5.4.1.3 Percentage of study participants with impaired fasting blood glucose (100mg/dL -110mg/dL) by age group and gender
0102030405060708090
100
25-34 35-44 45-54 55-64
Age Group (years)
% o
f the
stu
dy p
opul
atio
n w
ith
impa
ired
fast
ing
bloo
d gl
ucos
e le
vels Male
Female
Result description The mean fasting blood glucose level of the study population was 121.8 (±3.6) mg/dL (Table 5.4.1.2 Appendix 1). There was no significant difference between males (122.6 (±4.4) mg/dL) and females (120.9 (±5.2) (Table 5.4.1.2). Mean blood glucose levels increased with increasing age for both males and females. As indicated in Table 5.4.1.3 (Appendix 1), 10.4% (±8.4) of the study population had been diagnosed with diabetes by a health worker in the previous 12 months. There was no significant difference between males and females, with 9.3% (±3.0) and 11.5% (±2.9) of males and females being diagnosed with diabetes in the last 12 months, respectively. The proportion of participants with a recent diagnosis of diabetes was observed to increase with increasing age (Figure 5.4.1.1). This was evident for both males and females. For the most senior age grouping, 29.3% (±10.3) of males and 30.4% (±10.0) of females had been given a diagnosis of diabetes within the previous 12 months. As shown by Table 5.4.1.4, the prevalence of diabetes in the total study population using a blood glucose level of 110 mg/dL as a cut-off was 47.3% (±3.4). The prevalence of diabetes in males from the study population was 52.3% (±3.7) and for females it was 42.4% (±4.1). Figure 5.4.1.2 shows prevalence of diabetes by gender and age group. The prevalence of diabetes amongst males was higher than that amongst females for each age group; however the differences were not significant. In general, for both males and females the prevalence of diabetes increased with increasing age, such that approximately 70% of males and females in the 55-64 year age group were diabetic.

AmericanSamoaSTEPSReport.doc
21/08/2007 Page 48 of 94
Prior to 1999, a blood glucose level of 120 mg/dL was the accepted cut-off value used to diagnose diabetes. To enable comparison with older studies, the prevalence of diabetes in the current survey was also calculated using this higher cut-off. Table 5.4.1.5 shows that the prevalence of diabetes in the total study population using the 120 mg/dL cut-off was 29.6% (±3.7). The prevalence of diabetes amongst males and females using the 120 mg/dL cut-off was 31.1% (±5.9) and 28.1% (±4.4) respectively. There was no significant difference in the prevalence of diabetes between males and females using the higher blood glucose cut-off. There was a trend for prevalence of diabetes to increase with increasing age for both males and females. Table 5.4.1.6b shows the proportions of diagnosed diabetics receiving various prescribed diabetes treatments in the past 2 weeks. This table is a condensed version of the table shown in the appendix (Table 5.4.1.6a) in which some of the treatment categories are collapsed. Treatment categories from Table 5.4.1.6a were collapsed into the following treatment categories for Table 5.4.1.6b:
• Insulin and Diet (Table 5.4.1.6a) = Insulin Only (Table 5.4.1.6b) • All (Drugs, diet and insulin) (Table 5.4.1.6a) = Insulin & Drugs (Table 5.4.1.6b)
The results indicate that the majority of the diabetics in the study population were taking oral drugs (47.8% (±15.7)). 48.6% (±22.6) of males and 47.2% (±16.5) of females were taking oral drugs. Overall, 28.4% (±8.0) of the study population was not being treated for their diabetes. The remainder of the population were on a special diet (13.2% (±5.4), insulin (5.9% (±5.8), or various combinations of therapy. There were no significant differences between the percentages of men and women on the different therapies. Table 5.4.1.7 shows the percentage of the study population with impaired fasting blood glucose levels. This percentage takes into account only those participants who had not been previously diagnosed with diabetes and whose blood glucose levels were 100-110 mg/dL. The results indicate that overall 25.7% (±1.5) of the population who were not diabetic but had impaired fasting glucose levels. There was no significant gender or age difference (Figure 5.4.1.3). Comparison with previous data A previous 1990 study cited by Coyne (2000)28 indicated the prevalence of diabetes in American Samoa to be 13.1% for males and 7.8% for females. Using a fasting glucose level of 126 mg/dL as a cut-off, McGarvey (2001)29 found the 1995 prevalence of diabetes to 11% and 36% for males aged 29-43 and 44-60 years, respectively. Prevalence of diabetes was 15% for females in 29-43 and 44-60 year age groups. There have been no other reports on prevalence of diabetes in American Samoa. In the current survey the prevalence of diagnosed diabetes in the study population was 10.45% (±8.4), with 9.3% (±3.0) and 11.5% (±2.9) in males and females respectively. The total prevalence of diabetes takes into account those participants with a diagnosis of diabetes as well as those with no new diagnosis but with elevated blood glucose levels. Prevalence of diabetes was estimated using two different blood glucose concentrations as cut-offs. Using a glucose cut-off of 110mg/dL the prevalence of diabetes in the total study population was 45.7% (±4.4). The prevalence of diabetes was 49.3% (±5.0) for males and 42.0% (±5.7) for females. Using a glucose cut-off of 120 mg/dL, overall prevalence in the study population was 29.6% (±3.7). The prevalence for males was 31.1% (±5.9) and for females was 28.1% (±4.4).

AmericanSamoaSTEPSReport.doc
21/08/2007 Page 49 of 94
5.4.2 Blood Cholesterol22
Total blood cholesterol was measured for each participant as described in the operational manual using an Accutrend GCT. Elevated total blood cholesterol was defined as being >200mg/dL (5.15 mmol/L) 30.
The measurement range of the Accutrend GC is from 150 mg/dL (3.88 mmol/L) to 300 mg/dL (7.76 mmol/L) with a stated accuracy of ± 5 % compared with CHOD-PAP method 31. The instrument indicated values outside the measurement range but not zero as either “low” or "high". During statistical analyses these "low" values were set to the lowest readable value (150 mg/dL) and the “high” values were set at the highest readable value i.e. 300 mg/dL for further statistical analysis.
Result tables
Table 5.4.2 1 Mean total blood cholesterol levels (mg/dL)
Males Females Age Mean CI N Mean CI N
25-34 176.8 5.2 145 170.9 0.8 17635-44 181.9 2.9 183 184.2 2.6 24945-54 189.8 5.8 172 191.4 5.9 21155-64 190.2 6.8 108 196.3 2.8 123Total 183.3 2.3 608 183.8 2.0 759
Figure 5.4.2.2 Percentage of study population
with high risk total blood cholesterol levels
05
101520253035404550
25-34 35-44 45-54 55-64
Age group (years)
% o
f stu
dy p
opul
atio
n w
ith h
igh
risk
chol
este
rol l
evel
s
MaleFemale

AmericanSamoaSTEPSReport.doc
21/08/2007 Page 50 of 94
Result description The mean blood total cholesterol level of the total population was 183.6 (±1.8) mg/dL (Table 5.4.2.1 Appendix 1). There was a significant gender difference with the mean cholesterol level for males and females being 183.3 (±2.4) mg/dL and 183.8 (±2.2) mg/dL, respectively (Table 5.4.2.1). For both males and females mean cholesterol level increased with age. Females tended to have a slightly higher cholesterol level in each age group than males. However this difference was only significant for the 55-64 age group with a mean cholesterol level of 196.3 (±4.3) mg/dL for females and 190.2 (±7.5) for males. The mean total cholesterol level for each participant was used to determine the proportion of individuals at high risk for coronary artery disease as determined by levels of cholesterol >200mg/dL (Table 5.4.2.2). For all age groups except the 25-34 year group, the proportion of females in the high risk category was greater than for males (Figure 5.4.2.2). However the differences were not statistically significant and the overall proportion of females and males in the high risk group were 23.7% (±3.0) and 23.1% (±2.2), respectively, indicating no gender difference. For both males and females the proportion of participants in the high risk category increased with increasing age, such that 34.7% (±10.4) and 39.5% (±7.3) of males and females from the 55-64 year age group, respectively were in the high risk category (Figure 5.4.2.2). Comparison with previous data
Table 5.4.2.3 Mean and average total cholesterol levels in American Samoans
Publication Sur-vey Year
Number of participants
Gender Age groups (years)
Cholesterol level (mg/dL)
WHO NCD-STEPS (current study)
2002 2062 Males Females
25-64 172.8
Crews et.al. 2004 32 1992 274 Males= 125 Females = 149
35-87 193.0
Kamboh et.al. 2000 33 361 Males = 145 Females = 216
20-70 195.2
1990 67 Males 40-49 205.0 McGarvey et.al. 1993 34
1978 16 Males 40-49 180.5 Pelletier & Hornick 1986 35 153 Males = 50
Females = 96 NA1 189.5
1. Not available Table 5.4.2.3 shows previously reported average total blood cholesterol levels for American Samoans. In each case the levels are higher than the mean total blood cholesterol determined in the current survey (172.8 mg/dL). The current survey measured blood cholesterol in 2062 individuals while the previously reported mean cholesterol levels were all determined from fewer than 400 individuals.

AmericanSamoaSTEPSReport.doc
21/08/2007 Page 51 of 94
The prevalence of high cholesterol levels (>200 mg/dL) in a 1994 study in American Samoa was reported to be above 48% for males aged 29-43 years and 39% for males aged 44-60 years35 For females the prevalence of high cholesterol levels was 32% for those aged 29-43 years and 57% for those aged 44-60%. These prevalence figures are significantly higher than those assessed in the current survey (15.2% for males and 16.7% for females). Some of this difference might be attributable to the age difference between the participants in the different studies (with the current survey probably having the lowest mean age) and some due to methodological differences. 5.5 Combined risk factors There are 5 common and critical risk factors for NCDs were selected, including current daily smokers, overweight or obese (BMI≥25kg/m2), raised Blood Pressure (SBP≥140 and/or DBP≥90 mmHg or currently on medication for raised BP), less than 5 servings of fruit and vegetables per day and low level of activity (<600 MET-minutes). Only 0.4% of the study population were low risk to NCD (i.e., none of the 5 risk factors). 71.2% of the population aged 45 to 64 years old were raised risk (at least three of the risk factors included above). What should be paid more attention to was 60.9% of the population were raised risk (at least three of the risk factors included above) since their ages were 25 to 44 years old only.

AmericanSamoaSTEPSReport.doc
21/08/2007 Page 52 of 94
6. Conclusions and Discussion The American Samoa NCD-STEPS survey indicated that noncommunicable disease risk factors are highly prevalent in the population. Tobacco Smoking Tobacco smoking is the major risk factor for heart disease, stroke and chronic respiratory disease. It causes cancer of the lungs, oesophagus, mouth, bladder, and larynx and contributes to cancer of the cervix, kidney and pancreas. It is the single largest preventable cause of disease and premature death. Although smoking prevalence has declined in many developed nations, it has increased in many less developed countries, including those in the Western Pacific region. The current data indicate that smoking prevalence has not declined in nearly two decades in American Samoa. The risk of smoking related chronic disease therefore remains high for a large proportion of American Samoans. Alcohol Consumption Excess alcohol consumption is a leading cause of preventable death and illness. It is a contributing cause of liver cirrhosis, mental illness, pancreatitis, foetal alcohol syndrome and cardiovascular disease. It also is a contributing cause of cancers of the oral cavity, pharynx, oesophagus, liver and breast. In addition, excess alcohol consumption has adverse social consequences, including road traffic injuries and suicide. Although it is not known if alcohol consumption in American Samoa is increasing, alcohol consumption in the Western Pacific region shows an upward trend. Together with information from the current survey that more than 66% and 53% of male and female current consumers of alcohol in the 25-34 year age bracket, respectively, participate in binge drinking, it indicates a need for an increased awareness of the health implications of excess alcohol consumption, particularly amongst younger American Samoans. Fruit and vegetable intake Evidence reviewed by the FAO/WHO Joint Workshop on Fruit and Vegetables for Health (2004), strongly suggests that fruit and vegetable consumption has a potential role in reducing the risk of type 2 diabetes mellitus (Fruit and Vegetables for Health: Report of a Joint FAO/WHO Workshop, 2004). It was also reported that diets rich in fruit and vegetables could significantly reduce the risk of ischaemic heart disease and stroke. The report also noted that consumption of fruit and vegetables might have a role in obesity, weight management, and cancer prevention. The WHO recommendations are for 400g daily of fruit and vegetable consumption (assuming 80g/ serve). Assuming a serving size of 80g, 90% of the total study population in American Samoa consumed less than this recommended amount. Obesity BMI has an established association with overweight and obesity. A BMI of greater than 25 kg/ m2 and less than 30 is defined as overweight and one of greater than or equal to 30 kg/ m2 is defined as obese. Waist circumference, which can be used as an indication of excess abdominal fat, is closely correlated with BMI and is independently associated with overweight and obesity. The WHO currently specifies that waist circumferences of >80cm for females and >94cm for males infer increased risk of cardiovascular disease. Both BMI and waist circumference are therefore important in predicting risk for the various co morbidities associated with obesity. Overweight and obesity are related to a range of serious chronic conditions that reduce overall quality of life and may lead to premature death. Obesity is associated with a greatly increased relative risk for type 2 diabetes, gallbladder disease, and sleep apnoea, with a moderately increased relative risk for coronary heart disease, hypertension and osteoarthritis, and with a slightly increased risk for impaired fertility, and some cancers (postmenopausal breast cancer, endometrial cancer, colon cancer) (WHO 1997). In the current survey, 69.3% of males and 80.2% of females in the study population had BMIs of >=30 kg/m2. The mean waist circumferences of males and females were greater than those that infer increased

AmericanSamoaSTEPSReport.doc
21/08/2007 Page 53 of 94
risk of cardiovascular disease. These characteristics place the majority of the study population in high risk categories for serious obesity-related chronic diseases such as type 2 diabetes, cardiovascular disease, hypertension, stroke and some cancers. Physical Activity Physical inactivity is a major preventable risk factor for noncommunicable diseases and has been estimated by the WHO to cause 10-16% each of breast cancer, colon cancer and diabetes, and about 22% of ischaemic heart disease. About 60% of the world’s population do not achieve the minimum recommended physical activity each day (about 30 minutes of moderate intensity physical activity). In the current American Samoan survey, it was found that 61.7% of the study population was physically inactive. Along with other risk factors, such as smoking, excessive alcohol intake, and inadequate fruit and vegetable intake, this places a large proportion of the population at risk for the above-mentioned noncommunicable diseases. Hypertension Hypertension is a major risk factor for cardiovascular disease, stroke, renal damage and heart failure. The prevalence of hypertension in the current study was found to be 20.6% for males and 12.3% for females thus placing a large proportion of the population at risk of these serious diseases. The prevalence of hypertension amongst young American Samoan males was significantly higher than that amongst females of similar age, indicating a pressing need to target this group with information about the health risks of hypertension and interventions to prevent and control it. Diabetes Diabetes is a serious condition that is a risk factor for renal failure, blindness, stroke and ischaemic heart disease. In the current survey it was found that the prevalence of diabetes was 52.3% and 42.4% for males and females, respectively. Additionally, prevalence of diabetes was more than 68% for American Samoans in the 55-64 year age group. More than 23% of diabetics were not currently receiving any treatment. Together with the high prevalence of risk factors for diabetes, such as obesity and physical inactivity, in American Samoa, this data suggests that a large proportion of the population are at risk of serious diabetes-related illnesses. Cholesterol Overall, 23.4% of the study population were in the high risk category for cholesterol levels. Although the majority of the study population is clearly not in the high risk category, the proportions in the high risk category increased with age, so that in the 55-64 age group, over 30% of the participants had cholesterol levels of above ≥200 mg/dL. When considered with other risk factors common in the older population, such as obesity, elevated blood pressure, inadequate dietary fruit and vegetable intake and physical inactivity this may indicate that this group needs special attention.

AmericanSamoaSTEPSReport.doc
21/08/2007 Page 54 of 94
7. Recommendations To inform the American Samoan public about:
• Implementation of WHO Framework Convention on Tobacco Control (FCTC)
• The health risks associated with smoking and of the health benefits of smoking cessation.
• The adverse health effects of excessive alcohol consumption and the health benefits of decreasing alcohol consumption, particularly targeted towards younger males and females.
• Increasing of production and importation of fruit and vegetables
• The health benefits of increasing fruit and vegetable consumption and decreasing consumption
of fatty foods.
• The contributions of overweight and obesity to chronic diseases such as type II diabetes, cardiovascular disease, stroke and some cancers.
• The health benefits of reducing and preventing overweight and obesity
• Ways of achieving weight reduction through modification of diet and physical activity.
• The health risks of hypertension, diabetes and cardiovascular disease and the health benefits of
preventing or controlling them.
• Lifestyle factors contributing to hypertension, diabetes and cardiovascular disease
• The importance of appropriately monitoring and treating hypertension and diabetes, particularly amongst the older age groups.
To develop and introduce strategies to decrease the prevalence of lifestyle risk factors including tobacco use, excessive alcohol consumption among American Samoans, including the following:
• Measures to prevent younger Samoans from taking up smoking • Measures to encourage and support current smokers to give up smoking • Measures to discourage younger Samoans from participating in binge drinking • Measures to encourage current consumers of alcohol to decrease their level of alcohol
consumption To develop and introduce programmes that support the prevention and control of hypertension, diabetes and cardiovascular disease, including the following:
• An increase in efforts to encourage healthy eating habits across all age groups by promoting the availability and consumption of greater levels of fruit and vegetables.
•

AmericanSamoaSTEPSReport.doc
21/08/2007 Page 55 of 94
• Instigating strategies that support and promote weight reduction. This should include increased access to healthy foods and options for physical activity. Increasing levels of physical activity during leisure and transportation could be targeted specifically.
• Ensuring that the health system adequately performs monitoring and treatment of hypertension,
diabetes and cardiovascular disease
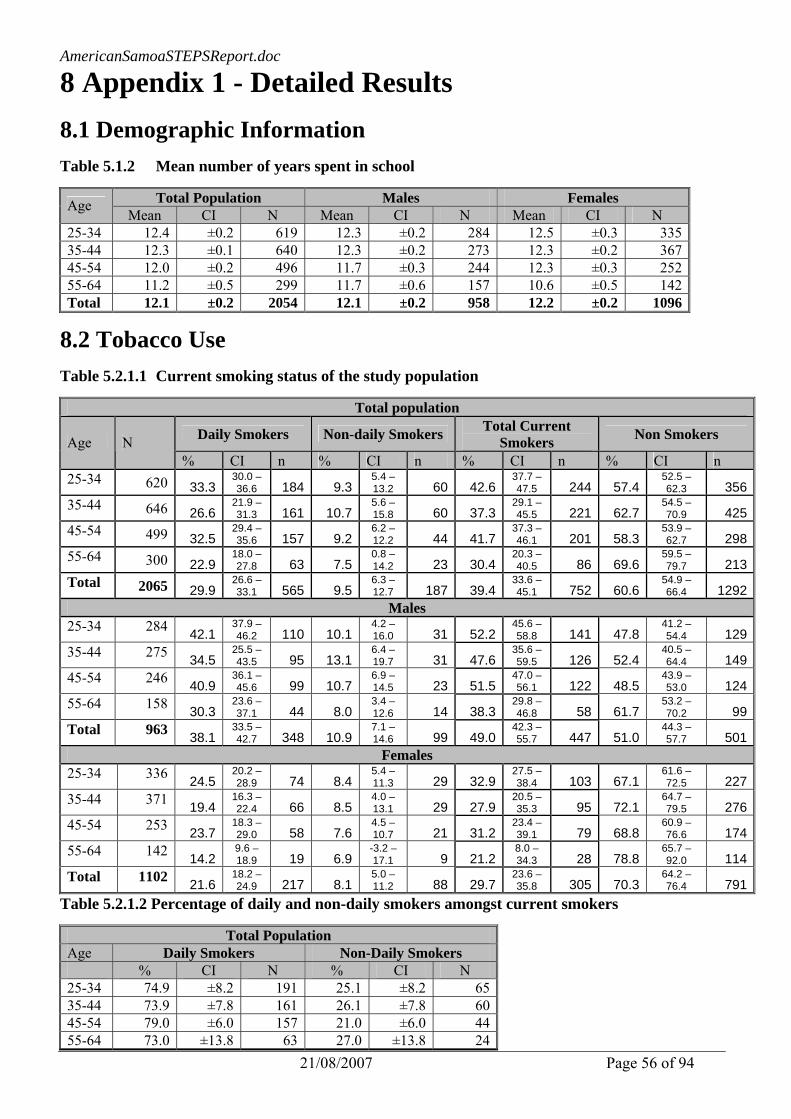
AmericanSamoaSTEPSReport.doc
21/08/2007 Page 56 of 94
8 Appendix 1 - Detailed Results 8.1 Demographic Information Table 5.1.2 Mean number of years spent in school
Total Population Males Females Age Mean CI N Mean CI N Mean CI N
25-34 12.4 ±0.2 619 12.3 ±0.2 284 12.5 ±0.3 33535-44 12.3 ±0.1 640 12.3 ±0.2 273 12.3 ±0.2 36745-54 12.0 ±0.2 496 11.7 ±0.3 244 12.3 ±0.3 25255-64 11.2 ±0.5 299 11.7 ±0.6 157 10.6 ±0.5 142Total 12.1 ±0.2 2054 12.1 ±0.2 958 12.2 ±0.2 1096
8.2 Tobacco Use Table 5.2.1.1 Current smoking status of the study population
Total population
Daily Smokers Non-daily Smokers Total Current Smokers Non Smokers Age N
% CI n % CI n % CI n % CI n 25-34 620 33.3
30.0 – 36.6 184 9.3
5.4 – 13.2 60 42.6
37.7 – 47.5 244 57.4
52.5 – 62.3 356
35-44 646 26.6 21.9 – 31.3 161 10.7
5.6 – 15.8 60 37.3
29.1 – 45.5 221 62.7
54.5 – 70.9 425
45-54 499 32.5 29.4 – 35.6 157 9.2
6.2 – 12.2 44 41.7
37.3 – 46.1 201 58.3
53.9 – 62.7 298
55-64 300 22.9 18.0 – 27.8 63 7.5
0.8 – 14.2 23 30.4
20.3 – 40.5 86 69.6
59.5 – 79.7 213
Total 2065 29.9 26.6 – 33.1 565 9.5
6.3 – 12.7 187 39.4
33.6 – 45.1 752 60.6
54.9 – 66.4 1292
Males 25-34 284 42.1
37.9 – 46.2 110 10.1
4.2 – 16.0 31 52.2
45.6 – 58.8 141 47.8
41.2 – 54.4 129
35-44 275 34.5 25.5 – 43.5 95 13.1
6.4 – 19.7 31 47.6
35.6 – 59.5 126 52.4
40.5 – 64.4 149
45-54 246 40.9 36.1 – 45.6 99 10.7
6.9 – 14.5 23 51.5
47.0 – 56.1 122 48.5
43.9 – 53.0 124
55-64 158 30.3 23.6 – 37.1 44 8.0
3.4 – 12.6 14 38.3
29.8 – 46.8 58 61.7
53.2 – 70.2 99
Total 963 38.1 33.5 – 42.7 348 10.9
7.1 – 14.6 99 49.0
42.3 – 55.7 447 51.0
44.3 – 57.7 501
Females 25-34 336 24.5
20.2 – 28.9 74 8.4
5.4 – 11.3 29 32.9
27.5 – 38.4 103 67.1
61.6 – 72.5 227
35-44 371 19.4 16.3 – 22.4 66 8.5
4.0 – 13.1 29 27.9
20.5 – 35.3 95 72.1
64.7 – 79.5 276
45-54 253 23.7 18.3 – 29.0 58 7.6
4.5 – 10.7 21 31.2
23.4 – 39.1 79 68.8
60.9 – 76.6 174
55-64 142 14.2 9.6 – 18.9 19 6.9
-3.2 – 17.1 9 21.2
8.0 – 34.3 28 78.8
65.7 – 92.0 114
Total 1102 21.6 18.2 – 24.9 217 8.1
5.0 – 11.2 88 29.7
23.6 – 35.8 305 70.3
64.2 – 76.4 791
Table 5.2.1.2 Percentage of daily and non-daily smokers amongst current smokers
Total Population Age Daily Smokers Non-Daily Smokers % CI N % CI N 25-34 74.9 ±8.2 191 25.1 ±8.2 6535-44 73.9 ±7.8 161 26.1 ±7.8 6045-54 79.0 ±6.0 157 21.0 ±6.0 4455-64 73.0 ±13.8 63 27.0 ±13.8 24

AmericanSamoaSTEPSReport.doc
21/08/2007 Page 57 of 94
Total 75.3 ±5.8 572 24.7 ±5.8 193Males
25-34 76.6 ±9.4 115 23.4 ±9.4 3535-44 74.4 ±10.8 95 25.6 ±10.8 3145-54 80.9 ±8.0 99 19.1 ±8.0 2355-64 76.2 ±10.7 44 23.8 ±10.7 15Total 76.8 ±7.0 353 23.2 ±7.0 104
Females 25-34 71.9 ±12.3 76 28.1 ±12.3 3035-44 73.0 ±11.5 66 27.0 ±11.5 2945-54 75.9 ±6.2 58 24.1 ±6.2 2155-64 65.3 ±30.6 19 34.7 ±30.6 9Total 72.7 ±7.5 219 27.3 ±7.5 89
Table 5.2.1.3 Mean age of starting smoking, for current daily smokers
Total Population Males Females Age Mean CI N Mean CI N Mean CI N 25-34 18.8 ±0.4 186 18.9 ±1.1 111 18.7 ±1.0 7535-44 21.0 ±1.1 159 19.8 ±1.5 94 23.0 ±1.5 6545-54 22.5 ±1.6 155 21.0 ±2.1 98 25.1 ±2.6 5755-64 21.2 ±1.9 63 20.3 ±2.3 44 24.0 ±3.7 19Total 20.5 ±0.6 563 19.8 ±0.9 347 21.8 ±1.3 216
Table 5.2.1.4 Mean number of years of smoking, for current smokers
Total Population Males Females Age Mean CI N Mean CI N Mean CI N
25-34 19.1 0.7 177 19.3 0.8 105 18.8 1.4 7235-44 21.3 1.0 159 20.6 1.0 94 22.5 2.4 6545-54 22.2 1.2 155 21.1 1.3 98 24.1 2.5 5755-64 20.6 3.7 62 20.1 3.6 43 22.0 5.2 19Total 20.6 1.1 553 20.1 1.1 340 21.3 2.0 213

AmericanSamoaSTEPSReport.doc
21/08/2007 Page 58 of 94
Table 5.2.1.5 Percentage of current smokers smoking various types of cigarettes
Total Population Manufactured
cigarettes Hand-rolled
cigarettes Pipes full of tobacco
Cigars, cheroots, cigarillos Other Age
% CI n % CI n % CI n % CI n % CI n 25-34 100 ±0.0 187 - ±0 0 - ±0 0 - ±0 035-44 99.6 ±0.9 152 - ±0 0 - ±0 0 - ±0 045-54 100 ±0.0 154 - ±0 0 - ±0 0 - ±0 055-64 100 ±0.0 58 16.4 ±41.4 1 19.0 ±69.1 1 46.2 ±83.2 1Total 99.9 ±0.2 551 1.9 ±5.8 1 1.9 ±8.0 1 6.6 ±22.2 1
Males 25-34 100 ±0 114 ---- ±0 0 - ±0 0 - ±0 035-44 100 ±0 90 ---- ±0 0 - ±0 0 - ±0 045-54 100 ±0 97 ---- ±0 0 - ±0 0 - ±0 055-64 100 ±0 39 19.5 ±71.1 1 23.4 ±116.6 1 52.8 ±109.6 1Total 100 ±0 340 3.8 ±16.5 1 3.7 ±20.9 1 12.4 ±68.2 1
Females 25-34 100 ±0 73 35-44 98.9 ±2.5 62 45-54 100 ±0 57 55-64 100 ±0 19 Total 99.7 ±0.7 211
Table 5.2.1.6 Consumption of manufactured cigarettes/day by current smokers of manufactured
cigarettes
Total Population Males Females Age Mean CI N Mean CI N Mean CI N
25-34 12.4 1.7 180 12.3 2.4 109 12.6 2.1 7135-44 14.5 0.9 152 16.0 1.6 90 12.2 2.2 6245-54 15.0 2.3 154 16.0 1.7 97 13.2 4.8 5755-64 11.7 1.8 58 12.8 3.1 39 9.5 3.0 19Total 13.5 1.2 544 14.2 1.6 335 12.4 1.3 209

AmericanSamoaSTEPSReport.doc
21/08/2007 Page 59 of 94
8.3 Alcohol Consumption Table 5.2.2.1 Alcohol consumption status of the study population
Total population Males Females Ever Consumed Ever Consumed Ever Consumed AGE
N % CI n N % CI n
N % CI n
25-34 621 46.6 ±8.2 269 285 66.2 ±8.5 183 336 26.8 ±10.6 8635-44 647 41.8 ±10.6 255 276 61.1 ±12.0 170 371 22.9 ±10.9 8545-54 500 41.9 ±8.3 213 246 56.9 ±9.4 144 254 26.5 ±9.1 6955-64 304 37.1 ±7.5 117 159 55.2 ±9.5 91 145 15.7 ±9.3 26Total 2072 43.0 ±7.8 854 966 61.4 ±6.5 588 1106 24.3 ±9.2 266
Table 5.2.2.2 Consumers of alcohol during the past 12 months
Total population Males Females Current Consumers Current Consumers Current Consumers AGE
N % CI n N % CI n
N % CI n
25-34 621 32.5 ±6.6 184 285 51.2 ±8.6 141 336 13.4 ±5.7 4335-44 647 27.1 ±9.3 163 276 44.3 ±12.7 124 371 10.3 ±6.8 3945-54 500 21.7 ±6.5 116 246 34.1 ±9.9 91 254 9.0 ±3.8 2555-64 302 18.3 ±5.1 57 159 32.0 ±9.7 54 143 1.8 ±2.5 3Total 2070 27.0 ±6.3 520 966 43.2 ±7.8 410 1104 10.3 ±4.6 110
Table 5.2.2.3 Percentage of current consumers of alcohol who binge drink* on at least one day during the past week
Total population Males Females Binge Drinking >=5 Drinks on One
Day >= 4 Drinks on One
Day AGE
N % CI n
N % CI n
N % CI n
25-34 184 63.7 ±12.1 112 141 66.4 ±13.1 89 43 53.5 ±16.6 2335-44 163 61.1 ±9.2 93 124 69.8 ±9.0 83 39 24.4 ±20.2 1045-54 116 38.0 ±11.1 48 91 44.9 ±13.7 45 25 11.2 ±13.2 355-64 57 39.2 ±15.5 24 54 41.0 ±17.2 24 3 ---- ±0.0 0Total 520 56.8 ±6.7 277 410 61.7 ±7.4 241 110 35.6 ±9.7 36
*5 or more standard drinks per drinking day for males and 4 or more standard drinks per drinking day for females

Am
ericanSamoaSTEPSReport.doc
21/08/2007 Page 60 of 94
Table 5.2.2.4 Frequency of binge drinking amongst current consumers of alcohol
Total Population Monday Tuesday Wednesday Thursday Friday Saturday Sunday Age N % CI n % CI n % CI n % CI n % CI n % CI n % CI n
25-34 184 2.3 ±3.4 3 4.3 ±3.9 5 1.2 ±2.0 3 1.7 ±2.1 4 3.6 ±3.9 8 37.3 ±12.5 65 3.0 ±2.8 5 35-44 163 0.4 ±1.0 1 ---- ±0.0 0 2.5 ±3.3 4 2.9 ±4.5 6 11.3 ±5.9 18 26.9 ±9.9 40 7.7 ±7.6 13 45-54 116 1.9 ±4.4 2 1.5 ±1.9 2 0.7 ±1.4 1 1.3 ±2.8 2 9.8 ±6.6 11 14.9 ±10.1 20 1.0 ±2.2 1 55-64 57 6.0 ±10.7 2 1.4 ±3.0 1 3.0 ±4.8 2 ---- ±0.0 0 4.5 ±5.3 3 7.1 ±6.9 5 5.4 ±9.2 4 Total 520 1.9 ±2.7 8 2.3 ±1.9 8 1.7 ±1.9 10 1.9 ±1.8 12 7.1 ±2.3 40 28.0 ±7.7 130 4.3 ±3.2 23
Males 25-34 141 2.8 ±4.1 3 5.4 ±5.0 5 0.5 ±1.2 1 1.2 ±1.6 2 2.5 ±4.6 5 38.2 ±13.2 51 2.4 ±3.2 3 35-44 124 0.5 ±1.2 1 ---- ±0.0 0 2.6 ±3.3 3 2.6 ±4.5 4 13.5 ±6.5 17 31.2 ±12.3 36 7.8 ±7.8 11 45-54 91 2.4 ±5.5 2 1.9 ±2.4 2 0.8 ±1.8 1 1.7 ±3.6 2 11.2 ±7.7 10 16.9 ±13.2 18 1.2 ±2.7 1 55-64 54 6.3 ±11.3 2 1.4 ±3.1 1 3.2 ±5.1 2 ---- ±0.0 0 4.7 ±5.6 3 7.4 ±7.4 5 5.6 ±9.7 4 Total 410 2.4 ±3.2 8 2.8 ±2.4 8 1.5 ±1.4 7 1.6 ±1.7 8 7.6 ±2.6 35 29.8 ±8.4 110 4.2 ±3.3 19
Females 25-34 43 4.0 ±9.9 2 3.5 ±9.0 2 7.6 ±9.7 3 33.4 ±15.6 14 5.0 ±7.4 2 35-44 39 2.5 ±5.5 1 3.9 ±6.3 2 1.9 ±4.5 1 9.1 ±8.6 4 6.9 ±13.7 2 45-54 25 ---- ±0.0 0 ---- ±0.0 0 4.1 ±8.8 1 7.1 ±10.9 2 ---- ±0.0 0 55-64 3 ---- ±0.0 0 ---- ±0.0 0 ---- ±0.0 0 ---- ±0.0 0 ---- ±0.0 0 Total 110 2.7 ±6.3 3 3.0 ±4.5 4 5.0 ±4.9 5 20.3 ±7.9 20 4.6 ±5.4 4

AmericanSamoaSTEPSReport.doc
21/08/2007 Page 61 of 94
8.4 Diet Table 5.2.3.1 Number of days fruit is consumed per week
Total population Males Females Age Mean CI N Mean CI N Mean CI N
25-34 2.2 0.1 596 2.1 0.2 269 2.4 0.2 32735-44 2.3 0.2 645 2.1 0.2 275 2.6 0.2 37045-54 2.4 0.2 497 2.0 0.2 245 2.9 0.2 25255-64 2.8 0.3 299 2.6 0.3 155 3.0 0.7 144Total 2.4 0.1 2037 2.1 0.2 944 2.6 0.1 1093
Table 5.2.3.2 Servings of fruit consumed per day
Total population
< 1 serving per day* 1 serving per day 2-4 servings per day 5 or more servings per day Age N
% CI n % CI n % CI n % CI n 25-34 613 78.1 2.9 474 11.8 2.0 78 9.4 3.5 56 0.7 0.8 535-44 644 78.5 4.3 502 10.1 1.9 72 10.3 4.4 64 1.1 1.3 645-54 496 75.2 5.3 375 13.5 4.3 68 11.0 3.8 51 0.4 0.6 255-64 299 73.1 8.4 223 10.3 3.5 33 15.2 9.3 38 1.3 1.6 5Total 2052 77.0 2.7 1574 11.4 1.7 251 10.7 2.9 209 0.8 0.5 18
Males 25-34 282 80.3 2.2 225 10.6 2.4 30 8.3 3.6 25 0.8 1.3 235-44 275 82.3 5.6 227 6.1 3.4 17 9.8 5.0 27 1.8 2.6 445-54 245 83.6 5.4 206 7.6 4.7 20 8.8 4.4 19 ---- 0.0 055-64 155 74.0 14.9 122 6.8 4.7 11 19.2 17.1 22 ---- 0.0 0Total 957 80.8 3.6 780 8.2 1.8 78 10.2 3.8 93 0.8 0.9 6
Females 25-34 331 75.7 6.0 249 13.0 4.5 48 10.6 4.1 31 0.7 1.1 335-44 369 74.7 6.8 275 14.1 2.7 55 10.9 5.3 37 0.4 0.6 245-54 251 66.5 6.1 169 19.5 4.9 48 13.3 4.6 32 0.7 1.2 255-64 144 72.1 9.0 101 14.5 5.1 22 10.5 3.1 16 2.9 3.8 5Total 1095 73.2 3.2 794 14.8 2.6 173 11.2 2.1 116 0.8 0.8 12
* Includes “Don’t eat fruit at all” Table 5.2.3.3 Mean number of servings of fruit consumed per week
Total population Males Females Age Mean CI N Mean CI N Mean CI N
25-34 2.1 0.1 467 2.0 0.2 203 2.1 0.1 264 35-44 2.0 0.2 545 2.0 0.3 216 1.9 0.2 329 45-54 1.9 0.2 395 1.8 0.3 175 2.0 0.2 220 55-64 1.8 0.3 257 1.8 0.4 131 1.9 0.4 126 Total 2.0 0.1 1664 1.9 0.2 725 2.0 0.1 939

AmericanSamoaSTEPSReport.doc
21/08/2007 Page 62 of 94
Table 5.2.3.4 Number of days vegetables are consumed per week
Total population Males Females Age Mean CI N Mean CI N Mean CI N
25-34 4.0 0.3 328 3.7 0.3 270 4.0 0.3 32835-44 4.2 0.4 368 3.7 0.3 273 4.2 0.4 36845-54 4.7 0.4 251 3.7 0.4 246 4.7 0.4 25155-64 4.0 0.6 144 4.1 0.7 158 4.0 0.6 144Total 4.2 0.4 1091 3.7 0.3 947 4.2 0.4 1091
Table 5.2.3.5 Servings of vegetables consumed per day
Total population
< 1 serving per day* 1 serving per day 2-4 servings per day 5 or more servings per day Age N
% CI n % CI n % CI n % CI n 25-34 612 50.9 8.6 305 22.0 5.3 137 24.4 6.6 152 2.6 1.6 1835-44 633 50.5 10.4 311 21.5 4.6 137 25.2 6.7 168 2.8 2.1 1745-54 488 48.4 9.3 225 21.1 4.9 104 28.0 7.3 147 2.5 2.3 1255-64 298 52.1 11.0 149 18.4 5.8 60 26.0 6.5 81 3.4 4.3 8Total 2031 50.4 8.7 990 21.2 3.6 438 25.6 5.6 548 2.8 1.8 55
Males 25-34 282 54.4 8.4 150 17.1 4.2 51 25.1 9.0 71 3.4 1.9 1035-44 270 54.9 12.3 148 19.0 6.9 53 23.7 11.8 62 2.3 2.2 745-54 240 55.1 10.0 129 18.9 5.2 47 23.7 10.4 60 2.4 3.5 455-64 157 52.4 11.0 79 19.5 7.6 34 25.1 6.9 40 3.0 3.5 4Total 949 54.4 8.6 506 18.3 4.0 185 24.4 7.8 233 2.8 1.6 25
Females 25-34 330 47.4 10.3 155 27.1 9.9 86 23.7 6.2 81 1.9 2.3 835-44 363 46.2 12.4 163 23.8 7.8 84 26.7 7.1 106 3.3 4.0 1045-54 248 41.5 10.2 96 23.3 8.1 57 32.4 9.1 87 2.7 2.1 855-64 141 51.8 15.8 70 17.2 9.2 26 27.2 7.9 41 3.9 6.0 4Total 1082 46.3 10.0 484 24.2 6.3 253 26.8 5.4 315 2.7 2.3 30
* Includes “Don’t eat vegetables at all” Table 5.2.3.6 Mean number of servings of vegetables consumed per week
Total population Males Females Age Mean CI N Mean CI N Mean CI N
25-34 2.5 0.1 551 2.5 0.1 245 2.5 0.2 30635-44 2.5 0.2 608 2.5 0.3 253 2.6 0.1 35545-54 2.7 0.2 477 2.7 0.4 232 2.6 0.2 24555-64 2.4 0.3 289 2.4 0.4 152 2.5 0.4 137Total 2.5 0.1 1925 2.5 0.2 882 2.5 0.1 1043

AmericanSamoaSTEPSReport.doc
21/08/2007 Page 63 of 94
Table 5.2.3.7 Servings of fruit & vegetables consumed per day
Total population Males Females <5 servings <5 servings <5 servings Age N % CI n N % CI n N % CI n
25-34 450 60.2 269 255 628 123 195 57.8 14635-44 531 62.8 325 322 61.2 129 209 64.1 19645-54 391 60.2 234 218 61.5 102 173 59.1 13255-64 252 68.7 166 122 70.0 87 130 67.1 79Total 1624 62.1 994 917 63.0 441 707 61.2 553

AmericanSamoaSTEPSReport.doc
21/08/2007 Page 64 of 94
8.5 Physical Activity Table 5.2.4.1 Percentage of the study population that is physically inactive
Total population Males Females Inactive Inactive Inactive AGE
N % CI n N % CI n
N % CI n
25-34 619 42.9 ±11.9 265 284 36.8 ±12.5 105 335 49.0 ±13.1 16035-44 644 42.8 ±10.0 256 276 44.9 ±14.0 113 368 40.6 ±7.4 14345-54 498 38.3 ±11.4 184 245 39.5 ±16.2 92 253 37.1 ±8.4 9255-64 304 48.4 ±10.8 136 159 46.7 ±12.9 68 145 50.4 ±9.9 68Total 2065 42.6 ±9.8 841 964 41.1 ±10.6 378 1101 44.1 ±9.1 463
Table 5.2.4.2 Total physical activity (hours/week) by age group
Total population Males Females Age Mean CI N Mean CI N Mean CI N 25-34 22.6 5.5 304 30.4 8.3 160 12.0 4.1 14435-44 18.3 5.5 328 24.1 6.5 141 13.1 4.3 18745-54 18.1 5.5 260 22.9 6.5 129 13.2 6.3 13155-64 14.7 5.2 140 17.5 9.6 74 11.3 3.2 66Total 19.5 3.3 1032 25.7 3.5 504 12.6 3.4 528
Table 5.2.4.3 Total physical activity by domain (METminutes/week) and age group
Total population Work Transport Leisure Age
Mean CI n Mean CI n Mean CI n 25-34 8382.2 ±1386.0 87 1149.7 ±286.7 239 2544.7 ±694.2 7335-44 6420.4 ±1507.1 89 1376.0 ±464.5 270 2483.4 ±742.4 6445-54 6040.7 ±1694.5 72 1355.9 ±251.4 225 3329.3 ±1708.2 3855-64 4385.5 ±1266.4 31 1164.9 ±297.7 130 4638.2 ±4326.0 18Total 6961.2 ±717.8 279 1267.8 ±246.1 864 2785.0 ±461.1 193
Males 25-34 11052.7 ±2202.2 52 1217.5 ±292.4 118 3114.7 ±1061.6 4535-44 8723.0 ±2226.6 43 1615.2 ±518.7 106 2811.5 ±1615.1 3245-54 7908.5 ±2461.2 41 1360.9 ±313.9 105 3588.2 ±2522.3 2055-64 5381.6 ±1828.5 16 1205.3 ±451.4 68 5327.3 ±5507.2 13Total 9355.5 ±1101.9 152 1355.1 ±277.5 397 3294.3 ±693.2 110
Females 25-34 3705.4 ±2134.1 35 1065.7 ±338.1 121 1542.8 ±1082.0 2835-44 3970.2 ±938.9 46 1188.8 ±489.0 164 2096.0 ±1243.7 3245-54 3375.7 ±1707.9 31 1351.2 ±413.8 120 2999.9 ±1413.2 1855-64 3403.2 ±1878.7 15 1115.8 ±542.1 62 1987.9 ±1217.9 5Total 3697.0 ±1269.2 127 1180.2 ±257.4 467 1996.5 ±840.1 83
Note: The term MET is an abbreviation for metabolic equivalent and is used to reflect the intensity of the specific PA. A MET is defined as the ratio of the associated metabolic rate for a specific activity divided by the resting metabolic rate. The resting metabolic rate is approximately 1 MET and reflects the energy cost of sitting quietly. The MET values for the three PA domains are as follows:
* Moderate PA (work and leisure domain) = 4.0 METS * Vigorous PA (work and leisure domain) = 6.0 METS * Transport related walking/cycling = 3.0 METS

AmericanSamoaSTEPSReport.doc
21/08/2007 Page 65 of 94
Table 5.2.4.4 Levels of physical activity at work by age group
Total population Inactive Moderate only* Vigorous* Age
% CI n % CI n % CI n 25-34 87 10.2 ±8.5 8 11.8 ±8.4 11 77.9 ±9.0 68 35-44 89 11.6 ±10.3 10 11.7 ±5.8 11 76.7 ±11.9 68 45-54 72 12.7 ±7.6 8 15.8 ±10.4 11 71.5 ±14.3 53 55-64 31 16.6 ±20.3 4 8.0 ±13.1 3 75.4 ±18.7 24 Total 279 11.7 ±4.4 30 12.3 ±5.5 36 76.0 ±4.6 213
Males 25-34 52 2.0 ±3.2 1 8.0 ±6.1 5 90.0 ±7.5 46 35-44 43 10.8 ±12.6 4 11.6 ±12.8 4 77.6 ±20.5 35 45-54 41 9.3 ±15.5 2 3.7 ±5.5 2 87.0 ±14.0 37 55-64 16 5.1 ±11.5 1 11.0 ±17.2 2 83.9 ±17.5 13 Total 152 6.1 ±4.7 8 8.3 ±4.9 13 85.6 ±6.7 131
Females 25-34 35 24.7 ±22.6 7 18.5 ±19.2 6 56.8 ±21.9 22 35-44 46 12.4 ±11.8 6 11.8 ±8.0 7 75.7 ±17.0 33 45-54 31 17.7 ±13.8 6 33.0 ±28.8 9 49.3 ±23.2 16 55-64 15 27.3 ±38.2 3 5.2 ±10.6 1 67.6 ±35.9 11 Total 127 19.4 ±11.4 22 17.7 ±9.6 23 62.9 ±7.4 82
* Moderate only: 600-1500 Metminutes * Vigorous: >1500 Metminutes Table 5.2.4.5 Levels of physical activity during transportation by age group
Total population Inactive Moderate only* Vigorous* Age
% CI n % CI n % CI n 25-34 239 49.0 ±16.0 116 22.5 ±7.4 54 28.5 ±9.1 69 35-44 270 41.8 ±11.6 114 32.0 ±9.5 81 26.2 ±11.9 75 45-54 225 39.4 ±5.3 89 30.4 ±7.2 67 30.2 ±7.4 69 55-64 130 46.8 ±10.5 64 24.5 ±5.8 30 28.7 ±10.4 36 Total 864 44.4 ±9.0 383 27.4 ±5.6 232 28.2 ±6.1 249
Males 25-34 118 44.9 ±16.9 52 24.0 ±9.3 28 31.1 ±9.6 38 35-44 106 37.0 ±10.9 39 31.0 ±7.9 31 32.1 ±11.4 36 45-54 105 31.8 ±8.4 36 34.2 ±10.1 32 34.0 ±9.5 37 55-64 68 40.3 ±22.1 32 27.3 ±8.8 17 32.3 ±15.2 19 Total 397 39.3 ±9.8 159 28.5 ±6.5 108 32.1 ±6.8 130
Females 25-34 121 54.2 ±16.2 64 20.6 ±8.0 26 25.3 ±11.4 31 35-44 164 45.7 ±13.5 75 32.8 ±12.9 50 21.6 ±12.8 39 45-54 120 46.5 ±8.8 53 26.9 ±12.9 35 26.6 ±10.9 32 55-64 62 54.6 ±15.1 32 21.0 ±15.4 13 24.4 ±18.0 17 Total 467 49.4 ±9.3 224 26.4 ±7.3 124 24.2 ±8.0 119
* Moderate only: 600-1500 Metminutes * Vigorous: >1500 Metminutes

AmericanSamoaSTEPSReport.doc
21/08/2007 Page 66 of 94
Table 5.2.4.6 Levels of physical activity during leisure time by age group
Total population Inactive Moderate only* Vigorous* Age
% CI n % CI n % CI n 25-34 73 23.6 ±10.1 16 19.7 ±12.6 16 56.8 ±12.1 41 35-44 64 15.8 ±11.1 11 36.1 ±16.3 22 48.0 ±12.4 31 45-54 38 16.8 ±10.7 7 33.0 ±33.5 14 50.2 ±28.7 17 55-64 18 8.2 ±8.6 2 19.4 ±24.2 3 72.5 ±25.6 13 Total 193 19.2 ±6.1 36 26.6 ±8.0 55 54.2 ±6.0 102
Males 25-34 45 17.5 ±6.4 9 12.8 ±11.9 6 69.6 ±11.0 30 35-44 32 6.2 ±9.8 2 38.9 ±29.4 12 54.9 ±26.4 18 45-54 20 16.9 ±11.7 4 29.4 ±29.7 7 53.7 ±34.7 9 55-64 13 ---- ±0.0 0 24.4 ±31.7 3 75.6 ±31.7 10 Total 110 12.9 ±4.3 15 23.1 ±9.6 28 64.0 ±8.8 67
Females 25-34 28 34.1 ±25.6 7 31.6 ±20.6 10 34.2 ±24.0 11 35-44 32 27.3 ±21.2 9 32.9 ±13.3 10 39.8 ±14.8 13 45-54 18 16.7 ±20.6 3 37.6 ±50.1 7 45.8 ±30.8 8 55-64 5 39.5 ±22.4 2 ---- ±0.0 0 60.5 ±22.4 3 Total 83 29.0 ±13.4 21 32.0 ±9.2 27 39.0 ±11.6 35
* Moderate only: 600-1500 Metminutes * Vigorous: >1500 Metminutes Table 5.2.4.7 Involvement in physical activity for less than 150 minutes per week by age group
Total population Males Females Yes Yes Yes Age N % CI n N % CI n N % CI n
25-34 621 8.946 ±3.2 52 285 7.419 ±3.7 21 336 10.495 ±4.4 3135-44 647 8.647 ±3.2 58 276 6.984 ±5.0 19 371 10.269 ±4.3 3945-54 500 8.904 ±1.4 43 246 7.399 ±3.2 20 254 10.454 ±4.4 2355-64 304 9.482 ±3.0 32 159 6.393 ±5.9 12 145 13.147 ±4.8 20Total 2072 8.906 ±1.7 185 966 7.154 ±2.5 72 1106 10.699 ±1.8 113
8.6 Obesity Table 5.3.1.1a Mean height (inches) of the study population across gender and age groups
Total population Males Females Age Mean CI N Mean CI N Mean CI N
25-34 68.2 ±0.4 621 70.1 ±0.6 285 66.3 ±0.5 336 35-44 67.6 ±0.4 645 69.9 ±0.4 275 65.4 ±0.2 370 45-54 67.0 ±0.4 500 69.1 ±0.4 246 64.8 ±0.5 254 55-64 66.3 ±0.2 303 68.0 ±0.4 158 64.3 ±0.4 145 Total 67.5 ±0.2 2069 69.6 ±0.3 964 65.5 ±0.3 1105

AmericanSamoaSTEPSReport.doc
21/08/2007 Page 67 of 94
Table 5.3.1.1b Mean height (cm) of the study population across gender and age groups
Total population Males Females Age Mean CI N Mean CI N Mean CI N
25-34 170.5 ±0.9 621 175.2 ±1.4 285 165.8 ±1.2 33635-44 169.0 ±0.9 645 174.7 ±1.1 275 163.4 ±0.4 37045-54 167.5 ±0.9 500 172.8 ±1.1 246 162.1 ±1.1 25455-64 165.7 ±0.5 303 170.0 ±0.9 158 160.7 ±1.0 145Total 168.9 ±0.4 2069 173.9 ±0.7 964 163.7 ±0.7 1105
Table 5.3.1.2a Mean weight of the study population (pounds) of the study population across gender and age groups
Total population* Maless Females* Age Mean CI N Mean CI N Mean CI N
25-34 222.2 ±4.1 570 222.8 ±9.4 285 221.5 ±9.1 28535-44 226.1 ±4.5 619 233.8 ±9.6 275 218.1 ±4.1 34445-54 218.6 ±6.0 485 224.7 ±7.7 246 211.9 ±9.6 23955-64 208.6 ±6.2 296 208.9 ±6.0 159 208.1 ±10.4 137Total 221.1 ±1.4 1970 224.8 ±4.4 965 216.8 ±3.8 1005
* Pregnant females excluded Table 5.3.1.2b Mean weight of the study population (kg) of the study population across gender and age groups
Total population* Males Females* Age Mean CI N Mean CI N Mean CI N
25-34 101.0 1.9 570 101.3 4.4 285 100.7 4.1 28535-44 102.8 2.0 619 106.3 4.5 275 99.1 1.9 34445-54 99.4 2.8 485 102.1 3.6 246 96.3 4.4 23955-64 94.8 2.8 296 95.0 2.8 159 94.6 4.7 137Total 100.5 0.7 1970 102.2 2.0 965 98.6 1.7 1005
Table 5.3.1.3 Mean body mass index (kg/m2)
Total population* Males Females* Age Mean CI N Mean CI N Mean CI N
25-34 34.6 0.7 568 33.2 1.3 271 36.1 0.8 297 35-44 35.5 0.6 630 34.2 0.7 273 36.7 1.1 357 45-54 34.9 1.0 498 34.1 0.7 246 35.7 1.6 252 55-64 34.3 0.4 299 32.9 1.3 155 36.0 1.4 144 Total 34.9 0.2 1995 33.7 0.5 945 36.2 0.3 1050
* Pregnant females excluded

AmericanSamoaSTEPSReport.doc
21/08/2007 Page 68 of 94
Table 5.3.1.4 Risk categories for body mass index (kg/m2)
Total Population* Underweight
(<18.5) Normal weight
(18.5-24.9) Overweight (25.0-29.9)
Obese (≥30.0) Age N
% CI n % CI n % CI n % CI n 25-34 568 0.1 0.2 1 7.4 1.1 44 22.9 3.7 121 69.7 4.1 40235-44 630 0.1 0.3 1 5.6 1.9 34 14.9 2.7 91 79.4 2.2 50445-54 498 ---- 0.0 0 5.7 2.5 25 16.6 4.3 80 77.7 6.5 39355-64 299 ---- 0.0 0 6.9 2.2 19 22.2 5.1 59 71.0 4.6 221Total 1995 0.1 0.1 2 6.4 0.8 122 18.9 1.1 351 74.6 1.5 1520
Males 25-34 271 ---- ---- ---- 8.2 3.4 27 28.8 6.0 78 63.0 6.4 16635-44 273 ---- ---- ---- 6.9 2.6 18 19.0 5.0 51 74.0 4.6 20445-54 246 ---- ---- ---- 5.4 2.7 12 18.4 4.3 45 76.1 5.6 18955-64 155 ---- ---- ---- 8.7 4.5 13 27.5 7.8 37 63.8 8.6 105Total 945 ---- ---- ---- 7.3 1.2 70 23.5 2.1 211 69.3 2.0 664
Females* 25-34 297 0.1 0.4 1 6.5 3.4 17 16.3 4.8 43 77.0 6.6 23635-44 357 0.2 0.6 1 4.3 3.2 16 11.0 3.4 40 84.5 2.9 30045-54 252 ---- 0.0 0 6.1 3.6 13 14.6 5.2 35 79.4 8.1 20455-64 144 ---- 0.0 0 4.8 2.2 6 15.9 5.8 22 79.3 6.0 116Total 1050 0.1 0.2 2 5.5 1.7 52 14.2 2.0 140 80.2 3.3 856
* Pregnant females excluded Table 5.3.1.5a Mean waist circumference (inches) of the study population across gender and age groups
Total population* Males Females* Age Mean CI N Mean CI N Mean CI N
25-34 41.2 ±0.6 562 40.8 ±1.1 277 41.6 ±0.8 28535-44 42.3 ±0.7 614 42.7 ±1.3 270 42.0 ±0.9 34445-54 42.6 ±1.0 479 42.7 ±1.0 240 42.6 ±1.5 23955-64 43.0 ±0.4 289 42.4 ±0.6 152 43.7 ±0.9 137Total 42.1 ±0.3 1944 41.9 ±0.6 939 42.2 ±0.7 1005
* Pregnant females excluded Table 5.3.1.5b Mean waist circumference (cm) of the study population across gender and age groups
Total population* Males Females* Age Mean CI N Mean CI N Mean CI N
25-34 103.4 1.4 566 102.7 3.9 264 104.1 3.4 30235-44 105.0 1.8 633 105.5 2.7 270 104.4 1.6 36345-54 105.5 3.7 493 106.3 2.3 240 104.7 5.5 25355-64 107.1 1.3 296 105.7 1.3 151 108.7 3.8 145Total 104.8 1.4 1988 104.7 1.0 925 104.8 3.0 1063
* Pregnant females excluded

AmericanSamoaSTEPSReport.doc
21/08/2007 Page 69 of 94
8.7 Blood Pressure and Hypertension Table 5.3.2.1 Resting blood pressure (mmHg)
Total Population Age Systolic Diastolic Mean CI N Mean CI N 25-34 125.2 2.0 598 78.9 1.9 59735-44 128.1 1.9 623 82.3 1.3 62345-54 134.3 1.2 435 84.9 1.5 43555-64 142.3 2.2 240 84.9 1.6 240Total 129.6 1.5 1896 81.8 1.3 1895
Males 25-34 131.4 3.3 270 80.9 2.9 27035-44 133.2 1.7 264 84.7 1.6 26445-54 136.0 1.8 214 85.4 1.6 21455-64 142.9 4.2 124 86.3 3.0 124Total 134.1 2.1 872 83.5 1.9 872
Females 25-34 119.0 1.1 328 76.8 1.2 32735-44 123.5 2.0 359 80.1 1.1 35945-54 132.3 1.2 221 84.5 2.0 22155-64 141.5 3.9 116 83.3 2.0 116Total 125.1 1.0 1024 80.0 0.9 1023
† Includes persons taking medication for high blood pressure Table 5.3.2.2 Diagnosis of hypertension by health worker in past 12 months
Total population Males Females HTN* HTN* HTN* Age N % CI n N % CI n N % CI n
25-34 621 3.2 ±1.2 21 285 3.3 ±2.9 8 336 3.2 ±2.2 1335-44 647 9.3 ±2.7 54 276 11.2 ±4.2 28 371 7.5 ±2.2 2645-54 498 19.4 ±2.6 94 245 17.7 ±5.1 43 253 21.1 ±4.4 5155-64 302 29.6 ±5.5 84 157 32.8 ±8.1 49 145 25.8 ±7.0 35Total 2068 11.4 ±1.6 253 963 12.3 ±2.8 128 1105 10.6 ±2.1 125
* HTN = Hypertension or high blood pressure Table 5.3.2.3 Percentage of the study population with high blood pressure receiving drug
treatment Total population Males Females
Yes Yes Yes Age N % CI n N % CI n N % CI n 25-34 601 0.5 272 0.6 2 329 0.4 235-44 646 3.0 23 275 3.1 11 371 3.0 1245-54 500 13.3 65 246 12.6 32 254 14.1 3355-64 303 19.6 63 158 19.3 34 145 20..0 29Total 2050 6.2 155 951 6.2 79 1099 6.2 76

ericanSamoaSTEPSReport.doc
21/08/2007 Page 70 of 94
Table 5.3.2.4 Prevalence of high blood pressure
Am
Total Population
All Previously Diagnosed with Hypertension
Previously Diagnosed With Hypertension and on
Medication
All Individuals NOT Diagnosed Previously but
With BP >= 140/90
Individuals NOT Diagnosed Previously but With BP >=
160/100
Total Prevalence of High Blood Pressure Age N
% CI n % CI n % CI n % CI n % CI n 25-34 621 3.2 ±1.3 21 0.5 ±0.5 4 20.9 ±5.7 123 4.3 ±2.5 22 21.4 ±5.5 127 35-44 647 9.3 ±2.7 54 3.9 ±2.4 22 33.5 ±5.7 199 7.5 ±3.5 46 37.4 ±7.4 221 45-54 500 19.3 ±2.7 94 12.4 ±3.3 65 33.3 ±5.4 167 9.5 ±2.2 50 45.7 ±5.2 232 55-64 304 29.2 ±5.3 84 22.4 ±5.9 63 36.4 ±8.6 122 12.7 ±3.9 38 58.8 ±5.5 185 Total 2072 11.4 ±1.6 253 6.5 ±1.0 154 29.2 ±4.0 611 7.3 ±1.5 156 35.7 ±3.8 765
Males 25-34 285 3.3 ±2.9 8 0.6 ±1.0 2 30.6 ±11.2 83 6.9 ±5.3 15 31.3 ±11.0 85 35-44 276 11.2 ±4.2 28 4.6 ±3.4 11 42.3 ±8.1 109 10.1 ±5.0 27 46.9 ±10.0 120 45-54 246 17.7 ±5.1 43 12.6 ±5.1 32 32.8 ±8.7 86 12.2 ±4.7 31 45.4 ±8.3 118 55-64 159 32.1 ±7.5 49 24.0 ±8.5 34 34.0 ±12.5 63 10.7 ±5.4 18 58.0 ±7.5 97 Total 966 12.2 ±2.7 128 7.2 ±1.7 79 35.1 ±6.3 341 9.4 ±2.6 91 42.3 ±6.0 420
Females 25-34 336 3.2 ±2.2 13 0.5 ±0.7 2 11.0 ±4.2 40 1.6 ±1.5 7 11.5 ±4.3 42 35-44 371 7.5 ±2.2 26 3.2 ±2.6 11 24.8 ±4.7 90 5.1 ±2.7 19 28.1 ±6.4 101 45-54 254 21.0 ±4.4 51 12.2 ±5.0 33 33.8 ±8.2 81 6.7 ±2.8 19 46.0 ±6.5 114 55-64 145 25.8 ±7.1 35 20.5 ±7.5 29 39.2 ±6.9 59 15.1 ±6.2 20 59.7 ±9.0 88 Total 1106 10.6 ±2.1 125 5.9 ±1.7 75 23.1 ±4.3 270 5.2 ±1.4 65 29.0 ±4.6 345

Am
ericanSamoaSTEPSReport.doc
21/08/2007 Page 71 of 94
8.8 Blood glucose and diabetes Table 5.4.1.1 Fasting status
Total population Males Females Fasted Fasted Fasted Age N % CI n N % CI n N % CI n
25-34 618 96.2 ±3.1 593 284 95.6 ±3.9 271 334 96.8 ±2.5 32235-44 645 97.9 ±1.9 630 276 96.9 ±2.6 266 369 98.8 ±1.4 36445-54 498 95.5 ±4.5 473 245 96.4 ±3.9 235 253 94.7 ±5.8 23855-64 304 97.1 ±3.2 293 159 98.0 ±2.4 155 145 94.7 ±5.1 138Total 2065 96.7 ±2.8 1989 964 96.5 ±2.9 927 1101 96.9 ±2.9 1062
† Step 3 participants only Table 5.4.1.2 Fasting blood glucose (mg/dL)
Total population Males Females Age Mean CI N Mean CI N Mean CI N
25-34 108.1 2.7 570 112.0 4.7 257 104.2 2.7 31335-44 123.7 6.5 610 127.4 9.1 257 120.5 5.7 35345-54 132.0 2.1 415 128.9 6.4 207 135.2 5.8 20855-64 132.5 16.1 230 138.4 20.5 121 125.2 12.6 109Total 120.3 3.9 1825 123.0 5.0 842 117.5 4.2 983
Table 5.4.1.3 Diagnosis of diabetes during the past 12 months
Total population Males Females Diabetes Diabetes Diabetes Age N % CI n N % CI N N % CI n
25-34 621 2.7 ±1.0 16 285 1.2 ±1.5 3 336 4.2 ±2.1 1335-44 647 7.7 ±3.0 42 276 6.6 ±6.2 14 371 8.8 ±4.5 2845-54 500 17.5 ±4.2 81 246 15.8 ±6.1 36 254 19.2 ±5.9 4555-64 304 29.8 ±7.8 81 159 29.3 ±10.3 45 145 30.4 ±10.0 36Total 2072 10.4 ±1.9 220 966 9.3 ±3.0 98 1106 11.5 ±2.9 122

AmericanSamoaSTEPSReport.doc Table 5.4.1.4 Prevalence of diabetes – 110 mg/dL (6.1 mmol/L) cut-off
Total Population
All Previously Diagnosed with Diabetes
Previously Diagnosed With Diabetes and on Treatment
All Individuals NOT diagnosed previously but
with Glucose >= 110mg/dL Total Prevalence Age N
% CI n % CI n % CI n % CI n Males
25-34 285 1.2 ±1.5 3 0.9 ±1.3 2 33.1 ±7.4 93 34.3 ±8.0 9635-44 276 6.6 ±6.4 14 4.1 ±2.5 10 50.0 ±5.2 138 56.6 ±6.7 15245-54 246 15.8 ±6.2 36 12.4 ±3.4 29 47.7 ±6.9 122 63.5 ±5.8 15855-64 159 29.3 ±10.6 45 24.0 ±10.7 36 43.0 ±12.0 72 72.3 ±10.4 117Total 966 9.3 ±3.1 98 7.1 ±2.0 77 42.5 ±3.8 425 51.8 ±5.4 523
Females 25-34 336 4.2 ±2.1 13 2.7 ±2.2 7 22.4 ±9.4 74 26.6 ±8.6 8735-44 371 8.8 ±4.6 28 5.1 ±3.8 15 39.4 ±7.8 137 48.2 ±8.8 16545-54 254 19.2 ±6.1 45 14.4 ±4.1 35 38.8 ±9.4 102 58.1 ±5.0 14755-64 145 30.4 ±10.2 36 25.0 ±8.2 31 39.7 ±10.3 64 70.1 ±6.3 100Total 1106 11.5 ±2.9 122 8.2 ±2.4 88 33.0 ±4.1 377 44.6 ±5.5 499
21/08/2007 Page 72 of 94

AmericanSamoaSTEPSReport.doc Table 5.4.1.5 Prevalence of diabetes – 120 mg/dL (6.7 mmol/L) cut-off
Total Population
All Previously Diagnosed with Diabetes
Previously Diagnosed With Diabetes and on Treatment
All Individuals NOT diagnosed previously but with
Glucose >= 120 mg/dL Total Prevalence N
% CI n % CI n % CI n % CI n 25-34 621 2.7 ±1.0 16 1.1 ±1.2 5 12.7 ±2.7 74 13.9 ±3.6 7935-44 647 7.7 ±3.0 42 4.0 ±1.6 21 27.9 ±5.0 167 31.9 ±5.9 18845-54 500 17.5 ±4.3 81 12.5 ±2.0 60 28.8 ±4.2 146 41.3 ±5.4 20655-64 304 29.8 ±7.9 81 23.4 ±6.5 64 29.5 ±8.7 93 52.9 ±9.8 157Total 2072 10.4 ±1.9 220 6.9 ±1.6 150 22.7 ±2.4 480 29.6 ±3.7 630
Males 25-34 285 1.2 ±1.5 3 0.3 ±0.6 1 15.7 ±6.8 40 16.0 ±6.8 4135-44 276 6.6 ±6.4 14 4.1 ±2.5 10 30.0 ±7.2 79 34.2 ±7.2 8945-54 246 15.8 ±6.2 36 11.9 ±3.2 27 29.1 ±6.9 75 40.9 ±7.9 10255-64 159 29.3 ±10.6 45 22.8 ±11.9 34 29.0 ±9.1 48 51.8 ±11.8 82Total 966 9.3 ±3.1 98 6.6 ±2.1 72 24.5 ±4.4 242 31.1 ±5.9 314
Females 25-34 336 4.2 ±2.1 13 2.0 ±2.4 4 9.7 ±3.7 34 11.7 ±3.8 3835-44 371 8.8 ±4.6 28 3.9 ±3.5 11 25.8 ±5.4 88 29.7 ±8.2 9945-54 254 19.2 ±6.1 45 13.1 ±3.5 33 28.6 ±4.8 71 41.7 ±5.7 10455-64 145 30.4 ±10.2 36 24.1 ±8.8 30 30.1 ±13.3 45 54.3 ±8.6 75Total 1106 11.5 ±2.9 122 7.2 ±2.6 78 20.9 ±2.7 238 28.1 ±4.4 316
21/08/2007 Page 73 of 94

AmericanSamoaSTEPSReport.doc
21/08/2007 Page 74 of 94
Table 5.4.1.6a Type of blood glucose treatment for diabetes
Total Population
Insulin Only Insulin & Drugs Diet Only Drugs Only No treatment Insulin & Diet Drugs & Diet All (Drugs, Diet & Insulin) Age N
% CI n % CI n % CI n % CI n % CI n % CI n % CI n % CI n
25-34 14 6.4 ±13.2 1 ---- ±0.0 0 26.2 ±32.1 3 10.0 ±23.8 1 44.3 ±31.3 7 ---- ±0.0 0 14 ±6.4 13.2 1 ---- 0.0
35-44 37 5.5 ±7.3 3 ---- ±0.0 0 9.0 ±10.8 4 26.3 ±24.2 9 39.6 ±20.2 15 8.0 ±17.8 2 37 ±5.5 7.3 3 ---- 0.0
45-54 72 5.1 ±5.3 4 2.3 ±3.8 2 5.7 ±5.5 4 44.9 ±18.3 32 23.3 ±12.3 15 2.0 ±4.7 2 72 ±5.1 5.3 4 ±2.3 3.8
55-64 68 7.1 ±5.5 6 9.7 ±8.2 6 4.2 ±5.8 3 35.2 ±27.9 25 16.8 ±9.4 11 9.2 ±9.3 5 68 ±7.1 5.5 6 ±9.7 8.2
Total 191 6.0 ±5.1 14 4.0 ±4.2 8 7.6 ±6.8 14 34.6 ±17.0 67 26.6 ±7.1 48 5.5 ±5.4 9 191 ±6.0 5.1 14 ±4.0 4.2
Males
25-34 3 21.8 ±53.8 1 ---- ±0.0 0 50.7 ±75.8 1 ---- ±0.0 0 27.5 ±55.8 1 ---- ±0.0 0 ---- ±0.0 0 ---- ±0.0 0
35-44 12 4.5 ±11.8 1 ---- ±0.0 0 ---- ±0.0 0 33.9 ±23.0 4 23.4 ±25.0 2 10.4 ±25.9 1 22.4 ±27.3 3 5.4 ±10.7 1
45-54 35 2.7 ±6.3 1 ---- ±0.0 0 3.8 ±5.4 2 55.0 ±33.5 20 19.8 ±18.9 6 2.0 ±4.9 1 11.8 ±13.9 4 5.0 ±10.1 1
55-64 42 6.5 ±9.4 3 16.5 ±11.1 6 4.3 ±10.3 2 34.3 ±16.6 16 12.2 ±14.3 6 8.6 ±11.8 2 15.8 ±16.2 6 1.7 ±4.3 1
Total 92 5.5 ±7.0 6 6.5 ±5.9 6 5.6 ±6.7 5 40.0 ±19.8 40 17.9 ±9.4 15 6.1 ±4.7 4 14.8 ±10.7 13 3.6 ±5.7 3
Females
25-34 13 ---- ±0.0 0 ---- ±0.0 0 17.4 ±23.3 3 34.3 ±49.3 2 35.5 ±30.2 6 ---- ±0.0 0 7.2 ±16.2 1 5.6 ±13.1 1
35-44 28 5.1 ±7.3 2 ---- ±0.0 0 12.8 ±17.3 4 34.3 ±28.4 8 42.6 ±23.1 13 5.2 ±11.8 1 ---- ±0.0 0 ---- ±0.0 0
45-54 44 6.6 ±8.5 3 4.1 ±6.3 2 6.6 ±10.4 2 41.2 ±10.8 18 23.7 ±12.5 9 1.8 ±4.0 1 13.2 ±10.8 8 2.9 ±6.7 1
55-64 36 7.5 ±9.4 4 ---- ±0.0 0 3.0 ±6.1 1 45.8 ±37.8 16 17.6 ±21.6 5 7.6 ±12.8 3 9.9 ±9.6 5 8.6 ±16.4 2
Total 121 5.6 ±3.7 9 1.3 ±2.3 2 8.6 ±7.2 10 39.9 ±17.0 44 28.3 ±8.6 33 4.0 ±5.9 5 8.2 ±3.8 14 4.2 ±5.2 4

AmericanSamoaSTEPSReport.doc
21/08/2007 Page 75 of 94
Table 5.4.1.7 Percentage of study participants with impaired fasting blood glucose (100 – 110 mg/dL)
Total Population Males Females Age % CI N % CI N % CI N
25-34 29.3 ±5.8 178 31.9 ±6.1 92 26.7 ±7.4 8635-44 24.8 ±5.1 172 24.7 ±3.9 71 24.8 ±7.4 10145-54 23.0 ±3.8 109 22.1 ±5.7 52 23.8 ±3.5 5755-64 21.1 ±9.1 63 20.8 ±10.3 32 21.6 ±8.5 31Total 25.7 ±1.5 522 26.3 ±1.8 247 25.0 ±2.1 275
8.9 Blood cholesterol Table 5.4.2.1 Mean total cholesterol levels (mg/dL)
Total population Males Females Age Mean CI N Mean CI N Mean CI N
25-34 173.9 2.6 321 176.8 5.2 145 170.9 0.8 17635-44 183.1 2.0 432 181.9 2.9 183 184.2 2.6 24945-54 190.7 4.9 383 189.8 5.8 172 191.4 5.9 21155-64 193.4 4.0 231 190.2 6.8 108 196.3 2.8 123Total 183.6 1.9 1367 183.3 2.3 608 183.8 2.0 759
Table 5.4.2.2 Total blood cholesterol risk categories
Total population Males Females ≥200 mg/dL ≥200 mg/dL ≥200 mg/dL Age N % CI n N % CI n N % CI n
25-34 13.0 40 16.3 22 9.5 1835-44 21.3 90 21.1 38 21.5 5345-54 31.3 122 28.1 54 34.0 6855-64 37.2 86 34.7 37 39.5 49Total 23.4 339 23.1 151 23.7 188
8.10 Data quality indices Table 9.10.1 Number of pregnant females
Pregnant Age N % CI n
25-34 313 9.2 ±4.5 28
35-44 351 2.3 ±1.7 7
45-54 239 ---- ±0.0 0
55-64 137 ---- ±0.0 0Total 1040 4.1 1.9 35

AmericanSamoaSTEPSReport.doc
21/08/2007 Page 76 of 94
Table 9.10.2 Number of blood pressure measurements taken
One Two Three % CI n % CI n % CI n
Systolic 100 ±0.0 2071 100 ±0.0 2071 100 ±0.0 2071 Diastolic 100 ±0.0 2071 100 ±0.0 2071 100 ±0.0 2071
Table 9.10.3 Out-of-range biochemistry results†
Low High N %†† CI n % CI n
Glucose 2072 0.4 ±0.7 4Total cholesterol 2072 35.2 ±3.1 681 0.2 ±0.3 7
† As indicated by laboratory diagnostic testing equipment. †† Percentages based on total number of persons with biochemical measures

AmericanSamoaSTEPSReport.doc
21/08/2007 Page 77 of 94
9 Appendix 2 – Questionnaire (English Version)
GOVERNMENT OF AMERICAN SAMOA DEPARTMENT OF HEALTH & WORLD HEALTH
ORGANIZATION
Check if the following are completed (to be checked by:) Yes No Fasting status (Step 2&3 Registration Station) Checkout (Step 2&3 Check-out Station) EpiData data entry (Data entry personnel) EpiInfo data entry (Data entry personnel) Data entry irregularities (Data entry personnel)
1 Identification Information:
V 1 Is the respondent on the participation list for the survey? Yes, on the original list
Yes, on the replacement list No (if “No”, then END)
1 2 3
I 2 Village name:
I 3 Village code: (SEE NOTE BELOW)
I 4 Interviewer code
I 5 Date of completion of the questionnaire / /2004 Month Day Year
Respondent ID Number
Consent
I 6 Consent has been read out to respondent Yes 1 No 2 If NO, read consent
I 7 Consent has been obtained (verbal or written) Yes 1 No 2 If NO, END
I 8 Interview Language English 1 Samoan 2
I 9 Time of interview (24 hour clock) : I 10 Family Name
I 11 First Name
I 12 Contact phone number where possible
TThhee WWHHOO SSTTEEPPwwiissee aapppprrooaacchh ttoo SSuurrvveeiillllaannccee ooff nnoonnccoommmmuunniiccaabbllee ddiisseeaasseess ((SSTTEEPPSS))

AmericanSamoaSTEPSReport.doc
21/08/2007 Page 78 of 94
I 13 Specify whose phone Work 1 Home 2 Neighbor 3 Other 4
Note: Identification information I6 to I12 should be stored separately from the questionnaire because it contains confidential information. Please note: village code is required as part of main instrument for data analyses. Date of interview is required to calculate age.
Step 1 Demographic Information
Coding Column
Male 1 C1 Sex (Record Male / Female as observed ) Female 2
Month Day Year19What is your date of birth? C2
If Don’t Know, See Note* below and Go to C3
C3 How old are you? Years
In total, how many years have you spent at school or in full-time study (excluding pre-school)? C4 Years
Step 1 Behavioural Measures
Tobacco Use (Section S) Now I am going to ask you some questions about various health behaviours. This includes things like smoking, drinking alcohol, eating fruits and vegetables and physical activity. Let's start with smoking.
Response Coding Column S 1a Do you currently smoke any tobacco products,
such as cigarettes, cigars or pipes?
Yes 1
(NOTE: Currently = past 12 months) No 2 If No, go to
Next Section S 1b If No, go to
Next Section If Yes, Yes 1 Do you currently smoke tobacco products daily? No 2
S 2a How old were you when you first started smoking daily?
If Known, go to S 3
Age (years) Don’t remember DK
Years In Years S 2b Do you remember how long ago it was?
OR in Months
Months
Weeks OR in Weeks (CODE DK FOR DON’T KNOW OR DON’T REMEMBER) On average, how many of the following do you smoke each day? Manufactured cigarettes
S 3
(RECORD FOR EACH TYPE) Hand-rolled cigarettes
(CODE DK FOR DON’T KNOW OR DON’T REMEMBER) Pipes full of tobacco
Cigars, cheroots, cigarillos
__________________________________________ Other (please specify):
Alcohol Consumption (Section A) The next questions ask about the consumption of alcohol.
Response Coding Column A 1a Have you ever consumed a drink that contains
alcohol such as beer, wine, spirit, or fermented cider?
Yes No
1 2
If No, Go to

AmericanSamoaSTEPSReport.doc
21/08/2007 Page 79 of 94
USE SHOWCARD or SHOW EXAMPLES Next Section A 1b Have you consumed alcohol within the past 12
months? Yes No
1 2
If No, Go to Next Section
NOTE: The Date of Birth (C2) or the age (C3) or both (C2 and C3) have to be filled. CODE “DK” FOR DON’T KNOW or DON’T REMEMBER. Code DK for DON’T KNOW or DON’T REMEMBER except for where answers are mandatory such as Village code, date of interview and either date of birth or age.
A 2 In the past 12 months, how frequently have you had at least one drink? (READ RESPONSES) USE SHOWCARD
5 or more days a week 1-4 days per week 1-3 days a month
Less than once a month
1 2 3 4
A 3 When you drink alcohol, on average, how many drinks do you have during one day?
Number Don’t know
DK
Monday
Tuesday
Wednesday
Thursday
Friday
Saturday
A 4 During each of the past 7 days, how many standard drinks of any alcoholic drink did you have each day? (RECORD FOR EACH DAY USE SHOWCARD) Sunday
Diet (Section D) The next questions ask about the fruits and vegetables that you usually eat. I have a nutrition card here that shows you some examples of local fruits and vegetables. Each picture represents the size of a serving. As you answer these questions please think of a typical week in the last year.
D 1a
In a typical week, on how many days do you eat fruit? USE SHOWCARD
Number of days
If Zero days, go to D 2a
D 1b How many servings of fruit do you eat on one of those days? USE SHOWCARD
Number of servings
D 2a In a typical week, on how many days do you eat vegetables? USE SHOWCARD
Number of days If Zero days, go to P1
D 2b How many servings of vegetables do you eat on one of those days? USE SHOWCARD
Number of servings
Physical Activity (Section P)
Next I am going to ask you about the time you spend doing different types of physical activity. Please answer these questions even if you do not consider yourself to be an active person. Think first about the time you spend doing work. Think of work as the things that you have to do such as paid or unpaid work, household chores, harvesting food, fishing or hunting for food, seeking employment.
P 1 Does your work involve mostly sitting or standing, with walking for no more than 10 minutes at a time?
Yes No
1 2 If Yes, go
to P6

AmericanSamoaSTEPSReport.doc
21/08/2007 Page 80 of 94
P 2 Does your work involve vigorous activities, like heavy lifting, digging or construction work for at least 10 minutes at a time? INSERT EXAMPLES & USE SHOWCARD
Yes No
1 2
If No, go to P4
P 3a In a typical week, on how many days do you do vigorous activities as part of your work? Days a week
Note: Code DK for DON’T KNOW or DON’T REMEMBER except for where answers are mandatory such as Village code, date of interview and either date of birth or age.
In hours and minutes hrs : mins P 3b On a typical day on which you do vigorous activities, how much time do you spend doing such work?
OR in Minutes only or minutes
P 4 Does your work involve moderately intense activities, like brisk walking or carrying light loads for at least 10 minutes at a time? INSERT EXAMPLES & USE SHOWCARD
Yes No
1 2
If No, go to P6
P 5a In a typical week, on how many days do you do moderately intense activities as part of your work? Days a week
In hours and minutes hrs : mins P 5b On a typical day on which you did moderately intense activities, how much time do you spend doing such work?
OR in Minutes only or minutes
P 6 How long is your typical work day? Number of hours hrs
Other than activities that you’ve already mentioned, I would like to ask you about the way you travel to and from places. For example to work, for shopping, to market, to church etc
P 7 Do you walk or use a bicycle (pedal cycle) for at least 10 minutes continuously to get to and from places?
Yes No
1 2
If No, go to P9
P 8a In a typical week, on how many days do you walk or bicycle for at least 10 minutes to get to and from places?
Days a week
P 8b In hours and minutes hrs : mins
How much time would you spend walking or bicycling for travel on a typical day?
OR in Minutes only or minutes
The next questions ask about activities you do in your leisure time. Think about activities you do for recreation, fitness or sports. Do not include the physical activities you do at work or for travel mentioned already.
P 9 Does your leisure time involve mostly sitting, reclining, or standing, with no physical activity lasting more than 10 minutes at a time?
Yes No
1 2
If Yes, go to P 14
P 10 In your leisure time, do you do any vigorous activities like running or strenuous sports, weight lifting for at least 10 minutes at a time? INSERT EXAMPLES & USE SHOWCARD
Yes No
1 2
If No, go to P 12
P 11a If Yes, In a typical week, on how many days do you do vigorous activities as part of your leisure time?
Days a week
In hours and minutes hrs : mins P 11b How much time do you spend doing this on a typical
day? OR in Minutes only
or minutes
P 12 In your leisure time, do you do any moderate-intensity activities like brisk walking, cycling or swimming for at least 10 minutes at a time? INSERT EXAMPLES & USE SHOWCARD
Yes No
1 2
If No, go to P 14

AmericanSamoaSTEPSReport.doc
21/08/2007 Page 81 of 94
P 13a If Yes In a typical week, on how many days do you do moderately intense activities as part of leisure time?
Days a week
In hours and minutes hrs : mins P 13b How much time do you spend doing this on a typical day?
OR in Minutes only or minutes
Note: Code DK for DON’T KNOW or DON’T REMEMBER except for where answers are mandatory such as Village code, date of interview and either date of birth or age. The following question is about sitting or reclining. Think back over the past 7 days, to time spent at work, at home, in leisure, including time spent sitting at a desk, visiting friends, reading, or watching television, but do not include time spent sleeping.
In hours and minutes hrs : mins P 14 Over the past 7 days, how much time did you spend sitting or reclining on a typical day?
OR in Minutes only or minutes
History of High Blood Pressure H 2 During the past 12 months have you been told by a
doctor or other health worker that you have elevated blood pressure or hypertension?
Yes No
1 2
If No, skip to H7
H 3a During the last 2 weeks, have you taken any drugs (medication) for high blood pressure prescribed by a doctor or other health worker?
Yes No
1 2
History of Diabetes H 7 During the past 12 months, have you been told by a
doctor or other health worker that you have diabetes?
Yes No
1 2
If No, skip to V3
H 8 Are you currently receiving any of the following treatments for diabetes prescribed by a doctor or other health worker? (NOTE: Currently = past 2 weeks)
H 8a Insulin Yes No
1 2
H 8b Oral drug (medication that you have taken in the last 2 weeks)
Yes No
1 2
H 8c Special prescribed diet Yes No
1 2
Comments: Step 1 (to be answered by Interviewer)
V 2 Are there any irregularities or problems with the interview?
Yes No
1 2
If yes, please state the irregularities or problems in the space provided below. __________________________________________________________________________________________________________________ __________________________________________________________________________________________________________________ __________________________________________________________________________________________________________________ __________________________________________________________________________________________________________________ __________________________________________________________________________________________________________________ __________________________________________________________________________________________________________________

AmericanSamoaSTEPSReport.doc
21/08/2007 Page 82 of 94
Step 2 Physical Measurements
Height and weight Coding Column M 1 Technician ID Code
(1a) height (1b) weight
M 2a & 2b
Device IDs for height and weight (2a) height (2b) weight
M 3 Height (in Centimetres) .
M 4 Weight If too large for scale, use TWO scales (in Pounds) .
M 5 (For women) Are you pregnant?
Yes No
1 2
If Yes, go to M9
Waist
M 6 Technician ID
M 7 Device ID for waist
M 8 Waist circumference (in Centimetres) .
Blood pressure Coding Column M 9 Technician ID
M 10 Device ID for blood pressure
M 11 Cuff size used Standard Large
X-Large (Manual)
1 2 3
M 12a Reading 1 Systolic BP Systolic mmHg
M 12b Diastolic BP Diastolic mmHg
M 13a Reading 2 Systolic BP Systolic mmHg
M 13b Diastolic BP Diastolic mmHg
M 14a Reading 3 Systolic BP Systolic mmHg
M 14b Diastolic BP Diastolic mmHg

AmericanSamoaSTEPSReport.doc
21/08/2007 Page 83 of 94
Step 3 Biochemical Measurements
Blood glucose Coding Column B 1 Since 10 o’clock last night, have you had anything to
eat or drink, other than water? Yes No
1 2
B 2 Technician ID Code
B 3 Device ID code
B 4 Time of day blood specimen taken (24 hour clock) hrs : mins
mg/dL .
B 5 Blood glucose
Low High
Unable to assess
1 2 3
Blood Lipids B 6 Technician ID Code
B 7 Device ID code
mg/dL .
B 8 Total cholesterol
Low High
Unable to assess
1 2 3
Comments: Step 2 and 3 (to be answered by any Step 2 or 3 technician)
V 3 Are there any irregularities or problems with the measurements?
Yes No
1 2
If yes, please state the irregularities or problems in the space provided below. __________________________________________________________________________________________________________________ __________________________________________________________________________________________________________________ __________________________________________________________________________________________________________________ __________________________________________________________________________________________________________________ __________________________________________________________________________________________________________________ __________________________________________________________________________________________________________________

AmericanSamoaSTEPSReport.doc
21/08/2007 Page 84 of 94
10. Appendix 3 – Questionnaire (Samoan Version)

AmericanSamoaSTEPSReport.doc
21/08/2007 Page 85 of 94
GOVERNMENT OF AMERICAN SAMOA
DEPARTMENT OF HEALTH &
World Health Organization
Suesuega o Faama’i Le Pipisi ma Mafua’aga i Samoa
Faamatalaga o le sui auai: I 1 Nuu/ Alalafaga: (name)
I 2 Nuu (code): (SEE NOTE BELOW)
Ioe 1 Leai 2 I 3 Mo Pagopago, Malaeimi, Malaeloa, Leone
ma Pavaiai: Does the participant live within the area defined on the map?
I 4 Numera o le sui suesue
I 5 Aso na mae’a ai le suesuega / / Aso Masina Tausaga
Numera a le tagata o loo suesueina
Consent
Ioe 1 I 6 Pepa o maliega Leai 2 Gagana Peretania I 7 Gagana faaaogaina Gagana Samoa 2
: I 8 Taimi o le suesuega (24 hour clock)
I 9 Faaiu
I 10 Igoa Muamua
I 11 Telefoni
Fale faigaluega 1 I 12 Telefoni i le Aiga 2 Tua’oi 3 Se isi tagata (o ai?) 4
Note: Identification information I5 to I11 should be stored separately from the questionnaire because it contains confidential information. Please note: village code is required as part of main instrument for data analyses. Date of interview is required to calculate age.

AmericanSamoaSTEPSReport.doc
21/08/2007 Page 86 of 94
Step 1 Core Demographic Information
Coding Column Alii 1 C1 Ituaiga Tamaitai 2
Aso Masina TausagaO le a lou aso fanau?
C2
Afai e le iloa, vaai Note* i lalo ma faaauau i le fesili C3
C3 Ua fia ou tausaga? Tausaga
I le aotelega, e fia le aofai o tausaga sa e aoga ai (full time) e le aofia ai Aoga Faataitai? C4 Tausaga
∗Note: Coding Rule: Code “Don’t Know” 7 (or 77 or 777 as appropriate).
Step 1 Core Behavioural Measures
Taumafa Tapa’a / Sikareti (Section S) Ole a ‘ou fesili atu ini amioga tau ile soifua Maloloina e aofia ai le ulaula, inu ‘ava, taumafa I fuala’au suamalie ma fuala’au e taumafa-mataina male fa’agaoioiga ole tino. Ole a amata ile ta’umafa tapa’a.
Response Coding Column S 1a O e taumafa tapa’a e pei o sikareti, sika po o tapa’a
utu paipa i le taimi nei?
Ioe 1
Leai 2 A leai, alu i le fesili A1a
S 1b
I Afai e Ioe: E te taumafa tapa’a i aso uma? Ioe 1 Leai 2 A leai, alu i le
fesili A1a S 2a O le fia o ou tausaga na amata ai ona e taumafa
tapa’a i aso uma? Age (tausaga)
Le manatua 7 7 A manatua tausaga,
alu i le fesili S3
Tausaga Tausaga talu ai S 2b
PO O Masina talu ai
Masina
Afai e te le manatua le matua o ou tausaga, o le a le umi talu ona e ulaula i aso uma?
Vaiaso PO O Vaiaso talu ai (CODE 77 FOR DON’T REMEMBER)
E fia le aofai o ituaiga tapa’a nei e masani ona e taumafaina/ulaina i le aso e tasi? Sikareti ua maea ona gaosia
S 3
(RECORD FOR EACH TYPE) Sikareti ta’ai
Tapa’a utu paipa (Samoa/Palagi)
(CODE 88 FOR NOT APPLICABLE) Sika/Tapa’a Samoa (tipi)
O nisi tapa’a (please specify):

AmericanSamoaSTEPSReport.doc
21/08/2007 Page 87 of 94
Taumafa Ava Malosi (Section A) O fesili e soso’o ai e ta’atatau lea ile ta’umafaina o ‘ava malosi.
Response Coding Column
A 1a Ua e taumafaina se ava malosi (e pei o le pia, uaina, fagu malosi po o le pulū)? USE SHOWCARD or SHOW EXAMPLES
Ioe Leai
1 2
A “leai”
alu i le fesili D1a
A 1b Afai e Ioe : Sa e taumafaina i totonu ole 12 masina talu ai?
Ioe Leai
1 2
A “leai”
alu i le fesili D1a
A 2 I le 12 masina talu ai, e faafia ona e taumafaina se ipu ava malosi se tasi pe sili atu? (READ RESPONSES) USE SHOWCARD
5 aso pe sili atu i le vaiaso 1-4 aso o le vaiaso 1-3 aso i le masina
Lalo ifo i le tasi i le masina
1 2 3 4
A 3 I taimi e te taumafaina ai le ava malosi, e fia ni ipu ava faapenei e masani ona e taumafaina i le aso?
Numera Le iloa
7 7
Aso Gafua
Aso Lua
Aso Lulu
Aso Tofi
Aso Faraile
Aso Toonai
A 4 I le 7 aso talu ai, e fia ni ipu ava faapenei sa e taumafaina i aso taitasi? (RECORD FOR EACH DAY USE SHOWCARD) Aso Sa
Taumafa Tatau (Section D) Mafaufau i au taumafa masani o le taeao, aoauli, afiafi ma vai’aiga mo fesili o loo i lalo (faaali fua o ‘aiga ma ituaiga o fualaau ‘aina). Ole a ‘ou fa’aali atu ni ata e fesoasoani ile fa’amalamalamaina o nei fesili.
D 1a
E fia ni aso o le vaiaso e te taumafa ai i se fualaau ‘aina suamalie? (Vaai i le ata A)
Aso
A”0” alu i le fesili D2a
D 1b E fia ni au ‘aiga o fualaau ‘aina suamalie e te taumafaina i se aso se tasi o ia aso? (e aofia ai vaisalo, supoesi, suafai, kokoesi, salati fualaau ‘aina suamalie, etc.) (Vaai i le ata A)
Aofai o ‘aiga
D 2a E fia ni aso e te taumafa ai i se fualaau ‘aina faisua/meaai aano i le vaiaso? (Vaai i le ata B & C : e aofia ai talo, taamu, fai, ulu, ufi, pateta, umala, kapisi, kukama, maukeni, salati fualaau ‘aina taumafa mata, etc.; e le aofia ai araisa ma falaoa).
Aso A “0”, alu i le fesili P1
D 2b E fia ni au ‘aiga o fualaau ‘aina faisua / meaai aano sa e taumafaina i se aso se tasi o ia aso? (Vaai i le ata B & C)
Aofai o ‘aiga

AmericanSamoaSTEPSReport.doc
21/08/2007 Page 88 of 94
Faagaioiga o le Tino (Section P) Mafaufau i au galuega masani i le vaiaso, e tali mai ai fesili nei mo le 12 masina ua tea. P 1 E tele ina e nofo pe ete tu e te le gaioi, pe a e galue i
lau galuega? (ie. laititi ifo ma le 10 minute e savali ai mo se taimi)
Ioe Leai
1 2
A Ioe, alu i le fesili P6
P 2 E aofia i lau galuega masani le faatinoina o galuega mamafa e pei o le siisii mea mamafa, eliina o lua po o galuega fau fale? (ie: Galuega e faatinoina i le 10 minute pe sili atu).
Ioe Leai
1 2
A Leai, alu i le fesili P4
P 3a E fia ni aso o le vaiaso e masani ona e galue ai faapea?
Aso i le vaiaso
Itula ma minute hrs : mins P 3b O le a se umi o le taimi e masani ona e galue ai faapea i le aso?
PO O Minute Po o minute
P 4 E i ai ni vaega o lau galuega e manaomia ai le faanatinati o lau savali po o le siisii foi o ni mea e le mamafa tele i se 10 minute pe sili atu foi?
Ioe Leai
1 2
A Leai, alu i le fesili P6
P 5a e fia ni aso o le vaiaso e te faatinoina ai ia galuega? Aso i le vaiaso
Itula ma minute hrs : mins P 5b O le a se umi o le taimi e masani ona e galue ai faapea i le aso?
PO O Minute only Po o minute
P 6 O le a le umi e masani ona e faigaluega ai i aso taitasi? Itula hrs
E ‘ese mai ai I au tali I fesili ua te’a atu. Oute toe fia fesili atu ia te oe I au fealua’iga. Fa’ata’ita’iga o lou alu e faigaluega, fa’atau, ma lou alu ile lotu.
P 7 E te savali pe ete alu i se uila vili vae ma e toe foi mai i se taimi e sili atu i le 10 minute? (ie: i le galuega, maketi, lotu etc)
Ioe Leai
1 2
A Leai, alu i le fesili P9
P 8a e fia ni aso o le vaiaso e masani ona e malaga ai faapea?
Aso i le vaiaso
Itula ma minute hrs : mins P 8b O le a se umi o le taimi e masani ona e malaga ai faapea i le aso?
PO O Minute only po’o minute
(O fesili nei e faasino tonu i galuega e faagaioi ai lou tino i ou taimi paganoa i tafaoga ma taaloga (e le aafia ai galuega e te faatinoina pe a e faigaluega pe faimalaga foi i se mea).
P 9 I ou taimi paganoa/tafao/taalo etc., e tele ina e saofa’i, taotooto faalagolago, tu ma savali foi mo se umi e i lalo ifo o le 10 minute? (eg. matamata TV)
Ioe Leai
1 2 A Ioe, alu i le
fesili P 14
P 10 I ou taimi paganoa, e te faatinoina ni galuega mamafa e pei o le siisii mea mamafa, tamo’e pe ete taalo malosi foi i ni taaloga i le 10 minute pe sili atu?
Ioe Leai
1 2
A Leai, alu i le fesili P 12
P 11a Afai e “Ioe” e fia ni aso o le vaiaso ete faatinoina ai ia galuega?
Aso i le vaiaso
Itula ma minute hrs : mins P 11b O le a le umi o le taimi e te faia ai ia galuega i se aso se tasi o le vaiaso?
PO O Minute only po‘o minute

AmericanSamoaSTEPSReport.doc
21/08/2007 Page 89 of 94
P 12 I ou taimi paganoa e te faatinoina ni gaioiga e le
mamafa tele e pei o le taalo, savali, vili se uila po o le aau, i le 10 minute pe sili atu?
Ioe Leai
1 2
A Leai, alu i le fesili P 14
P 13a Afai e “Ioe”, e fia ni aso o le vaiaso e te faatinoina ai ia galuega?
Aso i le vaiaso
Itula ma minute hrs : mins P 13b O le a le umi o le taimi e te faatinoina ai ia galuega i le aso?
PO O Minute only or minutes
O le fesili lenei e faasino i au galuega e fai pe a e nofonofo pe ete taotooto i taimi e te ala ai. Mafaufau i le 7 aso ua tuana’i atu i le taimi lea o lo o e faigaluega i lou fale faigaluega po o lou lava fale, pe o le taimi o lo o e tafao pe nofonofo ai ma taimi e te alu ai e vaai au uo pe matamata le TV. Ae le o le taimi e te tofa ai.
Itula ma minute hrs : mins P 14 I le 7 aso talu ai, o le a le umi o se taimi e masani ona e nofonofo pe ete taotooto ai, i se aso se tasi?
PO O Minute only or minutes
Step 2 Physical Measurements
Height and weight Coding Column M 1 Technician ID Code
M 2a & 2b
Device IDs for height and weight (2a) height (2b) weight
M 3 Height
(in Centimetres) .
M 4 Weight If too large for scale, code 666.6
(in Kilograms) .
M 5 (For women) O ‘E ma’I-tagata-(ma’I-to)?
Yes No
1 2
If Yes, Skip Waist
Waist
M 6 Technician ID
M 7 Device ID for waist
M 8 Waist circumference (in Centimetres) .
Blood pressure Coding Column M 9 Technician ID
M 10 Device ID for blood pressure
M 11 Cuff size used Small Normal
Large
1 2 3
M 12a Reading 1 Systolic BP Systolic mmHg
M 12b Diastolic BP Diastolic mmHg
M 13a Reading 2 Systolic BP Systolic mmHg
M 13b Diastolic BP Diastolic mmHg

AmericanSamoaSTEPSReport.doc
21/08/2007 Page 90 of 94
M 14a Reading 3 Systolic BP Systolic mmHg
M 14b Diastolic BP Diastolic mmHg
M 15 Ile lua vaiaso ua te’a, na togafitia Oe ile toto maualuga ini fuala’au e se Foma’I?
Ioe Leai
1 2
Step 3 Biochemical Measurements
CORE Blood glucose Coding Column B 1 B1 Ile 12 itula ua te’a atu, sa e taumafa pe inu ise
vai-inu e ese mai ile vai-auli? Yes No
1 2
B 2 Technician ID Code
B 3 Device ID code
B 4 Time of day blood specimen taken (24 hour clock) hrs : mins
mmol/l .
B 5 Blood glucose
Low High
Unable to assess
1 2 3
CORE Blood Lipids B 6 Technician ID Code
B 7 Device ID code
mmol/l .
B 8 Total cholesterol
Low High
Unable to assess
1 2 3

AmericanSamoaSTEPSReport.doc
21/08/2007 Page 91 of 94
113. Appendix 4 – Detailed equipment list Specified equipment: Weight: Heine 737 Scales x4 Standard weights to calibrate scales x2 sets of 2 different weights Flat boards x2 Height: Seca Leicester Height Measure x4 Waist: Figure Finder constant tension tape measure x8 Blood pressure: Omron T5 with standard cuff and adaptor x4 Large cuff size (32cm-42 cm) x4 Sphygmomanometer with large cuff x2 Processing and analysis of biochemical measures: Measurement of blood glucose and blood cholesterol was performed using Accutrend GCT devices from Bayer Corp which were purchased through the WHO, Apia Office. Specified equipment: Blood Glucose: Glucometers (Advantage) x4 Glucometer strips x2100 Glucometer control solution Blood Cholesterol: Cholesterol Meters: Accutrend GC display in mg/dl x4 Cholesterol strips: pack of 25 x84 Cholesterol GC (1) Control Solution x11

AmericanSamoaSTEPSReport.doc
21/08/2007 Page 92 of 94
12. References 1. Dwyer, T, Tieru, H*, Hynes, K, Zhang, C, ‘Profile of Cardiovascular Diseases, Diabetes Mellitus and Associated Risk Factors in the Western Pacific Region’, Profile of Cardiovascular Diseases, Diabetes Mellitus and Associated Risk Factors in the Western Pacific Region, World Health Organization, Manila, Philippines, 1999 2. Beaver, C. Health care decision-making in the Western Pacific Region: diabetes and the care continuum in the Pacific island countries. World Health Organization. Regional Office for the Western Pacific 2003. 3. http://www.who.int/chp/steps/en/ 4. Tonga commitment to promote healthy Lifestyles and supportive environment. World Health Organisation. Western Pacific Region. Secretariat of the Pacific Community. 2003. 5. The World Fact Book. CIA last accessed on August 15, 2006 https://www.cia.gov/cia/publications/factbook/index.html 6. WHO Country Health Information Profiles (CHIPS) American Samoa. WPRO 2006 7. WHO Country Health Information Profiles (CHIPS) American Samoa. WPRO 2006 8. Global Infobase se: http://www.who.int/ncd_surveillance/resources/infobase/en/ 9. Epi Info [computer program]. Version 6. Atlanta, GA: Centers for Disease Control and Prevention 1994 10. Source: US Department of Commerce, American Samoa: 2000 Census of Population and Housing 11. Dwyer, T, Tieru, H*, Hynes, K, Zhang, C, ‘Profile of Cardiovascular Diseases, Diabetes Mellitus and Associated Risk Factors in the Western Pacific Region’, Profile of Cardiovascular Diseases, Diabetes Mellitus and Associated Risk Factors in the Western Pacific Region, World Health Organization, Manila, Philippines, 1999 12. McGarvey ST. Cardiovascular disease (CVD) risk factors in Samoa and American Samoa, 1990-95. Pacific Health Dialog. 8(1): 157-162. 2001 13. Mishra, SI, Osann, K and Luce, PH Prevalence and predictors of smoking behaviour among Samoans in three geographical regions. Ethnicity and disease. 15(2): 305-15, 2005 14. World Health Organisation. Global Status Report on Alcohol 2004. 15. World Health Organisation. Diet, Nutrition and the Prevention of Chronic Diseases, 2003 16. Diet, Food Supply and Obesity in the Pacific. World Health Organization 2003 17. Coyne, T. Lifestyle Diseases in Pacific Communities. Ed. Robert Hughes and Sarah Langhi. Technical paper no.219 / Secretariat of the Pacific Community. 2000 18. Cassels, S. Overweight in the Pacific: links between foreign dependence, global food trade, and obesity in the Federated States of Micronesia. Globalization and Health 2:10 (2006)

AmericanSamoaSTEPSReport.doc
21/08/2007 Page 93 of 94
19. Hodge AM, Dowse GK, Toelupe P, Collins VR, Imo T, Zimmet PZ. Dramatic increase in the prevalence of obesity in Western Samoa over the 13 year period 1978-1991. Int J Obes Relat Metab Disord. Jun; 18(6): 419-28. 1994 20. Keighley ED, McGarvey ST, Turituri P, Viali S. Farming and adiposity in Samoan adults. Am J Hum Biol. 18:112-122 (2006) 21. Fiji School of Medicine. American Samoa STEPwise approach to NCD surveillance - Operational Manual v3, 2004. Fiji, Suva 22. Clinical Guidelines on the Identification, Evaluation, and Treatment of Overweight and Obesity in Adults (http://www.nhlbi.nih.gov/guidelines/obesity/ob_home.htm). National Heart, Lung, and Blood Institute (NHLBI), in cooperation with the National Institute of Diabetes and Digestive and Kidney Diseases (NIDDK). 23. Coyne, T. Lifestyle Diseases in Pacific Communities. Ed. Robert Hughes and Sarah Langhi. Technical paper no.219 / Secretariat of the Pacific Community. 2000 24. Keighley ED, McGarvey ST, Turituri P, Viali S. Farming and adiposity in Samoan adults. Am J Hum Biol. 18:112-122 (2006) 25. McGarvey ST, Levinson PD, Bausserman L, Galanis DJ, Hornick CA. Population change in adult obesity and blood lipids in American Samoa from 1976-1978 to 1990. Amer. J. Human Biol. 5: 17-30, 1993 26. Coyne, T. Lifestyle Diseases in Pacific Communities. Ed. Robert Hughes and Sarah Langhi. Technical paper no.219 / Secretariat of the Pacific Community. 2000 27. WHO (1999) Definition, Diagnosis and Classification of Diabetes Mellitus and its Compositions. Part 1: Diagnosis and Classification of Diabetes Mellitus. P.52. 28. Coyne, T. Lifestyle Diseases in Pacific Communities. Ed. Robert Hughes and Sarah Langhi. Technical paper no.219 / Secretariat of the Pacific Community. 2000 29. McGarvey ST. Cardiovascular disease (CVD) risk factors in Samoa and American Samoa, 1990-95. Pacific Health Dialog. 8(1): 157-162. 2001 30. Executive Summary of the Third Report of the National Cholesterol Education Program (NCEP) Expert Panel on Detection, Evaluation, and Treatment of High Blood Cholesterol in Adults (Adult Treatment Panel III). JAMA 2001; 285:2486-97 31. Roche Diagnostics Accutrend® GC Detailed information 2006. http://www.diavant.com/ diavant/CMSFront.html?pgid=3,1,4,1 32. Crews DE, Fitton LJ, Kottke BA, Kamboh MI. Population genetics of apolipoproteins A-IV, E, and H, and the angiotensin converting enzyme (ACE): associations with lipids, and apolipoprotein levels in American Samoans. Am J Phys Anthropol. Aug; 124(4): 364-72. 2004 33. Kamboh MI, McGarvey ST, Aston CE, Ferrell RE, Bausserman L. 2000. Plasma lipoprotein (a) distribution and its correlates among Samoans. Hum Biol 72: 321-326.

AmericanSamoaSTEPSReport.doc
21/08/2007 Page 94 of 94
34. McGarvey ST. Cardiovascular disease (CVD) risk factors in Samoa and American Samoa, 1990-95. Pacific Health Dialog. 8(1): 157-162. 2001 35. Pelletier DL, Hornick CA. 1986. Blood lipid studies. In: Baker PT, Hanna JM, Baker TS, editors. The changing Samoans: behavior and health in transition. Oxford: Oxford University Press. p 327-349.